simultaneous production of amylases and proteases by bacillus subtilis …€¦ · ·...
TRANSCRIPT

I
Sp
AZa
Cb
a
A
R
A
A
A
J
K
A
B
B
P
R
I
Taabar
h1B
b r a z i l i a n j o u r n a l o f m i c r o b i o l o g y 4 7 (2 0 1 6) 665–674
ht tp : / /www.bjmicrobio l .com.br /
ndustrial Microbiology
imultaneous production of amylases androteases by Bacillus subtilis in brewery wastes
lina Sánchez Blancoa, Osmar Palacios Durivea, Sulema Batista Péreza,oraida Díaz Montesa, Nelson Pérez Guerrab,∗
Departamento de Fundamentos Químicos y Biológicos, Facultad de Ingeniería Química, sede Mella, Universidad de Oriente, Santiago deuba, CubaDepartamento de Química Analítica y Alimentaria, Facultad de Ciencias, Campus de Ourense, Universidad de Vigo, Spain
r t i c l e i n f o
rticle history:
eceived 1 August 2015
ccepted 8 January 2016
vailable online 20 April 2016
ssociate Editor: Adalberto Pessoa
unior
eywords:
mylases
acillus subtilis
rewery wastes
roteases
esponse surface methodology
a b s t r a c t
The simultaneous production of amylase (AA) and protease (PA) activity by Bacillus subtilis
UO-01 in brewery wastes was studied by combining the response surface methodology with
the kinetic study of the process. The optimum conditions (T = 36.0 ◦C and pH = 6.8) for high
biomass production (0.92 g/L) were similar to the conditions (T = 36.8 ◦C and pH = 6.6) for
high AA synthesis (9.26 EU/mL). However, the maximum PA level (9.77 EU/mL) was obtained
at pH 7.1 and 37.8 ◦C. Under these conditions, a considerably high reduction (between 69.9
and 77.8%) of the initial chemical oxygen demand of the waste was achieved. In verification
experiments under the optimized conditions for production of each enzyme, the AA and
PA obtained after 15 h of incubation were, respectively, 9.35 and 9.87 EU/mL. By using the
Luedeking and Piret model, both enzymes were classified as growth-associated metabolites.
Protease production delay seemed to be related to the consumption of non-protein and
protein nitrogen. These results indicate that the brewery waste could be successfully used
for a high scale production of amylases and proteases at a low cost.
© 2016 Sociedade Brasileira de Microbiologia. Published by Elsevier Editora Ltda. This is
an open access article under the CC BY-NC-ND license (http://creativecommons.org/
licenses/by-nc-nd/4.0/).
sources. However, in some cases, the effects of these vari-
ntroduction
he amylases and proteases produced by the Bacillus speciesre of world-wide interest for their important industrialpplications.1 Therefore, production of these enzymes should
e carried out at a low production cost by using economicallyvailable culture media (such as food wastes or agro-industrialesidues) and optimized fermentation conditions.2,3∗ Corresponding author.E-mail: [email protected] (N. Pérez Guerra).
ttp://dx.doi.org/10.1016/j.bjm.2016.04.019517-8382/© 2016 Sociedade Brasileira de Microbiologia. Published by EY-NC-ND license (http://creativecommons.org/licenses/by-nc-nd/4.0/)
Different studies have shown that production of amylasesand proteases is affected by a variety of physicochemicalfactors, including the type and composition of the sub-strate, incubation time and temperature, pH, agitation andthe concentration and type of the carbon and nitrogen
1,3
ables on enzyme production have been studied by usingthe “one variable at a time” method1,3,4 rather than usingresponse surface methodology (RSM). The first method is time
lsevier Editora Ltda. This is an open access article under the CC.

i c r o b i o l o g y 4 7 (2 0 1 6) 665–674
Table 1 – Experimental domain and codification of theindependent variables (T: temperature and pH) used inthe experimental design.
Coded values Actual values
T (◦C) pH
–1.267 28.0 4.0–1 30.0 4.50 37.8 6.2
666 b r a z i l i a n j o u r n a l o f m
consuming and could lead to an incomplete interpretationof the behavior of the system, resulting in a lack of predic-tive ability, mainly when there are interactions between theindependent factors.5 In contrast, the use of RSM allows thereduction in the number of experiments and obtains empiri-cal mathematical models describing the effect (both linear andquadratic) of each independent factor and their interactionson the response variables.5
Considering the substantial availability of brewery wastes(BWs) with a high chemical oxygen demand (COD) at very lowprices from a brewery plant in Santiago de Cuba (Cuba), theuse of this effluent as a fermentation substrate could offer anattractive alternative for the low cost production of amylasesand proteases by Bacillus subtilis UO-01. However, to the bestof our knowledge, there is no information available on the useof brewery waste for production of amylases and proteases byBacillus strains.
In the present study, we investigated the suitability ofthis waste to support both the growth and enzyme produc-tion by B. subtilis UO-01 at different initial values of pH andincubation temperatures. For this purpose, the time coursesof the synthesis of amylases, proteases, biomass and totalsugars consumption were followed for 30 h. Subsequently,the concentrations of enzymes and biomass obtained weremodeled by using the corresponding logistic model to smooththe experimental data obtained and reduce the experimentalerror. The data predicted by the logistic model in each case atthe appropriate fermentation time were then used for the RSManalysis to obtain the optimum pH and temperature values forhigh production of amylases, proteases and biomass. In addi-tion, the enzyme production system was studied under theoptimum conditions to verify the effectiveness and the accu-racy of the empirical enzyme model obtained. After typifyingboth the amylase and protease production with the Luedekingand Piret model,6 the relationship between protease produc-tion and consumption of total nitrogen and proteins wasstudied at different culture pH values and at the optimumtemperature for growth of B. subtilis UO-01.
Materials and methods
Bacterial cultures
B. subtilis UO-01, the amylase- and protease-producing strain,was acquired from the Biotechnology Center of the Universityof Oriente (Santiago de Cuba, Cuba). Stock cultures were main-tained at 4 ◦C on nutrient agar slants. The working cultureswere prepared monthly from frozen stock cultures and main-tained at 4 ◦C on nutrient agar (Cultimed Panreac QuímicaS.A.).
Culture medium preparation, inoculum and fermentationconditions
Brewery wastes (BWs), which were used to prepare the cul-
ture media, were obtained from a local brewery in Santiago deCuba, Cuba. The wastes were centrifuged at 12,000 × g/15 minto remove the solids in suspension. The supernatant obtainedfrom the BWs contained (g/L): COD, 3.40; total sugars, 1.98;1 45.5 8.01.267 47.6 8.5
reducing sugars, 1.46; total nitrogen, 0.095; total phosphorus,0.034.
Inoculum was prepared by transferring (with a sterile inoc-ulation loop) some colonies of a 24-h old slant culture into250 mL Erlenmeyer flasks containing 50 mL of sterile mediumcomposed of (g/L): glucose, 20; bacteriological peptone, 2.5;KH2PO4·3H2O, 1.5; Na2SO4, 1.5; MgSO4·7H2O, 0.15, FeSO4·7H2O,0.03; MnCl2·4H2O, 0.1; CaCl2·2H2O, 0.45. After inoculation, themedium was adjusted to pH 6.8 and sterilized at 121 ◦C/15 min.The inoculated culture was then incubated at 36 ◦C/12 h(200 rpm).
The production BWs medium was supplemented withthe same ingredients as the medium used to prepare theinoculum, but in this case, soluble potato starch (at a con-centration of 10 g/L) was used instead of glucose. The mediawere buffered at different initial pH values with the appropri-ate buffer (0.1 M potassium hydrogen phthalate–HCl buffer forpH values of 4.0, 4.5 and 6.2 or 0.1 M sodium phosphate bufferfor pH values of 8.0 and 8.5) according to the experimentaldesign defined in Table 1 and then sterilized (121 ◦C/15 min).
Batch cultures were performed in triplicate in 250 mL Erlen-meyer flasks containing 50 mL of the corresponding bufferedmedium. Each flask was inoculated with a 2% (v/v) inoculumlevel (with an absorbance of 0.5 at 600 nm) of a 12-h inoculumculture and incubated in an orbital shaker (200 rpm) for 30 h atthe corresponding temperature according to the experimentalmatrix defined in Table 1.
To study the relationship between nitrogen and proteinconsumption and protease production by strain UO-01 at dif-ferent initial pH values, the BWs media were buffered withthe same buffers used in the former experiment to obtaininitial pH values of 4, 5, 6, 7, and 8. The media were incu-bated (200 rpm) at the optimum temperature for growth of theenzyme-producing bacterium for 21 h.
Analytical methods
In each fermentation, three flasks were collected each 3 h,and triplicate samples (runs) were taken from each flask toperform analytical determinations. The COD values were mea-sured at the end of the culture period (30 h).
Growth was monitored by absorbance at 600 nm and con-verted to cell dry weight (CDW) from a standard curve. Cellswere harvested by centrifugation (12,000 × g for 15 min at
◦
4 C) of culture samples and washed twice with saline (0.8%NaCl). The culture supernatants were used to measure totalsugars (TS), total nitrogen (TN), proteins, enzyme produc-tion and COD. The methods for determining total sugars
r o b i
(spw
mebmiTeD(1
mwpasatipwamawOe1
stW
S
A(sco
C
A
P
wtoAa
b r a z i l i a n j o u r n a l o f m i c
phenol–sulfuric acid method), nitrogen (micro-Kjeldahl, sub-tituting distillation for a spectrophotometric method) androteins (method of Lowry) were described in a previousork.7
Amylase activity (AA) of the cell-free medium was deter-ined at 40 ◦C by appropriately mixing the diluted crude
nzyme extract (80 �L) with 400 �L of 0.15 M citrate–phosphateuffer (pH 5.0) and 800 �L of 4% soluble starch previouslyaintained at 40 ◦C/15 min. The reaction was stopped by
mmediately adding 480 �L of 3,5-dinitrosalicylic acid (DNS).he reducing sugars (glucose equivalents) released from thenzymatic reaction were determine after 10 min by using theNS method. One unit of amylase activity (enzymatic units
EU)/mL) was defined as the amount of enzyme releasing mg/mL of reducing sugars/min under the assay conditions.8
Protease activity (PA) of the cell-free medium was deter-ined as described by Tekin et al.9 The reaction mixtureith 1 mL of 1% (w/v) casein in 0.02 M NaOH, 2 mL of 0.4 Mhosphate buffer pH 6, and 1 mL of cell-free medium (suit-bly diluted) was incubated at 30 ◦C/10 min. The reaction wastopped with 3 mL of 10% trichloroacetic acid, mixed andfter 5 min, centrifuged at 12,000 × g for 5 min, then 0.5 mL ofhe supernatants were incubated with 2.5 mL of 0.1 M NaOHn 2% (w/v) Na2CO3 for 10 min. Thereafter, 0.25 mL of Folinhenolic reagent (commercial solution diluted 1:1 in distilledater) was added, mixed and held for 30 min at room temper-
ture. The absorbance measured at 750 nm was converted tog of tyrosine/L using a calibration curve (mg tyrosine/L vs.
bsorbance). The tyrosine solutions dissolved in 0.01 M HClere treated in the same manner as the cell-free medium.ne unit of protease (EU/mL) was defined as the amount ofnzyme that produced an absorbance at 750 nm equivalent to
�mol of tyrosine/min under the assay conditions.COD analyses were carried out in triplicate in the culture
upernatants at the end of each fermentation (30 h) usinghe Standard Methods for the Examination of Water and
astewater.10
tatistical analyses
fter obtaining the experimental concentrations of biomassCDW), AA and PA for each sampling time, the data weremoothed by using, in case of growth and PA production, theorresponding form of the logistic model6 and a modified formf the logistic model, in the case of AA:
DW(g/L) = CDWmax
1 + e(c−b·t) , being c = ln(
CDWmax
CDW0− 1
)(1)
A (EU/mL) = A0 · e(−A1·t)
1 + e(A2+A3·t+A4 ·t2)− A0
1 + e(A2)(2)
A (EU/mL) = A0
1 + e(A2+A3·t+A4 ·t2)− A0
1 + e(A2)(3)
here CDWmax and CDW0 are, respectively, the maximum and
he initial cell dry weight concentration (g/L), b is a constantf proportionality (h−1), t is the time (h) and A0, A1, A2, A3 and4 are constants in models (2) and (3). The latter models werelso adjusted to describe AA production. However, the best fits
o l o g y 4 7 (2 0 1 6) 665–674 667
were obtained with the use of model (2) that includes a term(e(−A1·t)) that considers the AA decay observed from the 18 hof incubation until the end of the culture. After smoothingthe cell growth and enzyme (AA and PA) production curves,the best sampling time to take the data for the correspondingexperimental design was selected for studying the combinedeffect of pH and temperature on the growth and enzyme syn-thesis by B. subtilis UO-01 in the BWs medium.
The central composite (orthogonal) design was based ontwo levels and two variables and consisted of 13 experimentswith four (22) factorial points, four axial points to form a cen-tral composite design with = 1.267 and five center pointsfor replication (Table 1). The corresponding smoothed dataobtained at 15 h of fermentation were used in each case. Theresults were analyzed by the Experimental Design Moduleof the Statistica software package (Statistica 12.0 for Win-dows computer program manual; StatSoft Inc., 2013, Tulsa,OK, USA). The coefficients of the models with p values lowerthan 0.05 were considered statistically significant. The Fisher’sF-test for analysis of variance (ANOVA) was performed onexperimental data to evaluate the statistical significance ofthe model.
Modeling the enzymes production with the Luedeking andPiret model
Both AA and PA production were modeled by using the Luedek-ing and Piret model.6 The model parameters in each casewere obtained by using the non-linear curve-fitting softwareof SigmaPlot for Windows version 12.0 (Systat Software, Inc.,2011). The coefficients of the models with p values lower than0.05 were considered statistically significant.
Results and discussion
Kinetics of growth, enzyme production and total sugarsconsumption by B. subtilis UO-01 in BWs media
The kinetics of growth (CDW), production of amylase (AA) andprotease (PA) activity and total sugars (TS) consumption by B.subtilis UO-01 in BWs media was followed in batch cultures atdifferent initial pH values and incubation temperatures (Fig. 1)according to the experimental design defined in Table 1.
According to the predictions of model (1), biomass produc-tion increased until 15 h of incubation and remained constantafterwards in all the cultures although, in some fermenta-tions, the total sugars were not totally consumed (Fig. 1).However, the evolution of enzyme (AA and PA) synthesis andbiomass production showed some differences. Thus, AA levelsincreased until reaching the maximum concentration at 15 hof culture, then the AA concentration was maintained almostconstant until 18 h and decreased slightly afterwards (Fig. 1),although not always significantly, because the values obtainedfor the coefficient A1 in model (2) were not always significant.
Because the presence of starch induces the production of
�-amylases,2 during the first 15 h of fermentation, AA was syn-thesized by B. subtilis UO-01 to hydrolyze the starch presentin the medium and produce more easily assimilable sugars(glucose and maltose) for the growing strain.1
668 b r a z i l i a n j o u r n a l o f m i c r o b i o l o g y 4 7 (2 0 1 6) 665–674
121 5 9
106
7 11
8 12
13
2
3
4
0.6
0.4
0.2
0
0.4
0.3
0.2
0.1
0
0.8
0.6
0.2
0.4
0
0.8
0.6
0.2
0.4
0
0.6
0.4
0.2
0
0 10 20
Time (h) Time (h) Time (h)
Time (h) Time (h) Time (h)
Time (h) Time (h) Time (h)
Time (h) Time (h)
CDW: Cell dry weight (g/L),
TS: Total sugars (g/L)
AA: Amylase activity (EU/mL),
PA: Protease activity (EU/mL),
Time (h)
Time (h)
TS
, AA
, PA
CD
W
TS
, AA
, PA
CD
W
TS
, AA
, PA
CD
W
TS
, AA
, PA
CD
W
TS
, AA
, PA
CD
W
TS
, AA
, PA
CD
W
TS
, AA
, PA
CD
W
TS
, AA
, PA
CD
W
TS
, AA
, PA
CD
W
TS
, AA
, PA
CD
W
TS
, AA
, PA
CD
W
TS
, AA
, PA
CD
W
CD
W
TS
, AA
, PA
30
T=45.5 ºC, pH=8.0 T=47.6 ºC, pH=6.2
T=28.0 ºC, pH=6.2
T=37.8 ºC, pH=8.5
T=37.8 ºC, pH=4.0 T=37.8 ºC, pH=6.2
T=37.8 ºC, pH=6.2
T=37.8 ºC, pH=6.2
T=37.8 ºC, pH=6.2
T=37.8 ºC, pH=6.2
T=45.5 ºC, pH=4.5
T=30.0 ºC, pH=8.0
T=30.0 ºC, pH=4.5
40
0 10 20 30 40
0 10 20 30 40
0 10 20 30 40 0 10 20 30 40
0 10 20 30 40
0 10 20 30 40
0 10 20 30 40
0 10 20 30 40
0 10 20 30 4000
0.34
0.68
0.912
1.2
0
0.3
0.6
0.9
1.2
0
0.3
0.6
0.9
1.2
0
0.2
0.4
0.6
0.8
0
0.3
0.6
0.9
1.2
0
0.3
0.6
0.9
1.2
16
0
4
8
12
16
0
4
8
12
16
0
4
8
12
16
0
4
8
12
16
0 10 20 30 40
0 10 20 30 40
0 10 20 30 40
9
6
3
0
12 0.12
9 0.09
6 0.06
0.03
0
3
0
12
9
6
3
0
12
9
6
3
0
12
9
6
3
0
0.3
0.2
0.1
0
12
9
6
3
0
12
9
6
3
0
12
9
6
3
0
Fig. 1 – Kinetic of production of cell dry weight, amylase and protease activity, and consumption of total sugars by B. subtilisUO-01 at the initial pH and T values, as defined in Table 1. Each data point represents the mean of three independentcultures (the standard errors were less than 5% of the means).

b r a z i l i a n j o u r n a l o f m i c r o b i o l o g y 4 7 (2 0 1 6) 665–674 669
Table 2 – Concentrations of biomass (CDW in g/L), amylase (AA in EU/mL) and protease (PA in EU/mL) activity obtained at15 h of incubation and chemical oxygen demand (COD) reduction percentages (%) at the end of the cultures (30 h). No.:number of the experiment.
No. Coded values Actual values Response variable values
T (◦C) pH T (◦C) pH CDW AA PA COD reduction
1 1 1 45.5 8.0 0.49 3.97 7.16 40.42 1 –1 45.5 4.5 0.10 1.73 2.72 8.13 –1 1 30.0 8.0 0.68 5.30 7.50 56.34 –1 –1 30.0 4.5 0.37 3.20 3.06 30.15 1.267 0 47.6 6.2 0.35 3.08 5.42 28.86 –1.267 0 28.0 6.2 0.63 4.94 5.91 51.37 0 1.267 37.8 8.5 0.68 5.20 8.26 56.78 0 –1.267 37.8 4.0 0.25 2.25 2.64 19.99 0 0 37.8 6.2 0.91 9.40 8.84 74.4
10 0 0 37.8 6.2 0.89 9.27 8.81 73.111 0 0 37.8 6.2 0.93 9.40 9.48 77.8
ttdadc
eopBnos
it
1
2
mrtowwaab
12 0 0 37.8 6.213 0 0 37.8 6.2
The observed decline in AA synthesis after 18 h of incuba-ion could be related to a possible proteolytic degradation ofhe amylases by the action of the extracellular proteases pro-uced by the B. subtilis strain.1,2 However, other researchersttributed this AA decrease to a possible denaturation and/orecomposition of the enzyme due to interactions with otherompounds in the fermented medium.3
Protease production that reached the maximum PA lev-ls at 15 h of incubation (Fig. 1) was only detected after 9 hf fermentation in all cultures, when the cells entered theost-exponential phase, as it was observed before for otheracillus species.11 This behavior has been attributed to theeed for obtaining nutrients for post-exponential survival11
r to an increased need for turnover of cell proteins at thelower growth rate.1
Because all the media were buffered at the correspondingnitial pH values, the cessation of growth from 15 h of fermen-ation could be related to the following reasons:
. In the cultures at initial pH ≥ 6.2, the carbon source reachedlevels considerably lower (<3 g/L), except for the culturesat initial pH 8.0 and T = 45.5 ◦C and at initial pH 6.2 andT = 47.6 ◦C (Fig. 1). These low TS levels could lead to a lowavailability of the carbon source12 that limits the growth ofB. subtilis UO-01.
. The exhaustion in all the cultures of some nutrient (thesources of nitrogen and/or phosphorus) or micronutri-ent (vitamins, minerals amino acids or cations) essentialfor the growth of the enzyme-producing strain, as it wasobserved before for other bacteria.12,13
The removal percentages of initial COD load in the fer-ented media are shown in Table 2. The higher COD
eductions (69.9–77.8%) were obtained in the cultures charac-erized by the highest biomass production in the center pointsf the experimental design, suggesting that B. subtilis UO-01as able to utilize the organic matter present in the breweryastewater as a source of nutrients. Thus, bacterial growth
nd enzyme production by B. subtilis UO-01 could be used asn alternative for removing the initial COD load present inrewery wastes.
0.81 8.75 9.63 69.90.87 9.10 9.48 72.1
Kinetic classification of the AA and PA production
To typify the production of the two enzymes (E), the classicalLuedeking and Piret (LP) model6 was used:
dE
dX= · dX
dt+ · X, or dividing by the biomass (4)
qE = ( · � + ˇ) (5)
where X is the biomass concentration (g of CDW/L), t is thetime (h), qE is the specific enzyme production rate (EU/mg/h),� is the specific growth rate (h−1), is a growth-associatedconstant for enzyme production (EU/mg), and is the non-growth-associated constant (EU/mg/h).
The CDW, AA and PA values (symbols in Fig. 2) predictedby models (1), (2) and (3) (solid lines in Fig. 1) were used tocalculate the values of the parameters of the LP model (5).
The trajectories for the production dynamic of the twoenzymes (solid lines in Fig. 2) were calculated by numericalintegration of the qE values obtained with the LP model (5) forAA and PA synthesis in the corresponding batch cultures of B.subtilis UO-01.
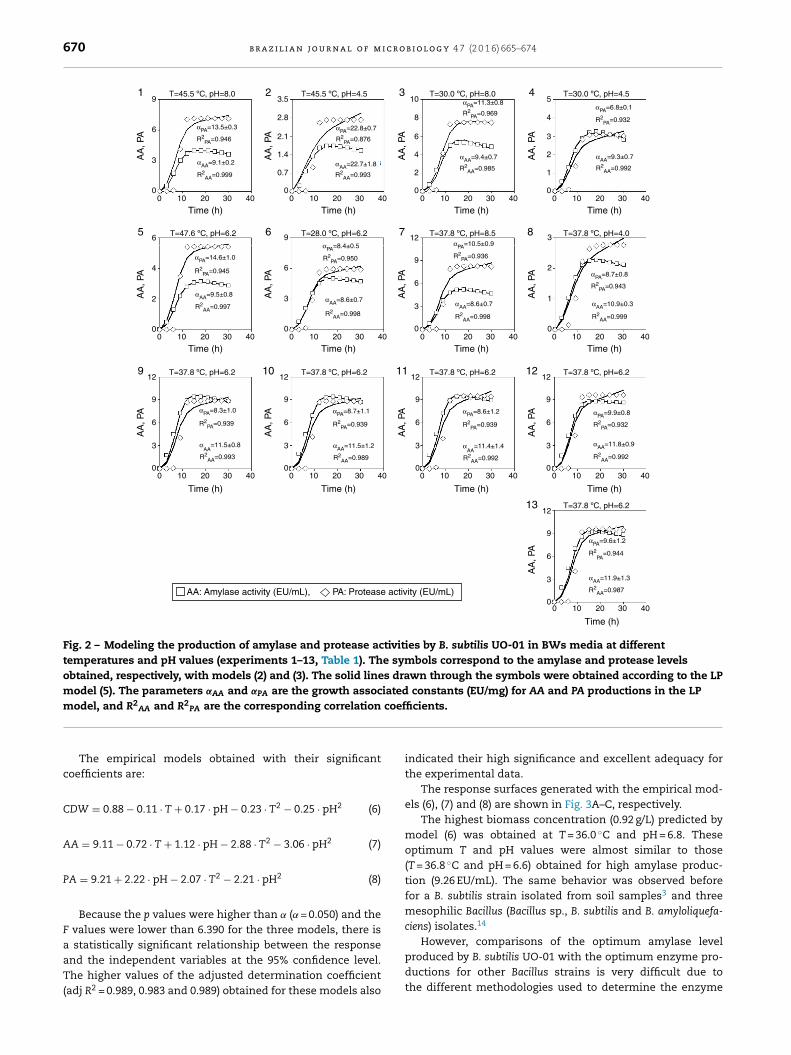
For both enzymes, significant values (p < 0.05) for and non-significant values (p > 0.05) for were always obtained (Fig. 2).Thus, AA and PA can be characterized as growth-associatedmetabolites ( /= 0, = 0). However, AA production (R2
AA val-ues between 0.985 and 0.999) was more satisfactorily describedby the LP model than PA synthesis (R2
PA values between 0.876and 0.969), mainly because production of the latter enzymestarted after 9 h of incubation, while the growth and AA pro-duction started from the beginning of the culture (Fig. 2).
Effect of initial pH and incubation temperature on thegrowth and production of amylases and proteases
The results on the effect of initial pH and temperature on pro-duction of biomass (CDW), AA and PA by B. subtilis UO-01 inBWs medium after 15 h of incubation are shown in Table 2.
670 b r a z i l i a n j o u r n a l o f m i c r o b i o l o g y 4 7 (2 0 1 6) 665–674
T=45.5 ºC, pH=8.0
AA
, PA
Time (h) Time (h) Time (h) Time (h)
Time (h) Time (h) Time (h)
Time (h) Time (h)
Time (h)
AA: Amylase activity (EU/mL), PA: Protease activity (EU/mL)
Time (h)
Time (h)
Time (h)
AA
, PA
AA
, PA
AA
, PA
AA
, PA
AA
, PA
AA
, PA
AA
, PA
AA
, PA
AA
, PA
AA
, PA
AA
, PA
AA
, PA
T=47.6 ºC, pH=6.2
T=37.8 ºC, pH=6.2 T=37.8 ºC, pH=6.2
T=28.0 ºC, pH=6.2
T=45.5 ºC, pH=4.5 T=30.0 ºC, pH=8.0
T=37.8 ºC, pH=8.5
T=37.8 ºC, pH=6.2 T=37.8 ºC, pH=6.2
T=37.8 ºC, pH=6.2
T=37.8 ºC, pH=4.0
T=30.0 ºC, pH=4.59
1 2
65
9 10 11 12
13
3
7
4
8
αPA=13.5±0.3 αPA=22.8±0.7
αAA=9.1±0.2 αAA=22.7±1.8
R2PA=0.946 R2
PA=0.876
αPA=11.3±0.8
R2PA=0.969
αPA=6.8±0.1
R2PA=0.932
R2AA=0.999
αPA=14.6±1.0
αPA=8.4±0.5
αAA=9.5±0.8
R2PA=0.945
R2PA=0.950
R2AA=0.997
αAA=8.6±0.7
R2AA=0.998
αPA=10.5±0.9
R2PA=0.936
αPA=8.7±0.8
R2PA=0.943
αAA=8.6±0.7
R2AA=0.998
αAA=10.9±0.3
R2AA=0.999
αPA=9.9±0.8
R2PA=0.932
αAA=11.8±0.9
R2AA=0.992
αPA=8.6±1.2
R2PA=0.939
αAA
=11.4±1.4
R2AA=0.992
αPA=9.6±1.2
R2PA
=0.944
αAA=11.9±1.3
R2AA=0.987
αPA=8.7±1.1
R2PA=0.939
αAA=11.5±1.2
R2AA=0.989
αPA=8.3±1.0
R2PA=0.939
αAA
=11.5±0.8
R2AA=0.993
R2AA=0.993
αAA=9.4±0.7
R2AA=0.985
αAA=9.3±0.7
R2AA=0.992
6
3
0
9
6
3
0
3
2
1
0
6
4
2
0
12
9
6
3
0
12
9
6
3
0
12
9
6
3
0
12
9
6
3
0
12
9
6
3
0
12
9
6
3
0
3.5
2.8
2.1
1.4
0.7
0
10
8
6
4
2
0
5
4
3
2
1
00 10 20 30 40
0 10 20 30 40
0 10 20 30 400 10 20 30 40 0 10 20 30 40
0 10 20 30 40
0 10 20 30 40
0 10 20 30 400 10 20 30 400 10 20 30 40
0 10 20 30 40 0 10 20 30 40 0 10 20 30 40
Fig. 2 – Modeling the production of amylase and protease activities by B. subtilis UO-01 in BWs media at differenttemperatures and pH values (experiments 1–13, Table 1). The symbols correspond to the amylase and protease levelsobtained, respectively, with models (2) and (3). The solid lines drawn through the symbols were obtained according to the LPmodel (5). The parameters ˛AA and ˛PA are the growth associated constants (EU/mg) for AA and PA productions in the LP
coef
model, and R2AA and R2PA are the corresponding correlation
The empirical models obtained with their significantcoefficients are:
CDW = 0.88 − 0.11 · T + 0.17 · pH − 0.23 · T2 − 0.25 · pH2 (6)
AA = 9.11 − 0.72 · T + 1.12 · pH − 2.88 · T2 − 3.06 · pH2 (7)
PA = 9.21 + 2.22 · pH − 2.07 · T2 − 2.21 · pH2 (8)
Because the p values were higher than ( = 0.050) and theF values were lower than 6.390 for the three models, there is
a statistically significant relationship between the responseand the independent variables at the 95% confidence level.The higher values of the adjusted determination coefficient(adj R2 = 0.989, 0.983 and 0.989) obtained for these models alsoficients.
indicated their high significance and excellent adequacy forthe experimental data.
The response surfaces generated with the empirical mod-els (6), (7) and (8) are shown in Fig. 3A–C, respectively.
The highest biomass concentration (0.92 g/L) predicted bymodel (6) was obtained at T = 36.0 ◦C and pH = 6.8. Theseoptimum T and pH values were almost similar to those(T = 36.8 ◦C and pH = 6.6) obtained for high amylase produc-tion (9.26 EU/mL). The same behavior was observed beforefor a B. subtilis strain isolated from soil samples3 and threemesophilic Bacillus (Bacillus sp., B. subtilis and B. amyloliquefa-ciens) isolates.14
However, comparisons of the optimum amylase levelproduced by B. subtilis UO-01 with the optimum enzyme pro-ductions for other Bacillus strains is very difficult due tothe different methodologies used to determine the enzyme

b r a z i l i a n j o u r n a l o f m i c r o b i o l o g y 4 7 (2 0 1 6) 665–674 671
CD
W (
g/L)
A B
C
AA
(E
U/m
L)
pH
pH
Temp (ºC) Temp (ºC)
Temp (ºC)
pH
PA (
EU
/mL)
1.0
47.6
37.8
28.0 6.06.9
7.7 47.6
37.8
28.0 6.06.9
7.7
12
9
6
3
0
0.8
0.6
0.4
0.2
0
1.0
47.6
37.8
28.0 6.06.9
7.7
8
6
4
2
0
CDW: Cell dry weight AA: Amylase activity, PA: Protease activity
Fig. 3 – Response surfaces showing the effect of temperature and pH on the production of cell dry weight, amylase andp
atFmftIaet
(asa
llsceptocma
rotease activities by B. subtilis UO-01 in BWs media.
ctivity, the different forms to express the enzyme concentra-ion and the different forms to define the enzyme activity unit.or example, in some cases, the enzyme activity was deter-ined by quantifying the amounts of reducing sugars released
rom the hydrolysis of starch by incubating the reaction mix-ures at temperatures of 40 ◦C,1 50 ◦C14 or 60 ◦C15 for 10 min.n these cases, the enzyme activity unit was defined as themount of enzyme releasing 1 �mol of glucose14,15 or maltose1
quivalents from the substrate per min under the assay condi-ions, and the reaction mixtures had different compositions.
With regard to protease production, the maximum level9.77 EU/mL) predicted by model (8) was obtained at pH = 7.1nd T = 37.8 ◦C. Similar results were obtained for B. subtilistrain Rand, which produced the maximum relative proteasectivity (%) at pH = 7 and T = 37 ◦C.16
As indicated above, comparison of the optimum proteaseevel produced by B. subtilis strain UO-01 with the proteaseevels found by other researchers is very difficult as a con-equence of the different forms of expressing the enzymeoncentrations or defining the unit of protease activity. Forxample, protease levels have been expressed as relativeroduction in U/log10CFU17 or as relative activity (%).16 In addi-ion, the unit of protease activity was defined as the amount
f enzyme required to: (i) produce an increase of 0.1 in opti-al density at 700 nm,1 (ii) release 1 �g of tyrosine per mL perinute,18 or (iii) to obtain an increase of 0.001 absorbance unitt 450 nm per minute.16
The increase in temperature over its optimum valueinhibited product (CDW, AA and PA) formation by B. subtilisstrain UO-01, probably by suppression of cell viability19 andenzymatic inactivation.20 In contrast, low temperature valuesmay slow down the metabolism of the microorganism20 andconsequently, enzyme synthesis, because the latter productswere synthesized as growth-associated (primary) metabolites,as it was demonstrated with the LP model (Fig. 2).
The decrease in growth and enzyme (AA and PA) pro-duction observed at pH levels lower and higher than theoptimum value could be related to a reduction in the metabolicactivity of B. subtilis UO-01,3 probably caused by a limitationin micronutrients or nutrient transport.13,21 Inactivation orinstability of the enzymes could be other reasons to explainthe decrease observed in enzyme production.22
Verification of the predicted results in the optimalconditions for enzyme production
Triplicate incubation experiments were carried out under theoptimized conditions for AA and PA productions to verify theresults predicted by models (7) and (8). The experimental datafor growth and production of AA and PA in both cases were
smoothed by using the models (1), (2) and (3) (Fig. 4). Under theoptimal conditions for AA production (T = 36.8 ◦C and pH = 6.6),the predicted values of biomass, AA and PA after 15 h of incu-bation were, respectively, 0.94 g/L, 9.35 EU/mL and 9.34 EU/mL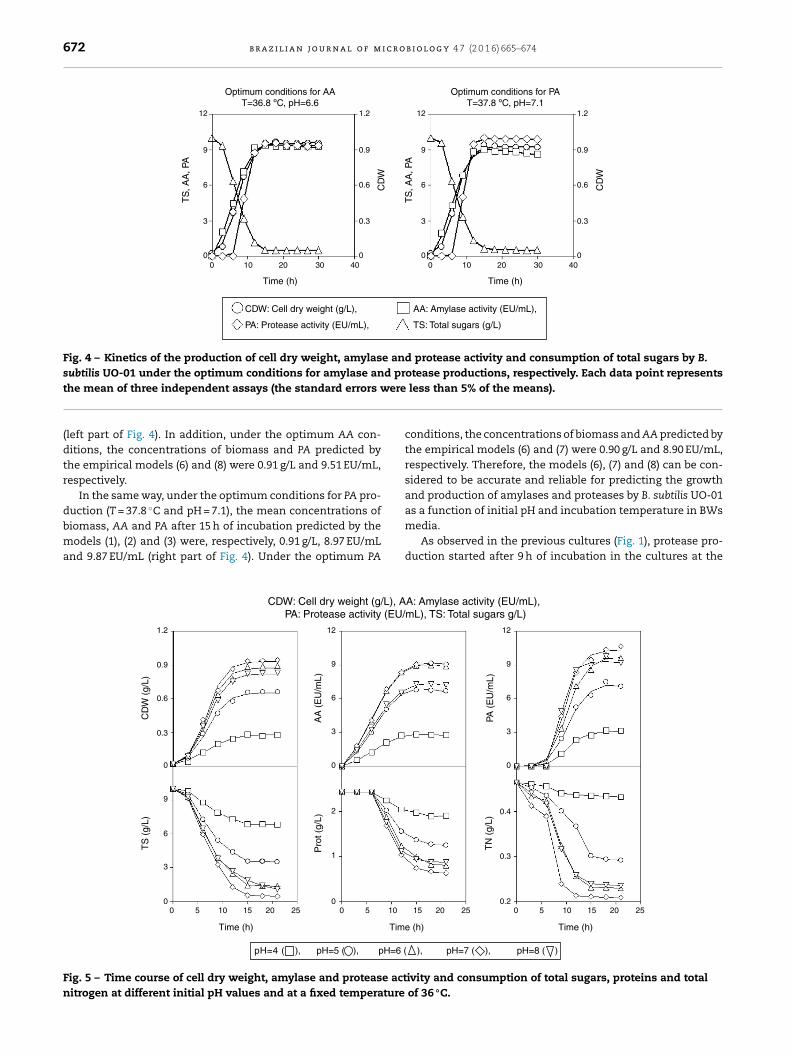
672 b r a z i l i a n j o u r n a l o f m i c r o b i o l o g y 4 7 (2 0 1 6) 665–674
Optimum conditions for AAT=36.8 ºC, pH=6.6
CDW: Cell dry weight (g/L),
PA: Protease activity (EU/mL),
AA: Amylase activity (EU/mL),
TS: Total sugars (g/L)
Time (h)
12
9
6
3
0
1.2
0.9
0.6
0.3
00 10 20 4030 0 10 20 4030
12
9
6
3
0
1.2
0.9
0.6
0.3
0
Time (h)
TS
, AA
, PA
TS
, AA
, PA
CD
W
CD
W
Optimum conditions for PAT=37.8 ºC, pH=7.1
Fig. 4 – Kinetics of the production of cell dry weight, amylase and protease activity and consumption of total sugars by B.subtilis UO-01 under the optimum conditions for amylase and protease productions, respectively. Each data point represents
ere
the mean of three independent assays (the standard errors w(left part of Fig. 4). In addition, under the optimum AA con-ditions, the concentrations of biomass and PA predicted bythe empirical models (6) and (8) were 0.91 g/L and 9.51 EU/mL,respectively.
In the same way, under the optimum conditions for PA pro-duction (T = 37.8 ◦C and pH = 7.1), the mean concentrations of
biomass, AA and PA after 15 h of incubation predicted by themodels (1), (2) and (3) were, respectively, 0.91 g/L, 8.97 EU/mLand 9.87 EU/mL (right part of Fig. 4). Under the optimum PACDW: Cell dry weight (g/L), APA: Protease activity (EU/
1.2 12
9
6
3
0
2
1
0
0.9
0.6
0
9
6
3
00 5 10 15
Time (h) Tim
Pro
t (g/
L)A
A (
EU
/mL)
CD
W (
g/L)
TS
(g/
L)
20 25 0 5 10
0.3
pH=4 ( pH=5 ( pH=6 (), ),
Fig. 5 – Time course of cell dry weight, amylase and protease actnitrogen at different initial pH values and at a fixed temperature
less than 5% of the means).
conditions, the concentrations of biomass and AA predicted bythe empirical models (6) and (7) were 0.90 g/L and 8.90 EU/mL,respectively. Therefore, the models (6), (7) and (8) can be con-sidered to be accurate and reliable for predicting the growthand production of amylases and proteases by B. subtilis UO-01as a function of initial pH and incubation temperature in BWs
media.As observed in the previous cultures (Fig. 1), protease pro-duction started after 9 h of incubation in the cultures at the
A: Amylase activity (EU/mL), mL), TS: Total sugars g/L)
12
9
6
3
0
0.4
0.3
0.2
e (h)
PA (
EU
/mL)
TN
(g/
L)
Time (h)
15 20 25 0 5 10 15 20 25
pH=7 ( pH=8 (), ), )
ivity and consumption of total sugars, proteins and total of 36 ◦C.

r o b i
oatin
mLpaTapmn
itadwwars
a9Ltatnicb
pnHdnd
C
Tctetrdw
C
T
r
b r a z i l i a n j o u r n a l o f m i c
ptimal conditions for AA and TA production (Fig. 4). In anttempt to explain the observed delay in protease production,he kinetics of growth and enzyme production were followedn parallel with the evolution of the corresponding inductorutrient (total sugars and proteins) for each enzyme.
Because both the nutrient consumption and product for-ation by different bacteria (Lactococcus lactis, L. cremoris,
actobacillus rhamnosus and Lact. casei) depended on the cultureH,13,21 a series of cultures with strain UO-01 in BWs mediadjusted to initial pH values of 4, 5, 6, 7 and 8 was studied.he cultures were incubated at 36 ◦C (the optimum temper-ture for biomass production) for 21 h. Considering that theresence of protein and non-protein nitrogen in the cultureedia can affect protein consumption,7 the evolution of total
itrogen was also followed in the fermentations.As observed in Fig. 5, production of biomass and AA
ncreased in parallel with the decreases in TS and TN. In addi-ion, a direct relationship between the time courses of proteinsnd PA production was observed. In the latter case, proteinsecreased at 9 h of fermentation when protease productionas detected in the culture medium. However, total nitrogenas slightly consumed during the first 6 h of incubation, but
fter this time, the concentration of total nitrogen decreasedapidly, coinciding with the start of the intense protein con-umption.
If the time courses of proteins and TN are jointly analyzed, direct relationship between both variables only exists after
h of incubation. According to the manufacturers (Pronadisa,aboratorios Conda, SA), the bacteriological peptone used ashe nitrogen source in the BWs media has a total nitrogen andn amino nitrogen content of 15.5% and 3% (w/w), respec-ively. Thus, B. subtilis UO-01 seemed to consume first theon-protein nitrogen fraction (presumably easier to assim-
late) and then the nitrogen present in the proteins of theulture media (Fig. 5), as it was observed before for otheracteria.7,23,24
These observations suggest that the delay in proteaseroduction could be closely related to the consumption ofon-protein and protein nitrogen by B. subtilis UO-01 (Fig. 5).owever, the consumption of both total nitrogen and proteinsepended on the culture pH (Fig. 5) as observed before forutrient (sugars, amino acids and phosphorus) transport inifferent strains of lactic acid bacteria.13,21
onclusions
he results obtained in this work showed that brewery wastesould be used for enzyme (amylases and proteases) produc-ion by B. subtilis UO-01, with the additional advantage of anffective and cost-effective reduction of the initial COD. Then,he methodological procedure described in this work and theesults obtained could be used as a reference for the pro-uction of other important microbial metabolites in breweryastes and in other effluents from the food industry.
onflicts of interest
he authors declare no conflicts of interest.
o l o g y 4 7 (2 0 1 6) 665–674 673
e f e r e n c e s
1. Mukhtar H, Haq IU. Concomitant production of twoproteases and alpha-amylase by a novel strain of Bacillussubtilis in a microprocessor controlled bioreactor. Braz JMicrobiol. 2012;43:1072–1079.
2. Jamrath T, Lindner C, Popovic MK, Bajpai R. Production ofamylases and proteases by Bacillus caldolyticus from foodindustry wastes. Food Technol Biotechnol. 2012;50:355–361.
3. Unakal C, Kallur RI, Kaliwal BB. Production of �-amylaseusing banana waste by Bacillus subtilis under solid statefermentation. Eur J Exp Biol. 2012;2:1044–1052.
4. Raul D, Biswas T, Mukhopadhyay S, Das SK, Gupta S.Production and partial purification of alpha amylase fromBacillus subtilis (MTCC 121) using solid state fermentation.Biochem Res Int. 2014:1–5.
5. Agregán R, Alonso E, Torrado A, Guerra NP. A review on someimportant factors affecting bacteriocin production bylactococci, lactobacilli and pediococci. Curr Biochem Eng.2014;1:9–24.
6. Guerra NP. Modeling the batch bacteriocin productionsystem by lactic acid bacteria by using modifiedthree-dimensional Lotka-Volterra equations. Biochem Eng J.2014;88:115–130.
7. Guerra NP, Torrado A, López C, Fajardo P, Pastrana L.Dynamic mathematical models to describe the growth andnisin production by Lactococcus lactis subsp. lactis CECT 539 inboth batch and re-alkalized fed-batch cultures. J Food Eng.2007;82:103–113.
8. Torrado A, Vázquez JA, Prieto MA, et al. Amylase productionby Aspergillus oryzae in a solid-state bioreactor withfed-batch operation using mussel processing wastewaters asfeeding medium. J Chem Technol Biotechnol. 2013;88:226–236.
9. Tekin N, Cihan AC , Takac ZS, Tüzün CY, Tunc K, C ökmüs C.Alkaline protease production of Bacillus cohnii APT5. Turk JBiol. 2012;36:430–440.
10. APHA. Standard Methods for the Examination of Water andWastewater. 21st edition Washington, DC: American PublicHealth Association; 2005.
11. Aronson AI, Bell C, Fulroth B. Plasmid-encoded regulator ofextracellular proteases in Bacillus anthracis. J Bacteriol.2005;187:3133–3138.
12. Van Niel EWJ, Hahn-Hägerdal B. Nutrient requirements oflactococci in defined growth media. Appl Microbiol Biotechnol.1999;52:617–627.
13. Fajardo P, Rodríguez I, Pastrana L, Guerra NP. Production of apotentially probiotic culture of Lactobacillus casei subsp. caseiCECT 4043 in whey. Int Dairy J. 2008;18:1057–1065.
14. Nusrat A, Rahman SR. Comparative studies on theproduction of extracellular �-amylase by three mesophilicBacillus isolates. Bangl J Microbiol. 2007;24:129–132.
15. Amutha K, Priya KJ. Effect of pH, temperature and metal ionson amylase activity from Bacillus subtilis KCX 006. Int J PharmaBio Sci. 2011;2. B-407-B-413.
16. Abusham RA, Rahman RNZRA, Salleh AB, Basri M.Optimization of physical factors affecting the production ofthermo-stable organic solvent-tolerant protease from anewly isolated halo tolerant Bacillus subtilis strain Rand.Microb Cell Fact. 2009;8:20.
17. Shivanand P, Jayaraman G. Production of extracellularprotease from halotolerant bacterium, Bacillus aquimarisstrain VITP4 isolated from Kumta coast. Proc Biochem.2009;44:1088–1094.
18. Olajuyigbe FM. Optimized production and properties ofthermostable alkaline protease from Bacillus subtilis SHS-04grown on groundnut (Arachis hypogaea) meal. Adv Enz Res.2013;1:112–120.

i c r o
674 b r a z i l i a n j o u r n a l o f m19. Francis F, Sabu A, Nampoothiri KM, Szakacs G, Pandey A.Synthesis of a-amylase by Aspergillus oryzae in solid-statefermentation. J Basic Microbiol. 2002;5:320–326.
20. Mazutti M, Ceni G, Di Luccio M, Treichel H. Production ofinulinase by solid-state fermentation: effect of processparameters on production and preliminary characterizationof enzyme preparations. Bioprocess Biosyst Eng.
2007;30:297–304.21. Panesar PS, Kennedy JF, Knill CJ, Kosseva M. Production ofL(+) lactic acid using Lactobacillus casei from whey. Braz ArchBiol Techn. 2010;53:219–226.
b i o l o g y 4 7 (2 0 1 6) 665–674
22. Aqel H. Effects of pH-values, temperatures, sodium chloride,metal ions, sugars and Tweens on the acid phosphataseactivity by thermophilic Bacillus strains. Eur J Sci Res.2012;75:262–268.
23. Letort C, Nardi M, Garault P, Monnet V, Juillard V. Caseinutilization by Streptococcus thermophilus results in a diauxicgrowth in milk. Appl Environ Microbiol. 2002;68:3162–3165.
24. Guerra NP, Fajardo P, Pastrana L. Modelling the stressinducing biphasic growth and pediocin production byPediococcus acidilactici NRRL B-5627 in re-alkalized fed-batchcultures. Biochem Eng J. 2008;40:465–472.