since 1980s,tqm has been regarded as one of the effective ... real.doc · web viewtotal quality...
TRANSCRIPT
MAKERERE UNIVERSITY
COLLEDGE OF BUSINESS AND MANAGEMENT SCIENCES
ADOPTION OF TOTAL QUALITY MANAGEMENT PRACTICES AND
PERFOMANCE OF SMALL AND MEDUIM SCALE MANUFACTURING
ENTERPRISES.
A CASE STUDY OF KAMPALA DISTRICT
BY
MUTEBI RONALD
06/U/9650/EXT
SUPERVISOR: MR. KITALE C.CHARLES
A RESEARCH PROPOSAL SUBMITTED TO MAKERERE UNIVERSITY IN
PARTIAL FULFILLMENT OF THE REQUIREMENTS OF THE AWARD OF THE
DEGREE OF BACHELOR OF COMMERCE.
AUGUST -2011
1

DECLARATION
I Mutebi Ronald declare that this research report is my original work and has never been
previously or currently presented to any university for the award of any degree .The
source used to compile it are presented and where another person’s work has been used
or referred to, an acknowledgement been made respectively.
Signature ………………………………………………………………..
Date ……………………………………………………………………
2

APPROVAL
This is to certify that this work has been submitted for examination with my approval as
university supervisor.
Signature
…………………………………………….............................
Date ……………………………………………………………….
3

DEDICATION
To my father Mr. Kizito Austin who basically sacrificed his life to make certain that I get
a head start .And to my mother Mrs. Kizito Justine for the support above and beyond the
call. What would I do without two?
4

ACKNOWLEDGEMENT
I would like to acknowledge the assistants, academic moral or material, which was
extended to me during the preparation of this research report.
I extended my sincere appreciation to my supervisor, Mr. Kitale Chris for his valuable
and brotherly guidance, encouragement, advice and collective comments throughout the
preparation of this research report .I am al so indebted to Mr. .Richard Kajumbula and
Mr. Isaac Shinyekwe who introduced me to Research Methods
I thank God and my paternal family members who have been by my side since I began
my university degree to date .Utmost special thanks to my aunt, M/s Nalongo Sylvia
sendi and Mr. Salongo sendi for the love ,care ,moral and financial support rendered to
me through out my life my brothers and sisters :Sserwanga john ,Jjuko henry, Kanyike
thomas, Nakizito teddy, Ndagire Justin, Demintria, Joseph and Edward and my God
mother M/s Sarka slozolova for all the shared triumphs and disasters over so many years .
I would like to appreciate the support and encouragement that my friends have rendered
to me during this study. Special thanks go to the following people Nassaka
lindah ,Faridah ,Erinah, Paul, Wilson, Innocent ,Lawrence, Joseph, Partrick, Richard,
Vanessa ,Hannington, Julius,Special thanks go to Mr.& Mrs. Ssebalamu, M/s Sarka
slovilova and all the workers at Afroplast (u) ltd.
Thank you all for the support accorded to me during the course and throughout the
research process.
5

TABLE OF CONTENTS
DECLARATION……………………………………………………………..ii
APPROVAL………………………………………………………………….iii
DEDICATION………………………………………………………………..iv
ACKNOWLEDGEMENTS………………………………………………….v
TABLE OF CONTENTS……………………………………………………vi
LIST OF FIGURES………………………………………………………….xi
LIST OF TABLES……………………………………………………………xii
LIST OF ABBREVIATIONS AND ACRONYMS…………………………xiii
ABSTRACTS…………………………………………………………………..xiv
CHAPTER ONE
INTRODUCTION
1.1 BACKGROUND OF THE STUDY…………………………………………1
1.2 STATEMENT THE PROBLEM ……………………………………………2
1.3 PURPOSE OF THE STUDY………………………………………………...3
1.4 OBJECTIVE OF THE STUDY……………………………………………...3
1.5 RESEARCH QUESTIONS………………………………………………….3
1.6 SCOPE OF THE STUDY …………………………………………………..3
1.6.1 CONTENT SCOPE………………………………………………………3
1.6.2 GEOGRAPHICAL SCOPE……………………………………………....4
1.7 SIGNIFICANCY OF THE STUDY…………………………………………4
1.8 CONCEPTUAL FRAMEWORK……………………………………………4
CHAPTER TWO
LITERATURE REVIEW
6

2.0 INTRODUCTGION…………………………………………………………..5
2.1 Definition of TQM…………………………………………………………….5
2.2 Definition of business performance……………………………………………8
2.3 Definition of quality……………………………………………………………9
2.4 Some of the general causes of poor performance in S.M.ES………………….11
2.5 Critical factors for effective TQM adoption……………………………….11
2.5.1 Management leadership and commitment…………………………………..11
2.5.2 Continuous improvement……………………………………………………12
2.5.3 Total customer satisfaction……………………………………………….....13
2.5.4 Employee involvement………………………………………………………14
2.5.5 Training and education………………………………………………………15
2.5.6 Reward and recognition……………………………………………………...16
2.6 Levels of TQM implementation……………………………………………..17
2.6.1 No customer concern/ No inspection………………………………………..17
2.6.2 Quality control……………………………………………………………....17
2.6.3 Quality assurance…........................................................................................18
2.6.4 Continuous quality improvement…………………………………………...18
2.6.5 Quality award model………………………………………………………..18
2.7 Dimensions of business performance…………………………………………19
2.7.1 Product quality and effectiveness…………………………………………...19
2.7.2 Customer satisfaction………………………………………………………..19
2.7.3 Financial performance……………………………………………………….19
2.8 Effects of TQM adoption on business performance………………………..20
2.8.1 TQM and organization performance…………………………………………20.
2.8.2 TQM and organization growth……………………………………………….20
2.8.3 TQM and organization competitive advantage……………………………….20
2.8.4 TQM and organization profits………………………………………………...21
7

2.8.5 TQM and organization financial performance………………………………..21
2.8.6 TQM and product quality and price…………………………………………..21
2.8.7 TQM and customer protection………………………………………………..22
2.9 Relationship between adoptions of TQM techniques and
business performance…………………………………………………....22
2.10 Hypothesis developed
2.10.1 Customer focus……………………………………………………………25
2.10.2 Management leadership…………………………………………………...26
2.10.3 Human resource management…………………………………………….26
2.10.4 Quality data and reporting………………………………………………..27
2.10.5 Suppliers’ management…………………………………………………..28
2.10.6 Design management……………………………………………………...39
2.10.7 Process management……………………………………………………..39
2.10.8 Conclusion……………………………………………………………….39
CHAPTER THREE
METHODOLOGY
3.0 Introduction ……………………………………………………………….31
3.1 Research design……………………………………………………………31
3.2 Survey population………………………………………………….............31
3.3 Sampling method…………………………………………………………...31
3.4 Sample size ………………………………………………………………....31
3.5 Source of data……………………………………………………………...32
3.6 Data collection tools……………………………………………...................32
3.7 Procedures of data collections ……………………………………………...32
3.8 Data presentation and analysis ……………………………………………..33
3.9 Problem s /limitations s of the study………………………………………..33
8

CHAPTER FOUR
PRESENTATION, ANALYSIS AND INTERPRETATION P F FINDINGS
4.0 Introduction ……………………………………………………………34
4.1 Findings on demographic characteristics of respondents
4.1.1 Response rate………………………………………………………….34
4.1.2 Age of respondents …………………………………………………..35
4.1.3 Gender of respondents ……………………………………………….36
4.1.4 Educational levels of respondents ……………………………………37
4.1.5 Length of time respondents have worked at the company……………38
4.1.6 Length of time the company has been in existence…………………..39
4.2. Findings on adoption of TQM techniques
4.2.1 Findings on the factors for effective adoption/
implementation of TQM techniques………………………………..40
4.3 Findings on the effects of TQM on company performance……………..42
4.3.1 TQM and organization performance…………………………………..42
4.3.2 TQM and organization growth………………………………………...43
4.3.3 TQM and organization competitive advantage..………………………43
4.3.4 TQM and organization profits…………………………………………45
4.3.5 TQM and organization financial performance…………………………45
4.3.6 TQM and product quality and price……………………………………46
4.3.7 TQM and customer protection………………………………………….47
4.4 FINDINGS ON THE RELATIONSHIP BETWEEN ADOPTION OF TQM
TECHNIQUES AND PERFORMANCE OF SMALL AND MEDIUM ENTERPRISES
4.4.1 Whether effective adoption of TQM techniques affects the performance
of small and medium enterprises……………………………………….48
4.4.2 Whether there is a relationship between adoption of TQM
techniques and performance of S.M.Es…………………………..49
9

CHAPTER FIVE
SUMMARY OF MAJOR FINDINGS, CONCLUSIONS AND RECOMMENDATIONS
5.0 Introduction……………………………………………………………………51
5.1 SUMMARY OF MAJOR FINDINGS ………………………………………..51
5.1.1 Summary of major findings on adoption of TQM techniques……………….52
5.1.2. Summary of major findings on business performance………………………52
5.1.3 Summary of major findings on the relationship between adoption
of TQM techniques and performance of S.M.E…………………………52
5.2 Conclusion…………………………………………………………………..52
5.2.1 Adoption of TQM techniques……………………………………………..52
5.2.2 Effects on company performance………………………………………….52
5.2.3 RRLATIONSHIP BETWEEN LOCAL REVENUE COLLECTION AND
QUALITY OF SERVICE DERIVERY
5.3 RECOMM ENDATIONS
5.3.2 Recommendations on quality service delivery
5.4 Areas for further research
BIBLIOGRATHY
APPENDICES
APPENDIX I
APPENMDIX II
APPERNDIX III
APPENDIX IV
APPENDIX V
APPENDIX VI
APPENDIX VIII
10

APPENDIX
LIST OF FIGURES.
Figure 1; Response Rate…………………………………………………… 34
Figure 2; Age of Respondents………………………………………………35
Figure 3; Gender of the Respondents……………………………………….36
Figure 4; Education level of the Respondent………………………………..37
Figure 5; Time of work at the company………………………………......…38
Figure 6; Length of company existence……………………………………...39
Figure 7; Rating of the factors for effective adoption of TQM techniques…..41
Figure 8; Effects of TQM on company’s competitive advantage……………44
Figure 9; Effect of TQM on product quality and price………………………47
11

LIST OF TABLES
Table 1: Showing educational levels of the respondents…………………….37
Table 2: Length of time of work at the company…………………………….38
Table 3: Length of time of company’s existence…………………………….39
Table 4: Factors for effective TQM adoption………………………………..40
Table 5: Showing effect of TQM on organization performance……………..42
Table 6: Showing whether TQM has an effect on organization growth……..43
Table 7: Showing effect of TQM on organization competitive advantage…..43
Table 8: Showing whether TQM leads to high profit in an organization…….46
Table 9: Showing effect of TQM on financial perspective…………………..46
Table 10: Showing whether TQM is relevant to product quality and price….47
Table 11: Showing whether there is a cause relation- effect between
TQM techniques and customer protection………………………..48
Table 12: Showing whether effective adoption of TQM techniques leads
High performance of S.M.Es………………………………………49
Table 13: Showing whether there is relationship between adoption of
TQM techniques and performance of S.M.Es……………………..49
12

LIST OF ABBREVIATIONS AND ACRONYMS
TQM - Total quality management
S.M.Es - Small and medium enterprises
UBOS - Uganda bureau of statistics
NIST - National institute of standard and technology
UNCTAD - United nations conference on trade and development
MNBQA - Malcolm Baldrige National Quality Awards
13

ABSTRACT
Total Quality Management (TQM) has been widely considered as the strategic, tactical
and operational tool in the quality management research field. It is one of the most
applied and well accepted approaches for business excellence. There is a great
enthusiasm among manufacturing and service industries in adopting and implementing
this strategy in order to maintain their sustainable competitive advantage.
The aim of this study is to establish the relationships between adoption of TQM
techniques and company’s performance particularly in the context of small and medium
manufacturing enterprises by measuring the product quality and effectiveness, customer
satisfaction and financial performance as performance indicator. A comprehensive review
of literature on TQM and company performance was carried out to accomplish the
objectives of this study.
Three research questions were proposed and 7 hypotheses were looked at to re-validate
the TQM practices. The adoption of such a theoretical model on TQM and company’s
company would help managers, decision makers, and practitioners of TQM in better
understanding of the TQM practices and to focus on the identified practices while
implementing TQM in their companies. The result finding is expected to be powerful
information for future research directions especially as an indicator for the development
of a suitable TQM framework for the local SMEs in Uganda
14

CHAPTER ONE
1.0 Background of the study.
In such a competitive environment resulting from world globalization and liberalization,
firms survive with much difficulty unless they create the competitive advantage over their
competitor (Adam et al., 2001, Samson & Terzivzki, 1999). Around 12% of businesses
close within their first year, 25% are closed within two years, and around one thirds will
have disappeared by the end of the third year, Alan and Jamieson (2006).
With the increasing competition, business survival pressure and the dynamic, changing
customer-oriented environment, Total quality management (TQM) has been recognized
as one of the important management issues for every organization and it has generated
substantial amount of interest a monger managers and researchers (Achier et al., 1995;
Benson et al., 1991; Powel, 1980).
According to Stevenson (2002), TQM is defined as a quest for quality in an organization
and according to him there are three philosophies in this approach, namely; continuous
improvement, involvement of everyone in the organization, and the customer satisfaction.
Performance on the other hand is the effectiveness to the firm's ability to serve or produce
what the firm requires at particular time and efficiency which means meeting the
objectives at the lowest possible cost with the highest possible benefit (Grassing 2000).
Various authors have argued and empirically stated the positive impact of TQM adoption
on company’s performance in terms of operating and financial results, quality, customer
satisfaction or employee satisfaction. However, most of these studies focus on identifying
the TQM practices that are most effective and crucial from the performance improvement
15

point of view. Some of these studies focus only on a particular type of performance:
quality performance, financial performance, or operating performance. They do not
provide much evidence on how exactly TQM affects performance: are all performance
dimensions improved and what areas of performance are mostly improved by TQM
adoption?
Therefore the objective of this study is to understand and measure the impact of TQM on
different dimensions of company performance. In order to achieve the above objective,
the research is focused on answering the following questions: Is there a significant
company performance improvement after TQM adoption? Are these improvements more
of financial, operating, employee performance or customer satisfaction nature? How long
does it take to get significant positive benefits?
1.2 Statement of the Problem.
The Small and medium scale manufacturing sector is widely regarded as the driving force
in economic growth and job creation in Uganda. It plays a significant role as over 90% of
the active non farming population are employed in this sector, UBOS ;( 2003). However,
the performance of this sector is relatively poor. Despite the fact that the Government of
Uganda has provided non-fiscal incentives to stimulate its growth, the performance of
these small scale industries has remained low. S.M.E s are not growing. The industrial
sector, which is dominated by .S.M.Es, still contributes less than 20 percent to the GDP
and has not been performing impressively, James.M; (1994). From 1997/98 to 2005/2006
the manufacturing sector’s annual growth rate was only 1.3%, Esther. K et al; 2008. The
sector’s efficiency has been decreasing, and its technical efficiency is much lower (that
is, 0.19) than that of manufacturers in Cameroon, Ghana, Kenya, and Zimbabwe
(Gauthier 2001). There is concentration of S.M.Es in low-quality production (Sengendo
et al. 2001, and poor managerial and skills competence (Nalumansi et al. 2002; Nel and
Shapiro 2003). The industrial sector’s annual growth rate was approximately 1.3%. The
capacity utilization of the Ugandan manufacturing sector when compared to that of other
African countries was around the mean (58%) but lower than that of the manufacturing
sectors in Kenya (63%) and Côted’Ivoire (71%), This limits their levels of sales and
profits since most of them compete for the same customers, (Sengendo et al. 2001).
16

This has been attributed to the lack of resources and knowledge to practice total quality
management techniques in their operations hence they continue producing low quality
products that do not meet customer need thus loosing the competitive advantage over
their rivals hence collapse.
1.3 Purpose of the Study
The purpose of the study is to investigate the effect of the adoption of total quality
management practices on the performance of Small scale industries in Kampala district
(Uganda)
1.4 Objectives of the Study
The study has the following objectives:
1. To identify the key factors for the successful adoption of TQM techniques.
2. To examine the effects of TQM techniques adoption on company performance.
3. To establish the relationship between company performance and the adoption of
total quality management practices.
1.5 Research Question
1. What are the key factors for the successful adoption of TQM techniques?
2. What are the effects of TQM adoption on the manufacturing firm’s performance?
3. What is the relationship between the adoption of TQM practices and the company
performance?
1.6 Scope of the study.
1.6.1 Content scope.
The content of the study will be centered on total management techniques in my case
studies. It will include among other things, the key elements of TQM, the effect of TQM
adoption.
It will also analyze the firm’s performance in terms of; product quality, business set goals
against the achieved one, profits, sales, and other related indicators of performance of the
company since their existence.
17

1.6.2 Geographical Scope,
This will be in the area of the study location. This will be Kampala district specifically. It
will also involve all workers at different levels; officials from private sector foundation
will also be approached on this matter.
1.7 Significance of the Study
The study will help managers to establish a strong total quality management
system in their organization.
Academicians and future researchers will base on these findings to conduct future
related studies.
The study is to propose a model which can study TQM effects more effectively
and hence, implement TQM in a more efficient manner.
The study will help manager/owners of SMEs to recognize the need for an
efficient management system in an organization.
1.8 The Conceptual frame work
coll
ection
18
Customer satisfaction
Continuous improvement
Everyone involvement
Adoption of TQM
techniques
Performance of small and medium
enterprises

CHAPTER TWO
2.0 LITERATURE REVIEW.
2.0 Introduction
This chapter looked at what other researchers and academicians have written about the
variables in the study and any other related literature. This chapter is aimed at giving an
insight into the related literature about Total quality management and performance of
S.M.Es. Under TQM, various definitions, principals, its effect on business performance,
the relationship between TQM and business performance, and the hypothesis developed
on TQM will be covered. With business performance, things like definitions, likely
causes for their poor performance and also an overview of the SME in Uganda will be
looked upon.
2.1 Definitions of TQM
Feigenbaum defined total quality as a continuous work process, starting with customer
requirements and ending with customer’s satisfaction. According to him, the definitions
of quality have changed with the passage of time with the changing customer’s needs and
requirements. But the essence has been more or less to develop an approach to problem
solving, conformation to standards for customer satisfaction. With management functions
getting complex, approaches to managing quality in functional areas are becoming
difficult. Organizations, which have successfully used TQM principles, have customer
satisfaction and quality embedded in their corporate strategy.
According to Jack P. Pekar, “any organization is a system of interrelated units. For TQM
to succeed, all of the components within the organization must be collectively involved.
Initially, organizations implemented TQM in hope that improvement in the shop-floor
19
activities would solve all existing productivity and quality problems .Later; they have
realized that TQM is much more than just shop-floor improvement. the definitions of
quality incorporates factors like top management commitment, leadership, team work,
training and development, rewards and recognition, involvement and empowerment of
employees e.t.c. these critical factors are the foundation for transformational orientation
to create a sustainable improvement culture for competitive advantage on continuous
basis.
According to Kamukama Nixon, (2006), TQM is a technique in which management
develops policies and practices to ensure that firm's products and services exceeds
customer expectations. The approach includes increased product functionality, reliability,
durability and serviceability.
According to Professor Vinod Kumar, Total quality management has many definitions.
Gurus of the total quality management discipline like Deming, Juran, Crosby, Ishikawa
and Feigenbaum defined the concept in different ways but still the essence and spirit
remained the same.
According to Deming,E.W. (1986), TQM is a continuous quality improvement process
towards predictable degree of uniformity and dependability. Diming also identified 14
principles of quality management to improve productivity and performance of the
organization,
Juran,J.M.(1993), defined quality as “fitness for use”. According to him every person in
the organization must be involved in the effort to make products or services that are fit
for use. Crosby defines quality as conformance to requirements. His focus has been on
zero defects and doing it right the first time.
Ishikawa also emphasized the importance of total quality control to improve
organizational performance. According to him quality does not only mean the quality of
the product, but also of after sales service, quality of management, the company itself and
the human life.
.
20
According to Selladurai Raj, TQM an interventions or activities must be guided by four
change principles, namely work processes, variability analysis, and continuous
improvement. Product design and production processes must be improved; variance must
be controlled to ensure high quality; data must be systematically collected and analyzed
in a problem solving cycle; and commitment made to continuous learning by employees
about their work.
Chase et al., (2001) defined TQM as managing the entire organization so that it excels on
all dimensions of products and services that are important to the customer.
According to Zairi, Letza, and Oakland (1994) TQM is defined as a positive attempt by
the organizations concerned to improve structural, infrastructural, attitudinal, behavioral,
and methodological ways of delivering to the end customer, with the emphasis on
consistency, improvement in quality, competitive enhancements, all with the aim of
satisfying or delighting the end customer.
TQM is an organizational cultural commitment to satisfying customers through the use of
an integrated system of tools, techniques and training. TQM involves the continuous
improvement of organizational processes resulting in high quality products and services.
Under this approach, all managers should be thinking about how every organizational
process can be conducted to provide products and services that are responsive to tougher
and tougher customer and competitive standards.
TQM believes in,
Zero defects
Get right the first time and every time
100% perfection; there is no room for error.
Working in a system where all departments work together.
It involves bench making, which means comparing your own products and
processes with the very best in the world.
TQM also traces that customers should be the starting point because they need
high quality products that are fit for use.
TQM needs participation for all the management team and employees they all
must devote time to get the possible cause for failure.
21

Total quality management is a management philosophy embracing all activities
through which the needs and expectations of the customer and the community, and
the organization are satisfied in the most efficient and cost effective way by
maximizing the potential of all employees in a continuing drive for improvement.
Barrie G.Dale;(1994).
2.2 Definition of business performance
Performance in the context of business operations is the effectiveness to the firm's ability
to serve or produce what the firm requires at particular time and efficiency which means
meeting the objectives at the lowest possible cost with the highest possible benefit
(Grassing 2000).
According to the efforts of Kaplan (1992) and Keegan et al. (1982) observe that
performance measures used by the organization has to provide a balanced picture of the
organization. The set of measure would reflect the non financial and financial measures
that include income statement, cash flow statements, innovations and customer
satisfaction, internal and external measures that include the employees, suppliers,
creditors, effectiveness and the efficiency measures.
Performance is said to be a measurement tool that needs judgment and interpretations and
must therefore be qualified as good or bad Neily, (2002).
It has also been referred to as the ultimate economic results that are said to be produced
by the organization to be determined by the pattern and the conduct prevailing in the
industry Weily, (1982).
Armstrong (2001), defined performance as the record of outcomes achieved. It’s a record
of a person’s accomplishments.
According to United nations conference on trade and development (UNCTAD)
LDCIII/PRESS (2001 ), Small- and medium-sized enterprises (SMEs) play a crucial role
in stimulating broad-based, equitable and sustainable economic development through
employment and income generation. The main constraints affecting the development of a
globally competitive SME sector in Uganda include the lack of entrepreneurial and
22

management skills; limited access to and high cost of financing; lack of business
development support services; limited access to information on market opportunities; and
poor economic infrastructure.
According to Oscar Ankunda (2010), Small and Medium Enterprises (SMEs) in Uganda
employ more than 2.5m people, constitute up to 90 percent of the private sector and
contribute over 70 percent to total GDP.
It must be noted that the newly launched National Development Plan 2010/11 - 2014/15
strongly emphasizes the fact that the private sector is the engine of growth, employment
creation and socio-economic transformation. This, therefore, means that SMEs must be
brought at the forefront of policy design and implementation if socio-economic
transformation is to be achieved. Issues of value chain development, value addition (agro-
processing for agribusiness SMEs), access to markets, etc, must be strongly focused on so
that the returns from the SME sector more than double.
A Micro Enterprise is defined as an enterprise employing maximum 4 people; annual
sales/revenue turnover of maximum Ugandan Shillings 12 million and total assets of
maximum Ugandan Shillings 12 million.
A Small Enterprise is defined as an enterprise employing maximum 50 people; annual
sales/revenue turnover of maximum Ugandan Shillings 360 million and total assets of
maximum Ugandan Shillings 360 million.
A Medium Enterprise is defined as an enterprise employing more than 50 people; annual
sales/revenue turnover of more than Ugandan Shillings 360 million and total assets of
more than Ugandan Shillings 360 million. Small and Medium Enterprises (SME) are the
backbone of the Ugandan economy. They contribute to job creation and poverty
reduction. SMEs need to be supported to grow from small enterprises to medium and
large businesses.
2.3 Definition of quality.
23
. Today, there is no single universal definition of quality. Some people view quality as
“performance to standards.” Others view it as “meeting the customer’s needs” or
“satisfying the customer.” Let’s look at some of the more common definitions of quality.
Conformance to specifications measures how well the product or service meets
the targets and tolerances determined by its designers. For example, the
dimensions of a machine part may be specified by its design engineers as 3.05
inches. This would mean that the target dimension is 3 inches but the dimensions
can vary between 2.95 and 3.05 inches. Similarly, the wait for hotel room service
may be specified as 20 minutes, but there may be an acceptable delay of an
additional 10 minutes. Also, consider the amount of light delivered by a 60 watt
light bulb. If the bulb delivers 50 watts it does not conform to specifications. As
these examples illustrate, conformance to specification is directly measurable,
though it may not be directly related to the consumer’s idea of quality.
• Fitness for use focuses on how well the product performs its intended function or use.
For example, a Mercedes Benz and a Jeep Cherokee both meet a fitness for use definition
if one considers transportation as the intended function. However, if the definition
becomes more specific and assumes that the intended use is for transportation on
mountain roads and carrying fishing gear, the Jeep Cherokee has a greater fitness for use.
You can also see that fitness for use is a user-based definition in that it is intended to
meet the needs of a specific user group.
• Value for price paid is a definition of quality that consumers often use for product or
service usefulness. This is the only definition that combines economics with consumer
criteria; it assumes that the definition of quality is price sensitive. For example, suppose
that you wish to sign up for a personal finance seminar and discover that the same class is
being taught at two different colleges at significantly different tuition rates. If you take
the less expensive seminar, you will feel that you have received greater value for the
price.
24

• Support services provided are often how the quality of a product or service is judged.
Quality does not apply only to the product or service itself; it also applies to the people,
processes, and organizational environment associated with it. For example, the quality of
a university is judged not only by the quality of staff\ and course offerings, but also by
the efficiency and accuracy of processing paperwork.
2.4 Some of the causes of the poor performance of the SMES.
According to Alan Bryce and Jamieson Wilson, (2006), where these businesses have
goon wrong might be difficult to explain, but using the four major functional areas
(finance, human resources, marketing and operations) might be a start.
a). If your market research is faulty (bad survey, wrong questions, inappropriate sample
of the market), the expected sales do not happen.
b). If your operations are badly organized (too much stock, wrong stock, wrong type of
production), costs escalates and the products is too costly.
c). If your job and person specifications are wrong, recruitment of human resources will
be badly and inefficiently carried out and you will have a poor, unmotivated workforce.
d). Lastly, if your finance is in mess, the amount of money coming in and out will be out
of your control; ultimately, you are out of business
2.5 Critical factors for effective TQM adoption
TQM calls for a cultural transformation that requires employee involvement at all levels
and a spirit of teamwork among customers, suppliers, employees, and managers.
Employee involvement, participation and empowerment form the cornerstones of TQM
(Saylor, 1992). According to Barrie.B.Dale (1994), also talks about the factors or
principals for an effective implementation of TQM in an organization. These six
principles to guarantee success are:
• Management leadership and commitment
• Continuous improvement
• Total customer satisfaction
• Employee involvement
• Training and education
25

• Reward and recognition
2.5.1 Management leadership and commitment
The transformation to world-class quality is not possible without committed visionary,
hands-on leadership. Some principles and practices of TQM may differ among firms and
industries, but there is unanimous agreement as to the importance of leadership by top
management when implementing TQM. Leadership involves defining the need for
change, creating new frameworks to mobilize commitment to those vision- frameworks
for thinking about strategy, structure and people (Aalbregtse, 1991).
This requires management to actively participate in quality transformation. They have to
outline the quality goals, quality policies and quality plans so that employees are
constantly reminded that the customer, not the product, is the top priority (Besterfield,
1995). Quality goals give all employees clear indication of what is going to be achieved
concerning quality. Quality policies when described in detail will provide guideline on
how employees are to achieve that goal. Management commitment; requires developing
management systems that assure and ensure that quality is built into each and every
process in organization. Thus, meaningful plans, such as performing an annual quality
audit help top management acquire the necessary insight into problems the company
faces in realizing the quality plan. In short, management commitment and leadership
represent a paradigm shift from the traditional management role and responsibilities
towards a new role, supporting and enhancing the total quality culture and environment.
2.5.2 Continuous Improvement
It is only when management supports, in both word and deed, the goal of continuous
improvement that it will begin to see increases in both quality and productivity.
Continuous improvement of all systems and processes in an organization is essential for
TQM success. A continuous improvement system gears the organization toward
attainment of the vision (Richardson, 1997). The improvement system must not only be
continuously applied, but also consistently, throughout the organization. This requires a
26

disciplined continuous improvement system based on trust, with everyone in the
organization striving to improve the system (Crosby, 1979). Saylor (1992) suggested a
continuous system cycle that involves 5 stages.
The cycle starts by defining the vision or mission of the organization.
Top leadership determines the vision, with input from everyone. Then everyone in the
organization ascertains his specific mission to accomplish the overall vision. In doing so,
the focus and priorities of the vision are determined, established, understood and
supported by all.
The next phase after defining their vision includes listing all improvement
opportunities. It is important to obtain an understanding of the process of
determining improvement opportunity at this stage. Customers, both internal and
external, are identified and their needs and expectations understood. Suppliers
also are matched with requirements. Any potential problems are identified during
this process.
For the third stage of selecting improvement opportunity, specific improvement
opportunities are selected based on the critical processes that have the greatest
impact on customer satisfaction. These problems are solved using a disciplined
methodology such as statistical process control, quality function deployment and
process analysis and should be used consistently to complete a mission, improve
a process and solve problems throughout the organization.
Finally, similar to Shewhart PDCA cycle, the results for the impact of
improvements are evaluated against the overall mission. In this case, a sixth stage
can be added as a reminder: Do it again and again and again. The cycle is never
ending in a continuous improvement system.
2.5.3 Total Customer Satisfaction
If TQM is aimed at anything; it is aimed at winning and keeping customers keeping them
delighted. Increasingly, manufacturing and service organizations are using customer
satisfaction as the measure of quality. This fact is reflected in the Malcolm Baldridge
National Quality Award, wherein customer satisfaction accounts for 300 out of the
1000 total points.
27

An organization must give its customers a quality product or service that meets their
needs, at reasonable price, on-time delivery, and outstanding service.
Listening to the ‘customers’ and responding quickly to their changing needs, expectations
and perceptions is one of the TQM basic approaches. By keeping close to their customer,
companies can establish customer needs; gather information on customer trend and
benchmarking them with their competitors. This can be a winning strategy towards
winning new customers and retaining customer loyalty. Total customer satisfaction also
means giving an unwavering focus on the internal customer. Before external customers
can be satisfied, obstacles faced by internal customers have to be eliminated in the first
place. This is because employees are the asset and part of the firm’s process. It is
important to create a good working condition necessary for them to produce and deliver
quality by providing them proper training, tools, information and empowerment required
for self- management to work efficiently. Only then, the entire workforce can truly be
utilized through active involvement from committed and satisfied employees.
2.5.4 Employee Involvement
At the heart of TQM is the concept of intrinsic motivation. Empowerment- involvement
in decision making is commonly viewed as essential for assuring sustained results.
Deming’s fourteen points for management are worth remembering. The basis of his
philosophy is contained in the following principle:
1. Institute training on the job.
2). Breakdown barriers between departments to build teamwork.
3). Drive out fear in the workplace.
4). Eliminate quotas on the shop floor.
5). Create conditions that allow employees to have pride in their workmanship and
abolish annual reviews and merit ratings
6). Institute a program of education and self-improvement (Saunders, 1995).
Employee involvement is a long-term commitment for a new way of doing business and
needs a fundamental change in culture (George, 1994). Binney (1992) described
unlocking people potential as one of the total quality principles whereby it creates an
28

environment in which people can readily learn, where teamwork can flourish and
individuals grow in self-confidence and self-esteem.
In the past, the focus in achieving such improvements was frequently the “system” –
traditional techniques and methods of quality control. Such a focus may overlook the fact
that operation of the system depends on people, and no system will work with
disinterested or poorly trained employees. It must be coordinating the system and people
at the same time.
Employee involvement is a process for empowering members of an organization to make
decisions and to solve problems appropriate to their levels in the organization
(Richardson, 1997). Empowerment is equally effective in service industries, where most
frequently customer perception of quality stands or falls based on the action of the
employee in a – one-on one relationship with the customer. This can be achieved by
making the employee part of the organization, which is essential to the success of the
organization. Employees who believe they are important will be motivated to ensure that
their efforts are consistent and dependable upon the contributions made.
2.5.5 Training and Education
World-class companies realize that all firms have access to the same equipment,
technology, financing, and people. The “half-life” of any academic degree is extremely
short; therefore, the real difference among companies is the degree to which employees
are developed. Training and education provide the necessary skills and knowledge- the
ability to make it happen (Saylor, 1992). This process is an investment that must be
made.
According to Dahlagaard et.al (1994) Japan, Estonia and India are reported to allocate
between 65 and 80 hours per year for each educational and training activities per
employee. They believe that satisfaction of the workforce and hence motivation and
ability to act as a constructive part in the process of continuous improvement depend on
education and training.
In the TQM environment, everyone is required to gain additional capabilities to improve
the process and perform work. Hence, a comprehensive training program is necessary and
29

must be institutionalized within the entire organization. Training in TQM philosophy,
guiding principles and tools and techniques is never ending.
Personal and team interaction skills must be continually refined. This training should be
given only as it is needed to the people who will use it immediately. It should start with
specific training for management. Once management has the skills to lead the TQM
process, the rest of the organization should be trained to ensure a systematic, integrated,
consistent organization- wide effort (Richardson, 1997).
Specific job skills training must be provided and constantly updated to reflect the
improved processes. All too often management exhorts employees to get things right first
time, to operate effectively in quality improvement teams and to participate in the never
ending search for excellence. Yet, at the same time, they often fail to provide the training,
tools, information and empowerment required for self- management to work effectively.
Hence, all training must be geared to specific, clearly define objectives; it must be
performed as close as possible to the time it is required and must be reinforced to ensure
the results needed to achieve victory. It should bear in mind that training and education
are never ending for everyone in the organization. Continuous improvement means
learning and companies seeking to adopt TQM, need to become learning organization
(Binney, 1992).
2.5.6 Rewards and Recognition
For worker to do quality work, they must be managed in a way that convinces them that
the work they are asked to do satisfy their needs. The more it does, the harder they will
work. Rewards are generally considered to be something given for quality work such as
money or other tangible things of financial value. Recognition is an act of
acknowledgement that is directed at an individual’s self-esteem and social needs
(Richardson, 1997). Crosby’s 12th step and Juran’s 7th step indicate that reward and
recognition should be instituted to support TQM movement. They feel that recognition,
praise, coaching and show of concern are all vital forms of reward that must never be
neglected. Reward and recognition should be appropriate to the situation by being rank
ordered- the higher the achievement, the higher the reward. It could be such things as a
bonus, salary increase, and change in the title, promotion, theater tickets, or perhaps a pat
30

on the back (Besterfield, 1995). In a TQM environment, there must be a change in the
usual recognition system. One must give recognition for efforts, not just for goal
attainment. This recognition of effort provides a powerful incentive for everyone to
become involved in quality improvement. It helps illustrate the commitment from
management. It is also essential that employee involvement be used in planning and
executing any recognition or reward system. Programs that are developed with employee
involvement will most likely to succeed.
2.6 Level of TQM implementation.
According to the International Journal of Business and Social Science
Vol. 2 No. 9 [Special Issue - May 2011], different firms implement TQM in different
ways but in general TQM implementation can be classified in the following five
categories.
2.6.1 No customer concern / No inspection: (Zero Level)
These companies do not focus customers and incorporate management systems to
measure or control the quality characteristics of their product and services. According to
Kamran Moosa (1999) in countries like Pakistan in many firms usually there is no
accountability for poor performance and in some firms it is up to the level of torturing the
customers.
2.6.2 Quality Control: (Level 1)
These organizations consider laboratory and testing of products as a main activity of
quality management and invest in and develop their products/services management
systems, these firms usually have quality control labs and departments testing and
measurements make them react to non conformities. Researchers like Prakash J. Singh,
Damien Power and Sum Chee Chuong (2010), Shewhart (2000), Dodge (1999) have
identified that most companies use statistical process controls for such measurements.
While according to Kamran Moosa (2000) most manufacturing firm in Pakistan use
quality controls for implementing TQM in their organizations.
31
2.6.3 Quality Assurance: (Level 2)
These companies understand that a product is a result of many processes and unless these
are controlled effectively quality can not be delivered therefore they try to control all
these processes that effect product/service quality. According to Hale Kaynak (2004) and
Alessandro Burn (2010) most companies assure quality by using quality programs like
ISO 9000, ISO 9000-2000, and other quality tools like Deming prize, affinity diagrams,
Pareto charts.
2.6.4 Continuous Quality Improvements: (Level 3)
The companies which come under this category do not just confer to the quality
assurance but they realize that process improvements are directly proportional to
competence, commitment and team work of employees; such organizations mobilize
company wide campaigns for continuously developing skills of quality management at all
levels and give assignments on weekly and monthly basis in cross functional teams.
Researchers like M. Madi Bin Abdullah, Jegak Uli and Juan Jose Tari (2008) and Esin
Sadikoglu , Cemal Zehir (2010) identified that companies in the manufacturing industry
in Australia use different approaches for continuous quality improvements like just in
time (JIT), zero defect mentality and quality circles. While according to Jamshed H.
Khan (2000) there are very few firms operating in Pakistan which fall under the category
of continuous quality improvements.
2.6.5 Quality Award Models: (Level 4)
These companies are global champions and dominate markets with their
products/services. They set bench marks to others and for these companies quality means
complete satisfaction of their customers and publics. Henrick Eriksson & Jonas Hansson
(2003), K.A.S.P Kaluarachchi (2010) studied the effect of quality award
models in service firms , and identified that these firms use approaches like process
reengineering, and computer software packages to enhance quality performance.
32
2.7. Dimensions of business performance.
Since in this study all four levels of total quality management will be evaluated that is
why the effect of TQM implementation will be measured in terms of business
performance, after a detail literature review the following dimensions of business
performance were considered.
2.7.1 Product Quality and Effectiveness
The quality of a product or service is dependent on the customer expectation in contrast
with other suppliers, so when judging product quality it depends who is the customer.
According to Mehmet Demirbag and Ekrem Tatoglu (2006), Mahour Mellat Parast
(2010) when companies’ judge product quality effectiveness internally they measure it in
terms of defects rate, rework cost, scrape cost. While Daniel I. Prajogo (2008) have
measured product quality effectiveness in terms of the level of reliability it offers and the
fitness of use and conformance with expectations.
2.7.2 Customer Satisfaction.
The focus on customer has become a part of quality movement. According to Jarrod M
Haar and Chester S. Spell (2008) successful implementation of TQM include customer
retention and increase in market share. While according to Carlos Bou Liusar, Ana B.
Escrig Tena (2009) customer focus leads to customer loyalty which can be achieved by
providing customers with reliable, durable product/service. So customer focus in firms
incorporates customer satisfaction, confidence, loyalty and reduction in complaints.
2.7.3 Financial Performance
The previous researches have shown strong positive relationship between quality
improvements and financial performance of a firm Wisner and Eakins (1999).
33

According to Mehmet. D;(2005) and Christos. B, et al; (2009) firms that focus on
improving the quality of their product and processes leads to improve revenues and
reduction of costs. So the financial performance of a firm as a result of quality initiatives
can be measured by the increase in the level of sales, revenue produced, and level of cost
performance, the return on investment and assets and by the increase in market share.
2.8 Effects of TQM on Business Performance
2.8.1 TQM and organization performance
According to Ishikawa, the importance of total quality control is to improve
organizational performance. According to him quality does not only mean the quality of
product, but also of after sales service, quality or management, the company itself and the
human life.
2.8.2 TQM and organization growth`
According to George A. Boyne and Richard M. Walker, totally quality management
(TQM) is a strategy aimed at achieving excellence in organizations. It is the cornerstone
of improving productivity, profitability and customer satisfaction in organizations. While
a quality performance is imperative to attain the competitive to advantage, innovation is
the catalyst for further growth.
2.8.3 TQM and organization competitive advantage
According to Flynn et al. 1995; Samson and Terziovski, 1999, the benefit of an effective
TQM can be studied using three different perspectives. Firstly, from the operating angle,
the reason that TQM has become a hot topic in both industry and academia is that can be
applied to improve or enhance global competitive. Firms with effective TQM
implementation can accomplish the internal benefits such as improving quality,
enhancing productivity, or realizing better operating income (Corbett et al., 2005;
Hendricks and Singhal, 1997).
34

2.8.4 TQM and organization profits
Eng and Yuof (2003) argued that quality holds the key competitiveness in today’s
market. In addition, TQM has widely been considered as an effective management tool to
provide business with the stability, growth, and prosperity (Isaac et al. 2004). According
to Freisleben, (2005), the effect of TQM can not only be reflected on decreasing costs but
also on maximizing business profits. In terms of quality improvement, what really
accounts for a firm is not cost minimization but the effect of superior quality has on
maximizing profits.
2.8.5 TQM and organization financial perspectives
From the financial performance perspective, Corebett et al., 2005 says, careful design and
implementation of constituent and documented quality management systems can
contribute significantly to superior financial performance. Furthermore with an effective
TQM implantation can significantly out perform on the stock price performance
(Hendricks and Singhal, 2001).
2.8.6 TQM and product quality and price
According to A. Cole Mambim mipm MITD, TQM is a term intended to convey a
vertical approach to quality in an organization. That is to say, quality is a matter of
concern for everybody from the board of directors down to the humble employee. To him
the greatest influence from the total quality approach to management has been exercised
by two Americans and one Japanese. The first two, Edward Daming and Joseph Juran,
applied and developed earlier techniques such as statistical process control to the post
war industries in Japan. They showed that, by paying attention to continuous
improvement of production process and gaining employee commitment, tom the idea of
quality at every stage of production, it was possible to achieve continuous high standards
of finished goods at a price the customer is more than willing to pay in order to secure
reliability and acceptable performance.
According to him, quality management begins with the consideration of the customer, be
they internal, employees, business or members of the public. Their needs and wants have
35
to be translated into specifications of one kind or another and these specifications need to
be developed and tested.
2.8.7 TQM and customer protection
According to Garvin (1989), quality is not only a strategic weapon for competing in the
current marketplace, but it also means consumers, not just protecting them from
annoyances. Therefore, a company’s specific advantage is to identify and compete on one
or more of the dimensions of quality.
2.9 Relationship between TQM adoption and business performance
According to Hoogervost et al. (2005), argued that TQM approach requires focus on
employee behavior, attention to organizational culture, management practices, and
organizational structures and systems.
Yang (2006) empirically confirmed that human resource management practices have a
significantly positive effect on the implementation of TQM, and therefore on the
improvement of employee and customer satisfaction and quality performance achieve
through TQM.
Fuentes et al (2006) examined the relationship between strategy and TQM adoption as
well as the impact of both on organizational performance. Their results suggested that
differences in TQM adoption depend on the selected strategy and that companies with the
greater degrees of co-alignment between their strategies and TQM achieve the highest
levels of performance improvement.
According to the International Journal of Quality & Reliability Management, 2009; TQM
adoption is believed to lead to company performance improvement. Numerous studies
indicate positive relation between TQM adoption and performance. Examples of benefits
36

achieved from TQM by companies around the world include: decreased inventory 23
percent in two years, order changes halved, delivery time reduced from 20 to 4.5 days,
quality terms saved 5.6 million over four years, customer claims frequency reduced by
over 40% , customer service response time reduced by 44%, lost time from injuries
reduced 46%, cost quality reduced from 12% to 9%, operating profits increased 7.4
times, 98% first pass yield, on-time delivery increased from 75% to 99% , customer
complaints reduced to 78 % $12 million saved in one year in suggestion system, 91% of
employees said proud to work for the company, positive responses on employees attitude
survey increased from 76 % to 83 %.
According to GAO, (1991) of 20 companies scoring high on wither the 1988 or the 1089
MNBQA, there is a cause-and-effect relationship between the total quality management
practices embodied in the Baldrige criteria and corporate performance, measured by
employee relations, productivity, customer satisfaction, or profitability. The following
four positive results have been shown.
1. Better Employee Relations. Employees experience more job satisfaction, there
was a higher rate of attendance, and there was less turnover, absenteeism and accidents.
The number of employee suggestions relating to quality rose 16.7 percent.
2. Improved operating procedures. Companies increased the reliability (improved by
an annual average of 11.3 percent) and on-time delivery of their products or services and
reduced errors (by 10.3 percent), product lead-time, and cost of quality.
3. Greater customer satisfaction. There were fewer customer complaints (declined
by 11.6 percent), and a greater number of customers stayed with the company.
4. Increased financial performance. Each also improved its market share (An annual
improvement of 13.7 percent) and increased profitability (yearly gains averaged 8.6
percent in sales per employee; 1.3 percent in return on assets; and 0.4 percent in return on
sales).
Huarg and Chen (2002) report evidence that TQM philosophy and TQM tools have a
positive relationship with business performance of small and medium companies in
37

Taiwan, that is to say, the integration of TQM philosophy and tools positively influenced
both cost reduction and business performance.
Hendricks and Singha,(1997), conducted a longitudinal analysis comparing the
performance of companies, before and after the adoption of TQM and concluded that
firms that have effectively implemented TQM outperforms the control sample of
companies without TQM on profitability, revenues, costs, capital expenditure, total
assets and number of employees.
Hasan and Kerr (2003) studied the relationship between TQM practices and organization
performance in service organizations and discovered that TQM practices like top-
management commitment; employee involvement; training; supplier quality; quality
costs; service design; quality techniques, benchmarking; and customer satisfaction leads
to higher productivity and quality performance.
Prajogo and Brown (2004) conducted an empirical study within Australian organizations
to investigate the relationship between TQM practices and quality performance, and the
results indicated a strong and positive linkage. A study on ISO9000 certified
organizations of Taiwan performed by Jeng (1998) examined linkage between six QM
practices and quality performance.
Talib et al;.( 2010) found customer focus as the most powerful discriminated practice of
quality performance while remaining five practices showed low discriminating powers.
Brah and Tee (2002) examined the relationship between TQM constructs and
organization performance by measuring quality performance of Singapore companies.
They found that implementation of TQM leads to quality performance and have positive
correlation.
Another study based on the comparative analysis of TQM practices and quality
performance between Australian manufacturing and service firms, Prajogo (2005)
reported that there exist no significant differences in the level of most of the TQM
practices and quality performance between two sectors. A study utilizing structural
38

equation modeling (SEM) approach by Sanchez-Rodriguez et al., (2006) provided the
insights into the current information technology (IT) and TQM theory and practice on
operational and quality performance. They found TQM initiatives generate significant
positive gains in operational and quality performance. In line to this, Prajogo and Sohal
(2004) also employed SEM approach to examine the multidimensionality of TQM in
association with organization performance. Using empirical data collected form 194
Australian firms the finding support the proposition in pairing the mechanistic elements
of TQM with quality performance and the organic elements with innovation performance.
A recent empirical study conducted by Arumugam et al. (2008) explored the relationship
between TQM practices and quality performance on ISO9001:2000 certified
manufacturing organizations in Malaysia. Analyzing empirical data drawn from 122
Malaysian organizations through correlation and multiple regression analyses, the finding
revealed that TQM practices were found to be partially correlated with quality
performance. They further found that customer focus and continuous improvement were
perceived as dominant TQM practices in quality performance.
2.10 Hypothesis developed.
According to Ahire et al.,(1995); Flynm et al.,(1994); Kaynak,(2003); Samson and
Terziovski,(1999); Sousa & Voss,(2002); there are seven factors to be the key driving
force to an effective implementation of TQM. Namely; customer focus, management
leadership, human resource, quality data & reporting, suppliers' management, design
management and process management.
2.10.1 Customer focus
For business enterprises, the significant driving force to establish the quality goals
basically originating from customer needs. Customer needs identify the operational goals
for firms to meet. And this type of quality goals is also referred as market-driven [juran,
1992]. Oakland [2005] mentioned that quality started with the understanding of customer
needs and ended when those needs were satisfied. In order to meet the requirement of
39

customers, top management should clarify the expectations of its customers. Further,
organizational strategy should also be developed based on customers' needs. Samson &
Terziovski [1999] pointed out that customer focus is the underpinning principles for firms
to implement TQM programs. Since senior management may have the influence and
authority to dominate the entire TQM implementation, dedicated commitment from top
management about implementing TQM is certainly a necessity. Therefore customer focus
is positively related to management leadership
.
2.10.2 Management leadership
Management leadership is considered to be another major driver of TQM and it has a
significant influence on determining whether or not a TQM program can be implemented
effectively [Soltani, 2005]. Management leadership in fact, refers to how management
level guides and supervises personnel of a firm in an appropriate manner. Management
level provides the necessary resources for training employee to meet the new
requirements and/or changes that are resulted from TQM implementation, and
consequently, creates a work environment which is conductive to employee involvement
in the process of changes [Kaynak, 2003; Wilson & Collier, 2000] .In addition, effective
management leadership is critical to influence the decision of selecting the qualified
supplier and certifying suppliers for quality materials (Flynn et al.,1995; Trents &
Monczka, ,1999).Management leadership is also responsible for monitoring product
design and considering market demands and consumer needs (Deming,1986; Fynn et a.,l
1995.) In other words, the focus of management is essential for firms to produce goods
that are manufacturability and meet the needs of customers (Fynn et al., 1995; Juran,
1981). In conclusion, management leadership plays a significant role on conducting
organizational operations and also highly influences the decision- making and resource
allocation processes for supplier management and design management, respectively.
Therefore the authors propose that management level has positive effects on human
resource, suppliers’ management, and design management.
2.10.3 Human resource management
40

In terms of quality management, employees must be able to measure and utilize quality
data efficiently and effectively (Ahire & Dreyfus, 2000; Ho et al., 1999). The study of Ho
et al.,(2001) indicated that human resource, which include employee training and
employee relation, was positively related to quality improvement, which was mediated
through utilizing quality data and reporting. Thus, whether or not a TQM program will be
successfully implemented mainly depends on the collaboration and coordination a among
a firm’s workforce. An effective implementation of TQM can derived from employees’
understanding of the philosophy and principles of TQM implementation. Furthermore, if
employees have high consciousness of TQM, the data and reporting of quality control
prepared by working staffs will be easy to uncover the reality and thus, can be used to
correct quality flaws or mistakes immediately and effectively. In this way, the authors
propose that better human management will result in more positive effect on producing
quality data and reporting.
2.10.4 Quality data and reporting
Quality data and reporting utilize quality reports and control charts to identify explicit
and potential quality problems and provide timely information for correcting and
improving problems explored (Ho et al.,1999).In other words, a good data and reporting
system can timely And correctly reflect the actual circumstances/situation to
management level. It can also provide management level adequate information to make
timely decision. With regard to quality data reporting, it can help management or
employee to identify and solve problems stemming from input materials that are supplied
by cooperative suppliers (Adebanjo & Kehoe, 1999).In addition, several studies indicated
that the goals for firms to implement TQM were mainly focused on building quality into
the products rather than merely inspecting quality into the finished products or removing
defective products (Fynn et al., 1995; Handfield et al., 1999; Tan, 2001). Since effective
design management requires various resources to support, such as considering the
requirement of customer or coordination of procurement function, design function,
production function, and supply function merely inspecting quality into the finished,
design management can be effectively only implemented if quality data and reporting are
collected and shared throughout the organization in a timely manner (Ahire & Dreyfus,
41

2000; Easton & Jarrell,1998; Flynn et al.,1995; Handfield et al.,1999; Ho et al.,1999).
Additionally, quality data and reporting can provide employee timely information to deal
with changes or problems occurred and further examine the results with the
improvements made (Flynn et al., 1995; Handfield et al., 1999; Ho et al.,1999).Thus, an
effective quality data and reporting system will have positive impacts on enforcing
suppliers’ management, design management, and process management aspects
(Kaynak,2003).Therefore, the authors propose that quality data and reporting is positively
related to suppliers management, design management, and process management.
2.10.5 Suppliers’ management
With regarding to suppliers’ management, an effective suppliers’ management will
enforce the cooperation between suppliers and firms by allowing suppliers’ involvement
and/or participation not only in the process but also in the production process, and help
the procurements of materials or parts meet firm’s requirement and be efficiently utilized
(Flynn et al., 1995; Shin et al., 2000; Tan, 2001).The research findings of Kaynak
(2003)showed that suppliers’ management, this emerged as an important component of
TQM implementation, had directly positive effects on both design management and
process management. In addition, the quality of materials provided by suppliers is
important and the starting point for firms to produce quality products. Eventually, a good
quality of raw materials will reduce the occurrences rework, scrap, and/or defective
outputs. Ultimately, it can result in a good operational performance. From the discussion
above, suppliers’ management can be used to streamline the suppliers’ base to facilitate
the following tasks such as managing suppliers’ relationship, developing strategic
alliances with suppliers, cooperating with suppliers to ensure meeting the customer
expectations, involving suppliers early in the product development process, and
enhancing the process management (Flynn et al.,1995; Kannan & Tah, 2005).Therefore,
the authors propose that suppliers’ management is positively related to design
management, process management, and operating performance.
2.10.6 Design management
42

Effective design management can increase the efficiency of process management and
improve operating efficiency. The study of Ahire & Dreyfus (2000) showed that design
management has positive impacts on process management and internal quality, and
external quality. The empirical result of Kaynak (2003) showed that products/ services
management and quality performance, which in turn influenced operating performance.
Thus, the authors hypothesize that design management may have positive impact on
process management.
2.10.7 Process management
Inferior quality manufacturing process will result in higher scrap rate and rework rate
which will lead to more resource consumed to produce qualified products (Ahire
&Dreyfus, 2000). The goal of process management is to reduce process variation by
building quality into the production process (Flynn et al., 1995; Handfield et al.,
1999).The effects of reducing process variation will increase the quality of output as well
as decreasing the occurrences of unnecessary costs such as rework costs and waste costs
by finding and correcting quality problems immediately (Ahire &Dreyfus, 2000;
Anderson et al., 1994; Forza & Flippii et al., 1998; Hendricks & Singhal, 1997). It is
further noted that quality management can improve operating efficiency by reducing
defect rate, scrap rate, and the occurrence of rework .The improvement of operating
efficiency will improve customers’ satisfaction and eventually the company’s financial
performance. In addition, the improvement of customers’ satisfaction and loyalty may
sustain or enlarge market share, which can be eventually transformed into better firm’s
financial performance (Ahire & Dreyfus, 2000; Choi & Eboch, 1998). Thus, the authors
propose that operating performance resulting from TQM implementation will increase
customers’ satisfaction and improve financial performance, respectively. In the
meantime, the improvement of customers’ satisfaction will also have positive effect on
improving financial performance.
Conclusion
43

According to Noori (1990), who stresses in his book that competitiveness cannot be
achieved but through quality, the needs for quality are four fold: cost, competitive
advantage, reputation and staying alive.
Numerous empirical studies confirm that firms that have adopted a quality-oriented
strategy have achieved improved productivity, greater customer satisfaction, increased
employee morale, improved management-labor relations, and higher overall
performance. For example, the US National Institute of Standards and Technology
(NIST) tracked the performance of publicly traded companies which won the MBNQA
during 1988 through 1996, and reported that MBNQA winners significantly
outperformed the Standard & Poor’s 500 Index (Goal/QPC, 1998). Similarly,
Saizanbirtoria; (2005) investigated how the implementation of quality systems based on
the ISO 9000 international standards and the Excellence Model of the European
Foundation for Quality Management of both TQM models had a positive influence on
company results, mainly through the improvement of operations, efficiency and the costs
of the company’s internal activities.
44

CHAPTER THREE
3.0 Research methodology
3.0 Introduction
This chapter comprises of the methodology that was used in the field of study. It displays
the research design, survey population, data collection tools and methods that were used,
data presentation and limitation of the study.
3.1 Research design
The research design was cross sectional and analytical to examine the relationship
between the adoption of TQM and business performance covering a period of three
financial years for each sample. These designs guided the researcher throughout data
collection up to the final stage of data analysis.
3.2 Survey population
The survey population was comprised of the staffs, few selected medium enterprises like
officials at Muzinge food Ltd, and Afro plast(U)ltd. Workers at all levels were considered
and final consumers too were also approached. It was from this study population that a
representative sample to participate in the study was selected
3.3 Sampling method
45

Since information was sought from various companies, stratified sampling method was
used, as it covered the major priority areas of customer base, profitability, financial
strength, employee performance and satisfaction.
3.4 Sample size
The target was 2 companies and the breakdown of each company was top management 1,
operational managers 2, human resource 2, supervisors 3, workers 4, and 10 final
customers.
3.5 Sources of data
Data was collected from both primary and secondary sources. Primary data was collected
from the responses from the questionnaires administered and personal interviews with
company administrators. The secondary data was got from the company reports both
quarterly and annual reports, Private sector foundation annual report, business news
report and other reports.
3.6 Data collection tools
Questionnaires, interviews, and direct observation were dimmed appropriate instrument
for data collection. The researcher used all means available to link up with the survey
population. The questionnaires were circulated to the various respondents and
appointments were appropriately made to meet other respondents for interviews.
Interviews helped the researcher to capture information from especially company
administrators and workers. The researcher designed a list of precise and brief questions
as a guide for direct interviews, requesting for short answers.
Direct observations was a necessity for the researcher to see physically what is on the
ground as far as company performance in all dimensions is concerned.
Document review:
To obtain related secondary data for the subject under study, the researcher managed to
access all the secondary documents from the company accountants and from other
sources to review and analyze to supplement the primary data.
46
3.7 Procedure of data collection
The researcher visited the two company directors and workers, with an introduction letter
seeking to carry out research in their respective companies.
Permission was granted and the researcher introduced himself to the division managers,
lower level workers and residents/customers from who information was obtained.
Questionnaires were drafted and presented to respondents and to those who could read
and write the research. The researcher read and translates the questions to any common
language used in the area. Their responses were filled in the questionnaires by the
researcher.
On the other hand, interviews were arranged with the company directors, division
managers, lower level workers and residents/customers.
3.8 Data presentation and analysis.
After collecting data from different sources, using different tools/instruments, the data
was carefully studied, sorted, edited, organized and corrected where necessary. The data
was then tabulated to calculate the percentages, and correlation coefficient statistical
method used to analyze the data. The researcher used the statistical package (SPSS) to
analyze the data.
After analyzing the data, it was presented in the form of tables and graphs.
3.9 Problems/ limitations of the study
The researchers experienced the following limitations during the study.
a). Inadequate funds
b). Un cooperative respondents
c). Data analysis
d).Time limitation
47

CHAPTER FOUR
PRESENTATION, ANALYSIS AND INTERPRETATION OF THE FINDING
4.0 INTRODUCTION
This chapter deals with the presentation and discussion of the findings. The variables
constituting total quality management techniques that have been analyzed include
adoption, key elements, and effects. On the other hand, business performance was looked
at in terms of its dimensions that is, product quality and effectiveness, customer
satisfaction and financial performance.
Data was analyzed in an attempt to establish the relationship between total quality
management techniques adoption and business performance. The presentation is in charts
and tables showing frequencies.
4.1 FINDINGS ON DEMOGRAPHIC CHARACTERISTICS OF RESPONDENTS
4.1.1 RESPONSE RATE
The total number of questionnaires administered was 72 with an expected return of 66
questionnaires after considering for non response of 9.68%. However, after the exercise,
62 questionnaires were collected reflecting a response rate of 84% and non response of
16% as shown in figure 1 below
Figure 1 Response rate
48

Source: Primary date
4.1.2 AGE OF THE RESPONDENTS
According to the questionnaires, the age of the respondents are indicated in figure 2
Figure 2: Age of respondents.
Figure 4.1.2 Age of the Respondents
0
5
10
15
20
25
30
Below 18 18-25 26-32 33-40 41-48 49-56 Above 57
Age
Perc
enta
ge
0
Source: primary data
As shown in figure 2 above, 1.9% of the respondents were below 18 years,11.5% were
between 18 and 25 years,19.2%were between 26 and 32years, 26.9% were between
49
84% 16%
33and 40 years, 21.2% were between 41 and 48years, 7.7% were between 49 and 56
years and 11.5% were 57 years and above.
This could imply that most residents below the age of 18 are not well conversant with
total quality management techniques and performance of small and medium enterprises
since most of they are not part of the working group or they have little knowledge about
the subject compared to persons between 18 years and 48years
4.1.3 GENDER OF RESPONDENTS
As shown in figure 4.1.2 below, findings indicated that majority of the respondents were
male representing 73.1% compared to 26.9% who were females
This implies that probably more males are employed than their counterparts
Figure 3. Gender of the Respondents
50

Source: Primary data
4.1.4 EDUCATION LEVELS OF RESPONDENTS
Information on the educational level of the respondents is indicated in table 2(a) and
figure 4 below.
Table 1: educational level of the respondents
Educational levels Frequency Percentage
None 10 16.1
Primary 24 38.7
Secondary 16 25.8
University 12 19.4
51

Total 62 100
Source: primary data
Figure 4: showing the educational of the respondents
Educational levels of Respondents
0
5
10
15
20
25
30
35
40
45
University Secondary Primary None
level of education
perc
enta
ge
Series1
Source: Primary data
Of the respondents, 15.4% had never gone to school, 40.4% are of primary levels, who
are the majority, 28.9% are of secondary level and 17.3% are of university level. This
shows that 55.8% of the respondents have not attained education above primary level and
this could have led to the high non-response rate of 16% compared to the expected 10%
as shown in figure 1 above
4.1.6 LENGTH OF TIME RESPONDENTS HAS WORKED AT THE COMPANY
Table 3: Length of time of work of respondents
Years Frequency Percentage
52

0-2 24 38.2
3-5 14 23.1
6-8 12 19.2
9-11 7 11.5
Above 12 years 5 7.7
Total 62 100
Source: primary date
From the above table, 7.7% of the respondents have stayed at the company for more than
12 years, 11.5% for a period between 9 to 11 years, 19.2% for a period between 6 to 8
years, 23.1% for a period between 3 to 5 years and 38.2 % for a period below 2 years.
This implies that 80.5% of the respondents have stayed at the company for a period of
less than 5 years and thus this could have an effect on effective TQM adoption by the
company.
4.1.7 4.1.6 LENGTH OF TIME THE COMPANY HAS BEEN IN EXISTANCE.
Figure 5:Time of work of the Respondents
0
5
10
15
20
25
30
35
40
45
Below 2 3-5 years 6-8year 9-12years Above 13
Years
Perc
enta
ge
Series1
53

Table 3: Length of time of existence by the company.
Years Frequency Percentage
0-2 22 30
3-5 14 25
6-8 12 20
9-11 8 15
Above 12 years 6 10
Total 62 100
Source: primary date
Figure 6: Time of existence by the company.
Time that the company has been in existance
0
5
10
15
20
25
30
35
1 2 3 4 5 6
Years
Perc
enta
ge
Series2Series1
4.2 FINDINGS ON ADOPTION OF TQM TECHNIQUES.
OBJECTIVE A; To identify the key factors for success adoption of TQM.
4.2.1 Findings on factors for success of TQM adoption
54

Information was sought on necessary factors for effective adoption/implementation of
TQM techniques in an organization.
The findings are presented in figure below
Table 4: Factors for effective implementation of TQM techniques
Factors Frequency Percentage
Management leadership and
commitment 15
24.2
Continuous improvement 13 21
Total customer satisfaction 12 19.4
Employee involvement 10 16.1
Training and education 7 11.3
Reward and recognition 5 8.1
Total 62 100
Source: primary data
55
Figure 6: Rating of factor for effective adoption of TQM
0
5
10
15
20
25
30
Mlc TCS EI CI T&E R&R
Factors
Perc
enta
ge
From the figure above, the respondents ranked each factor according to its necessity
towards the effective adoption/ implementation of TQM techniques. Factors like
Management leadership and commitment, continuous improvement, Total customer
satisfaction, Employee involvement, Training and education and Reward and recognition
respectively too the highest rank.
This implies that though each factor had different rank, all factors in conjunction play an
important role towards effective implementation of TQM techniques.
4.3 FINDINGS ON THE EFFECTS OF TQM ON BUSINESS PERFORMANCE
56

Objective B. To examine the effects of adoption of TQM techniques on performance
of small and medium enterprises.
4.3.1 TQM leads to organization performance
Table 5: showing effect of TQM on organization performance.
Response Frequency Percentage
Strongly disagree
Disagree
Not sure
Agree
Strongly agree
Total
7
12
2
27
14
62
11.5
19.2
3.8
44.2
21
100
Source: primary data
From the table above, 21% of the respondents strongly agreed that TQM leads to
organization performance, 44.2%, the majority agreed, 19.2% disagreed, 11.5% strongly
disagreed and 3.8% were not sure on the effective of TQM on organization performance.
4.3.2 TQM and organization growth
Information was sought by the researcher on the effects of TQM on organization growth
and the findings are presented in the table below;
Table 6: showing whether TQM has an effect on organization growth.
Response Frequency Percentage
Strongly disagree
Disagree
Not sure
Agree
Strongly agree
Total
6
8
1
25
22
62
9.6
13
1.9
40.4
34.6
100
Source; primary data
57

Findings from the above table show that 34.6% strongly agreed that TQM has an effect
on organization growth, 40.4%, agreed, 1.9% were not sure,9.6% strongly disagree, while
13 disagreed, claiming that they do not see any relation between TQM and organization
growth.
This implies that the growth rate of companies that adopted TQM techniques is relatively
high.
4.3.3 TQM and organization competitive advantage
Table 7; showing effect of TQM techniques on organization competitive advantage
Response Frequency Percentage
Strongly disagree
Disagree
Not sure
Agree
Strongly agree
5
6
3
27
21
8.5
10
1
45.5
35
Total 62 100
Source; primary data
Figure 8: Showing effect of TQM on company’s competitive advantage
58

Showing effect of TQM on competitive advantage
Strongly agreeAgreeNot sureDisagreeStrongly disagree
Findings according to table 4.3.3 above indicate that, 35% of the respondents strongly
agree that the manner in which services are provided involves a wide range of social
interaction between service providers and service users, 45.5% agreed, only 1% were not
sure, 10% disagreed and 8.5% strongly disagreed.
This implied that all companies that adopted TQM techniques attained a positive
competitive advantage over their competitors.
4.3.4 TQM and organization profits
Information was sought by the researcher on whether TQM techniques lead to highly
profitability levels in the organization. The findings are presented in the figure below:
Table 8; showing whether TQM leads to high profit in an organization
Response Frequency Percentage
59

Strongly disagree
Disagree
Not sure
Agree
Strongly agree
4
5
1
28
24
5.2
8.5
1.8
45
39
Total 62 100
Source; primary data
From the figure above, findings revealed that 39% strongly agreed that profits levels of
the company increase as a result of adoption of TQM techniques, 45% agreed, 1.8% were
not sure, 8.5% disagreed and 5.2% strongly disagreed.
This could conclusively imply, according to the 84% majority who at least agreed, that,
even though some other factors leads to high company profits, however TQM has a role
to play.
4.3.5 TQM and organization financial perspectives.
Table 9; showing the effect of TQM on financial perspective.
Response Frequency Percentage
Strongly disagree
Disagree
Not sure
Agree
Strongly agree
6
8
2
24
22
10.5
12.5
4
38
35
Total 62 100
Source; primary data
From the above, findings revealed that 35% strongly agree that the financial performance
of the company was higher due to adoption of TQM techniques,38% agreed, 4% were not
sure, 12.5% disagreed,10.5% strongly disagreed.
This implies that most companies that adopted TQM techniques have financially
improved.
60

4.3.6 TQM and product quality and price.
Data were sought on whether product quality and price improve as a result of TQM
adoption.
Table 10: showing whether TQM is relevant to product quality and price.
Response Frequency Percentage
Strongly disagree
Disagree
Not sure
Agree
Strongly agree
Total
3
3
0
34
22
62
4.5
5.6
0.0
55.0
35
100
Source: primary date.
Figure 9; Effect of TQM on product quality and price
Showing effect of TQM on product quality and price
0
10
20
30
40
50
60
Strongly agree Agree Not sure Disagree Strongly disagree
Response
perc
enta
ge
Series1
61

From the table above, 35% strongly agreed that product quality and price really improve
has a result TQM adoption techniques, 55% agreed, 5.6% disagreed and 4.5% strongly
disagreed.
This implies that product quality becomes the best and price become affordable to
customer has a result TQM adoption.
4.3.7 TQM and customer protection.
Information was sought on whether customer rights and needs are catered for when a
company adopts TQM techniques .The findings are presented in the table below;
Table 11: showing whether there is a cause-relation effect between TQM techniques
and customer protection.
Response Frequency Percentage
Strongly disagree
Disagree
Not sure
Agree
Strongly agree
5
7
3
27
19
8.5
11.5
5.5
44.
30.5
Total 62 100
Source; primary data
From the table above, findings revealed that 30.5% of the respondents strongly agreed
that there is strong customer protection when a company adopts TQM techniques, 44%
agreed, 5.5% were not sure, 11.5% disagreed whereas 8.5% strongly disagreed.
This implies that product or service users can not be affected after consumption of such a
product.
62

4.4. FINDINGS ON THE RELATIONSHIP BETWEEN ADOPTION OF TQM
TECHNIQUES AND PERFORMANCE OF SMALL AND MEDIUM
ENTERPRISES.
Objective C. To examine the relationship between adoption of TQM techniques and
the performance of small and medium enterprises.
4.4.1, whether TQM adoption affects the performance of small and medium enterprises
Table 12; showing whether effective adoption of TQM techniques leads to high
performance of small and medium enterprises.
Response Frequency Percentage
Strongly disagree
Disagree
Not sure
Agree
Strongly agree
3
5
2
30
22
5.5
8.5
2.5
48.
35.5
Total 62 100
Source: primary source
From the table above, 35.5% agrees that effective adoption of TQM techniques in a
company leads to improved performance in all business circle like financial, product
quality and customer base, 48% agreed, 2.5% not sure,8.5% disagreed and 5.5% strongly
disagreed.
This implies that because TQM begins with the customer needs and ends with the lower
level worker, the company gets to know all the needs of the consumers and the potentials
of the workers hence achieving the best at the end.
63

4.4.2 Whether there is a positive relationship between TQM and performance of
small and medium enterprises.
Table 13 showing whether there is a relationship between adoption of TQM techniques
and performance of small and medium enterprises.
Response Frequency Percentage
Strongly disagree
Disagree
Not sure
Agree
Strongly agree
3
5
2
30
22
5.5
8.5
2.5
48.
35.5
Total 62 100
Source: primary source
The response on the relationship concluded that there is a positive relationship between
TQM adoption and performance of small and medium enterprise since over 83.5% agreed
and only 14.5% disagreed.
In addition, using a statistical package SPSS and Pearson’s correlation coefficient, results
revealed that there is a significant positive relationship between TQM and performance of
small and medium enterprises.
Using correlation analysis, as seen in the table below, there is a positive relationship
between adoption of TQM techniques and performance of small and medium enterprises.
64

`
CHAPTER FIVE
SUMMARY OF MAJOR FINDINGS, CONCLUSIONS AND
RECOMMENDATIONS.
5.0 INTRODUCTION.
The study investigated, analyzed and presented the relationship between adoption of
TQM techniques and performance of small and medium enterprises. The independent
variable of the study was adoption of TQM techniques and the dependent variable was
performance of small and medium enterprises whose indicators are; product quality
effectiveness, customer satisfaction and financial performance.
In this chapter, a summary of major findings are presented, conclusions based on such
findings are made, recommendations given and areas of further studies suggested.
5.1 SUMMARY OF MAJOR FINDINGS
The main purpose of the study was to examine the key factors for effective adoption of
TQM techniques, effects of TQM adoption, and to establish the relationship between
adoption of TQM techniques and performance of small and medium enterprise taking
65

Muzinge foods Ltd and Afroplast (u) ltd as the case in point. The summary of the major
finding have been given based on the objectives of the study;
5.1.1 Summary of major findings on adoption of TQM techniques
According to the study, the adoption of TQM techniques in small and medium
manufacturing enterprises has been increasing for the last 3years due to notable effects it
has on company performance, increasing customer diversification and competitiveness in
the global market irrespective of the size of the company.
According to the Afroplast (u) Ltd and Muzinge Foods Ltd performance reports and year
plans however, despite the increasing performance a monger the small and medium
manufacturing sector, forecasted performance has always not achieved.
5.1.2 Summary of major findings on company performance
According to the study, finding indicate that the performance of Afroplast (U) ltd is
relatively good as products produced at the company are relatively of good quality,
comparably affordable and it is one of the 100 best small and medium manufacturing
enterprises in Uganda.
However some discrepancies that compromise company performance has been
discovered by the study as some products are not constantly available, and do not fully
meet customer requirement.
5.1.3 Summary of major findings on the relationship between adoption of TQM
techniques and performance of small and medium enterprises.
Findings of the study revealed that more 80% of the respondents acknowledged that there
is an effect and thus relationship between adoption of TQM techniques and performance
of small and medium enterprises although a small percentage did not include some who
were not sure of any correlation between the variables.
66
5.2 CONCLUSIONS
Like the summary, of major findings, conclusions are also presented in respect of the
research objectives.
5.2.1 ADOPTION OF TQM TECHNIQUES.
As earlier noted, TQM techniques includes customer focus, management leadership,
human resource management, quality data and reporting, suppliers’ management, design
management, and process management.
Research findings and financial reports revealed that forecasted performance is not the
same the actual performance.
However, as earlier noted because of the size of the company, incapacitating the effective
adoption of TQM techniques, actual performance has always been below the forecasted.
5.2.2 EFFECT ON COMPANY PERFORMANCE
As earlier mentioned, company performance is characterized by; product quality and
effectiveness, customer satisfaction and financial performance.
Therefore, conclusions have been drawn from findings of each of the above trait.
5.2.2.1 Organization performance
The findings revealed that organization performance highly improves (see table 4.3.1).
However, while in interviews, claims were put forward on the extent to which TQM leads
to organization performance, the majority believed that to a large extent adoption of
TQM techniques leads to organization performance.
67

5.2.2.2 Organization growth
The research showed that 75% of the respondents recognized that total quality
management techniques leads to organizational growth. However, the growth is more so
customer base.
5.2.2.2 Competitive advantage.
Looking at competitive advantage, almost 81% of the respondents agreed with the
competitive advantage that a company attains when TQM techniques are adopted. This
means that a company can easily out compete its competitor when it appropriately
implements TQM techniques.
5.2.2.3 Organization profits
Company managers ought to have high sales necessary skills to effectively acquire high
profits, However, the research revealed that TQM does not only increase product quality,
but also leads to high profitability margin of the organization.46.2% of the respondent
agreed that services are provided by qualified staff.
5.2.2.4 Product quality and price
Research findings indicated that because TQM emphasises quality, the final product
quality will be high and also the price will be relatively affordable due to continuous
improvement
5.3 RECOMMENDATIONS
Recommendations have been made on the variables of the study which are adoption of
TQM techniques and performance of S.M.Es.
68

5.3.1 Recommendations on Adoption of TQM technique
If SM.Es in particular Muzinge foods and Afroplast (u) ltd are to play a significant role in
their economic development process, they must put more effort in quality management
techniques than they are currently doing. More effort is needed from the top level down
the bottom line for especially on customer focus, management leadership, human
resource management, quality data and reporting supplier’s management, design
management and process management. All these factors should be enhanced for greater
performance
The company should put in place all the incentives to the employee to effectively
implement the total quality management techniques. Quality and performance yard sticks
should be put in place, employees must be recognized and rewarded for the work done
and also product performance should be followed to see whether the products meets the
intended use.
This can not go without the help of the government via its authority (the Uganda
investment authority and the revenue authority) and also the private sector foundation
because the technique looks to be costly compared to the size of the firm, so the help
from the above bodies is essential.
5.3.2 Recommendation on the performance of S.M.Es
Because performance includes the main yardsticks of product quality and effective,
customer satisfaction and financial performance, the company should ensure the balance
between the three. One should not compromise the other.
There should be terminal evaluation performance reports to compare the forecasted and
actual performance for the season and then mechanism to rectify the discrepancies should
be availed.
Areas for further research
Areas of further research may include;
1. It would be interesting to conduct further research to explain our finding that
TQM adoption leads to high performance in SMEs.
69

2. Another avenue for future research would be to survey on S.M.Es to determine
their motivation for adopting TQM.
3. Another alternative research area could be the main aim of TQM adopting firms.
Is it financial? , for quality reasons, or because it is a new management strategy?
4. Further research could also investigate the benefits of adopting TQM in SMEs
versus the costs associated to it.
5. Further research could also investigate whether TQM adoption is only beneficial
to firms above a certain size. That is, the costs associated with TQM adoption
may outweigh the benefits for firms below a certain size.
70

BIBIOGRAPHY
Adam, E.E., Flores, B.E. & Macias, A. (2001) Quality improvement practices and the
effect on manufacturing firm performance: International Journal of Production Research,
Ahire, S.L., Landeros, R. & Golhar, D. (1995) Total quality management: A literature
review and an agenda for future research, Production and Operations Management.
Ahire, S.L. & Dreyfus, P. (2000). The impact of design management and process
management on quality: an empirical examination, Journal of Operations Management.
Anderson, J.C., Rungtusanatham, M., Schroeder, R.G., Devaraj, S. (1995) A path analytic
model of a theory of quality management underlying the Deming management method:
preliminary empirical findings, Decision Sciences, 26(5)
Benson, P.G., seraph, J.V. & Schroeder, R.G. (1991) The effects of organizational
context on quality management: an empirical investigation, Management Science.
Dale, B., Boaden, R., Wilcox, R. & McQuarter, W. (1998) The use of quality
management techniques and tools: an examination of some key issues, International
Journal of Technology Management
Easton, G.S. & Jarrell, S.L. (1998) The effects of total quality management on corporate
performance: an empirical investigation, Journal of Business,
Small and Medium Enterprises Business Guide; (2008) Uganda Investment Authority.
Kotler,P.Amstrong,G.(2000) Management.2 nd Edition . Prentice Hall, India
Flynn, B.B., Schroeder, R.G. & Sakakibara, S. (1994) A framework for quality
management research and an associated measurement instrument, Journal of Operations
Management
71
Freiesleben, J. (2005) The economic effects of quality improvement, Total Quality
Management,
Handfield, R., Ghosh, S. & Fawcett, S. (1998) Quality-driven change and its effects
on financial performance, Quality Management Journal.
Hendticks, K.B. & Singhal, V.R. (1997) Does implementing an effective TQM program
actually improve operating performance? empirical evidence from firms that have won
quality awards, Management Science.
Hendticks, K.B. & Singhal, V.R. (2001) The long-run stock price performance of firms
with effective TQM programs, Management Science.
Juran, J.M. (1981) Product quality-A prescription for the West, Part 2, Upper
management leadership and employee relations, Management Review.
Juran, J.M. (1992) Juran on quality by design: the new steps for planning quality into
goods and services, The Free Press.
Juran, J.M. (1993) Made in USA: a renaissance in quality, Harvard Business Review.
Kaynak, H. (2003) The relationship between total quality management practices and their
effects on firm performance, Journal of Operations Management.
UBOS report,(2003)
Lemark, D.J., Reed, R. & Satish, P.K. (1997) Commitment to total quality management:
is there a relationship with firm performance? Journal of Quality Management.
Madu, C.N., Kuei, C. & Lin, C. (1995) A comparative analysis of quality practice in
manufacturing firms in the US and Taiwan, Decision Sciences.
Oakland, J. (2005) From quality to excellence in the 21 st century , Total Quality
Management.
72

www.intel.com/intel/quality/quality.htm .
Powell, T.C. (1995) Total quality management as competitive advantage: A review and
empirical study, Strategic Management Journal.
Reed, R., Lemak, D.J. & Montgomery, J.C. (1996) Beyond process: TQM content and
firm performance, Academy of Management Review.
Samson, D. & Terziovski, M. (1999) The relationship between total quality management
practices and operational performance, Journal of Operations Management.
Sun, H. (2000) Total quality management, ISO 9000 certification and performance
improvement, International Journal of Quality & Reliability Management.
Terziovski, M. & Samson, D. (1999) The link between total quality management practice
and organizational performance, International Journal of Quality & Reliability
Management.
Ahire, S.L., Golhar, D.Y. (1996), Quality Management in large versus small firms,
Journal of Small Business Management.
Ahire, S.L., Golhar, D.Y., Waller, M.A., (1996), Development and Validation of TQM
implementation constructs, Decision Sciences.
Badri, M.A., Davis, Donald, Davis Donna, (1995), A study of measuring the critical
factors of quality management, International Journal of Quality and Reliability
Management.
Besterfield, D.H. (1995) Total Quality Management, New Jersey, Prentice Hall Inc.
Blackford, M. (1991), A History of Small Business in America, Twayne Publisher, New
York.
73

Black, S.A., Porter, L.J., (1996), Identification of Critical factors of TQM, Decision
sciences.
BS 7850: Part 1, (1992), Total Quality Management, and Guide to Management
Principle, British Standard Institution.
Ciampa, D (1992), Total Quality: A User guide for Implementation, Addison
Wesley Publishing Company, USA.
Cramer, D.(1998), Fundamental Statistics for Social Research, Routledge, London.
Crosby, Philip (1979), Quality is Free, New York, McGraw Hill.
Dahlgaard, Kristensen, Kanji (1998), (1sted) Fundamentals of Total Quality
Management, Chapman & Hall, London.
Dale, B.G (1994) Managing Quality (2 nd ed ), Prentice Hall, New York.
Dewhurst, F, Martinez- Lorente, A.R, (1998) Total quality management: Origins and
Evolution of the term, The TQM Magazine.
Fowler, F.J. (1998), Design and Evaluation of survey questions, Handbook of
Applied Research Methods, Sage Publications, London.
Garvin, D., (1983), Quality on the line, Harvard Business review.
Ghobadian, A & Gallear, DN (1995), Total Quality Management in SMEs, International
Journal of. Management Science.
Gomes, H (1996) Quality Qoutes, ASQC Quality Press, Milwaukee.
Haksever, C. (1996), Total Quality Management in the small business environment,
Business Horizons.
74
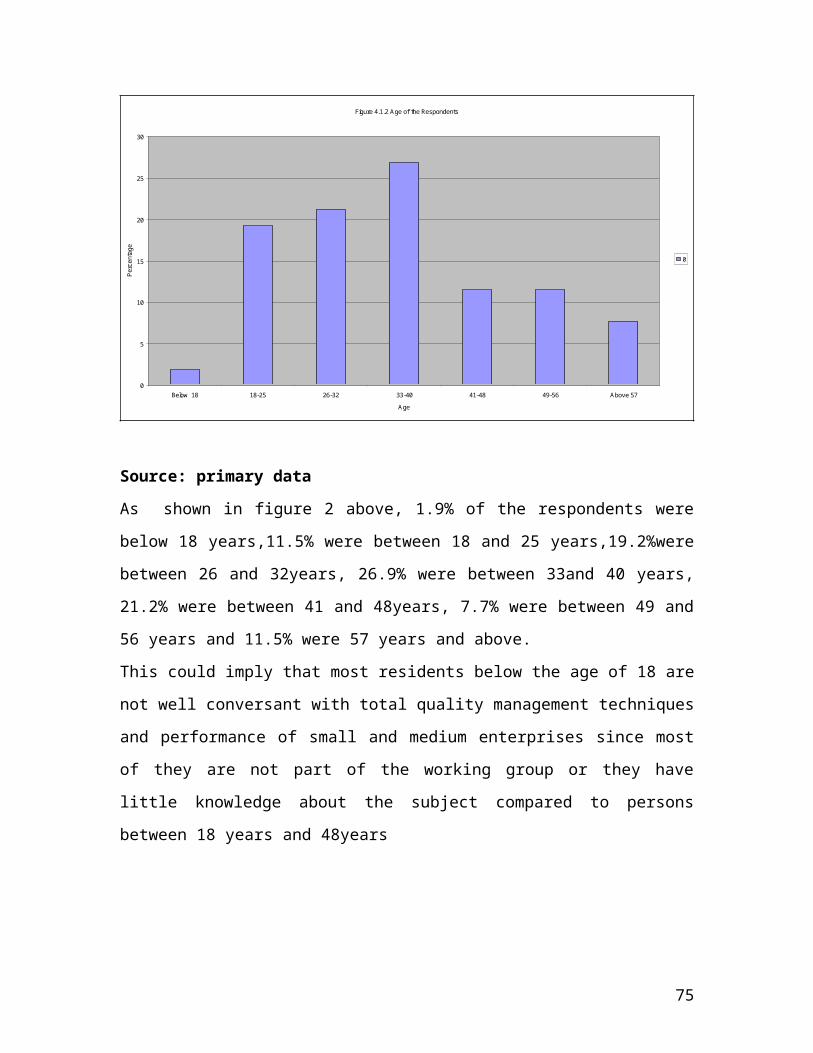
Ishikawa, K (1989), Introduction to quality control, JUSE Press Ltd, Tokyo.
Juran, J.M. (1951), Quality Control Handbook, New York, McGraw Hill.
K.M.Ho, Samuel (1999) Change for the better via ISO 9000 and TQM, Management
Decision 37/4, MCB University Press.
Kanji, G.K., Yui, H., (1997), Total quality culture, Total Quality Management.
Lamprecht, James L, (1995), Implementation for Small Business, ISO 9000, New York,
Van Nostrand Reinhold.
Lee, G. L., Oakes, I. (1995), The ‘pros’ and ‘cons’ of total quality management for small
firms in manufacturing: some experiences down the supply chain, Total Quality
Management.
Mann, R. S., Kehoe,D. (1994), An evaluation of the effects of quality improvement
activities on business performance, Journal of Quality &Reliability Management.
Mathews, B.P., Ueno,A., Periera, L.Z., Silva, G., Kekale, T., Repka, M. (2001),
Quality Training: Findings from a European Survey, The TQM Magazine.
Mo, J.P.T., Chan, A.M.S. (1997) Strategy for the successful implementation of ISO 9000
in small and medium manufacturers, The TQM Magazine.
Moreno- Luzon, M.D. (1993), Can total quality management make small firms
competitive? Total Quality Management.
Page, Richard & Curry, Adrienne (2000) TQM – A Holistic view, The TQM
Magazine.
Parkin, M.A. (1996) The impact of TQM in UK SMEs, Industrial Management and Data
Systems.
75
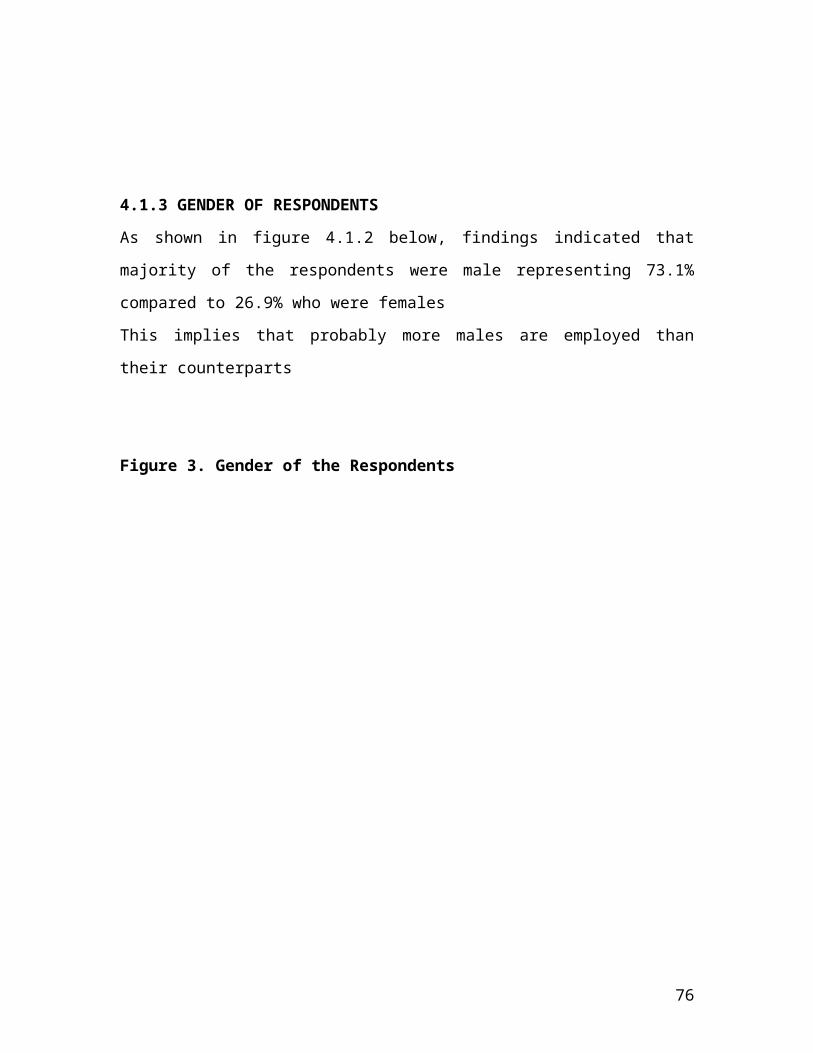
Porter, L.J., Parker, A.J., (1993), Total Quality Management-the critical success factors,
Total Quality Management.
Quazi H.A. & R. Padibjo Samuel. (1998) A journey toward total quality management
through ISO 9000 certification – a study on small and medium sized enterprises in
Singapore, International Journal of Quality &Reliability Management.
Richardson, Terry (1997), Total Quality Management, Delmar Publishers, New York.
Ross, J.E. (1994) Total Quality Management: Text and Cases Readings, 2nd Edition,
Kogan Page, London.
Saunders, D.M. (1995) Four Days with Dr. Deming, Addison- Wesley Publishing
Company, USA.
Saylor, J.H. (1992), TQM Field Manual, McGraw Hill, USA.
Garvin.D (2005) Managing quality, McGraw Hill, New York Universities Teknologi
Malaysia.
Steve Levit (1994) Quality is Just the Beginning, Management for Total Responsiveness:
New York, McGraw – Hill.
Tamimi, N., Gershon, M., (1995), A tool for assessing industry TQM practice versus
Deming philosophy, Production and Inventory Management Journal.
Wolkins, D.O. (1996), Total Quality: A framework for Leadership, Productivity Press.
Yusof, S.M. & Aspinwall, E.M. (1999) Critical Success factors for total quality
management implementation in small and medium enterprises, Total Quality
76
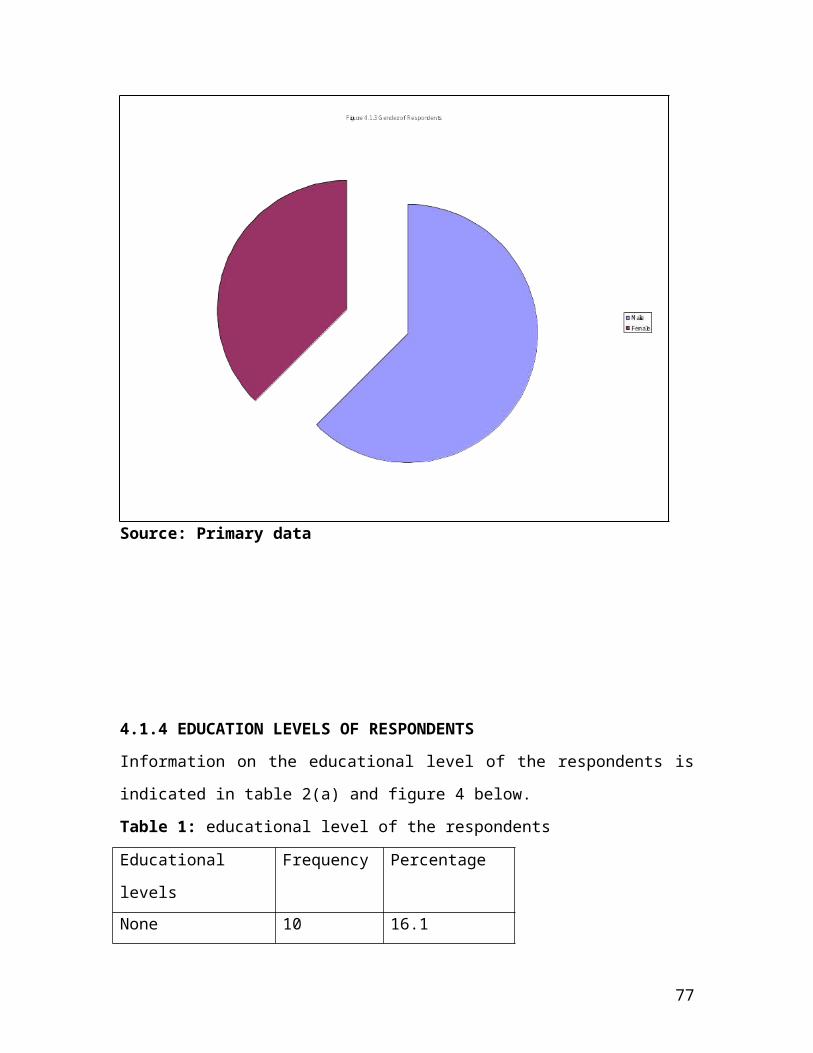
APPENDICES
APPENDIX 1
MAKERERE UNIVERSITY
COLLEGE OF BUSINESS AND MANAGEMENT SCIENCE.
ADOPTION OF TQM TECHNIQUES AND PERFORMANCE OF SMALL AND
MEDIUM ENTERPRISES
QUESTIONNAIRES (For service users)
Dear respondents
I am a student of Makerere University pursuing a degree of Bachelor of commerce and I
am carrying out an academic research study on Adoption of TQM techniques and
performance of small and medium enterprises taking Kampala district as my case
study
For that pursuit, I kindly seek your option and answers to the questions raised in this
questionnaire to facilitate any study by either ticking the appropriate option or giving a
brief explanation as required. The information obtained thereafter shall be used for
education purposes only and shall be treated with utmost confidentiality. Its only through
your response that this study can be completed successfully.
Thanks for your cooperation and time
A. General information.
Please tick or fill in the space if necessary
1.Male . Female
77

B. How long has the company been in existence?
5 years and below
6 years and above
2. If yes, for how long have you been an employee of that company?
1-3yrs 4-6 yrs
Above 6yrs
Please rate each opinion and answer according to the grades suggested below;
1=strongly agree
2=Agree
3=Not sure
4=Disagree
5=strongly disagree
ITEM 1 2 3 4 5
The company has had a positive performance since its existence.
There is full knowledge about TQM practices by both top and
lower level managers/ supervisors in the company
Total quality management techniques are practiced in the
company at all levels
78

A. Factors for effective adoption of TQM techniquesManagement leadership and commitment leads to effective
adoption of TQM in an organisation
Continuous improvement is one of the key factors for effective
adoption of TQM
To effectively adopt TQM in an organization, total customer
satisfaction is crucial
To successfully adopt TQM techniques, employee must fully get involvedTraining and education is an important factor for successful
adoption of TQM techniques in an organisation
Reward and recognition leads to the success of adoption the TQM
techniques.
B. Effects of TQM adoption on the company performance
79

Organization profits are increased when TQM techniques are
adopted by the organization.
The company attains competitive advantage when TQM
techniques are adopted
The company’s growth is assured when TQM techniques are
adopted.
The organization excels in financial perspectives when TQM
techniques are adopted.
Product quality and price are greatly improved when TQM
techniques are adopted.
The adoption of TQM techniques leads to customer protection
The adoption of TQM techniques leads to improvement in
organization performance.
C. Relationship between TQM techniques adoption and company performance
Poor management technique compromise the performance of
small and medium enterprises
Efficient implementation of TQM techniques leads to improved
performance of small and medium enterprises.
There is a strong relationship between adoption of TQM
techniques and company performance
Thanks, God bless you
APPENDIX II
80

MAKERERE UNIVERSITY
SCHOOL OF BUSINESS AND MANGEMENT STUDIES
ADOPTION OF TQM TECHNIQUES AND PERFORMANCE OF SMALL AND
MEDIUM ENTERPRISES
INTERVIEW GUIDE
(For managers and proprietors).
For how long have you worked in the company?
How often is company performance evaluated?
Do TQM techniques fully practiced in the company?
What sensitization programs about TQM have you adopted?
Do have quality assurance unit in the company?
Do products produced meet customer needs and expectations?
Do you always meet targeted performance standards? If not
What are the possible causes?
What factors could improve the company performance?
APPENDIX III
81

MAKERERE UNIVERSITY
COLLEDGE OF BUSINESS AND MANAGEMENT STUDIES
ADOPTION OF TQM TECHNIQUES AND PERFORMANCE OF SMALL AND
MEDIUM ENTERPRISES
INTERVIEW GUIDE
(For employees)
What procedures are followed to ensure the production of quality products?
How often do you get training?
Do you have team work at the work place?
How do detect in the production process? and
What steps do take?
APPENDIX IV
82
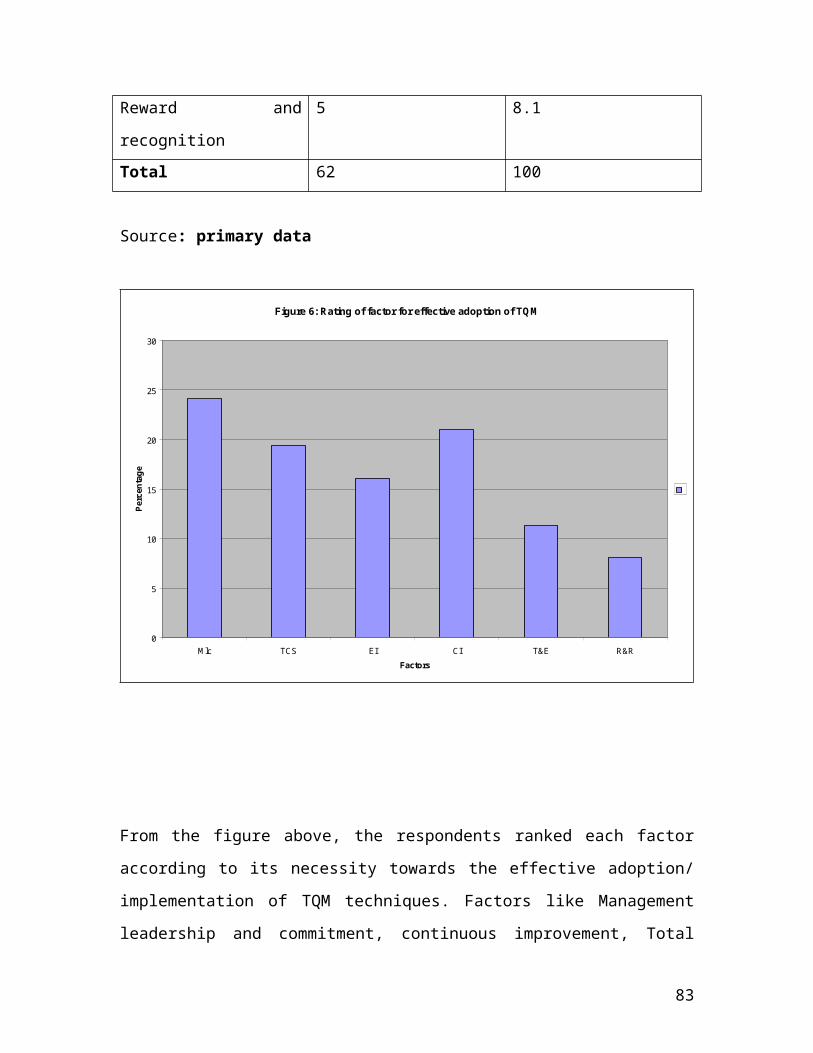
NUMBER OF ADMINISTRATORS INTERVIEWED
Company Number
Afroplast (U) Ltd 2
Muzinge Foods Ltd 3
Total 5
APPENDIX V
83
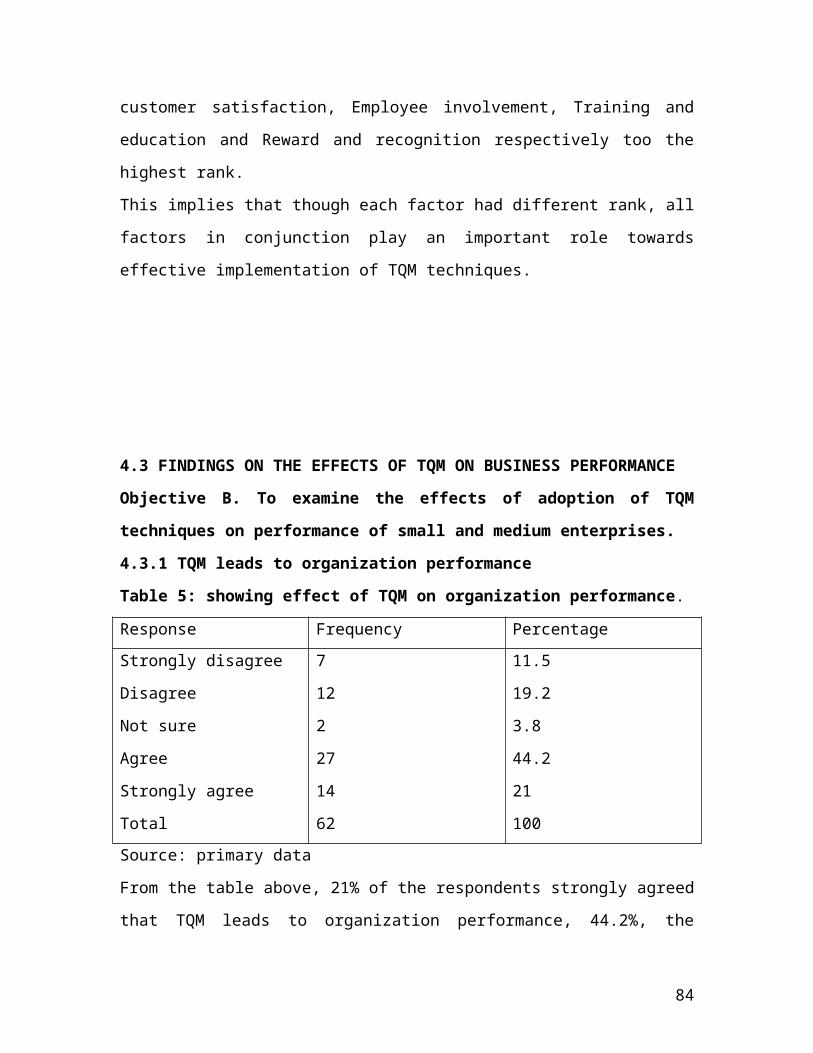
RESEARCH REPORT BUDGET
ITEMS AMOUNTS
Transport 110,000
Lodging costs 150,000
Secretarial services 95,000
Photocopying costs 20,000
Stationary (papers, pens and pencils) 11,000
Questionnaire preparation 40,000
Communication (Telephone calls) 20,000
Interview facilitation 50,000
Printing and binding of the report
Grand total
84

Some of the products produced by Muzinge Foods (U) Ltd
85
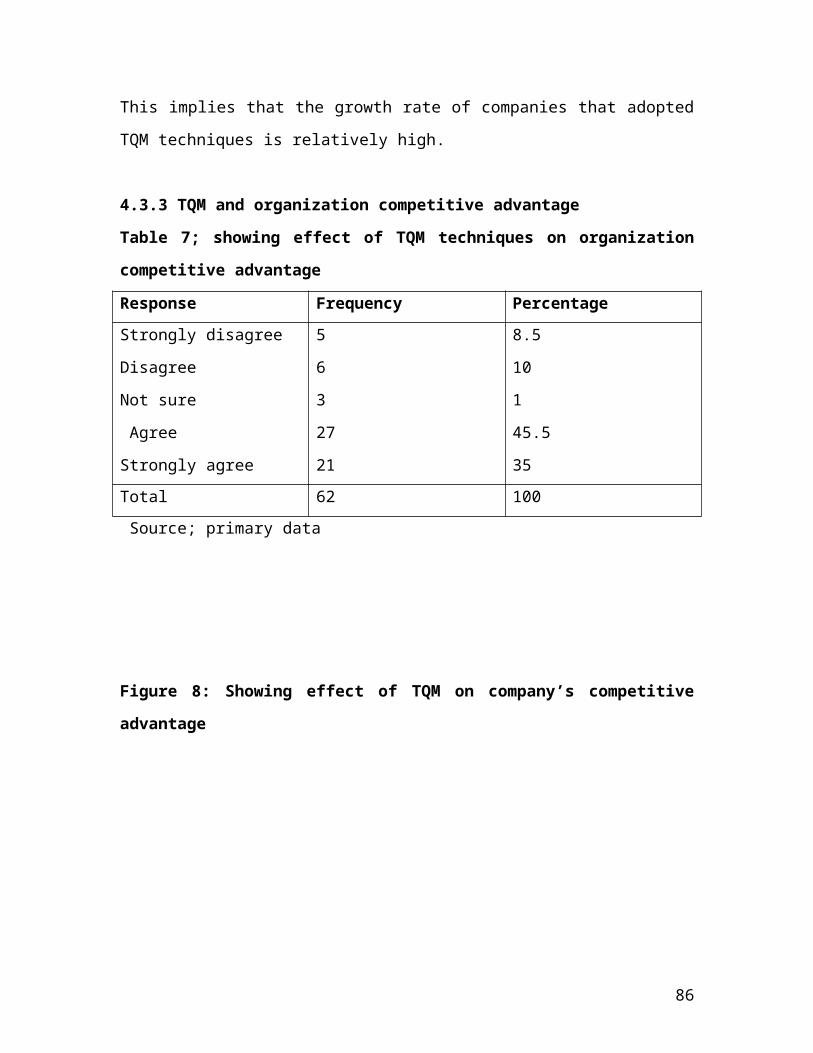
86