single-molecule mrna decay measurements reveal … · single-molecule mrna decay measurements...
TRANSCRIPT
Single-Molecule mRNA DecayMeasurements Reveal Promoter-Regulated mRNA Stability in YeastTatjana Trcek,1 Daniel R. Larson,4 Alberto Moldon,2 Charles C. Query,2 and Robert H. Singer1,3,*1Anatomy and Structural Biology2Cell Biology3Gruss-Lipper Biophotonics CenterAlbert Einstein College of Medicine, 1300 Morris Park Avenue, Bronx, NY 10461, USA4National Cancer Institute, National Institutes of Health, 41 Library Drive, Bethesda, MD 20892, USA*Correspondence: [email protected] 10.1016/j.cell.2011.11.051
SUMMARY
Messenger RNA decay measurements are typicallyperformed on a population of cells. However, this ap-proach cannot reveal sufficient complexity to pro-vide information on mechanisms that may regulatemRNA degradation, possibly on short timescales.To address this deficiency, we measured cell cycle-regulated decay in single yeast cells using single-molecule FISH.We found that two genes responsiblefor mitotic progression, SWI5 and CLB2, exhibit amitosis-dependentmRNA stability switch. Their tran-scripts are stable until mitosis, when a precipitousdecay eliminates the mRNA complement, preventingcarryover into the next cycle. Remarkably, the spec-ificity and timing of decay is entirely regulated bytheir promoter, independent of specific cis mRNAsequences. The mitotic exit network protein Dbf2pbinds to SWI5 and CLB2 mRNAs cotranscriptionallyand regulates their decay. This work reveals thepromoter-dependent control of mRNA stability, aregulatory mechanism that could be employed bya variety of mRNAs and organisms.
INTRODUCTION
Precise analysis of decay kinetics is necessary to understandwhen and how a decay regulator functions, and single-cell,single-molecule techniques could advance our understandingofmRNA turnover. For example, the kinetic behavior of individualRNA polymerase II (RNAPII) transcribing a gene (reviewed inArdehali and Lis, 2009) provides a precise quantification of thecontribution ofmRNA synthesis to the cellular pool of transcripts.However, to date, no such approach has been available formeasuring mRNA turnover. Traditional techniques have reliedon normalization of decay signal and on a large sample of cells,genetically modified or treated with inhibitors, to stop transcrip-tion and thus obtain kinetic information of a decaying mRNA
species (reviewed in Passos and Parker, 2008). Furthermore,the accuracy of decay measurement varies with the techniqueused. For example, in budding yeast, half-lives of an individualmRNA species quantified by different approaches may differby more than 50 percent (Grigull et al., 2004; Holstege et al.,1998; Wang et al., 2002). In turn, the accuracy of the decay curvewill influence how precisely it can be modeled. In this work, weuse single-molecule counting with fluorescent in situ hybridiza-tion (FISH) (Zenklusen et al., 2008) to derive an absolute measureof mRNA synthesis and decay in individual cells. This provideda highly sensitive approach for detecting changes that occur ina fraction of cells and would otherwise have been obscured.We focused onmRNA turnover because it could regulate gene
expression during the cell cycle. For instance, entry into mitosisinduces a rapid mRNA decay of the mitotic Clb2p cyclin that, ifprevented, can cause failure of cells to finish mitosis (Cai et al.,2002; Gill et al., 2004). Entry into G0 causes stabilization ofspecific G0 mRNAs (Talarek et al., 2010), whereas the stabilityof the canonical histone mRNAs increases with the onset of Sphase, and exit from S phase induces their rapid decay (Marzluffet al., 2008; Osley, 1991). Thus, together with their cyclical tran-scription, the destabilization of mRNAs can restrict the activity ofperiodically expressed genes to a particular cell-cycle phase.This modulation of stability is typically achieved through bindingof decay regulators to specific sequences located in the mRNA(reviewed in Guhaniyogi and Brewer, 2001).We focused on two cell cycle-regulated genes, SWI5 and
CLB2, and measured changes in their mRNA turnover duringthe cell cycle. Swi5p is a transcription regulator of late mitosisgenes, and Clb2p is a G2 phase cyclin that drives the progres-sion of cells towards mitosis. They are coregulated throughshared promoter elements (Koranda et al., 2000; Spellmanet al., 1998; Zhu et al., 2000) and were measured to degradewith 8 min and 4.5 min half-lives, respectively (Wang et al.,2002). We used morphological markers to determine timing ofthe cell cycle. We counted absolute numbers of cytoplasmicand nascent transcripts (Zenklusen et al., 2008) and analyzeddecay rates using a mathematical model without the use of tran-scriptional inhibitors, genetic mutants, or the need to normalizemRNA signal.
1484 Cell 147, 1484–1497, December 23, 2011 ª2011 Elsevier Inc.
The use of a single-molecule mRNA decay measurementenabled identification of a regulatory pathway of mRNA decaythat provides an additional level of cell cycle regulation. Wedetermined that the half-life of SWI5 and CLB2 decreasesmore than 30-fold with the onset of prometaphase/metaphase.Furthermore, regulation of this mRNA decay is coordinatedwith their transcription and controlled by their promoter se-quence, independent of the specific cis sequences located inthe mRNA. By using morphological markers, we were able todetermine that the cell cycle progression and the prometa-phase/metaphase stability switch of SWI5 and CLB2 werecoupled and regulated by the mitotic exit network kinases,Dbf2p and Dbf20p. Both kinases bind to SWI5 and CLB2mRNAs, and Dbf2p is also enriched at their transcription sites.We propose a model whereby Dbf2p is first recruited by the pro-moter and then cotranscriptionally deposited onto the mRNA.Once in the cytoplasm, the mRNA associates with Dbf20p andthen waits for the appropriate cellular cues to initiate thedecay process. Thus, for a subset of budding yeast mRNAs,promoter-dependent activity directly influences how and whenan mRNA will be degraded in the cytoplasm.
RESULTS
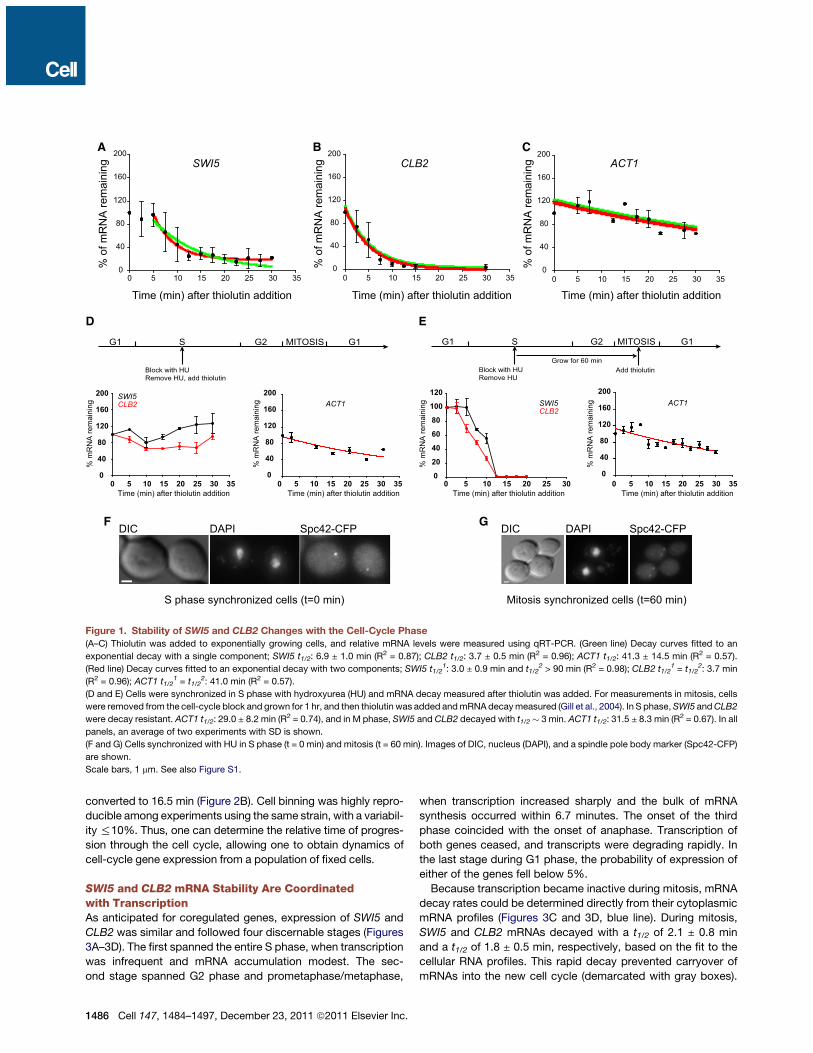
SWI5 and CLB2 mRNA Exhibit Cell Cycle-DependentDecay KineticsWe measured SWI5 and CLB2 mRNAs decay rates in exponen-tially growing cells using the common approaches of qRT-PCRcoupled with the transcriptional inhibitor thiolutin. A constitu-tively expressed ACT1 was expected to decay independentlyof the cell-cycle phase with a single decay rate (t1/2 of 45 min)(Wang et al., 2002) and was used as a control. Decay curves ofSWI5, CLB2, and ACT1 (Figures 1A–1C) were fitted to both anexponential decay with a single component (green line) andtwo components (red line) to identify which kinetic model bestdescribed their decay curves. A two-componentmodel detecteda decay-resistant SWI5 mRNA population (t1/2 > 90 min) anda rapidly decaying SWI5 mRNA population (t1/2 = 3.0 min),whereas a single component model with a t1/2 = 6.9 min showedsystematic deviations from the measured data. A two-compo-nent model was not able to resolve multiple CLB2 decay popu-lations and, similarly to ACT1 mRNA, fitted the decay data aswell as a single component model. Here, CLB2 mRNA decayedwith a single t1/2 = 3.7 min, whereas ACT1 mRNA decayed witha single t1/2 = 41.3 min, consistent with previously reportedvalues (Wang et al., 2002).To test whether SWI5 and CLB2 mRNAs decayed differently
during the cell cycle, we synchronized cells in different cell-cyclephases followed by thiolutin inhibition. In S phase and at G2/Mborder, SWI5 andCLB2mRNAs were stable, whereas in mitosis,they decayed rapidly with an estimated t1/2 of !3 min (Figures1D–1G and Figure S1A available online). ACT1 decayed inde-pendently of the cell-cycle phase and, similarly to unsynchro-nized cells, turned over with a single t1/2 of !30 min.Kinetics of transcription inhibition by thiolutin was indepen-
dent of the synchronization protocol (Figure S1B), and thus wecould conclude that the stability of SWI5 and CLB2 mRNAs,but not of ACT1 mRNA, changed depending on the cell-cycle
phase. Two CLB2 decay populations, however, could onlybe detected when physically separated in time by cell culturesynchronization. Therefore, normalization of mRNA decaysignal, inhibition of transcription, and use of populationmeasure-ments obscured the behavior occurring in a fraction of cells, thusdiminishing the sensitivity of the technique. We employed anapproach that was both highly quantitative and minimally inva-sive to the cell’s physiology. We modified a FISH-based methodthat enabled us to quantify mRNA decay rates in individual, mini-mally perturbed cells with single mRNA sensitivity without theneed for transcription inhibition, cell synchronization, or normal-ization of mRNA signal.
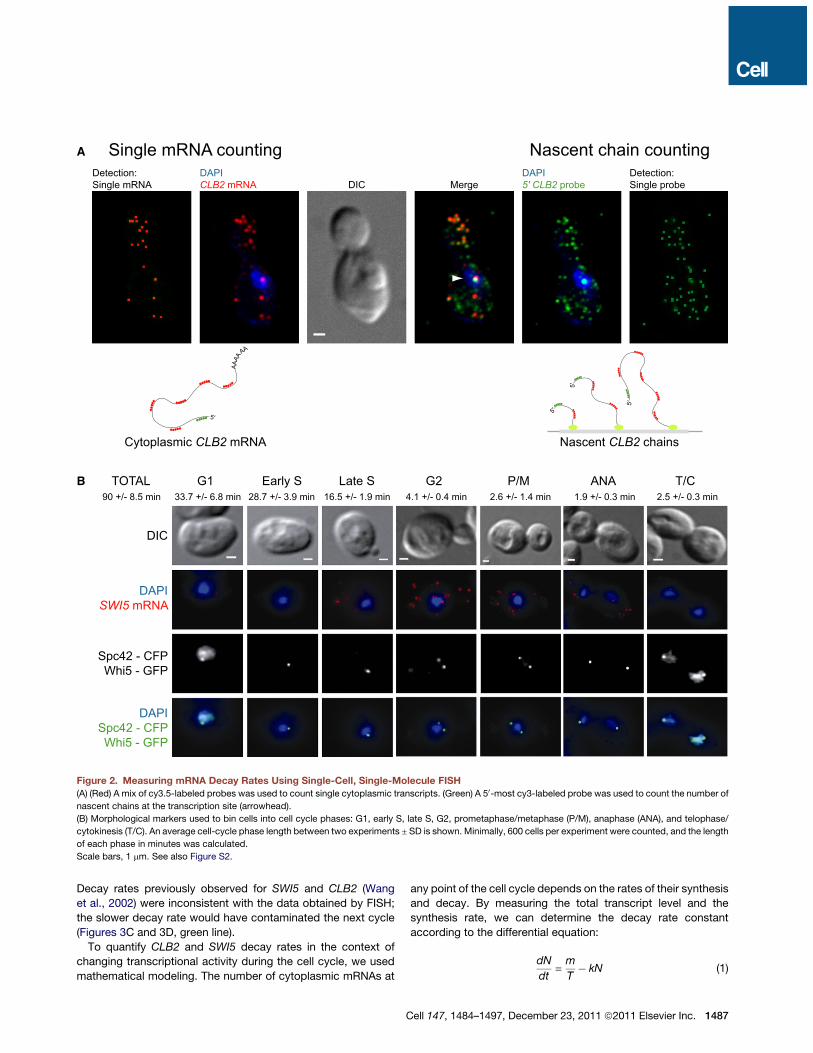
Measuring mRNA Decay Using Single-Cell, Single-Molecule FISHWe counted single transcripts in the cytoplasm in individual cellsusing single-cell, single-molecule FISH (Zenklusen et al., 2008).A mix of fluorescently labeled probes hybridizing along anmRNA was used (Figure 2A, red probes, and Table S1), whichstrongly amplified the signal-to-noise ratio and detection sensi-tivity. Fluorescent transcripts were detected and counted usingthe algorithm Localize (Larson et al., 2005; Zenklusen et al.,2008; Figure S2A). Specific fluorescent signal was only detectedin the presence of a target mRNA (Figures S2C and S2D). Aftercell segmentation, we obtained an absolute number of tran-scripts per cell, which obviated normalization of mRNA signalrequired for ensemble measurements and thus the uncertaintyassociated with them.FISH probes also annealed to the nascent chains whenever
a cell actively transcribed a gene. We used a single probe tar-geted to the 50-most endof the transcript labeledwith a spectrallydistinct fluorophore (Figures 2A, green probe, and S2B) andquantified the number of these probes annealed at the site oftranscription (Femino et al., 1998; Zenklusen et al., 2008). Thisapproach constitutes a direct measure of transcriptional activityin the cell, and the number of nascent chains reflects both thetranscript initiation rate and the dwell time of a transcript asdetermined by all postinitiation processes, including elongationand termination (see below). By directlymeasuring this transcrip-tional output, transcription inhibition was no longer needed,which enabled us to measure kinetics of mRNA decay in chem-ically unperturbed cells.To quantify changes inmRNA stability throughmitotic division,
we binned cells into cell-cycle phases using morphologicalmarkers as indicators of cell-cycle time (Brewer et al., 1984;Hartwell, 1974; Lord and Wheals, 1980; Figure 2B). Thisapproach provided temporal resolution without the need forcell synchronization. Four morphological markers were used:bud size (DIC), movement of the nucleus detected by DAPI, posi-tioning of the spindle pole body indicated by CFP-taggedSpc42p, and localization of a GFP-tagged Whi5p. Whi5p isnuclear during telophase, cytokinesis, and G1 phase of the cellcycle and is cytoplasmic in all others (Bean et al., 2006), allowingdifferentiation between G1 phase and early S phase cells thathave not yet formed a bud. Duplication time of the yeast culturewas 90 ± 8.5 minutes, and the percent of cells in each phasewas directly proportional to its length in minutes. For example,18.3% of cells were identified as late S phase cells, which
Cell 147, 1484–1497, December 23, 2011 ª2011 Elsevier Inc. 1485
converted to 16.5 min (Figure 2B). Cell binning was highly repro-ducible among experiments using the same strain, with a variabil-ity%10%. Thus, one can determine the relative time of progres-sion through the cell cycle, allowing one to obtain dynamics ofcell-cycle gene expression from a population of fixed cells.
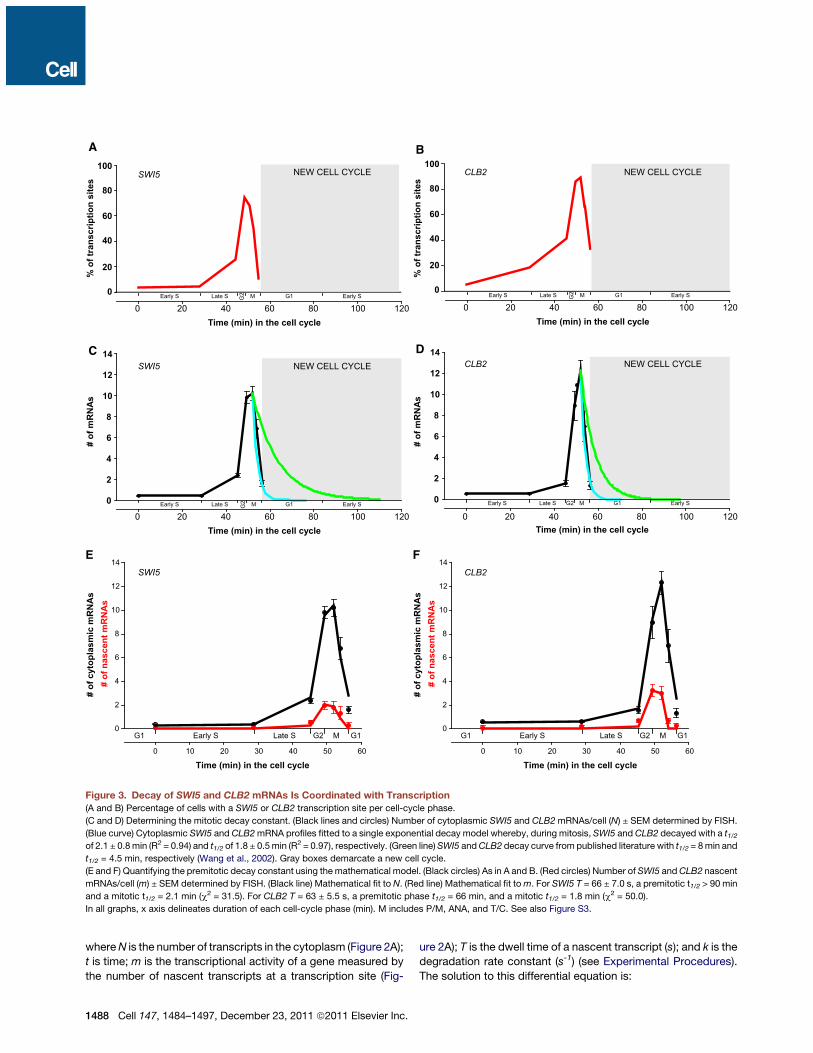
SWI5 and CLB2 mRNA Stability Are Coordinatedwith TranscriptionAs anticipated for coregulated genes, expression of SWI5 andCLB2 was similar and followed four discernable stages (Figures3A–3D). The first spanned the entire S phase, when transcriptionwas infrequent and mRNA accumulation modest. The sec-ond stage spanned G2 phase and prometaphase/metaphase,
when transcription increased sharply and the bulk of mRNAsynthesis occurred within 6.7 minutes. The onset of the thirdphase coincided with the onset of anaphase. Transcription ofboth genes ceased, and transcripts were degrading rapidly. Inthe last stage during G1 phase, the probability of expression ofeither of the genes fell below 5%.Because transcription became inactive during mitosis, mRNA
decay rates could be determined directly from their cytoplasmicmRNA profiles (Figures 3C and 3D, blue line). During mitosis,SWI5 and CLB2 mRNAs decayed with a t1/2 of 2.1 ± 0.8 minand a t1/2 of 1.8 ± 0.5 min, respectively, based on the fit to thecellular RNA profiles. This rapid decay prevented carryover ofmRNAs into the new cell cycle (demarcated with gray boxes).
Time (min) after thiolutin addition
% m
RN
A re
mai
ning ACT1
0 5 10 15 20 25 30 350
40
80
120
160
200
0 5 10 15 20 25 30020406080100120
CLB2SWI5
G1G1 S G2 MITOSIS
Block with HURemove HU, add thiolutin
G1G1 S G2 MITOSIS
Block with HURemove HU
Grow for 60 minAdd thiolutin
D E
0 5 10 15 20 25 30 350
40
80
120
160
200ACT1
% o
f mR
NA
rem
aini
ng SWI5A
Time (min) after thiolutin addition0 5 10 15 20 25 30 35
0
40
80
120
160
200ACT1
C
Time (min) after thiolutin addition0 5 10 15 20 25 30 35
0
40
80
120
160
200
% o
f mR
NA
rem
aini
ngCLB2 B
Time (min) after thiolutin addition0 5 10 15 20 25 30 35
0
40
80
120
160
200
% o
f mR
NA
rem
aini
ng
CLB2SWI5
0 5 10 15 20 25 30 350
40
80
120
160
200
% m
RN
A re
mai
ning
% m
RN
A re
mai
ning
% m
RN
A re
mai
ning
Time (min) after thiolutin addition Time (min) after thiolutin addition Time (min) after thiolutin addition
F G
S phase synchronized cells (t=0 min) Mitosis synchronized cells (t=60 min)
DIC DAPI Spc42-CFP DIC DAPI Spc42-CFP
Figure 1. Stability of SWI5 and CLB2 Changes with the Cell-Cycle Phase(A–C) Thiolutin was added to exponentially growing cells, and relative mRNA levels were measured using qRT-PCR. (Green line) Decay curves fitted to an
exponential decay with a single component; SWI5 t1/2: 6.9 ± 1.0 min (R2 = 0.87); CLB2 t1/2: 3.7 ± 0.5 min (R2 = 0.96); ACT1 t1/2: 41.3 ± 14.5 min (R2 = 0.57).
(Red line) Decay curves fitted to an exponential decay with two components; SWI5 t1/21: 3.0 ± 0.9 min and t1/2
2 > 90 min (R2 = 0.98); CLB2 t1/21 = t1/2
2: 3.7 min
(R2 = 0.96); ACT1 t1/21 = t1/2
2: 41.0 min (R2 = 0.57).
(D and E) Cells were synchronized in S phase with hydroxyurea (HU) and mRNA decay measured after thiolutin was added. For measurements in mitosis, cells
were removed from the cell-cycle block and grown for 1 hr, and then thiolutin was added andmRNAdecaymeasured (Gill et al., 2004). In S phase,SWI5 andCLB2
were decay resistant. ACT1 t1/2: 29.0 ± 8.2 min (R2 = 0.74), and in M phase, SWI5 and CLB2 decayed with t1/2 ! 3 min. ACT1 t1/2: 31.5 ± 8.3 min (R2 = 0.67). In all
panels, an average of two experiments with SD is shown.
(F and G) Cells synchronized with HU in S phase (t = 0 min) and mitosis (t = 60 min). Images of DIC, nucleus (DAPI), and a spindle pole body marker (Spc42-CFP)
are shown.
Scale bars, 1 mm. See also Figure S1.
1486 Cell 147, 1484–1497, December 23, 2011 ª2011 Elsevier Inc.
Decay rates previously observed for SWI5 and CLB2 (Wanget al., 2002) were inconsistent with the data obtained by FISH;the slower decay rate would have contaminated the next cycle(Figures 3C and 3D, green line).To quantify CLB2 and SWI5 decay rates in the context of
changing transcriptional activity during the cell cycle, we usedmathematical modeling. The number of cytoplasmic mRNAs at
any point of the cell cycle depends on the rates of their synthesisand decay. By measuring the total transcript level and thesynthesis rate, we can determine the decay rate constantaccording to the differential equation:
dN
dt=m
T" kN (1)
G1 Early S Late S G2 P/M ANA T/C33.7 +/- 6.8 min 16.5 +/- 1.9 min 4.1 +/- 0.4 min 2.6 +/- 1.4 min 1.9 +/- 0.3 min 2.5 +/- 0.3 min28.7 +/- 3.9 min
DIC
DAPISWI5 mRNA
DAPISpc42 - CFPWhi5 - GFP
Spc42 - CFPWhi5 - GFP
B90 +/- 8.5 min
TOTAL
Nascent CLB2 chains
AAAA
AA
Cytoplasmic CLB2 mRNA
Single mRNA counting Nascent chain countingA
DIC MergeDAPI5! CLB2 probe
Detection:Single probe
DAPICLB2 mRNA
Detection:Single mRNA
5!
5!
5!
5!
Figure 2. Measuring mRNA Decay Rates Using Single-Cell, Single-Molecule FISH(A) (Red) A mix of cy3.5-labeled probes was used to count single cytoplasmic transcripts. (Green) A 50-most cy3-labeled probe was used to count the number of
nascent chains at the transcription site (arrowhead).
(B) Morphological markers used to bin cells into cell cycle phases: G1, early S, late S, G2, prometaphase/metaphase (P/M), anaphase (ANA), and telophase/
cytokinesis (T/C). An average cell-cycle phase length between two experiments ± SD is shown. Minimally, 600 cells per experiment were counted, and the length
of each phase in minutes was calculated.
Scale bars, 1 mm. See also Figure S2.
Cell 147, 1484–1497, December 23, 2011 ª2011 Elsevier Inc. 1487
whereN is the number of transcripts in the cytoplasm (Figure 2A);t is time; m is the transcriptional activity of a gene measured bythe number of nascent transcripts at a transcription site (Fig-
ure 2A); T is the dwell time of a nascent transcript (s); and k is thedegradation rate constant (s-1) (see Experimental Procedures).The solution to this differential equation is:
DNEW CELL CYCLE
# of
mRN
As
0
2
4
6
8
10
12
14
Time (min) in the cell cycle0 20 40 60 80 100 120
Early SEarly S Late S G2 G1M
NEW CELL CYCLE
0
2
4
6
8
10
12
14
Time (min) in the cell cycle0 20 40 60 80 100 120
Early SEarly S Late S G2 G1M
# of
mRN
As
G1 G1G2Early S Late S M
Time (min) in the cell cycle0 10 20 30 40 50 60
0
2
4
6
8
10
12
14
# of
cyt
opla
smic
mRN
As
# of
nas
cent
mRN
As
F
G1 G1G2Early S Late S M
Time (min) in the cell cycle0 10 20 30 40 50 60
0
2
4
6
8
10
12
14
# of
cyt
opla
smic
mRN
As
# of
nas
cent
mRN
As
C
E
A100
80
60
40
20
0
% o
f tra
nscr
iptio
n si
tes
Time (min) in the cell cycle0 20 40 60 80 100 120
Early SEarly S Late S G2 G1M
NEW CELL CYCLE
B100
80
60
40
20
0
% o
f tra
nscr
iptio
n si
tes
Time (min) in the cell cycle0 20 40 60 80 100 120
Early SEarly S Late S G2 G1M
NEW CELL CYCLESWI5
SWI5
CLB2
CLB2
SWI5 CLB2
Figure 3. Decay of SWI5 and CLB2 mRNAs Is Coordinated with Transcription(A and B) Percentage of cells with a SWI5 or CLB2 transcription site per cell-cycle phase.
(C and D) Determining the mitotic decay constant. (Black lines and circles) Number of cytoplasmic SWI5 and CLB2mRNAs/cell (N) ± SEM determined by FISH.
(Blue curve) Cytoplasmic SWI5 and CLB2mRNA profiles fitted to a single exponential decay model whereby, during mitosis, SWI5 and CLB2 decayed with a t1/2of 2.1 ± 0.8min (R2 = 0.94) and t1/2 of 1.8 ± 0.5min (R2 = 0.97), respectively. (Green line)SWI5 andCLB2 decay curve from published literature with t1/2 = 8min and
t1/2 = 4.5 min, respectively (Wang et al., 2002). Gray boxes demarcate a new cell cycle.
(E and F) Quantifying the premitotic decay constant using the mathematical model. (Black circles) As in A and B. (Red circles) Number of SWI5 andCLB2 nascent
mRNAs/cell (m) ± SEM determined by FISH. (Black line) Mathematical fit to N. (Red line) Mathematical fit tom. For SWI5 T = 66 ± 7.0 s, a premitotic t1/2 > 90 min
and a mitotic t1/2 = 2.1 min (c2 = 31.5). For CLB2 T = 63 ± 5.5 s, a premitotic phase t1/2 = 66 min, and a mitotic t1/2 = 1.8 min (c2 = 50.0).
In all graphs, x axis delineates duration of each cell-cycle phase (min). M includes P/M, ANA, and T/C. See also Figure S3.
1488 Cell 147, 1484–1497, December 23, 2011 ª2011 Elsevier Inc.
N#t$= m
kT
!1" e"kt
"+N0e
"kt (2)
where N0 is the initial number of transcripts. The time t is deter-mined from cell-cycle markers as described above (Figure 2B).The measured values are m and N determined as a function of t,and the fit parameters are k and T. For each gene, a globalnonlinear least-squarefit to theexpressionprofilewasdetermined.This model describes RNA levels as a balance of zero-order
RNA synthesis and first-order decay. We assume first-ordermRNA decay because it is the simplest model that describes ourdata andallowsus tocompare tobulkbiochemicalmeasurementsof mRNA stability. In the simplest form, with a dwell time and anmRNA half-life that are invariant over the cell cycle, both fit valuesare < 35 s, resulting in RNA polymerase velocities and RNA life-times that are unphysical (Figures S3A–S3G). However, if weinclude the possibility of bimodal decay, as experimentallyobserved in Figure 1, the model captures the essential featuresof SWI5 and CLB2 regulation over the cell cycle. We kept themitotic t1/2 fixed at 2.1 min for SWI5 and t1/2 at 1.8 min for CLB2,as determined by the FISH measurements (Figures 3C and 3Dand S3C–S3G), and allowed the nascent transcript dwell timeand the premitotic decay to float. This fitting regime reacheda global minimum with the following parameter values: for SWI5mRNA, a dwell timeof 66± 7.0 s and apremitotic t1/2>90min (Fig-ure 3E, solid lines) and for CLB2mRNA a dwell time of 63 ± 5.5 sand a premitotic t1/2 of 66 min (Figure 3F, solid lines). The dwelltimes consist of elongation and postelongation processes, andif the termination time is estimated as 30 s (Zenklusen et al.,2008), the resulting polymerase velocity is !50 bp/s, consistentwith the polymerase velocity of 46 ± 6.2 bp/s during S/G2/M (Lar-son et al., 2011). Additionally, the bimodal decay kinetics isinvariant of nascent chain dwell times as long as these remainwithin the physiological boundaries of T > 18 seconds (FiguresS3C–S3G). Lastly, based on the best fit of our model, we deter-mined that the switch inmRNA stability occurred during prometa-phase/metaphase, when transcription for both genes was at itspeak, even though the rapid decay became apparent only withthe onset of anaphase, when transcription was shutting down(Figures 3A–3F).To further address the timing of destabilization, we modeled
the data assuming that the switch in mRNA stability occurredwith the onset of anaphase. This fitting regime also resulted inbimodal decay kinetics similar to the one described above butwith the higher divergence of the mathematical fit from theFISH data (data not shown). Based on the best fit criterion, thisanaphase-specific model was thus not considered in the anal-ysis of SWI5 and CLB2 decay kinetics.Several important conclusions are evident: (1) prior to mitosis,
SWI5 and CLB2 transcripts were stable, allowing the cell toincrease mRNA levels during active transcription; (2) duringmitosis, when SWI5 and CLB2 transcription were shutting down,their transcripts decayed rapidly, preventing carryover into thenext cell cycle; (3) the switch from one state to the other occurredduring prometaphase/metaphase (P/M), when SWI5 and CLB2transcription reached its peak. These data suggest, therefore,that mRNA synthesis and decay were temporally coordinated forSWI5 and CLB2.
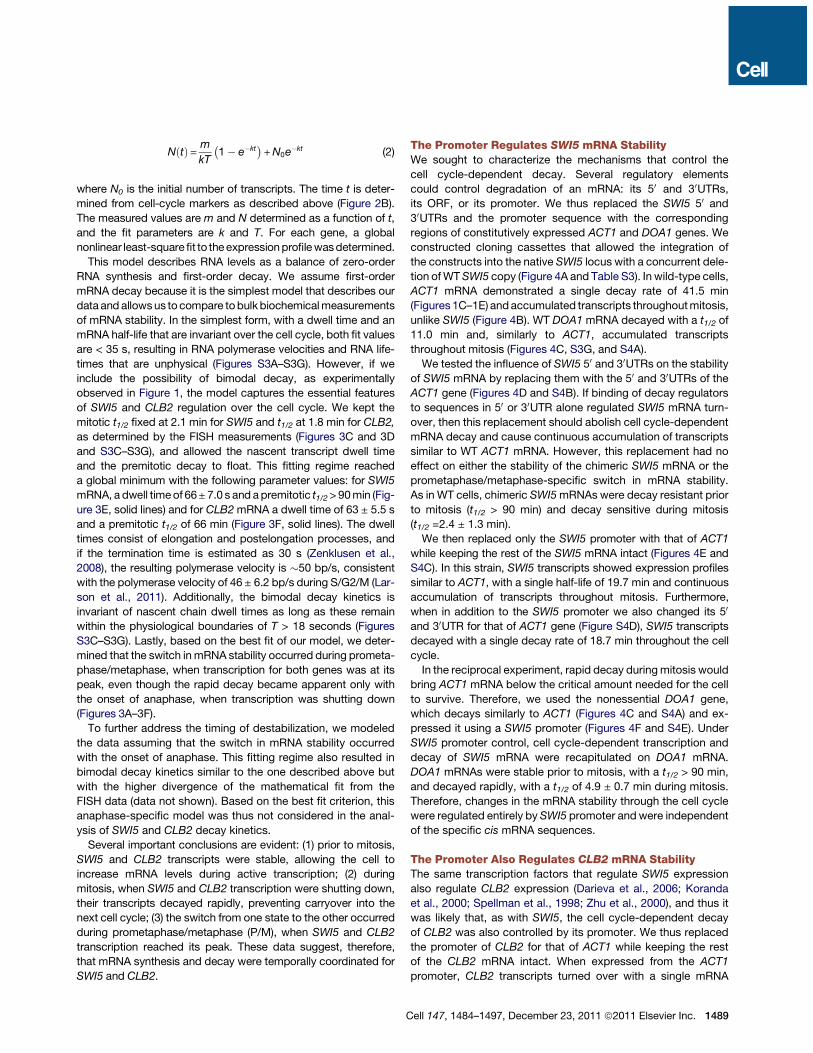
The Promoter Regulates SWI5 mRNA StabilityWe sought to characterize the mechanisms that control thecell cycle-dependent decay. Several regulatory elementscould control degradation of an mRNA: its 50 and 30UTRs,its ORF, or its promoter. We thus replaced the SWI5 50 and30UTRs and the promoter sequence with the correspondingregions of constitutively expressed ACT1 and DOA1 genes. Weconstructed cloning cassettes that allowed the integration ofthe constructs into the native SWI5 locus with a concurrent dele-tion ofWTSWI5 copy (Figure 4A and Table S3). In wild-type cells,ACT1 mRNA demonstrated a single decay rate of 41.5 min(Figures 1C–1E) andaccumulated transcripts throughoutmitosis,unlike SWI5 (Figure 4B). WT DOA1 mRNA decayed with a t1/2 of11.0 min and, similarly to ACT1, accumulated transcriptsthroughout mitosis (Figures 4C, S3G, and S4A).We tested the influence of SWI5 50 and 30UTRs on the stability
of SWI5 mRNA by replacing them with the 50 and 30UTRs of theACT1 gene (Figures 4D and S4B). If binding of decay regulatorsto sequences in 50 or 30UTR alone regulated SWI5 mRNA turn-over, then this replacement should abolish cell cycle-dependentmRNA decay and cause continuous accumulation of transcriptssimilar to WT ACT1 mRNA. However, this replacement had noeffect on either the stability of the chimeric SWI5 mRNA or theprometaphase/metaphase-specific switch in mRNA stability.As in WT cells, chimeric SWI5mRNAs were decay resistant priorto mitosis (t1/2 > 90 min) and decay sensitive during mitosis(t1/2 =2.4 ± 1.3 min).We then replaced only the SWI5 promoter with that of ACT1
while keeping the rest of the SWI5 mRNA intact (Figures 4E andS4C). In this strain, SWI5 transcripts showed expression profilessimilar to ACT1, with a single half-life of 19.7 min and continuousaccumulation of transcripts throughout mitosis. Furthermore,when in addition to the SWI5 promoter we also changed its 50
and 30UTR for that of ACT1 gene (Figure S4D), SWI5 transcriptsdecayed with a single decay rate of 18.7 min throughout the cellcycle.In the reciprocal experiment, rapid decay duringmitosis would
bring ACT1 mRNA below the critical amount needed for the cellto survive. Therefore, we used the nonessential DOA1 gene,which decays similarly to ACT1 (Figures 4C and S4A) and ex-pressed it using a SWI5 promoter (Figures 4F and S4E). UnderSWI5 promoter control, cell cycle-dependent transcription anddecay of SWI5 mRNA were recapitulated on DOA1 mRNA.DOA1 mRNAs were stable prior to mitosis, with a t1/2 > 90 min,and decayed rapidly, with a t1/2 of 4.9 ± 0.7 min during mitosis.Therefore, changes in the mRNA stability through the cell cyclewere regulated entirely by SWI5 promoter andwere independentof the specific cis mRNA sequences.
The Promoter Also Regulates CLB2 mRNA StabilityThe same transcription factors that regulate SWI5 expressionalso regulate CLB2 expression (Darieva et al., 2006; Korandaet al., 2000; Spellman et al., 1998; Zhu et al., 2000), and thus itwas likely that, as with SWI5, the cell cycle-dependent decayof CLB2 was also controlled by its promoter. We thus replacedthe promoter of CLB2 for that of ACT1 while keeping the restof the CLB2 mRNA intact. When expressed from the ACT1promoter, CLB2 transcripts turned over with a single mRNA
Cell 147, 1484–1497, December 23, 2011 ª2011 Elsevier Inc. 1489
E
D
F
A
C
B
Figure 4. SWI5 mRNA Decay Is Determined by Its Promoter(A) Design of an integration cassette. Colors denote gene origins: SWI5, yellow; ACT1, blue; DOA1, pale blue; selection marker, green.
1490 Cell 147, 1484–1497, December 23, 2011 ª2011 Elsevier Inc.

half-life of 4.9 min and, unlike WT CLB2 mRNAs, accumulatedcontinuously throughout mitosis (Figure 5A).In the reciprocal experiment, a constitutively transcribed
DOA1 was expressed from the CLB2 promoter and its mRNAstability measured. In this strain, the gene expression features
of CLB2 were recapitulated on DOA1, with a slow mRNA turn-over prior to mitosis (t1/2 of 14.7 min) and a rapid turnover duringmitosis (t1/2 of 0.9 min) (Figure 5B). Unlike WT CLB2, however,the switch in the DOA1 mRNA stability occurred during telo-phase/cytokinesis. Due to the integration of cloning cassette
(B) WT ACT1 expression over the cell cycle. Note the increase in transcription and transcripts after gene duplication. Summed fluorescence intensity ± SD is
shown with images of ACT1-expressing cells (see Experimental Procedures).
(C) WT DOA1. (Black circles) N ± SEM; (red circles) m ± SEM quantified by FISH; (black line) mathematical fit to N; (red line) mathematical fit to m. T of 68 s,
t1/2 = 11.0 min (c2 = 46.7).
(D–F) Swapping of SWI5 regulatory sequence elements with ACT1 and DOA1 shows that the promoter is the determinant of decay. (Black circles) N ± SEM;
(red circles) m ± SEM quantified by FISH; (black line) mathematical fit to N; (red line) mathematical fit to m.
(D) Chimeric SWI5 with ACT1 50 and 30UTR. T of 64 s, a premitotic t1/2 > 90 min (c2 = 25.7), and a mitotic t1/2 = 2.4 ± 1.3 min (R2 = 0.92).
(E) SWI5 with ACT1 promoter: T of 72 s and a t1/2 = 19.7 min (c2 = 162.1).
(F)DOA1withDOA1 50 and 30UTRs expressed from a SWI5 promoter. T of 68 s, a premitotic t1/2 > 90min (c2 = 109.9), and amitotic t1/2 = 4.9 ± 0.7 min (R2 = 0.99).
For (B)–(F), see Experimental Procedures and Table S3. In all graphs, the x axis delineates duration of each cell-cycle phase (min). M includes P/M, ANA, and T/C.
Images of cells through the cell cycle for each strain are shown. Scale bars, 1 mm. See also Figure S4.
ACT1 CLB2 CLB2 CLB2 CLB2
atg taaPromoter 5!UTR ORF 3! UTR5!homol. Sel. 3!UTR
CLB2
0
5
10
15
20
25
# of
cyt
opla
smic
CLB
2 m
RN
As
# of
nas
cent
CLB
2 m
RN
As
Time (min) in the cell cycle0 10 20 30 40 50 60 70
G1 G1G2 MEarly S Late S
G135. 4 min
Early S29.1 min
Late S14.0 min
G24.7 min
P/M3.8 min
ANA5.2 min
T/C4.5 min
DIC
Whi5p-GFPSpc42p-CFP
CLB2 mRNADAPI
G135. 4 min
Early S29.1 min
Late S14.0 min
G24.7 min
P/M3.8 min
ANA5.2 min
T/C4.5 min
DIC
Whi5p-GFPSpc42p-CFP
DOA1 mRNADAPI
CLB2 DOA1 DOA1 DOA1 CLB2
atg taaPromoter 5!UTR ORF 3! UTR5!homol. Sel. 3!UTR
CLB2
# of
cyt
opla
smic
DO
A1
mR
NA
s #
of n
asce
nt D
OA
1 m
RN
As
0
5
10
15
20
25
Time (min) in the cell cycle0 20 40 60 80 100
Late SEarly SG1 G2 M G1
A
B
Figure 5. CLB2 mRNA Decay Is Determined by Its Promoter(A and B) An integration cassette used to create the strain is shown. Colors denote gene origins: ACT1, blue; DOA1, pale blue; CLB2, violet; selection marker,
green. (Black circles) Number of cytoplasmicCLB2 orDOA1mRNAs/cell (N) ± SEM determined by FISH; (red circles) Number ofCLB2 orDOA1 nascent mRNAs/
cell (m) ± SEM determined by FISH; (black line) mathematical fit to N; (red line) mathematical fit to m.
(A) CLB2 mRNA expressed from the ACT1 promoter: T = 66 s and a t1/2 of 4.9 min (c2 = 32.4).
(B) DOA1mRNA expressed from the CLB2 promoter: T = 77 s, a pretelophase/cytokinesis t1/2 of 14.7 min, and a telophase/cytokinesis t1/2 of 0.9 min (c2 = 32.5).
In all graphs, the x axis delineates duration of each cell-cycle phase (min). M includes three cell-cycle phases: P/M, ANA, and T/C. Images of cells through the cell
cycle are shown. Scale bars, 1 mm.
Cell 147, 1484–1497, December 23, 2011 ª2011 Elsevier Inc. 1491
BA
GF
H I
C D E
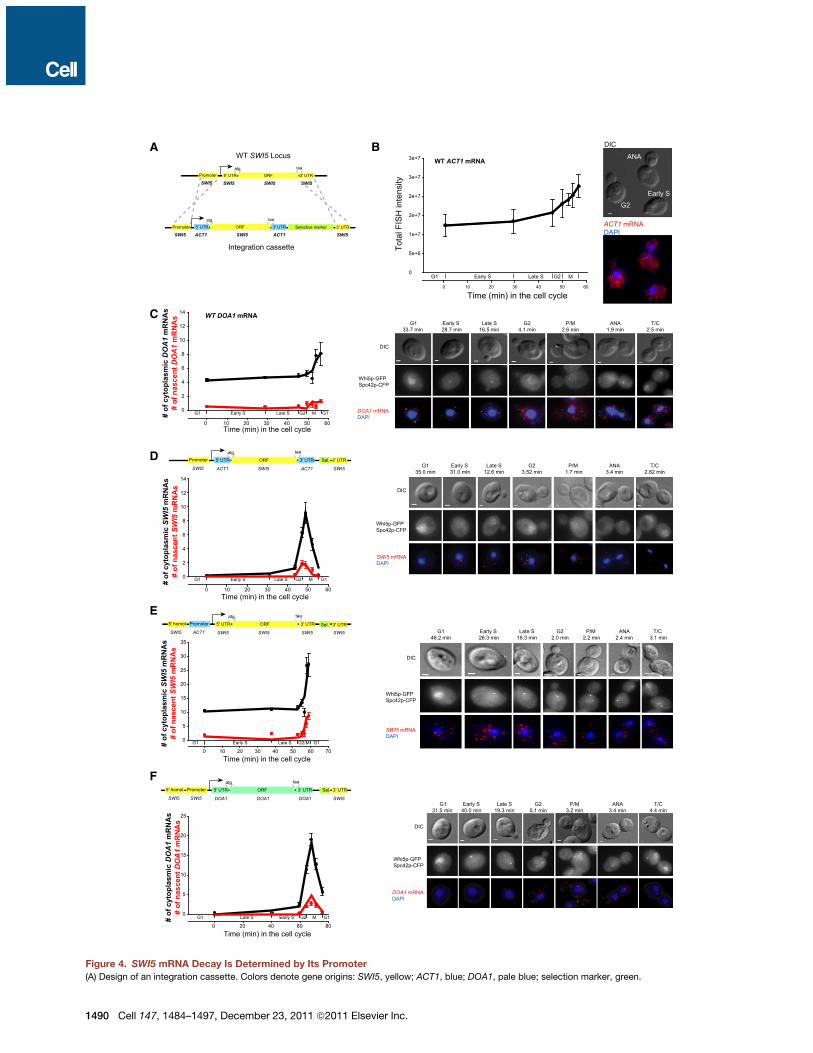
Figure 6. Dbf2p, but Not Dbf20p, Associates with SWI5 and CLB2 mRNA during Transcription and Regulates Their mRNA Stability(A) RNA immunoprecipitation of SWI5 andCLB2mRNAs with Dbf2p-TAP and Dbf20p-TAP frommitotic cells. Binding relative to Pab1p-TAP is shown. Significant
enrichment relative to untagged cells is indicated (t test; *p<0.05 and **p<0.01).
(B) The positions of PCR amplicons used in (A)–(E) for each gene are depicted (Table S5).
(C–E) Dbf2p-TAP, Dbf20p-TAP, and an untagged control were immunopurified from S phase (S, black bars) or mitotic cells (M, red bars). Association of these
proteins to various regions of SWI5, CLB2, ACT1, and DOA1 genes was analyzed by qPCR. Data are represented as relative to binding to TEL V, a telomeric
region in chromosome V. In each panel, an average of three experiments with the SEM is shown. Significant enrichment relative to the S phase cells is indicated
(t test; * p<0.05).
(F–I) Dbf2p and Dbf20p deletions affect SWI5 andCLB2mRNA stability. (Black circles)N ± SEM; (red circles) m ± SEM; (black line) mathematical fit toN; (red line)
mathematical fit to m.
(F) SWI5 in DDBF2: T of 66 s, premitotic t1/2 = 4.3 min, and a mitotic t1/2 = 2.8 min (c2 = 6.3).
1492 Cell 147, 1484–1497, December 23, 2011 ª2011 Elsevier Inc.
into the CLB2 locus, this strain did not express the Clb2cyclin. Consistent with the literature, this deletion resulted in anabnormal cell cycle and a delayed progression through mitosis(Figure 5B; Fitch et al., 1992), which could have adverse effectson the decay process and the timing of theDOA1mRNA stabilityswitch.These results demonstrate that the promoter sequence regu-
lates the cell cycle-dependent mRNA turnover of both the SWI5and CLB2, independent of their cis mRNA sequences. mRNAstabilities measured for SWI5 and CLB2 when driven from theACT1 promoter thus represent their ‘‘innate’’ abilities to resistdecay. For SWI5 and CLB2, therefore, transcription and mRNAdecay are codependent processes in which the regulation ofthe first influences the outcome of the latter.
mRNA Stability of SWI5 and CLB2 Is Regulated by Dbf2pand Dbf20pA bona fide regulator of SWI5 and CLB2 decay requires interac-tion with their transcription factors, the mRNA decay regulators,and the cell-cycle machinery to ensure coordination among thethree. In the search of this trans-acting factor, we made use ofthe Saccharomyces genome database. Because the regulationof SWI5 and CLB2 decay is promoter dependent, we askedwhether any of their transcription factors physically interactedwith a protein that, in turn, interacted with themRNA decay regu-lators and the cell-cycle regulators to provide coupling amongthe three processes (see Experimental Procedures). Dbf2p, amitotic exit network (MEN) kinase, was the only protein thatsatisfied this criterion. It interacts with Cdc5p (Visintin andAmon, 2001), a SWI5 and CLB2 transcription factor and itselfa MEN regulator (Darieva et al., 2006); it is a part of a largerCCR4-NOT complex (Liu et al., 1997), a major deadenylase ofcytoplasmic mRNAs in yeast (Tucker et al., 2001); and Dbf2p ismitotically active to ensure telophase to G1 phase transition(Toyn and Johnston, 1994). Similarly, Dbf20p performs severalDbf2p functions and is synthetically lethal with Dbf2p (Toynet al., 1991), so we assayed its role in regulation of SWI5 andCLB2 mRNA decay as well.By using an RNA immunoprecipitation assay and mitosis-
synchronized cells to enrich for the SWI5 and CLB2 expression,we detected specific and significant binding of TAP-taggedDbf2p to SWI5 and CLB2 mRNAs at levels similar to Pab1p-TAP, but not to ACT1 and DOA1 mRNAs (Figures 6A and 6B).Significant Dbf20p-TAP binding was detected only with CLB2mRNA. Furthermore, by using chromatin immunoprecipitation(ChIP), we detected significant enrichment of Dbf2p-TAP atSWI5 and CLB2 transcriptional units, which was also RNAdependent (Figures 6B, 6C, 6E, and S5A). Dbf2p-TAP bindingwas only detected in cells enriched in mitosis (red bars) andnot in S phase (black bars). This result was anticipated because,in S phase, transcription of SWI5 and CLB2 was infrequent(Figures 3E and 3F, red line), and thus the ChIP enrichmentwas not expected. Accordingly, the RNAPII ChIP in S phase cells
was only marginally higher relative to background, particularlyfor SWI5 (Figure S5B). Cotranscriptional binding of Dbf20p-TAP to SWI5 and CLB2 mRNAs could not be detected (Figures6B, 6D, and 6E), indicating that Dbf20p interacts with CLB2 aftertranscription is completed, possibly in the cytoplasm.Finally, we measured SWI5 and CLB2 mRNA stabilities in the
absence of Dbf2p and Dbf20p. Protein levels of either kinasesdo not fluctuate through the cell cycle (data not shown) (Visintinand Amon, 2001), and hence we speculated that Dbf2p orDbf20p could regulate either stable or unstable SWI5 andCLB2 mRNAs. Deletion of either of the kinases had no effecton the stability of ACT1mRNA (Figures S5C and S5D) but greatlyaffected the stability ofSWI5 andCLB2mRNAs, particularly priorto mitosis (Figures 6F–6I). Moreover, the regulation of mRNAstability by Dbf2p was independent of its kinase activity (FiguresS5E and S5F). The mRNA half-lives determined for these twomRNAs using thiolutin and qRT-PCR were kinetically inconsis-tent with the FISH measurements (Figures S5G–S5L). Thesediscrepancies are likely to have occurred due to toxic effectsthat thiolutin exerts on the physiology of a cell and on themRNA turnover (Jimenez et al., 1973; Pelechano and Perez-Ortın, 2008), thus artificially prolonging their mRNA stabilities.Additionally, both deletions prolonged the G2 to T/C length
of the cell cycle relative to the WT by 2- to 4-fold (FiguresS6A–S6D), consistent with the literature (Liu et al., 1997). Thus,cells spent a longer time expressing SWI5 and CLB2 with tran-scriptional amplitudes similar to the WT cells but without exces-sive accumulation of transcripts (red circles in Figures 6F–6I, 3E,and 3F). The measured reduced stabilities of SWI5 and CLB2 inDDBF2 and DDBF20 could not have been an artificial conse-quence of the redistribution of the transcripts over a longer cellcycle because the model accounted for the ongoing transcrip-tion. Thus, due to decreased stability of SWI5 and CLB2, cellswere estimated to synthesize up to three times more mRNAsto reach the WT levels (Figures S6E–S6H).These results imply that Dbf2p is recruited to SWI5 and CLB2
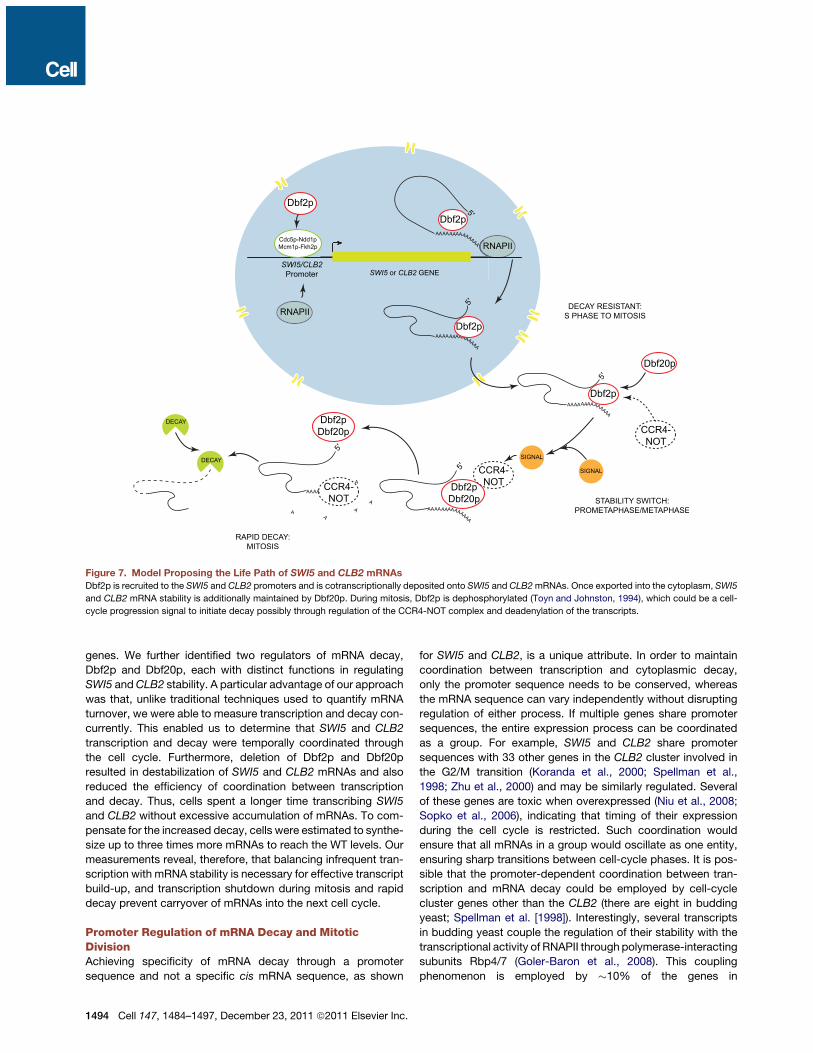
promoters and loaded onto SWI5 and CLB2 nascent chainscotranscriptionally. Dbf2p is then exported with the mRNAsinto the cytoplasm, where along with Dbf20p, it regulates thetiming of SWI5 and CLB2 decay (Figure 7). Dbf2p and Dbf20pthus coordinate between SWI5 and CLB2 transcription andmRNA decay and communicate the cell-cycle cues onto thedecay machinery to initiate the decay process.
DISCUSSION
Single-Cell, Single-Molecule mRNA DecayMeasurementsIn this work, we developed a single-cell, single-moleculeapproach that enabled us to characterize the kinetics of mRNAdecay with a high temporal resolution. This approach uncovereda unique promoter-dependent regulatory mechanism of mRNAdecay that could be employed by a variety of cell cycle-regulated
(G) SWI5 in DDBF20: T of 66 s, premitotic t1/2 = 7.1 min, and a mitotic t1/2 = 2.6 min (c2 = 18.9).
(H) CLB2 in DDBF2: T of 63 s, premitotic t1/2 = 4.4 min, and mitotic t1/2 = 3.4 min (c2 = 115.7).
(I) CLB2 in DDBF20: T of 63 s, premitotic t1/2 =7.8 min, and a mitotic t1/2 = 2.2 min (c2 = 40.3).
In all graphs, the x axis delineates duration of each cell-cycle phase (min). M includes P/M, ANA, and T/C. See also Figures S5and S6 .
Cell 147, 1484–1497, December 23, 2011 ª2011 Elsevier Inc. 1493
genes. We further identified two regulators of mRNA decay,Dbf2p and Dbf20p, each with distinct functions in regulatingSWI5 andCLB2 stability. A particular advantage of our approachwas that, unlike traditional techniques used to quantify mRNAturnover, we were able to measure transcription and decay con-currently. This enabled us to determine that SWI5 and CLB2transcription and decay were temporally coordinated throughthe cell cycle. Furthermore, deletion of Dbf2p and Dbf20presulted in destabilization of SWI5 and CLB2 mRNAs and alsoreduced the efficiency of coordination between transcriptionand decay. Thus, cells spent a longer time transcribing SWI5and CLB2 without excessive accumulation of mRNAs. To com-pensate for the increased decay, cells were estimated to synthe-size up to three times more mRNAs to reach the WT levels. Ourmeasurements reveal, therefore, that balancing infrequent tran-scription with mRNA stability is necessary for effective transcriptbuild-up, and transcription shutdown during mitosis and rapiddecay prevent carryover of mRNAs into the next cell cycle.
Promoter Regulation of mRNA Decay and MitoticDivisionAchieving specificity of mRNA decay through a promotersequence and not a specific cis mRNA sequence, as shown
for SWI5 and CLB2, is a unique attribute. In order to maintaincoordination between transcription and cytoplasmic decay,only the promoter sequence needs to be conserved, whereasthe mRNA sequence can vary independently without disruptingregulation of either process. If multiple genes share promotersequences, the entire expression process can be coordinatedas a group. For example, SWI5 and CLB2 share promotersequences with 33 other genes in the CLB2 cluster involved inthe G2/M transition (Koranda et al., 2000; Spellman et al.,1998; Zhu et al., 2000) and may be similarly regulated. Severalof these genes are toxic when overexpressed (Niu et al., 2008;Sopko et al., 2006), indicating that timing of their expressionduring the cell cycle is restricted. Such coordination wouldensure that all mRNAs in a group would oscillate as one entity,ensuring sharp transitions between cell-cycle phases. It is pos-sible that the promoter-dependent coordination between tran-scription and mRNA decay could be employed by cell-cyclecluster genes other than the CLB2 (there are eight in buddingyeast; Spellman et al. [1998]). Interestingly, several transcriptsin budding yeast couple the regulation of their stability with thetranscriptional activity of RNAPII through polymerase-interactingsubunits Rbp4/7 (Goler-Baron et al., 2008). This couplingphenomenon is employed by !10% of the genes in
Figure 7. Model Proposing the Life Path of SWI5 and CLB2 mRNAsDbf2p is recruited to the SWI5 and CLB2 promoters and is cotranscriptionally deposited onto SWI5 and CLB2mRNAs. Once exported into the cytoplasm, SWI5
and CLB2 mRNA stability is additionally maintained by Dbf20p. During mitosis, Dbf2p is dephosphorylated (Toyn and Johnston, 1994), which could be a cell-
cycle progression signal to initiate decay possibly through regulation of the CCR4-NOT complex and deadenylation of the transcripts.
1494 Cell 147, 1484–1497, December 23, 2011 ª2011 Elsevier Inc.
Saccharomyces cerevisiae and was shown to be preservedthrough evolution (Dori-Bachash et al., 2011). Thus, intriguingly,promoter-dependent regulation of mRNA stability could bea common strategy of control of mRNAs turnover in yeast andpossibly in a variety of eukaryotic cells.
SWI5 and CLB2 mRNA Life CycleWe propose a model whereby the regulation of cytoplasmicSWI5 andCLB2mRNAdecay begins concurrentlywith their tran-scription (Figure 7). To provide specificity of decay, independentof specific cis mRNAs sequences, the decay regulator must berecruited by SWI5 and CLB2 transcription factors to theirpromoters and deposited onto the mRNA during transcription.Possibly, the promoter recruits factors that influence a specificmRNA feature, such as the cap structure, the poly(A) tail, or theirassociated proteins. We identified Dbf2p kinase as a regulator ofSWI5 andCLB2 decay and found it associated with their mRNAsduring transcription.SWI5andCLB2areadditionally stabilizedbyDbf20p. Unlike Dbf2p, Dbf20p does not bind to SWI5 and CLB2cotranscriptionally and likely associates with mRNAs in the cyto-plasm.Our data indicate therefore that, despite being redundant,Dbf2p and Dbf20p have distinct functions in regulation of SWI5and CLB2mRNA stability, indicating that their roles in the decayprocess are complex and could involve multiple regulators.How Dbf2p becomes recruited to the promoters of SWI5 and
CLB2 and how the two kinases interact with the mRNAs is notclear. Interaction of Dbf2p with Cdc5p (Visintin and Amon,2001), a SWI5 and CLB2 transcription factor (Darieva et al.,2006), suggests a possible mechanism. Additionally, the mech-anism whereby Dbf2p and Dbf20p regulate mRNA stability isalso unknown. This regulation is independent of Dbf2p (andpresumably Dbf20p) kinase activity, which is triggered shortlyafter metaphase-to-anaphase transition to promote progressionfrom telophase to G1 phase (Toyn and Johnston, 1994). Theseresults are consistent with our findings that Dbf2p and Dbf20pstabilize SWI5 and CLB2 mRNAs prior to mitosis when theirkinase activity is low (Toyn and Johnston, 1994). Because theprometaphase/metaphase and anaphase are separated onlyby a couple of minutes, it is possible that insufficient time reso-lution duringmitosis obscured precisely when themRNA stabilityswitch occurs. Nevertheless, our data indicate that Dbf2p andDbf20p have two biologically distinct and mutually independentfunctions: one involved in regulation of mRNA stability describedhere and a better understood one involved in the regulation ofcompletion of mitosis as MEN regulators (Mah et al., 2001).Additionally, how Dbf2p and Dbf20p relay cell-cycle signals
onto the mRNA decay machinery to initiate decay remains tobe determined. Dbf2p is dephosphorylated during mitosis(Toyn and Johnston, 1994), and we speculate that this dephos-phorylation event could act as a cell-cycle signal, therebysynchronizing mRNA degradation and mitotic division. Intrigu-ingly, association of Dbf2p with the CCR4-NOT complexsuggests that regulation of decay could be manifested throughthe regulation of deadenylation, as determined for tristetraprolinprotein TTP. Dephosphorylation of TTP controls if and whenCCR4-NOT complex is able to gain access to the mRNA toinitiate decay (Clement et al., 2011; Sandler et al., 2011). Similarlyto TTP, Dbf2p and Dbf20p might regulate accessibility of CCR4-
NOT complex to the SWI5 and CLB2mRNAs in a dephosphory-lation-dependent but kinase activity-independent manner.Here, we show that the fate of the SWI5 and CLB2 mRNA is
determined cotranscriptionally at their birth. Thus, the decaymarker assembles on the mRNA and is exported with it intothe cytoplasm, priming the mRNAs for immediate decay oncea cell-cycle signal arrives. Furthermore, in budding yeast, tran-scriptional activity can directly determine how an mRNA willlocalize, translate, and degrade in the cytoplasm (Harel-Sharvitet al., 2010; Shen et al., 2010). Thus, we hypothesize that asubset of yeast mRNAs could become ‘‘fully functionally config-ured’’ during their synthesis. These mRNAs could exit thenucleus equipped with the regulatory proteins that would definetheir translation, localization, and decay, which would then be‘‘shed away’’ from an mRNA in a step-by-step manner aftereach completed step (Trcek and Singer, 2010). This model ofmRNP formation is quite different from the one generallyassumed for an mRNA, wherein proteins that regulate differentsteps in anmRNA life path interact with anmRNA only when theirfunction is needed (Balagopal and Parker, 2009). Our study maythus have far-reaching implications that will serve as a platformfor the analysis of mRNA decay and proteins that regulate it ina variety of mRNAs and organisms.
EXPERIMENTAL PROCEDURES
Yeast StrainsTable S3 and the Extended Experimental Procedures list yeast strains used
and their synchronization and growth conditions.
FISH Probes and ProcedurePer gene, three to seven probes were used, each labeled with > 90% labeling
efficiency (Table S1). Design, synthesis, and labeling of probes were per-
formed as described previously (Femino et al., 2003; Zenklusen et al., 2008).
ACT1mRNA was highly expressed, and therefore reliable counting of single
transcripts in a maximal projection as performed for SWI5 and CLB2 was not
possible. Instead, images were sum projected, and total fluorescent intensity
of ACT1 FISH signal for each cell was measured and presented as an average.
The summed fluorescent valueswere corrected for the autofluorescent cellular
background of the same cellular size from the control cells not hybridized with
ACT1 probes. The control cells were subjected to the same hybridization
procedure and imaged as ACT1 FISH cells only without the ACT1 probes.
Mathematical ModelThe number of transcriptsmeasured in a particular phase of the cell cycle is the
time-integrated average of the time-dependent solution (Equation 2) divided
by the length of that particular cell-cycle phase:
hNi=#
1
kTc
$%#m
kT" N0
$!e"kT " 1
"+
#mTc
T
$&(3)
where brackets denote the ensemble average over the population of cells in
a particular cell-cycle phase; Tc is the duration of that phase; and m, T, and
k are defined previously (Equation 2) as the number of nascent chains, the
dwell time, and the decay rate, respectively. The initial number of transcripts
N0 is determined by the number of transcripts present at the end of the
previous cell cycle stage:
N0i =N#Tci"1;mi"1; ki"1;T$ (4)
where i designates the cell-cycle phase. Thus, the initial number of transcripts
N0i is determined from the time-dependent solution N(t) (Equation 2) at a time
Cell 147, 1484–1497, December 23, 2011 ª2011 Elsevier Inc. 1495
Tc corresponding to the length of the previous cell-cycle phase, where the
kinetic values mi-1, ki-l, are also those of the previous cell-cycle phase. The
dwell time (T) of a nascent chain at the gene is determined by the parameters v
(RNAPII velocity) and l (transcript length) (see Tables S3 and S4). Equations 3
and 4 were used to model the data in Figures 3–6 and their supplemental data.
Table S4 summarizes the parameters used to model the FISH data. For WT
SWI5, CLB2, SWI5 with ACT1 50 and 30UTRs, and DOA1 expressed from the
SWI5 promoter, the mitotic decay was measured by fitting their cytoplasmic
mRNA abundances after anaphase onset to an exponential decay with a single
component. A slow decay was determined by calculating a global nonlinear
least-square fit to theN andmwith two floating parameters (T and a premitotic
decay rate), and the mitotic decay (from P/M to T/C) rate measured by FISH
was fixed.
For WT DOA1, SWI5 expressed from the ACT1 promoter, SWI5 with ACT1
50 and 30UTRs expressed from the ACT1 promoter, and CLB2 expressed
from the ACT1 promoter, the data with one free parameter (a single k) were
modeled. The velocity v of the RNAPII of 33 bp/s was assumed (Mason and
Struhl, 2005) to obtain the dwell time T of 68 s (WT DOA1), 72 s (SWI5 with
an ACT1 promoter), 70 s (SWI5 with ACT1 50 and 30UTRs expressed from
the ACT1 promoter), and 66 s (CLB2 with an ACT1 promoter).
For DDbf2 and DDbf20 deletions, for DOA1 mRNA expressed from a CLB2
promoter, and for the Dbf2p kinase dead experiment, the mitotic decay could
not be determined directly from their cytoplasmic mRNA profiles because, in
these strains, the mitotic phases were extended two to three times relative to
WT, and the addition of newmRNAsdue to ongoing transcriptionwas not negli-
gible. Here, the data were modeled with the fixed T of 66 s for SWI5, 63 s for
CLB2, and 77 s forDOA1 determined for theWT SWI5 andCLB2, respectively,
whereas the premitotic and mitotic decay rates were free parameters.
Identification of Dbf2p and Dbf20p as SWI5 and CLB2 DecayRegulatorsA bona fide regulator of SWI5 and CLB2 decay requires interaction with
their transcription factors, the mRNA decay regulators, and the cell-cycle
machinery to ensure coordination among the three. Cell cycle-dependent tran-
scription of SWI5 and CLB2 is regulated by four transcription factors (Ndd1p,
Fkh2p, Mcm1p, and Cdc5p), and their promoter binding positions have been
determined (Darieva et al., 2006; Koranda et al., 2000; Spellman et al., 1998;
Zhu et al., 2000). We reasoned that, because the stability of SWI5 and CLB2
is promoter specified, the mRNA decay regulator that we were searching for
has to be recruited to SWI5 and CLB2 promoters by one of their transcription
factors to ensure specificity of decay. This regulator, in turn, has to interact or
be a part of the mRNA decay machinery and the cell-cycle progression
machinery to further enable the coordination of decay through mitotic division.
In the search of this trans-acting factor, we made use of the Saccharomyces
genome database. Ndd1p, Fkh2p, Mcm1p, and Cdc5p each uniquely inter-
acted with 5, 14, 20, and 97 proteins, respectively. Dbf2p, a mitotic exit
network (MEN) kinase, was the only protein that satisfied our criterion; it inter-
acts with Cdc5p (Visintin and Amon, 2001), a SWI5 and CLB2 transcription
factor and itself a MEN regulator (Darieva et al., 2006). It is furthermore
a part of a larger 1.9 MDa CCR4-NOT complex (Liu et al., 1997), a major dead-
enylase of cytoplasmicmRNAs in yeast (Tucker et al., 2001), and it ismitotically
active to ensure telophase-to-G1 phase transition (Toyn and Johnston, 1994).
Dbf2p interacts with four out of nine proteins of the CCR4-NOT complex:
with Ccr4p, the catalytic subunit of CCR4-NOT complex with deadenylase
activity (Tucker et al., 2002); with Pop2p, Caf40p, and Caf36p, noncatalytic
subunits of CCR4-NOT complex; and also with Caf4p, a CCR4-NOT-associ-
ated protein; and with Cdc33p and Cdc20p, a 50 cap-binding protein and
a cap-associated protein. Dbf2p copurifies with all components of the
complex itself and coimmunoprecipitates with the Ccr4p and Pop2p proteins
(Liu et al., 1997). Additionally, DDBF2 results in similar phenotypes and tran-
scriptional defects to those observed in DCCR4 and DPOP2. Conversely,
DCCR4 and DPOP2 affected mitotic cell-cycle progression similar to that
observed for DDBF2, indicating that Ccr4p, Pop2p, and Dbf2p all participate
in regulating gene expression and cell-cycle progression during late mitosis
(Liu et al., 1997).
Dbf2p is synthetically lethal with Dbf20p, which is not known to interact with
the CCR4-NOT complex or Cdc5p like Dbf2p. During the cell cycle, however,
Dbf20p performs several Dbf2p functions (Toyn et al., 1991), so we assayed
the role of Dbf20p in regulation of SWI5 and CLB2 mRNA decay as well.
Apart from Dbf2p, SWI5 and CLB2 transcription factors displayed other
interactions—but either with the major mRNA decay regulators or cell-cycle
progression regulators and not both, thus making them unsuitable candidates.
For example,Mcm1p interactedwithArg81p, andCdc5p interactedwithCse4p
that, in turn, interacted with Dcp2p, a catalytic subunit of the Dcp1p-Dcp2p
decapping enzyme complex. Cdc5p also interacted with Mcd1p that, in turn,
interacted with Not5p, a subunit of the CCR4-NOT complex and with Nop13p
andPds5p that, in turn, interactedwithXrn1p,a5’-3’exonucleaseandacompo-
nent of cytoplasmic processing (P) bodies involved in mRNA decay.
Finally, apart from its role as a transcription factor, Cdc5p ismostly known as
a MEN regulator in promoting transition of cells from telophase into G1 phase
(Toyn and Johnston, 1994). It physically interacts with several MEN regulators,
for example, with Dbf2p. Unlike Dbf2p however, none of these regulators, in
turn, interact with the mRNA decay factors, making these proteins unsuitable
candidates involved in the regulation of SWI5 and CLB2 mRNA stability.
Unless cited, the protein descriptions were obtained from the Saccharo-
myces genome database.
Chromatin Immunoprecipitation and RNA Immunoprecipitation45 ml of cells were grown in YPD until OD600 !0.35. Cells were synchronized
in S or M phase with HU (see Extended Experimental Procedures). Chromatin
immunoprecipitation (ChIP) was performed as described in Moldon et al.
(2008) and Table S5. For RNase ChIP in mitotic cells, crosslinked extracts
were treated with DNase-free RNase (50 mg/ml, Roche) for 15min at 37%C prior
to sonication. RNA immunoprecipitation was performed as described in
Gilbert et al. (2004).
Measuring mRNA Decay Rates Using qRT-PCR and ThiolutinSee Table S6 and the accompanying text.
SUPPLEMENTAL INFORMATION
Supplemental Information includes Extended Experimental Procedures,
six figures, and six tables and can be found with this article online at doi:10.
1016/j.cell.2011.11.051.
ACKNOWLEDGMENTS
We would like to thank Drs. Jeffrey Chao and Kevin Czaplinski for helpful
discussion of the project and Xiuhua Meng for her help with cloning. We thank
Drs. Ian Willis, Michael Keogh, and Angelika Amon for sharing DSWI5 (TT012),
Pab1p-TAP (TT065) strains, and Dbf2p-kinase dead plasmid with us, respec-
tively. This work was supported by an EMBO fellowship awarded to A.M.,
GM57829 to C.C.Q., and GM57071 to R.H.S.
Received: December 6, 2010
Revised: July 27, 2011
Accepted: November 22, 2011
Published: December 22, 2011
REFERENCES
Ardehali, M.B., and Lis, J.T. (2009). Tracking rates of transcription and splicing
in vivo. Nat. Struct. Mol. Biol. 16, 1123–1124.
Balagopal, V., and Parker, R. (2009). Polysomes, P bodies and stress granules:
states and fates of eukaryotic mRNAs. Curr. Opin. Cell Biol. 21, 403–408.
Bean, J.M., Siggia, E.D., and Cross, F.R. (2006). Coherence and timing of cell
cycle start examined at single-cell resolution. Mol. Cell 21, 3–14.
Brewer, B.J., Chlebowicz-Sledziewska, E., and Fangman, W.L. (1984). Cell
cycle phases in the unequal mother/daughter cell cycles of Saccharomyces
cerevisiae. Mol. Cell. Biol. 4, 2529–2531.
Cai, T., Aulds, J., Gill, T., Cerio, M., and Schmitt, M.E. (2002). The Saccharo-
myces cerevisiae RNase mitochondrial RNA processing is critical for cell cycle
progression at the end of mitosis. Genetics 161, 1029–1042.
1496 Cell 147, 1484–1497, December 23, 2011 ª2011 Elsevier Inc.
Clement, S.L., Scheckel, C., Stoecklin, G., and Lykke-Andersen, J. (2011).
Phosphorylation of tristetraprolin by MK2 impairs AU-rich element mRNA
decay by preventing deadenylase recruitment. Mol. Cell. Biol. 31, 256–266.
Darieva, Z., Bulmer, R., Pic-Taylor, A., Doris, K.S., Geymonat, M., Sedgwick,
S.G., Morgan, B.A., and Sharrocks, A.D. (2006). Polo kinase controls cell-
cycle-dependent transcription by targeting a coactivator protein. Nature
444, 494–498.
Dori-Bachash, M., Shema, E., and Tirosh, I. (2011). Coupled evolution of tran-
scription and mRNA degradation. PLoS Biol. 9, e1001106.
Femino, A.M., Fay, F.S., Fogarty, K., and Singer, R.H. (1998). Visualization of
single RNA transcripts in situ. Science 280, 585–590.
Femino, A.M., Fogarty, K., Lifshitz, L.M., Carrington, W., and Singer, R.H.
(2003). Visualization of single molecules of mRNA in situ. Methods Enzymol.
361, 245–304.
Fitch, I., Dahmann, C., Surana, U., Amon, A., Nasmyth, K., Goetsch, L., Byers,
B., and Futcher, B. (1992). Characterization of four B-type cyclin genes of the
budding yeast Saccharomyces cerevisiae. Mol. Biol. Cell 3, 805–818.
Gilbert, C., Kristjuhan, A., Winkler, G.S., and Svejstrup, J.Q. (2004). Elongator
interactions with nascent mRNA revealed by RNA immunoprecipitation. Mol.
Cell 14, 457–464.
Gill, T., Cai, T., Aulds, J., Wierzbicki, S., and Schmitt, M.E. (2004). RNase MRP
cleaves the CLB2 mRNA to promote cell cycle progression: novel method of
mRNA degradation. Mol. Cell. Biol. 24, 945–953.
Goler-Baron, V., Selitrennik, M., Barkai, O., Haimovich, G., Lotan, R., and
Choder, M. (2008). Transcription in the nucleus and mRNA decay in the
cytoplasm are coupled processes. Genes Dev. 22, 2022–2027.
Grigull, J., Mnaimneh, S., Pootoolal, J., Robinson, M.D., and Hughes, T.R.
(2004). Genome-wide analysis of mRNA stability using transcription inhibitors
and microarrays reveals posttranscriptional control of ribosome biogenesis
factors. Mol. Cell. Biol. 24, 5534–5547.
Guhaniyogi, J., and Brewer, G. (2001). Regulation of mRNA stability in
mammalian cells. Gene 265, 11–23.
Harel-Sharvit, L., Eldad, N., Haimovich, G., Barkai, O., Duek, L., and Choder,
M. (2010). RNA polymerase II subunits link transcription and mRNA decay to
translation. Cell 143, 552–563.
Hartwell, L.H. (1974). Saccharomyces cerevisiae cell cycle. Bacteriol. Rev. 38,
164–198.
Holstege, F.C., Jennings, E.G., Wyrick, J.J., Lee, T.I., Hengartner, C.J., Green,
M.R., Golub, T.R., Lander, E.S., and Young, R.A. (1998). Dissecting the
regulatory circuitry of a eukaryotic genome. Cell 95, 717–728.
Jimenez, A., Tipper, D.J., and Davies, J. (1973). Mode of action of thiolutin, an
inhibitor of macromolecular synthesis in Saccharomyces cerevisiae. Antimi-
crob. Agents Chemother. 3, 729–738.
Koranda, M., Schleiffer, A., Endler, L., and Ammerer, G. (2000). Forkhead-like
transcription factors recruit Ndd1 to the chromatin of G2/M-specific
promoters. Nature 406, 94–98.
Larson, D.R., Johnson,M.C.,Webb,W.W., and Vogt, V.M. (2005). Visualization
of retrovirus budding with correlated light and electronmicroscopy. Proc. Natl.
Acad. Sci. USA 102, 15453–15458.
Larson, D.R., Zenklusen, D., Wu, B., Chao, J.A., and Singer, R.H. (2011). Real-
time observation of transcription initiation and elongation on an endogenous
yeast gene. Science 332, 475–478.
Liu, H.Y., Toyn, J.H., Chiang, Y.C., Draper, M.P., Johnston, L.H., and Denis,
C.L. (1997). DBF2, a cell cycle-regulated protein kinase, is physically and
functionally associated with the CCR4 transcriptional regulatory complex.
EMBO J. 16, 5289–5298.
Lord, P.G., and Wheals, A.E. (1980). Asymmetrical division of Saccharomyces
cerevisiae. J. Bacteriol. 142, 808–818.
Mah, A.S., Jang, J., and Deshaies, R.J. (2001). Protein kinase Cdc15 activates
the Dbf2-Mob1 kinase complex. Proc. Natl. Acad. Sci. USA 98, 7325–7330.
Marzluff, W.F., Wagner, E.J., and Duronio, R.J. (2008). Metabolism and regu-
lation of canonical histone mRNAs: life without a poly(A) tail. Nat. Rev. Genet.
9, 843–854.
Mason, P.B., and Struhl, K. (2005). Distinction and relationship between
elongation rate and processivity of RNA polymerase II in vivo. Mol. Cell 17,
831–840.
Moldon, A., Malapeira, J., Gabrielli, N., Gogol, M., Gomez-Escoda, B.,
Ivanova, T., Seidel, C., and Ayte, J. (2008). Promoter-driven splicing regulation
in fission yeast. Nature 455, 997–1000.
Niu, W., Li, Z., Zhan, W., Iyer, V.R., and Marcotte, E.M. (2008). Mechanisms of
cell cycle control revealed by a systematic and quantitative overexpression
screen in S. cerevisiae. PLoS Genet. 4, e1000120.
Osley, M.A. (1991). The regulation of histone synthesis in the cell cycle. Annu.
Rev. Biochem. 60, 827–861.
Passos, D.O., and Parker, R. (2008). Analysis of cytoplasmic mRNA decay in
Saccharomyces cerevisiae. Methods Enzymol. 448, 409–427.
Pelechano, V., and Perez-Ortın, J.E. (2008). The transcriptional inhibitor
thiolutin blocks mRNA degradation in yeast. Yeast 25, 85–92.
Sandler, H., Kreth, J., Timmers, H.T., and Stoecklin, G. (2011). Not1 mediates
recruitment of the deadenylase Caf1 to mRNAs targeted for degradation by
tristetraprolin. Nucleic Acids Res. 39, 4373–4386.
Shen, Z., St-Denis, A., and Chartrand, P. (2010). Cotranscriptional recruitment
of She2p by RNA pol II elongation factor Spt4-Spt5/DSIF promotes mRNA
localization to the yeast bud. Genes Dev. 24, 1914–1926.
Sopko, R., Huang, D., Preston, N., Chua, G., Papp, B., Kafadar, K., Snyder, M.,
Oliver, S.G., Cyert, M., Hughes, T.R., et al. (2006). Mapping pathways and
phenotypes by systematic gene overexpression. Mol. Cell 21, 319–330.
Spellman, P.T., Sherlock, G., Zhang, M.Q., Iyer, V.R., Anders, K., Eisen, M.B.,
Brown, P.O., Botstein, D., and Futcher, B. (1998). Comprehensive identifica-
tion of cell cycle-regulated genes of the yeast Saccharomyces cerevisiae by
microarray hybridization. Mol. Biol. Cell 9, 3273–3297.
Talarek, N., Cameroni, E., Jaquenoud, M., Luo, X., Bontron, S., Lippman, S.,
Devgan, G., Snyder, M., Broach, J.R., and De Virgilio, C. (2010). Initiation of
the TORC1-regulated G0 program requires Igo1/2, which license specific
mRNAs to evade degradation via the 50-30 mRNA decay pathway. Mol. Cell
38, 345–355.
Toyn, J.H., Araki, H., Sugino, A., and Johnston, L.H. (1991). The cell-cycle-
regulated budding yeast gene DBF2, encoding a putative protein kinase, has
a homologue that is not under cell-cycle control. Gene 104, 63–70.
Toyn, J.H., and Johnston, L.H. (1994). The Dbf2 and Dbf20 protein kinases of
budding yeast are activated after the metaphase to anaphase cell cycle tran-
sition. EMBO J. 13, 1103–1113.
Trcek, T., and Singer, R.H. (2010). The cytoplasmic fate of an mRNP is deter-
mined cotranscriptionally: exception or rule? Genes Dev. 24, 1827–1831.
Tucker, M., Valencia-Sanchez, M.A., Staples, R.R., Chen, J., Denis, C.L., and
Parker, R. (2001). The transcription factor associated Ccr4 and Caf1 proteins
are components of the major cytoplasmic mRNA deadenylase in Saccharo-
myces cerevisiae. Cell 104, 377–386.
Tucker, M., Staples, R.R., Valencia-Sanchez, M.A., Muhlrad, D., and Parker, R.
(2002). Ccr4p is the catalytic subunit of a Ccr4p/Pop2p/Notp mRNA deadeny-
lase complex in Saccharomyces cerevisiae. EMBO J. 21, 1427–1436.
Visintin, R., and Amon, A. (2001). Regulation of the mitotic exit protein kinases
Cdc15 and Dbf2. Mol. Biol. Cell 12, 2961–2974.
Wang, Y., Liu, C.L., Storey, J.D., Tibshirani, R.J., Herschlag, D., and Brown,
P.O. (2002). Precision and functional specificity in mRNA decay. Proc. Natl.
Acad. Sci. USA 99, 5860–5865.
Zenklusen, D., Larson, D.R., and Singer, R.H. (2008). Single-RNA counting
reveals alternative modes of gene expression in yeast. Nat. Struct. Mol. Biol.
15, 1263–1271.
Zhu, G., Spellman, P.T., Volpe, T., Brown, P.O., Botstein, D., Davis, T.N., and
Futcher, B. (2000). Two yeast forkhead genes regulate the cell cycle and pseu-
dohyphal growth. Nature 406, 90–94.
Cell 147, 1484–1497, December 23, 2011 ª2011 Elsevier Inc. 1497