singular value decomposition based algorithm for...
TRANSCRIPT

POD based algorithm for damage detection in composites Submitted to Mechanical Systems and Signal Processing
Proper Orthogonal Decomposition Based Algorithm for Detecting
Damage Location and Severity in Composite Plates
Conner Shane1 and Ratneshwar Jha*
Department of Mechanical and Aeronautical Engineering Clarkson University, Potsdam, New York 13699-5725
ABSTRACT: A damage detection algorithm based on the proper orthogonal
decomposition technique is presented for health monitoring of structures. The proper
orthogonal modes are employed as dynamical invariants to filter out the influence of
operational/environmental variations on the dynamic response of the structure. Finite
element model of a carbon/epoxy composite plate is used to generate vibration data for
healthy and damaged structures. Varying levels of stiffness reduction for the elements in
the damaged zone of the structure simulate impact damage. Three damage locations
(center of plate, fixed end, and free end) with three damage cases for each location are
investigated. Different random excitation inputs are used to introduce variations in the
loading conditions of the plate. The results show that the developed algorithm is capable
of detecting both location and severity of damages even under changing loading
conditions and with a high level of confidence.
Keywords: structural health monitoring, proper orthogonal decomposition, composite,
finite element analysis, damage severity
1. INTRODUCTION
High performance composite materials have seen increasing usage, especially in the
aerospace industry, over the last 30 years. The use of composite materials has many
benefits for aerospace structures including weight savings, smoother aerodynamic shape,
and a reduction in parts count. Other benefits include improved fatigue performance and
1 Currently with GE Global Research Center, Niskayuna, NY * Corresponding author. E-mail: [email protected] (R. Jha), Phone: (315) 268-7686, Fax: (315) 268-6695
1

POD based algorithm for damage detection in composites Submitted to Mechanical Systems and Signal Processing
higher resistance to corrosion. However, the damage mechanisms of composites are very
different from those of metals. Loading, impact, or manufacturing defects can initiate
delaminations and crack lengths can reach a critical size before they can be detected
visually. An on-board structural health monitoring (SHM) system is therefore proposed
for composite airframes which can inspect the structure continuously and provide the
operator with up-to-date information about its health. Such a system would allow
designers to relax the conservative designs and take full advantage of the benefits of
composite materials. An SHM system would also allow operators to abandon schedule
based maintenance and adopt a much more efficient condition-based maintenance.
The basic premise of an SHM system is that damage alters stiffness, mass or damping
of a structure and in turn causes a change in its dynamic response. The complete health
state of a structure can be determined based on presence, location, type and severity of
damage (diagnostics) and estimation of remaining useful life (prognostics). An extensive
review of SHM methods was presented by Doebling et al. (1998) and Sohn et al. (2003).
Montalvo et al. (2006) have reviewed vibration based SHM methods with emphasis on
composite materials. The proceedings of the structural health monitoring conferences
(Uhl, et al., 2008; Chang, 2007) contain hundreds of papers dealing with advancements in
SHM. Most of the vibration based methods use modal properties (natural frequency,
mode shapes, curvature of mode shapes, modal strain energy, etc.) of a structure for
damage detection. Another class of methods is based on time series or frequency-time
analysis of data (such as auto-regressive models, signal processing using wavelet or
Hilbert-Huang transform, etc.).
Since most of damage detection methods use structural responses directly, variations
in the operational and/or environmental conditions may mask the changes in the dynamic
response caused by structural damage. A methodology is needed to distinguish between
variations in the dynamic response caused by damage and those due to changes in
operational and/or environmental conditions. A physics-based model may be employed to
predict response of healthy (baseline) structure over its operational range under various
environmental conditions; however, reliable physics-based models are often very difficult
or impossible to obtain for complex structures. A data-driven model may be created
through experimental measurements of the baseline structure, but a very large database
2

POD based algorithm for damage detection in composites Submitted to Mechanical Systems and Signal Processing
would be needed to create a model valid under various operational and environmental
conditions
The current research uses the concept of dynamical invariants of a system for damage
detection. The dynamic response of a system is based on the geometric and material
properties as well as loading and environmental conditions. Dynamical invariants are
parameters of the system that are only influenced by changes in the geometric and
material properties of the system, that is, damage. If these dynamical invariants can be
determined and tracked, then changes to these parameters would serve as damage
indicators. The concept of dynamical invariants was used by Park et al. (2002) in the
SHM methodology called Beacon-based Exception Analysis for Multi-Missions (BEAM).
In the BEAM methodology, the auto-regressive (AR) model coefficients were
successfully used as dynamical invariants to predict abnormalities in data taken from the
Space Shuttle Main Engine (Park et al., 2002).
Proper orthogonal decomposition (POD) method is a very well known and often used
procedure in multivariate analysis in several disciplines (fluid dynamics, signal
processing, image analysis, etc.) to create approximate low-dimensional models from
numerical or experimental data of complex processes (Holmes, Lumley and Berkooz,
1996). POD involves two steps, namely extraction of basis functions or proper orthogonal
modes (POM) and the Galerkin projection of basis functions to obtain a low-dimensional
dynamical model. The POMs constitute a set of optimal basis functions with respect to
energy content of the signal. That is, among all possible decompositions of a random
field, POD captures most energy of the process for a given number of modes or basis
functions (Kerschen and Golinval, 2002; Kerschen et al., 2005). The reader is referred to
Lanata and Del Grosso (2006) for a brief review of POD and related techniques,
including Singular Value Decomposition (SVD) which is a discrete realization of the
POD.
Park and Zak (2004) showed that stable low-order dynamical models can be created
using POD even in the presence of noise and employed POD based low-order model for
fault detection. It is suggested that POMs (basis functions in POD/SVD) are dynamical
invariants of a system and therefore may be used for the development of an SHM
algorithm. While there is no a priori physical meaning behind the POMs, it has been
3

POD based algorithm for damage detection in composites Submitted to Mechanical Systems and Signal Processing
shown that for free or lightly damped vibrations, SVD provides a good approximation of
eigenmodes of the physical system (Kerschen and Golinval, 2002). Although POD has
been used extensively in several areas, its application for SHM has been rather limited.
Ruotolo and Surace (1999) investigated SVD for damage detection by comparing
current sensor data to a subspace spanned by measurements taken from the healthy
structure with varying operational and environmental conditions. Once the distance
between the current data and the healthy subspace exceeds a defined level, the data is
termed damaged or anomalous. Variations of this method were used with success by
Vanlanduit et al. (2005) to detect damage using both numerical and experimental data.
They used an aluminum beam with different damage scenarios such as saw cut and
fatigue crack and performed damage detection under several conditions (different beams
with small dimensional changes, beams covered with damping material and different
operating levels). Lanata and Del Grosso (2006) employed POD for damage detection of
a bridge structure based on computer simulations of static displacement/strain data.
Galvanetto and Violaris (2007) used finite element analysis of beams and showed success
in damage detection using POD. Damage is revealed by a sudden change in the slope of
the curve showing the value of ∆POM, the difference between the values of the dominant
POM of the undamaged and damaged structures.
This paper presents the development and application of a POD based algorithm (with
POM as dynamical invariants) for detecting presence, location, and severity of damages.
The POD model is used to filter out the influence of changing loading conditions on the
dynamic response of the structure leaving only the change caused by the presence of
damage. Finite element analysis using a commercial code (ANSYS) is employed to
obtain dynamic responses for various transient excitations. Three damage locations with
three severity levels for each location are investigated. The excitation consists of a
superposition of two harmonics (the first two bending natural frequencies) and a white
noise whose amplitude is set at 25% of the amplitude of the combined harmonics. Fifteen
excitation files, each with a unique white noise frequency spectrum, are used to excite the
healthy and damaged plates to simulate operational variability. This study paves the way
for application of the algorithm to experimental data.
4

POD based algorithm for damage detection in composites Submitted to Mechanical Systems and Signal Processing
2. PROPER ORTHOGONAL DECOMPOSITION (POD)
The goal of POD process is to extract a set of basis functions from the dynamic
response of a system that is varying in both space and time. Essentially, in terms of
structural dynamics, the POD is a way to uncouple the spatial and temporal content
contained in the dynamic response of the system. POD method allows a high-
dimensioned process to be very accurately described by a low-dimensioned model, thus
allowing a large amount of data to be processed and modeled easily. A dynamical system
can be approximated using a set of corresponding time-functions and spatial functions as
follows (Chatterjee, 2000).
(1)
M
kkk xtatxz
1
)()(),(
This approximation becomes exact as the number of corresponding functions, M,
approaches infinity. The spatial functions ( )k x are termed proper orthogonal modes and
can be used to establish a reduced-order model of the system. The representation of a
dynamical system in Equation 1 is not unique to the POD method. The basis functions
can be represented as a Fourier series, Legendre polynomials, or Chebyshev polynomials
(Chatterjee, 2000). Based on the choice of basis functions ( )k x , a set of corresponding
time functions can be obtained to provide a suitable representation of z(x, t).
However, POD provides an optimal set of basis functions (POMs) for a given number of
modes. Another benefit of POD is that it is applicable to nonlinear cases as well;
however, optimality exists for linear systems only (Kerschen and Golinval, 2002).
( )ka t
In the current study, discrete packets of sensor data were analyzed using the Singular
Value Decomposition (SVD) which is a discrete realization of POD. Using the SVD a
packet of sensor data A (an m x n matrix of data, m samples in time of n different
measurements) can be decomposed as
TA U V (2)
where U and V are orthogonal matrices (m x n and n x n respectively), and is a
diagonal matrix. The columns of the orthogonal matrix V are the computed POMs,
written as v. The diagonal matrix is termed the singular matrix whose elements (along
the diagonal) are non-negative numbers, called the singular values, arranged in
5

POD based algorithm for damage detection in composites Submitted to Mechanical Systems and Signal Processing
decreasing order. These singular values each correspond to a single basis function, v, and
represent the level of ‘energy’ present in each mode. A major benefit of using the
POD/SVD methodology is that data contained in the columns of A do not have to be
consistent, that is, strain, velocity, acceleration, pressure, force, etc. can all be analyzed
together as part of the same data matrix. This makes it very attractive in terms of the use
of an integrated health monitoring system; one central system can be used to monitor an
entire complex structure.
The matrices U and can be multiplied to form a matrix Q and Equation (2) can be
re-written as
(3) 1
mT
k kk
A QV q v
T
where qk and vk are column matrices that represent the functions ak (t) and k (x) ,
respectively. The basis functions vk are the dynamical invariants of the system. The
matrix Q, obtained through multiplication of the left orthogonal matrix U and , is
termed the temporal matrix, whose columns are the computed time functions. The
singular values can be used to derive a lower order model by establishing a reduced order
matrix, , that contains the first p singular values with the rest of the diagonal entries
set to zero. The model order p can be set to capture the desired percentage of total
‘energy’ in the system.
qk
red
3. DAMAGE DETECTION ALGORITHM
A damage detection algorithm was developed in this study based on the POD/SVD
decomposition of data. Two healthy (baseline) databases of the structural responses (at 25
sensor locations as shown later) are generated using five different excitation files for
each. The SVD is computed (and the components are saved) using data in the first
healthy database. Then the data in the second healthy database are used to compute the
residual error using the current time functions and corresponding healthy POMs from the
first database. Once the level of residual error for healthy data is established, an
‘unknown’ case (damaged or healthy structure) can be analyzed and if the residual error
is significantly higher than in the healthy case the data can be said to be anomalous and
6

POD based algorithm for damage detection in composites Submitted to Mechanical Systems and Signal Processing
the structure damaged. The detailed steps of the damage detection algorithm are as
follows.
Identify Healthy Mode Shapes (POMs)
1) Arrange sensor data in an m x n matrix with each column representing time-series data
of an individual sensor. Subtract mean from each column, ai (where i ranges from 1 to n),
in the first healthy database.
ˆii i aa a (4)
For simplicity, the columns of data with the mean subtracted, , and the matrices they
comprise,
a
A , are denoted a and A, respectively. There are five (excitation/response) data
files for first healthy database, giving matrices jA where j = 1, 2, 3, 4, 5.
2) Compute SVD for A matrix and save its components ( denotes first healthy
database).
[1]H
(5) [1] [1] [1] [1]T
H H H HA U V
[1] [1] [1]H H HQ U (6)
Establish Residual Error for Healthy Data
3) Subtract mean from sensor data (see step 1 above) and compute SVD for data files in
the second healthy database.
(7) [2] [2] [2] [2]T
H H H HA U V
[2] [2] [2]H H HQ U (8)
4) For each time function in the second healthy database, find closest time function
in the first healthy database by minimizing
[2]HQ
j , where j = 1, .., 5. The POM corresponding
to the closest time function is denoted . [1cH
V ]
(9) [2] [1]
2
jj H H
Q Q
7

POD based algorithm for damage detection in composites Submitted to Mechanical Systems and Signal Processing
5) Define reduced order singular value matrix red by replacing the singular values on
the diagonal with zeros after the first p diagonal elements, where p is the reduced model
order. Calculate reduced order time function Q and the corresponding model . red
[2]red redHQ U (10)
(11) [2]T
red HQ V
6) Compute model filter using reduced order time function and the closest POM
from the first databaseV .
cA
[1]cH
redQ
[1]c
c red HA Q V (12)
7) Compute residual error matrix R by subtracting model filter from model . Then
compute standard deviation of the columns of
cA
R and find its average value k .
cR A (13)
1
1i
n
kin r
(14)
8) Repeat steps 3-7 for each data file in second healthy database, saving standard
deviations k , where k ranges from 1 to total number of files in second healthy database
(set to 5 in this study).
9) Compute average of k giving a measure of residual error for healthy data files.
1
1 k
Hkk k
(15)
Test Unknown Data
10) Follow steps 3-7 above using an ‘unknown’ (damaged or undamaged) data file
instead of data from the second healthy database and obtain u (similar to k in step 7).
11) Compute Damage Index (DI) defined as the ratio of u and H . A DI value much
larger than unity is considered a strong indication of damage.
8
POD based algorithm for damage detection in composites Submitted to Mechanical Systems and Signal Processing
u
H
DI
(16)
4. NUMERICAL MODEL
To test the ability of the damage detection algorithm to predict and localize damage,
finite element (FE) model of a carbon-fiber epoxy plate was developed using ANSYS.
The FE model was used to simulate the dynamic response of the plate with changing
loading conditions for healthy and damaged cases. The AS4/3501-6 carbon/epoxy
composite plate is 25 mm long, 12.5 mm wide, and 0.20 mm thick. The lay-up consists of
symmetric cross-ply arrangement using 8 plies, that is, [0/90]2s. The plate was modeled
using 1056 solid-layered elements that allowed the user to define ply orientations used.
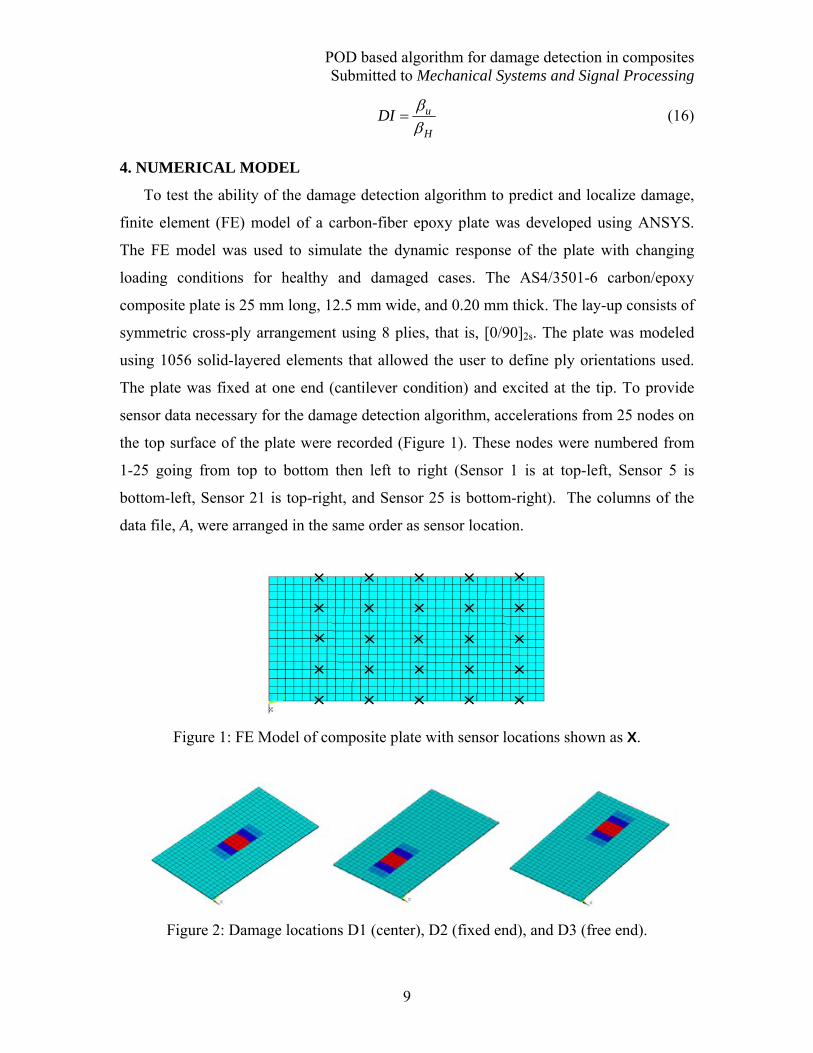
The plate was fixed at one end (cantilever condition) and excited at the tip. To provide
sensor data necessary for the damage detection algorithm, accelerations from 25 nodes on
the top surface of the plate were recorded (Figure 1). These nodes were numbered from
1-25 going from top to bottom then left to right (Sensor 1 is at top-left, Sensor 5 is
bottom-left, Sensor 21 is top-right, and Sensor 25 is bottom-right). The columns of the
data file, A, were arranged in the same order as sensor location.
Figure 1: FE Model of composite plate with sensor locations shown as X.
Figure 2: Damage locations D1 (center), D2 (fixed end), and D3 (free end).
9

POD based algorithm for damage detection in composites Submitted to Mechanical Systems and Signal Processing
Impact damage of the plate was simulated by reducing the stiffness of selected
elements by varying amounts. The largest damage (level 1) consists of 60% stiffness
reduction at the center of damage region followed by 40% reduction and then 20%
reduction (along length of the plate). Three different damage locations were studied,
namely, center of the plate (D1), near fixed end (D2), and near tip (D3), as shown in
Figure 2. A modal analysis was performed to determine the natural frequencies of the
healthy plate and damage cases D1, D2, and D3. As observed from Table 1, these
damage cases show less than four percent reduction in the frequencies of the first two
bending modes.
Table 1: Natural frequencies for healthy and damaged plates
Six additional damage models were created simulating lower levels of damage to
ascertain the capability of developed algorithm to predict damage severity. Damage
models D4-D6 (damage level 2) have damaged areas equal to D1-D3, respectively, but
the stiffness reductions are half of damage Level 1 (that is, 30-20-10% stiffness loss).
Damage models D7-D9 (damage level 3) have the same stiffness reductions as D1-D3,
but damaged areas equal half of damage level 1 (Figure 3). Damage levels 2 and 3 have
very similar extent of damage, but they are designated differently to distinguish between
decreased damaged areas (level 3) and reduced stiffness (level 2) compared to level 1.
Figure 3: Damage models D7, D8, and D9 (left to right) with half the areas of D1-D3.
10

POD based algorithm for damage detection in composites Submitted to Mechanical Systems and Signal Processing
5. RESULTS AND DISCUSSIONS
A superposition of the first two bending frequencies of the healthy plate (28.5 and
179.1 Hz) plus white noise (having 25% magnitude of superposed excitation) was used to
excite the plate at its tip. The input signal was adjusted such that maximum plate
vibrations are within ±1.5g. Fifteen excitation files (with unique white noise frequency
spectrum) were used to excite the healthy and damaged cases. Figure 4 shows a portion
of excitation files 1 and 2 wherein the small differences are only due to white noise
frequencies. Excitation files 1-15 were used to generate ten healthy response files needed
for the healthy database (used for steps 1-9 in the algorithm) and five healthy ‘unknown’
files (used for steps 10-11). Excitation files 1-5 and 11-15 were used to generate damaged
(‘unknown’) data files for each of the nine damage cases (D1-D9).
Figure 4: Input signal voltage: excitation 1 (blue-solid) and excitation 2 (red–dashes).
Figure 5 shows that accelerations of sensor 13 (located in the center of damage D1) are
almost identical for healthy and damaged cases. As is well known, direct observations of
time series data do not indicate damage (generally), which necessitates the development
of damage detection algorithms. The present algorithm is based on SVD, hence singular
values were examined first to determine energy in each mode and the number of modes
needed to establish an accurate reduced order model. The acceleration response of the
plate is recorded at 25 locations (Figure 1), meaning that there are 25 time-series data for
each case (healthy, damage D1, etc.). It is observed from Figure 6 that the first four
11

POD based algorithm for damage detection in composites Submitted to Mechanical Systems and Signal Processing
singular values contain almost all of the energy in the system for both healthy and
damaged case (singular values for damage D1 only are shown since other damages show
similar results). Modes 5-25 contain very low levels of energy which is at the noise level
and these modes do not influence the dynamic response significantly. The singular values
do not vary much between healthy and damaged cases, indicating that the singular values
alone are unable to predict damage. The number of dominant modes is the same for all
cases (healthy or damaged); therefore, the same model order can be used without
introducing much error in the model.
Figure 5: Accelerations at sensor 13 for healthy (blue) and damaged (red) plates.
12

POD based algorithm for damage detection in composites Submitted to Mechanical Systems and Signal Processing
Figure 6: Singular values for healthy (data H-1 to H-5; blue-circles) and damaged (data
D1-1 to D1-5; red-+) cases.
Figure 7: Comparison of POM #1 for healthy (data H-1 to H-5; blue-circles) and
damaged (data D1-1 to D1-5; red-+) cases.
Figure 8: Comparison of POM #2 for healthy (data H-1 to H-5; blue-circles) and
damaged (data D1-1 to D1-5; red-+) cases.
13

POD based algorithm for damage detection in composites Submitted to Mechanical Systems and Signal Processing
The extracted proper orthogonal modes were examined to see if they behave as
dynamical invariants, which is an assumption for the damage detection algorithm
developed in this paper. Essentially, the POMs should not be influenced by the changing
excitation files (environmental/operational conditions); however, there should be
differences between the POMs extracted from healthy and damaged models. The results
shown in Figures 7 and 8 validate the assumption since there is no noticeable variation
among POMs extracted from different data files for the same case (healthy or damaged).
The POMs for healthy and damaged cases are nearly same for Mode 1, but significant
difference is observed for Mode 2.
To apply the damage detection algorithm, excitation files 1-5 wre used to generate the
first healthy database and files 6-10 are used for the second healthy database. The
reduced model order was selected as 4 by examining the singular values (Figure 6). For
each data file, a contour plot was generated using the DI values at the 25 sensor locations
to provide an image of the damaged elements of the plate. The maximum DI value for the
healthy case is less than unity. In the case of damaged model D1, the maximum DI value
ranges from 2517 to 2520 for D1-1 to D1-5 (corresponding to excitation files 1-5). Figure
9 shows DI contour plot for D1-1 clearly indicating that the damaged area predicted by
the algorithm is centered where the damage actually exists on the plate. The figure shows
a wider damaged area than actually exists, but the damage index is much higher in the
center of damage. To show that the damage detection algorithm works with
operational/environmental variations, DI values were also obtained using excitation files
11 to 15, which contained forcing functions not used for the healthy database. The DI
contour plot for D1-11 is given in Figure 10, which is very similar to that of Figure 9,
indicating that the variations in excitation of the plate do not influence the ability of the
algorithm to predict damage. The contour plots for data files D1-2 through D1-5 and D1-
12 through D1-15 are very similar to those in Figure 9 and Figure 10.
14

POD based algorithm for damage detection in composites Submitted to Mechanical Systems and Signal Processing
Fig. 9: Damage index contour plot for damage location D1 (center) using data file D1-1
Fig. 10: Damage index contour plot for damage location D1 (center) using data file D1-11
In order to ascertain if the damage detection algorithm can predict the location of
damage when the damaged elements are moved away from the center of the plate, two
additional damage locations were investigated. For the damage location close to the fixed
end, data files D2-1 through D2-5 and D2-11 through D2-15 were processed. All the
contour plots are very similar to that shown in Figure 11 which correctly identifies
damage location. Similarly, for damage near free end of the plate (D3), the contour plot
indicates damage location correctly (Figure 12). Thus the developed algorithm is capable
of locating damage anywhere in the plate, even though maximum DI value reduces as
damage moves away from center of the plate.
15

POD based algorithm for damage detection in composites Submitted to Mechanical Systems and Signal Processing
Figure 11: Damage index contour plot for damage location D2 (fixed end) using data file D2-2
Fig. 12: Damage index contour plot for damage location D3 (free end) using data file D3-1
The identification of damage severity is crucial for predicting remaining useful life
(prognostics) of a structure. Along with the three damage cases (D1, D2 and D3)
discussed earlier, six additional damage cases were investigated. Damage models D4, D5
and D6 have the same damage areas as D1, D2 and D3, respectively, but the stiffness
reductions are halved. Damage models D7 to D9 have the same stiffness as D1 to D3, but
the number of damaged elements is halved. The results presented in Figures 13-15
indicate that the developed algorithm is capable of predicting the severity of damage
accurately. For damages in the center of the plate, the DI values are largest for case D1
(Figure 13) which has the largest damage area as well as damage level (stiffness
16

POD based algorithm for damage detection in composites Submitted to Mechanical Systems and Signal Processing
reduction). The maximum DI values for D4 and D7 (wherein damage level or damage
areas are halved) are about half of those for damage D1. This indicates that the algorithm
presented is very sensitive to changes in damage extent or severity. Another interesting
result is that the maximum DI values for different runs (that is, using different excitation
files) of any particular damage case are remarkably close. The maximum values for
damage files D1-1 to D1-5 are 2517 to 2520 and for D1-11 to D1-15 the range is 2515 to
2524. These results show that the developed method is able to perform well under
varying operational conditions. Similar results are obtained for the other two damage
locations as shown in Figures 14-15.
Fig. 13: Maximum DI values for healthy and damaged cases in location 1(plate center).
17

POD based algorithm for damage detection in composites Submitted to Mechanical Systems and Signal Processing
Figure 14: Maximum DI values for healthy and damaged cases in location 2 (fixed end).
Figure 15: Maximum DI values for healthy and damaged cases in location 3 (free end).
18

POD based algorithm for damage detection in composites Submitted to Mechanical Systems and Signal Processing
6. CONCLUSIONS
This numerical study has presented the use of proper orthogonal modes as dynamical
invariants for structural health monitoring. A finite element model of a carbon/epoxy
composite plate was created for healthy and damaged cases. Impact damage was
simulated through varying levels of stiffness reduction in the damaged area. Nine
different damage cases were investigated which included three damage locations (center
of plate, fixed end, and free end) with three type of damage at each location. Input
excitations included superposition of the first two bending mode frequencies (healthy
plate) and white noise with 25% amplitude to simulate variable loading conditions. The
results have clearly shown that the developed algorithm is capable of predicting damage
presence, location, and severity, even under changing loading conditions, with a high
level of confidence. This study paves the way for experimental implementation of the
POD based algorithm for SHM of composite structures.
REFERENCES
Chang, F-K (2007). “Structural Health Monitoring 2007 – Quantification, Validation, and
Implementation,” The 6th International Workshop on Structural Health Monitoring,
Stanford University, Stanford, CA.
Chatterjee, A., “An introduction to the proper orthogonal decomposition,” Current
Science, vol. 78, no. 7, April 2000.
Doebling, S.W., Farrar, C.R. and Prime, M.B. (1998). “A Summary Review of Vibration-
Based Damage Identification Methods,” The Shock and Vibration Digest, 30(2), pp. 91–
105.
Galvanetto, U., and Violaris, G., “Numerical investigation of a new damage detection
method based on proper orthogonal decomposition,” Mechanical Systems and Signal
Processing, Vol. 21, 2007, pp. 1346-1361.
Holmes, P., Lumley, J. L., and Berkooz, G., Turbulence, Coherent Structures, Dynamical
Systems and Symmetry, Cambridge University Press, 1996.
Kerschen G, Golinval J C, Vakasis A F and Bergman L A, “The method of proper
orthogonal decomposition for dynamical characterization and order reduction of
mechanical systems: an overview,” Nonlinear Dynamics, 41, 2005, pp. 147–69
19

POD based algorithm for damage detection in composites Submitted to Mechanical Systems and Signal Processing
20
Kerschen, G. and Golinval, J.C., “Physical Interpretation of the Proper Orthogonal
Modes Using the Singular Value Decomposition,” Journal of Sound and Vibration,
249(5), 2002, pp. 849-865.
Lanata, F. and Del Grosso, A., “Damage detection and localization for continuous static
monitoring of structures using a proper orthogonal decompositon of signals,” Smart
Materials and Structures, Vol. 15, 2006, pp. 1811–1829.
Montalvao, D., Maia, N. M. M., and Ribeiro, A. M. R., “A Review of Vibration based
Structural Health Monitoring with Special Emphasis on Composite Materials,” Shock and
Vibration Digest, Vol. 38, No. 4, July 2006.
Park, H., and Zak, M., “Model Reconstruction using POD Method for Gray-box Fault
Detection” IEEE Aerospace Conference, Big Sky, MT, 2004.
Park, H., Mackey, R., James, M., Zak, M., Kynard, M., Sebghati, J., and Greene, W.,
“Analysis of Space Shuttle Main Engine Data Using Beacon-based Exception Analysis
for Multi-Missions,” IEEE Aerospace Conference, Big Sky, MT, 2002.
Ruotolo, R., and Surace, C. “Using SVD to Detect Damage in Structures with Different
Operational Conditions.” Journal of Sound and Vibration, vol. 226, no. 3, 1999.
Sohn, H., Farrar, C. R., Hemez, F. M., Shunk, D. D., Stinemates, D. W., and Nadler, B.
R. (2003). “A Review of Structural Health Monitoring Literature: 1996–2001,” Los
Alamos National Laboratory Report, LA-13976-MS.
Uhl, T., Ostachowicz, W, and Holnicki-Szulc, J. (ed) (2008). Structural Health
Monitoring 2008: Proceedings of the Fourth European Workshop, Kracow, Poland, July
2-4, 2008.
Vanlanduit, S., Parloo, E., Cauberghe, B., Guillaume, P., and Verboven, P., “A robust
singular value decomposition for damage detection under changing operating conditions
and structural uncertainties.” Journal of Sound and Vibration, vol. 284, pp. 1033-1050,
2005.