sinking budgets sinking ships sinking csu? debbie brothwell deputy vice president csu east bay june...
Post on 19-Dec-2015
221 views
TRANSCRIPT
Sinking Budgets Sinking Ships Sinking CSU?
Debbie BrothwellDeputy Vice PresidentCSU East Bay
June 2011 1ARC - San Diego 2011

AgendaCurrent Budget Situation
◦May ReviseHistorical Budget DataHow much funding do we need?What does the future hold?
June 2011 2ARC - San Diego 2011
3June 2011
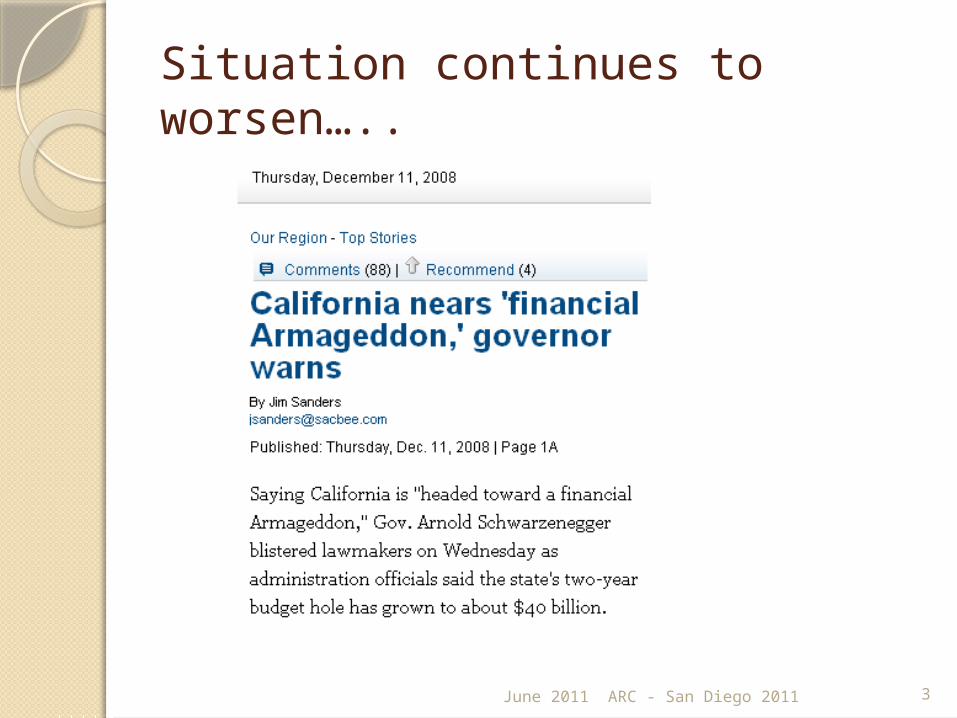
Situation continues to worsen…..
ARC - San Diego 2011
Current Budget Situation
May ReviseMay 16, 2011
June 2011 ARC - San Diego 2011 4
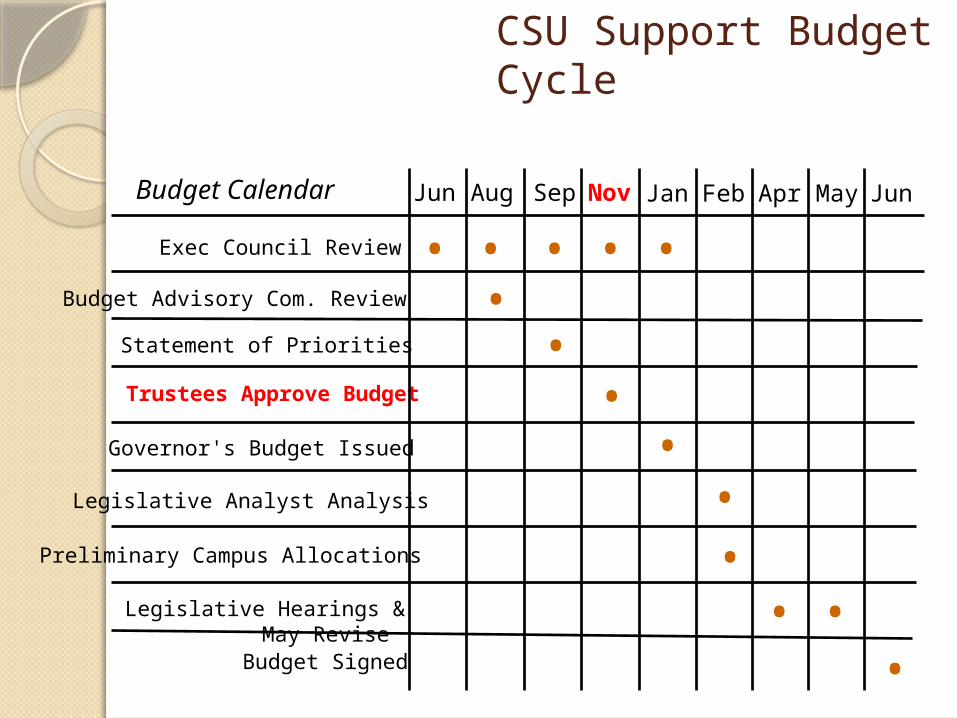
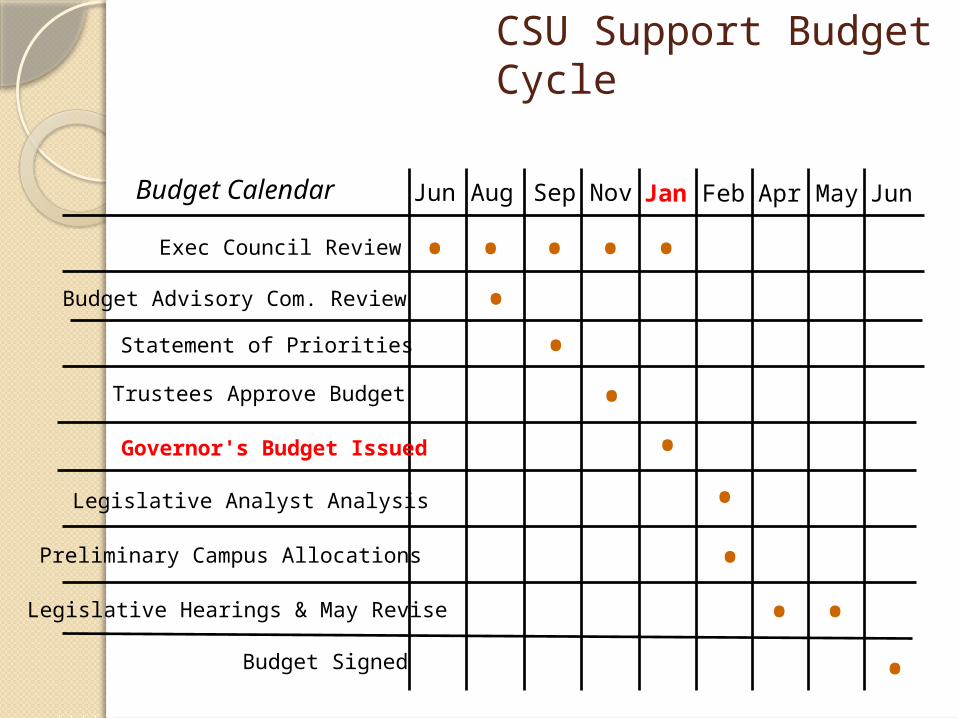
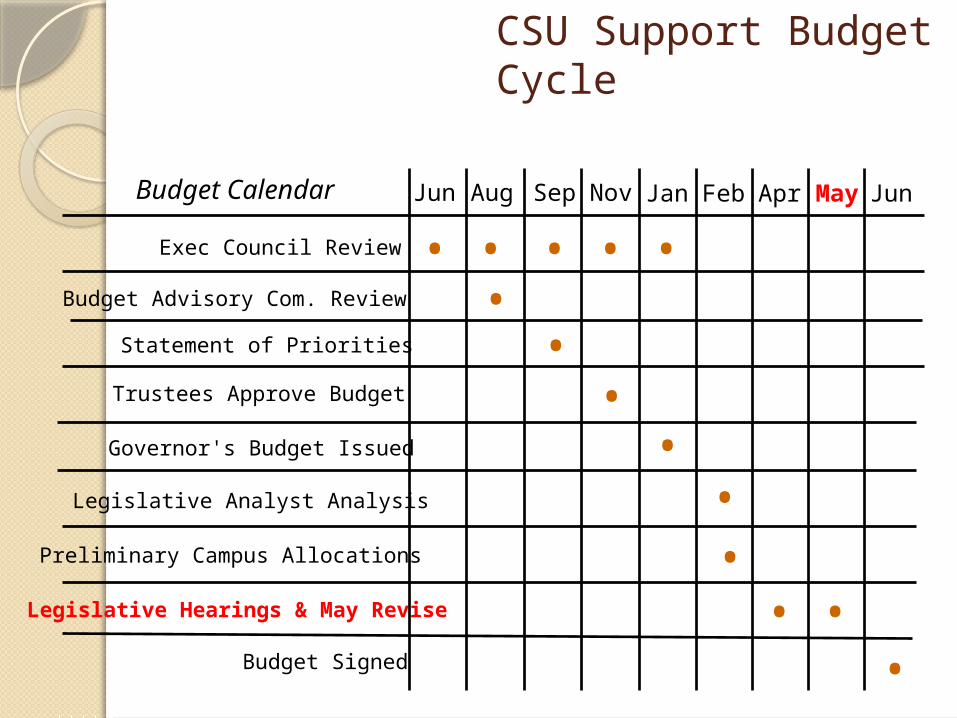
CSU Support Budget Cycle
Jun
Statement of Priorities
•
Trustees Approve Budget
Legislative Analyst Analysis
Legislative Hearings & May Revise
Budget Calendar Jan FebAug Sep
Exec Council Review • •
Governor's Budget Issued
•
Nov
••
Preliminary Campus Allocations
••
Apr
•Budget Signed •
Jun
• •May
•
Budget Advisory Com. Review •
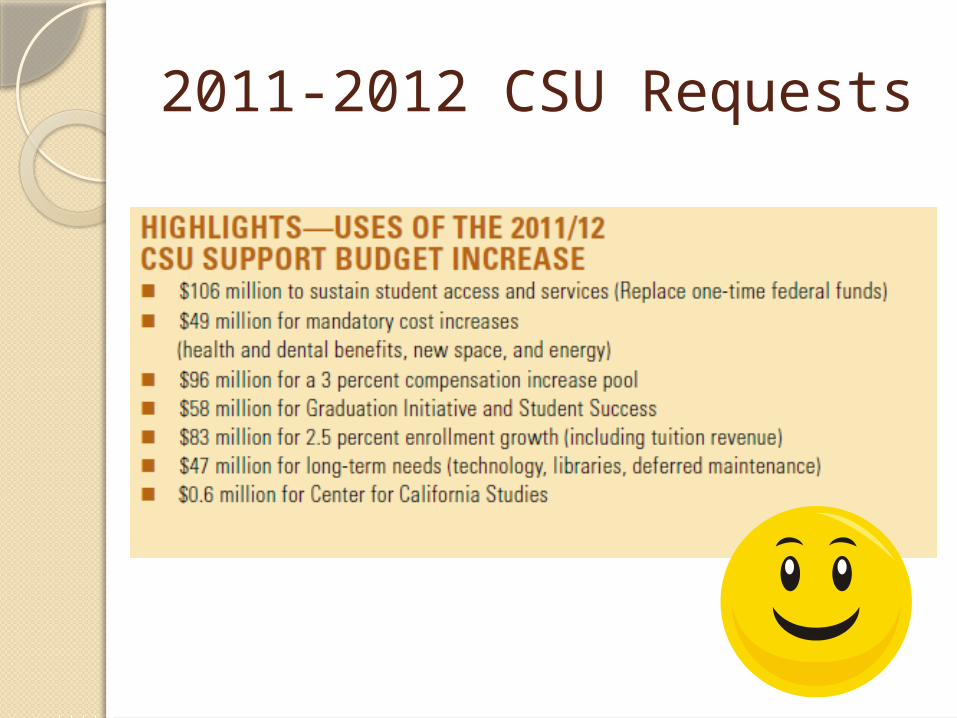
2011-2012 CSU Requests
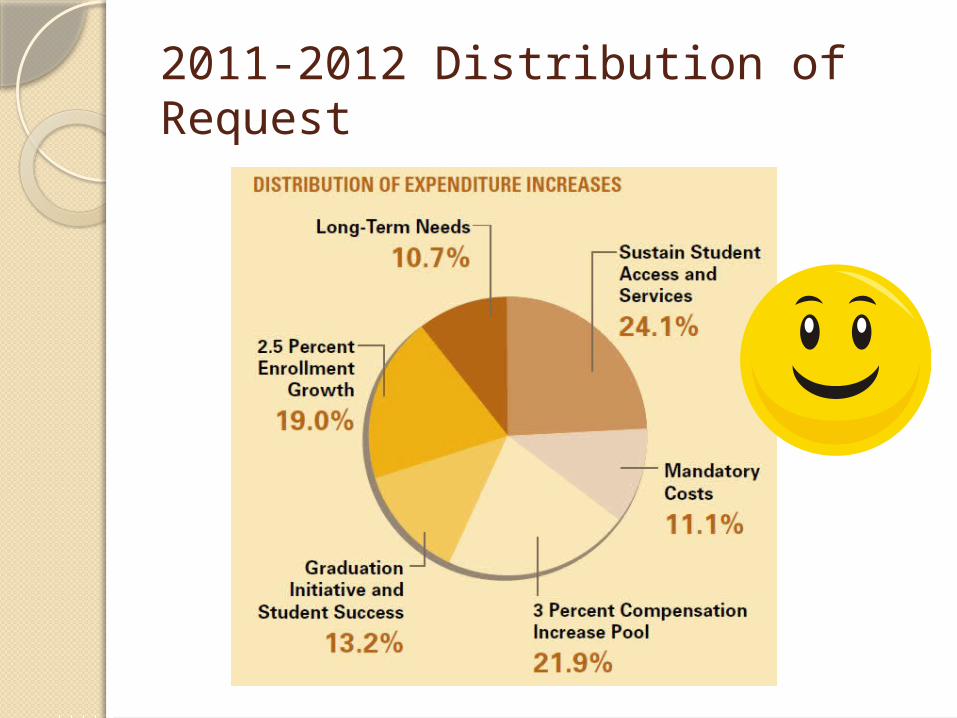
2011-2012 Distribution of Request
CSU Support Budget Cycle
Jun
Statement of Priorities
•
Trustees Approve Budget
Legislative Analyst Analysis
Legislative Hearings & May Revise
Budget Calendar Jan FebAug Sep
Exec Council Review • •
Governor's Budget Issued
•
Nov
••
Preliminary Campus Allocations
••
Apr
•Budget Signed •
Jun
• •May
•
Budget Advisory Com. Review •
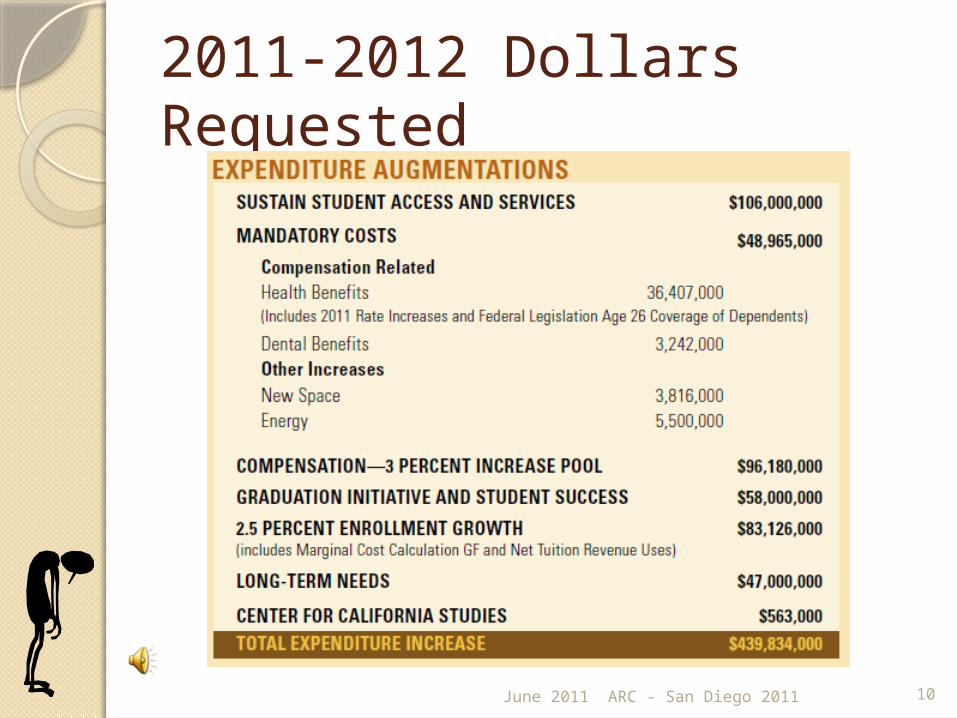
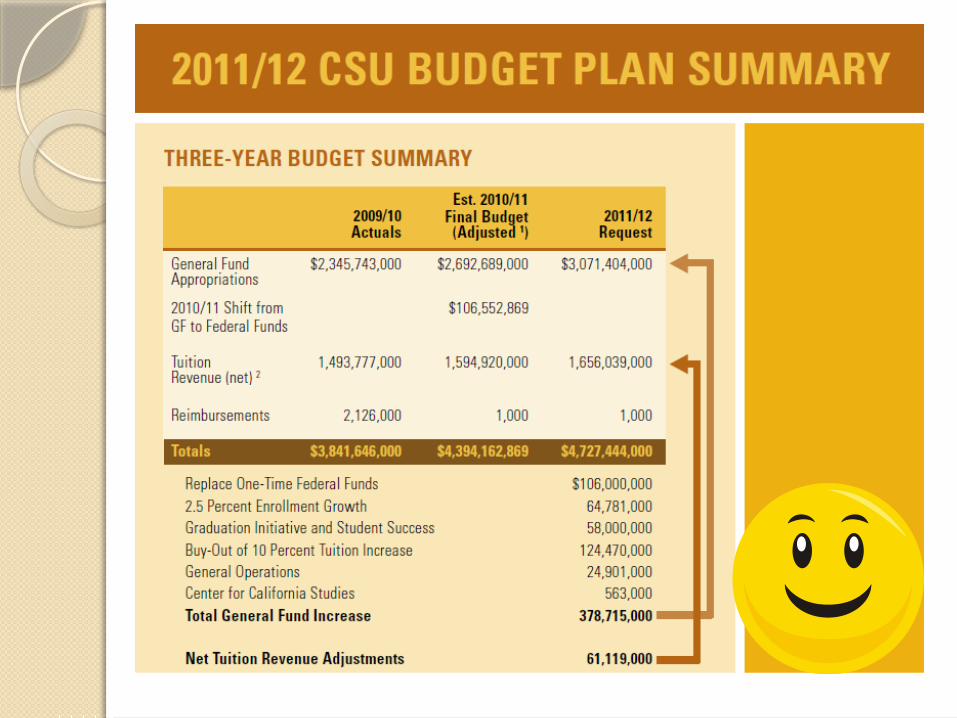
2011-2012 Dollars Requested
June 2011 ARC - San Diego 2011 10
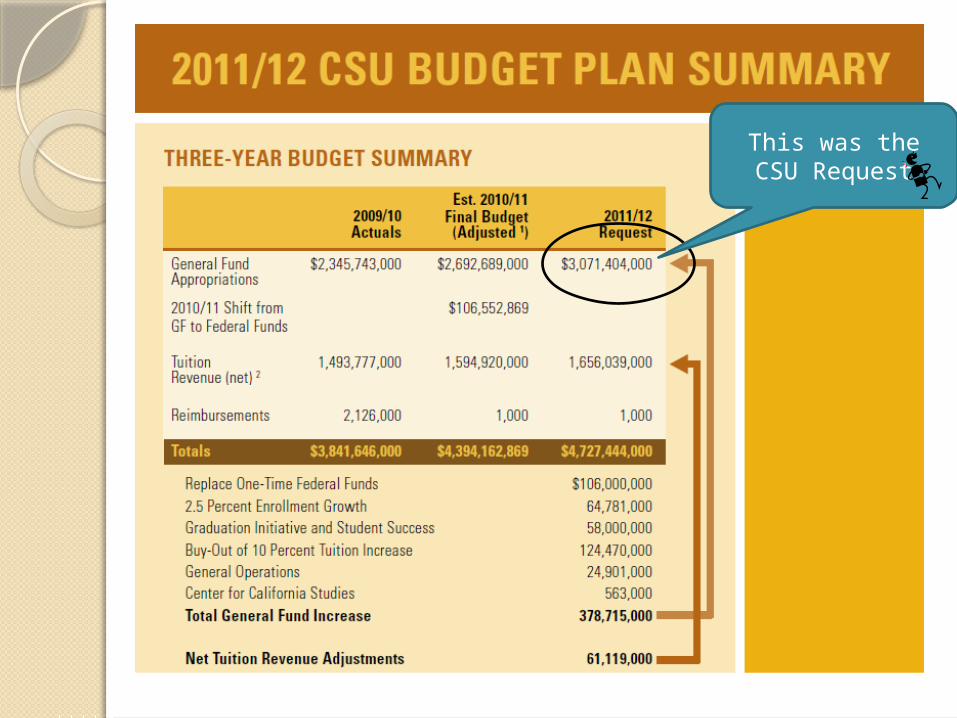
This was the CSU Request
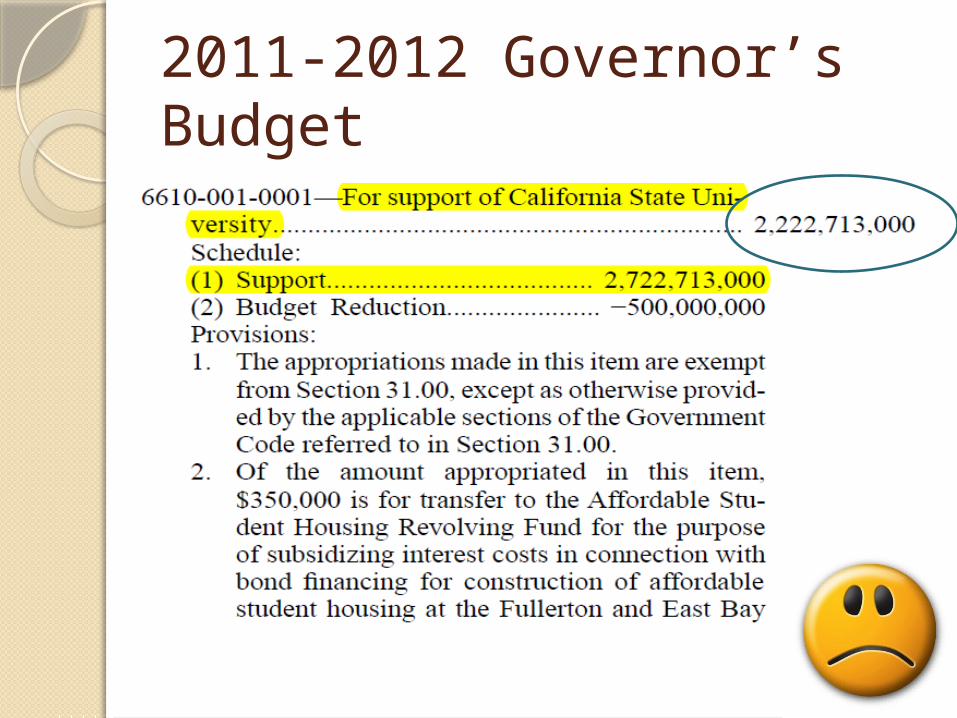
2011-2012 Governor’s Budget
This is what was proposed in the
Governor’s Budget
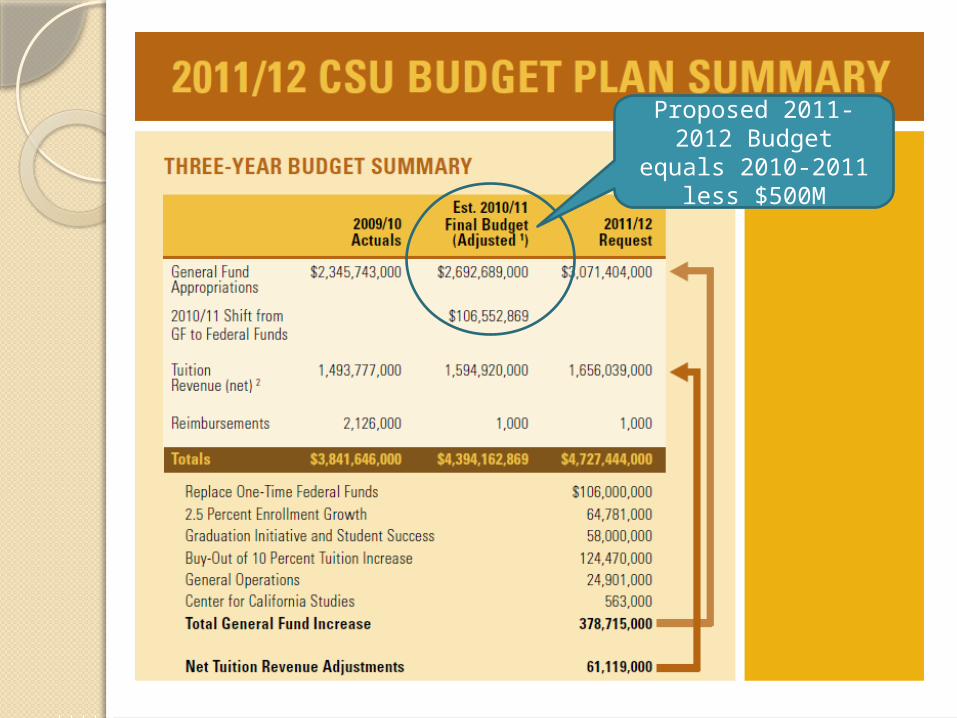
Proposed 2011-2012 Budget equals 2010-
2011 less $500M
CSU Support Budget Cycle
Jun
Statement of Priorities
•
Trustees Approve Budget
Legislative Analyst Analysis
Legislative Hearings & May Revise
Budget Calendar Jan FebAug Sep
Exec Council Review • •
Governor's Budget Issued
•
Nov
••
Preliminary Campus Allocations
••
Apr
•Budget Signed •
Jun
• •May
•
Budget Advisory Com. Review •

May 16, 2011 – Governor Brown’s May Revision of the state budget proposes an additional reduction of $500 million in state funding support for the CSU, bringing the total budget reduction to …….
$1 BillionJune 2011 ARC - San Diego 2011 15
ARC - San Diego 201116
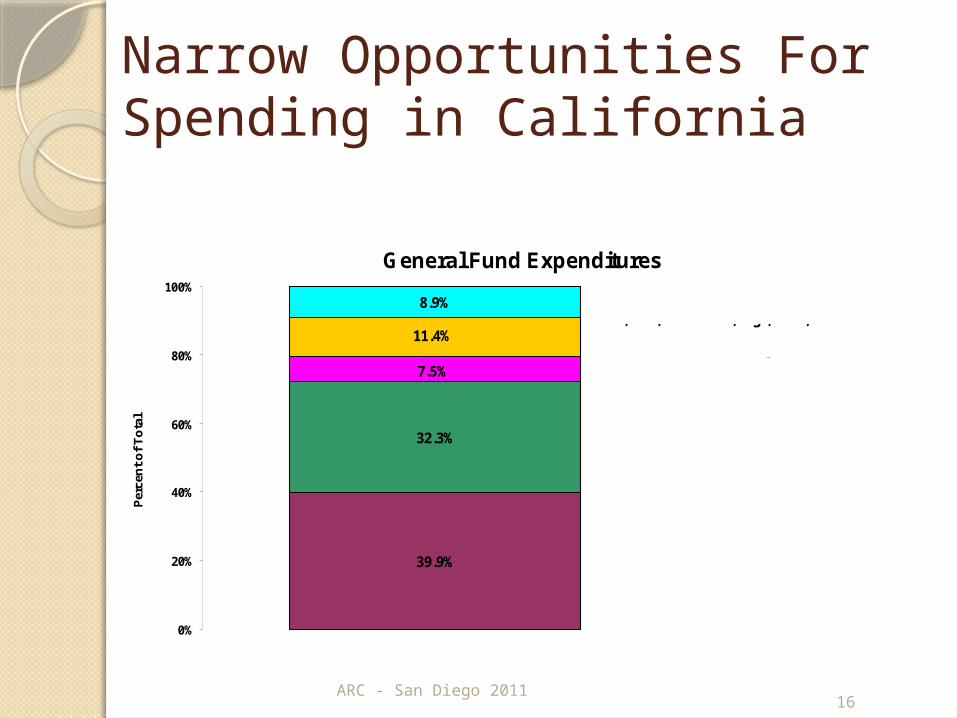
Narrow Opportunities For Spending in California
General Fund Expenditures
39.9%
32.3%
8.9%
7.5%
11.4%
0%
20%
40%
60%
80%
100%
Per
cen
t o
f T
ota
l
All Other-Tax Relief, FTB, BOE,BTH,Resources,Leg.,Exec, etc.
Universities and Other Higher Ed.
Corrections Protected by Courts
Health & Human Services, Protected by Fed. Matching & Maintenance of Effort
Prop. 98 K-12 Education, Constitutionally Protected
Note: Debt service distributed throughout Budget
Historical Budget Data
June 2011 ARC - San Diego 2011 17
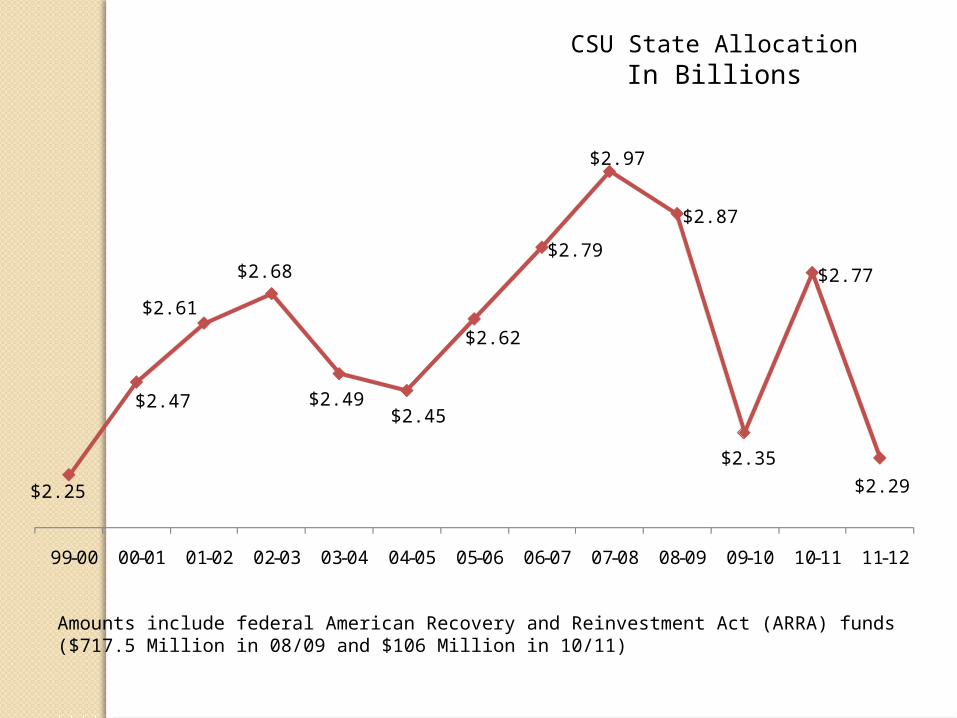
$2.25
$2.47
$2.61
$2.68
$2.49 $2.45
$2.62
$2.79
$2.97
$2.87
$2.35
$2.77
$2.29
99-00 00-01 01-02 02-03 03-04 04-05 05-06 06-07 07-08 08-09 09-10 10-11 11-12
Amounts include federal American Recovery and Reinvestment Act (ARRA) funds ($717.5 Million in 08/09 and $106 Million in 10/11)
CSU State AllocationIn Billions
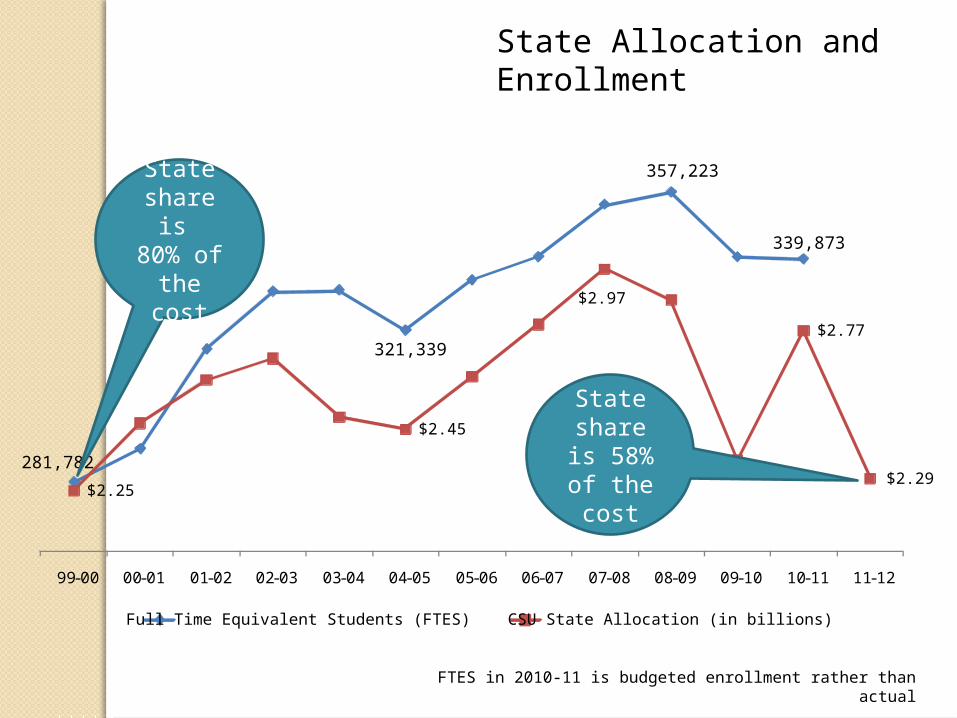
State Allocation and Enrollment
$2.97
281,782
321,339
357,223
339,873
$2.25
$2.45
$2.77
$2.29
99-00 00-01 01-02 02-03 03-04 04-05 05-06 06-07 07-08 08-09 09-10 10-11 11-12
Full Time Equivalent Students (FTES) CSU State Allocation (in billions)
FTES in 2010-11 is budgeted enrollment rather than actual
State share is 80% of the cost
State share is 58% of the cost
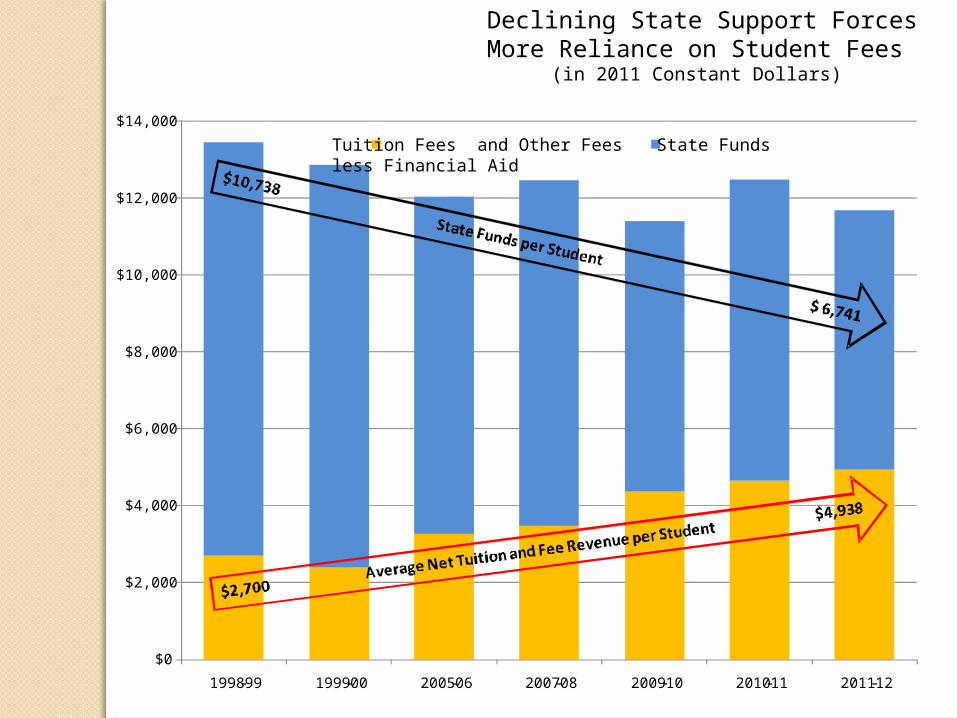
Declining State Support Forces More Reliance on Student Fees
(in 2011 Constant Dollars)
$0
$2,000
$4,000
$6,000
$8,000
$10,000
$12,000
$14,000
1998-99 1999-00 2005-06 2007-08 2009-10 2010-11 2011-12
Tuition Fees and Other Feesless Financial Aid
State Funds
June 2011 ARC - San Diego 2011 21
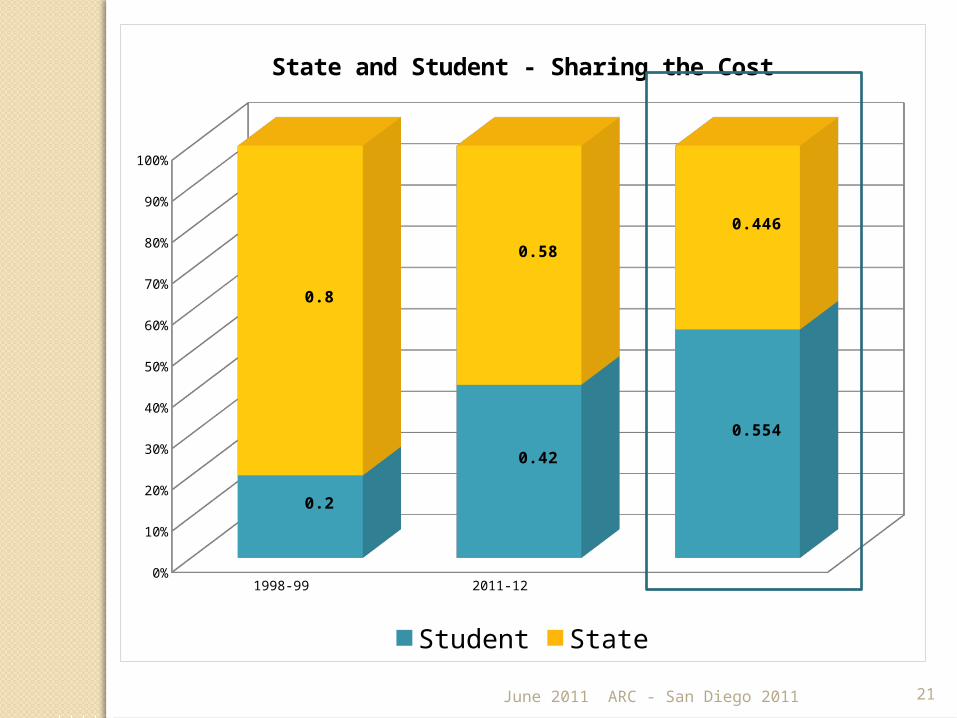
1998-99 2011-120%
10%
20%
30%
40%
50%
60%
70%
80%
90%
100%
0.2
0.42
0.554
0.8
0.58
0.446
State and Student - Sharing the Cost
Student State
Can we do more with less?
June 2011 ARC - San Diego 2011 22
Budget ComponentsAverage Compensation
◦Tenure Track◦Lecturer◦MPP◦Staff
June 2011 ARC - San Diego 2011 23
Budget ComponentsStudent Faculty Ratio
◦Undergraduate Lecturer◦Graduate Lecturer◦Undergraduate Lab◦Graduate Lab
June 2011 ARC - San Diego 2011 24
Budget ComponentsLecturer Undergrad FTESLab Undergrad FTES Lecturer Grad FTESLab Undergrad FTES
June 2011 ARC - San Diego 2011 25
Budget ComponentsTenure/Tenure Track Ratio to TotalLecturer Ratio to Total
June 2011 ARC - San Diego 2011 26
Budget ComponentsReimbursed Assigned TimeNon-reimbursed Assigned Time
June 2011 ARC - San Diego 2011 27
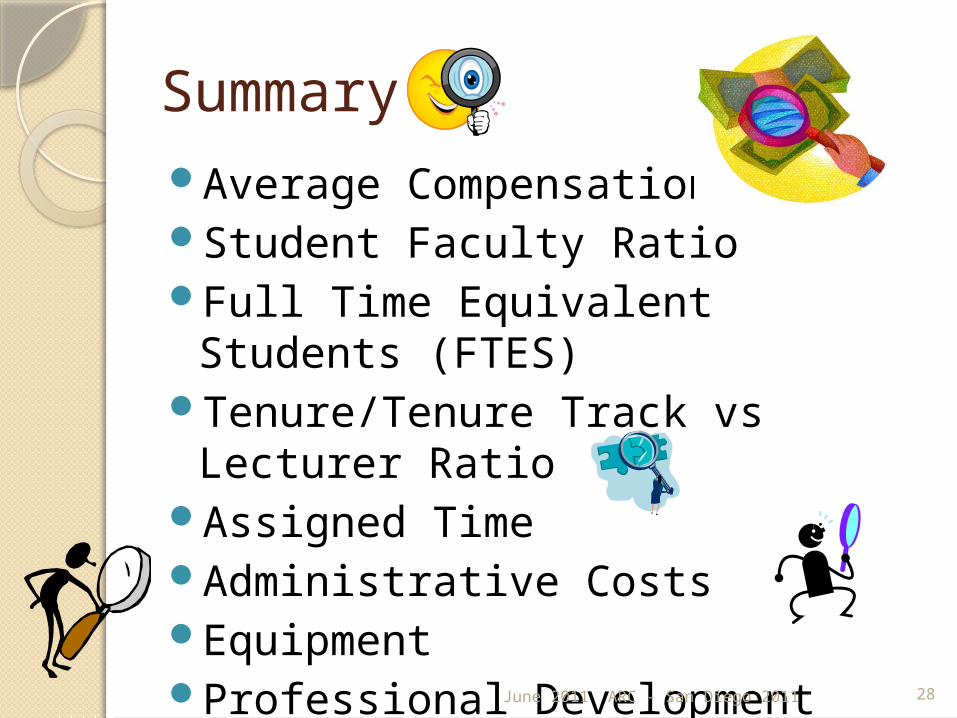
SummaryAverage CompensationStudent Faculty RatioFull Time Equivalent Students
(FTES)Tenure/Tenure Track vs Lecturer
RatioAssigned TimeAdministrative CostsEquipmentProfessional DevelopmentJune 2011 ARC - San Diego 2011 28
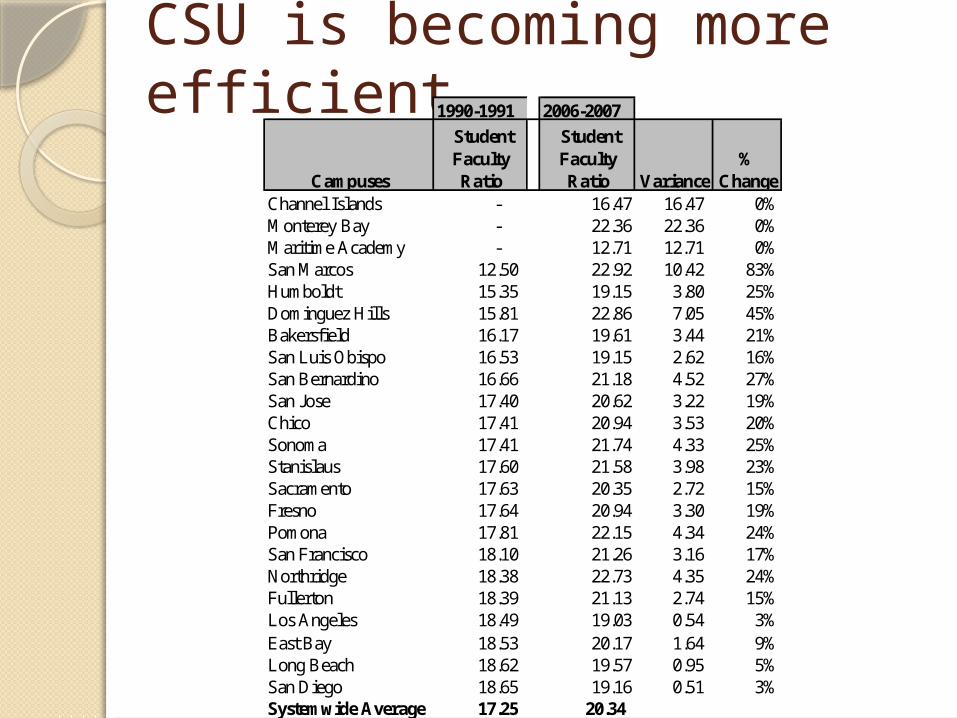
CSU is becoming more efficient 1990-1991 2006-2007
Campuses
Student Faculty Ratio
Student Faculty Ratio Variance
% Change
Channel Islands - 16.47 16.47 0%Monterey Bay - 22.36 22.36 0%Maritime Academy - 12.71 12.71 0%San Marcos 12.50 22.92 10.42 83%Humboldt 15.35 19.15 3.80 25%Dominguez Hills 15.81 22.86 7.05 45%Bakersfield 16.17 19.61 3.44 21%San Luis Obispo 16.53 19.15 2.62 16%San Bernardino 16.66 21.18 4.52 27%San Jose 17.40 20.62 3.22 19%Chico 17.41 20.94 3.53 20%Sonoma 17.41 21.74 4.33 25%Stanislaus 17.60 21.58 3.98 23%Sacramento 17.63 20.35 2.72 15%Fresno 17.64 20.94 3.30 19%Pomona 17.81 22.15 4.34 24%San Francisco 18.10 21.26 3.16 17%Northridge 18.38 22.73 4.35 24%Fullerton 18.39 21.13 2.74 15%Los Angeles 18.49 19.03 0.54 3%East Bay 18.53 20.17 1.64 9%Long Beach 18.62 19.57 0.95 5%San Diego 18.65 19.16 0.51 3%Systemwide Average 17.25 20.34
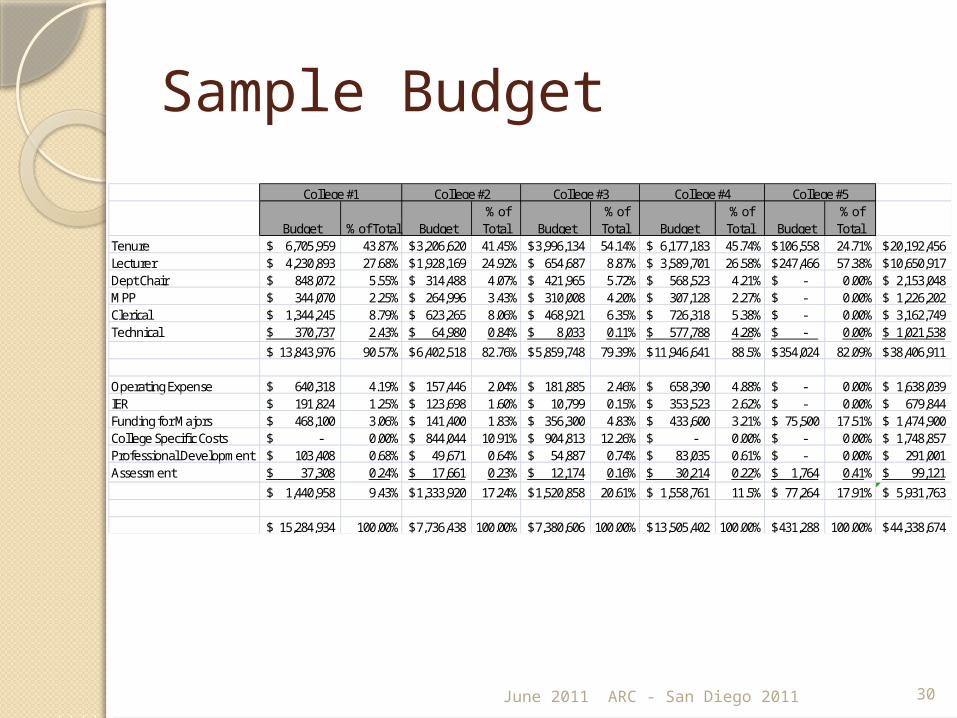
Sample Budget
June 2011 ARC - San Diego 2011 30
Budget % of Total Budget % of Total Budget
% of Total Budget
% of Total Budget
% of Total
Tenure 6,705,959$ 43.87% 3,206,620$ 41.45% 3,996,134$ 54.14% 6,177,183$ 45.74% 106,558$ 24.71% 20,192,456$ Lecturer 4,230,893$ 27.68% 1,928,169$ 24.92% 654,687$ 8.87% 3,589,701$ 26.58% 247,466$ 57.38% 10,650,917$ Dept Chair 848,072$ 5.55% 314,488$ 4.07% 421,965$ 5.72% 568,523$ 4.21% -$ 0.00% 2,153,048$ MPP 344,070$ 2.25% 264,996$ 3.43% 310,008$ 4.20% 307,128$ 2.27% -$ 0.00% 1,226,202$ Clerical 1,344,245$ 8.79% 623,265$ 8.06% 468,921$ 6.35% 726,318$ 5.38% -$ 0.00% 3,162,749$ Technical 370,737$ 2.43% 64,980$ 0.84% 8,033$ 0.11% 577,788$ 4.28% -$ 0.00% 1,021,538$
13,843,976$ 90.57% 6,402,518$ 82.76% 5,859,748$ 79.39% 11,946,641$ 88.5% 354,024$ 82.09% 38,406,911$
Operating Expense 640,318$ 4.19% 157,446$ 2.04% 181,885$ 2.46% 658,390$ 4.88% -$ 0.00% 1,638,039$ IER 191,824$ 1.25% 123,698$ 1.60% 10,799$ 0.15% 353,523$ 2.62% -$ 0.00% 679,844$ Funding for Majors 468,100$ 3.06% 141,400$ 1.83% 356,300$ 4.83% 433,600$ 3.21% 75,500$ 17.51% 1,474,900$ College Specific Costs -$ 0.00% 844,044$ 10.91% 904,813$ 12.26% -$ 0.00% -$ 0.00% 1,748,857$ Professional Development 103,408$ 0.68% 49,671$ 0.64% 54,887$ 0.74% 83,035$ 0.61% -$ 0.00% 291,001$ Assessment 37,308$ 0.24% 17,661$ 0.23% 12,174$ 0.16% 30,214$ 0.22% 1,764$ 0.41% 99,121$
1,440,958$ 9.43% 1,333,920$ 17.24% 1,520,858$ 20.61% 1,558,761$ 11.5% 77,264$ 17.91% 5,931,763$
15,284,934$ 100.00% 7,736,438$ 100.00% 7,380,606$ 100.00% 13,505,402$ 100.00% 431,288$ 100.00% 44,338,674$
College #1 College #2 College #3 College #4 College #5

What does the future hold?
June 2011 31

Campus Founding Timeline
32
1857San Jose State
1887-99Chico, San Diego &
San Francisco
1901San Luis Obispo
1911-13Fresno & Humboldt
1947-49Los Angeles,
Sacramento &Long Beach
1957-60Fullerton, East Bay, Stanislaus,Northridge, Sonoma, San Bernardino,
& Dominguez Hills
1965Bakersfield
1938/1966Pomona
1988San Marcos
1929/1994Maritime Academy &Monterey Bay
2002Channel Islands
World War II Y2K
Stock Market Crash
San FranciscoEarthquake
June 2011 ARC - San Diego 2011
June 2011 ARC - San Diego 2011 33
The Master Plan for Higher Education of California3. Reaffirmation of California's long-
time commitment to the principle of tuition-free education to residents of the state. However, the 1960 Master Plan did establish the principle that students should pay fees for auxiliary costs like dormitories and recreational facilities. Because of budgetary reductions, fees have been increased and used for instruction at UC and CSU in recent years, but fee increases have been accompanied by substantial increases in student financial aid.
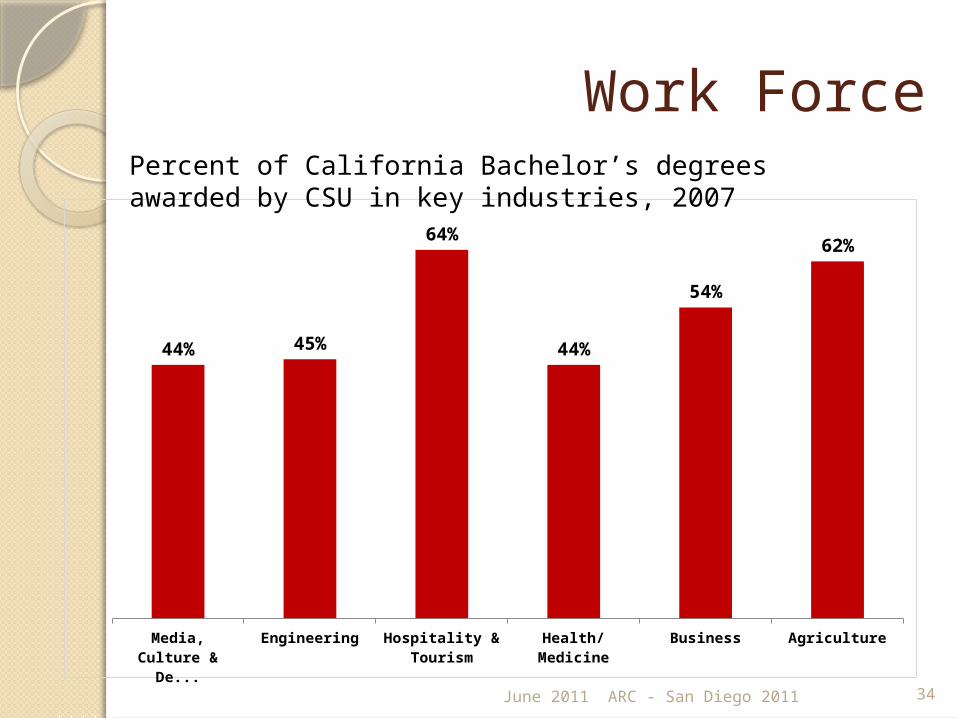
Work Force
AgricultureBusinessHealth/Medicine
Hospitality & Tourism
EngineeringMedia, Culture & Design
62%
54%
44%
64%
45%44%
Percent of California Bachelor’s degrees awarded by CSU in key industries, 2007
June 2011 34ARC - San Diego 2011

CSU Graduates
35
California’s economic drivers are mainly knowledge-based industries that thrive in the state because of the quality of its skilled workforce: Agriculture, Food & Beverages
Business and Professional Services Life Sciences and Biomedicine Engineering, Information Technology, and
Technical Media, Culture and Design Hospitality and Tourism Education Criminal Justice Social Work Public AdministrationJune 2011 ARC - San Diego 2011

Economic Impact CSU-related expenditures and enhanced
earnings of graduates:– Generate $70 billion total annual spending in the
state;– Support more than 485,000 jobs; and– Create $4.9 billion in tax revenue for state and
local governments For each $1 invested by the state, CSU
generates $5.43 for California’s economy Enhanced earnings by graduates
increases this investment return to $23 for each $1
36June 2011 ARC - San Diego 2011
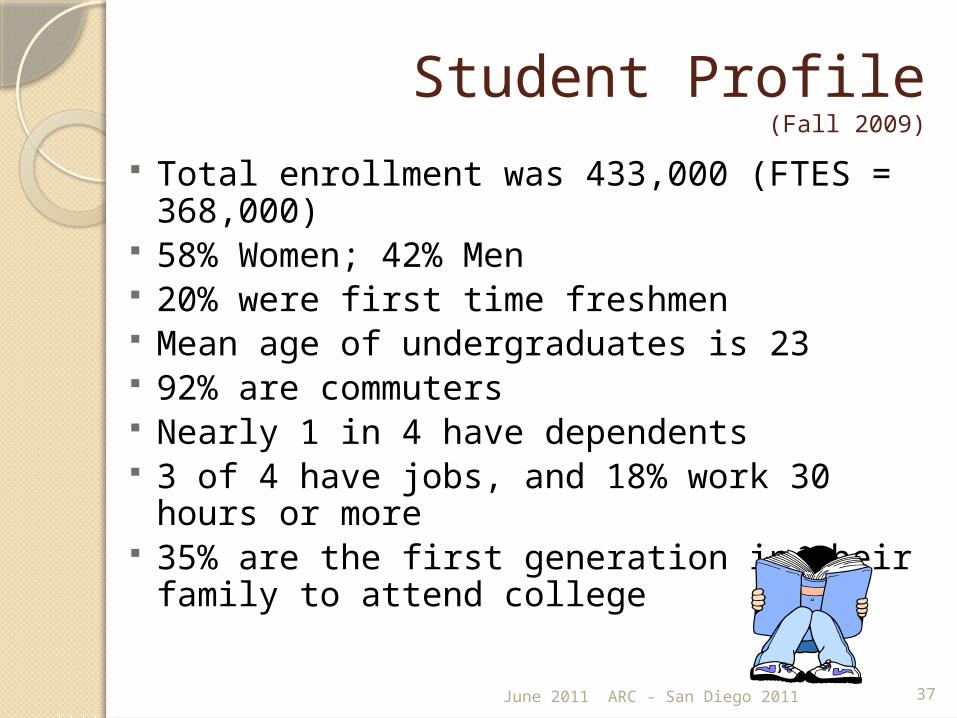
Student Profile(Fall 2009)
Total enrollment was 433,000 (FTES = 368,000)
58% Women; 42% Men 20% were first time freshmen Mean age of undergraduates is 23 92% are commuters Nearly 1 in 4 have dependents 3 of 4 have jobs, and 18% work 30 hours
or more 35% are the first generation in their family
to attend college
37June 2011 ARC - San Diego 2011
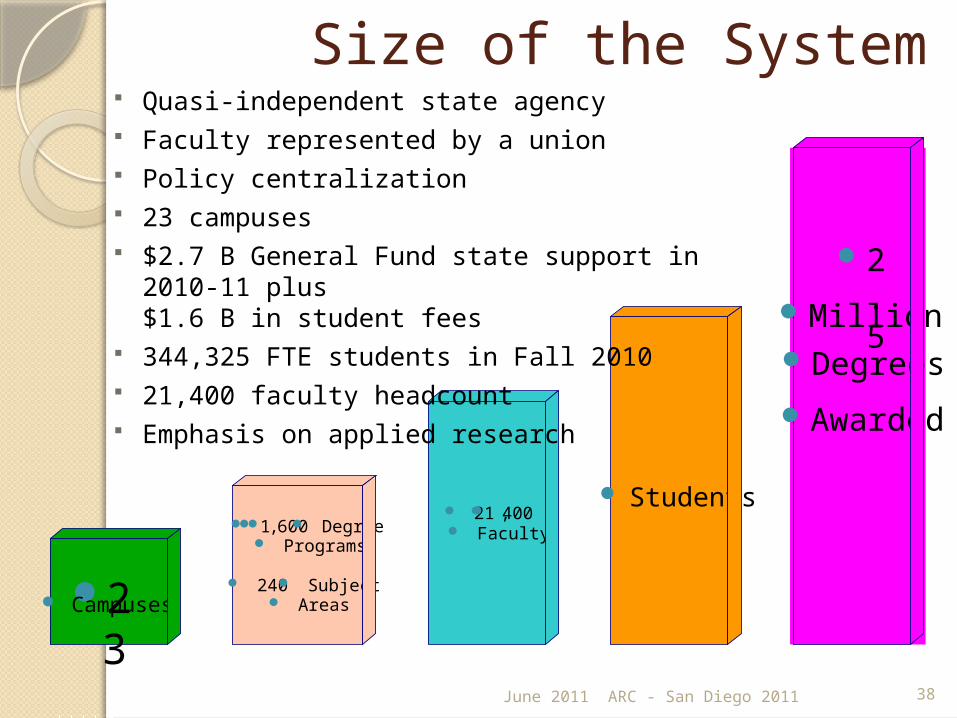
Size of the System
38
23 Campuses
21 , 400 Faculty
Students
2.5
MillionDegrees
Awarded
1 , 600 Degree Programs
240 Subject Areas
June 2011 ARC - San Diego 2011
Quasi-independent state agency Faculty represented by a union Policy centralization 23 campuses $2.7 B General Fund state support in
2010-11 plus$1.6 B in student fees
344,325 FTE students in Fall 2010 21,400 faculty headcount Emphasis on applied research

$- $1,000 $2,000 $3,000 $4,000 $5,000
$2,694 $3,079 $3,116 $3,130
$3,257 $3,278 $3,299 $3,342 $3,350 $3,355 $3,428 $3,456 $3,457 $3,528 $3,558 $3,562 $3,632
$4,153 $4,201
$4,368 East Carolina UniversityUniversity of Nevada – Las Vegas
University of North Carolina – CharlotteSan Jose State UniversityUniversity of Central Florida
CSU SacramentoUtah Valley University
University of South Florida – Main CampusSan Francisco State University
San Diego State UniversityFlorida State University
CSU NorthridgeCSU Fullerton
CSU FresnoCal Poly Pomona
University of FloridaFlorida International University
CSU Long BeachMetropolitan State College of Denver
Florida Atlantic University
Chart 5D: Lowest “In-State Tuition” Universities (Universities with at least 15,000 students, #103)
39
Source: Education Trust (2008 Data)
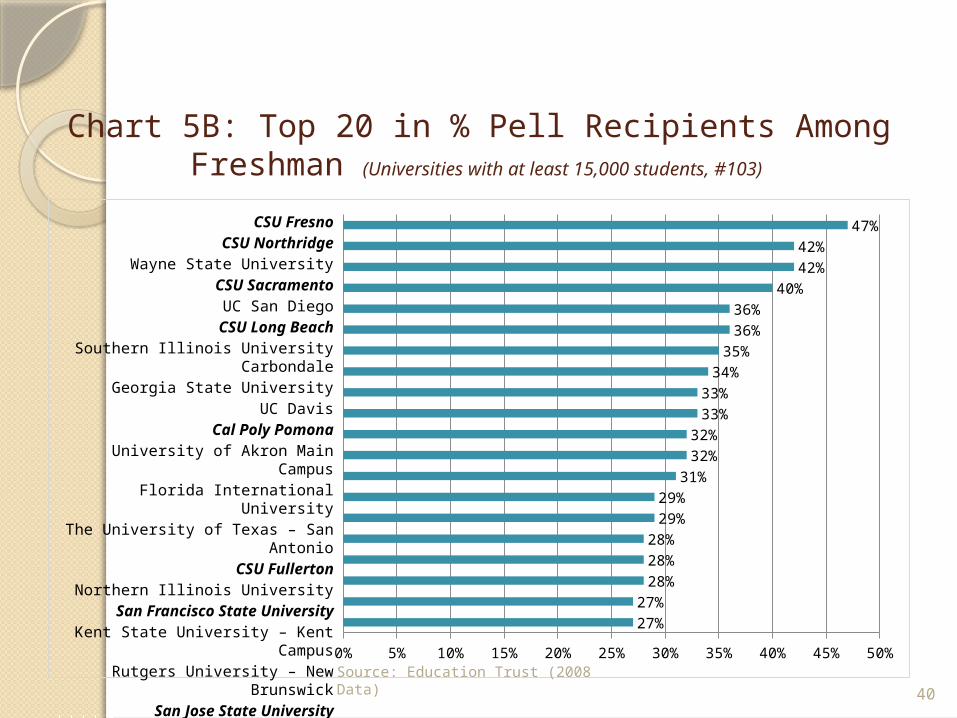
0% 5% 10% 15% 20% 25% 30% 35% 40% 45% 50%
27%27%
28%28%28%
29%29%
31%32%32%
33%33%
34%35%
36%36%
40%42%42%
47%
Chart 5B: Top 20 in % Pell Recipients Among Freshman (Universities with at least 15,000 students, #103)
CSU FresnoCSU Northridge
Wayne State UniversityCSU Sacramento
UC San DiegoCSU Long Beach
Southern Illinois University Carbondale
Georgia State UniversityUC Davis
Cal Poly PomonaUniversity of Akron Main Campus
Florida International UniversityThe University of Texas – San
AntonioCSU Fullerton
Northern Illinois UniversitySan Francisco State University
Kent State University – Kent Campus
Rutgers University – New BrunswickSan Jose State University
Middle Tennessee State University40Source: Education Trust (2008 Data)
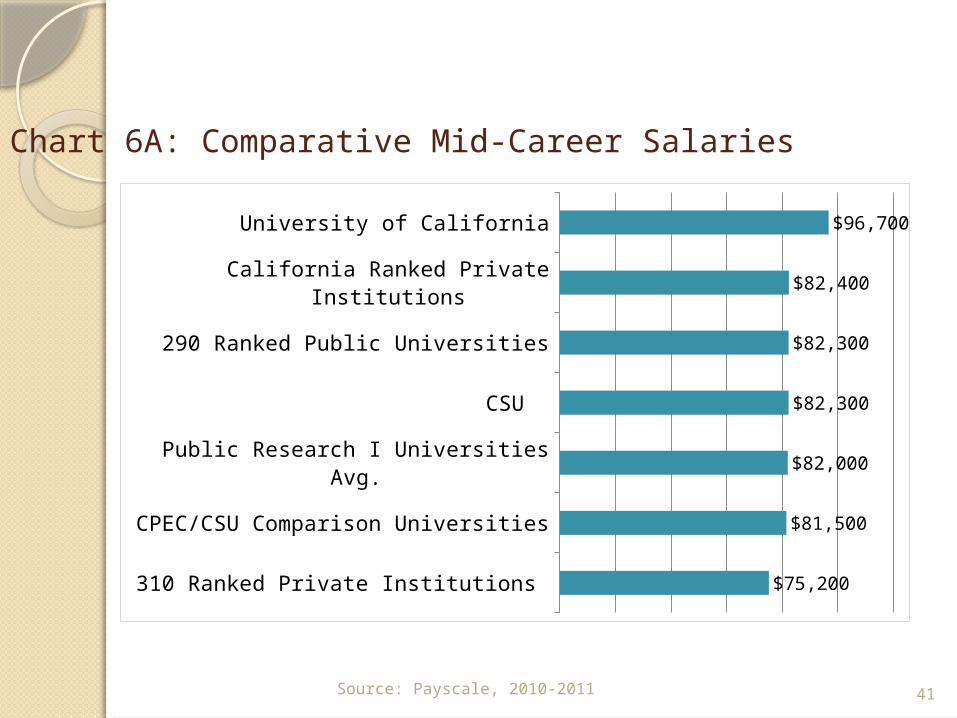
Chart 6A: Comparative Mid-Career Salaries
310 Ranked Private Institutions
CPEC/CSU Comparison Universities
Public Research I Universities Avg.
CSU
290 Ranked Public Universities
California Ranked Private Institutions
University of California
$75,200
$81,500
$82,000
$82,300
$82,300
$82,400
$96,700
41Source: Payscale, 2010-2011
My SummaryWe are an amazing organizationWe provide an amazing service to the
State of CaliforniaWe do amazing things with less and less
resourcesWe have amazing employeesWe will continue to be amazing…..but
the state will not fund itThe cost to the student will still be a
“DEAL”We need to be accountable for outcomes
June 2011 ARC - San Diego 2011 42