sintef a19989- unrestricted report - carbon technology testing
TRANSCRIPT
SINTEF Materials and Chemistry
Marine Environmental Technology
2011-07-28
SINTEF A19989- Unrestricted
Report
Biodegradation of nitrosamines in water
Biodegradation studies at low nitrosamine concentrations
Authors
Odd Gunnar Brakstad
Kolbjørn Zahlsen


PROJECT NO. 80169200
REPORT NO. SINTEF A19989
VERSION 1.0
2 of 29
Document history
VERSION DATE VERSION DESCRIPTION
1.0. 2011-07-28 Final version

PROJECT NO. 80169200
REPORT NO. SINTEF A19989
VERSION 1.0
3 of 29
Abstract In this study biodegradation of 3 nitrosamines, N-nitrosodiethanolamine (NDELA), N-nitrosodimethylamine (NDMA) and N-nitrosopiperazine (NPz) were investigated at low concentrations. The biodegradation experiments were conducted with natural lake and river water as bacterial inocula, and over periods of 56 days (2 months), mainly according to recommendation in the OECD Guideline 309. The water used was collected during winter and spring periods with low temperatures and contained more bacteria able to grow at temperatures of 5 and 10°C than at 20°C. Biodegradation was determined by chemical analyses, by liquid chromatography – triple quadrupole mass spectrometry (LC-MS-MS-QQQ), and with a sensitivity of approximately 1 µg/L nitrosamine. Biodegradation rates were determined by non-linear regression analyses. Initial studies showed that concentration ranges of 1 to 2000 µg/L nitrosamines did not inhibit growth of bacterial cultures from the water used during the degradation studies. Analytical precision was excellent for NDELA and NDMA, but slightly poorer for NPz, although acceptable also for this nitrosamine. Biodegradation experiments with NDELA at different concentrations (100 to 1.0 µg/L) showed only small differences in biodegradation rates, although depletion of sterile controls differed with concentration. However depletion in biotic and sterile samples differed significantly. The biodegradation of NDELA after 56 days of incubation was higher than 80 % for all concentrations at a water temperature of 20°C, and calculation of degradation rates showed half-lives of 28.5 to 33.1 days. Biodegradation of NDELA was also studied at temperatures of 5 to 20°C, showing that biodegradation in water collected during winter and spring periods were not significantly affected by the water temperature. After 28 days of incubation the biodegradation was highest at the lowest temperature (51.1 % at 5°C). After 56 days the percentage degradation increased with higher temperature (49.6 to 85.4 %), and the half-lives of NDELA decreased from 38.1 to 31.2 days with increasing temperature. Biodegradation studies of NDMA and NPz showed that these nitrosamines were significantly less biodegradable in water at low concentrations than NDELA under comparable conditions. Calculation of biodegradation kinetics showed half-lives of > 400 days for NDMA and > 1500 days for NPz. Biodegradation will therefore vary significantly between different nitrosamines.
Sammendrag I denne studien ble biodegradering av de 3 nitrosaminene N-nitrosodietanolamin (NDELA), N-nitrosodimetylamin (NDMA) and N-nitrosopiperazin (NPz) undersøkt i vann og ved lave konsentrasjoner. Biodegraderingsforsøk ble utført med naturlig vann fra en innsjø og en elv som bakteriekilder, hovedsakelig som anbefalt i OECD Guideline 309. Forsøkene ble utført over en periode på 56 dager (2 måneder). Vann ble samlet inn i vinter og vårsesong og med lave vanntemperaturer. Bakterietellinger vist at dette vannet innehold høyere konsentrasjoner av bakterier som vokste ved 5 og 10°C enn ved 20°C. Biodegradering ble målt ved kjemiske analyser, ved væskekromatografi – trippel kvadrupol masseektrometri (LC-MS-MS-QQQ), og med en følsomhet på ca. 1 µg/L nitrosamin. Biodegraderingshastigheter ble beregnet ved ikke-lineære regresjonsanalyser. Innledende studier viste at konsentrasjonsgradienter på 1 til 2000 µg/L ikke inhiberte vekst av bakteriekulturer fra vannkildene brukt ved biodegraderingsforsøkene. Analytisk presisjon var god for NDELA og NDMA, men noe dårligere, men innenfor akseptabelt område, for NPz. Biodegradringseksperimenter med NDELA ved ulike konsentrasjoner (100 til 1.0 µg/L) viste kun små forskjeller i biodegraderingshastigheter, med reduksjon i konsentrasjoner ble påvist ved laveste konsentrasjon i sterile kontroller. Reduksjoner i konsentrasjoner var imidlertid langt større i prøver med r naturlig vann enn i sterile kontroller. Biodegradering av NDELA etter 56 dagers test var større enn 80 % for alle konsentrasjoner testet ved en vanntemperatur på 20°C, og beregninger av degraderingshastigheter vise halveringstider på 28.5 til 33.1 dager. Biodegradering av NDELA ble også sammenlignet ved temperaturer på 5 til 20°C, og resultatene viste at degradering i vann innsamlet i vinter-/vår-sesong ved lave temperaturer ikke var mye påvirket av vanntemperatur. Etter 28 dagers inkubasjon var degraderingen høyest ved den laveste temperaturen (51.1 % ved 5°C). Etter 56 dager økte prosent nedbryting ved høyere

PROJECT NO. 80169200
REPORT NO. SINTEF A19989
VERSION 1.0
4 of 29
temperatur (49.6 til 85.4 %), og halveringstider for NDELA sank fra 38.1 til 31.2 dager med økende temperatur. Biodegraderingsforsøk med NDMA og NPz viste at disse nitrosaminene var langt mindre nedbrytbare enn NDELA under sammenlignbare betingelser. Beregninger av degraderingsrater vist halveringstider på > 400 dager for NDMA og > 1500 dager for NPz. Biodegradering av ulike nitrosaminer må derfor forventes å variere vesentlig.
PROJECT NO. 80169200
REPORT NO. SINTEF A19989
VERSION 1.0
5 of 29
Table of contents
1 Background and objectives....................................................................................................................................................................................... 6
2 Materials and methods ................................................................................................................................................................................................. 8
2.1 Chemicals ..................................................................................................................................................................................................................8
2.2 Water sources and treatment .....................................................................................................................................................................8
2.3 Biodegradation experiments .......................................................................................................................................................................9
2.4 Sampling and analyses................................................................................................................................................................................. 10
2.5 Calculations .......................................................................................................................................................................................................... 10
2.6 Inhibition of bacterial growth .................................................................................................................................................................... 10
3 Results and discussions ......................................................................................................................................................................................... 11
3.1 Inhibition of bacterial growth .................................................................................................................................................................... 11
3.2 Nominal and measured concentrations ............................................................................................................................................ 12
3.3 Biodegradation of different concentrations of NDELA............................................................................................................ 12
3.4 Biodegradation of NDELA at different temperatures ............................................................................................................... 16
3.5 Biodegradation of other nitrosamines ............................................................................................................................................... 20
4 Conclusions and recommendations ................................................................................................................................................................ 23
5 References .......................................................................................................................................................................................................................... 24
Appendix 1 – LC-MS data
APPENDICES
Appendix 1 – LC-MS data

PROJECT NO. 80169200
REPORT NO. SINTEF A19989
VERSION 1.0
6 of 29
1 Background and objectives
In a recent study performed at SINTEF Materials and Chemistry biodegradation of 10 selected nitrosamines
were examined by a screening closed bottle method (OECD 301D, 1992). In this study biodegradation was
performed with high concentrations of nitrosamines (2 mg/L) and a water temperature of 20°C (Brakstad et
al., 2011). These studies showed that none of the tested nitrosamines was defined as “ready
biodegradable” in the screening test.
However, a literature survey showed that nitrosamines may be biodegradable in soil and water, but that
the degradability is dependent on concentrations (Kaplan and Kaplan, 1985; Gunnison et al., 2000). These
studies showed that the nitrosamines were biodegradable in soil and water at low concentrations. It was
also shown that biodegradation of nitrosamines was temperature-dependent in various soil types (Yang et
al., 2005). It is also in accordance with recommendations by OECD that substances not ready biodegradable
in screening tests are further tested in simulation tests (OECD, 2006). OECD recommends the Guideline 309
as a simulation test for water (OECD, 2004).
Nearly all studies of nitrosamine biodegradation have been performed with nitrosodimethylamine (NDMA).
However, other nitrosamines may also be relevant for emissions from CO2-capture plants. We suggested to
include three nitrosamines for further biodegradation testing (Table 1.1).
Table 1.1 Nitrosamines selected for biodegradation studies.
Nitrosamine
CAS no.
Abbrev.
Structure
N-nitrosodiethanolamine
1116-54-7
NDELA
N-nitrosodimethylamine
62-75-9
NDMA
N-nitrosopiperazine
5632-47-3
NPz
These nitrosamines may be potential degradation products from amines used in relevant CO2-capture
systems. Nitrosodiethanolamine (NDELA) was shown to be moderately biodegradable in the screening test,
while no biodegradability was measured for NDMA and NPz (Brakstad et al., 2011). NDELA and NDMA are
open structures, while NPz is a cyclic compound, and these three nitrosamines may therefore represent
different degradation mechanisms. For instance, in NDELA both the hydroxyl and nitroso groups may be a

PROJECT NO. 80169200
REPORT NO. SINTEF A19989
VERSION 1.0
7 of 29
subject to microbial oxidation, while in NDMA ands NPz the nitroso-group are the most likely group for
microbial oxidation.
Biodegradation of compounds in low concentrations have often been performed with the use of
radiolabelled compounds, mainly by 14C-labelling, and this is also recommended in OECD guidelines for
simulation biodegradation tests in water (OECD, 2004). For instance, a number of studies have been
performed with 14C-labelled NDMA. However, other 14C-labelled nitrosamines than NDMA were not
commercially available. In addition, recent advances in analytical instrumentation enabled the
quantification of nitrosamines at sub-ppb levels. We therefore decided to use non-labelled nitrosamines
and analytical methods which could detect amines in concentrations lower than 1 µg/L.
It was decided to perform two separate experiments:
(1) A biodegradation study of NDELA at 20°C and with three different initial concentrations, 100, 10 and 1.0
µg/L. The objective of this study was to determine if different concentrations resulted in different
degradation, in agreement with results shown for NDMA (Kaplan and Kaplan, 1985).
(2) A biodegradation study of NDELA, NDMA and NPz with the objectives to –
a. Determine the degradation of NDELA at two low water temperatures, 10 and 5°C
b. Determine the degradation of NDEMA and NPz at the conditions described for NDELA
biodegradation in (1) at one selected concentration of nitrosamine.

PROJECT NO. 80169200
REPORT NO. SINTEF A19989
VERSION 1.0
8 of 29
2 Materials and methods
2.1 Chemicals
The chemicals used for the biodegradation experiments are described in Table 2.1.
Table 2.1 Characteristics of the nitrosamines used in the study
Chemical CAS no. Abbreviation A)Product no. Appearance
N-nitrosodiethanolamine 1116-54-7 NDELA 9666.4-100MG Yellow liquid
N-nitrosodimethylamine 62-75-9 NDMA B)9820.2-100MG Yellow liquid
N-nitrosopiperazine 5632-47-3 NPz 8986.4-100MG Yellow oil A) Purchased from Chiron AS B) A mix of N-nitrosodimethylamine (78.8 %), dimethylnitramine (18.7 %) and other compounds (6.5 %), according to information from the supplier
Both NDELA and NPz were used as pure chemicals. However, the supplier was not able to provide pure NDMA, and a mixture of NDMA, the corresponding nitramine and some unknown compounds were used instead (see footnote to Table 2.1).
2.2 Water sources and treatment
Water was collected from a local non-polluted lake and river close to Trondheim and used as diluent and bacterial source:
Haukvatnet
Nidelva (Nedre Leirfoss)
For experiment (1) it was only possible to collect water from the river source, since this experiment was started in the winter time when the lake source was ice-covered. For experiment (2), which was started in spring time, water was collected from both sources. Water was collected and immediately transported to the laboratory. If collected from both sources the water was mixed in equal volumes and incubated (aged)
for 5-7 days at the temperatures in which the experiments should be conducted (202°C, 10±2°C, or 5±1°C). By this aging the water was adapted to the test temperature, and it was ensured that dissolved organic carbon (DOC) in the water was degraded.
For all experiments 10 l of water was circulated through a filter in an aquarium pump at experimental
temperatures (202°C, 10±2°C, or 5±1°C) for 5-7 days. The filter material (“filter watte”, purchased from a local pet shop) was used to enrich water microorganisms. After the end of filtration the filter material was stirred well in the 1 L of aged water. Finally, this water, enriched with bacteria, was mixed into the rest of the aged water which was then used in the experiments. The bacterial concentrations in aged water, with and without bacterial enrichment, are shown in Table 2.2.
PROJECT NO. 80169200
REPORT NO. SINTEF A19989
VERSION 1.0
9 of 29
Table 2.2 Concentrations of viable heterotrophic bacteria determined by plate counts based on colony counts in nutrient agar. The plates were inoculated with 10 µl water before and after enrichment from aquarium filters and incubated at test temperatures (20, 10 or 5°C) for 4 days (20°C), 7 days (10°C), or 14 days (5°C) before colonies were counted. The results are shown as mean results and standard deviations (SD) of three replicates (n=3).
A)Original water B)Enriched water
Mean
(colonies/ml)
SD
(colonies/ml)
Mean
(colonies/ml)
SD
(colonies/ml)
Experiment (1)-20°C 333 321 13100 3143
Experiment (2)-20°C 200 100 15700 3387
Experiment (2)-10°C 25100 854 56933 1617
Experiment (2)-5°C 104267 31152 180267 22703 A)
Original water: Water aged, aerated and fortified with nutrients, before addition of extra bacterial inoculum from the filter material
B) Water aged, aerated, fortified with nutrients, and enriched with bacterial inoculum from the filter material
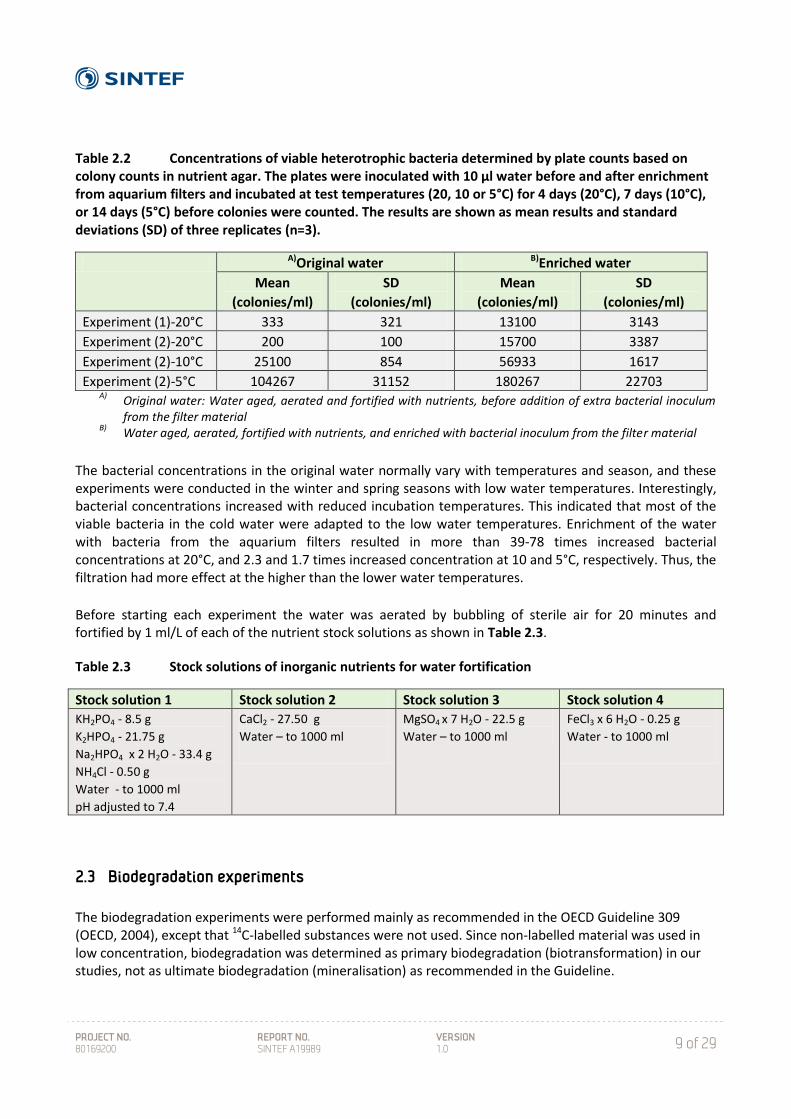
The bacterial concentrations in the original water normally vary with temperatures and season, and these experiments were conducted in the winter and spring seasons with low water temperatures. Interestingly, bacterial concentrations increased with reduced incubation temperatures. This indicated that most of the viable bacteria in the cold water were adapted to the low water temperatures. Enrichment of the water with bacteria from the aquarium filters resulted in more than 39-78 times increased bacterial concentrations at 20°C, and 2.3 and 1.7 times increased concentration at 10 and 5°C, respectively. Thus, the filtration had more effect at the higher than the lower water temperatures.
Before starting each experiment the water was aerated by bubbling of sterile air for 20 minutes and fortified by 1 ml/L of each of the nutrient stock solutions as shown in Table 2.3.
Table 2.3 Stock solutions of inorganic nutrients for water fortification
Stock solution 1 Stock solution 2 Stock solution 3 Stock solution 4
KH2PO4 - 8.5 g
K2HPO4 - 21.75 g
Na2HPO4 x 2 H2O - 33.4 g
NH4Cl - 0.50 g
Water - to 1000 ml
pH adjusted to 7.4
CaCl2 - 27.50 g
Water – to 1000 ml
MgSO4 x 7 H2O - 22.5 g
Water – to 1000 ml FeCl3 x 6 H2O - 0.25 g
Water - to 1000 ml
2.3 Biodegradation experiments
The biodegradation experiments were performed mainly as recommended in the OECD Guideline 309 (OECD, 2004), except that 14C-labelled substances were not used. Since non-labelled material was used in low concentration, biodegradation was determined as primary biodegradation (biotransformation) in our studies, not as ultimate biodegradation (mineralisation) as recommended in the Guideline.

PROJECT NO. 80169200
REPORT NO. SINTEF A19989
VERSION 1.0
10 of 29
Biodegradation experiments were conducted in 1-L SCOTT flasks with red Teflon-coated caps. Each flask was filled with 800 ml aged, aerated and nutrient-enriched water. Stock solutions of 100 mg/L nitrosamines were prepared in deionised water and applied to each flask in volumes of 800 or 80 µL to obtain final concentrations of 100 and 10 µg/L nitrosamine, respectively. To obtain final concentrations of 1.0 µL nitrosamine, the stock solution was diluted 10 times (10 mg/L) and 80 µl of this dilution applied to 800 ml aged, aerated and enriched water. For all experiments samples were prepared in triplicate.
Sterile controls were prepared by adding 800 ml aged, aerated and nutrient enriched water to 1-L SCHOTT flasks with Teflon-coated caps, autoclaving the water (121°C, 15 minutes) and adding the biocide HgCl2 at final concentrations 100 mg/L. Nitrosamines were then applied as described above.
In each experiment was also included a sample (800 ml) with aged, aerated and nutrient-enriched water without nitrosamines (blank).
All flasks were incubated in complete darkness at relevant temperatures with continuous stirring for 56
days.
2.4 Sampling and analyses
Samples of 5-6 ml from each bottle were collected on 12-ml Teflon-capped glass vials after 0, 2, 4, 7, 14, 21, 28, 42 and 56 days of incubation. Samples were stored at -20°C until analysed.
The nitrosamines were analyzed by liquid chromatography – triple quadrupole mass spectrometry (LC-MS-MS-QQQ) on an Agilent 1290 liquid chromatograph linked to an Agilent 6460 mass spectrometer. The analyses were performed by direct injection. The sensitivity of the methodology is approximately 1 µg/L for the nitrosamines analyzed.
2.5 Calculations
Degradation rates were calculated as first-order reaction kinetics by non-linear regression analyses. Calculations were performed by Prism 5.03 for Windows (GraphPad Software, Inc., La Jolla Ca, USA). During calculations constraints of 100 % initial concentrations and 0% final plateau levels were used.
2.6 Inhibition of bacterial growth
Inhibition of bacterial growth by nitrosamines was assessed by preparing dilution series of each nitrosamine from the 100 mg/L stock solutions in ranges of 2 mg/L to 1 µg/L. Nutrient broth (Fluka BioChemika) was added to each tube (9 ml) and nitrosamines applied to give final concentrations of 2000, 1000, 100, 10, and 1 µg/L nitrosamine. Aged, aerated and enriched water (1 ml) was added to each tube as microbial inoculum. All tubes were incubated at 20°C for 4 days in the dark with continuous agitation, and bacterial growth measured daily in a spectrophotometer (OD600).
PROJECT NO. 80169200
REPORT NO. SINTEF A19989
VERSION 1.0
11 of 29
3 Results and discussions
3.1 Inhibition of bacterial growth
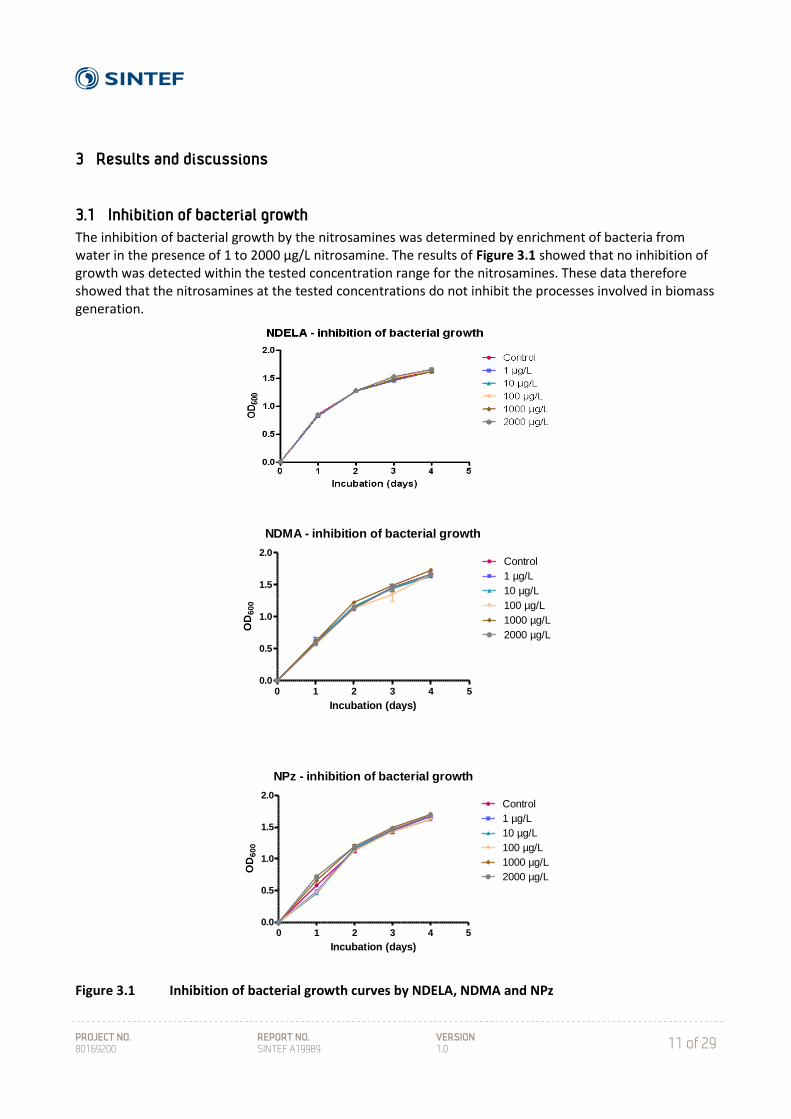
The inhibition of bacterial growth by the nitrosamines was determined by enrichment of bacteria from water in the presence of 1 to 2000 µg/L nitrosamine. The results of Figure 3.1 showed that no inhibition of growth was detected within the tested concentration range for the nitrosamines. These data therefore showed that the nitrosamines at the tested concentrations do not inhibit the processes involved in biomass generation.
NDMA - inhibition of bacterial growth
0 1 2 3 4 50.0
0.5
1.0
1.5
2.0Control
1 µg/L
10 µg/L
100 µg/L
1000 µg/L
2000 µg/L
Incubation (days)
OD
60
0
NPz - inhibition of bacterial growth
0 1 2 3 4 50.0
0.5
1.0
1.5
2.0Control
1 µg/L
10 µg/L
100 µg/L
1000 µg/L
2000 µg/L
Incubation (days)
OD
60
0
Figure 3.1 Inhibition of bacterial growth curves by NDELA, NDMA and NPz

PROJECT NO. 80169200
REPORT NO. SINTEF A19989
VERSION 1.0
12 of 29
3.2 Nominal and measured concentrations
The agreements between nominal and measured concentrations are shown in Table 3.1. The NDELA results showed excellent agreement between weighed and measured concentrations at three different concentrations. Also the sample-to-sample variations were very small, resulting in average concentrations very close to nominal concentrations, even at the lowest concentrations (94 to 114 % of expected concentrations ) and with small standard deviations.
The result for NDMA showed poor agreement between measured and nominal concentration. A major reason for this was that this chemical contained impurities (see section 2.1). However, the NDMA preparation seemed to contain lower concentrations of NDMA (4.51 µg/L) than the expected 74.8 % described by the supplier (see Table 2.1). The results showed only small sample-to-sample variation with low standard deviation.
The results for NPz showed higher sample-to-sample variation than the other two nitrosamines, resulting in a higher standard deviation. However, this variation may be regarded as acceptable.
Table 3.1 Nominal concentrations of nitrosamines applied to biodegradation test flasks and replicates measured by LC-MS analyses at day 0 of the biodegradation experiments. The results are shown for replicates and as average with standard deviation (SD).
Nitrosamine
Nominal conc.
(µg/L)
Measured concentrations (µg/L)
Replicate 1 Replicate 2 Replicate 3 Average ± SD
NDELA
100 96.1 93.5 92.5 94.0 ± 1.9
10 9.8 9.7 9.9 9.8 ± 0.1
1.0 1.17 1.18 1.08 1.14 ± 0.06
NDMA A) 7.9 4.55 4.41 4.57 4.51 ± 0.08
NPz 10 10.2 7.8 7.1 8.4 ± 1.6 A) See Table 2.1
3.3 Biodegradation of different concentrations of NDELA
The biodegradation in water of NDELA at three different concentrations were determined as biotransformation at 20°C over a period of 56 days (for data from the chemical analyses, see Appendix 1). Depletion curves for NDELA in normal water and in water poisoned with HgCl2 are shown in Figure 3.2. The results showed that the nitrosamine was highly depleted at all concentrations in normal water. However, depletion was also detected in sterile controls, but only in flasks incubated for 56 days. The depletion in the sterile controls was concentration-dependent, and higher in the lowest concentrations. This may indicate that low concentrations of NDELA are less stable at room temperature than high concentrations.
The percentage depletion of NDELA by biotic and abiotic processes are shown in Figure 3.3 and Table 3.2. The transformation was comparable for all concentrations, showing no significant differences between the concentrations (P>0.05). These results partly contrasted data from previous studies with NDMA, in which degradation differed with concentration of the nitrosamine (Kaplan and Kaplan, 1985). The results for the

PROJECT NO. 80169200
REPORT NO. SINTEF A19989
VERSION 1.0
13 of 29
degradation in sterile controls showed that these data varied from 7 to 42 % depletion with decreasing concentration of NDELA. The reason for this depletion was not further investigated, but we may anticipate that the nitrosamine is not chemical stable at very low concentrations, since the abiotic depletion was highly dependent on concentration.
In order to determine degradation kinetics of the different NDELA concentrations, non-linear regression analyses were performed to determine depletion rate constants and half-lives. The results of Table 3.3 and Figure 3.4 show rate constants/half-lives and regression curves for NDELA, respectively. In normal water depletion half-lives were 28.5 to 33.1 days, while sterilised water resulted in half-lives of 119 to > 2000 days. The degradation rates showed 2.1 to 2.4 % depletion per day in normal water and 0.03 to 0.58 % in sterilised water.
The depletion in normal water may therefore be regarded as primarily as the result of biodegradation. It is peculiar that depletion in normal water was similar for all three NDELA-concentrations, while depletion in sterile samples differed significantly with concentration, without seemingly affecting the depletion in the biotic samples. These results indicate that the depletion at the end of the experiment in the biotic samples was not affected by any abiotic degradation.

PROJECT NO. 80169200
REPORT NO. SINTEF A19989
VERSION 1.0
14 of 29
NDELA - 1 µg/L
0 10 20 30 40 50 600.0
0.2
0.4
0.6
0.8
1.0
1.2
1.4 Biotic
Sterile
Days
Co
nc (
µg
/L)
NDELA - 10 µg/L
0 10 20 30 40 50 600
2
4
6
8
10
12 Biotic
Sterile
Days
Co
nc (
µg
/L)
NDELA - 100 µg/L
0 10 20 30 40 50 600
20
40
60
80
100
120 Biotic
Sterile
Days
Co
nc (
µg
/L)
Figure 3.2 Depletion of NDELA at three different concentrations in normal water (biotic) and in water poisoned with 100 mg/L HgCl2 (Sterile). The results are based on LC-MS analyses of samples collected during a biodegradation experiment at 20°C lasting for 56 days. Error bars indicate standard deviation.

PROJECT NO. 80169200
REPORT NO. SINTEF A19989
VERSION 1.0
15 of 29
NDELA - Depletion
10 20 30 40 50 60-20
0
20
40
60
80
100Biotic 1 µg/L
Biotic 10 µg/L
Biotic 100 µg/L
Sterile 1 µg/L
Sterile 10 µg/L
Sterile 100 µg/L
Days
Dep
leti
on
(%
)
Figure 3.3 Percentage depletion of NDELA at different concentrations in normal water (Biotic) and water poisoned by HgCl2 (Sterile). Error bars show standard deviations.
Table 3.2 Percentage depletion of NDELA at different concentrations in n normal water (Biotic) and water poisoned by HgCl2 (Sterile).
Concentration
(µg/L)
Depletion - Biotic Depletion - Sterile
28 days 56 days 28 days 56 days
1.0 35.6 85.4 0 42.3
10 36.7 83.4 0 15.3
100 43.0 87.6 0 7.0
Table 3.3 Non-linear regression analyses (first-order rate kinetics) for determination of depletion rates and half-lives of NDELA in normal water (Biotic) and in water poisoned with HgCl2 (Sterile). The curve-fitness was determined as R2-values.
Concentration
(µg/L)
Rate constant
(k-1)
Half-life
(t1/2, days)
Goodness of fit
(R2)
Biotic Sterile Biotic Sterile Biotic Sterile
1.0 0.0222 0.00584 31.2 118.7 0.8707 0.5790
10 0.0209 0.00131 33.1 527.4 0.9048 0.2058
100 0.02435 0.00029 28.5 >2000 0.9195 ---

PROJECT NO. 80169200
REPORT NO. SINTEF A19989
VERSION 1.0
16 of 29
NDELA - Non-linear regression
0 10 20 30 40 50 600
20
40
60
80
100Biotic 1 µg/L
Biotic 10 µg/L
Biotic 100 µg/L
Sterile 1 µg/L
Sterile 10 µg/L
Sterile 100 µg/L
Days
Dep
leti
on
(%
)
Figure 3.4 Depletion curves of non-linear regression analyses for degradation of NDELA in normal water (Biotic) and in water poisoned with HgCl2 (Sterile). Error bars show standard deviations.
3.4 Biodegradation of NDELA at different temperatures
In the previous section biodegradation of NDELA in water was performed at 20°C (for data from the chemical analyses, see Appendix 1). However, water temperatures in Norway may only reach this level during peak summer, and the effect of lower water temperatures was therefore investigated. Biodegradation was run at 5 and 10°C at low concentrations of NDELA (1 µg/L). This concentration was chosen since it was the lowest analytical reliable concentration of NDELA which could be used for the biodegradation experiments. Depletion curves for degradation at the two temperatures are shown in Figure 3.5. The result showed that depletion was insignificant in sterile controls. This contrasted the results the corresponding results in sterile controls at 20°C, where depletion also was measured in sterile controls at low concentrations of the nitrosamine (see Figure 3.2). Depletion was detected both at 5 and 10°C in normal water. After 56 days of degradation the concentration was reduced from 1.19 ± 0.03 mg/L to 0.46 ± 0.03 mg/L, while corresponding results at 5°C were reductions from 1.33 ± 0.12 mg/L to 0.67 ± 0.10 mg/L, but the depletion curves were not significantly different (P>0.05).
Comparison of percentage depletion of NDELA at the three tested temperatures of 20, 10 and 5°C are shown in Figure 3.6 and tabulated in Table 3.4. The results showed that degradation after 28 days was comparable at all temperatures, but were reduced at lower temperatures after 56 days. It is normally expected that biodegradation is dependent on temperature (Arrhenius, 1889) and increases with higher temperatures. However, NDELA was more rapidly degraded between 0 and 28 days at the lower temperatures (10 and 5°C) than at 20°C. One reason for this initial degradation at the lower temperatures was probably that the water used for the experiments was collected during winter and early spring periods. The water therefore contained higher concentrations of bacteria able to grow at 5 and 10°C than at 20°C (see Table 2.2). However, after a period of biodegradation we may assume that bacterial concentrations increased in the experiment at 20°C, resulting in higher degradation at this temperature, as observed in the period 28 to 56 days of the experiments.

PROJECT NO. 80169200
REPORT NO. SINTEF A19989
VERSION 1.0
17 of 29
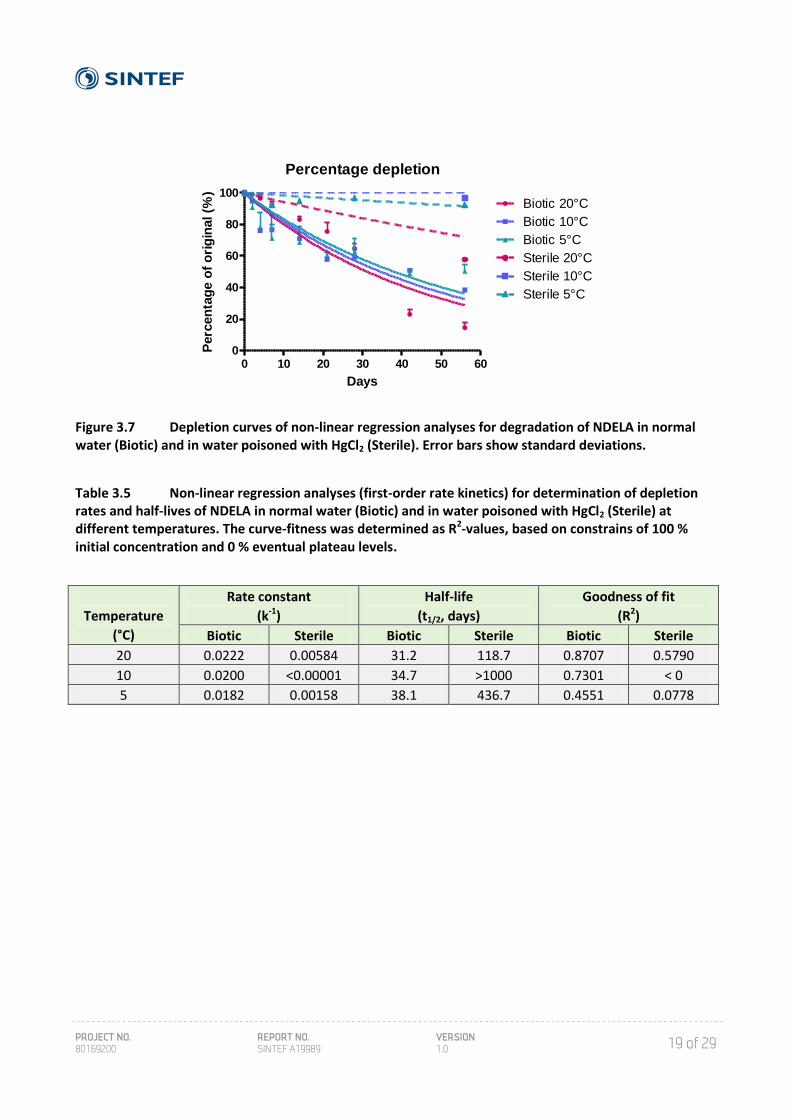
Non-linear degradation kinetics of NDELA depletion at different temperatures are shown in Figure 3.7 and in Table 3.5. The results showed that biodegradation of NDELA in water from a Norwegian source were not significantly affected by water temperatures. The half-lives varied between 31.8 and 38.1, increasing by reduced temperatures. These results differed somewhat from the results of Yang et al. (2005), showing an increase in half-lives from 5.6-22.5 days at 20°C to 8.5-36.1 days at 10°C. However, their study was conducted in landscape soil.
NDELA - 10°C
0 10 20 30 40 50 600.0
0.2
0.4
0.6
0.8
1.0
1.2
1.4Biotic
Sterile
Days
Co
nc (
µg
/L)
NDELA - 5°C
0 10 20 30 40 50 600.0
0.2
0.4
0.6
0.8
1.0
1.2
1.4Biotic
Sterile
Days
Co
nc (
µg
/L)
Figure 3.5 Depletion of NDELA at temperatures of 10 and 5°C in normal water (Biotic) and water poisoned by HgCl2 (Sterile) over an experimental period of 56 days. Error bars indicate standard deviation.

PROJECT NO. 80169200
REPORT NO. SINTEF A19989
VERSION 1.0
18 of 29
Percentage depletion
0 10 20 30 40 50 600
20
40
60
80
100Biotic 20°C
Biotic 10°C
Biotic 5°C
Sterile 20°C
Sterile 10°C
Sterile 5°C
Days
Dep
leti
on
(%
)
Figure 3.6 Percentage depletion of NDELA at different temperatures in normal water (Biotic) and water poisoned by HgCl2 (Sterile). Error bars show standard deviation. Results for biodegradation at 20°C are also shown in Figure 3.3.
Table 3.4 Percentage depletion of NDELA at different temperatures in normal water (Biotic) and water poisoned by HgCl2 (Sterile).
Temperature
(°C)
Depletion - Biotic Depletion - Sterile
28 days 56 days 28 days 56 days
20 35.6 ± 5.8 85.4 ± 6.1 0 42.3
10 40.7 ± 1.8 61.5 ± 2.1 0 3.1
5 51.1 ± 4.1 49.6 ± 7.2 3.9 7.5
PROJECT NO. 80169200
REPORT NO. SINTEF A19989
VERSION 1.0
19 of 29
Percentage depletion
0 10 20 30 40 50 600
20
40
60
80
100Biotic 20°C
Biotic 10°C
Biotic 5°C
Sterile 20°C
Sterile 10°C
Sterile 5°C
Days
Perc
en
tag
e o
f o
rig
inal (%
)
Figure 3.7 Depletion curves of non-linear regression analyses for degradation of NDELA in normal water (Biotic) and in water poisoned with HgCl2 (Sterile). Error bars show standard deviations.
Table 3.5 Non-linear regression analyses (first-order rate kinetics) for determination of depletion rates and half-lives of NDELA in normal water (Biotic) and in water poisoned with HgCl2 (Sterile) at different temperatures. The curve-fitness was determined as R2-values, based on constrains of 100 % initial concentration and 0 % eventual plateau levels.
Temperature
(°C)
Rate constant
(k-1)
Half-life
(t1/2, days)
Goodness of fit
(R2)
Biotic Sterile Biotic Sterile Biotic Sterile
20 0.0222 0.00584 31.2 118.7 0.8707 0.5790
10 0.0200 <0.00001 34.7 >1000 0.7301 < 0
5 0.0182 0.00158 38.1 436.7 0.4551 0.0778
PROJECT NO. 80169200
REPORT NO. SINTEF A19989
VERSION 1.0
20 of 29
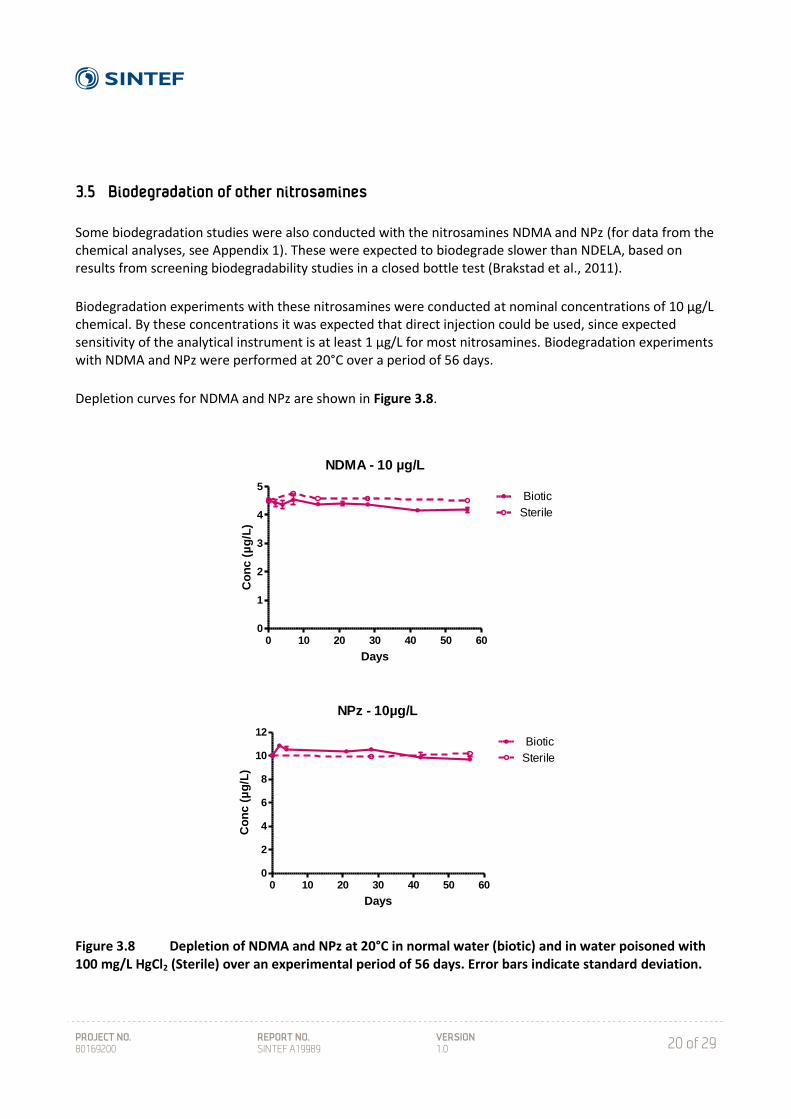
3.5 Biodegradation of other nitrosamines
Some biodegradation studies were also conducted with the nitrosamines NDMA and NPz (for data from the chemical analyses, see Appendix 1). These were expected to biodegrade slower than NDELA, based on results from screening biodegradability studies in a closed bottle test (Brakstad et al., 2011).
Biodegradation experiments with these nitrosamines were conducted at nominal concentrations of 10 µg/L chemical. By these concentrations it was expected that direct injection could be used, since expected sensitivity of the analytical instrument is at least 1 µg/L for most nitrosamines. Biodegradation experiments with NDMA and NPz were performed at 20°C over a period of 56 days.
Depletion curves for NDMA and NPz are shown in Figure 3.8.
NDMA - 10 µg/L
0 10 20 30 40 50 600
1
2
3
4
5 Biotic
Sterile
Days
Co
nc (
µg
/L)
NPz - 10µg/L
0 10 20 30 40 50 600
2
4
6
8
10
12 Biotic
Sterile
Days
Co
nc (
µg
/L)
Figure 3.8 Depletion of NDMA and NPz at 20°C in normal water (biotic) and in water poisoned with 100 mg/L HgCl2 (Sterile) over an experimental period of 56 days. Error bars indicate standard deviation.
PROJECT NO. 80169200
REPORT NO. SINTEF A19989
VERSION 1.0
21 of 29
The results showed slow biodegradation for the two nitrosamines. The concentration of NDMA was decreased from initially 4.51 ± 0.09 µg/L to 4.19 ± 0.09 µg/L after 56 days. The NDMA compound was not a pure nitrosamine substance and contained both dimethylnitramine and other compounds (see Table 2.1). This may have affected the degradation of the nitrosamine. If some of the other compounds were more degradable than NDMA this may have resulted in reduced NDMA biodegradation.
However, NPz concentrations were more difficult to handle. As shown in Table 3.1 the initial concentrations varied between 10.2 and 7.1 µg/L. The analytical data from days 2 and 4 varies less (10.9 to 8.4 µg/L). We therefore decided to use the median value (10.2 µg/L) from these measurements as initial concentration for biodegradation calculations. The initial concentrations were then reduced to 9.7 ± 0.2 µg/L after 56 days. Samples of NPz collected after 7 and 14 days showed obvious erroneous measuring results, with measuring data from 7.5 to 1.5 µg/L, and these results were also measured in repeated analyses. Samples collected from the same flasks after 21 days showed concentrations of 10.3 to 10.4 µg/L. It is obvious that something happened to the day 7 and 14 samples after sampling from biodegradation flasks, although we have no obvious explanation of this. Similar sampling equipment and procedures were consequently used during all experiments. It was therefore decided to exclude the analytical data for day 7 and 14 of NPz, and these were not included in the results shown in Figure 3.8.
Non-linear regression curves and degradation rate data for NDMA and NPz are shown in Figure 3.9 and in Table 3.6, respectively. These results showed that NDMA and NPz were very slowly biodegradable in the test systems used here. With half-lives of more than 400 days for NDMA and more than 1000 days for NPz these nitrosamines may be regarded as recalcitrant in natural non-adapted water, in contrast to NDELA.
The results for NDMA and NPz confirmed the screening results obtained in a standard biodegradability test with higher concentrations of the chemicals (Brakstad et al., 2011). No relevant literature data for biodegradability of NPz are available to our knowledge. However, our data for NDMA were not in agreement with studies performed in lake water (Kaplan and Kaplan, 1985). These studies showed fairly rapid biodegradation of 14C-labelled NDMA in water at low concentration and high water temperature (20-22°C), with more than 60 % complete biodegradation to CO2 after 30 days of biodegradation, and with 12 ng/L to 15µg/L of chemical). The water source used in their studies is Lake Cochituate in Massachusetts (USA), which was inoculated with organisms from activated sludge (Kaplan and Kaplan, 1985). Thus the results of our studies may not be directly comparable to their studies, since we did not include any extra bacterial inoculum to our water, except those already present in the water. In addition, it has been reported that water collected during summer may cause more rapid degradation than water collected during the cold season (Yordy and Alexander, 1980).

PROJECT NO. 80169200
REPORT NO. SINTEF A19989
VERSION 1.0
22 of 29
NDMA and NPz - Non-linear regression
0 10 20 30 40 50 6050
60
70
80
90
100NDMA - Biotic
NDMA - Sterile
NPz - Biotic
NPz - Sterile
Days
Dep
leti
on
(%
)
Figure 3.9 Depletion curves of non-linear regression analyses for degradation of NDMA and NPz in normal water (Biotic) and in water poisoned with HgCl2 (Sterile). Error bars show standard deviations.
Table 3.6 Non-linear regr-ession analyses (first-order rate kinetics) for determination of depletion rates and half-lives of NDMA and NPz in normal water (Biotic) and in water poisoned with HgCl2 (Sterile) at 20°C. The curve-fitness was determined as R2-values, based on constrains of 100 % initial concentration and 0 % eventual plateau levels.
Temperature
(°C)
Rate constant
(k-1)
Half-life
(t1/2, days)
Goodness of fit
(R2)
Biotic Sterile Biotic Sterile Biotic Sterile
NDMA 0.00149 < 0.000001 466 > 1000 0.4818 < 0
NPz 0.00043 0.00021 1610 3266 0.08720 < 0
The results shown here are primarily relevant for degradation in surface water. Nitrosamines may also end up in groundwater and in seawater. Before ending up in groundwater the compounds are filtered though soil and/or sediment systems, which may strongly affect degradation. In seawater different microbial communities are present than in freshwater, so data can therefore not be transferred between fresh- and seawater. From previous biodegradation testing of amines in freshwater and seawater test systems at SINTEF we have also experienced that degradation of the same compound may be slightly slower in comparable seawater than freshwater systems.
Biodegradation is one of several potential degradation mechanisms for nitrosamines, including also hydrolysis and photochemical oxidation. There is no evidence of nitrosamines hydrolysis under acidic and

PROJECT NO. 80169200
REPORT NO. SINTEF A19989
VERSION 1.0
23 of 29
basic conditions, while photochemical oxidation may be an important degradation process in water (Plumlee and Reinhard, 2007). During long summer days it is expected that photodegradation may be a more important degradation process for nitrosamines in the photic zone of surface water. However, in winter season with short days (and the risk of ice coverage), potential biodegradation becomes important as a degradation mechanism in surface water. Also in groundwater it is anticipated that biodegradation may be important.
4 Conclusions and recommendations
Biodegradation tests were performed with water collected during winter time and with original water temperatures close to 5°C. Based on the results from the biodegradation studies conducted with this water the following conclusions can be made:
Biodegradation of NDELA after 56 days of incubation was higher than 80 % for three different concentrations of nitrosamine (100, 10 and 1.0 µg/L) at a water temperature of 20°C, and calculation of degradation rates showed half-lives of 28.5 to 33.1 days
Water temperatures in the range of 5 to 20°C affected biodegradation of NDELA only to a limited extent, and degradation was initially faster at 5°C than at the higher temperatures
Biodegradation of two other nitrosamines, NDMA and NPz was much slower than for NDELA (estimated half-lives > 400 days for NDMA and > 1500 days for NPz), showing that biodegradation will differ between various nitrosamines
Selected biodegradation rates for NDELA described here may be used for predictions of the fate of this nitrosamine compound after emission to water
Further investigations may be performed:
To identify the metabolic products during biodegradation of nitrosamines like NDELA. It has been shown that nitrosamines may be metabolised to nitramines and alkylamines (Fournier et al., 2006).
To investigate the fate of nitrosamines precipitated in a catchment area and the subsequent impacts on its water systems.
To compare photochemical degradation and biodegradation of nitrosamines in water during summer and winter periods.
PROJECT NO. 80169200
REPORT NO. SINTEF A19989
VERSION 1.0
24 of 29
5 References
Arrhenius, S. (1889). Über die Reaktionsgeschwindigkeit bei der Inversion von Rohrzucker durch Säuren. Zeitschrift für Physikalische Chemie 139:79-103.
Brakstad, O.G., Booth, A., Zahlsen, K. (2011). Biodegradation of nitrosamines in water. Ready
biodegradability studies and literature review. SINTEF Report A18258 – Unrestricted. 38 pages. Fournier, D., Hawari, J., Streger, S.H., McClay, K., Hatzinger, P.B. (2006). Biotransformation of N-
nitrosodimethylamine by Pseudomonas mendocina KR1. Applied and Environmental Microbiology, 72, 6693-6698.
Gunnison, D., Zappi, M.E., Teeter, C., Pennington, J.C., Bajpai, R. (2000). Attenuation mechanisms of N-
nitrosodimethylamine at an operating intercept and treat groundwater remediation system. Journal of Hazardous Materials, 73, 179-197.
Kaplan, D.L. Kaplan, A.M. (1985). Biodegradation of N-Nitrosodimethylamine in Aqueous and Soil Systems.
Appl. Environ. Microbiol., 50, 1077-1086.
OECD Guidelines for the Testing of Chemicals Test No. 301: Ready Biodegradability . Adopted 17. June 1992.
OECD Guidelines for the Testing of Chemicals Test No. 3090: Aerobic Mineralisation in Surface Water – Simulation Biodegradation Test . Adopted 13. April 2004.
OECD Guidelines for the Testing of Chemicals. Revised Introduction to the OECD Guidelines for Testing of Chemicals, Section 3. Part 1: Principles and Strategies related to the Testing of degradation of Organic Chemicals. Adopted 23. March 2006.
Plumlee, M.H., Reinhard, M. (2007). Photochemical attenuation of N-nitrosodimethylamine (NDMA) and
other nitrosamines in surface water. Environmental Science and Technology, 41, 6170.6176.
Yang, W.C., Gan, J., Liu, W.P., Green, R. (2005). Degradation of N-Nitrosodimethylamine (NDMA) in
Landscape Soils. Journal of Environmental Quality, 34, 336-341.
Yordy, J.R., Alexander, M. (1980). Microbial metabolism of N-ntrosodiethanolamine in lake water and sewage. Applied and Environmental Microbiology, 39, 559-565.
PROJECT NO. 80169200
REPORT NO. SINTEF A19989
VERSION 1.0
25 of 29
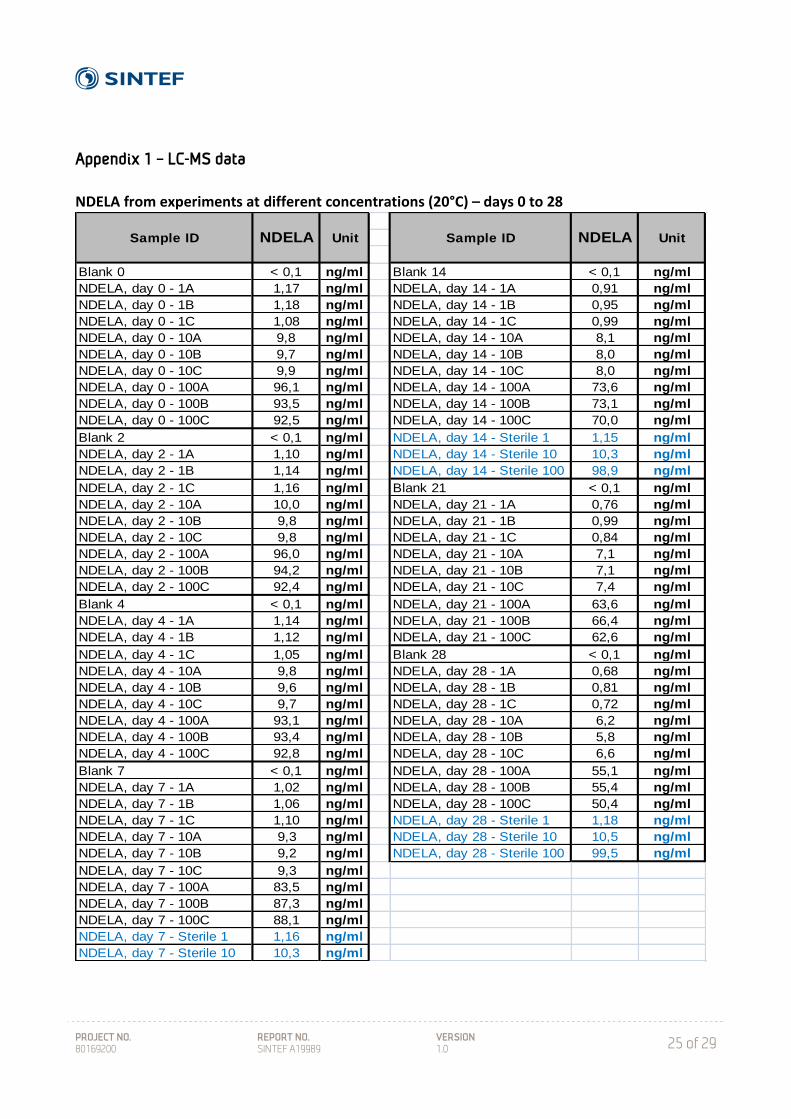
Appendix 1 – LC-MS data
NDELA from experiments at different concentrations (20°C) – days 0 to 28
Blank 0 < 0,1 ng/ml Blank 14 < 0,1 ng/ml
NDELA, day 0 - 1A 1,17 ng/ml NDELA, day 14 - 1A 0,91 ng/ml
NDELA, day 0 - 1B 1,18 ng/ml NDELA, day 14 - 1B 0,95 ng/ml
NDELA, day 0 - 1C 1,08 ng/ml NDELA, day 14 - 1C 0,99 ng/ml
NDELA, day 0 - 10A 9,8 ng/ml NDELA, day 14 - 10A 8,1 ng/ml
NDELA, day 0 - 10B 9,7 ng/ml NDELA, day 14 - 10B 8,0 ng/ml
NDELA, day 0 - 10C 9,9 ng/ml NDELA, day 14 - 10C 8,0 ng/ml
NDELA, day 0 - 100A 96,1 ng/ml NDELA, day 14 - 100A 73,6 ng/ml
NDELA, day 0 - 100B 93,5 ng/ml NDELA, day 14 - 100B 73,1 ng/ml
NDELA, day 0 - 100C 92,5 ng/ml NDELA, day 14 - 100C 70,0 ng/ml
Blank 2 < 0,1 ng/ml NDELA, day 14 - Sterile 1 1,15 ng/ml
NDELA, day 2 - 1A 1,10 ng/ml NDELA, day 14 - Sterile 10 10,3 ng/ml
NDELA, day 2 - 1B 1,14 ng/ml NDELA, day 14 - Sterile 100 98,9 ng/ml
NDELA, day 2 - 1C 1,16 ng/ml Blank 21 < 0,1 ng/ml
NDELA, day 2 - 10A 10,0 ng/ml NDELA, day 21 - 1A 0,76 ng/ml
NDELA, day 2 - 10B 9,8 ng/ml NDELA, day 21 - 1B 0,99 ng/ml
NDELA, day 2 - 10C 9,8 ng/ml NDELA, day 21 - 1C 0,84 ng/ml
NDELA, day 2 - 100A 96,0 ng/ml NDELA, day 21 - 10A 7,1 ng/ml
NDELA, day 2 - 100B 94,2 ng/ml NDELA, day 21 - 10B 7,1 ng/ml
NDELA, day 2 - 100C 92,4 ng/ml NDELA, day 21 - 10C 7,4 ng/ml
Blank 4 < 0,1 ng/ml NDELA, day 21 - 100A 63,6 ng/ml
NDELA, day 4 - 1A 1,14 ng/ml NDELA, day 21 - 100B 66,4 ng/ml
NDELA, day 4 - 1B 1,12 ng/ml NDELA, day 21 - 100C 62,6 ng/ml
NDELA, day 4 - 1C 1,05 ng/ml Blank 28 < 0,1 ng/ml
NDELA, day 4 - 10A 9,8 ng/ml NDELA, day 28 - 1A 0,68 ng/ml
NDELA, day 4 - 10B 9,6 ng/ml NDELA, day 28 - 1B 0,81 ng/ml
NDELA, day 4 - 10C 9,7 ng/ml NDELA, day 28 - 1C 0,72 ng/ml
NDELA, day 4 - 100A 93,1 ng/ml NDELA, day 28 - 10A 6,2 ng/ml
NDELA, day 4 - 100B 93,4 ng/ml NDELA, day 28 - 10B 5,8 ng/ml
NDELA, day 4 - 100C 92,8 ng/ml NDELA, day 28 - 10C 6,6 ng/ml
Blank 7 < 0,1 ng/ml NDELA, day 28 - 100A 55,1 ng/ml
NDELA, day 7 - 1A 1,02 ng/ml NDELA, day 28 - 100B 55,4 ng/ml
NDELA, day 7 - 1B 1,06 ng/ml NDELA, day 28 - 100C 50,4 ng/ml
NDELA, day 7 - 1C 1,10 ng/ml NDELA, day 28 - Sterile 1 1,18 ng/ml
NDELA, day 7 - 10A 9,3 ng/ml NDELA, day 28 - Sterile 10 10,5 ng/ml
NDELA, day 7 - 10B 9,2 ng/ml NDELA, day 28 - Sterile 100 99,5 ng/ml
NDELA, day 7 - 10C 9,3 ng/ml
NDELA, day 7 - 100A 83,5 ng/ml
NDELA, day 7 - 100B 87,3 ng/ml
NDELA, day 7 - 100C 88,1 ng/ml
NDELA, day 7 - Sterile 1 1,16 ng/ml
NDELA, day 7 - Sterile 10 10,3 ng/ml
UnitSample ID NDELA Unit Sample ID NDELA

PROJECT NO. 80169200
REPORT NO. SINTEF A19989
VERSION 1.0
26 of 29
NDELA from experiments at different concentrations (20°C) – days 42 and 56
Blank 42 <0,1 ng/ml
NDELA, day 42 - 1A 0,33 ng/ml
NDELA, day 42 - 1B 0,22 ng/ml
NDELA, day 42 - 1C 0,24 ng/ml
NDELA, day 42 - 10A 2,6 ng/ml
NDELA, day 42 - 10B 2,7 ng/ml
NDELA, day 42 - 10C 4,3 ng/ml
NDELA, day 42 - 100A 32,6 ng/ml
NDELA, day 42 - 100B 22,2 ng/ml
NDELA, day 42 - 100C 18,3 ng/ml
Blank 56 < 0,1 ng/ml
NDELA, day 56 - 1A 0,24 ng/ml
NDELA, day 56 - 1B < 0,1 ng/ml
NDELA, day 56 - 1C 0,16 ng/ml
NDELA, day 56 - 10A 1,2 ng/ml
NDELA, day 56 - 10B 1,2 ng/ml
NDELA, day 56 - 10C 2,5 ng/ml
NDELA, day 56 - 100A 22,4 ng/ml
NDELA, day 56 - 100B 8,2 ng/ml
NDELA, day 56 - 100C 4,3 ng/ml
NDELA, day 56 - Sterile 1 0,66 ng/ml
NDELA, day 56 - Sterile 10 8,3 ng/ml
NDELA, day 56 - Sterile 100 87,5 ng/ml
Sample ID NDELA Unit

PROJECT NO. 80169200
REPORT NO. SINTEF A19989
VERSION 1.0
27 of 29
NDELA from experiments at 5 and 10°C (concentration 1.0 µg/L)
NDELA 4-5°C NDELA 10°C
NDELA A 4-5°C day 0 1,28 ng/ml NDELA A 10°C day 0 1,18 ng/ml
NDELA B 4-5°C day 0 1,24 ng/ml NDELA B 10°C day 0 1,22 ng/ml
NDELA C 4-5°C day 0 1,47 ng/ml NDELA C 10°C day 0 1,16 ng/ml
NDELA A 4-5°C day 2 1,51 ng/ml NDELA A 10°C day 2 0,99 ng/ml
NDELA B 4-5°C day 2 1,13 ng/ml NDELA B 10°C day 2 1,17 ng/ml
NDELA C 4-5°C day 2 0,98 ng/ml NDELA C 10°C day 2 1,22 ng/ml
NDELA A 4-5°C day 4 1,28 ng/ml NDELA A 10°C day 4 0,91 ng/ml
NDELA B 4-5°C day 4 0,93 ng/ml NDELA B 10°C day 4 0,91 ng/ml
NDELA C 4-5°C day 4 0,92 ng/ml NDELA C 10°C day 4 0,89 ng/ml
NDELA Sterile 4-5°C day 7 1,23 ng/ml NDELA Sterile 10°C day 7 1,25 ng/ml
NDELA A 4-5°C day 7 1,17 ng/ml NDELA A 10°C day 7 1,12 ng/ml
NDELA B 4-5°C day 7 0,80 ng/ml NDELA B 10°C day 7 0,81 ng/ml
NDELA C 4-5°C day 7 0,87 ng/ml NDELA C 10°C day 7 0,80 ng/ml
NDELA Sterile 4-5°C day 14 1,26 ng/ml NDELA Sterile 10°C day 14 1,26 ng/ml
NDELA A 4-5°C day 14 1,08 ng/ml NDELA A 10°C day 14 1,03 ng/ml
NDELA B 4-5°C day 14 0,85 ng/ml NDELA B 10°C day 14 0,77 ng/ml
NDELA C 4-5°C day 14 0,81 ng/ml NDELA C 10°C day 14 0,73 ng/ml
NDELA A 4-5°C day 21 0,81 ng/ml NDELA A 10°C day 21 0,69 ng/ml
NDELA B 4-5°C day 21 0,84 ng/ml NDELA B 10°C day 21 0,67 ng/ml
NDELA C 4-5°C day 21 0,76 ng/ml NDELA C 10°C day 21 0,70 ng/ml
NDELA Sterile 4-5°C day 28 1,29 ng/ml NDELA Sterile 10°C day 28 1,23 ng/ml
NDELA A 4-5°C day 28 1,05 ng/ml NDELA A 10°C day 28 0,85 ng/ml
NDELA B 4-5°C day 28 0,72 ng/ml NDELA B 10°C day 28 0,65 ng/ml
NDELA C 4-5°C day 28 0,73 ng/ml NDELA C 10°C day 28 0,61 ng/ml
NDELA A 4-5°C day 42 0,71 ng/ml NDELA A 10°C day 42 0,63 ng/ml
NDELA B 4-5°C day 42 0,59 ng/ml NDELA B 10°C day 42 0,60 ng/ml
NDELA C 4-5°C day 42 0,65 ng/ml NDELA C 10°C day 42 0,58 ng/ml
NDELA Sterile 4-5°C day 56 1,23 ng/ml NDELA Sterile 10°C day 56 1,15 ng/ml
NDELA A 4-5°C day 56 0,78 ng/ml NDELA A 10°C day 56 0,48 ng/ml
NDELA B 4-5°C day 56 0,60 ng/ml NDELA B 10°C day 56 0,43 ng/ml
NDELA C 4-5°C day 56 0,63 ng/ml NDELA C 10°C day 56 0,46 ng/ml
UnitSample ID NDELA Unit Sample ID NDELA
Sample ID NDELA UnitSample ID NDELA Unit

PROJECT NO. 80169200
REPORT NO. SINTEF A19989
VERSION 1.0
28 of 29
NDMA from experiment at 20°C (10 µL/L nominal concentration)
Sample ID NDMA Unit
NDMA A 20°C Day 0 4,55 ng/ml
NDMA B 20°C Day 0 4,41 ng/ml
NDMA C 20°C Day 0 4,57 ng/ml
NDMA A 20°C Day 2 4,41 ng/ml
NDMA B 20°C Day 2 4,55 ng/ml
NDMA C 20°C Day 2 4,32 ng/ml
NDMA A 20°C Day 4 4,23 ng/ml
NDMA B 20°C Day 4 4,33 ng/ml
NDMA C 20°C Day 4 4,52 ng/ml
NDMA sterile 10°C Day 7 4,75 ng/ml
NDMA A 20°C Day 7 4,62 ng/ml
NDMA B 20°C Day 7 4,33 ng/ml
NDMA C 20°C Day 7 4,64 ng/ml
NDMA sterile 10°C Day 14 4,58 ng/ml
NDMA A 20°C Day 14 4,33 ng/ml
NDMA B 20°C Day 14 4,36 ng/ml
NDMA C 20°C Day 14 4,46 ng/ml
NDMA A 20°C Day 21 4,32 ng/ml
NDMA B 20°C Day 21 4,39 ng/ml
NDMA C 20°C Day 21 4,47 ng/ml
NDMA sterile 10°C Day 28 4,58 ng/ml
NDMA A 20°C Day 28 4,33 ng/ml
NDMA B 20°C Day 28 4,36 ng/ml
NDMA C 20°C Day 28 4,42 ng/ml
NDMA A 20°C Day 42 4,15 ng/ml
NDMA B 20°C Day 42 4,15 ng/ml
NDMA C 20°C Day 42 4,19 ng/ml
NDMA sterile Day 56 4,51 ng/ml
NDMA A 20°C Day 56 4,15 ng/ml
NDMA B 20°C Day 56 4,12 ng/ml
NDMA C 20°C Day 56 4,29 ng/ml

PROJECT NO. 80169200
REPORT NO. SINTEF A19989
VERSION 1.0
29 of 29
NPz from experiment at 20°C (10 µL/L nominal concentration)
Sample ID NPz Unit
NPz A 20°C Day 0 10,2 ng/ml
NPz B 20°C Day 0 7,8 ng/ml
NPz C 20°C Day 0 7,1 ng/ml
NPz A 20°C Day 2 10,9 ng/ml
NPz B 20°C Day 2 10,8 ng/ml
NPz C 20°C Day 2 8,4 ng/ml
NPz A 20°C Day 4 10,3 ng/ml
NPz B 20°C Day 4 10,6 ng/ml
NPz C 20°C Day 4 10,7 ng/ml
NPz sterile 10°C Day 7 9,5* ng/ml
NPz A 20°C Day 7 7,5* ng/ml
NPz B 20°C Day 7 5,2* ng/ml
NPz C 20°C Day 7 6,8* ng/ml
NPz sterile 10°C Day 14 9,4* ng/ml
NPz A 20°C Day 14 4,4* ng/ml
NPz B 20°C Day 14 3,9* ng/ml
NPz C 20°C Day 14 1,5* ng/ml
NPz A 20°C Day 21 10,3 ng/ml
NPz B 20°C Day 21 10,4 ng/ml
NPz C 20°C Day 21 10,4 ng/ml
NPz sterile 10°C Day 28 9,9 ng/ml
NPz A 20°C Day 28 10,6 ng/ml
NPz B 20°C Day 28 10,5 ng/ml
NPz C 20°C Day 28 10,5 ng/ml
* Samples were analysed 2 times with equal results
NPz A 20°C Day 42 10,3 ng/ml
NPz B 20°C Day 42 9,7 ng/ml
NPz C 20°C Day 42 9,6 ng/ml
NPz steril Day 56 10,2 ng/ml
NPz A 20°C Day 56 9,7 ng/ml
NPz B 20°C Day 56 9,9 ng/ml
NPz C 20°C Day 56 9,5 ng/ml

Technology for a better society
www.sintef.no