site master s110, s111, s330, s331 personal … · site master s110, s111, s330, s331 personal...
TRANSCRIPT

Site Master S110, S111, S330, S331
Personal SWR/RL and Fault Location Tester
User’s Guide
Hand-Held Tester For Antennas, TransmissionLines And Other RF Components

WARRANTYThe WILTRON product(s) listed on the title page is (are) warrantedagainst defects in materials and workmanship for one year from thedate of shipment.WILTRON’s obligation covers repairing or replacing products whichprove to be defective during the warranty period. Buyers shall prepaytransportation charges for equipment returned to WILTRON for war-ranty repairs. Obligation is limited to the original purchaser. WILTRONis not liable for consequential damages.
LIMITATION OF WARRANTYThe foregoing warranty does not apply to WILTRON connectors thathave failed due to normal wear. Also, the warranty does not apply todefects resulting from improper or inadequate maintenance by theBuyer, unauthorized modification or misuse, or operation outside theenvironmental specifications of the product. No other warranty is ex-pressed or implied, and the remedies provided herein are the Buyer’ssole and exclusive remedies.
TRADEMARK ACKNOWLEDGEMENTSMS-DOS, Windows, and Windows for Workgroups are registeredtrademarks of the Microsoft Corporation.Site Master, Site Master 110, Site Master S110, Site Master S111, SiteMaster 330, Site Master S330, and Site Master S331 are trademarks ofWiltron Company.
NOTICEWILTRON Company has prepared this manual for use by WILTRONCompany personnel and customers as a guide for the proper installa-tion, operation and maintenance of WILTRON Company equipmentand computer programs. The drawings, specifications, and informa-tion contained herein are the property of WILTRON Company, andany unauthorized use or disclosure of these drawings, specifications,and information is prohibited; they shall not be reproduced, copied, orused in whole or in part as the basis for manufacture or sale of theequipment or software programs without the prior written consent ofWILTRON Company.


Table of Contents
General Information . . . . . . . . . 1-1Introduction . . . . . . . . . . . . . . . . . 1-1Description . . . . . . . . . . . . . . . . . . 1-1Standard Accessories . . . . . . . . . . . . 1-2Optional Accessories . . . . . . . . . . . . 1-3Spares . . . . . . . . . . . . . . . . . . . . . 1-4Performance Specifications . . . . . . . . . 1-4
Operation . . . . . . . . . . . . . . . 2-1Introduction . . . . . . . . . . . . . . . . . 2-1Control Descriptions . . . . . . . . . . . . 2-1
Test Panel . . . . . . . . . . . . . . . . . . . . . . . 2-1Keypad . . . . . . . . . . . . . . . . . . . . . . . . . 2-2Soft Keys . . . . . . . . . . . . . . . . . . . . . . . . 2-6Remote Operation . . . . . . . . . . . . . . . . . . . 2-19
Operating Procedures . . . . . . . . . . . . 2-19Making common function selections . . . . 2-20
Applying Power . . . . . . . . . . . . . . . . . . . . 2-20Setting Options . . . . . . . . . . . . . . . . . . . . 2-20Setting Scale/Limits . . . . . . . . . . . . . . . . . . 2-21Determining Remaining Battery Life . . . . . . . . 2-22
Making frequency-domain measurements 2-23
Return Loss or SWR Measurement . . . . 2-23Selecting a Frequency Range . . . . . . . . . . . . . 2-23Performing a Calibration . . . . . . . . . . . . . . . 2-23Making a Measurement . . . . . . . . . . . . . . . . 2-25Scaling the Display . . . . . . . . . . . . . . . . . . 2-26Adjusting Markers . . . . . . . . . . . . . . . . . . 2-26
June 1996 10580-00005Copyright 1995, Wiltron Co. Revision: E

Adjusting a Limit . . . . . . . . . . . . . . . . . . . 2-27Saving a Setup . . . . . . . . . . . . . . . . . . . . . 2-27Recalling a Setup . . . . . . . . . . . . . . . . . . . 2-27Storing a Trace . . . . . . . . . . . . . . . . . . . . 2-28Recalling a Trace . . . . . . . . . . . . . . . . . . . 2-28
Cable Loss Measurement . . . . . . . . . . 2-29Selecting a Frequency Range . . . . . . . . . . . . . 2-29Performing a Calibration . . . . . . . . . . . . . . . 2-29Making a Measurement . . . . . . . . . . . . . . . . 2-31Scaling the Display . . . . . . . . . . . . . . . . . . 2-31Adjusting Markers . . . . . . . . . . . . . . . . . . 2-31Adjusting a Limit . . . . . . . . . . . . . . . . . . . 2-32Saving a Setup . . . . . . . . . . . . . . . . . . . . . 2-32Recalling a Setup . . . . . . . . . . . . . . . . . . . 2-33Storing a Trace . . . . . . . . . . . . . . . . . . . . 2-33Recalling a Trace . . . . . . . . . . . . . . . . . . . 2-33
Making distance-domain measurements . 2-34Selecting a Frequency Range . . . . . . . . . . . . . 2-34Performing a Calibration . . . . . . . . . . . . . . . 2-36Performing a DTF Measurement . . . . . . . . . . 2-37
Printing . . . . . . . . . . . . . . . . . . . . 2-39Printer Switch Settings . . . . . . . . . . . . . . . . 2-39Printing a Screen . . . . . . . . . . . . . . . . . . . 2-40
Symbols . . . . . . . . . . . . . . . . . . . . 2-41Self Test . . . . . . . . . . . . . . . . . . . 2-41Error Codes . . . . . . . . . . . . . . . . . 2-41
Self Test Errors . . . . . . . . . . . . . . . . . . . . 2-41Range Errors . . . . . . . . . . . . . . . . . . . . . 2-41
Replacing the Battery . . . . . . . . . . . . 2-41Using the Soft Carrying Case . . . . . . . . 2-46
ii

Software Tools Program . . . . . . . 3-1Description . . . . . . . . . . . . . . . . . . 3-1Requirements . . . . . . . . . . . . . . . . 3-1Communication Port Setting . . . . . . . . 3-2
Changing COM Port Settings–Windows 3.1 . . . . 3-2Changing COM Port Settings–Windows 95 . . . . . 3-4
Software Installation . . . . . . . . . . . . 3-6Plot Capture . . . . . . . . . . . . . . . . . 3-7
Multiple trace capture (preferred method) . . . . . 3-7Single trace capture . . . . . . . . . . . . . . . . . . 3-8
Program Operation . . . . . . . . . . . . . 3-10Fault Location Software . . . . . . . . . . 3-11Smith Chart Software . . . . . . . . . . . . 3-11Saving a Plot as a Windows Metafile . . . 3-12Saving Data to a Spreadsheet . . . . . . . . 3-12“Drag-n-Drop” . . . . . . . . . . . . . . . . 3-13
iii

Version Number Supported Features
1.0, 1.1 Initial Release
2.0 Adds:
Remote Operation
Printer Support
Internal Cable Table
Marker Peak Search
CW Mode
3.0 Adds:
DTF Windowing
Calibration Storage
Cable Loss Measurement
Site Master Firmware Version Table
iv

How to Use this ManualThe operation of the Site Master is straightforward and intuitive.
However, you may find it helpful to review the operation of the keysand menus prior to first-time use.
Descriptions of the keys and menus, along with measurement proce-dures, are provided in Chapter 2.
First-time users and maintenance supervisors will benefit from perus-ing the material in Chapter 1. This chapter describes the instrument andprovides listings of options and performance specifications.
Please Recycle
This product contains a recharageable battery. This battery may be recyclable.It may be illegal to dispose of this bat-tery in municipal waste sites. Checkwith your local solid-waste disposalauthority.
v
User's Guide
LCDContra
st
Site Master S331
Serial
Interface
External12V
Battery
Charging
12-15VDC
(45CmA)
MARKER
SAVEDISPLAYRECALLDISPLAY
LIMIT
SAVESETUPRECALLSETUP
CAL
ENTER
ONOFF
RUNHOLD
ESCAPECLEAR
AUTOSCALESTARTCAL
12
43
56
89
0
7
Test Port
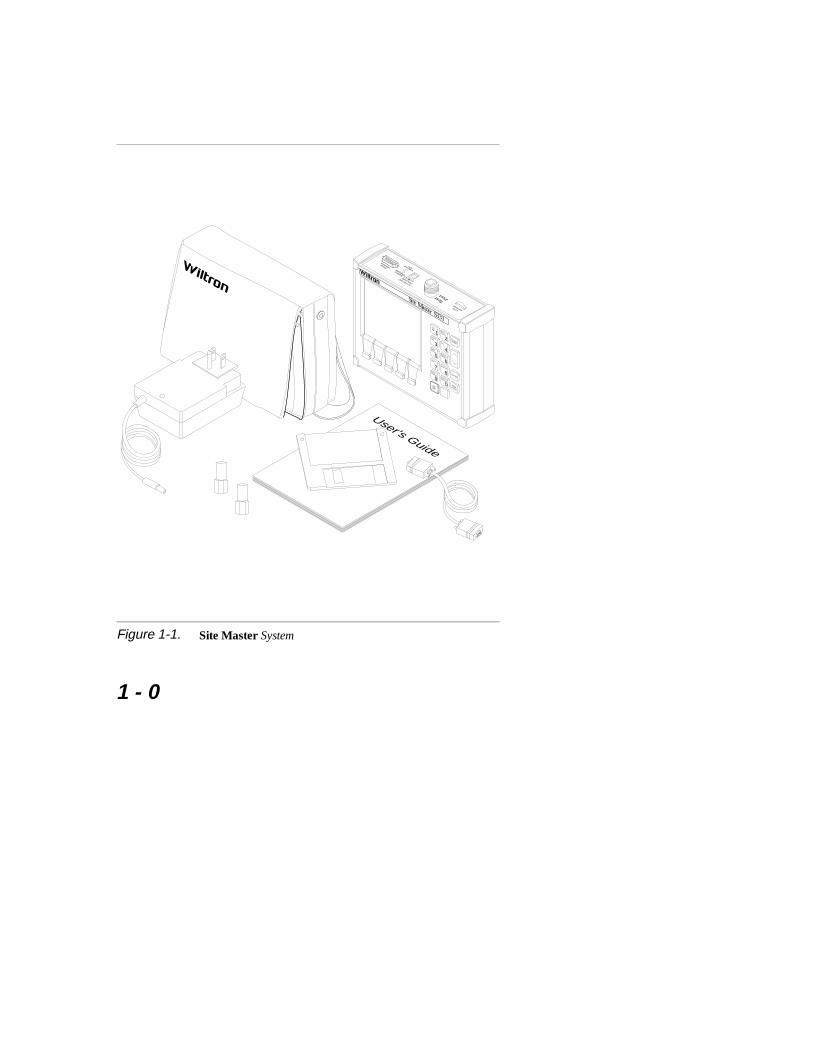
Figure 1-1. Site Master System
1 - 0

Chapter 1General Information
IntroductionThis chapter provides description, specification, and optional accesso-ries for the Site Master Series instruments. This series has four mem-bers, as shown below. Throughout this manual, the term Site Masterwill refer to the series; whereas, the terms Site Master S110, S130,S111, and S331 will refer to the applicable individual models.
Model Frequency Range
S110 600 to 1200 MHz
S111 300 to 1200 MHz
S330 700 to 3300 MHz
S331 25 to 3300 MHz
DescriptionThe Site Master (Figure 1-1) is a hand held SWR/RL(standing waveratio/return loss) and Distance-To-Fault measurement instrument thatincludes a built-in synthesized signal source. It uses a keypad to enterdata and a liquid crystal display (LCD) to provide a graphical indica-tion of SWR or RL over the selected frequency range. The Site MasterS111 and S331 have a built-in distance-to-fault capability. The SiteMaster S110 and S330, as well as models S111 and S331, allow meas-urement data to be converted to Fault Location via the companion Soft-
1
1 - 1

ware Tools program. The Site Master is capable of up to two hours ofcontinuous operation from a fully charged internal battery. It can alsobe operated from a 12.5 dc source (which will also simultaneouslycharge the battery). Built-in energy conservation features can be usedto extend battery life over an eight-hour work day.
The Site Master is designed for measuring SWR, return loss, or cableinsertion loss and locating faulty RF components in antenna systems.The displayed trace can be scaled and/or enhanced with settable fre-quency markers and/or a limit line. A menu option provides for an audi-ble “beep” when the limit value is exceeded. To permit use in low-lightenvironments, the LCD can be back lit using a front panel key.
Standard AccessoriesA PC based software program (called Software Tools) provides an on-line database record for storing measurement data. Site Master Soft-ware Tools can also convert the Site Master display to a MicrosoftWindows 3.x graphic. Measurements stored in the Site Master internalmemory are down-loaded to the PC using the included serial cable.This null-modem serial cable connects between the Serial Interface con-nector on the Site Master and a Com Port on a DOS/Windows-basedPC. Once stored, the graphic trace can then be displayed, scaled, and/orenhanced with markers and limit lines. Historical graphs can be over-laid with current data by using the PC’s mouse in “drag-n-drop” fash-ion. The underlying data can be extracted and used in spreadsheets orfor other analytical tasks.
The Software Tools program also performs DTF (Distance To Fault) orFault Location by clicking on the appropriate icon.
Chapter 1 General Information
1 - 2

The following items are supplied with the basic hardware.
• Soft carrying case
• Standard Calibration Components
• AC-DC adapter
• Automotive Cigarette Lighter 12 Volt DC Adapter
• 3 1/2-inch floppy disk containing the Software Tools program.This program contains Fault Location (DTF) and Smith Chartfunctions.
• Serial Interface Cable, Part Number 800-441
• One year Warranty (includes battery, firmware, and software)
• User’s Guide
• Programming Manual
Optional Accessories• Wiltron precision N type Short/Open, Part No. 22N50
• Site Master precision N Load, 42 dB Part No. SM/PL
• Test Port Extension Cable, 1.5 meter, Part No. TP/ECN 1.5
• Test Port Extension Cable, 3.0 meter, Part No. TP/ECN 3.0
• Test Port Extension Cable, 5.0 meter, Part No. TP/ECN 5.0
• Test Port Extension Cable, 1.5 meter, Part No. TP/EC 1.5
• Test Port Extension Cable, 3.0 meter, Part No. TP/EC 3.0
• Test Port Extension Cable, 5.0 meter, Part No. TP/EC 5.0
Chapter 1 General Information
1 - 3

• Transit Case for Site Master, Part No. 760-194A
• HP Deskjet 340 Printer, Part No. 2000-766
• Serial-to-Parallel Converter Cable (use with theHP 340 Printer), Part No. 2000-753
• Seiko DPU-411 Thermal Printer, Part No. 2000-754 or 2000-761
• Serial Interface Cable (use with the DPU-411Printer), Part No. 2000-756
• Thermal Paper (use with the DPU-411 Printer), Part No. 2000-755
Spares• N type Standard Short, Part No. SM/STS
• N type Standard Load, 35 dB, Part No. SM/STL
• Soft Carrying Case, Part No. D41955
• AC/DC Adapter, Part No. 40-97
• Serial Interface Cable, Part Number 800-441
Performance SpecificationsPerformance specifications are provided in Table 1-1.
Chapter 1 General Information
1 - 4

Specifications are valid when the unit is calibrated at ambienttemperature after a 5 minute warmup.
Description Value
Frequency Range Site Master S110 Site Master S111 Site Master S330 Site Master S331
600 to 1200 MHz300 to 1200 MHz700 to 3300 MHz25 to 3300 MHz
Frequency Accuracy (CW Mode) 75 parts per million
Frequency Resolution 100 kHz
Measurement Range VSWR 1.00 to 65.00
Return Loss Resolution 0.1 dB
*Fault Location Resolution,nominal
0.8% of maximum range
Dynamic Range 54 dB
Directivity (corrected) 35 dB (Standard Calibration)42 dB (Precision Calibration)
Test Port, Type N 50 Ohms
Max. Power output, nominal Site Master S110, S111 Site Master S330, S331
+9 dBm–7 dBm (25 to 800 MHz)–3 dBm (800 to 1600 MHz)–14 dBm (1600 to 3300 MHz)
**Immunity to Interfering signalsup to the level of
+10 dBm (Site Master S110, S111)–15 dBm (Site Master S330, S331)
Maximum Input (Damage Level) +22 dBm
Table 1-1. Performance Specifications (1 of 2)
Chapter 1 General Information
1 - 5

Measurement AccuracyMeasurement accuracy depends on calibration components.Standard calibration components have a directivity of 35 dB.Precision calibration components have a directivity of 42 dB.
Temperature Storage Operation
–20° C to 75° C0° C to 50° C
Maximum (burnout) level ofincoming signal at port
+22 dBm
Weight 2.2 pounds
Size 8x7x21⁄4 inches
* Fault location is accomplished by inverse Fourier Transformation of data taken withthe Site Master. Resolution and maximum range depend on the number of frequencydata points, frequency sweep range and relative propagation velocity of the cable beingtested.
Maximum Range = (1.5 × 10⁸) (129) (Vf)
(F2−F1)Where: F1 is start frequency
F2 is stop frequency Vf is relative propagation velocity
** Immunity measurement is made in CW mode with incoming intefering signal exactlyat the same frequency (worst case situation). Typical immunity is better when sweptfrequency is used.
Table 1-1. Performance Specifications (2 of 2)
Chapter 1 General Information
1 - 6

This page is intentionally blank
Chapter 1 General Information
1 - 7

LCDContra
st
Site Master S331
Serial
Interface
External12V
Battery
Charging
12-15VDC
(45CmA)
MARKER
SAVEDISPLAYRECALLDISPLAY
LIMIT
SAVESETUPRECALLSETUP
CAL
ENTER
ONOFF PRINT
RUNHOLD
ESCAPECLEAR
AUTOSCALESTARTCAL
12
43
56
89
0
7
Test Port
Soft Keys LIMIT
SAVE DISPLAY
ON/OFF
RUNHOLD
RECALL DISPLAY
ENTER
MAKER
RECALLSETUP
Up/Down Arrow
CAL
ESCAPECLEAR
AUTO SCALE
DisplayContrast
Test Port
12.5-15V DC(600 mA)
ExternalPower
SerialInterface
BatteryCharging
Back Lighting
STARTCAL
SAVESETUP
Figure 2-1. Site Master Controls and Connectors
2 - 0

Chapter 2 Operation
IntroductionThis chapter provides a description of each control and describes howto calibrate the Site Master and make a measurement.
Control DescriptionsControl descriptions are given below; the test panel controls and con-nectors are listed first. The keypad controls follow and are listed alpha-betically. Then, the soft keys and menu structure are described usingFigure 2-3 (page 2-7).
Test Panel
12.5-15VDC(600 mA)
Provides input for battery charging the unit. Input is12.5 to 15 Vdc @ 600 mA.
Battery Charging
Indicator light to show that the battery is beingcharged.
External Power
Indicator light to show that the Site Master is beingpowered by the external charging unit.
DisplayContrast
Thumbwheel control adjusts contrast level for theliquid crystal display.
2
2 - 1
SerialInterface
Provides an RS232 DB9 interface with a Com Porton a personal computer (for use with the WILTRONSoftware Tools program). Also provides an interfaceto a HP Deskjet 340 printer or a Seiko DPU-411Thermal printer.
Test Port
Provides RF output, 50Ω impedance.
Keypad
Turns the liquid crystal display (LCD) back-lightingON or OFF. (Leaving back lighting off conservesbattery power.)
AUTO SCALE
Automatically scales the display for optimumresolution.
CAL Opens a calibration menu. Use Up/Down Arrow keyand ENTER key to select a stored calibration (A orB) or turn CAL off.
ENTER Implements certain menu and key selections.
ESCAPECLEAR
Exits the present operation and/or clears the display.If a parameter is being edited, pressing this key willclear the value currently being entered and restore thelast valid entry. Pressing this key again will close theparameter. During normal sweeping, pressing thiskey will move up one menu level.
LIMIT Calls up the Scale Menu.
MARKER Calls up the Marker Menu.
Chapter 2 Operation
2 - 2

ONOFF
Turns the Site Master on or off. When turned on, thesystem state at the last turn-off is restored.
PRINT Prints the current display to the selected printer.
RECALL DISPLAY
Recalls a previously saved trace from memory loca-tion 1 through 40. When the key is pressed, “Recalldisplay:” appears on the display. Select an appropri-ate number from the keypad and press the ENTERkey to implement.
RECALL SETUP
Recalls a previously saved setup from memory loca-tion 0 through 9. When the key is pressed, “RecallSetup:” appears on the display. Select an appropriatenumber from the keypad and press the ENTER keyto implement. Setup 0 recalls the factory preset state.
RUNHOLD
When in the Hold mode, this key starts the Site Mas-ter sweeping and provides a Single Sweep Mode trig-ger; when in the Run mode, it pauses the sweep.When in the Hold mode, the hold symbol (Table 2-1,page 2-41) appears on the left side of the LCD.(HOLD conserves considerable battery power.)
SAVE DISPLAY
Saves the displayed trace to 1 of 40 internal non-volatile memory locations. When the key is pressed,“Save display:” appears on the display. Select anappropriate number from the keypad and press the ENTER key to implement.
CAUTION:The selected memory location will be over-written by the SAVE DISPLAY operation. No warningis given.
Chapter 2 Operation
2 - 3
SAVE SETUP
Saves the current system setup to 1 of 9 internal non-volatile memory locations. When the key is pressed,“Save Setup:” appears on the display. Select anappropriate number from the keypad and press theENTER key to implement.
CAUTION:The selected memory location will be over-written by the SAVE SETUP operation. No warning isgiven.
START CAL
Opens a calibration menu. Us the Up/Down Arrowkey and ENTER key to select the location to storethe calibration (A or B) or cancel the command. Theexisting calibration in the location chosen will beoverwritten once the calibration is performed.
Follow the text in the message area that instructs youto do the following:
Connect OPEN, Press ENTERThe Site Master then measures the “open” testport (standard calibration), or the calibration“open” (precision calibration kit) that you must at-tach to the end of the test port or transmission line.
Connect SHORT, Press ENTERThe Site Master then measures the calibration“short” that you must attach to the end of the testport or transmission line.
Chapter 2 Operation
2 - 4

Connect LOAD, Press ENTERThe Site Master then measures the 50Ω termina-tion (load) that you must attach to the end of thetest port or transmission line.
NOTES: The order of the “Open,” “Short,” and “Load” measure-ments can be changed or the selection repeated us-ing the Up/Down Arrow Key.
The combined measurements of an open, a short,and a known-impedance load normalizes the meas-urement system, to account for uncertainties intro-duced by measurement-system components (e.g.,cables, connectors, etc.).
Up/Down Arrow Key
Increments or decrements a parameter value.
Chapter 2 Operation
2 - 5
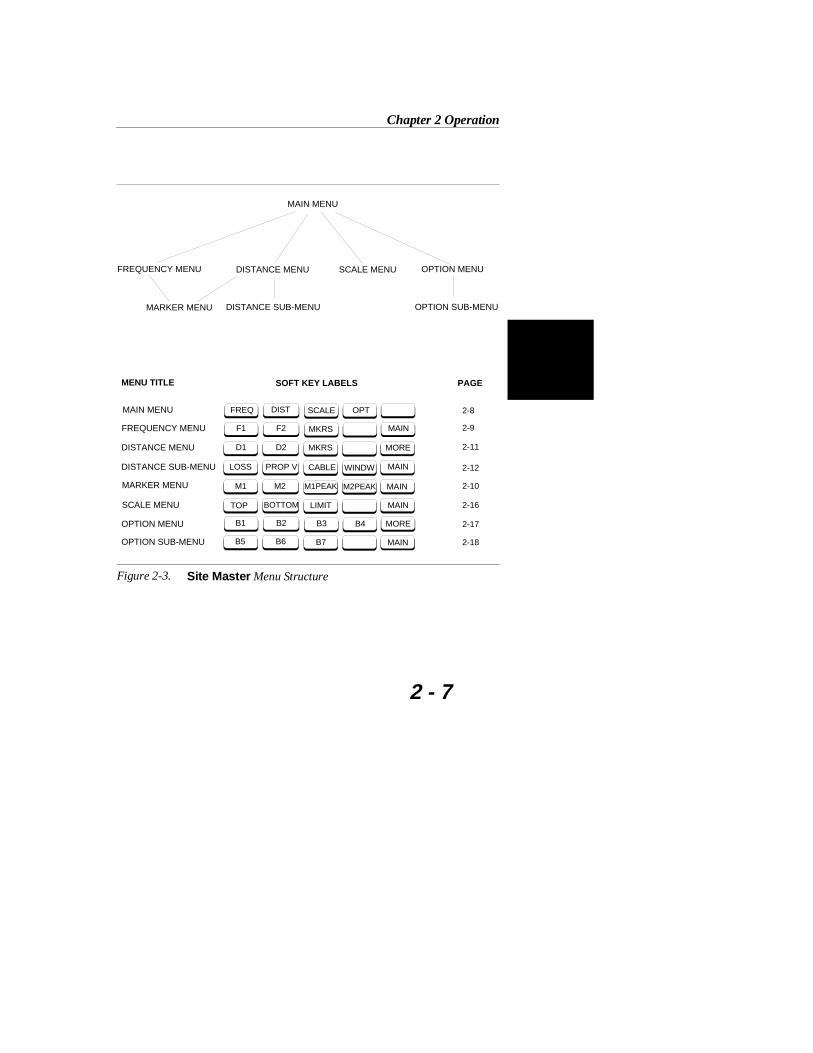
Soft Keys
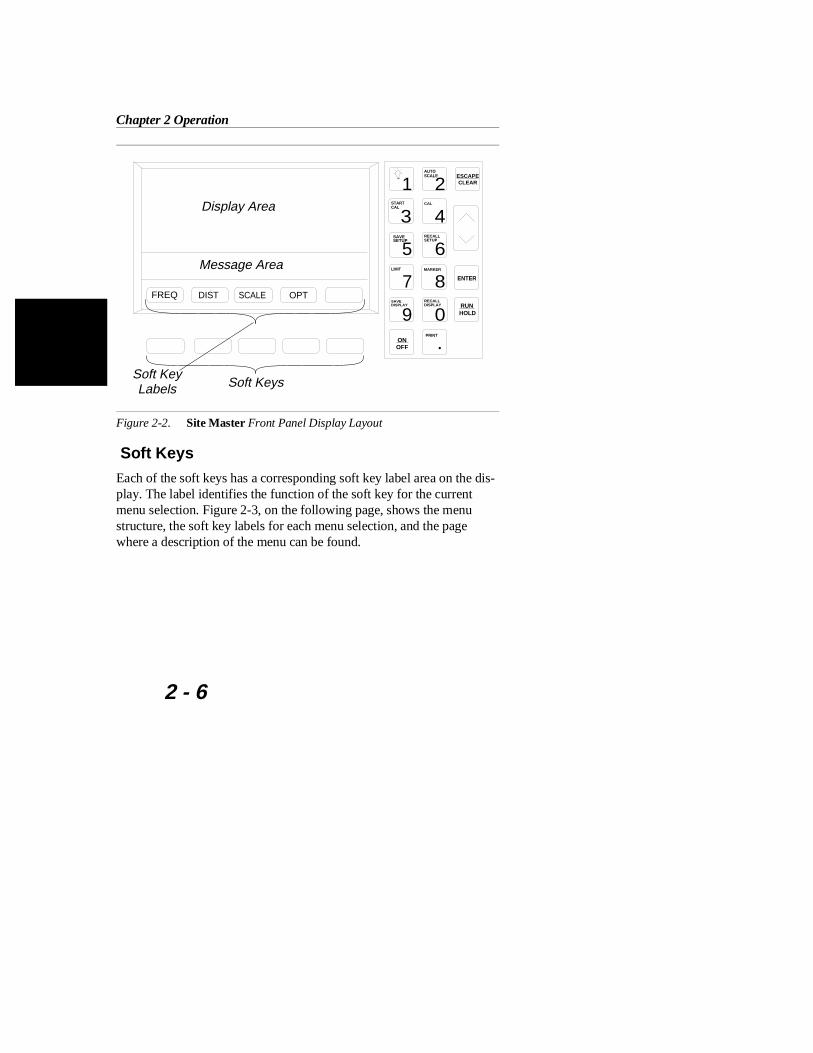
Each of the soft keys has a corresponding soft key label area on the dis-play. The label identifies the function of the soft key for the currentmenu selection. Figure 2-3, on the following page, shows the menustructure, the soft key labels for each menu selection, and the pagewhere a description of the menu can be found.
ESCAPECLEAR
RECALLSETUP
.
Message Area
Display Area
STARTCAL
LIMIT
SAVEDISPLAY
RECALLDISPLAY
MARKER
SAVESETUP
CAL
AUTOSCALE
ON OFF
RUN HOLD
ENTER
1 2
43
5 6
87
9 0FREQ SCALE OPTDIST
Soft KeysSoft KeyLabels
Figure 2-2. Site Master Front Panel Display Layout
Chapter 2 Operation
2 - 6
FREQUENCY MENU
DISTANCE MENU
DISTANCE SUB-MENU
MARKER MENU
SCALE MENU
OPTION MENU
OPTION SUB-MENU
SOFT KEY LABELSMENU TITLE
2-8
PAGE
2-9
2-11
2-12
2-10
2-16
2-17
2-18
MAIN MENU FREQ DIST OPTSCALE
F1 F2 MKRS MAIN
TOP BOTTOM LIMIT MAIN
B1 B2 B4B3 MORE
B5 B6 B7 MAIN
D1 D2 MKRS MORE
LOSS PROP V CABLE MAIN
M1 M2 M1PEAK M2PEAK MAIN
MAIN MENU
FREQUENCY MENU DISTANCE MENU
DISTANCE SUB-MENUMARKER MENU
SCALE MENU OPTION MENU
OPTION SUB-MENU
WINDW
Figure 2-3. Site Master Menu Structure
Chapter 2 Operation
2 - 7

Main Menu At turn on, the Main Menu soft keys, below, are dis-played, and the Marker status is shown in the mes-sage area.
These soft keys provide the following menu selec-tions:
FREQ — Selects the Frequency Menu, describedon page 2-9.
DIST — Selects the Distance Menu, described onpage 2-11.
SCALE —Selects the Scale Menu, described onpage 2-16.
OPT — Selects the Option Menu, descibed onpage 2-17.
FREQ DIST OPTSCALE
Chapter 2 Operation
2 - 8

FrequencyMenu(FREQ)
Provides for setting sweep frequency end-points.Also provides access to the Marker Menu. Selectedfrequency values may be changed using the keypador Up/Down Arrow key.
Choosing FREQ causes the soft keys, below, to bedisplayed and the corresponding values to be shownin the message area.
F1 — Opens the F1 parameter for data entry. Thisis the start value for the frequency sweep. PressENTER when data entry is complete.
F2 — Opens the F2 parameter for data entry. Thisis the stop value for the frequency sweep. PressENTER when data entry is complete.
MKRS — Selects the Markers Menu, describedon page 2-10.
MAIN — Returns to the Main Menu.
F1 F2 MKRS MAIN
Chapter 2 Operation
2 - 9

MarkerMenu(MKRS)
Provides for setting marker values. Selected fre-quency or distance values may be changed using thekeypad or Up/Down Arrow key.
Choosing MKRS causes the soft keys, below, to bedisplayed and the corresponding values to be shownin the message area.
Pressing the MARKER key will also call up thismenu.
M1 — Turns M1 marker OFF, if it is currentlyON. If M1 is currently OFF, turns it ON andopens the M1 marker parameter for data entry anddisplays the SWR, RL, or CL value and distancein Distance to Fault mode. Press ENTER whendata entry is complete.
M2 — Turns M2 marker OFF, if it is currentlyON. If M2 is currently OFF, turns it ON andopens the M2 marker parameter for data entry anddisplays the SWR, RL, or CL value. Press EN-TER when data entry is complete.
M1PEAK — Places the M1 marker at the fre-quency or distance with the peak SWR or RLvalue.
M2PEAK — Places the M2 marker at the fre-quency or distance with the peak SWR or RLvalue.
MAIN — Returns to the Main Menu.
M1 M2 M1PEAK M2PEAK MAIN
Chapter 2 Operation
2 - 10
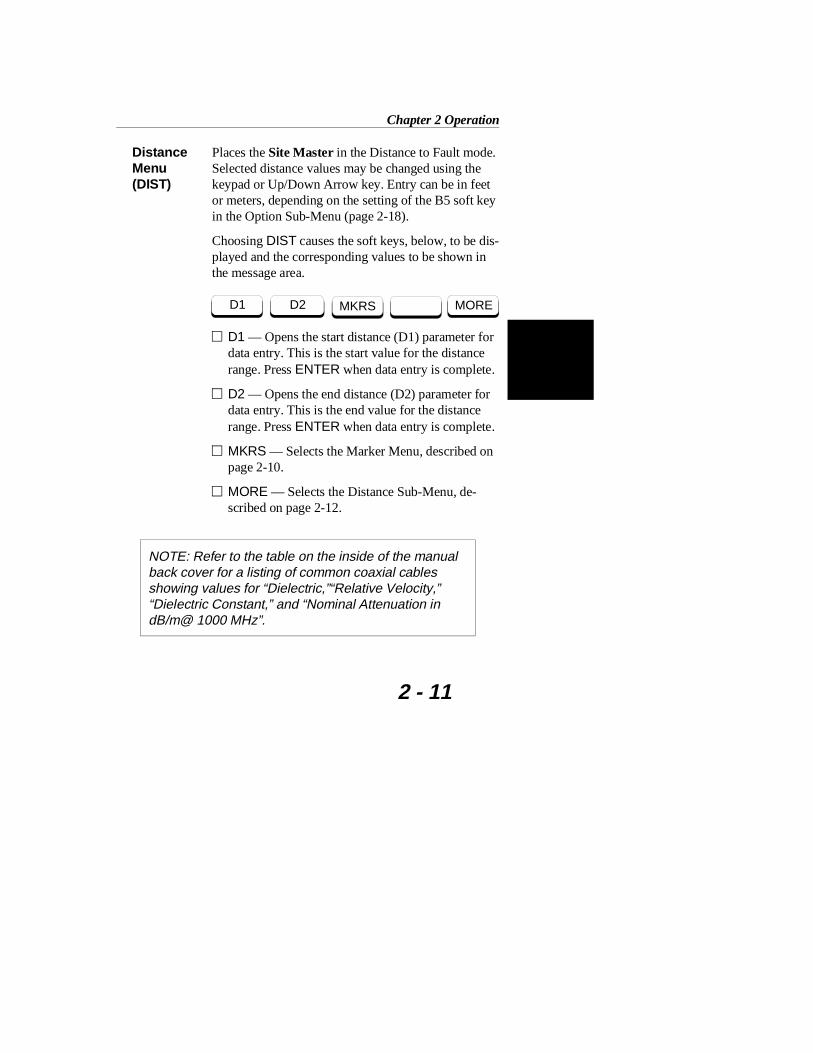
DistanceMenu(DIST)
Places the Site Master in the Distance to Fault mode.Selected distance values may be changed using thekeypad or Up/Down Arrow key. Entry can be in feetor meters, depending on the setting of the B5 soft keyin the Option Sub-Menu (page 2-18).
Choosing DIST causes the soft keys, below, to be dis-played and the corresponding values to be shown inthe message area.
D1 — Opens the start distance (D1) parameter fordata entry. This is the start value for the distancerange. Press ENTER when data entry is complete.
D2 — Opens the end distance (D2) parameter fordata entry. This is the end value for the distancerange. Press ENTER when data entry is complete.
MKRS — Selects the Marker Menu, described onpage 2-10.
MORE — Selects the Distance Sub-Menu, de-scribed on page 2-12.
NOTE: Refer to the table on the inside of the manualback cover for a listing of common coaxial cablesshowing values for “Dielectric,”“Relative Velocity,”“Dielectric Constant,” and “Nominal Attenuation indB/m@ 1000 MHz”.
D1 D2 MKRS MORE
Chapter 2 Operation
2 - 11

DistanceSub-Menu
Provides for setting the cable loss and relative propa-gation velocity of the coaxial cable. Selected valuesmay be changed using the keypad or Up/Down Ar-row key.
Choosing MORE causes the soft keys, below, to bedisplayed and the corresponding values to be shownin the message area.
LOSS — Opens the Cable Loss parameter for dataentry. Enter the loss per foot (or meter) for thetype of transmission line being tested. Press EN-TER when data entry is complete. (Range is 0.000to 5.000 dB/m)
PROP V (relative propagation velocity) — Opensthe Propagation Velocity parameter for data entry.Enter the propagation velocity for the type oftransmission line being tested. Press ENTERwhen data entry is complete. (Range is 0.010 to1.000)
CABLE — Opens a menu of common coaxial ca-bles. Use the up/down arrow key and ENTER keyto make a selection. This feature is provided as arapid means of setting both cable loss and propaga-tion velocity.
WINDW — Opens a menu of FFT windowingtypes for the DTF calculation. Use the Up/DownArrow key and ENTER key to make a selection.
LOSS PROP V CABLE MAINWINDW
Chapter 2 Operation
2 - 12

NOTE: Using WindowingThe theoretical requirement for inverse FFT is for thedata to extend from zero frequency to infinity. Sidelobes appear around a discontinuity due to the factthat the spectrum is cut off at a finite frequency. Win-dowing reduces the side lobes by smoothing out thesharp transitions at the beginning and end of the fre-quency sweep. As the side lobes are reduced themain lobe widens thereby reducing the resolution.
In situations where there may be a small discontinuityclose to a large one, side lobe reduction Windowingshould be used. When distance resolution is criticalWindowing can be reduced. The types of Windowingin order of increasing side lobe reduction are: rectan-gular, nominal side lobe, low side lobe, minimum sidelobe. Figures 2-4 thru 2-7, on pages 2-14 and 2-15,are examples of the types of Windowing.
MAIN — Returns to the Main Menu.
Chapter 2 Operation
2 - 13

Feet5 10 15 20 25 30 35 40 45 50 55 60
-5
-10
-15
-20
-25
-30
-35
-40
-45
-50
Return Loss (dB)
Distance To Fault
Figure 2-4. Rectangular Windowing Example
Distance To Fault
5 10 15 20 25 30Feet
35 40 45 50 55 60
-5
-10
-15
-20
-25
-30
-35
-40
-45
-50
Return Loss (dB)
Figure 2-5. Nominal Side Lobe Windowing Example
Chapter 2 Operation
2 - 14

Distance To Fault
5 10 15 20 25 30Feet
35 40 45 50 55 60
-5
-10
-15
-20
-25
-30
-35
-40
-45
-50
Return Loss (dB)
Figure 2-6. Low Side Lobe Windowing Example
Distance To Fault
5 10 15 20 25 30 35 40 45 50 55 60Feet
-5
-10
-15
-20
-25
-30
-35
-40
-45
-50
Return Loss (dB)
Figure 2-7. Minimum Side Lobe Windowing Example
Chapter 2 Operation
2 - 15

Scale Menu(SCALE)
Provides for changing the display scale. Selected values may be changed using the keypad orUp/Down Arrow key.
Choosing SCALE causes the soft keys, below, to bedisplayed and the corresponding values to be shownin the message area.
Pressing the LIMIT key on the keypad will also callup this menu.
TOP — Opens the TOP parameter for data entryand provides for setting the top scale value. PressENTER when data entry is complete.
BOTTOM — Opens the BOTTOM parameter fordata entry and provides for setting the bottomscale value. Press ENTER when data entry is com-plete.
LIMIT — Turns Limit OFF, if currently ON. IfLimit is currently OFF, turns it ON and opens theLimit parameter for data entry. Press ENTERwhen data entry is complete.
MAIN — Returns to the Main Menu.
TOP BOTTOM LIMIT MAIN
Chapter 2 Operation
2 - 16

OptionMenu(OPT)
Provides for selecting Site Master options.
Choosing OPT causes the soft keys, below, to be dis-played and the corresponding values to be shown inthe message area.
B1 MODE — Opens a menu of measurementmodes; Return Loss (RL), Standing Wave Ratio(SWR), and Cable Loss(CL). Use the Up/DownArrow key and ENTER key to make a selection.
B2 LIMIT BEEP ON/OFF — Toggles the limitbeeping sound on or off. When on, the Site Mas-ter sounds a beep when the measured value isabove the limit line.
B3 KEYBD LOCK ON/OFF — Toggles the key-board locking feature on or off. When on, the key-board (except for the keys listed below) is lockedto prevent inadvertant data entry.
When locked, pressing any key (except ON/OFF,RUN/HOLD, MORE, MAIN, OPT, and B3)will cause the lock-out symbol (Table 2-1, page2-41) to display along the left edge of the LCDand an error beep to sound.
B4 SINGLE SWP ON/ OFF — Toggles thesingle sweep function on or off. When on, the SiteMaster will have to be manually triggered usingthe RUN/HOLD key on the keypad for eachsweep.
B1 B2 B4B3 MORE
Chapter 2 Operation
2 - 17

MORE — Selects the Option Sub-Menu, de-scribed below.
OptionSub-Menu
Provides for selecting additional Site Master options.
Choosing MORE causes the soft keys, below, to bedisplayed and the corresponding values to be shownin the message area.
B5 UNITS — Toggles between ENGLISH andMETRIC units.
B6 FIXED CW — Toggles the fixed CW func-tion on or off. When on, if F1 is set equal to F2, aCW frequency is fixed at the selected value. Whenoff, a narrow band of frequencies, centered on theselected frequency, is generated.
B7 PRINTER — Displays a menu of supportedprinters—None, Seiko DPU-411, and HP Deskjet340. Use the up/down arrow key and ENTER keyto make the selection.
MAIN — Returns to the Main Menu.
B5 B6 B7 MAIN
Chapter 2 Operation
2 - 18

Remote Operation
(Available in Firmware Version 2.0 or later)All Site Master functions, settings, and operating modes (except forpower on/off) are controllable using commands sent from an externalcomputer via the serial port. A detailed description of the programmingcommands is available in the Site Master Programming Manual, P/N10580-00010.
Operating ProceduresSite Master operation can be divided into three functional areas: com-mon functions, frequency domain, and distance domain.
• Common functions are options and scale functions that arecommon to both frequency- and distance-domain measure-ments.
• Frequency domain measurements consist of Return Loss (RL),Standing Wave Ratio (SWR), and Cable Loss (CL) made overa selectable frequency range. RL and SWR characterize themagnitude of reflections present in a device or transmissionline. CL measurements display the insertion loss of a transmis-sion line over frequency.
• Distance domain measurements—commonly known as dis-tance-to-fault (DTF)—are made over a selectable distancerange. They include RL or SWR, but they also return informa-tion that can help locate discontinuities in a transmission line.CL cannot be measured in the distance domain.
Chapter 2 Operation
2 - 19

CAUTION: The measurement system MUST be cali-brated at the ambient temperature prior to making ameasurement. You must calibrate when the setup fre-quency is changed. The instrument can store up totwo calibrations. These stored calibrations are inde-pendent of any stored setups. When you recall astored setup, perform a new calibration or recall astored calibration.
Making common function selectionsCommon functions are options and scale functions that are common toboth frequency- and distance-domain measurements.
Applying Power
Step 1. Turn the Site Master on using the ON/OFF key.
Step 2. Observe that the Site Master opening screen appearsand that it performs a self test. The firmware versionand model number are shown in the opening screen.
Setting Options
Step 3. Press the OPT soft key, from the Main Menu (page 2-8).
Step 4. Accept or change the settings of the B1 through B7options. Refer to pages 2-17 and 2-18 for a descrip-tion of each option.
Chapter 2 Operation
2 - 20

Setting Scale/Limits
Step 5. Press the SCALE soft key, from the Main Menu.
Step 6. Accept or change the settings. To change, press theapplicable TOP, BOTTOM , or LIMIT soft key andeither:
Enter a numeric value from the keypad and pressthe ENTER key.
Or press the Up/Down Arrow key and press theENTER key.
Chapter 2 Operation
2 - 21
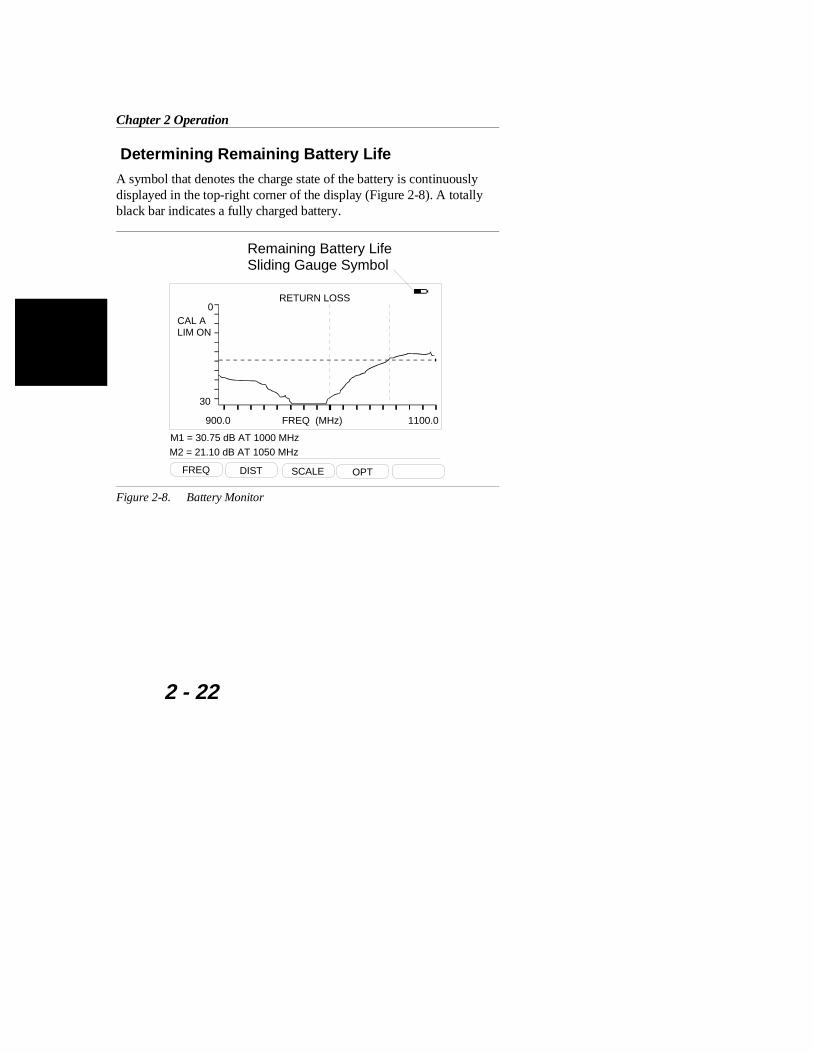
Determining Remaining Battery Life
A symbol that denotes the charge state of the battery is continuouslydisplayed in the top-right corner of the display (Figure 2-8). A totallyblack bar indicates a fully charged battery.
Remaining Battery LifeSliding Gauge Symbol
30
CAL A0
LIM ON
RETURN LOSS
M1 = 30.75 dB AT 1000 MHz
900.0 1100.0FREQ (MHz)
M2 = 21.10 dB AT 1050 MHz
FREQ DIST SCALE OPT
Figure 2-8. Battery Monitor
Chapter 2 Operation
2 - 22
Making frequency-domain measurementsFrequency domain measurements consist of Return Loss (RL), Stand-ing Wave Ratio (SWR), or Cable Loss (CL) measurements made over aselectable frequency range.
Return Loss or SWR Measurement
Selecting a Frequency Range
Step 1. Press the FREQ soft key, from the Main Menu (page 2-8).
Step 2. Press the F1 soft key from the Frequency Menu(page 2-9).
Step 3. Enter the desired numerical value using the keypador the Up/Down Arrow key (Figure 2-1, page 2-0).Press ENTER when data entry is complete.
Step 4. Press the F2 soft key.
Step 5. Enter the desired numerical value using the keypador the Up/Down Arrow key. Press ENTER whendata entry is complete.
Step 6. Check that the FREQ (MHz) scale in the display areaindicates the new frequency start and stop values.
Performing a Calibration
Step 7. Perform a measurement calibration, using theSTART CAL key. Select CAL A or CAL B. Follow the ensuing “Connect OPEN, Press EN-TER,” “Connect SHORT, Press ENTER,” and
Chapter 2 Operation
2 - 23
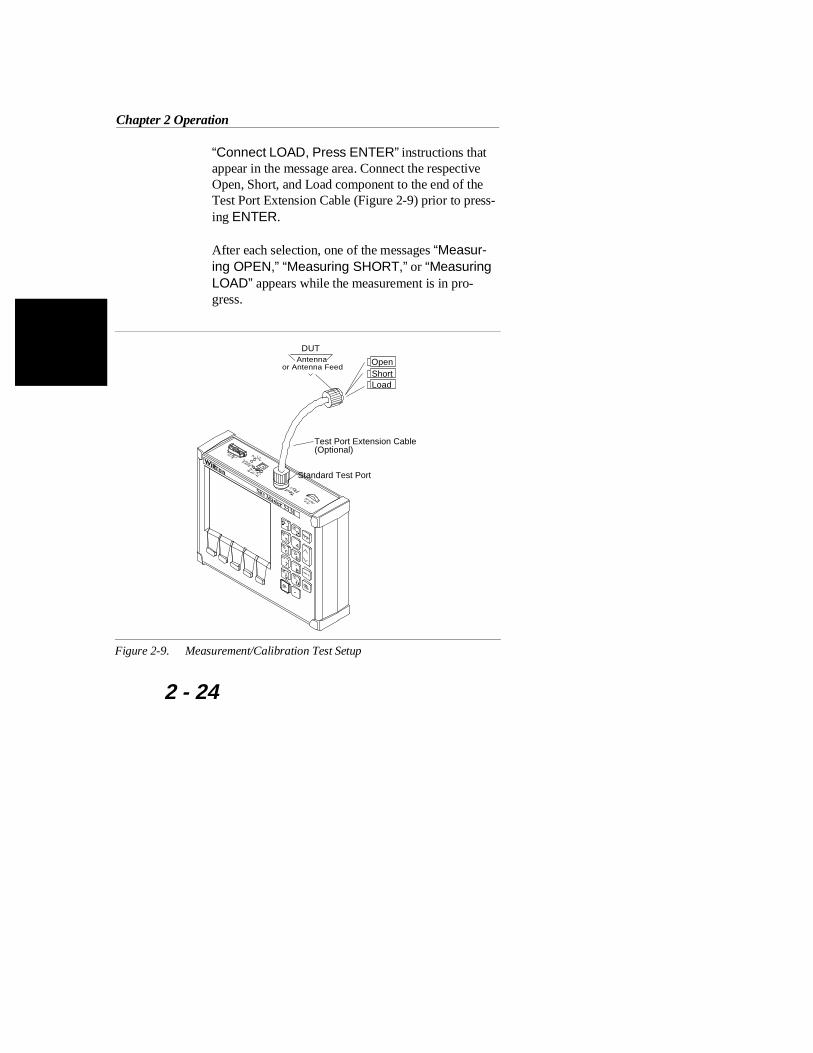
“Connect LOAD, Press ENTER” instructions thatappear in the message area. Connect the respectiveOpen, Short, and Load component to the end of theTest Port Extension Cable (Figure 2-9) prior to press-ing ENTER.
After each selection, one of the messages “Measur-ing OPEN,” “Measuring SHORT,” or “MeasuringLOAD” appears while the measurement is in pro-gress.
ShortLoad
Test Port Extension Cable(Optional)
Antennaor Antenna Feed
DUT
Standard Test Port
Open
Figure 2-9. Measurement/Calibration Test Setup
Chapter 2 Operation
2 - 24

If, during a calibration, you wish to repeat a meas-urement or change the order in which the Open,Short, and Load are connected, press Up/Down Ar-row key.
NOTES: For best calibration results — compensation for allmeasurement system uncertainties — ensure that theOpen/Short/Load is at the end of the test port or op-tional extension cable; that is, at the same point thatyou will connect the antenna or device to be tested.
For best results, use a phase stable Test Port Exten-sion Cable (see Optional Accessories). If you use atypical laboratory cable to extend the Site Master testport to the device-under-test, cable bending sub-sequent to the Open/ Short/Load calibration willcause uncompensated phase reflections inside thecable. Thus, cables which are NOT phase stable maycause measurement errors that are more pronouncedas the test frequency increases.
For optimum calibration, Wiltron recommends using preci-sion calibration components.
Making a Measurement
Step 8. Connect the device-under-test to the Site MasterTest Port or the Test Port Extension Cable.
Step 9. Observe the displayed waveform.
Chapter 2 Operation
2 - 25
Scaling the Display
Step 10. The display can be scaled using either of the follow-ing methods:
Automatically scale the display using the AUTOSCALE key (Figure 2-1, page 2-0).
Manually scale the display using the SCALE softkey—from the Main Menu—and the TOP andBOTTOM soft keys from the ensuing soft keymenu (page 2-16).
Adjusting Markers
Step 11. Press the MARKER key (Figure 2-1, page 2-0) tocall up the Marker Menu.
Step 12. If M1 needs to be turned OFF, press the M1 soft keyon the Markers Menu. If M1 needs to be turned ON,press the M1 soft key again. This will open the M1parameter for entry. If needed, enter the desired nu-merical value using the keypad or the Up/Down Ar-row key (Figure 2-1, page 2-0). Press ENTER whenthe data entry is complete.
Step 13. If M2 needs to be turned OFF, press the M2 soft keyon the Markers Menu. If M2 needs to be turned ON,press the M2 soft key again. This will open the M2parameter for entry. If needed, enter the desired nu-merical value using the keypad or the Up/Down Ar-row key (Figure 2-1, page 2-0). Press ENTER whenthe data entry is complete.
Step 14. Press the MAIN soft key to return to the Main Menu.
Chapter 2 Operation
2 - 26

Adjusting a Limit
Step 15. Press the LIMIT key (Figure 2-1, page 2-0) to call upthe Scale Menu.
Step 16. If the Limit needs to be turned OFF, press theLIMIT soft key on the Scale Menu. If the Limitneeds to be turned ON, press the LIMIT soft keyagain. This will open the Limit parameter for entry. Ifneeded, enter the desired numerical value using thekeypad or the Up/Down Arrow key (Figure 2-1, page2-0). Press ENTER when the data entry is complete.
Step 17. If you wish to have an audible beep when the trace isabove the limit line, press the OPT soft key from theMain Menu (page 2-8).
Step 18. Press the B2 soft key from the Option Menu (page2-17) to toggle the limit beep indicator ON.
Saving a Setup
Step 19. Press the SAVE SETUP key (Figure 2-1, page 2-0).
Step 20. Enter the desired numerical value using the keypad(1 to 9) or the Up/Down Arrow key. Press ENTERwhen data entry is complete.
Recalling a Setup
Step 21. Press the RECALL SETUP key.
Step 22. Enter the desired numerical value using the keypad(1 to 9) or the Up/Down Arrow key. Press ENTERwhen data entry is complete. To restore the factorydefaults, enter 0, then press ENTER.
Chapter 2 Operation
2 - 27

Storing a Trace
Step 23. Press the SAVE DISPLAY key.
Step 24. Enter the desired numerical value using the keypad(1 to 40) or the Up/Down Arrow key. Press ENTERwhen data entry is complete.
Recalling a Trace
Step 25. Press the RECALL DISPLAY key.
Step 26. Enter the desired numerical value using the keypad(1 to 40) or the Up/Down Arrow key. Press ENTERwhen data entry is complete.
Chapter 2 Operation
2 - 28

Cable Loss Measurement
Selecting a Frequency Range
Step 1. Press the FREQ soft key, from the Main Menu (page 2-8).
Step 2. Press the F1 soft key from the Frequency Menu(page 2-9).
Step 3. Enter the desired numerical value using the keypador the Up/Down Arrow key (Figure 2-1, page 2-0).Press ENTER when data entry is complete.
Step 4. Press the F2 soft key.
Step 5. Enter the desired numerical value using the keypador the Up/Down Arrow key. Press ENTER whendata entry is complete.
Step 6. Check that the FREQ (MHz) scale in the display areaindicates the new frequency start and stop values.
Performing a Calibration
Step 7. Perform a measurement calibration, using theSTART CAL key. Select CAL A or CAL B. Followthe ensuing “Connect OPEN, Press ENTER,”“Connect SHORT, Press ENTER,” and “Con-nect LOAD, Press ENTER” instructions that ap-pear in the message area. Connect the respectiveOpen, Short, and Load component to the end of theTest Port Extension Cable (Figure 2-9, page 2-24)prior to pressing ENTER.
Chapter 2 Operation
2 - 29

After each selection, one of the messages “Measur-ing OPEN,” “Measuring SHORT,” or “MeasuringLOAD” appears while the measurement is in pro-gress.
If, during a calibration, you wish to repeat a meas-urement or change the order in which the Open,Short, and Load are connected, press Up/Down Ar-row key.
NOTES: For best calibration results — compensation for allmeasurement system uncertainties — ensure that theOpen/Short/Load is at the end of the test port or op-tional extension cable; that is, at the same point thatyou will connect the antenna or device to be tested.
For best results, use a phase stable Test Port Exten-sion Cable (see Optional Accessories). If you use atypical laboratory cable to extend the Site Master testport to the device-under-test, cable bending sub-sequent to the Open/ Short/Load calibration willcause uncompensated phase reflections inside thecable. Thus, cables which are NOT phase stable maycause measurement errors that are more pronouncedas the test frequency increases.
For optimum calibration, Wiltron recommends using preci-sion calibration components.
Chapter 2 Operation
2 - 30

Making a Measurement
Step 8. Connect the cable to be tested to the Site MasterTest Port or the end of the Test Port Extension Cable(if used).
Step 9. Place an Open or Short at the other end of the cable.
Step 10. Observe the displayed cable loss vs frequency.
Scaling the Display
Step 11. The display can be scaled using either of the follow-ing methods:
Automatically scale the display using the AUTOSCALE key (Figure 2-1, page 2-0).
Manually scale the display using the SCALE softkey—from the Main Menu—and the TOP andBOTTOM soft keys from the ensuing soft keymenu (page 2-16).
Adjusting Markers
Step 12. Press the MARKER key (Figure 2-1, page 2-0) tocall up the Marker Menu.
Step 13. If M1 needs to be turned OFF, press the M1 soft keyon the Markers Menu. If M1 needs to be turned ON,press the M1 soft key again. This will open the M1parameter for entry. If needed, enter the desired nu-merical value using the keypad or the Up/Down Ar-row key (Figure 2-1, page 2-0). Press ENTER whenthe data entry is complete.
Chapter 2 Operation
2 - 31

Step 14. If M2 needs to be turned OFF, press the M2 soft keyon the Markers Menu. If M2 needs to be turned ON,press the M2 soft key again. This will open the M2parameter for entry. If needed, enter the desired nu-merical value using the keypad or the Up/Down Ar-row key (Figure 2-1, page 2-0). Press ENTER whenthe data entry is complete.
Step 15. Press the MAIN soft key to return to the Main Menu.
Adjusting a Limit
Step 16. Press the LIMIT key (Figure 2-1, page 2-0) to call upthe Scale Menu.
Step 17. If the Limit needs to be turned OFF, press theLIMIT soft key on the Scale Menu. If the Limitneeds to be turned ON, press the LIMIT soft keyagain. This will open the Limit parameter for entry. Ifneeded, enter the desired numerical value using thekeypad or the Up/Down Arrow key (Figure 2-1, page2-0). Press ENTER when the data entry is complete.
Step 18. If you wish to have an audible beep when the trace isabove the limit line, press the OPT soft key from theMain Menu (page 2-8).
Step 19. Press the B2 soft key from the Option Menu (page2-17) to toggle the limit beep indicator ON.
Saving a Setup
Step 20. Press the SAVE SETUP key (Figure 2-1, page 2-0).
Chapter 2 Operation
2 - 32

Step 21. Enter the desired numerical value using the keypad(1 to 9) or the Up/Down Arrow key. Press ENTERwhen data entry is complete.
Recalling a Setup
Step 22. Press the RECALL SETUP key.
Step 23. Enter the desired numerical value using the keypad(1 to 9) or the Up/Down Arrow key. Press ENTERwhen data entry is complete. To restore the factorydefaults, enter 0, then press ENTER.
Storing a Trace
Step 24. Press the SAVE DISPLAY key.
Step 25. Enter the desired numerical value using the keypad(1 to 40) or the Up/Down Arrow key. Press ENTERwhen data entry is complete.
Recalling a Trace
Step 26. Press the RECALL DISPLAY key.
Step 27. Enter the desired numerical value using the keypad(1 to 40) or the Up/Down Arrow key. Press ENTERwhen data entry is complete.
Chapter 2 Operation
2 - 33

Making distance-domain measurementsDistance domain measurements—commonly known as distance-to-fault (DTF)—are made over a selectable distance range. They return in-formation that can help locate discontinuities in a transmission line.
Selecting a Frequency Range
NOTE:The maximum distance range is determined by thefrequency span, number of data points, and relativepropagation velocity:
Maximum Unaliased Range = (1.5 × 10⁸) (129) (Vf)
F2 − F1
Where: F1 is start frequency
F2 is stop frequency
Vf is relative propagation velocity
maximum unaliased range is in meters.
Refer to Figure 2-10, page 2-35, for a plot of maximum distance
range versus frequency span.
Step 1. Press the FREQ soft key, from the Main Menu (page2-8).
Step 2. Press the F1 soft key from the ensuing soft key menu.
Step 3. Enter the desired numerical value using the keypador the Up/Down Arrow key (Figure 2-1, page 2-0).Press ENTER when data entry is complete.
Step 4. Press the F2 soft key.
Chapter 2 Operation
2 - 34
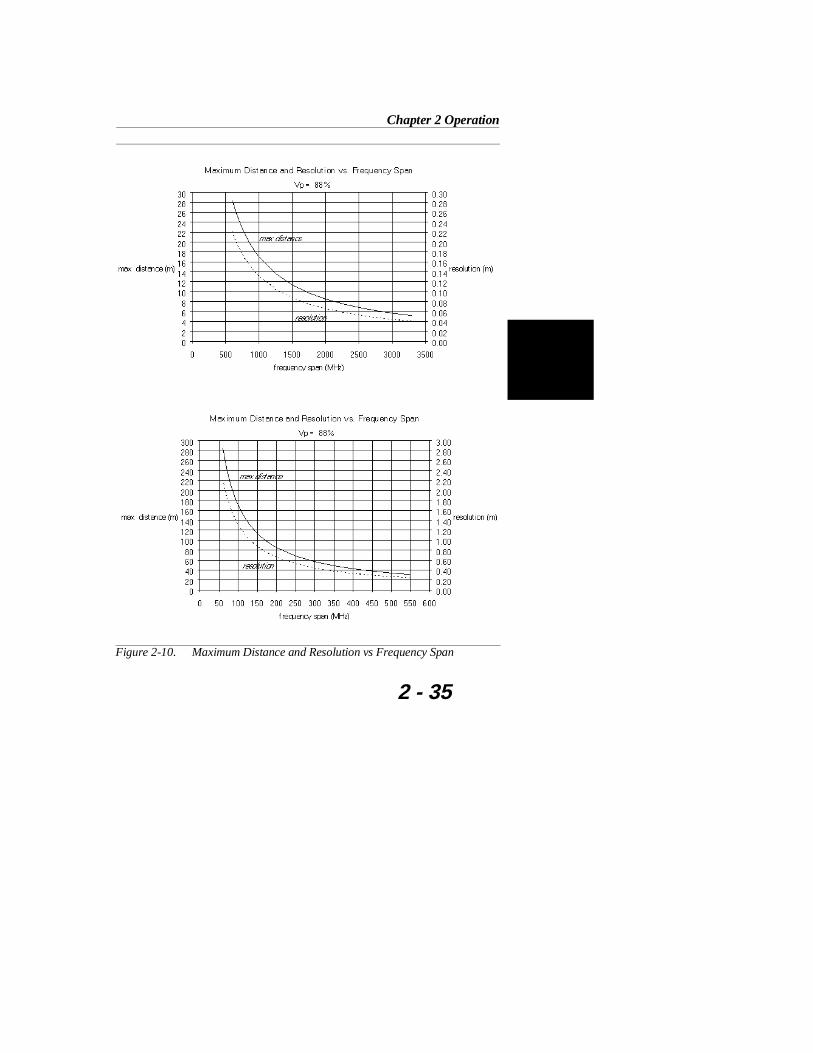
Figure 2-10. Maximum Distance and Resolution vs Frequency Span
Chapter 2 Operation
2 - 35

Step 5. Enter the desired numerical value using the keypador the Up/Down Arrow key. Press ENTER whendata entry is complete.
Step 6. Check that the FREQ (MHz) scale in the display areaindicates the new frequency start and stop values.
Performing a Calibration
Step 7. Perform a measurement calibration, using theSTART CAL key. Select CAL A or CAL B. Followthe ensuing “Connect OPEN, Press ENTER,”“Connect SHORT, Press ENTER,” and “ConnectLOAD, Press ENTER” instructions that appear inthe message area. Connect the respective Open,Short, and Load component to the end of the TestPort Extension Cable (Figure 2-9, page 2-24) prior topressing ENTER.
After each selection, one of the messages “Measur-ing OPEN,” “Measuring SHORT,” and “Measur-ing LOAD” appears while the measurement is inprogress.
If, during a calibration, you wish to repeat a meas-urement or change the order in which the Open,Short, and Load are connected, press Up/Down ar-row key.
Chapter 2 Operation
2 - 36

NOTES: For best calibration results — compensation for allmeasurement system uncertainties — ensure that theOpen/Short/Load is at the end of the test port or op-tional extension cable; that is, at the same point thatyou will connect the antenna or device to be tested.
For best results, use a phase stable Test Port Exten-sion Cable (see Optional Accessories). If you use atypical laboratory cable to extend the Site Master testport to the device-under- test, cable bending sub-sequent to the Open/ Short/Load calibration willcause uncompensated phase reflections inside thecable. Thus, cables which are NOT phase stable maycause measurement errors that are more pronouncedas the test frequency increases.
For optimum calibration, Wiltron recommends using preci-sion calibration components.
Performing a DTF Measurement
Step 8. Press the DIST soft key, from the Main Menu (page2-8).
Step 9. Press the D1 soft key from the ensuing soft key menu(page 2-11).
Step 10. Enter the desired numerical value using the keypador the Up/Down Arrow key (Figure 2-1, page 2-0).Press ENTER when data entry is complete.
Step 11. Repeat the above two steps for D2.
Chapter 2 Operation
2 - 37

Step 12. Press the MKRS soft key to go to the Markers Menu(page 2-10).
Step 13. Press the M1 soft key.
Step 14. Enter the desired numerical value using the keypador the Up/Down Arrow key. Press ENTER whendata entry is complete.
Step 15. Repeat the above two steps for M2.
Step 16. Press the MAIN soft key to return to the Main Menu.
Step 17. Press the DIST soft key to go to the Distance Menu.
Step 18. Press the MORE soft key to go to the Distance Sub-Menu.
Step 19. Press the CABLE soft key to select a coaxial cablefrom the menu or press the LOSS and PROP V softkeys to enter cable loss and relative propagation ve-locity parameters manually (page 2-12). The loss ofthe cable shown in the cable menu is @1000 MHz.
Step 20. Enter the desired numerical values using the keypador the Up/Down Arrow key. Press ENTER whendata entry is complete.
Step 21. Press the MAIN soft key to return to the Main Menu.
Step 22. After calculations are complete (approximately 8 sec-onds), observe that the message area displays the re-turn loss data at the two marker points.
Chapter 2 Operation
2 - 38

NOTES: Press the B5 soft key from the Option Sub-Menu(page 2-18) to toggle between feet and meters. Values entered in either will freely convert to theother.
Loss and relative propagation velocity values formany common cable types are listed in the table onthe inside of the manual back cover.
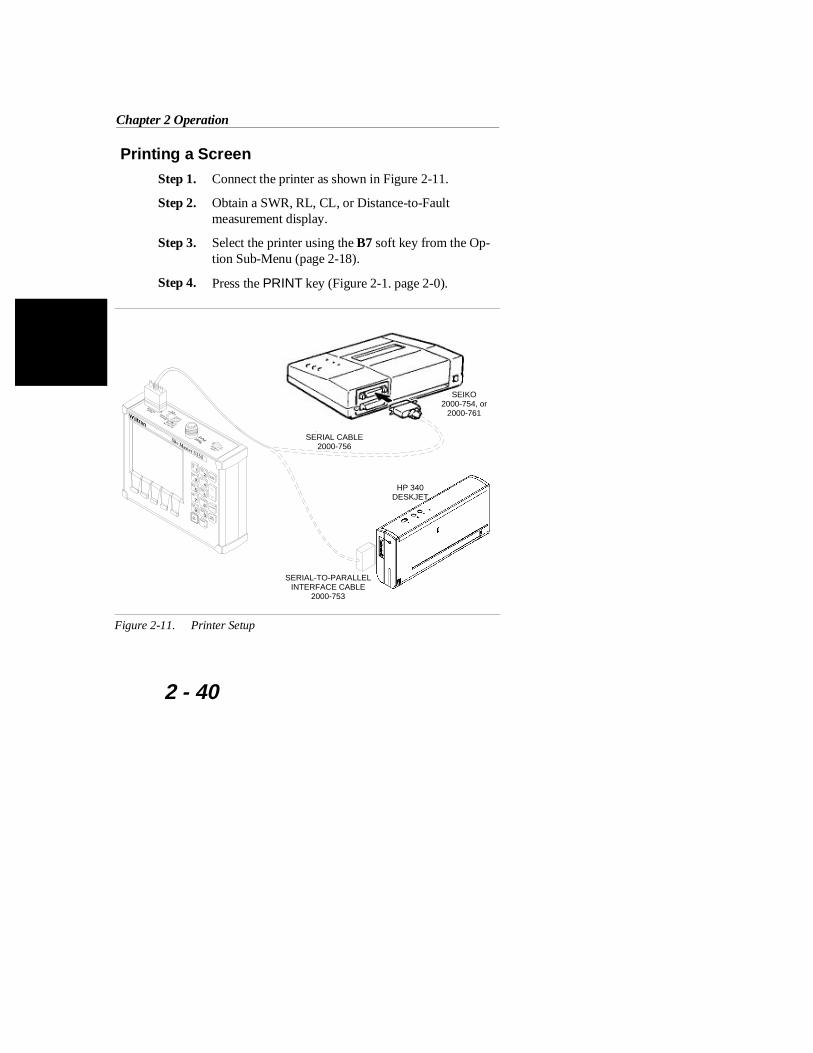
PrintingPrinting is accomplished with either of two printers: the Seiko DPU-411 thermal printer or the Hewlett Packard DeskJet 340 ink jet printer.Figure 2-11 shows a setup diagram for these two printers.
Printer Switch Settings
Set the switches, SW1 and SW2, on the Seiko DPU-411 thermal printeras follows:
Switch 1 2 3 4 5 6 7 8
SW1 OFF ON ON ON ON OFF ON ON
SW2 ON ON ON OFF OFF OFF
Chapter 2 Operation
2 - 39
Printing a Screen
Step 1. Connect the printer as shown in Figure 2-11.
Step 2. Obtain a SWR, RL, CL, or Distance-to-Fault measurement display.
Step 3. Select the printer using the B7 soft key from the Op-tion Sub-Menu (page 2-18).
Step 4. Press the PRINT key (Figure 2-1. page 2-0).
SEIKO2000-754, or
2000-761
HP 340DESKJET
SERIAL CABLE2000-756
SERIAL-TO-PARALLELINTERFACE CABLE
2000-753
Figure 2-11. Printer Setup
Chapter 2 Operation
2 - 40

SymbolsTable 2-1 provides a listing of the symbols used as condition indicatorson the LCD display.
Self TestAt turn-on, the Site Master runs through a series of quick checks to en-sure that the system is functioning properly. Note that the battery volt-age and temperature are displayed in the lower left corner below theself test message. If the battery is low, or if the ambient temperature isnot within the specified operational range, Self Test will fail. If SelfTest fails AND the battery is fully charged AND the Site Master iswithin the specified operating range, call your Wiltron Service Center.
Error Codes
Self Test Errors
A listing of Self Test Error messages is given in Table 2-2.
Range Errors
A listing of Range Error messages is given in Table 2-3.
Replacing the BatteryReplacing the battery is the only recommended field-level maintenanceaction. If your battery fails, contact your Wiltron Sales Office or Serv-ice Center. Table 2-4 provides a listing of current service centers.
Chapter 2 Operation
2 - 41

Icon Symbol
Site Master is in Hold or Power Conservationmode. To resume sweeping, press theRUN/HOLD key. After 10 minutes without akey press, the Site Master will automaticallyenter into its power conservation mode.
Site Master is in keypad lockout mode. Toturn off keypad lockout, use the B3 soft key(page 2-17).
Lock fail indication. Check battery. (If SiteMaster fails to lock with a fully charged bat-tery, call your Wiltron Service Center.)
Processor timeout failure. Symbol appears atthe frequency that causes an input RF overload;it then disappears as the sweep continues pastthat point.
When calibration is performed, the Site Mas-ter stores the ambient temperature. If the tem-perature drifts outside the specified range, thisindicator will flash. A recalibration at the cur-rent temperature is recommended.
Indicates the remaining charge on the battery.The inner white rectangle grows longer as thebattery charge depletes.
Table 2-1. LCD Symbols
Chapter 2 Operation
2 - 42

Error Message Description
BATTERY LOW Battery voltage is less than 12.5 volts.Charge battery. If condition persists, callyour WILTRON Service Center.
EXTERNALPOWER LOW
External supply voltage is less than 12.5volts. Call your WILTRON Service Center
PLL FAILED Phase-locked loops failed to lock. Chargebattery. If condition persists with a fullycharged battery, call your WILTRONService Center
INTEGRATORFAILED
Integration circuit could not charge to avalid level. Charge battery. If conditionpersists with a fully charged battery, callyour WILTRON Service Center.
EEPROM R/WFAILED
Non-volatile memory system has failed.Call your WILTRON Service Center.
OUT OF TEMP.RANGE
Ambient temperature is not within thespecified operating range. Returntemperature to specified operating range. Ifcondition persists, call your WILTRONService Center.
Note: A listing of current WILTRON service centers is given in Table 2-4.
Table 2-2. Self Test Error Messages
Chapter 2 Operation
2 - 43

Error Message Description
RANGEERROR:F1 > F2
The start (F1) frequency is greater than thestop (F2) frequency.
RANGEERROR:D1 > D2
The start (D1) distance is greater than thestop (D2) distance.
RANGEERROR:D2 >DMax=xx.x ft (m)
The stop distance (D2) exceeds themaximum unaliased range. This range isdetermined by the frequency span, numberof points, and relative propagation velocity:
Maximum Unaliased Range = (1.5 × 10
8) (129) (Vf)F2 − F1
Where: F1 is start frequency
F2 is stop frequency
Vf is relative propagation velocity
maximum unaliased range is in meters
Refer to Figure 2-10, page 2-35, for a plot of maximum
range versus frequency span.
RANGE ERROR:TOP<=BOTTOM
The SWR scale parameter top value is lessthan its bottom value.
RANGE ERROR:TOP>=BOTTOM
The RL scale parameter top value is greaterthan its bottom value.
CALINCOMPLETE
A complete open, short, and load calibrationmust be performed before calibration can beturned on.
CAL VALID FROM:xxxx.x to xxxx.x MHz
The calibration was performed at afrequency range that is different from thecurrent range.
Table 2-3. Range Error Messages (1 of 2)
Chapter 2 Operation
2 - 44
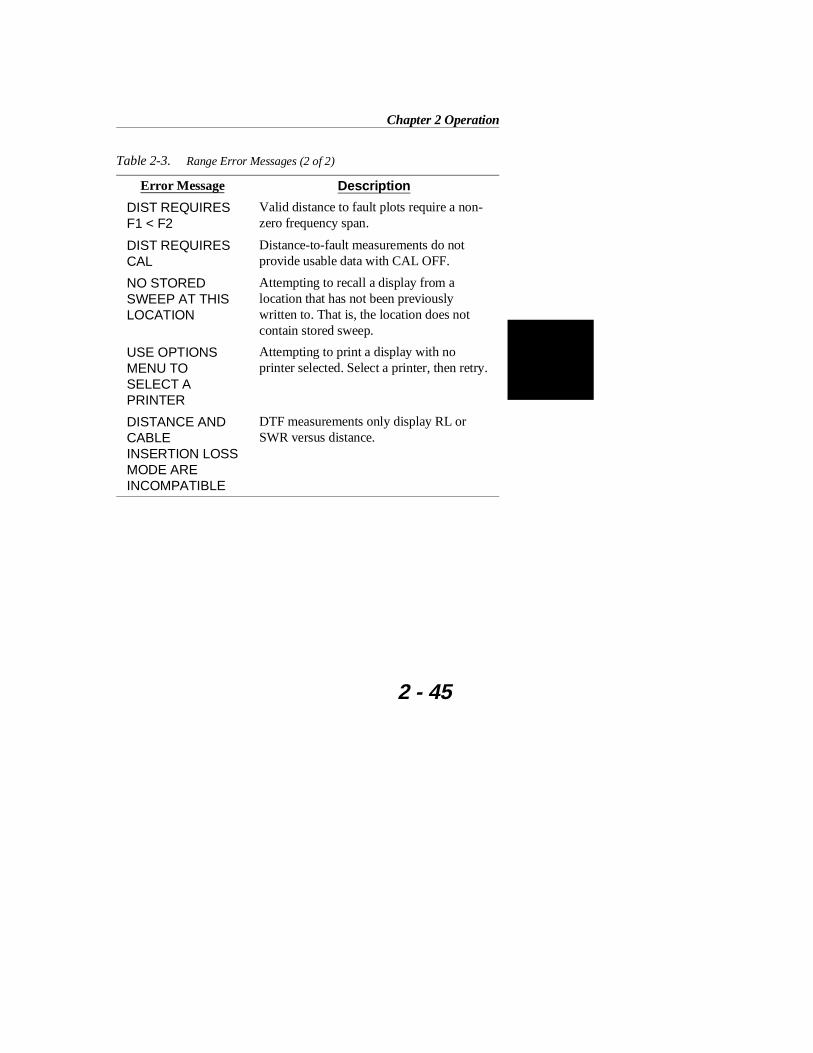
Error Message Description
DIST REQUIRES F1 < F2
Valid distance to fault plots require a non-zero frequency span.
DIST REQUIRESCAL
Distance-to-fault measurements do notprovide usable data with CAL OFF.
NO STOREDSWEEP AT THISLOCATION
Attempting to recall a display from alocation that has not been previouslywritten to. That is, the location does notcontain stored sweep.
USE OPTIONSMENU TO SELECT APRINTER
Attempting to print a display with noprinter selected. Select a printer, then retry.
DISTANCE ANDCABLE INSERTION LOSSMODE ARE INCOMPATIBLE
DTF measurements only display RL orSWR versus distance.
Table 2-3. Range Error Messages (2 of 2)
Chapter 2 Operation
2 - 45

Using the Soft Carrying CaseThe soft carrying case has been designed such that the strap can be un-snapped to allow the case to be easily oriented horizontally; thus allow-ing the Site Master controls to be more easily accessed (Figure 2-11).
Figure 2-11. Using Soft Carrying Case
Chapter 2 Operation
2 - 46
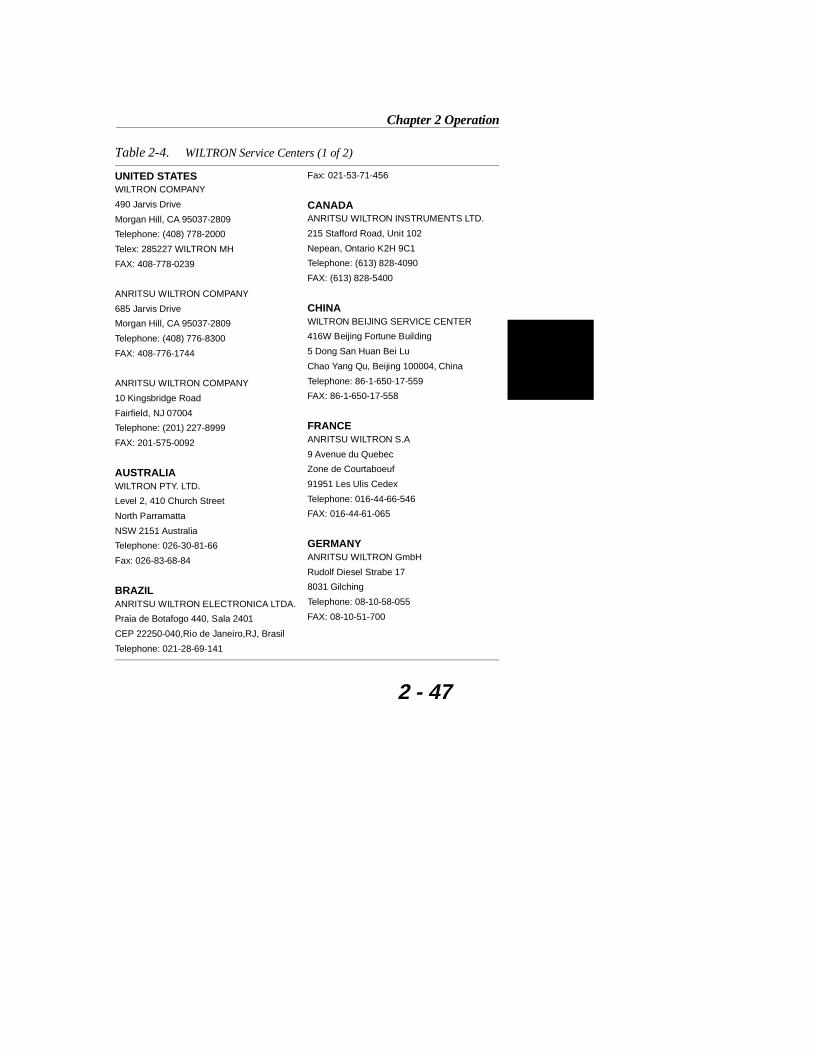
UNITED STATESWILTRON COMPANY
490 Jarvis Drive
Morgan Hill, CA 95037-2809
Telephone: (408) 778-2000
Telex: 285227 WILTRON MH
FAX: 408-778-0239
ANRITSU WILTRON COMPANY
685 Jarvis Drive
Morgan Hill, CA 95037-2809
Telephone: (408) 776-8300
FAX: 408-776-1744
ANRITSU WILTRON COMPANY
10 Kingsbridge Road
Fairfield, NJ 07004
Telephone: (201) 227-8999
FAX: 201-575-0092
AUSTRALIAWILTRON PTY. LTD.
Level 2, 410 Church Street
North Parramatta
NSW 2151 Australia
Telephone: 026-30-81-66
Fax: 026-83-68-84
BRAZILANRITSU WILTRON ELECTRONICA LTDA.
Praia de Botafogo 440, Sala 2401
CEP 22250-040,Rio de Janeiro,RJ, Brasil
Telephone: 021-28-69-141
Fax: 021-53-71-456
CANADAANRITSU WILTRON INSTRUMENTS LTD.
215 Stafford Road, Unit 102
Nepean, Ontario K2H 9C1
Telephone: (613) 828-4090
FAX: (613) 828-5400
CHINAWILTRON BEIJING SERVICE CENTER
416W Beijing Fortune Building
5 Dong San Huan Bei Lu
Chao Yang Qu, Beijing 100004, China
Telephone: 86-1-650-17-559
FAX: 86-1-650-17-558
FRANCEANRITSU WILTRON S.A
9 Avenue du Quebec
Zone de Courtaboeuf
91951 Les Ulis Cedex
Telephone: 016-44-66-546
FAX: 016-44-61-065
GERMANYANRITSU WILTRON GmbH
Rudolf Diesel Strabe 17
8031 Gilching
Telephone: 08-10-58-055
FAX: 08-10-51-700
Table 2-4. WILTRON Service Centers (1 of 2)
Chapter 2 Operation
2 - 47

INDIAMEERA AGENCIES (P) LTD
A-23 Hauz Khas
New Delhi 110 016
Telephone: 011-685-3959
FAX: 011-686-6720
ISRAELTECH-CENT, LTD
Haarad St. No. 7, Ramat Haahayal
Tel-Aviv 69701
Telephone: (03) 64-78-563
FAX: (03) 64-78-334
ITALYANRITSU WILTRON Sp.A
Rome Office
Via E. Vittorini, 129
00144 Roma EUR
Telephone: (06) 50-22-666
FAX: (06) 50-22-4252
JAPANANRITSU CORPORATION
1800 Onna Atsugi-shi
Kanagawa-Prf. 243 Japan
Telephone: 0462-23-1111
FAX: 0462-25-8379
KOREAANRITSU WILTRON KOREA (AWK)
#807 Seoulin Bldg. 45-15,Yeoido
Dong, Youngdeungpo-ku
Seoul Korea 150010
Telephone: 1011-82-2-783-6391
FAX: 011-82-2-784-4593
SINGAPOREANRITSU WILTRON (SINGAPORE) PTE LTD
3 Shenton Way #24-03
Shenton House
Singapore 0106
Telephone: 011-65-2265206
FAX: 011-65-2265207
SWEDENANRITSU WILTRON AB
Box 247
S-127 25 Skarholmen
Telephone: (08) 74-05-840
FAX: (08)71-09-960
TAIWANWILTRON CO., LTD.
8F, No. 96, Section 3
Chien Kuo N. Road
Taipei, Taiwan, R.O.C.
Telephone: (02) 515-6050
FAX: (02) 509-5519
UNITED KINGDOMANRITSU WILTRON LTD.
200 Capability Green
Luton, Bedfordshire
LU1 3LU, England
Telephone: 015-82-41-88-53
FAX: 015-82-31-303
Table 2-4. WILTRON Service Centers (2 of 2)
Chapter 2 Operation
2 - 48

Chapter 3Software Tools Program
DescriptionThe Site Master Software Tools program provides the means for trans-ferring the measured trace, along with any applied markers and/or alimit, to the screen of an MS-DOS based personal computer (PC) run-ning Windows, Windows for Workgroups 3.xx, Windows NT, or Win-dows 95.
Requirements The Site Master Software Tools program is a standard Windows 3.xprogram and will run on any computer that will run Windows, Win-dows for Workgroups 3.xx, Windows NT, or Windows 95. Typically,this means having a PC with the following characteristics:
• 386 or better microprocessor running enhanced mode(386DX, 33 MHz or better, recommended).
• 8 MBytes of memory, minimum.
• Hard Disk Drive, with approximately 3 MBytes of availablespace.
3
3-1

Communication Port SettingThe Site Master Software Tools communicates with the Site Masterthrough a standard COM port on the PC. It is important that your Win-dows COM port settings conform to the actual hardware settings. Table3-1 provides a listing of standard COM port settings for most IBM AT-Compatible computers.
Since various add-in devices such as sound cards, modems, and net-work cards use IRQ (Interrupts), it is possible that your computer hasnon-standard COM port settings. Please consult your computer vendorfor COM port address and IRQ information.
Changing COM Port Settings–Windows 3.1
Refer to Figure 3-1 while performing the following procedure.
Step 1. Open the Windows Control Panel.
Step 2. Double click on the Ports icon. The Ports dialog boxappears.
Step 3. Click on the icon for the COM Port whose communi-cations settings you wish to specify, then click theSettings... button. The Settings dialog box appears.
Port IRQ Address
COM1 4 3F8
COM2 3 2F8
COM3 4 3E8
COM4 3 2E8
Table 3-1. Standard COM Port Settings
Chapter 3 Screen Capture Program
3-2

Step 4. Change to the following settings if necessary:Baud Rate: 9600Data Bits: 8Parity: NoneStop Bits: 1Flow Control: None
Step 5. Click on the Advanced... button. At the AdvancedSettings dialog box verify the COM Port Base Ad-dress and IRQ. Click OK when done.
Step 6. Click OK again and then Close to close the COMPort Setting Windows.
Figure 3-1. Windows 3.1 COM Port Setting Dialog Boxes
Chapter 3 Screen Capture Program
3-3
Note:If you changed the COM Port Base Address and/orIRQ, you will need to restart Windows.
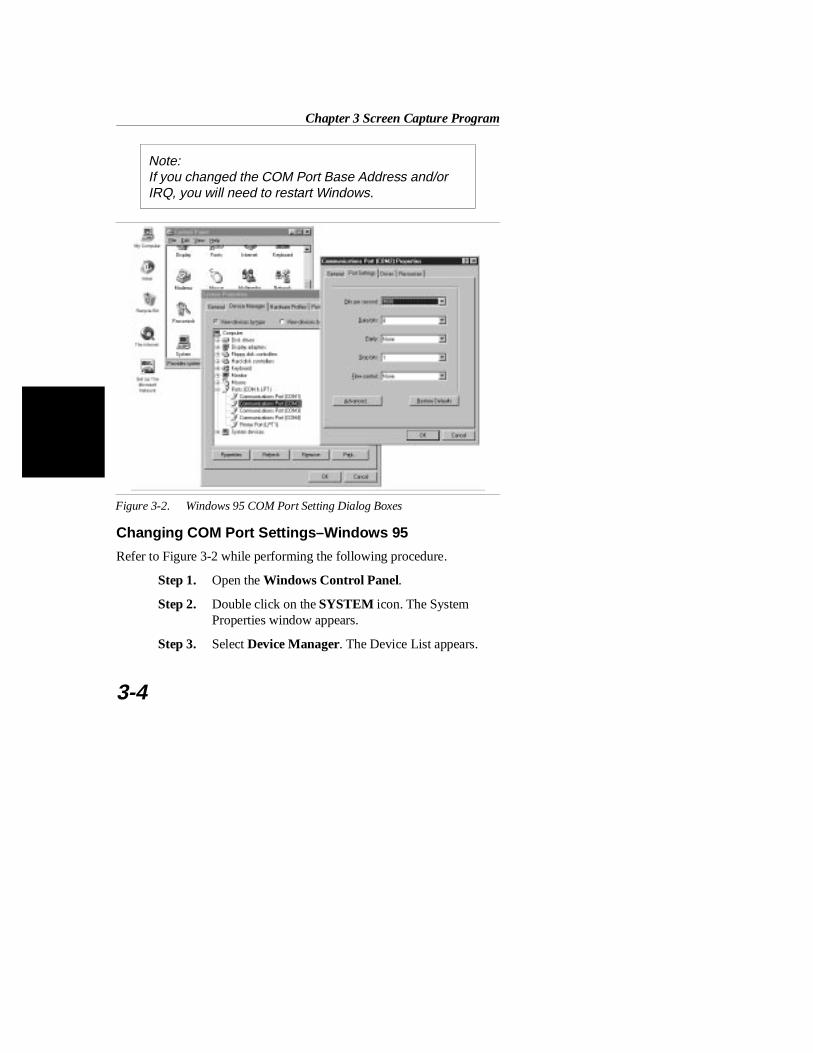
Changing COM Port Settings–Windows 95
Refer to Figure 3-2 while performing the following procedure.
Step 1. Open the Windows Control Panel.
Step 2. Double click on the SYSTEM icon. The SystemProperties window appears.
Step 3. Select Device Manager. The Device List appears.
Figure 3-2. Windows 95 COM Port Setting Dialog Boxes
Chapter 3 Screen Capture Program
3-4

Step 4. Double click on the item Ports (COM & LPT) inthe device list.
Step 5. Double click on the Communications Port you wantto set. The Communications Port Properties windowappears.
NOTE:If Windows doesn’t show any available COM Ports,consult your computer manufacturer.
Step 6. Choose Port Settings, then change to the followingsettings if necessary.
Baud Rate: 9600Data Bits: 8Parity: NoneStop Bits: 1Flow Control: None
Step 7. Choose Resource and verify the COM Port Base Ad-dress and IRQ. Click OK when done.
Step 8. Click OK again to close the System Properties win-dow.
Note:If you changed the COM Port Base Address and/orIRQ, you will need to restart Windows.
Chapter 3 Screen Capture Program
3-5

Software InstallationThe Site Master Software Tools program is a conventional MicrosoftWindows 3.x program. Installation is similar to all other such pro-grams. For users new to Windows 3.x, a detailed procedure is given below.
Step 1. Insert the Wiltron Site Master Software Tools ForWindows disk in floppy drive A:\ or B:\.
Step 2. In the Windows Program Manager, pull down theFile menu and select Run.
Step 3. Type A: (or B:)\SETUP, when the dialog box ap-pears.
Step 4. Press the Enter key to select the default directory,C:\SITEMSTR, and begin the Setup routine.
Step 5. Select “OK” or press the Enter key to exit the Setuproutine, when its completes.
NOTE: The Setup routine will create a new ProgramManager Group named “Site Master Software Tools.”This group will contain three file icons, “Read Me,”“Site Master Help,” and “Site Master Software Tools.”
Step 6. Double-click on the “Read Me” icon to read about(1) recent changes that did not get into this manualand/or (2) important features or problems that youshould know about.
Chapter 3 Screen Capture Program
3-6
Step 7. Double-click on the “Site Master Help” icon to ac-quaint yourself with the comprehensive on-linemanual. This manual provides descriptive narrativefor the various program features and controls.
Step 8. Double-click on the “Site Master Software Tools ”icon to open the Software Tools program.
Plot CapturePlots (traces) can be captured either singly from the Site Master dis-play or in multiples from one or more stored-display locations. Bothmethods are described below.
The recommended method is the Capture Multiple Traces option inthe Capture pull-down menu. Using this method, you can download tothe Software Tools program in one operation all of the data residing inthe up-to-40 Stored Display memory locations. The downloaded traceswill appear in cascade on the PC screen.
Multiple trace capture (preferred method)
Step 1. Connect the supplied cable as shown in Figure 3-3.
Step 2. Open the “Site Master Software Tools” group, inthe Windows Program Manager. (Select the Windows pull-down menu from the Pro-gram Manager menu bar, and select Site MasterSoftware Tools.)
Step 3. Double-click on the “Site Master Software Tools ”icon to open the program.
Step 4. Click on Capture, in the top menu bar, and selectCapture Multiple Traces from the drop-down menu.
Chapter 3 Screen Capture Program
3-7

Step 5. Enter the number (or numbers) of the stored-displaymemory location(s) (1 to 40) from which you wish todisplay traces in Site Master Software Tools.
Step 6. Select “OK.”
Step 7. Observe that the “Acquiring Control” box appears onthe screen, then disappears as the traces are automat-ically acquired.
Single trace capture
Step 1. Perform steps 1, 2, and 3 of the multiple-trace-cap-ture procedure.
Step 2. Click on Capture, in the top menu bar, and selectStart Capture from the drop-down menu.
Serial Interface
Com Port(Program defaults to Com2)
Figure 3-3. Equipment Setup for Sitemaster Tools Operation
Chapter 3 Screen Capture Program
3-8

Step 3. Observe that a “Waiting for Data” box appears on thescreen.
Step 4. On the Site Master,
Capture a new trace and store it to a memory location.
Recall the stored plot to the screen.
Press the ENTER key (on the Site Master) to startthe screen capture.
NOTE: The ENTER key on the Site Master must bepressed while the PC screen shows “Waiting forData” for the transfer of information to be complete.
Step 5. On the PC, observe that the “Waiting for data” boxdisappears and the trace capture process begins.Within a short time, the Site Master trace will ap-pear.
Step 6. If the trace differs from the Site Master display, it isbeing autoscaled by the capture program. To turn offautoscaling, proceed as follows:
Click on the Settings menu, in the top menu bar.
Click on Default Plot Settings, pull down menu.
Click on Per Site Master, in the dialog box, andselect OK to save changes.
On the Site Master, press the ENTER key to re-send the plot.
Chapter 3 Screen Capture Program
3-9

Program OperationThe captured trace on the PC can be scaled and have its limit line, mark-ers, and properties changed. (Select Plot Properties under the Viewmenu to make these changes.) The operation of the various menus thatallow these operations to be accomplished is straightforward. To readabout the operation of the menus, refer to the on-line help screens.They can be accessed from the Help menu, in the top menu bar.
Chapter 3 Screen Capture Program
3-10
Fault Location SoftwareA captured RL or SWR trace can be transformed to a Distance to Faultdisplay. This is useful for determining the location of faults, connec-tions, and other discontinuities within the cable.
To transform a plot, select Fault Find from the Tools menu (or clickthe toolbar button). A drop down menu will appear that asks you to sup-ply start and stop distances, along with dielectric constant or propagati-ion velocity and insertion loss values. The table on the inside of themanual back cover provides these values for some of the more popularcables. The values are given at a nominal frequency of 1000 MHz. Ifvalues are needed at a different frequency, or if you need the exact val-ues for more accurate measurement, please contact the cable manufac-turer. Cables may be added to the list be editing the cables.lstfile and following the existing format. The distance may be entered infeet or meters. Propagation velocity or dielectric constant may be used.The units may be changed by selecting Default Plot Settings under theSettings menu and changing “Distance Units” or “Cable Units.”
After supplying the needed information and clicking OK, a new plotwill open showing cable match vs. distance.
Smith Chart SoftwareAfter obtaining a frequency SWR or RL plot on the computer display,click the Smith Chart icon. Read the Help file to see how this featurefunctions (under Smith Chart and Data Readout).
Chapter 3 Screen Capture Program
3-11

Saving a Plot as a WindowsMetafilePlots can be saved as Windows Metafiles (.WMF). The metafile maybe imported into other graphic programs, but cannot be reloaded intothe Site Master Software Tools program.
To save a plot as a Windows Metafile, click on File, in the top menubar, and select Save as Metafile from the drop down menu.
Saving Data to a SpreadsheetThe data points from a plot can be exported to a spreadsheet via theclipboard. To transfer data to a Windows spreadsheet program:
Step 1. Select Clipboard Format from the Settings menuand choose Formatted Text.
Step 2. Capture or load the desired plot.
Step 3. Copy the data to the clipboard by selecting Copyfrom the Edit menu.
Step 4. Open the spreadsheet program and place the cursorwhere the first data point should appear.
Step 5. Select Paste from the spreadsheet program’s Editmenu.
Chapter 3 Screen Capture Program
3-12

“Drag-n-Drop”Site Master Software Tools is Windows based. Graphs can “Drag-n-Drop” onto each other. Site Master Software Tools allows quick com-parison of “before” and “after” Distance-To-Fault measurements.Recent data is compared to a historical PC database record, which isusually recorded during site installation/commissioning.
Each cable/antenna tends to have a unique Distance-To-Fault (DTF)“Signature” because differing cable electrical lengths, cable types,dielectric thickness variations, and the positions of components (connectors, adapters, and lightning arrestors) will cause differentreflections at differing positions in the transmission line. Variations inthe “signature” between maintenance intervals offer a good indicationof damage or damage causing conditions.
Chapter 3 Screen Capture Program
3-13

NOTES
Chapter 3 Screen Capture Program
3-14

Cable Type DialectricRelative
PropagationVelocity ( Vf)
DielectricConstant ( εr)
NominalAtten. dB/m@ 1000 MHz
RG8, 8A,10,10ARG9, 9ARG14,14ARG17, 17ARG18A
PPPPP
0.6590.6590.6590.6590.659
2.3032.3032.3032.3032.303
0.2620.2890.2560.1800.144
RG19ARG20ARG21, 21ARG29ARG55,55A, 55B
PPPPP
0.6590.6590.6590.6590.659
2.3032.3032.3032.3032.303
0.1180.1181.4110.5310.541
RG58, 58BRG58A, 58CRG71, 71A, 71BRG87ARG94A, 115, 115ARG117, 118
PPPTTT
0.6590.6590.6590.8400.7100.659
2.3032.3032.3031.4171.9842.303
1.5740.7870.3940.2490.2300.115
RG119, 120, 126RG140RG141RG142RG143
TTTTT
0.6590.6590.6590.6590.659
2.3032.3032.3032.3032.303
0.1800.1970.4270.4430.312
RG144RG178BRG179BRG187, 188RG214RG223
TTTTPP
0.6590.6590.6590.6590.6600.659
2.3032.3032.3032.3032.2962.303
0.0301.5090.7871.0170.2920.165
FSJ1-50AFSJ2-50FSJ4-50BLDF4-50ALDF5-50A
PPPPP
0.8400.8300.8100.8800.890
1.4171.4521.5241.2911.262
0.1970.1340.1190.0770.043
LDF6-50LDF7-50ALDF12-50FE25
PPPT
0.8900.8800.8800.760
1.2621.2911.2911.731
0.0320.0270.0220.150
Coaxial Cable Technical Data
