site response studies based on geotechnical data for ... site response studies based on geotechnical...
TRANSCRIPT

1
Site response studies based on geotechnical data for seismic microzonation of Agartala city
Sangeeta Sharma, M. K. Phukan and R. Duarah
GeoScience Division North East Institute of Science and Technology, Jorhat
email: [email protected] ABSTRACT: In this paper an attempt has been made to study the site response behaviours of the subsurface soil horizon within the Agartala city using Standard Penetration Test (SPT) data of 78 boreholes drilled up to a depth of 30mts. The empirically derived shear wave velocity (Vsh) of the subsoil horizon varies between 130 and 340m/s. The predominant frequency (fo), natural period (to) and the shear modulus (Gmax) of the soil horizon also derived empirically vary between 1.5-6.5 Hz, 0.14-0.52s and 8-36 kips/in2 respectively. The corresponding values of shear wave velocity, shear modulus, natural period and predominant frequency are used to draw the contour maps to understand the influence of seismic ground motions on manmade structures. The results show that the central part of the Agartala city is relatively more vulnerable to seismic hazard. Keywords: Site Response, Geotechnical properties, Standard Penetration Test, Shear wave velocity, Predominant frequency, Introduction:
Geotechnical properties of the subsurface horizons can provide valuable
insight in understanding the influence of earthquake generated ground
motions on manmade structures. In a most generalized term, site response is
the process of estimating the response of soil layers under earthquake
excitations and thus the variations of earthquake characteristics on the ground
surface. The response of manmade structures during an earthquake is not
only related with structural features, but also mostly controlled by earthquake
source characteristics and local site conditions. The characteristics of
incoming earthquake waves may change during their propagation through soil
layers. In addition, the soil characteristics may also change due to the cyclic
excitations of the ground. Thus, seismic microzonation study needs detail
consideration of the site condition, in addition to earthquake source
characteristics and effects of the incoming seismic waves (Aki, 1988; Bolt,

2
1996). Site response or the frequency dependent site amplification of ground
motion is a fundamental component of seismic microzonation. It is the most
desired component in seismic hazard assessment. It has been widely
accepted that local geological conditions have pronounced impact on seismic
ground motion of the site (Aki, 1988; Bolt, 1996; Finn, 1991). Each soil type
responds differently when subjected to the ground motions caused by
earthquakes. Generally, the soft and younger sediments can amplify the
seismic waves relatively higher than the older and more competent soil and
bedrock. Local amplification of the ground is often controlled by the upper
sedimentary sequence, which leads to the trapping of the seismic energy due
to the impedance contrast between the soft surface soils and the underlying
bedrock. Site amplification also depends on the match between the frequency
content of the earthquake motion and natural period of the ground.
Resonance frequency of each soil type also differs depending upon the
physical properties, and depth to the bedrock.
The ground motion characteristics during an earthquake are also controlled by
the local geotechnical site conditions. The local site conditions vary due to
the variations in soil properties, depth of the bedrock and water table, and
have significant effects on the characteristics of earthquake ground motion
(Idriss, 1990; Lachet, et al., 1996; Makra et al., 2001; Ansal, 1994; Bersenev
and others, 1995). Joyner & Fumal, 1985; Bersenev & Atkinson, 1997; Ansal
and Slejko, 2001, suggest that the upper 30 meter of the soil profile plays an
important role in wave amplification, and can be used as one of the important
parameters for estimating the site amplification.
Generally, the water saturated sediments mostly sands and silts are distinct
from unsaturated dense sand, and particularly susceptible to failure when
subjected to a seismic shock wave due to sudden loss of rigidity and strength.
The liquefaction susceptibility is estimated following standard penetration test
(SPT) and cone penetration tests (CPT). The methods based on SPT were
developed by Seed and Idriss (1971), Seed and Alba (1986), Iwasaki et al.,
(1978), Tokimatsu and Yoshimi (1983), and that of CPT by Seed and Alba

3
(1986), Ishihara (1985), Shibata & Teparaksa (1988) and Robertson &
Campanella (1985) are popularly in use.
Shear wave velocity is a dynamic soil property commonly used for dynamic
site response and site classification for seismic design. The average shear
wave velocity of the upper 30 meters of the soil profile (Vs30) is one of the soil
properties used in seismic design parameters. Prediction of the ground
shaking response at soil sites requires knowledge of the stiffness of the soil,
expressed in terms of shear wave velocity (Vs). Although, Vs can be directly
determined from field tests it is often not economically feasible at all site
locations. For this reason, a reliable correlation between Vs and penetration
resistance is a considerable advantage, reducing the number of field
verifications.
The North East India is seismically very active, and Agartala the state capital
of Tripura as well as one of the populated and fast growing cities in NE India
has experienced several mild to severe earthquakes during the recent past.
Although, the death and damage due to these past earthquakes were small,
the present uncontrolled growth of human settlement continually increases the
risk. The current land-use pattern and demography of the city show increased
population concentration along sediment filled low-lying plains and narrow
alluvial tracts. The risk posed by the increased population concentration is
further compounded by the degradation of the physical environment and
construction of massive multi-storied buildings in filled-up areas and
unconsolidated soil located in several parts of the city.
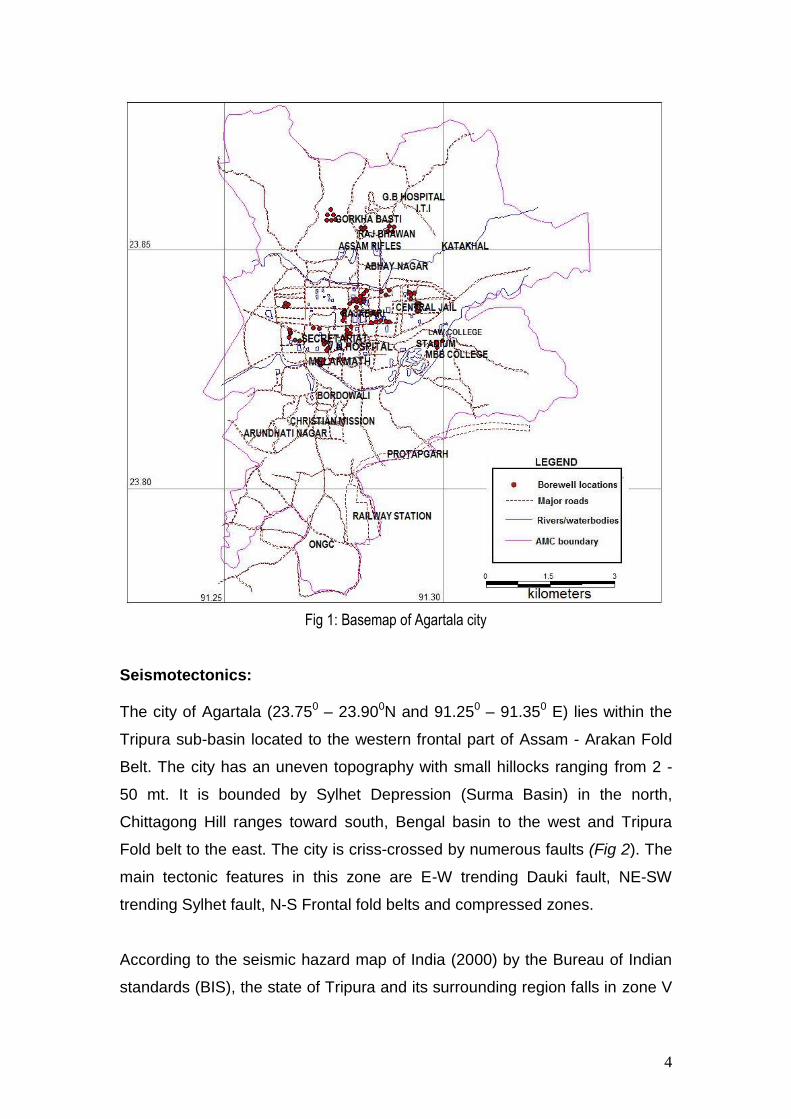
In this study, a base map of the Agartala city (Fig 1) has been prepared using
GIS software MapInfo Professional 5.5. Several layers were digitized
including major roads, river and water bodies, important establishments and
borehole locations. Majority of the boreholes locations are concentrated on
the central portion of the city area.
4
Fig 1: Basemap of Agartala city
Seismotectonics: The city of Agartala (23.750 – 23.900N and 91.250 – 91.350 E) lies within the
Tripura sub-basin located to the western frontal part of Assam - Arakan Fold
Belt. The city has an uneven topography with small hillocks ranging from 2 -
50 mt. It is bounded by Sylhet Depression (Surma Basin) in the north,
Chittagong Hill ranges toward south, Bengal basin to the west and Tripura
Fold belt to the east. The city is criss-crossed by numerous faults (Fig 2). The
main tectonic features in this zone are E-W trending Dauki fault, NE-SW
trending Sylhet fault, N-S Frontal fold belts and compressed zones.
According to the seismic hazard map of India (2000) by the Bureau of Indian
standards (BIS), the state of Tripura and its surrounding region falls in zone V

5
of the Seismic zoning map of India. The present day seismic activity is found
to be confined mostly to the north and north-eastern parts of Tripura in
association with the Dauki Fault (Fig 2). It is been observed that the activity is
mainly due to the occurrence of moderate magnitude earthquakes within the
upper crust. The earthquakes of M > 5.0 occurring in and around Tripura are
quite common. One of the most damaging earthquakes of magnitude (ML) 5.8
is the 1984 Cachar earthquake occurred in the Fold belt toward north.
Fig 2: Seismotectonic map of Tripura and adjoining regions [ISC & JHI: 1964-2008]
Geotechnical studies: The average shear wave velocity in the upper 30m of the ground is an
important parameter for ground characterization (Borcherdt 1994; Dobry et al.
2000). For the present study, data for 78 boreholes drilled up to a depth of
30m were taken. The N values were obtained at about 2 m intervals, and the
samples were analysed for different geotechnical parameters following BIS

6
Code. Location of the boreholes within the Agartala city area is shown in
Figure 1. The subsurface layers are basically soft to stiff clay and silt with
varying proportions of sand and minor amount of organic matters,
decomposed wood and mica.
Shear wave velocity (Vs):
Although, Vs can be measured directly from the field test but, often it is not
feasible at all locations. In this study, the empirical relation proposed by Imai
and Tonouchi (1982) is considered to compute the shear wave velocity. The
empirical equation is Vs= 97*N0.314 where Vs is the shear wave velocity and N
is the SPT value.
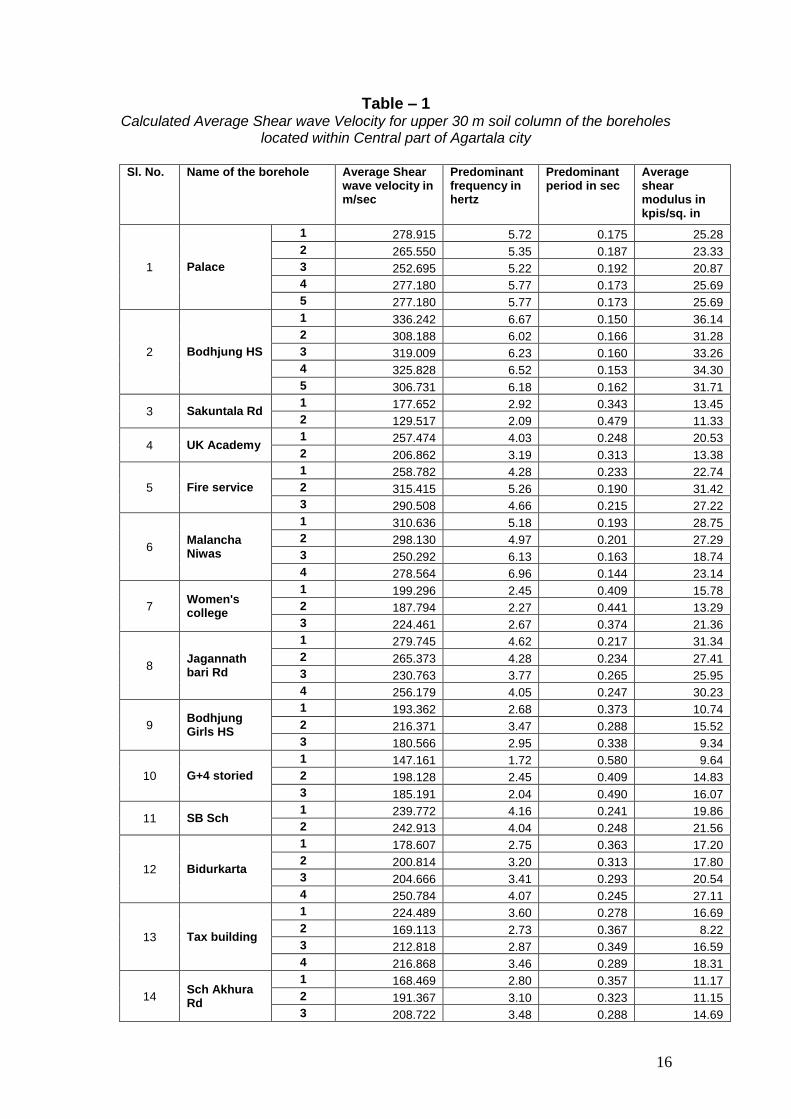
Shear wave velocity contour map was prepared by contouring the values
determined at each borehole with the help of the software Surfur (Fig 3). The
average shear wave velocity of the sediments varies in between 130 to
340m/s (Table – 1). The observed shear wave velocity in the upper 30 m soil
column of the city corresponds to Soil type “D” & “E” as per the site
classification of NEHRP (Table -2). Most of the city area is composed of stiff
soil (Vs 180-340m/s) while some small patches of soft clay (Vs 130-180m/s)
are localised in the central and western part of the city (Fig. 3).
Table 2: Soil classification based on shear wave velocity of upper 30 m NEHRP (Romero & Rix, 2001)
Soil Types
Rock/Soil Description Average shear wave velocity (VS30) m/s
A Hard rock >1500
B Rock 760-1500
C Hard and/or stiff /very stiff soils; most gravels
360-760
D Sand, silts and/or stiff/very stiff clays, some gravels
180-360
E Soft clay <180
F Special soils requiring special evaluation

7
Fig 3: Shear wave velocity contour map for upper 30mt depth of Agartala city, Tripura
Predominant frequency:
In order to estimate the predominant frequencies at which the seismic waves
are expected to resonate in the soil column of 30 m depth, the relationship
between the shear wave velocity (VS) and thickness of the sediment layer is
used.
fo=Vs/4H where
fo is the predominant frequency, Vs is the average shear wave velocity of each column and H is the total depth of the soil column.
The calculated predominant frequency for each of the sites is used to draw
the contour map (Fig 4). The predominant frequency for different sites varies
between 1.5 and 6.5 Hz.

8
The sites having peak frequency of 5 Hz and above are located in the
northern, central (around palace compound) and in the south western part of
the city are marked by hard ground with rocky exposures. Areas located in the
western part (near Ramanagar HS), central part (around Bodhjung HS) and to
the south and south eastern parts of the city exhibit predominant frequency of
about 2-3 Hz and thus represent soft to stiff soil over an amplifying interface at
medium depth.
Fig 4: Contours showing the distribution of predominant frequency, Agartala city, Tripura Predominant period: The predominant period (to) for each of the borehole locations was calculated
using the relation given by Mandrescu (1978), to=4H/Vs where H is the
thickness of the sediments and Vs is the average shear wave velocity. The

9
predominant period varies in between 0.14 – 0.52s (Fig 5) and the localities
are marked by soft alluvial deposit. The long structures such as bridges or tall
buildings constructed in these areas are especially susceptible to earthquake
damage due to the resonance. Such areas with having predominantly long
period of vibration are concentrated on the central (near Bodhjung H.S, near
women’s college), western (near Ramnagar H.S) and southern parts of the
city.
Fig 5: Contour map showing the distribution of predominant period of Agartala city
Maximum shear modulus (Gmax):
The shear modulus is the key parameter used in evaluating soil response to
applied static and dynamic loads. Maximum shear modulus (Gmax) is primarily
a function of both stress and soil fabric (Hardin, 1978; Yu and Richart, 1984;

10
Roesler, 1979 and Stokoe et al., 1985). It describes the response of the
underlying soil to shearing strain.
The maximum shear modulus of the underlying material are calculated using
the corrected values of N at each borewell locations (Fig 6). The Gmax has
been calculated using the equation developed by Imai and Tonouchi (1982).
Gmax (kips/ft2)=325(N60)0.68
where N60 is the corrected value of N.
The shear modulus varies from 8-36 kips/in2. It is seen that the maximum
shear modulus of the soil is less towards the central (near Bodhjung HS,
Dhaleswar HS, HGB Road and Central Jail) and western part (Ramnagar HS)
of the city which implies to low impedance.
Fig 6: Maximum shear modulus contour map of Agartala city

11
Liquefaction Potential: Liquefaction is a process by which water saturated sediments lose their shear
strength and start behaving like a liquid. Liquefaction depends on the physical
properties of the near surface materials and their saturation with the ground
water. Youd (1973) has defined liquefaction as the transformation of a
granular material from a solid state into a liquefied state as a result of
increased pore water pressure. Shaking of saturated granular and cohesion
less soils during an earthquake can lead to liquefaction. Liquefaction
commonly occurs following moderate to strong earthquakes under a particular
set of geoenvironmental conditions.
The data used for determining the site response maps have been utilized for
determining the liquefaction susceptibility of the Agartala city area. Based on
the data it is seen that the groundwater table follows the surface topography.
The groundwater table is shallowest in the central part of the city area (<5m)
with some localised groundwater mounds and gradually slopes towards the
south-eastern side of the city area (Fig 7).
Fig 7: The contours showing the depth of groundwater table, Agartala city

12
From the study of the litho-stratigraphy it has been observed that the sub-soil
horizon is made up of clay and sandy silt, and mostly devoid of liquefiable
sand layers. Although, the groundwater table rests at a shallow depth within
the study area the occurrence of seismically induced liquefaction are remote.
Results and Discussion: The epicentral plot shows that the both regional and local lineaments are
seismically very active. The high angle reverse Sylhet fault was the epicentre
of the Srimangal Earthquake of 1918 and the Cachar Earthquake of 1984
occurred in the Tripura fold belt.
The average borehole log data show that the subsoil horizon upto a depth of
30m is basically soft to stiff clay and silt with varying proportions of sand and
minor amount of organic matters, decomposed wood and mica.
From the shear wave velocity contours it can be seen that the average shear
wave velocity varies in between 130 to 340m/s. Nearly, 75 percent of the city
area is covered with stiff soil and the rest with soft clay sediments distributed
in small patches sporadically.
The hard and compact ground corresponds to low period (high frequency)
whereas the sites having soft soil correspond to high period (low frequency).
At period above 0.4 sec, the spectral amplifications are higher for the soil sites
than for the rock sites. The areas having high predominant period and low
natural frequency are found to be located in the Central (near Bodhjung H.S,
near Women’s college), Western (near Ramnagar H.S) and Southern parts of
the city area. From the shear modulus contour map it can be seen that the
maximum shear modulus of the soil is less towards the Central (near
Bodhjung HS, near Central Jail, near Dhaleswar HS, and HGB Rd) and
Western (near Ramnagar HS) part of the city area which implies that the
impedance of the soil is less in these part of the city area.

13
The study shows that the groundwater table in the study area is shallowest in
the central part of the city area (<5m) with some localised groundwater
mounds and gradually slopes towards the south-eastern side of the city area.
Chances of liquefaction are quite remote because of the absence of
liquefiable sand in the near sub-surface strata.
Acknowledgements: The authors are grateful to Dr. P.G. Rao, Director, North East Institute of Science and Technology for his constant encouragement and for the permission to publish this paper. The authors are highly thankful to Mr. S. Dutta, Executive Engineer, Public Works Department, and the Nodal Officer, Disaster Management, Government of Tripura, Agartala for extending valuable support. References Aki, K., 1988. Local site effects on Strong Ground motion. In: Earthquake Engineering and Soil Dynamics II – Recent Advances in Ground Motion Evaluation, June 27-30, Park City, Utah. Anbazhagan P (2006). Site Amplification and Liquefaction Studies for Bangalore City. IGC 2006, Chennai, India. pp 823-826 Anbazhagan P, Sitharam T.G, Divya C. Site response analysis based on site specific soil properties using Geotechnical and Geophysical tests: Correlations between Gmax and N60. 4th International Conference on Earthquake Geotechnical Engineering June, 2007. Paper No.1286.
Ansal, A.M., 1994. Effects of Geotechnical factors and behavior of soil layers during earthquakes. State-of-the-Art lecture. Proc. Of 10th European Conference on earthquake engineering. (1): 467-476. Ansal, A.M and Slejko, D., 2001. The long and Winding road from earthquakes to damage. Soil Dynamics and Earthquake Engineering. (21) 5: 369-375. Bersenev, I.A. and Atkinson, G.M., 1997. Shear Wave Velocity Survey of Seismographic Sites in Eastern Canada: Calibration of empirical regression method of estimating site response. Seismological Research Letters. (68)6, 981-987.
Bersenev, I.A. and Atkinson, G.M., 1997. Shear Wave Velocity Survey of Seismographic Sites in Eastern Canada: Calibration of empirical regression

14
method of estimating site response. Seismological Research Letters. (68)6, 981-987. Bolt, B.A., 1996. From earthquake acceleration to seismic displacements. Fifth Mallet-Milne Lecture, SECED, London, 50 pp. Boominathan A., Dodagoudar G.R., Suganthi A., Maheswari R.U. Seismic Hazard Assessment Considering Local Site Effects for Microzonation Studies of Chennai City. A Workshop on Microzonation ©Interline Publishing, Bangalore. pp 94-104 Dejong J.T. (2007) Site Characterization- Guidelines for estimating Vs Based on In-Situ Tests Stage 1-Interim Report. Soil Interactions Laboratory UC Davis. pp.1-22 Finn, W.D. Liam (1991) Geotechnical engineering aspects of seismic microzonation, Proceedings of the Fourth International Conference on Seismic Zonation, August 25-29, Stanford, California, 1, 199-250. Hasancebi N, Ulusay R (2007) Empirical correlations between shear wave velocity and penetration resistance for ground shaking assessments. Bull eng Geol Environ 66:203-213 Idriss, I.M., 1990. Response of Soft Soil Sites during earthquakes. Proc. H.Bolton Seed Memorial Symposium. 273-290. Ishihara, K., 1985. Stability of Natural Deposits during Earthquakes. Theme Lecture, 11th ICSMFE, (2), 321-376. Ishihara, K., 1997. Geotechnical aspects of the 1995 Kobe earthquake, Tezaghi Orientation. 14th International Conference of International Society of Soil Mechanics and Geotechnical Engineering, Hamburg, Germany. 4, 2047-2073.
Iwasaki, T; Tatsuoka, F; Tokida, K and Yasuda, S., 1978. A practical method for assessing Soil liquefaction potential. Proceedings of 2nd International Conference on Micro-zonation for Safer construction Research and Application. 885-896.
Joyner, W.B., and T.E. Fumal., 1985. Predictive mapping of earthquake ground motion. U.S. Geol. Sur. Profess. Pap. 1360, 203-220. Kandpal G.C, John B, Joshi K.C (2009). Geotechnical Studies in relation to Seismic Microzonation of Union Territory of Chandigarh. J.ind.Geophys.Union, Vol.13, No.2, pp.75-83 Kandpal G.C, Ram S, Pande P. Seismic Hazard Assessment of Dehrdun Urban Complex at Micro Level. A Workshop on Microzonation ©Interline Publishing, Bangalore. pp 36-38
15
Lachet, C., D.Hatzfeld, P.Y. Bard, N..Theodulidis, C. Papaioannou and A.Savvaidis, 1996. Site Effects and microzonation in the city of Thessalonki (Greece): Comparision of different approaches. Bull.Seism. Soc.Am. 86, 1692-1703. Lachet, C., D.Hatzfeld, P.Y. Bard, N..Theodulidis, C. Papaioannou and A.Savvaidis., 1996. Site Effects and microzonation in the city of Thessalonki (Greece): Comparision of different approaches. Bull.Seism. Soc.Am. 86, 1692-1703.
Makra, K., Raptakis, D., Chavez Garcia, F.J. and Pitilakis, K., 2001. Site Effects and Design Code Provisions: The case of Euroseistest. PAGEOPH. 158, 2349-2367. Rao. K.S, Satyam D.N (2007). Liquefaction studies for seismic microzonation of Delhi region. Current Science Vol.92, No.5 pp 646-654 Robertson, P.K. and Campanella, R.G., 1985. Liquefaction Potential of Sands Using the CPT, J. GED, ASCE, (111)3, 384-403. Sully J.P, Campanella R.G. (1992) In situ shear wave velocity determination using seismic cone penetrometer for evaluating soil anisotropy. Earthquake engineering, Tenth World Conference © 1992 Balkema, Rotterdam. pp 1269-1274. Seed, H.B and Idriss, I.M., 1971. Simplified procedure for evaluating soil liquefaction potential. Journal of the Soil Mechanics and Foundations Division, ASCE, 97 (SM9), 1249-1273. Seed, H.B and De Alba, P., 1986. Use of SPT and CPT Tests for Evaluating the Liquefaction Resistance of Sands. Proc. In Situ’ 86, ASCE, 281-302.
Shibata, T. and Teparaksa, W., 1988. Evaluation of Liquefaction Potential of Soils Using Cone Penetration Tests. Soil and Foundations. (28)2, 49-60. Tokimatsu, K. and Yoshimi, Y., 1983. Empirical Correlation of Soil Liquefaction based on SPT N-value and Fines Content. Soils and Foundation. (30)3, 153-158.
Wadhwa R.S, Rao C. S, Ghosh N. (2005) Estimation of Shear Wave Velocity from Soil Indices. IGC-2005, Ahmedabad, India pp 405-408
16
Table – 1 Calculated Average Shear wave Velocity for upper 30 m soil column of the boreholes
located within Central part of Agartala city
Sl. No. Name of the borehole Average Shear
wave velocity in m/sec
Predominant frequency in hertz
Predominant period in sec
Average shear modulus in kpis/sq. in
1 Palace
1 278.915 5.72 0.175 25.28
2 265.550 5.35 0.187 23.33
3 252.695 5.22 0.192 20.87
4 277.180 5.77 0.173 25.69
5 277.180 5.77 0.173 25.69
2 Bodhjung HS
1 336.242 6.67 0.150 36.14
2 308.188 6.02 0.166 31.28
3 319.009 6.23 0.160 33.26
4 325.828 6.52 0.153 34.30
5 306.731 6.18 0.162 31.71
3 Sakuntala Rd 1 177.652 2.92 0.343 13.45
2 129.517 2.09 0.479 11.33
4 UK Academy 1 257.474 4.03 0.248 20.53
2 206.862 3.19 0.313 13.38
5 Fire service
1 258.782 4.28 0.233 22.74
2 315.415 5.26 0.190 31.42
3 290.508 4.66 0.215 27.22
6 Malancha Niwas
1 310.636 5.18 0.193 28.75
2 298.130 4.97 0.201 27.29
3 250.292 6.13 0.163 18.74
4 278.564 6.96 0.144 23.14
7 Women's college
1 199.296 2.45 0.409 15.78
2 187.794 2.27 0.441 13.29
3 224.461 2.67 0.374 21.36
8 Jagannath bari Rd
1 279.745 4.62 0.217 31.34
2 265.373 4.28 0.234 27.41
3 230.763 3.77 0.265 25.95
4 256.179 4.05 0.247 30.23
9 Bodhjung Girls HS
1 193.362 2.68 0.373 10.74
2 216.371 3.47 0.288 15.52
3 180.566 2.95 0.338 9.34
10 G+4 storied
1 147.161 1.72 0.580 9.64
2 198.128 2.45 0.409 14.83
3 185.191 2.04 0.490 16.07
11 SB Sch 1 239.772 4.16 0.241 19.86
2 242.913 4.04 0.248 21.56
12 Bidurkarta
1 178.607 2.75 0.363 17.20
2 200.814 3.20 0.313 17.80
3 204.666 3.41 0.293 20.54
4 250.784 4.07 0.245 27.11
13 Tax building
1 224.489 3.60 0.278 16.69
2 169.113 2.73 0.367 8.22
3 212.818 2.87 0.349 16.59
4 216.868 3.46 0.289 18.31
14 Sch Akhura Rd
1 168.469 2.80 0.357 11.17
2 191.367 3.10 0.323 11.15
3 208.722 3.48 0.288 14.69

17
15 HGB Rd
1 222.166 2.27 0.440 18.43
2 203.921 2.47 0.405 12.97
3 202.707 2.42 0.414 13.09
4 199.872 2.44 0.409 14.55
16 Central Jail
1 207.252 3.43 0.291 13.59
2 138.794 2.31 0.432 8.93
3 171.811 2.77 0.361 13.05
4 185.270 2.97 0.337 14.13
17 Dhaleswar HS
1 196.852 4.64 0.215 11.58
2 197.351 4.61 0.217 11.74
3 170.057 4.01 0.249 8.37
4 171.895 3.70 0.270 8.15
5 187.795 4.65 0.215 11.00
18 MBB college
1 233.624 3.17 0.316 16.38
2 270.252 3.66 0.273 23.03
3 265.003 3.59 0.278 21.60
19 Fire service HQ
1 214.916 2.55 0.391 14.33
2 223.942 2.73 0.366 17.72
3 231.978 2.83 0.353 18.89
20 Ramnagar HS
1 173.080 2.77 0.361 9.11
2 160.978 2.52 0.398 7.14
3 163.103 2.46 0.407 7.38
4 178.022 2.89 0.346 10.12
21 State Planning
1 283.667 4.52 0.221 24.22
2 290.728 4.64 0.215 25.46
3 299.685 4.79 0.209 26.57
22 Rajbhawan
1 317.386 5.07 0.197 30.33
2 354.256 5.64 0.177 37.95
3 347.524 5.53 0.181 36.67
23 S&T Gorkhabasti
1 331.655 5.53 0.181 33.08
2 284.515 4.74 0.211 24.09
3 329.630 5.49 0.182 32.76