sites / activities - usgs · jan van wagtendonk rallies the troops early in the summer of 2001....
TRANSCRIPT

U.S. Geological Survey Scripps Institution of Oceanography – University of California - San DiegoCalifornia Cooperative Snow SurveysCalifornia Department of Water Resources National Oceanographic and Atmospheric Agency – Offi ce of Global Programs National Park ServiceWestern Regional Climate Center – Desert Research Institute
YosemiteNational Park
Notebook of Hydroclimatology - Sites / Activities
Participating Agencies:
������� ��� � �������� �����

The Yosemite Notebook is also online at:
http://sfbay.wr.usgs.gov/access/HydroClim/SiteBook.pdf

Notebook of Hydroclimatology – Sites / Activities
Yosemite National Park
Participating Agencies:U.S. Geological Survey
Scripps Institution of Oceanography – University of California - San DiegoCalifornia Cooperative Snow Surveys
California Department of Water Resources National Oceanographic and Atmospheric Agency – Offi ce of Global Programs
National Park ServiceWestern Regional Climate Center – Desert Research Institute
July 2003
by
Jeanne DiLeoand
Mark ButlerDaniel Cayan David Clow
Mike DettingerFrank GehrkeStephen Hager
Jessica Lundquist Greg McCurdyDavid PetersonKelly Redmond
Larry RiddleRichard Smith
Jan Van Wagtendonk

The home of the Notebook:
http://sfbay.wr.usgs.gov/access/HydroClim/SiteBook.pdf

Table of Contents
1
3
7
9
11
17
23
25
29
31
33
i
IntroductionConnecting the Science
Gin Flat snow-instrumentation Site
Tioga Pass RCS
Tenaya Lake Snow Sensor
Alpine River Monitoring System - Merced
Alpine River Monitoring System - Tuolumne
Spatial and Temporal Variability in Stream – Water Chemistry and
Discharge in the Upper Merced River Basin
Yosemite National Park Water Chemistry: Observation, Analysis and Prediction
Yosemite National Park Water Chemistry: Observation,
Analysis and Prediction Tuolumne River above Hetch Hetchy
List of Contributors
Meeting at Yosemite National Park - October 2002
David Peterson
Frank Gehrke, Mark Butler and Mike Dettinger
Frank Gehrke, Greg McCurdy and Mark Butler Mark Butler Mark Butler
Frank Gehrke, Greg McCurdy and Mark Butler Mark Butler Mark Butler
Daniel Cayan, Jessica Lundquist and Mike Dettinger Mike Dettinger Mike Dettinger
Daniel Cayan, Jessica Lundquist and Mike Dettinger Mike Dettinger Mike Dettinger
David Clow, Daniel Cayan and Jessica Lundquist
David Peterson, Richard Smith and Stephen Hager Stephen Hager Stephen Hager
David Peterson, Richard Smith and Stephen Hager
..................................................
..................................................

ii
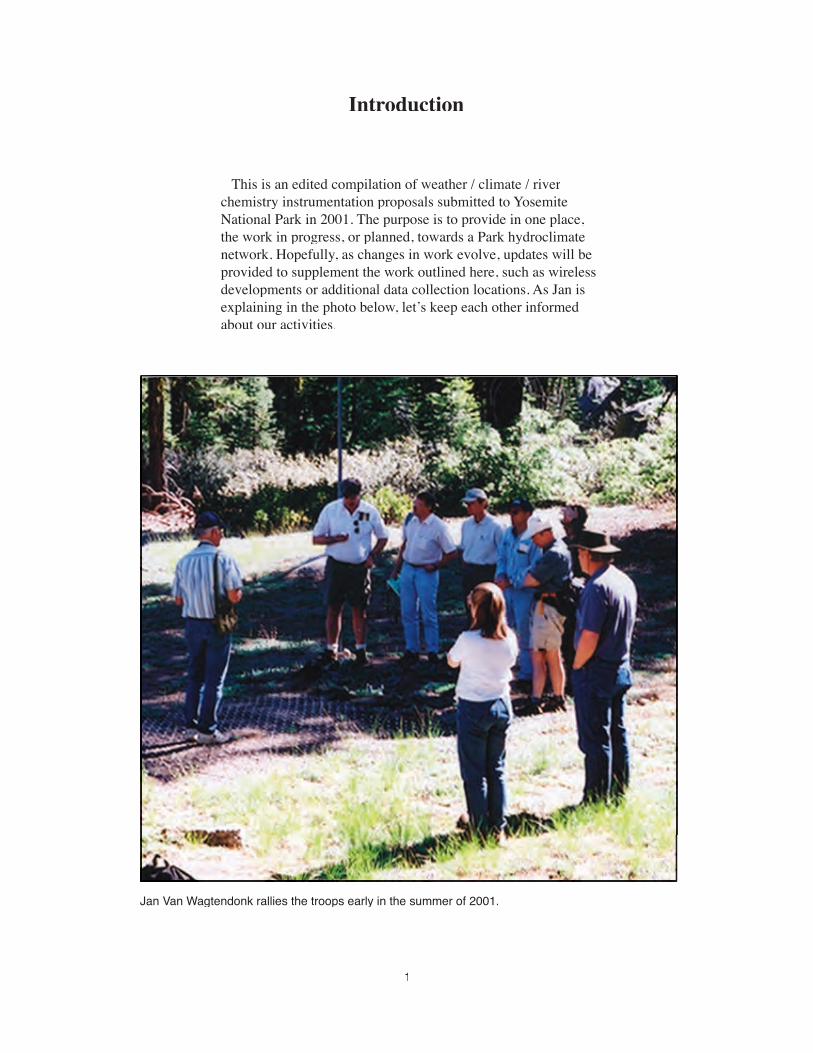
Jan Van Wagtendonk rallies the troops early in the summer of 2001.
This is an edited compilation of weather / climate / river chemistry instrumentation proposals submitted to Yosemite National Park in 2001. The purpose is to provide in one place, the work in progress, or planned, towards a Park hydroclimate network. Hopefully, as changes in work evolve, updates will be provided to supplement the work outlined here, such as wireless developments or additional data collection locations. As Jan is explaining in the photo below, letʼs keep each other informed about our activities.
1
Introduction
�����������
������
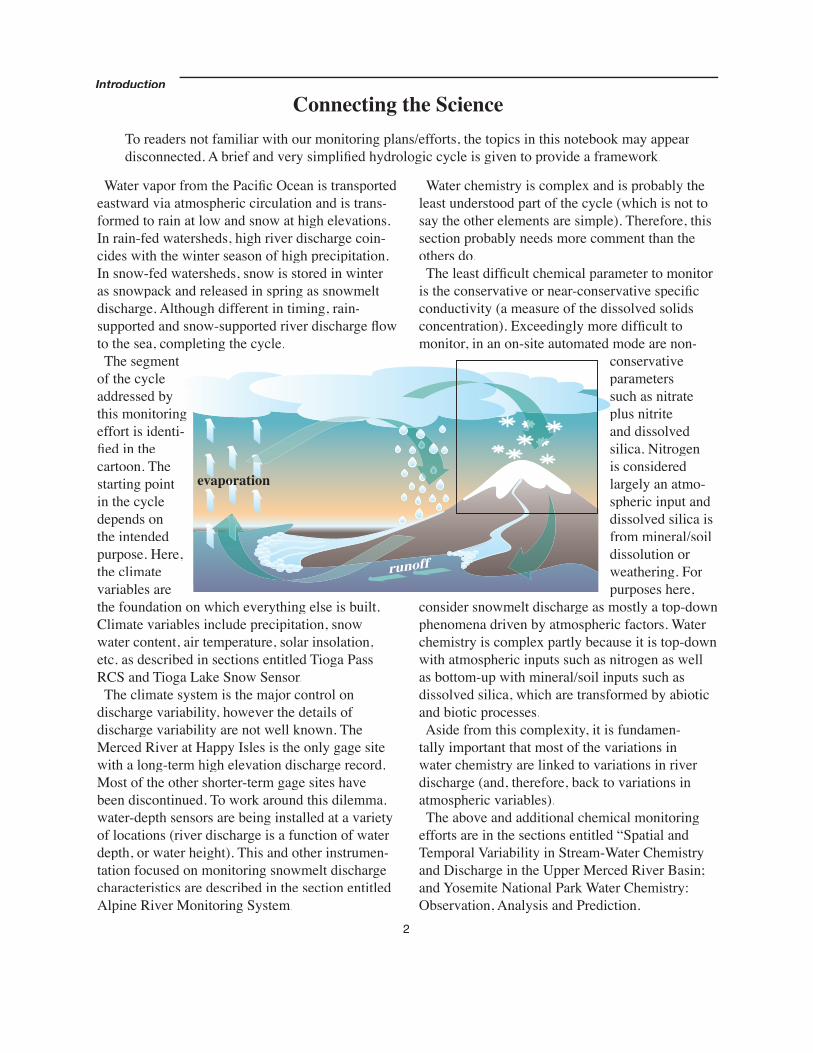
To readers not familiar with our monitoring plans/efforts, the topics in this notebook may appear disconnected. A brief and very simplifi ed hydrologic cycle is given to provide a framework.
Connecting the Science
Water vapor from the Pacifi c Ocean is transported eastward via atmospheric circulation and is trans-formed to rain at low and snow at high elevations. In rain-fed watersheds, high river discharge coin-cides with the winter season of high precipitation. In snow-fed watersheds, snow is stored in winter as snowpack and released in spring as snowmelt discharge. Although different in timing, rain-supported and snow-supported river discharge fl ow to the sea, completing the cycle. The segment of the cycle addressed by this monitoring this monitoring effort is identi-fi ed in the cartoon. The starting point in the cycle depends on the intended purpose. Here, the climate variables are the foundation on which everything else is built. Climate variables include precipitation, snow water content, air temperature, solar insolation, etc. as described in sections entitled Tioga Pass RCS and Tioga Lake Snow Sensor. The climate system is the major control on discharge variability, however the details of discharge variability are not well known. The Merced River at Happy Isles is the only gage site with a long-term high elevation discharge record. Most of the other shorter-term gage sites have been discontinued. To work around this dilemma, water-depth sensors are being installed at a variety of locations (river discharge is a function of water depth, or water height). This and other instrumen-tation focused on monitoring snowmelt discharge characteristics are described in the section entitled Alpine River Monitoring System.
Water chemistry is complex and is probably the least understood part of the cycle (which is not to say the other elements are simple). Therefore, this section probably needs more comment than the others do. The least diffi cult chemical parameter to monitor is the conservative or near-conservative specifi c conductivity (a measure of the dissolved solids concentration). Exceedingly more diffi cult to monitor, in an on-site automated mode are non-
conservative parameters such as nitrate plus nitrite and dissolved silica. Nitrogen is considered largely an atmo-spheric input and dissolved silica is from mineral/soil dissolution or weathering. For purposes here,
consider snowmelt discharge as mostly a top-down phenomena driven by atmospheric factors. Water chemistry is complex partly because it is top-down with atmospheric inputs such as nitrogen as well as bottom-up with mineral/soil inputs such as dissolved silica, which are transformed by abiotic and biotic processes. Aside from this complexity, it is fundamen-tally important that most of the variations in water chemistry are linked to variations in river discharge (and, therefore, back to variations in atmospheric variables). The above and additional chemical monitoring efforts are in the sections entitled “Spatial and Temporal Variability in Stream-Water Chemistry and Discharge in the Upper Merced River Basin; and Yosemite National Park Water Chemistry: Observation, Analysis and Prediction.
Introduction
2
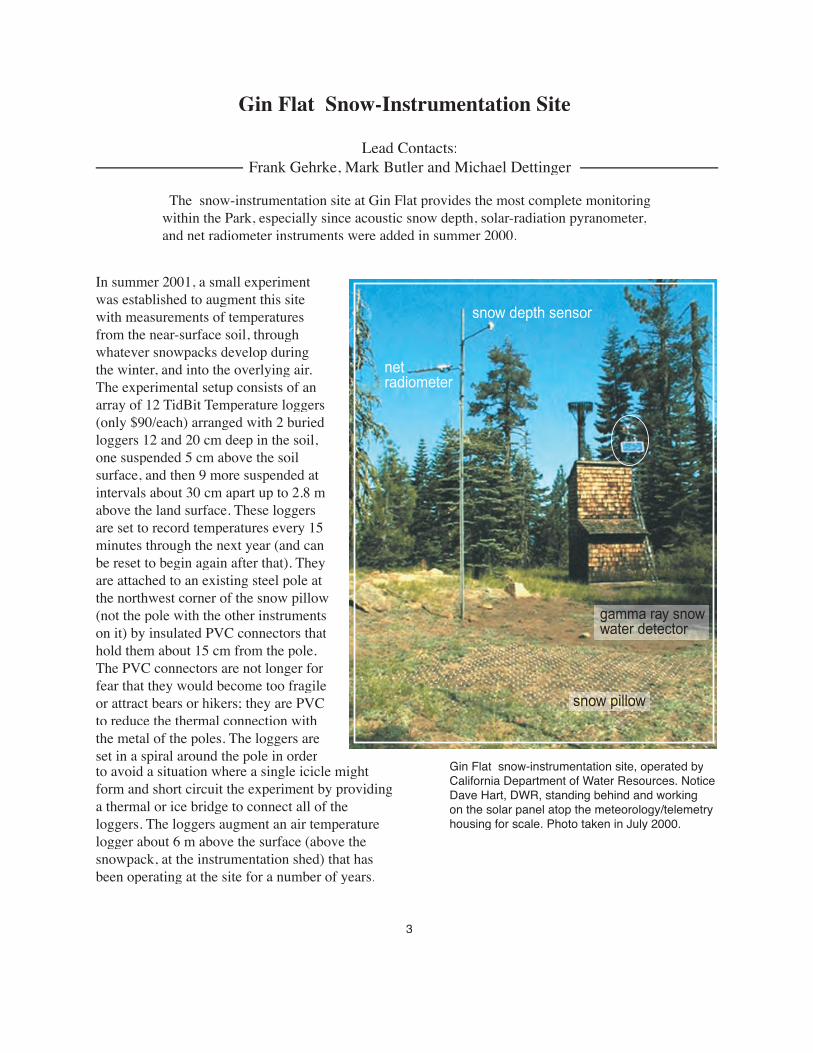
Gin Flat snow-instrumentation site, operated by California Department of Water Resources. Notice Dave Hart, DWR, standing behind and working on the solar panel atop the meteorology/telemetry housing for scale. Photo taken in July 2000.
The snow-instrumentation site at Gin Flat provides the most complete monitoring within the Park, especially since acoustic snow depth, solar-radiation pyranometer, and net radiometer instruments were added in summer 2000.
3
���� ����� ������
�������������
���� ������
����� ��� ��������� ��������
In summer 2001, a small experiment was established to augment this site with measurements of temperatures from the near-surface soil, through whatever snowpacks develop during the winter, and into the overlying air. The experimental setup consists of an array of 12 TidBit Temperature loggers (only $90/each) arranged with 2 buried loggers 12 and 20 cm deep in the soil, one suspended 5 cm above the soil surface, and then 9 more suspended at intervals about 30 cm apart up to 2.8 m above the land surface. These loggers are set to record temperatures every 15 minutes through the next year (and can be reset to begin again after that). They are attached to an existing steel pole at the northwest corner of the snow pillow (not the pole with the other instruments on it) by insulated PVC connectors that hold them about 15 cm from the pole. The PVC connectors are not longer for fear that they would become too fragile or attract bears or hikers; they are PVC to reduce the thermal connection with the metal of the poles. The loggers are set in a spiral around the pole in order
Gin Flat Snow-Instrumentation Site
to avoid a situation where a single icicle might form and short circuit the experiment by providing a thermal or ice bridge to connect all of the loggers. The loggers augment an air temperature logger about 6 m above the surface (above the snowpack, at the instrumentation shed) that has been operating at the site for a number of years.
Lead Contacts:Frank Gehrke, Mark Butler and Michael Dettinger

The Gin Flat automated snow-telemetry site, at 7,050 feet above sea level in Yosemite National Park, has been augmented in the past two years to measure components of the water and radia-tion budgets of the snowpack in addition to the precipitation, temperatures, and snow-water content (SWC) measurements typical of such sites. New measurements at Gin Flat include cosmic-ray-based SWC measurements, snow thickness, incoming solar radiation, and net radiation above the surface.
Instrumentation Results Winter and Spring 2002
Gin Flat Snow-instrumentation Site
4
A red fl ag is placed at the site location.
Together, measurements at Gin Flat characterize gross water and radiative-heat budgets of the winter snowpack and snow density. During 2002, temperatures within the snowpack also were monitored at one- to two-foot vertical intervals (some loggers failed), as indicators of the time and depth varying thermodynamics of the snowpack. Cosmic-ray SWC measurements continue to track the snow pillow well.
The idea is to let the loggers on the pole be buried by whatever snowpack develops on the site this winter, to thereby monitor the time evolution of soil, snow, and air temperatures within and adjacent to the snowpack as the snowpack builds, ages, and eventually melts. We hope to use the resulting temperature histories, together with the measurements of snow-water content, snow depth, solar radiation, and net radiation, to develop a better (potentially quantitative) sense of how heat gets into and out of the snow-pack, how the snowpack evolves towards the isothermal freezing state that is believed to coincide with melting, and how much memory the snowpack retains of temperature conditions during and between individual winter storms. If results look promising, next year we may setup similar experiments at other snow-instrumentation sites in the Park. If things go outrageously well, it may be possible to use the data to develop a diffusive-heat-transfer model of the heat balance of the snowpack.

Experimental setup. The spokesmodel is 5ʼ9” Julia Dettinger who pitched in like a trooper throughout the August 2002 fi eld instrumentation visit.
Additional instrumentation at Gin Flat is proving robust to the elements and is providing new insights into the workings of the Sierra Nevada snowpack. Augmentations have now been added at several more sites, including Tuolumne Meadows, Tioga Pass, and Dana Flat.
Gin Flat Snow-instrumentation Site
5
���������� ������������������ ���������������� ��������������������� �������
���� ������������������� ����������������������� ���������
����
������������������ ������������
����� ������������� ����� ��������� �� ����������� ���������� ��� ������� ������������
�������������� ������������������ ������������� ����� ������������� �������
����
��������������� ������������
�
�
� �
����������������
����� �����
�
�
�
�
�
�
�
�
�
�
��������������� �� ��� ����
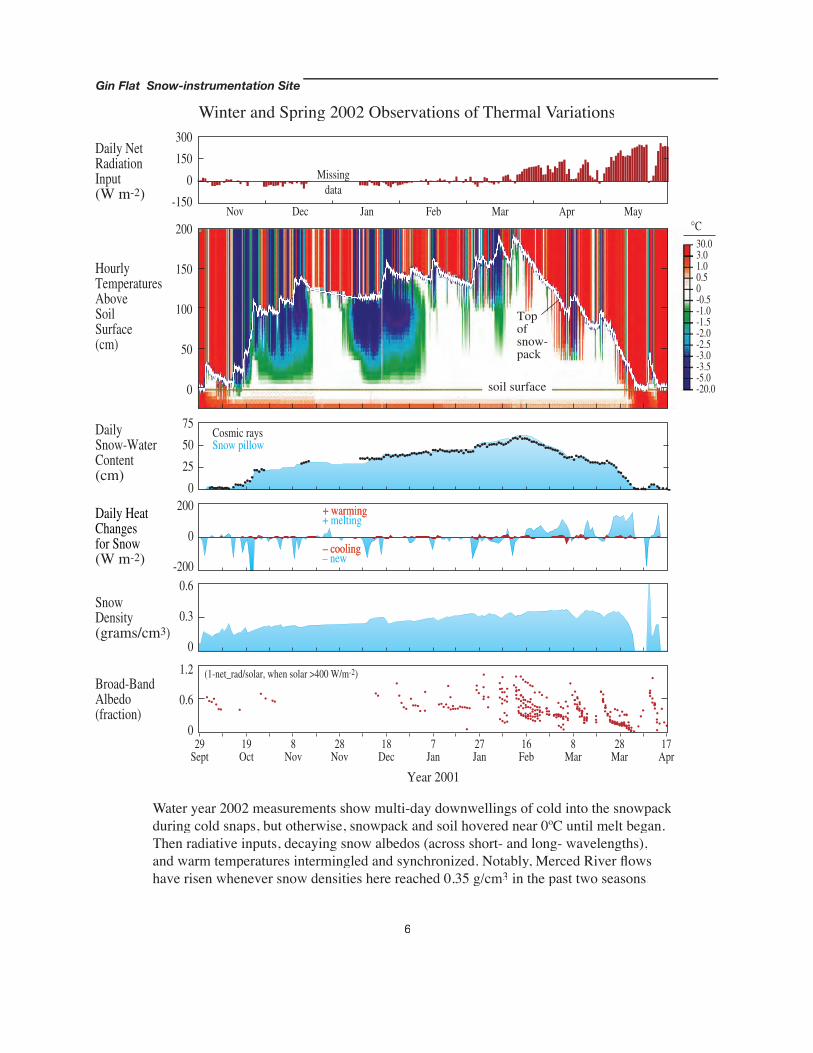
Water year 2002 measurements show multi-day downwellings of cold into the snowpack during cold snaps, but otherwise, snowpack and soil hovered near 0ºC until melt began. Then radiative inputs, decaying snow albedos (across short- and long- wavelengths), and warm temperatures intermingled and synchronized. Notably, Merced River fl ows have risen whenever snow densities here reached 0.35 g/cm3 in the past two seasons.
Winter and Spring 2002 Observations of Thermal VariationsGin Flat Snow-instrumentation Site
6
���
���
���
��
�
��
��
��
����
�
����
���
���
�
����
��������������
���������������������������������������������������
��������������������������������������
����� �������������� ������ ����
����� ������������������� ����
��������������������������
��
����������������������
��������������������������
����������������� ���� ����� ���� ���������
���
�
���
���
�
��� ��� ��� ��� ��� ��� ���
�����������
������ �������� ������
� �������
� �������
� �������
� �������
� �������
� ���
������
�����
����
�����
�����
����
���� ����
�����
�����
����
�����
�����
���� �������

Currently, most meteorological and hydrological observations are collected in accessible, highly populated, low elevation regions, whereas in western North America many of the most important hydroclimatic processes occur in less accessible, high elevation, unpopulated wilderness areas.
A hole 1.5ʼ diameter by 3ʼ deep would be dug for the base of the Rohn mast.
Tioga Pass RCS
Lead Contacts:Frank Gehrke, Greg McCurdy and Mark Butler
Data collection in these high elevation areas is diffi cult and expensive because of the extra costs and logistics required to visit snowy sites and preserve their wilderness character. The Tioga Pass site presents a unique opportunity to collect a variety of hydroclimatic data. Anticipated climate change and increased resource demand will require better understanding of physical processes if widespread environmental degrada-tion is too be avoided. The data and models using information from this site and other locations will be invaluable for monitoring long term hydrocli-matic changes and effects on the Park environ-ment and throughout the West. Additionally, specifi c instruments and computers added to the site will accelerate the development process for the new snow water content measure-ment devices as a replacement for snow pillows. The project involves the reestablishment of a precipitation measurement site, administered by the USGS, which was in place during the early ʻ90s. A Rohn mast, approximately 26 feet high, will be installed at the location of the old precipitation tower. The base of the mast will be installed in a concrete footing, 1.5 feet in diameter and 3 feet deep. A NEMA instrument enclosure 30” H x 20” W x 8” D will be bolted to the mast about 3 feet above ground with a supporting post underneath the box. The tower and other instruments will be painted or placed to blend with the background and minimize visual impact. Access to 110 volt power will be through an existing conduit. Instruments which will be installed on the tower are: temperature, humidity, wind direction and velocity, snow depth, shortwave incoming solar
7
���������� ���� �����������������
����� �����
���������� ������
������ ����������
��������� ������������� ��� ��������� �� �������� ���� ���������������
����� �������������
������� ��� ���
���������������
����������� ��� ��������
��� ������ ��� ��� �������������� ���� ���������
������������ ������������������� �����
���� ����� ������
��� ����������
���� ����
�������
������ �������
radiation, net solar radiation, electrically heated precipitation gage, and above snow (reference) high energy particle counter. Installed at the foot of the tower, just below ground surface, are a soil temperature probe and the below snow (fi eld) particle counter. Snow water content is determined by the ratio of the fi eld/reference measurements based on the known adsorption of high energy cosmic radiation by water. An antenna at the top of the mast will transmit the information to the GOES satellite for dissemination.
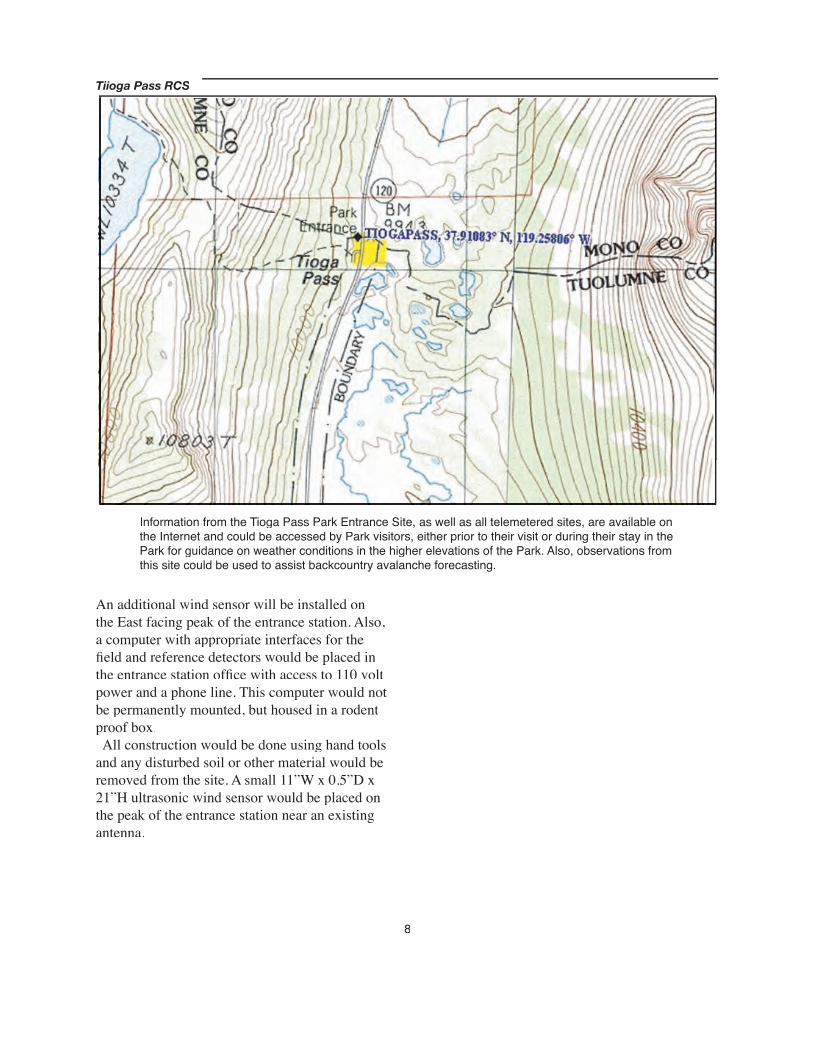
Information from the Tioga Pass Park Entrance Site, as well as all telemetered sites, are available on the Internet and could be accessed by Park visitors, either prior to their visit or during their stay in the Park for guidance on weather conditions in the higher elevations of the Park. Also, observations from this site could be used to assist backcountry avalanche forecasting.
Tiioga Pass RCS
8
An additional wind sensor will be installed on the East facing peak of the entrance station. Also, a computer with appropriate interfaces for the fi eld and reference detectors would be placed in the entrance station offi ce with access to 110 volt power and a phone line. This computer would not be permanently mounted, but housed in a rodent proof box. All construction would be done using hand tools and any disturbed soil or other material would be removed from the site. A small 11”W x 0.5”D x 21”H ultrasonic wind sensor would be placed on the peak of the entrance station near an existing antenna.
Tenaya Lake Snow SensorLead Contacts:
Frank Gehrke, Greg McCurdy and Mark Butler
Replacement of the existing 1.5” aluminum pole will also faciliate the addition of a heated precipita-tion gage, providing realtime rainfall data. A new mast is necessary to support this instrumentation. Additionally, specifi c instruments and computers added to the site will accelerate the development process for the new snow water content measure-ment devices as a replacement for snow pillows. The existing antenna mast is a 1.5” aluminum pole with a GOES antenna, temperature probe & shield and a 20 watt solar panel mounted near the top.
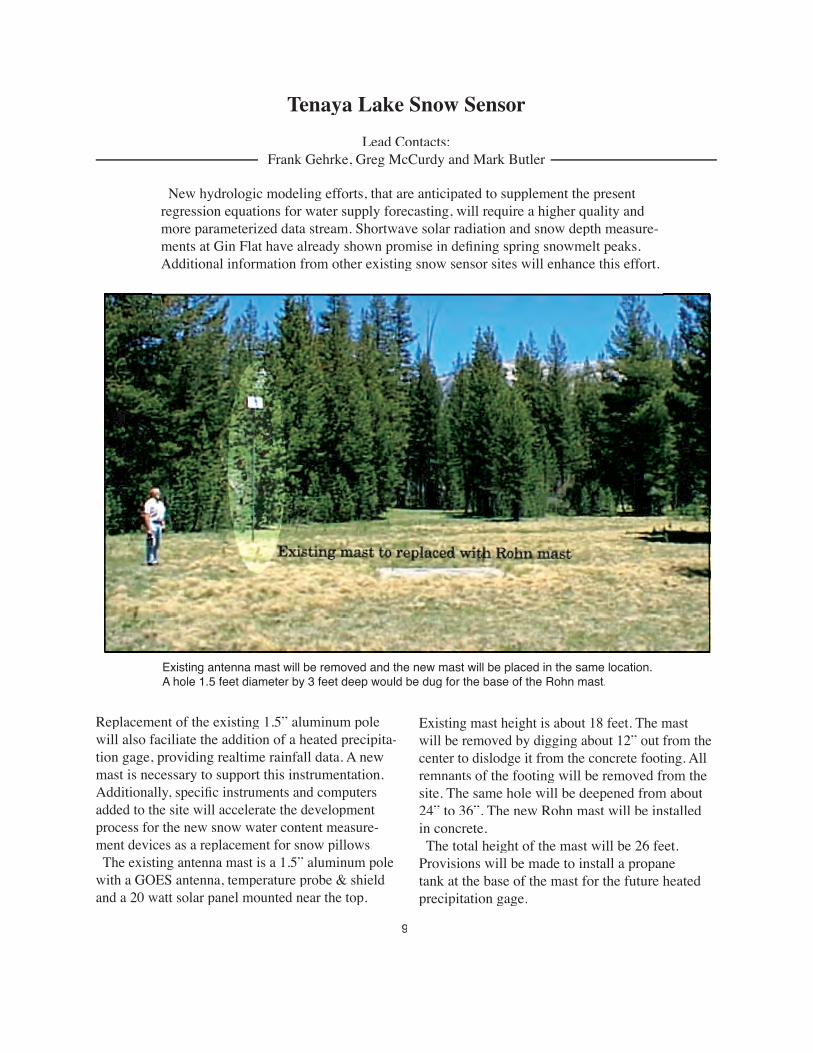
Existing mast height is about 18 feet. The mast will be removed by digging about 12” out from the center to dislodge it from the concrete footing. All remnants of the footing will be removed from the site. The same hole will be deepened from about 24” to 36”. The new Rohn mast will be installed in concrete. The total height of the mast will be 26 feet. Provisions will be made to install a propane tank at the base of the mast for the future heated precipitation gage.
Existing antenna mast will be removed and the new mast will be placed in the same location. A hole 1.5 feet diameter by 3 feet deep would be dug for the base of the Rohn mast.
9
New hydrologic modeling efforts, that are anticipated to supplement the present regression equations for water supply forecasting, will require a higher quality and more parameterized data stream. Shortwave solar radiation and snow depth measure-ments at Gin Flat have already shown promise in defi ning spring snowmelt peaks. Additional information from other existing snow sensor sites will enhance this effort.
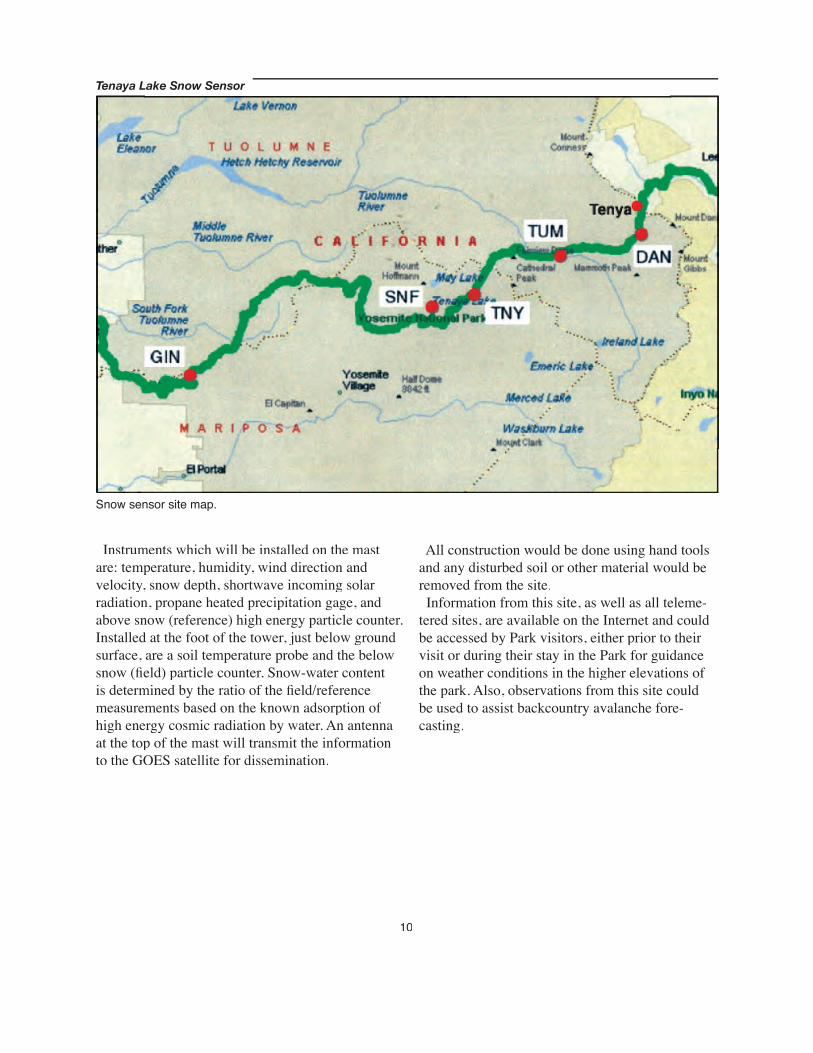
Snow sensor site map.
Tenaya Lake Snow Sensor
10
Instruments which will be installed on the mast are: temperature, humidity, wind direction and velocity, snow depth, shortwave incoming solar radiation, propane heated precipitation gage, and above snow (reference) high energy particle counter. Installed at the foot of the tower, just below ground surface, are a soil temperature probe and the below snow (fi eld) particle counter. Snow-water content is determined by the ratio of the fi eld/reference measurements based on the known adsorption of high energy cosmic radiation by water. An antenna at the top of the mast will transmit the information to the GOES satellite for dissemination.
All construction would be done using hand tools and any disturbed soil or other material would be removed from the site. Information from this site, as well as all teleme-tered sites, are available on the Internet and could be accessed by Park visitors, either prior to their visit or during their stay in the Park for guidance on weather conditions in the higher elevations of the park. Also, observations from this site could be used to assist backcountry avalanche fore-casting.
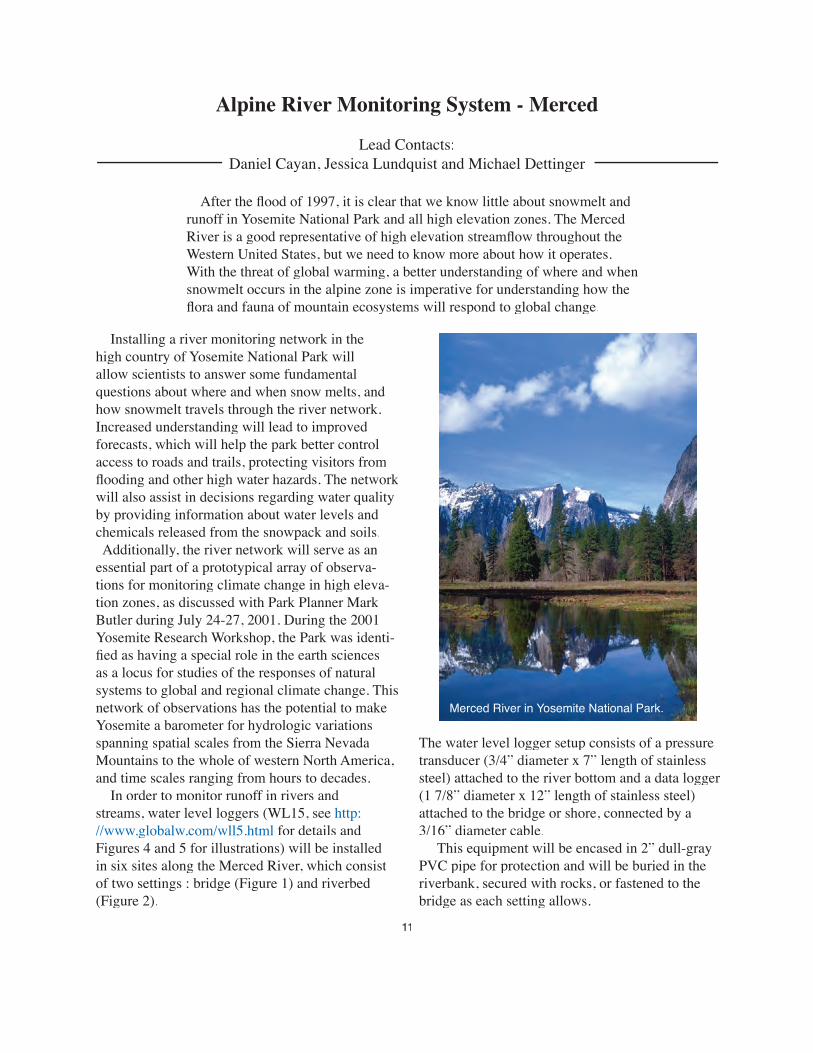
Merced River in Yosemite National Park.
Alpine River Monitoring System - Merced
Lead Contacts:Daniel Cayan, Jessica Lundquist and Michael Dettinger
11
After the fl ood of 1997, it is clear that we know little about snowmelt and runoff in Yosemite National Park and all high elevation zones. The Merced River is a good representative of high elevation streamfl ow throughout the Western United States, but we need to know more about how it operates. With the threat of global warming, a better understanding of where and when snowmelt occurs in the alpine zone is imperative for understanding how the fl ora and fauna of mountain ecosystems will respond to global change.
Installing a river monitoring network in the high country of Yosemite National Park will allow scientists to answer some fundamental questions about where and when snow melts, and how snowmelt travels through the river network. Increased understanding will lead to improved forecasts, which will help the park better control access to roads and trails, protecting visitors from fl ooding and other high water hazards. The network will also assist in decisions regarding water quality by providing information about water levels and chemicals released from the snowpack and soils. Additionally, the river network will serve as an essential part of a prototypical array of observa-tions for monitoring climate change in high eleva-tion zones, as discussed with Park Planner Mark Butler during July 24-27, 2001. During the 2001 Yosemite Research Workshop, the Park was identi-fi ed as having a special role in the earth sciences as a locus for studies of the responses of natural systems to global and regional climate change. This network of observations has the potential to make Yosemite a barometer for hydrologic variations spanning spatial scales from the Sierra Nevada Mountains to the whole of western North America, and time scales ranging from hours to decades. In order to monitor runoff in rivers and streams, water level loggers (WL15, see http://www.globalw.com/wll5.html for details and Figures 4 and 5 for illustrations) will be installed in six sites along the Merced River, which consist of two settings : bridge (Figure 1) and riverbed (Figure 2).
The water level logger setup consists of a pressure transducer (3/4” diameter x 7” length of stainless steel) attached to the river bottom and a data logger (1 7/8” diameter x 12” length of stainless steel) attached to the bridge or shore, connected by a 3/16” diameter cable. This equipment will be encased in 2” dull-gray PVC pipe for protection and will be buried in the riverbank, secured with rocks, or fastened to the bridge as each setting allows.
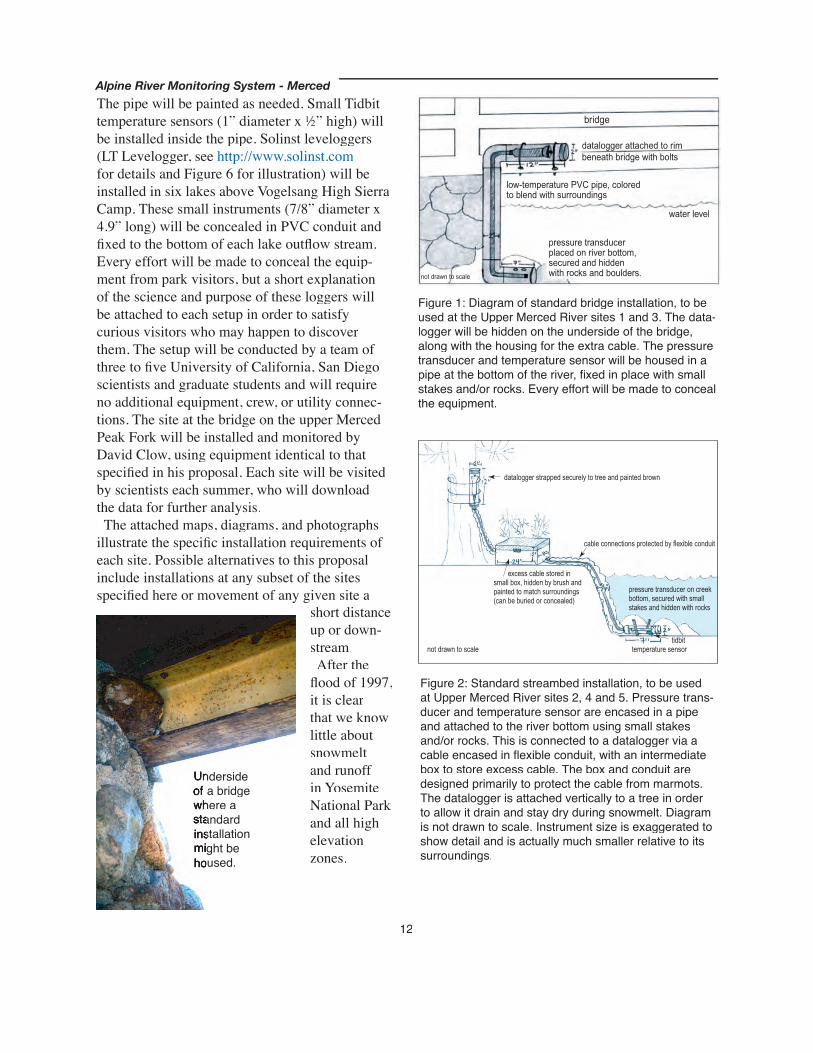
Figure 2: Standard streambed installation, to be used at Upper Merced River sites 2, 4 and 5. Pressure trans-ducer and temperature sensor are encased in a pipe and attached to the river bottom using small stakes and/or rocks. This is connected to a datalogger via a cable encased in fl exible conduit, with an intermediate box to store excess cable. The box and conduit are designed primarily to protect the cable from marmots. The datalogger is attached vertically to a tree in order to allow it drain and stay dry during snowmelt. Diagram is not drawn to scale. Instrument size is exaggerated to show detail and is actually much smaller relative to its surroundings.
Figure 1: Diagram of standard bridge installation, to be used at the Upper Merced River sites 1 and 3. The data-logger will be hidden on the underside of the bridge, along with the housing for the extra cable. The pressure transducer and temperature sensor will be housed in a pipe at the bottom of the river, fi xed in place with small stakes and/or rocks. Every effort will be made to conceal the equipment.
Alpine River Monitoring System - Merced
12
������
�������� ���������������� �� ����� �������������� ��� ���������� ����� ��� ���������
���������� �������� �� ���������� ������ ���� �����
��������������� ��� ����� ��������� ����� ���� ������������
����� �����
��� ����� �� �����
����������������� ��������� ����� �� �����
����� ����������� ��������� �� �������� �������
���������� �������� �������� �� ���� ��� ������� �����
������ ����� ������ ������� ���� ������ �� ����� ���������� �� ����� ���������������� �� ������ �� ����������
�������� ���������� �� ������������ ������� ���� ����������� ��� ������ ���� �����
The pipe will be painted as needed. Small Tidbit temperature sensors (1” diameter x 1⁄2” high) will be installed inside the pipe. Solinst leveloggers (LT Levelogger, see http://www.solinst.comfor details and Figure 6 for illustration) will be installed in six lakes above Vogelsang High Sierra Camp. These small instruments (7/8” diameter x 4.9” long) will be concealed in PVC conduit and fi xed to the bottom of each lake outfl ow stream. Every effort will be made to conceal the equip-ment from park visitors, but a short explanation of the science and purpose of these loggers will be attached to each setup in order to satisfy curious visitors who may happen to discover them. The setup will be conducted by a team of three to fi ve University of California, San Diego scientists and graduate students and will require no additional equipment, crew, or utility connec-tions. The site at the bridge on the upper Merced Peak Fork will be installed and monitored by David Clow, using equipment identical to that specifi ed in his proposal. Each site will be visited by scientists each summer, who will download the data for further analysis. The attached maps, diagrams, and photographs illustrate the specifi c installation requirements of each site. Possible alternatives to this proposal include installations at any subset of the sites specifi ed here or movement of any given site a
short distance up or down-stream. After the fl ood of 1997, it is clear that we know little about snowmelt and runoff in Yosemite National Park and all high elevation zones.
Underside Underside Underside of a bridge of a bridge of a bridge where a where a where a standard standard standard installation installation installation might be might be might be housed.housed.housed.
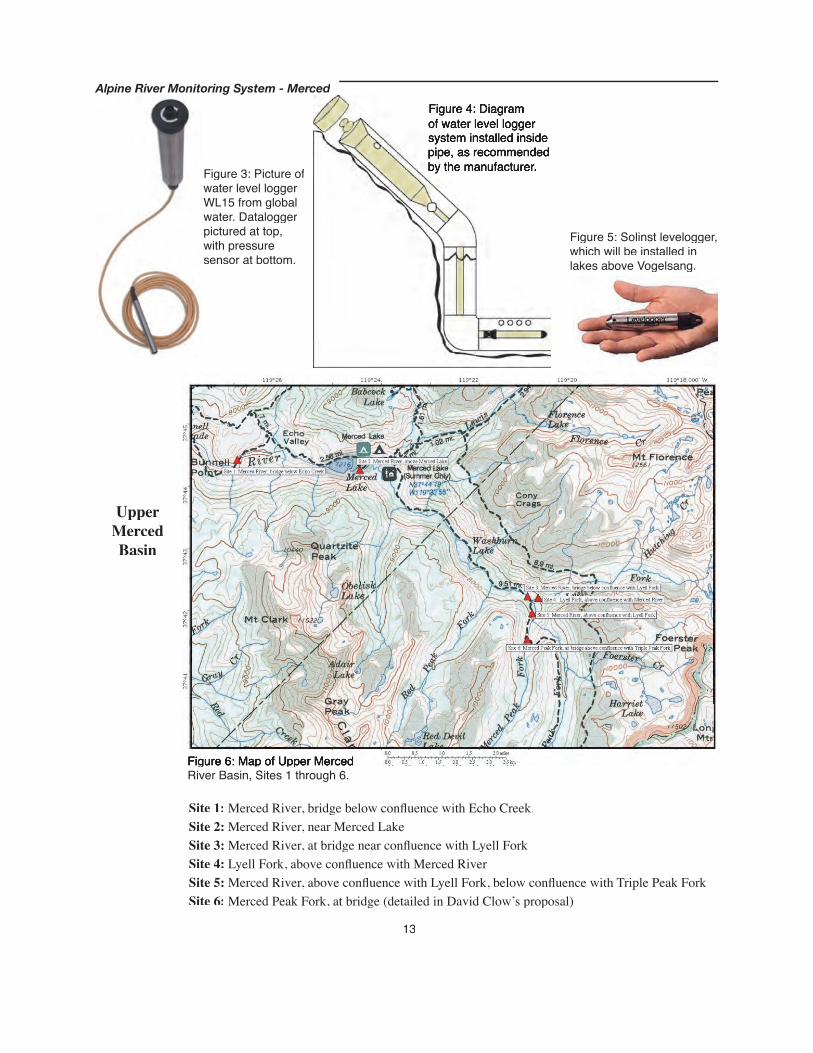
Figure 3: Picture of water level logger WL15 from global water. Datalogger pictured at top, with pressure sensor at bottom.
Figure 4: Diagram of water level logger system installed inside pipe, as recommended by the manufacturer.
Figure 5: Solinst levelogger, which will be installed in lakes above Vogelsang.
Site 1: Merced River, bridge below confl uence with Echo Creek.Site 2: Merced River, near Merced LakeSite 3: Merced River, at bridge near confl uence with Lyell ForkSite 4: Lyell Fork, above confl uence with Merced RiverSite 5: Merced River, above confl uence with Lyell Fork, below confl uence with Triple Peak ForkSite 6: Merced Peak Fork, at bridge (detailed in David Clowʼs proposal)
Upper Merced Basin
Alpine River Monitoring System - Merced
13
Figure 6: Map of Upper Merced Figure 6: Map of Upper Merced River Basin, Sites 1 through 6.
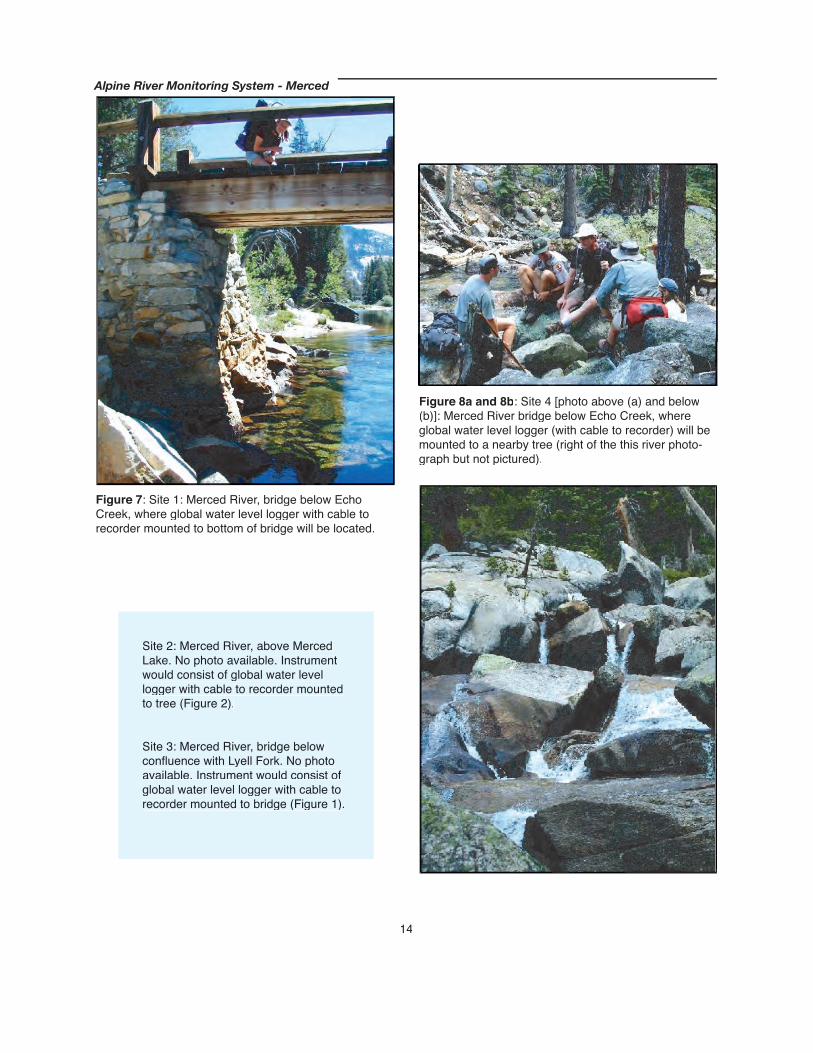
Figure 7: Site 1: Merced River, bridge below Echo Creek, where global water level logger with cable to recorder mounted to bottom of bridge will be located.
Site 2: Merced River, above Merced Lake. No photo available. Instrument would consist of global water level logger with cable to recorder mounted to tree (Figure 2).
Site 3: Merced River, bridge below confl uence with Lyell Fork. No photo available. Instrument would consist of global water level logger with cable to recorder mounted to bridge (Figure 1).
Figure 8a and 8b: Site 4 [photo above (a) and below (b)]: Merced River bridge below Echo Creek, where global water level logger (with cable to recorder) will be mounted to a nearby tree (right of the this river photo-graph but not pictured).
Alpine River Monitoring System - Merced
14
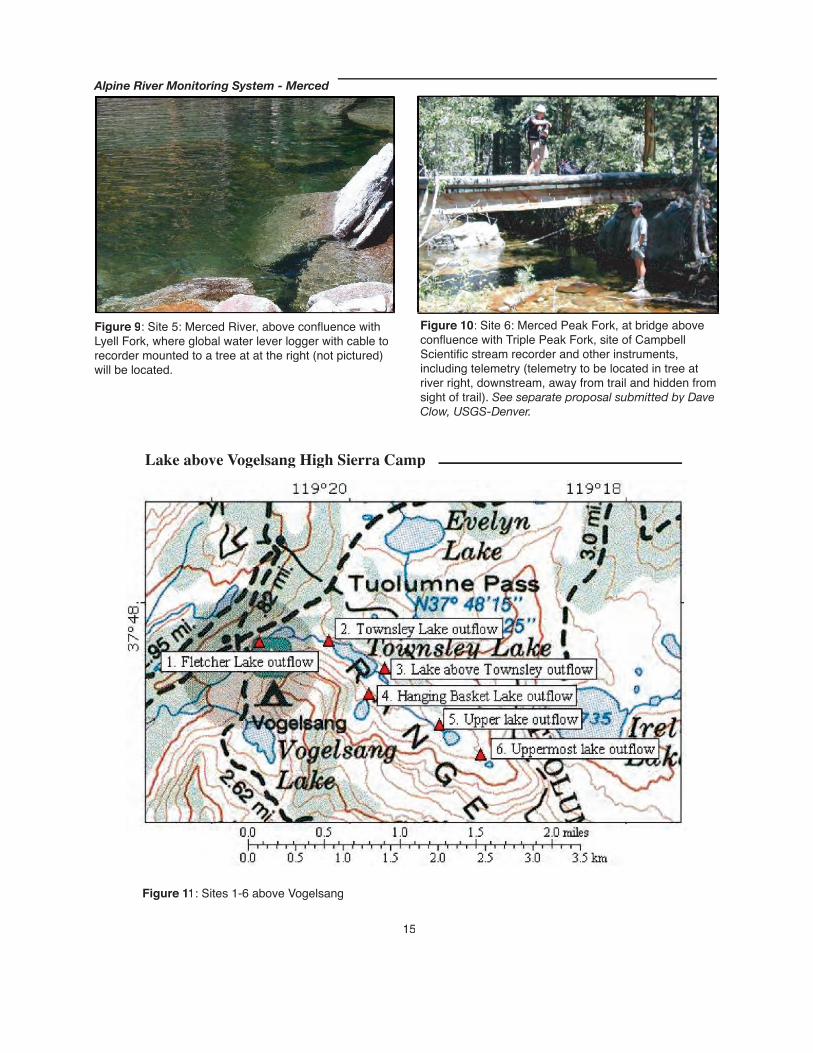
Figure 9: Site 5: Merced River, above confl uence with Lyell Fork, where global water lever logger with cable to recorder mounted to a tree at at the right (not pictured) will be located.
Figure 10: Site 6: Merced Peak Fork, at bridge above confl uence with Triple Peak Fork, site of Campbell Scientifi c stream recorder and other instruments, including telemetry (telemetry to be located in tree at river right, downstream, away from trail and hidden from sight of trail). See separate proposal submitted by Dave Clow, USGS-Denver.
Figure 11: Sites 1-6 above Vogelsang
Lake above Vogelsang High Sierra Camp
Alpine River Monitoring System - Merced
15
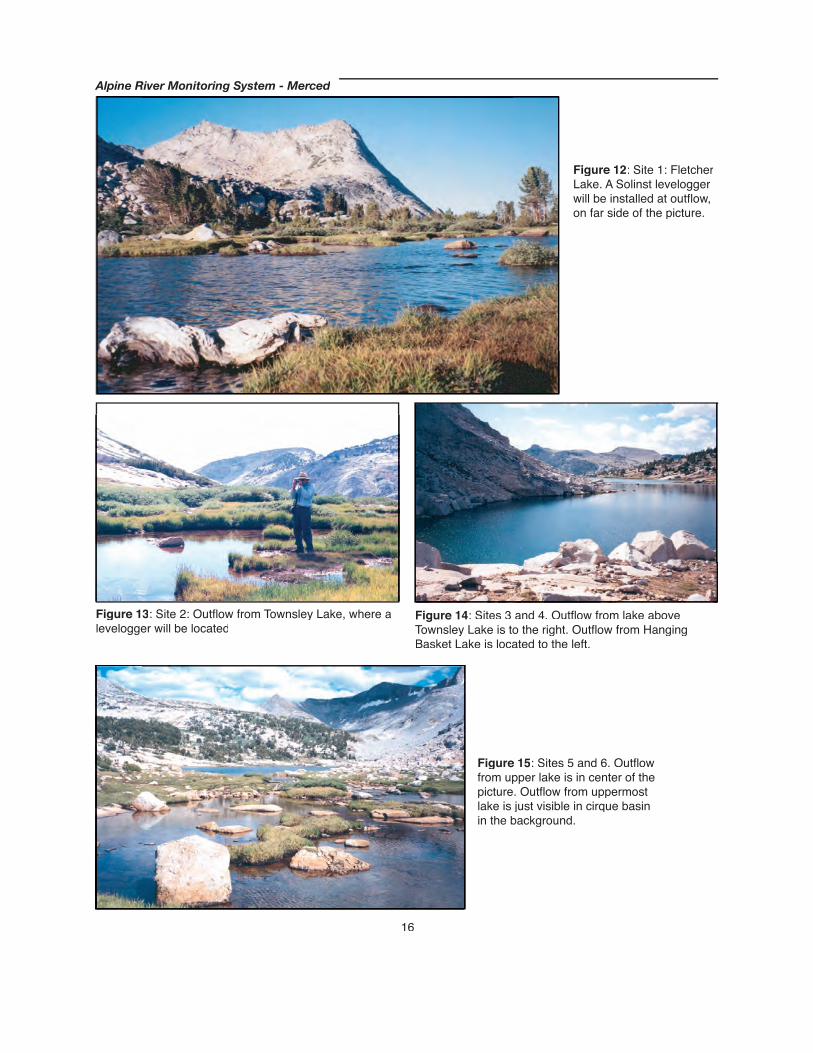
Figure 15: Sites 5 and 6. Outfl ow from upper lake is in center of the picture. Outfl ow from uppermost lake is just visible in cirque basin in the background.
Figure 12: Site 1: Fletcher Lake. A Solinst levelogger will be installed at outfl ow, on far side of the picture.
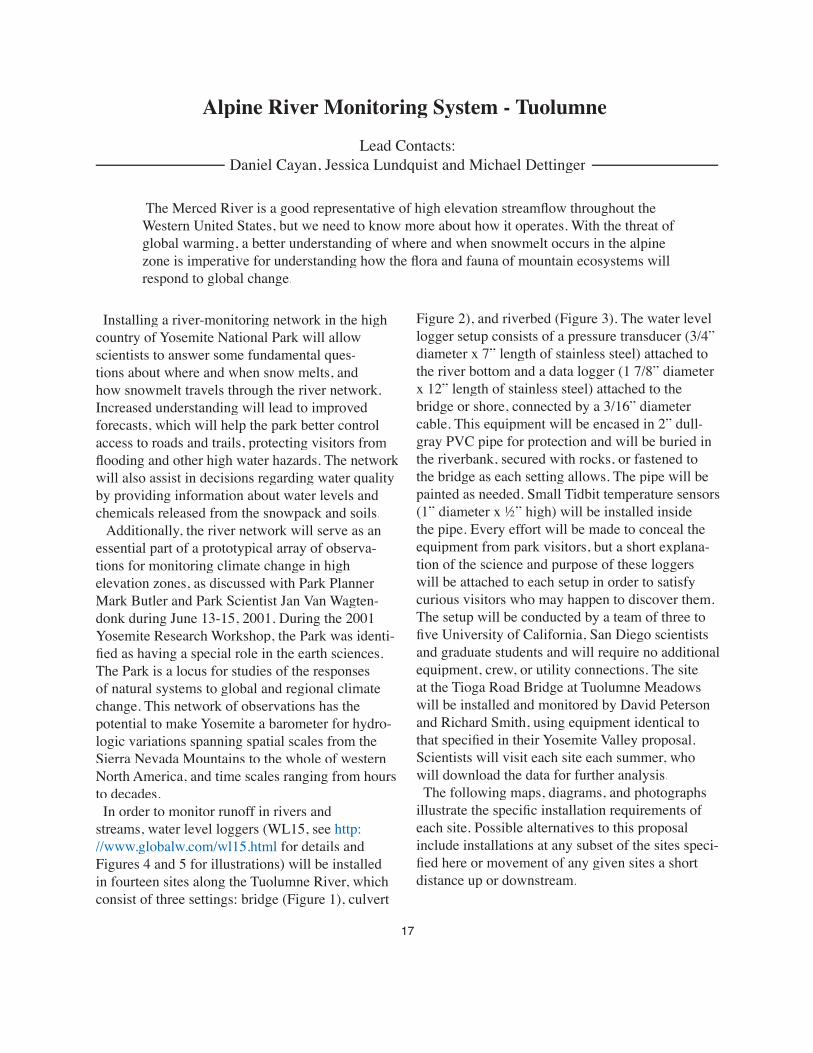
Figure 13: Site 2: Outfl ow from Townsley Lake, where a levelogger will be located
Figure 14: Sites 3 and 4. Outfl ow from lake above Townsley Lake is to the right. Outfl ow from Hanging Basket Lake is located to the left.
Alpine River Monitoring System - Merced
16
Alpine River Monitoring System - Tuolumne
Lead Contacts:Daniel Cayan, Jessica Lundquist and Michael Dettinger
17
Figure 2), and riverbed (Figure 3). The water level logger setup consists of a pressure transducer (3/4” diameter x 7” length of stainless steel) attached to the river bottom and a data logger (1 7/8” diameter x 12” length of stainless steel) attached to the bridge or shore, connected by a 3/16” diameter cable. This equipment will be encased in 2” dull-gray PVC pipe for protection and will be buried in the riverbank, secured with rocks, or fastened to the bridge as each setting allows. The pipe will be painted as needed. Small Tidbit temperature sensors (1” diameter x 1⁄2” high) will be installed inside the pipe. Every effort will be made to conceal the equipment from park visitors, but a short explana-tion of the science and purpose of these loggers will be attached to each setup in order to satisfy curious visitors who may happen to discover them. The setup will be conducted by a team of three to fi ve University of California, San Diego scientists and graduate students and will require no additional equipment, crew, or utility connections. The site at the Tioga Road Bridge at Tuolumne Meadows will be installed and monitored by David Peterson and Richard Smith, using equipment identical to that specifi ed in their Yosemite Valley proposal. Scientists will visit each site each summer, who will download the data for further analysis. The following maps, diagrams, and photographs illustrate the specifi c installation requirements of each site. Possible alternatives to this proposal include installations at any subset of the sites speci-fi ed here or movement of any given sites a short distance up or downstream.
Installing a river-monitoring network in the high country of Yosemite National Park will allow scientists to answer some fundamental ques-tions about where and when snow melts, and how snowmelt travels through the river network. Increased understanding will lead to improved forecasts, which will help the park better control access to roads and trails, protecting visitors from fl ooding and other high water hazards. The network will also assist in decisions regarding water quality by providing information about water levels and chemicals released from the snowpack and soils. Additionally, the river network will serve as an essential part of a prototypical array of observa-tions for monitoring climate change in high elevation zones, as discussed with Park Planner Mark Butler and Park Scientist Jan Van Wagten-donk during June 13-15, 2001. During the 2001 Yosemite Research Workshop, the Park was identi-fi ed as having a special role in the earth sciences. The Park is a locus for studies of the responses of natural systems to global and regional climate change. This network of observations has the potential to make Yosemite a barometer for hydro-logic variations spanning spatial scales from the Sierra Nevada Mountains to the whole of western North America, and time scales ranging from hours to decades. In order to monitor runoff in rivers and streams, water level loggers (WL15, see http://www.globalw.com/wl15.html for details and Figures 4 and 5 for illustrations) will be installed in fourteen sites along the Tuolumne River, which consist of three settings: bridge (Figure 1), culvert
The Merced River is a good representative of high elevation streamfl ow throughout the Western United States, but we need to know more about how it operates. With the threat of global warming, a better understanding of where and when snowmelt occurs in the alpine zone is imperative for understanding how the fl ora and fauna of mountain ecosystems will respond to global change.

Figure 1: Diagram of standard bridge installation, used at sites 1, 2, 7, 8, 9, 11, 12, and 13. The datalogger will be hidden on the underside of the bridge, along with the housing for the extra cable. The pressure transducer and temperature sensor will be housed in a pipe at the bottom of the river, fi xed in place with small stakes and/or rocks. Every effort will be made to conceal the equip-ment.
Figure 2: Standard culvert installation, to be used at Sites 3, 4, and 6. The entire setup will be placed back in the culvert, with the excess cable stored towards the rear. This drawing is not to scale, and the actual equip-ment will be much smaller relative to the culvert size.
Figure 3: Standard streambed installation, to be used at Sites 10 and 14. Pressure transducer and tempera-ture sensor are encased in a pipe and attached to the river bottom using small stakes and/or rocks. This is connected to a datalogger via a cable encased in fl exible conduit, with an intermediate box to store excess cable. The box and conduit are designed primarily to protect the cable from marmots. The datalogger is attached vertically to a tree in order to allow it drain and stay dry during snowmelt. Diagram is not drawn to scale. Instru-ment size is exaggerated to show detail and is actually much smaller relative to its surroundings.
Figure 4: Picture of water Figure 4: Picture of water level logger WL15 from level logger WL15 from global water. Datalogger global water. Datalogger pictured at top, with pres-pictured at top, with pres-sure sensor at bottom.sure sensor at bottom.
Figure 5: Diagram of water Figure 5: Diagram of water level logger system installed level logger system installed inside pipe, as recommended inside pipe, as recommended by the manufacturer.by the manufacturer.
Alpine River Monitoring System - Tuolumne
18
Bridges will acquire small holes where dataloggers are bolted to the underside. Culvert will also have small holes drilled into it to attach bolts. Where the PVC pipe is buried in the streambed and/or bank, soils will be temporarily disturbed. Every effort will be made to replace the soil to its original state. Because this is a very small instrument, the amount of soil disturbed will be minimal.
����������������� ��������� ����� �� �����
����� ����������� ��������� �� �������� �������
���������� �������� �������� �� ���� ��� ������� �����
������ ����� ������ ������� ���� ������ �� ����� ���������� �� ����� ���������������� �� ������ �� ����������
�������� ���������� �� ������������ ������� ���� ����������� ��� ������ ���� �����
���� � ���������� �������� �� ��� ������������� ���� �����
������ ����������� ������
��� ����������� ��� ������������ �� ����� ���� ������������
����� �����
���
��
��
����������� ���� �� ����� ������ ����������� ����� ������
����� ������ �� ���� ���� �� �����
�������� ����������������� �� ����� ���������� ����� ��� ��������
������ ����������� ������
��� ����� �� �����
���� ������ ������ �� ���� �� ������������� ��� ������� �� �������� ����
���������������������������� ���������
�����������������������
�������
�������� ���������� ������� ������� ����������� ����� ������ ��������� ���� �����
��� ����� �� �����
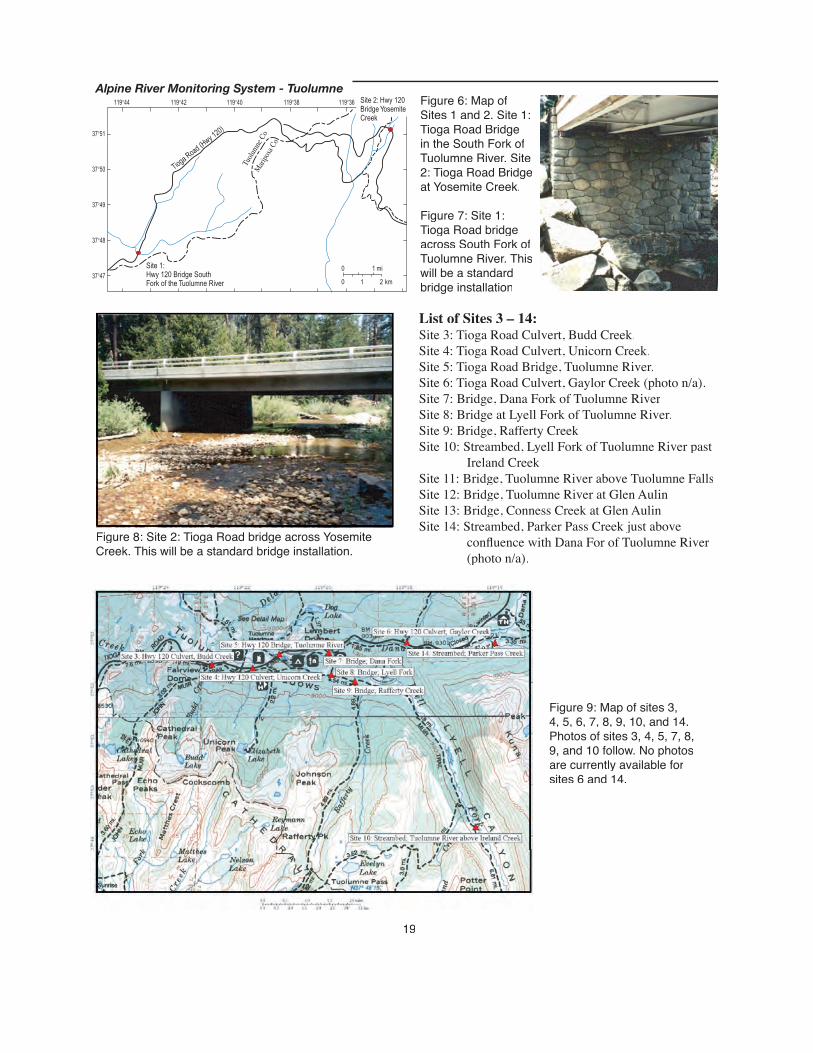
Figure 8: Site 2: Tioga Road bridge across Yosemite Creek. This will be a standard bridge installation.
Figure 9: Map of sites 3, 4, 5, 6, 7, 8, 9, 10, and 14. Photos of sites 3, 4, 5, 7, 8, 9, and 10 follow. No photos are currently available for sites 6 and 14.
List of Sites 3 – 14:Site 3: Tioga Road Culvert, Budd Creek.Site 4: Tioga Road Culvert, Unicorn Creek.Site 5: Tioga Road Bridge, Tuolumne River.Site 6: Tioga Road Culvert, Gaylor Creek (photo n/a). Site 7: Bridge, Dana Fork of Tuolumne RiverSite 8: Bridge at Lyell Fork of Tuolumne River.Site 9: Bridge, Rafferty CreekSite 10: Streambed, Lyell Fork of Tuolumne River past
Ireland CreekSite 11: Bridge, Tuolumne River above Tuolumne FallsSite 12: Bridge, Tuolumne River at Glen AulinSite 13: Bridge, Conness Creek at Glen AulinSite 14: Streambed, Parker Pass Creek just above
confl uence with Dana For of Tuolumne River (photo n/a).
Figure 6: Map of Sites 1 and 2. Site 1: Tioga Road Bridge in the South Fork of Tuolumne River. Site 2: Tioga Road Bridge at Yosemite Creek.
Figure 7: Site 1: Tioga Road bridge across South Fork of Tuolumne River. This will be a standard bridge installation
Alpine River Monitoring System - Tuolumne
19
������������� ����
� �
� �
��
���
�����
�����
�����
�����
�����
����
����
���
����
��� �
�
���� �� ��� ��������� �������������
���� ����� ��� ������ ��������� �� ��� �������� �����
������ ������ ������ ������ ������
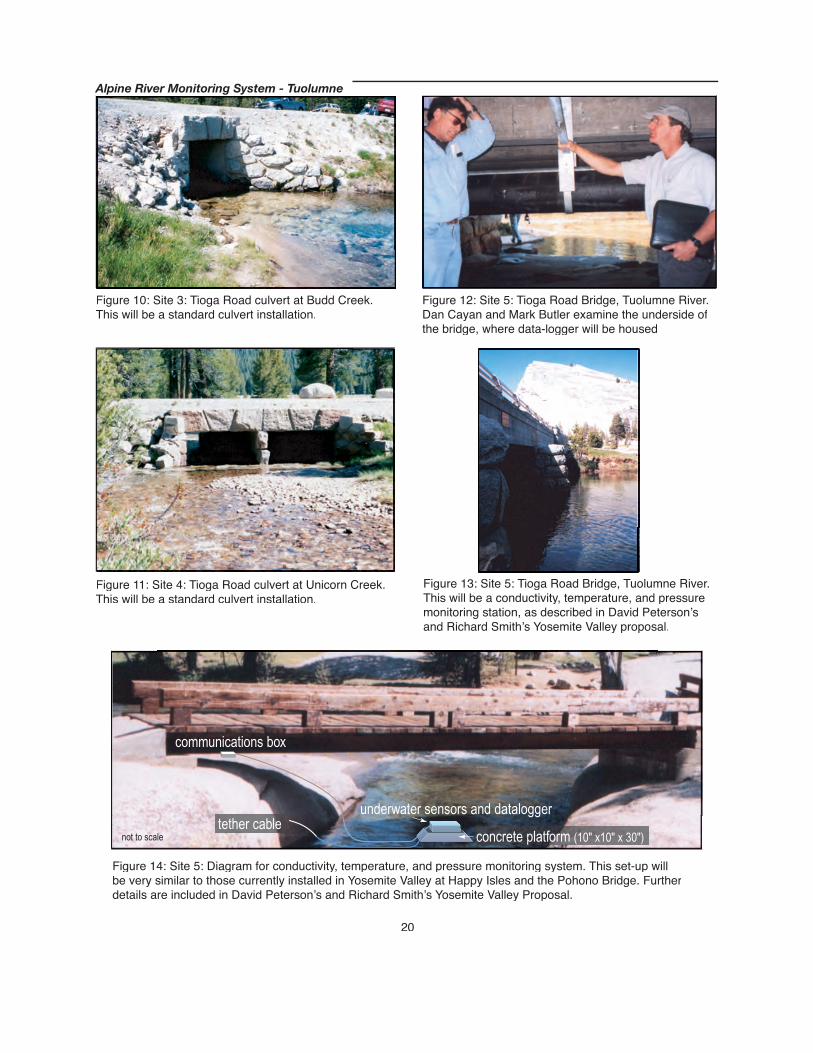
Figure 10: Site 3: Tioga Road culvert at Budd Creek. This will be a standard culvert installation.
Figure 11: Site 4: Tioga Road culvert at Unicorn Creek. This will be a standard culvert installation.
Figure 12: Site 5: Tioga Road Bridge, Tuolumne River. Dan Cayan and Mark Butler examine the underside of the bridge, where data-logger will be housed
Figure 13: Site 5: Tioga Road Bridge, Tuolumne River. This will be a conductivity, temperature, and pressure monitoring station, as described in David Petersonʼs and Richard Smithʼs Yosemite Valley proposal.
Figure 14: Site 5: Diagram for conductivity, temperature, and pressure monitoring system. This set-up will be very similar to those currently installed in Yosemite Valley at Happy Isles and the Pohono Bridge. Further details are included in David Petersonʼs and Richard Smithʼs Yosemite Valley Proposal.
Alpine River Monitoring System - Tuolumne
20
�������� �������� ���� ���� � ������� �� �����
���������� ������� ��� ����������
�������������� ���
������ �����

Figure 15 (left): Site 7: Bridge, Dana Fork of Tuolumne River. This will be a standard bridge installation.
Figure 16 (above): Site 8: Bridge, Lyell Fork of Tuolumne River. This will be a standard bridge installation.
Figure 17: Site 9: Bridge, Raffterty Creek. This will be a standard bridge installation.
Figure 18: Site 10: Streambed, Lyell Fork of Tuolumne River past Ireland Creek. This will be a standard streambed installation with the datalogger attached to one of the trees. The conduit and box will be hidden in the bushes.
Alpine River Monitoring System - Tuolumne
21
Figure 19: Map of sites 11, 12, and 13.
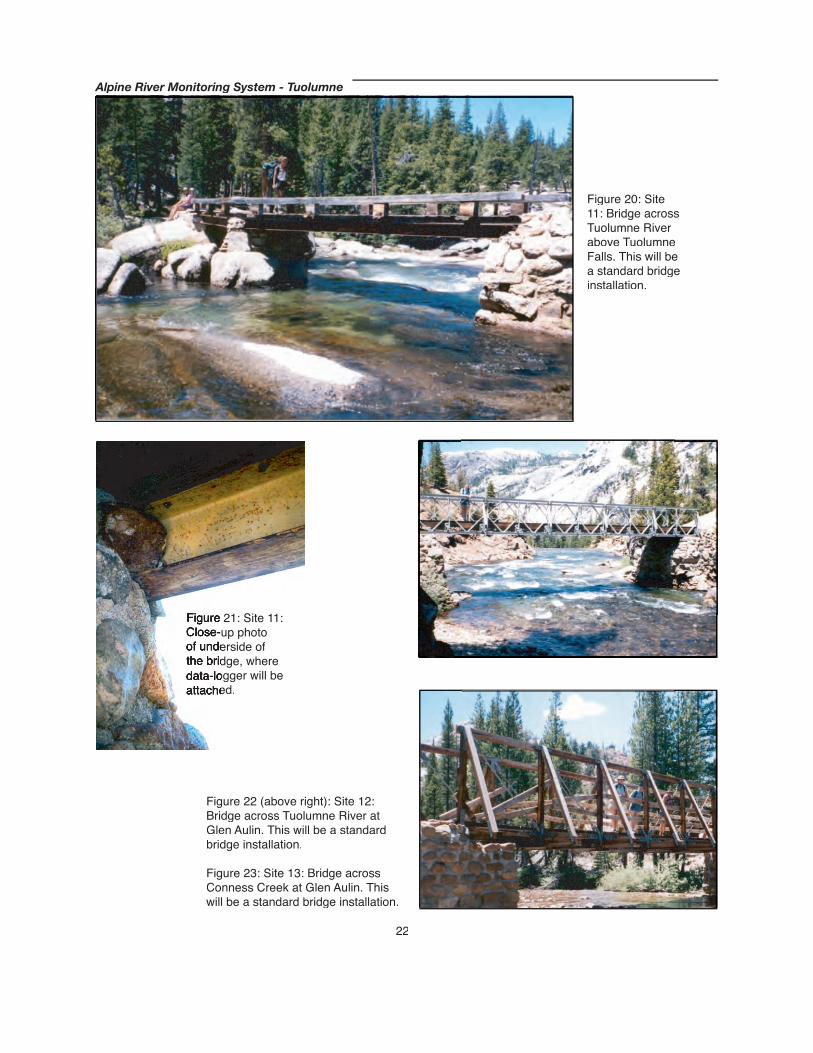
Figure 22 (above right): Site 12: Bridge across Tuolumne River at Glen Aulin. This will be a standard bridge installation.
Figure 23: Site 13: Bridge across Conness Creek at Glen Aulin. This will be a standard bridge installation.
Figure 20: Site 11: Bridge across Tuolumne River above Tuolumne Falls. This will be a standard bridge installation.
Alpine River Monitoring System - Tuolumne
22
Figure 21: Site 11: Figure 21: Site 11: Close-up photo Close-up photo of underside of of underside of the bridge, where the bridge, where data-logger will be data-logger will be attached.attached.
Spatial and Temporal Variability in Stream-Water Chemistry and Discharge in the Upper Merced River Basin
Lead Contacts:David Clow, Daniel Cayan, Jessica Lundquist
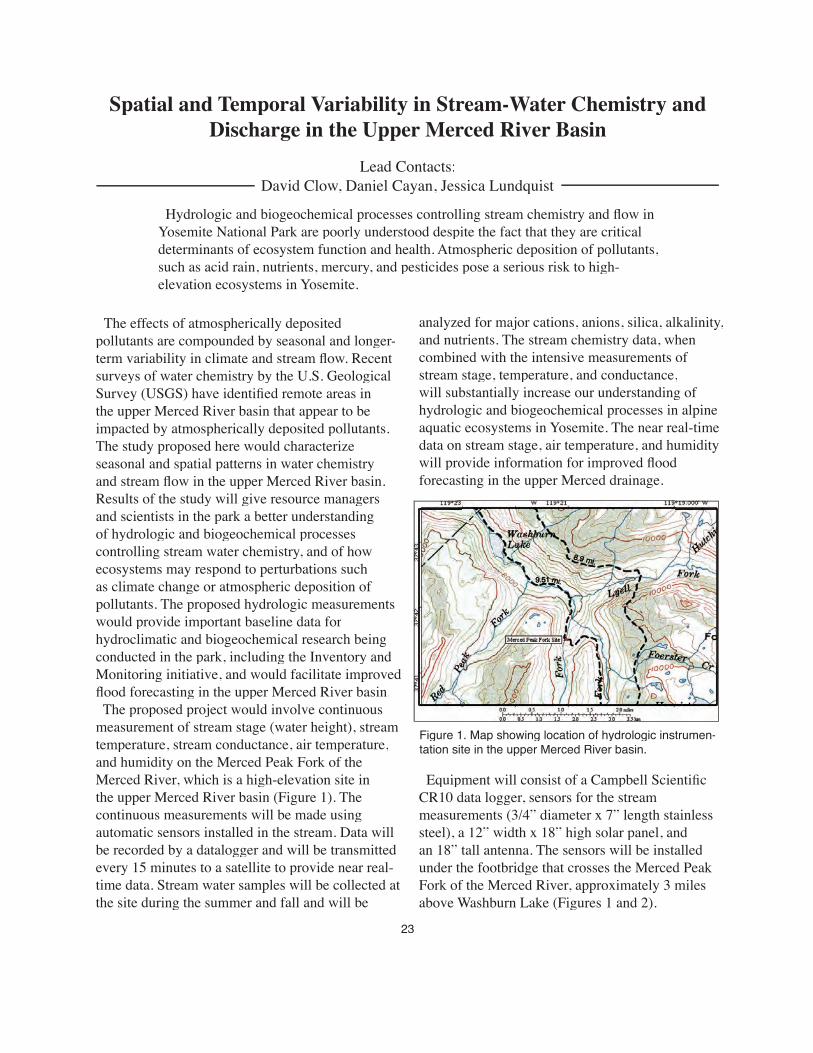
Hydrologic and biogeochemical processes controlling stream chemistry and fl ow in Yosemite National Park are poorly understood despite the fact that they are critical determinants of ecosystem function and health. Atmospheric deposition of pollutants, such as acid rain, nutrients, mercury, and pesticides pose a serious risk to high-elevation ecosystems in Yosemite.
Figure 1. Map showing location of hydrologic instrumen-tation site in the upper Merced River basin.
23
Equipment will consist of a Campbell Scientifi c CR10 data logger, sensors for the stream measurements (3/4” diameter x 7” length stainless steel), a 12” width x 18” high solar panel, and an 18” tall antenna. The sensors will be installed under the footbridge that crosses the Merced Peak Fork of the Merced River, approximately 3 miles above Washburn Lake (Figures 1 and 2).
analyzed for major cations, anions, silica, alkalinity, and nutrients. The stream chemistry data, when combined with the intensive measurements of stream stage, temperature, and conductance, will substantially increase our understanding of hydrologic and biogeochemical processes in alpine aquatic ecosystems in Yosemite. The near real-time data on stream stage, air temperature, and humidity will provide information for improved fl ood forecasting in the upper Merced drainage.
The effects of atmospherically deposited pollutants are compounded by seasonal and longer-term variability in climate and stream fl ow. Recent surveys of water chemistry by the U.S. Geological Survey (USGS) have identifi ed remote areas in the upper Merced River basin that appear to be impacted by atmospherically deposited pollutants. The study proposed here would characterize seasonal and spatial patterns in water chemistry and stream fl ow in the upper Merced River basin. Results of the study will give resource managers and scientists in the park a better understanding of hydrologic and biogeochemical processes controlling stream water chemistry, and of how ecosystems may respond to perturbations such as climate change or atmospheric deposition of pollutants. The proposed hydrologic measurements would provide important baseline data for hydroclimatic and biogeochemical research being conducted in the park, including the Inventory and Monitoring initiative, and would facilitate improved fl ood forecasting in the upper Merced River basin. The proposed project would involve continuous measurement of stream stage (water height), stream temperature, stream conductance, air temperature, and humidity on the Merced Peak Fork of the Merced River, which is a high-elevation site in the upper Merced River basin (Figure 1). The continuous measurements will be made using automatic sensors installed in the stream. Data will be recorded by a datalogger and will be transmitted every 15 minutes to a satellite to provide near real-time data. Stream water samples will be collected at the site during the summer and fall and will be

Figure 3. Photo showing CR10 data logger system. The data logger is housed in a 12” length x 16” height x 8” width white fi berglass enclosure.
Figure 2. Merced Peak Fork, at bridge above confl uence with Triple Peak Fork, site of Campbell Scientifi c stream recorder and other instruments, including telemetry (telemetry to be located in tree at river right, downstream, away from trail and hidden from sight of trail).
Spatial and Temporal Variability
24
Stream sensors will be attached to a 18” length x 8” width x 4” height concrete block that will be placed on the streambed and covered with rocks. Low-voltage cables, housed in 3/4” diameter metal conduit, will connect the sensors to a data logger. The cables will be covered with duff and will run through an area with dense undergrowth to conceal them. The data logger will be housed in a 12” length x 16” height x 8” wide white fi berglass enclosure (Figure 3). The solar panel, antennae, and data logger housing will be mounted on a 2” diameter x 36” long pipe attached vertically to a tree using webbing straps (Figure 3). A primary consideration for placement of the solar panel, antennae, and data logger will be to minimize visual impacts, which will be done by putting the instruments in a group of trees away from trails. All of the equipment would be installed by a two person crew from the USGS during fall, 2001. Travel will be by foot. Installation may require operation of a battery-powered drill for short periods. No utility connections will be required. All of the hydrologic equipment is battery powered. USGS personnel, who will visit each site at least once per year, will maintain equipment. The attached map, photos, and diagrams illustrate site locations and methods of installation.

Yosemite National Park Water Chemistry:Observation, Analysis and Prediction
Lead Contacts:David Peterson, Richard Smith and Stephen Hager
Map 1. Valley fl oor Water Chemistry observation sites.
Figure 1. Stylized version of a typical in situ Conductivity – Temperature – Pres-sure installation.
25
�������� �������� ���� ���� � ������� �� �����
���������� ������� ��� ����������
�������������� ���
������ �����
This project will provide such data in near real-time for managers, educators, park visitors, and scien-tists. This project will provide a water chemical framework for interpreting natural and perceived or real human-caused variations in chemistry, both within and outside the Park on a permanent basis. within and outside the Park on a permanent basis.
Climate is the major source of variability in Yosemite National Parkʼs (YNP) stream and water chemistry. However, there is no water chemistry observation history compatible with hydroclimatic variables (ie., hourly/daily frequency).
This will be a step toward the identifi ed need for a watershed hydroclimate network (Map 1, including water quality). Work is underway to link variations in large-scale atmospheric circulation to variations in the Merced and Tuolumne River discharge and then the variations in discharge to variations in chem-istry. To do this, river and stream chemistry needs to be monitored at a sampling rate compatible with hydroclimate variables (i.e., hourly/daily). The protocols for a conservative chemical param-eter, specifi c conductivity, have been established. Procedures for monitoring a non-conservative property (nitrate plus nitrite) are in progress as well as the addition of dissolved silica. The atmosphere is considered the major high eleva-tion source of nitrogen; weathering rock and soil minerals are the major source of dissolved silica. The Water Chemistry Observation system has two confi gurations 1) Conductivity-Tempera-ture-Pressure (CTP) and 2) CTP plus Chemical Analyzer.

Photo 2: Pool adjacent to foot bridge ~ 100 yards above the water tank. Illilouette Creek CTP
Photo 1: Tenaya Creek CTP
YNP Water Chemistry: Observation, Analysis and Prediction
26
The CTP system Confi guration 1) is composed of a SeaBird microcat SB37 sensor-logger mounted on a concrete platform (Figure 1). The system is roughly 30” long by 10” wide by 10” high (photo 1). The unit is placed on a stream bed with at least 1 foot water depth and tethered to shore using a 3/16” stainless steal cable. With judicious place-ment at or near bridge abutments in the shadow of the bridge, even in the clear waters of YNP, the unit is nearly invisible. To allow access to the data stored by the instrument without removing it from the stream a 3/8” black cable extends to the shore and is terminated in a gray water proof lock box. The cable and box are camoufl aged using local boulders and/or mounted on the bridge superstruc-ture to minimize visual impact.
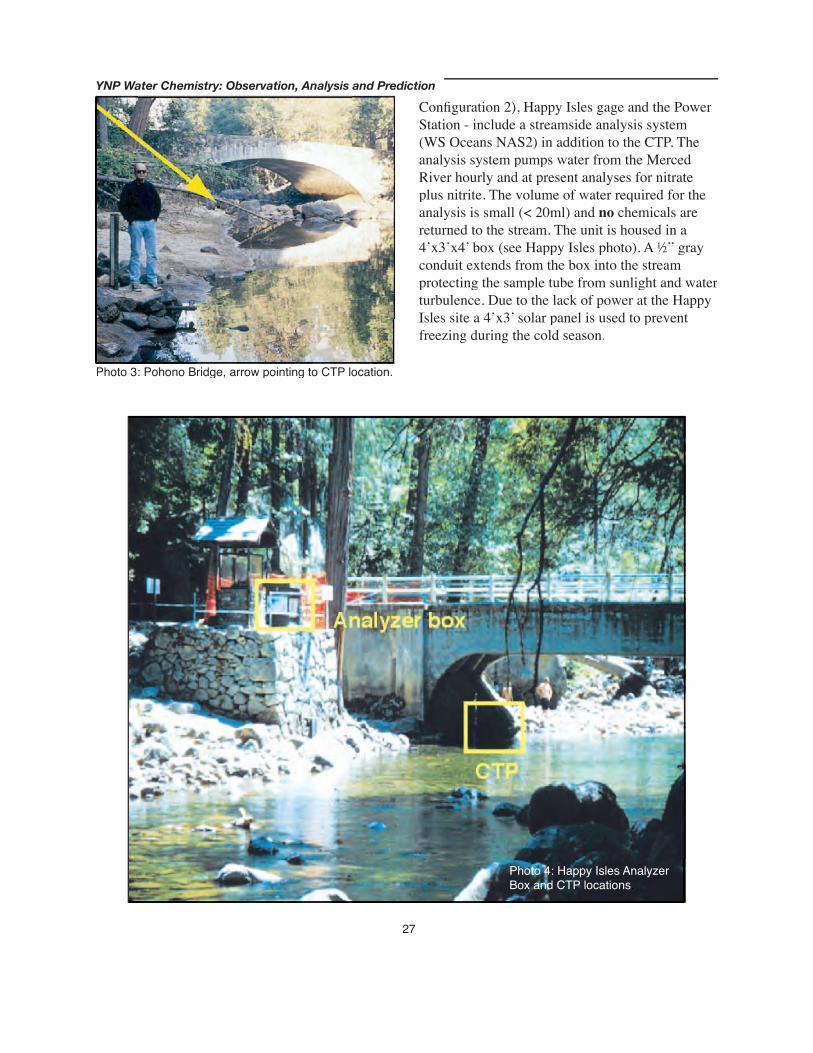
Photo 4: Happy Isles Analyzer Box and CTP locations.
Photo 3: Pohono Bridge, arrow pointing to CTP location.
YNP Water Chemistry: Observation, Analysis and Prediction
27
Confi guration 2), Happy Isles gage and the Power Station - include a streamside analysis system (WS Oceans NAS2) in addition to the CTP. The analysis system pumps water from the Merced River hourly and at present analyses for nitrate plus nitrite. The volume of water required for the analysis is small (< 20ml) and no chemicals are returned to the stream. The unit is housed in a 4ʼx3ʼx4 ̓box (see Happy Isles photo). A 1⁄2” gray conduit extends from the box into the stream protecting the sample tube from sunlight and water turbulence. Due to the lack of power at the Happy Isles site a 4ʼx3 ̓solar panel is used to prevent freezing during the cold season.
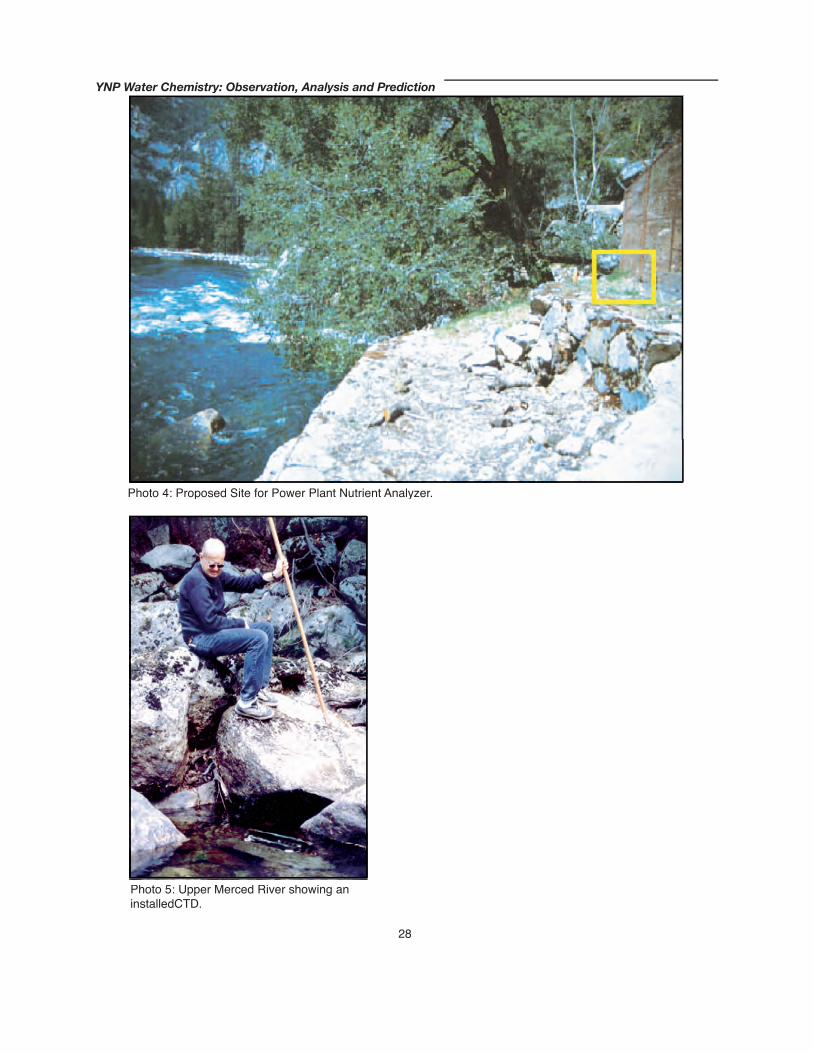
Photo 5: Upper Merced River showing an installedCTD.
Photo 4: Proposed Site for Power Plant Nutrient Analyzer.
YNP Water Chemistry: Observation, Analysis and Prediction
28

Yosemite National Park Water Chemistry:Observation, Analysis and PredictionTuolumne River above Hetch Hetchy
Lead Contacts: David Peterson, Richard Smith and Stephen Hager
The ʻWater Chemistry Observation ̓system has two confi gurations 1) Conductivity-Temperature-Pressure (CTP) and 2) CTP plus Chemical Analyzer. The CTP system is composed of a SeaBird microcat SB37 sensor-logger mounted on a concrete platform (Figure 1).
Map 1: Hetch Hetchy head waters site.
Figure 1: Stylized version of a typical In situ Conductivity - Temperature - Pressure instillation.
29
�������� �������� ���� ���� � ������� �� �����
���������� ������� ��� ����������
�������������� ���
������ �����
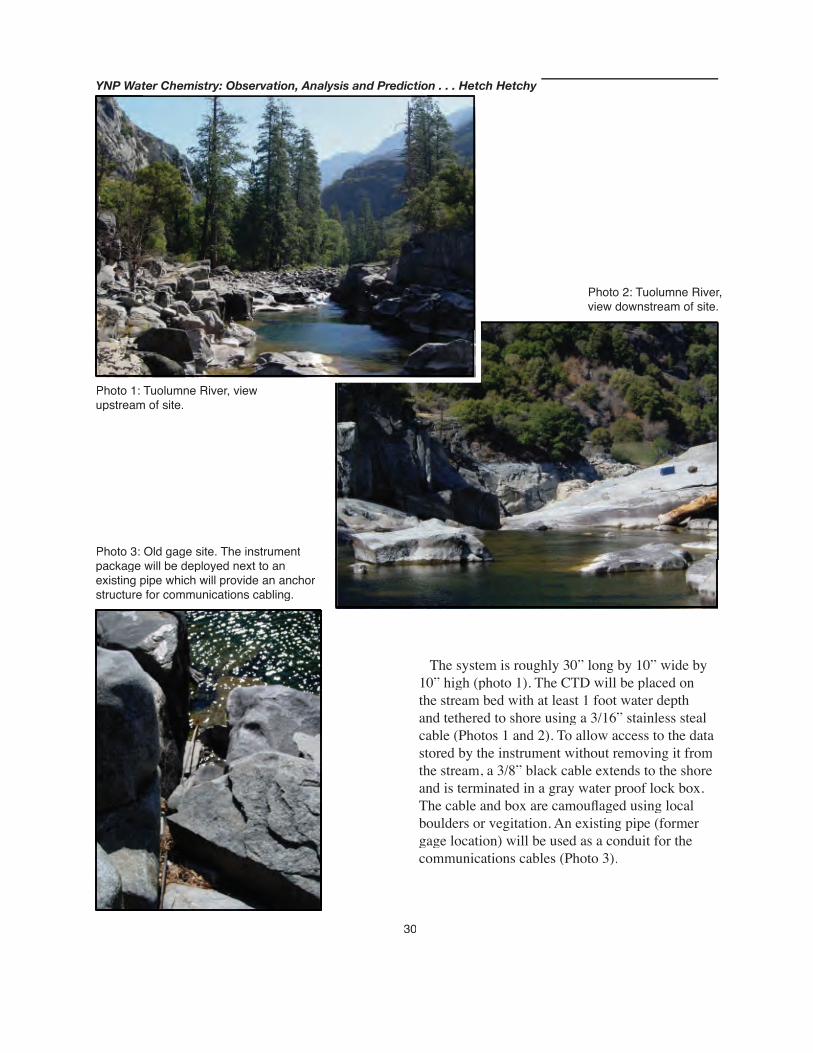
Photo 3: Old gage site. The instrument package will be deployed next to an existing pipe which will provide an anchor structure for communications cabling.
Photo 2: Tuolumne River, view downstream of site.
YNP Water Chemistry: Observation, Analysis and Prediction . . . Hetch Hetchy
30
Photo 1: Tuolumne River, view upstream of site.
The system is roughly 30” long by 10” wide by 10” high (photo 1). The CTD will be placed on the stream bed with at least 1 foot water depth and tethered to shore using a 3/16” stainless steal cable (Photos 1 and 2). To allow access to the data stored by the instrument without removing it from the stream, a 3/8” black cable extends to the shore and is terminated in a gray water proof lock box. The cable and box are camoufl aged using local boulders or vegitation. An existing pipe (former gage location) will be used as a conduit for the communications cables (Photo 3).
Mark ButlerYosemite National ParkResource Management DivisionP.O. Box 700El Portal, CA 95318Tel: 209 379-3260 Fax: 209 372-0449
Daniel CayanClimate Research Division - USGSScripps Institution of OceanographyLa Jolla, CA 92093-0224Tel: 858 534-5407Fax: 858 534-8561
David W ClowUSGSBox 25046, ms 415Denver Federal CenterDenver, CO 80225-0046Tel: 303 236-4882 x294Fax: 303 236-4912
Michael DettingerClimate Research Division - USGSScripps Institution of OceanographyLa Jolla, CA 92093-0224Tel: 858 822-1507Fax: 858 534-8561
Jeanne DiLeoUSGS345 Middlefi eld Road, ms 496Menlo Park, CA [email protected]: 650 329-4431Fax: 650 329-4327
Frank GehrkeCalifornia Cooperative Snow SurveysP.O. Box 219000Sacramento, CA 95821-9000Tel: 916 574-2635Fax: 916 574-2767
Stephen HagerUSGS345 Middlefi eld Road, ms 496Menlo Park, CA [email protected]: 650 329-4587Fax: 650 329-4327
List of Contributors / ParticipantsJessica LundquistScripps Institution of OceanographyUniversity of California, San Diego9500 Gilman DriveLa Jolla, CA 92093-0213Tel: 858 534-1504Fax: 858 534-8561
Greg McCurdyWestern Regional Climate Center Desert Research Institute 2215 Raggio Parkway Reno, Nevada 89512-1095 [email protected]: 775-674-7165Fax: 775-674-7016
David PetersonUSGS345 Middlefi eld Road, ms 496Menlo Park, CA 94025-3591Tel: 650 329-4525Fax: 650 329-4327
Kelly RedmondWestern Regional Climate Center Desert Research Institute 2215 Raggio Parkway Reno, Nevada 89512-1095 Tel: 775-674-7011Fax: 775-674-7016
Larry RiddleClimate Research DivisionScripps Institution of OceanographyLa Jolla, CA [email protected]: 858 534-1869Fax: 858 534-8561
Richard SmithUSGS345 Middlefi eld Road, ms 496Menlo Park, CA 94025-3591Tel: 650 329-4516Fax: 650 329-4327
Jan Van WagtendonkUSGS – Yosemite Field Station El Portal, CA 95318Tel: 209 379-1306Fax: 209 379-1116
31

32
Mark [email protected] 379-3260
Daniel [email protected]/USGS858 534-4507
David [email protected] 236-4912 x294
Michael [email protected] 858 448-1779
Jeanne [email protected] 329-4431
Frank [email protected] 574-2635
Brian [email protected] 379-3266
Jessica [email protected] 534-1504
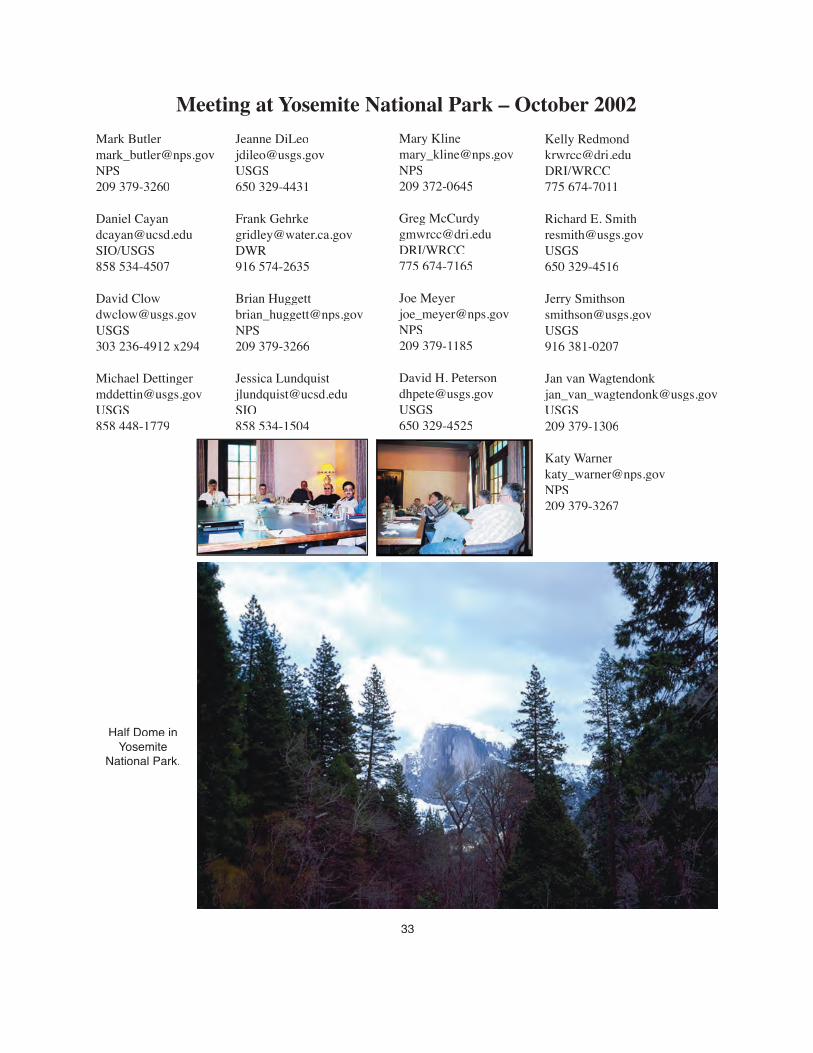
Meeting at Yosemite National Park – October 2002
33
Mary [email protected] 372-0645
Greg [email protected]/WRCC 775 674-7165
Joe [email protected] 379-1185
David H. [email protected] 650 329-4525
Kelly [email protected]/WRCC775 674-7011
Richard E. [email protected] 650 329-4516
Jerry [email protected] 916 381-0207
Jan van [email protected] 209 379-1306
Katy [email protected] 379-3267
Half Dome inYosemite
National Park.

Rich Smith, Greg McCurdy, Mark Butler, David Peterson, Jessica Lundquist, Dan Cayan, Jan Van Wagtendonk, Dave Clow, Frank Gehrke, Kelly Redmond, Mike Dettinger, Joe Meyer, Katy Warner and Brian Huggett.
34