sixth five year plan - globalpartnership.org
TRANSCRIPT

SIXTH FIVE YEAR PLAN FY2011-FY2015
Accelerating Growth and Reducing Poverty
Part 3
Statistical Annex and Technical Framework
General Economics Division
Planning Commission Ministry of Planning
Government of the People’s Republic of Bangladesh

ii
Cover Designed by
General Economics Division (GED),
Planning Commission
Government of the People’s Republic of Bangladesh

iii
Table of Contents Page
Contents…………………………………………………………………………………………………iii
Part 1: Statistical Annex .......................................................................................... 1
A. Macro and Fiscal Block ...................................................................................... 1
1. National Accounts ............................................................................................................. 1
Table 1: GDP at Constant Prices (1972/73 -78/79), 1985-86=100 ......................................... 1
Table 2: GDP at Constant Prices (1979/80-85/86), 1995-96=100 .......................................... 2
Table 3: GDP at Constant Prices (1986/87-92/93), 1995-96=100 .......................................... 3
Table 4: GDP at Constant Prices (1993/94-99/00), 1995-96=100 .......................................... 4
Table 5: GDP at Constant Prices (2000/01-04/05), 1995-96=100 .......................................... 5
Table 6: GDP at constant prices (2005/06-2009/10), 1995-96=100 ....................................... 6
Table 7: GDP at current market prices (1972/73-78/79) ......................................................... 7
Table 8: GDP at current market prices (1979/80-85/86) ......................................................... 8
Table 9: GDP at current market prices (1986/87-1992/93) ..................................................... 9
Table 10: GDP at current market prices (1993/94-99/00) ..................................................... 10
Table 11: GDP at current market prices (2000/01-2004/05) ................................................. 11
Table 12: GDP at current market prices (2005/06-2009/10) ................................................. 12
Table 13: Sectoral Share of GDP (%) at current market prices (1979/80-1984/85) ........ 13
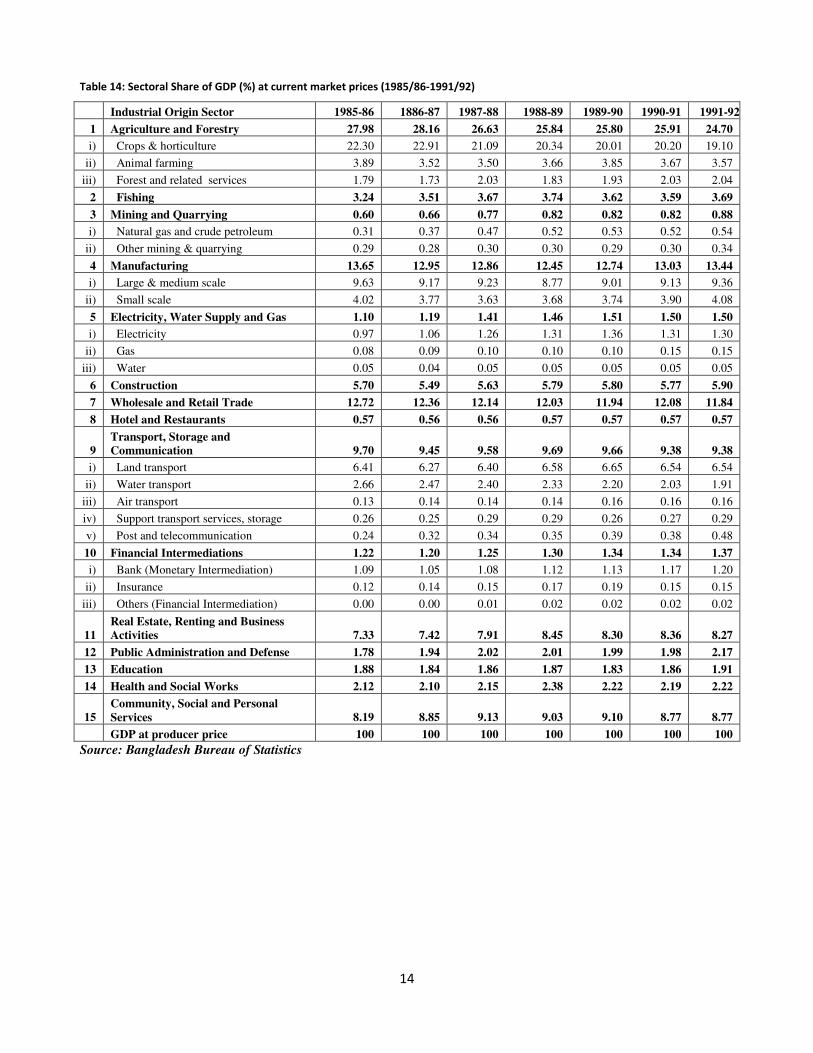
Table 14: Sectoral Share of GDP (%) at current market prices (1985/86-1991/92) ............. 14
Table 15: Sectoral Share of GDP (%) at current market prices (1992/93-1998/99) ............. 15
Table 16: Sectoral Share of GDP (%) at current market prices (1999/00-2004/05) ............. 16
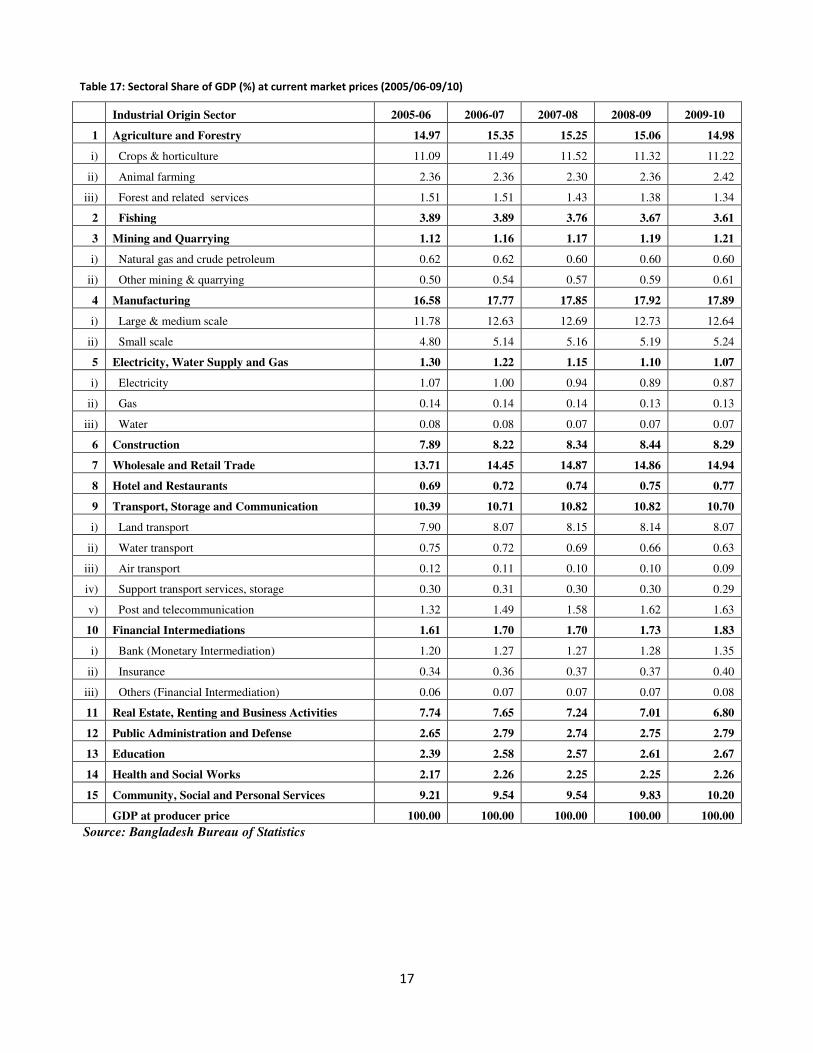
Table 17: Sectoral Share of GDP (%) at current market prices (2005/06-09/10) ................. 17
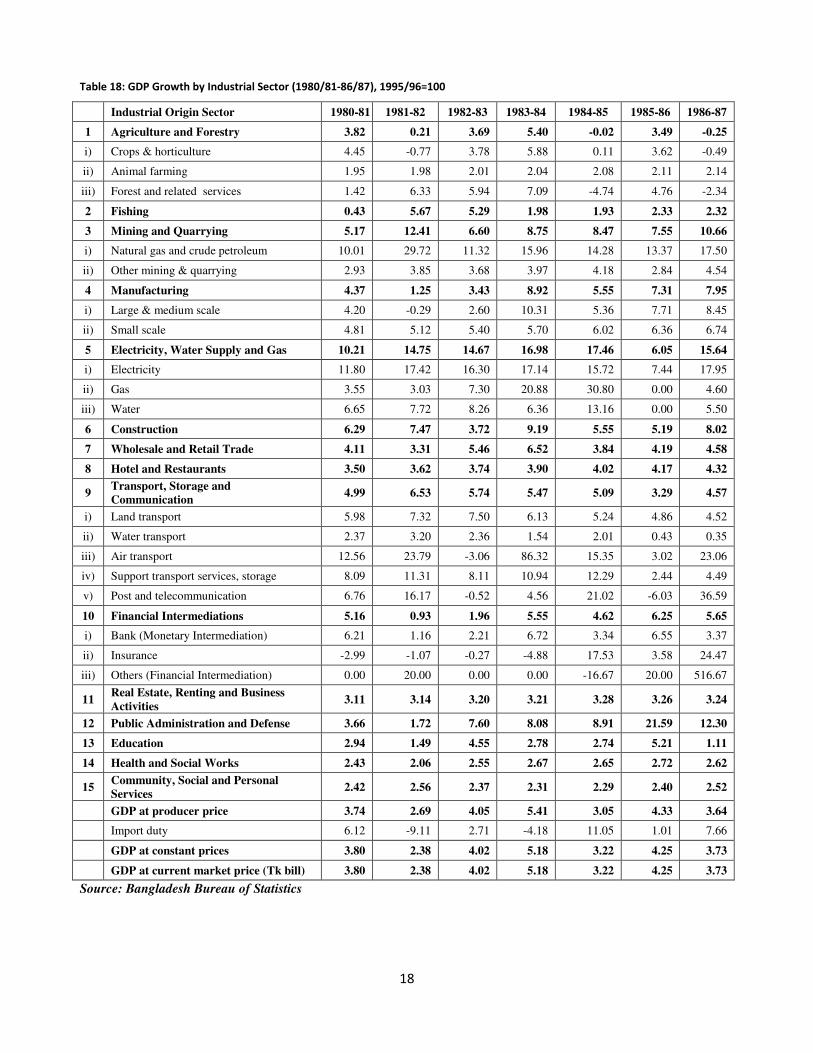
Table 18: GDP Growth by Industrial Sector (1980/81-86/87), 1995/96=100 ....................... 18
Table 19: GDP Growth by Industrial Sector (1987/88-1993/94), 1995/96=100 ................... 19
Table 20: GDP Growth by Industrial Sector (1994/95-99/00), 1995/96=100 ....................... 20
Table 21: GDP Growth by Industrial Sector (2000/01-2005/06), 1995/96=100 ................... 21
Table 22: GDP Growth by Industrial Sector (2006/07-09/10), 1995/96=100 ....................... 22
Table 23: GDP by Expenditure Categories at current market price (FY 1990-FY 95) ......... 23
Table 24: GDP by Expenditure Categories at current market price (FY 1996-FY 00) ......... 23
Table 25: GDP by Expenditure Categories at current market price (FY 01-FY 05) ............. 24
Table 26: GDP by Expenditure Categories at current market price (FY 2006-FY 2010) ..... 24

iv
2. Revenue .......................................................................................................................... 25
Table 27: Fiscal Components as % of GDP (FY73-FY87) ................................................... 25
Table 28: Table: Fiscal Components as % of GDP (FY88-FY03) ........................................ 26
Table 29: Fiscal Components as % of GDP (FY04-FY10) ................................................... 27
Table 30: Revenue Components as % of GDP (FY73-FY90)............................................... 28
Table 31: Revenue Components as % of GDP (FY91-FY02)............................................... 29
Table 32: Revenue Components as % of GDP (FY03-FY09)............................................... 30
3. Expenditure ..................................................................................................................... 31
Table 33: Expenditure Components as Percent of GDP (FY73-FY85) ................................ 31
Table 34: Expenditure Components as Percent of GDP (FY86-FY98) ................................ 32
Table 35: Expenditure Components as Percent of GDP (FY99-FY09) ................................ 33
Table 36: Expenditure Components ...................................................................................... 34
4. Debt ................................................................................................................................ 36
Table 37: Debt Components as % of GDP (FY73-FY86) ..................................................... 36
Table 38: Debt Components as % of GDP (FY87-FY98) ..................................................... 36
Table 39: Debt Components as % of GDP (FY99-FY09) ..................................................... 37
5. Money and Prices ............................................................................................................ 38
Table 40: Monetary Development ......................................................................................... 38
Table 41: Monetary Development ......................................................................................... 39
Table 42: Domestic Credit Development .............................................................................. 40
Table 43: Credit Development .............................................................................................. 41
Table 44: Interest Rates ......................................................................................................... 42
Table 45: Average Exchange Rate ........................................................................................ 43
Table 46: Yearly Average Consumer Price Index (CPI) ....................................................... 44
Table 47: Nominal Wage Rate Indices .................................................................................. 45
Table 48: Nominal Price of Rice ........................................................................................... 46
6. Balance of Payments ....................................................................................................... 47
Table 49: Balance of Payments of Bangladesh ..................................................................... 47
B. Poverty and Social Safety Net Block ...............................................................48
1. Poverty ............................................................................................................................ 48
Table 50: Incidence of poverty ............................................................................................. 48
Table 50-incidence of poverty (contd.) ................................................................................. 48
Table 51: Percentile Distribution of Income and Gini Coefficient ....................................... 49
Table 52: Dimensions of poverty by CBN method across regions (in percent) .................... 50
v
Table 53: Gini index of per capita expenditure ..................................................................... 50
2. Social safety net tables .................................................................................................... 51
Table 54: Targeted Agricultural and Specialized Credit Program through Public Sector
Banks and Cooperatives ........................................................................................................ 51
Table 55: Trend in Number of Employment Abroad and Amount of Remittances .............. 51
Table 56: Bangladesh Micro Finance- Operational Outreach ............................................... 51
Table 57: Financial outreach of the MFIs, 2003-08 .............................................................. 52
Table 58: Social Protection Programs in Bangladesh, 2009/10 ............................................ 52
Table 59: Serious Floods and Damages in the Last 25 Years ............................................... 52
C. Human Development ........................................................................................53
1. Education ........................................................................................................................ 53
Table 60: Population Size and Growth Rates, 1951- 2001.................................................... 53
Table 61: Age Sex Composition of Population by Age Group, 2001 ................................... 53
Table 62: Population Projection of Bangladesh (2006-2051) ............................................... 53
Table 63: Population Projection of Bangladesh by 5 year Age Group 2006-2021 (Million) 54
Table 64: Projected Pre-primary Age- (4-5) Population 2005-2020 ..................................... 54
Table 65: Projection Primary Age Population (6-10) of Bangladesh for 2006-2020 ............ 54
Table 66: Projected 11-13 year age group population for 2005-2020 ................................... 54
Table 67: Projection 14-15 years age group and 11-15 year age group population for 2006-
2020 ....................................................................................................................................... 55
Table 68: Projection Population for the 16- 17 years age group for 2006-2020 ................... 55
Table 69: Projected 18-21 and 22-24 Age Group Population for 2006-2020 ....................... 55
Table 70: Time series data of Pre Primary Students (2001-2008) ........................................ 55
Table 71: continued ............................................................................................................... 56
Table 72: Projection of Pre-Primary Education Enrolment, 2010, 2015, 2020 ..................... 56
Table 73: Primary Education Statistics of Schools, Teachers, Student by Type of School and
Gender: 2008. ........................................................................................................................ 57
Table 74: Continued .............................................................................................................. 57
Table 75: Class 1-5, Enrolment of Students in Absolute Numbers ....................................... 58
Table 76: Projection of Primary School Enrolment for 2008, 2010, 2015, 2020 (in million)
............................................................................................................................................... 58
Table 77: Number of Students in Post Primary Education (1990-2008) ............................... 59
Table 78: Continued .............................................................................................................. 59
Table 79: Projected GER in Junior Secondary Education (in percent). ................................ 60
Table 80: Projection of Enrolment in Junior Education, 2010-2020, (in lacs). ..................... 60

vi
Table 81: Projected GER for 2008 to 2020 for the Age Group 14-15 yrs ............................ 60
Table 82: Projected Secondary Enrolment for 2008-2020, (in million) ................................ 60
Table 83: Projected Higher Secondary Enrolment for 2008 - 2020 (in million) ................... 60
Table 84: Number of Secondary Educational Institutions in General Stream by Year and
Level of Education ................................................................................................................. 61
Table 85: Number of Secondary Educational Institutions in Madrasa Stream by Year and
Level of Education ................................................................................................................. 61
Table 86: Number of Secondary Students in General ........................................................... 62
Table 87: Number of Secondary Students in Madrasa Stream by Year and Level of
Education ............................................................................................................................... 62
Table 88: Pass Rates in the SSC/Dakhil Examination by Year ............................................. 63
Table 89: Pass Rates in HSC/Alim Examinations by Year ................................................... 63
Table 90: Number of Institutions and Teachers by Management and type of Secondary
Educational Institution ........................................................................................................... 64
Table 91: Government Expenditure on Secondary Education as % of GNI ......................... 64
Table 92: Average Private Expenditure for Secondary Education ........................................ 64
2. Health Indicators ............................................................................................................. 65
Table 93: Percentage Population by Sex and Age Group (1974-2001) ................................ 65
Table 94: Human Development Indicators (1981-2008) ....................................................... 66
3. Human Resource Development ........................................................................................ 68
Table 95: Training capacities in Public and Accredited Private Institutions, 1998 and 2005 68
Table 96: Capacity Utilization in the VET System ............................................................... 69
Table 97: Status of VET Students after Graduation .............................................................. 69
D. Regional Disparity Block ..................................................................................70 Table 98: Population Growth in Greater Districts, 1974 to 1991 .......................................... 70
Table 99: District-wise Population Density in 2001 and Total Fertility Rate (TFR) in Rural
Areas, 2001 to 2007 ............................................................................................................... 71
Table 100: Land Utilization Statistics of Bangladesh, 1984-85 to 2005-06 ......................... 73
Table 101: Intensity of Cropping Statistics of Bangladesh, by Former Districts, 1999-00 to
2004-05 .................................................................................................................................. 74
Table 102: Percent of High Yielding Variety (HYV) in Cropped Area by Former Districts,
2001-02 to 2005-06 ............................................................................................................... 75
Table 103: Percentages of Non-firm and Farm Households by Land Ownership by District,
2005-06 .................................................................................................................................. 77
Table 104: Literacy Rate for Persons aged 7 years and above by District, 1991 and 2001 .. 79
Table 105: Road Density by District, 2000 to 2005 (in meter per square k.m.) ................... 81

vii
Table 106: 14 Maximum Demand for Electricity ................................................................. 83
Table 107: Growth Rate of Male Agricultural Day Laborer’s Nominal Daily Wage by
Region, ................................................................................................................................... 83
Table 108: Growth of Regional Farm and Non-Farm Per Capita Incomes by District and
Division, ................................................................................................................................ 84
Table 109: Allocation of Public Expenditure (Development) -- Recent Trends ................... 86
Table 110: Allocation of Public Expenditure (Non-Development) -- Recent Trends ........... 88
Table 111: Acreage and Production of Rice in Greater Districts (1990-91 to 2005-06)....... 90
Table 112: District and Division-wise Share of Manufacturing in Regional GDP, .............. 91
Table 113: Economically Active Population (15+) (in '000) and Labour Force Participation
Rates, 2005-06 ....................................................................................................................... 93
Table 114: Unemployment Rate (15 years and above) by Division and District, 2005-06 .. 95
Table 115: Some Indicators for Eastern and Western Region............................................... 97
Table 116: Distribution of Households Receiving Benefits of Social Safety Net
Programmes, 2005 ................................................................................................................. 97
Table 117: Reductions in Central Government Transfers (Government grants to
Pourashavas, 1996-2002)....................................................................................................... 97
Part 2: Technical Framework ...............................................................................98
Macroeconomic Scenario for the Sixth Five Year Plan (2011-2015) ................98
Results from the Dynamic CGE Model of Bangladesh ....................................135

1
Part 1: Statistical Annex
A. Macro and Fiscal Block
Table 1: GDP at Constant Prices (1972/73 -78/79), 1985-86=100 (Million
Taka)
Source: Bangladesh Bureau of Statistics
1. National Accounts
Industrial Origin Sector 1972-73 1973-74 1974-75 1975-76 1976-77 1977-78 1978-79
1 Agriculture and Forestry 117837 126267 119818 131079 125777 136536 139248
i) Crops & horticulture 99326 108345 102332 113196 108084 116706 117982
ii) Animal farming 10088 10257 10422 10596 10771 11253 11506
iii) Forest and related services 8423 7665 7064 7287 6922 8577 9760
2 Fishing 13799 13844 13899 13854 13854 14034 10321
3 Mining and Quarrying 4 4 3 4 13 14 17
i) Natural gas and crude petroleum ---- ---- ---- ---- ---- ---- ----
ii) Other mining & quarrying ---- ---- ---- ---- ---- ---- ----
4 Manufacturing 23817 33960 30252 30043 33546 33941 37739
i) Large & medium scale 7263 17239 13385 12989 16327 16525 20156
ii) Small scale 16554 16721 16867 17054 17219 17416 17583
5 Electricity, Water Supply and Gas 580 464 353 474 530 852 863
i) Electricity ---- ---- ---- ---- ---- ---- ----
ii) Gas ---- ---- ---- ---- ---- ---- ----
iii) Water ---- ---- ---- ---- ---- ---- ----
6 Construction 12052 9536 7820 7313 10232 11541 17531
7 Wholesale and Retail Trade 19450 24802 24048 24294 23771 29375 30970
8 Hotel and Restaurants
9 Transport, Storage and Communication 27702 29027 29764 31203 33697 35042 36499
i) Land transport ---- ---- ---- ---- ---- ---- ----
ii) Water transport ---- ---- ---- ---- ---- ---- ----
iii) Air transport ---- ---- ---- ---- ---- ---- ----
iv) Support transport services, storage ---- ---- ---- ---- ---- ---- ----
v) Post and telecommunication ---- ---- ---- ---- ---- ---- ----
10 Financial Intermediations 2395 2472 2620 2549 2850 3168 4120
i) Bank (Monetary Intermediation) ---- ---- ---- ---- ---- ---- ----
ii) Insurance ---- ---- ---- ---- ---- ---- ----
iii) Others (Financial Intermediation) ---- ---- ---- ---- ---- ---- ----
11 Real Estate, Renting and Business Activities 22596 23255 23906 24682 25402 26181 26971
12 Public Administration and Defense 5810 6987 5345 7171 9793 8965 9603
13 Education ---- ---- ---- ---- ---- ---- ----
14 Health and Social Works ---- ---- ---- ---- ---- ---- ----
15 Community, Social and Personal Services 18513 19313 20196 21155 22210 23360 24643
GDP at producer price
Growth rate
Import duty
GDP at constant (1995/96) prices 264555 289931 278024 293821 301675 323009 338525

2
Table 2: GDP at Constant Prices (1979/80-85/86), 1995-96=100
(Million Taka)
Industrial Origin Sector 1979-80 1980-81 1981-82 1982-83 1983-84 1984-85 1985-86
1 Agriculture and Forestry 244389 253716 254260 263647 277896 277831 287518
i) Crops & horticulture 186659 194966 193468 200789 212605 212847 220548
ii) Animal farming 37795 38532 39295 40085 40903 41752 42632
iii) Forest and related services 19935 20218 21497 22773 24388 23232 24338
2 Fishing 43295 43481 45948 48377 49333 50284 51454
3 Mining and Quarrying 4986 5244 5895 6284 6834 7413 7973
i) Natural gas and crude petroleum 1578 1736 2252 2507 2907 3322 3766
ii) Other mining & quarrying 3408 3508 3643 3777 3927 4091 4207
4 Manufacturing 96311 100523 101783 105272 114664 121030 129882
i) Large & medium scale 69015 71914 71708 73572 81157 85507 92100
ii) Small scale 27296 28609 30075 31700 33507 35523 37782
5 Electricity, Water Supply and Gas 4828 5321 6106 7002 8191 9621 10203
i) Electricity 3780 4226 4962 5771 6760 7823 8405
ii) Gas 732 758 781 838 1013 1325 1325
iii) Water 316 337 363 393 418 473 473
6 Construction 41839 44471 47795 49571 54125 57129 60095
7 Wholesale and Retail Trade 97745 101763 105135 110880 118105 122635 127771
8 Hotel and Restaurants 4883 5054 5237 5433 5645 5872 6117
9
Transport, Storage and
Communication 73815 77499 82556 87297 92068 96756 99939
i) Land transport 47394 50228 53905 57947 61501 64722 67865
ii) Water transport 22408 22939 23674 24233 24606 25100 25208
iii) Air transport 422 475 588 570 1062 1225 1262
iv) Support transport services, storage 1743 1884 2097 2267 2515 2824 2893
v) Post and telecommunication 1848 1973 2292 2280 2384 2885 2711
10 Financial Intermediations 13535 14233 14366 14647 15460 16175 17186
i) Bank (Monetary Intermediation) 11989 12733 12881 13166 14051 14521 15472
ii) Insurance 1541 1495 1479 1475 1403 1649 1708
iii) Others (Financial Intermediation) 5 5 6 6 6 5 6
11
Real Estate, Renting and Business
Activities 90551 93367 96296 99379 102567 105927 109379
12
Public Administration and
Defense 13437 13929 14169 15246 16478 17946 21820
13 Education 18945 19502 19792 20693 21269 21851 22989
14 Health and Social Works 22353 22896 23368 23963 24604 25255 25943
15
Community, Social and Personal
Services 95459 97769 100274 102651 105026 107431 110006
GDP at producer price 866371 898768 922980 960342 1012265 1043156 1088275
Growth rate 3.739391 2.69391 4.047975 5.40672 3.051671 4.32524
Import duty 23398 24830 22567 23179 22209 24662 24910
GDP at constant (1995/96) prices 889769 923598 945547 983521 1034474 1067818 1113185
GDP at const(1995/96) prices
(Tkbill) 889.769 923.598 945.547 983.521 1034.474 1067.818 1113.185 Source: Bangladesh Bureau of Statistics

3
Table 3: GDP at Constant Prices (1986/87-92/93), 1995-96=100
(Million Taka)
Industrial Origin Sector 1986-87 1987-88 1988-89 1989-90 1990-91 1991-92 1992-93
1 Agriculture and Forestry 286786 284277 283198 313630 317553 321970 326319
i) Crops & horticulture 219473 214670 212231 241184 243213 245907 248287
ii) Animal farming 43545 44494 45480 46505 47572 48683 49840
iii) Forest and related services 23768 25113 25487 25941 26768 27380 28192
2 Fishing 52646 53214 53425 54528 58831 63680 69088
3 Mining and Quarrying 8823 9754 10628 11380 11565 12330 13428
i) Natural gas and crude petroleum 4425 5155 5830 6398 6506 7143 8018
ii) Other mining & quarrying 4398 4599 4798 4982 5059 5187 5410
4 Manufacturing 140210 141118 145029 156163 166133 178391 193771
i) Large & medium scale 99882 100576 102657 111126 117817 126462 137846
ii) Small scale 40328 40542 42372 45037 48316 51929 55925
5 Electricity, Water Supply and Gas 11799 13709 14968 16605 17839 18971 20301
i) Electricity 9914 11759 12957 14498 15150 16010 17150
ii) Gas 1386 1434 1465 1508 2043 2220 2292
iii) Water 499 516 546 599 646 741 859
6 Construction 64914 68481 71497 74963 75407 79886 84671
7 Wholesale and Retail Trade 133617 138909 146552 151738.6 158914.5 167671.5 172834.8
8 Hotel and Restaurants 6381 6666 6975 7309 7672 8054 8455
9
Transport, Storage and
Communication 104505 107709 110978 116270 118133 122451 126169
i) Land transport 70931 73399 75940 79988 82916 85812 89164
ii) Water transport 25295 25525 25947 25964 25208 24849 24106
iii) Air transport 1553 1615 1782 2237 2109 2121 2372
iv) Support transport services, storage 3023 3549 3581 3532 3654 3978 4343
v) Post and telecommunication 3703 3621 3728 4549 4246 5691 6184
10 Financial Intermediations 18157 18692 19060 19431 20375 21147 21748
i) Bank (Monetary Intermediation) 15994 16223 16364 16374 17737 18545 19255
ii) Insurance 2126 2285 2452 2774 2325 2243 2095
iii) Others (Financial Intermediation) 37 184 244 283 313 359 398
11
Real Estate, Renting and Business
Activities 112928 116465 120133 123956.9 127966.8 132153.8 136613.4
12 Public Administration and Defense 24503 25509 25798 26231 26984 30445 34941
13 Education 23245 23520 23915 24016 25342 26901 28918.58
14 Health and Social Works 26623 27252 28130 29263 29896 31248 32911
15
Community, Social and Personal
Services 112777 115579 118597 121593.1 124866 128246.2 131736.2
GDP at producer price 1127914 1150854 1178883 1247078 1287477 1343546 1401905
Growth rate 3.64237 2.033843 2.435496 5.784681 3.239545 4.354898 4.343687
Import duty 26818 28812 31598 35322.7 37747.51 48459.23 53774.63
GDP at constant (1995/96) prices 1154732 1179666 1210481 1282400 1325225 1392005 1455680
GDP at const (1995/96) prices (Tk
bill) 1154.732 1179.666 1210.481 1282.4 1325.225 1392.005 1455.68
Source: Bangladesh Bureau of Statistics

4
Table 4: GDP at Constant Prices (1993/94-99/00), 1995-96=100 (Million Taka)
Industrial Origin Sector 1993-94 1994-95 1995-96 1996-97 1997-98 1998-99 1999-000
1 Agriculture and Forestry 324200 317932.3 324381.6 342457.8 348080 359368 384251
i) Crops & horticulture 244172 235821.3 239924.6 255375.8 258098 266136 287688
ii) Animal farming 51047 52307 53621 55003 56456 57975 59566
iii) Forest and related services 28981 29804 30836 32079 33526 35257 36997
2 Fishing 74551 79613 85500 91997 100257 110240 120019
3 Mining and Quarrying 14119 15482 16691 17286 18281 18522 20277
i) Natural gas and crude petroleum 8405 9235 9919 9821 10292 10039 11500
ii) Other mining & quarrying 5714 6247 6772 7465 7989 8483 8777
4 Manufacturing 209554 231517 246351 258795 280908 289882.1 303679
i) Large & medium scale 149220 166297 175732 182704 199668 208033.1 217086
ii) Small scale 60334 65220 70619 76091 81240 81849 86593
5 Electricity, Water Supply and Gas 21628 22772 24009 24473 24965 26463 28258
i) Electricity 18198 19139 20196 20596 20863 22271 23802
ii) Gas 2462 2645 2810 2849 3000 3019 3188
iii) Water 968 988 1003 1028 1102 1173 1268
6 Construction 92525 101372 109993 119500 130833 142503.3 154590
7 Wholesale and Retail Trade 182433.3 196947.9 206076.2 217373.8 230382.5 245377 263282
8 Hotel and Restaurants 8876 9318 9782 10269 10936.49 11663.76 12473
9
Transport, Storage and
Communication 131241 137739 144832 152798 161490 171019 181422
i) Land transport 92648 97402 102758 108352 115661 123321 131116
ii) Water transport 23664 23163 22825 22634 22426 22784 23189
iii) Air transport 2565 2349 2496 2229 2606 2982 3483
iv) Support transport services, storage 4395 5319 5850 5892 6090 6349 7183
v) Post and telecommunication 7969 9506 10903 13691 14707 15583 16451
10 Financial Intermediations 22838 24001 25171 26465 27859.97 29365.11 30980
i) Bank (Monetary Intermediation) 19978 20622 21022 21514 22265 23123 24018
ii) Insurance 2403 2844 3366 3813 4383 4955 5604
iii) Others (Financial Intermediation) 457 535 783 1138 1211.97 1287.112 1358
11
Real Estate, Renting and Business
Activities 141159.1 146065.2 151035.9 156384.9 162327.5 168528.4 174990
12 Public Administration and Defense 36911 38561 40165 42375 44874 47432 50262
13 Education 30831 32214 33042 34618.1 37422.17 40303.68 43424
14 Health and Social Works 34436 35431.2 36387.84 37806.97 39542.31 41361.25 43346
15
Community, Social and Personal
Services 135345.2 139073 142942.9 146929.4 151116.8 155575 160332
GDP at producer price 1460648 1528039 1596360 1679529 1769276 1857604 1971585
Growth rate 4.190199 4.613774 4.471213 5.209879 5.343576 4.992316 6.135935
Import duty 54491.94 61723.86 66880 73318.41 75202.26 76687.38 77689
GDP at constant (1995/96) prices 1515140 1589762 1663240 1752847 1844478 1934291 2049274
GDP at const.(1995/96) prices (Tk bill) 1515.14 1589.762 1663.24 1752.847 1844.478 1934.291 2049.274
Source: Bangladesh Bureau of Statistics

5
Table 5: GDP at Constant Prices (2000/01-04/05), 1995-96=100 (Million Taka)
Source: Bangladesh Bureau of Statistics
Industrial Origin Sector 2000-01 2001-02 2002-03 2003-04 2004-05
1 Agriculture and Forestry 405514 403001 416273 434495 442298
i) Crops & horticulture 305481 298187 306765 319875 320339
ii) Animal farming 61241 64119 67011 70348 75434
iii) Forest and related services 38792 40695 42497 44272 46525
2 Fishing 114582 117125 119857 123560 128069
3 Mining and Quarrying 22254 23262 24930 26840 29090
i) Natural gas and crude petroleum 13109 13755 14980 16325 17797
ii) Other mining & quarrying 9145 9507 9950 10515 11293
4 Manufacturing 323976 341742 364804 390688 422690
i) Large & medium scale 231302 241941 257808 275723 298605
ii) Small scale 92674 99801 106996 114965 124085
5 Electricity, Water Supply and Gas 30349 32665 35285 38491 41915
i) Electricity 25611 27604 29616 32337 35110
ii) Gas 3381 3602 3918 4263 4641
iii) Water 1357 1459 1751 1891 2164
6 Construction 167959 182428 197189 213465 231195
7 Wholesale and Retail Trade 280212 298683 316865 337698 361552
8 Hotel and Restaurants 13346 14270 15269 16345 17509
9 Transport, Storage and Communication 195797 208633 222924 236763 255521
i) Land transport 139469 148856 158747 168296 175448
ii) Water transport 23322 23402 23419 23456 23915
iii) Air transport 3644 3031 2990 3015 3090
iv) Support transport services, storage 8483 8091 7997 7889 8119
v) Post and telecommunication 20879 25253 29771 34107 44949
10 Financial Intermediations 32697 34889 37215 39826 43380
i) Bank (Monetary Intermediation) 24981 26360 27919 29797 32512
ii) Insurance 6358 7143 7878 8513 9223
iii) Others (Financial Intermediation) 1358 1386 1418 1516 1645
11 Real Estate, Renting and Business Activities 180959 187147 193738 200681 208009
12 Public Administration and Defense 53216 56366 59318 63508 68604
13 Education 46511 50037 53840 57979 62559
14 Health and Social Works 45480 47890 50586 53708 57682
15 Community, Social and Personal Services 165378 170729 176397 183399 190824
GDP at producer price 2078230 2168867 2284490 2417446 2560897
Growth rate 5.4091 4.36126 5.33103 5.81994 5.93399
Import duty 79121 83743 86516 102233 108842
GDP at constant (1995/96) prices 2157351 2252610 2371006 2519679 2669739
GDP at constant (1995/96) prices (Tk bill) 2157.35 2252.61 2371.01 2519.68 2669.74

6
Table 6: GDP at constant prices (2005/06-2009/10), 1995-96=100 (Million Taka)
Industrial Origin Sector 2005-06 2006-07 2007-08 2008-09 2009-10
1 Agriculture and Forestry 465450 487297 501567 522152 577742
i) Crops & horticulture 336439 351327 360717 375200 398194
ii) Animal farming 80075 84470 86532 89542 92568
iii) Forest and related services 48936 51500 54318 57410 60412
2 Fishing 133083 138499 144285 150287 156519
3 Mining and Quarrying 31783 34430 37509 41199 44824
i) Natural gas and crude petroleum 19492 21057 22797 24884 26904
ii) Other mining & quarrying 12291 13373 14712 16315 17920
4 Manufacturing 468197 513722 550772 587539 625707
i) Large & medium scale 332682 365071 391572 417350 442298
ii) Small scale 135515 148651 159200 170189 183409
5 Electricity, Water Supply and Gas 45129 46075 49193 52101 55893
i) Electricity 37726 38133 40680 42872 45964
ii) Gas 5076 5450 5871 6365 6843
iii) Water 2327 2492 2642 2863 3086
6 Construction 250418 267964 283177 299308 317298
7 Wholesale and Retail Trade 385961 416996 445434 473085 500878
8 Hotel and Restaurants 18814 20228 21756 23405 25186
9 Transport, Storage and Communication 275921 298092 323566 349487 376366
i) Land transport 182719 190365 199012 209306 221828
ii) Water transport 24382 24804 25436 26062 26325
iii) Air transport 3252 3318 3524 3784 4129
iv) Support transport services, storage 8616 9386 10179 11161 12070
v) Post and telecommunication 56952 70219 85415 99174 112014
10 Financial Intermediations 47068 51391 55960 60993 68093
i) Bank (Monetary Intermediation) 35175 38459 41681 45454 50211
ii) Insurance 10068 10895 11988 12993 14926
iii) Others (Financial Intermediation) 1825 2037 2291 2546 2956
11 Real Estate, Renting and Business Activities 215687 223805 232205 241062 250445
12 Public Administration and Defense 74198 80436 85432 91432 99060
13 Education 68221 74331 80129 86581 94578
14 Health and Social Works 62174 66926 71627 76782 83001
15 Community, Social and Personal Services 198630 207725 217314 227534 238265
GDP at producer price 2740734 2927917 3099926 3282937 3477306
Growth rate 7.02242 6.82967 5.87479 5.74759 6.00
Import duty 105991 101791 117334 126255 123159
GDP at constant (1995/96) prices 2846725 3029708 3217260 3401968 3608446
GDP at constant (1995/96) prices (Tk bill) 2846.73 3029.71 3217.26 3401.97 3608.47
Source: Bangladesh Bureau of Statistics

7
Table 7: GDP at current market prices (1972/73-78/79)
(Million Taka)
Industrial Origin Sector 1972-73 1973-74 1974-75 1975-76 1976-77 1977-78 1978-79
1 Agriculture and Forestry 22264 35737 69620 49995 47388 63027 72069
i) Crops & horticulture 19491 31849 64464 44894 42151 54811 61764
ii) Animal farming 1636 2302 3036 3180 3299 4487 5943
iii) Forest and related services 1137 1586 2120 1921 1938 3729 4362
2 Fishing 2449 2920 4075 4950 5884 5904 5878
3 Mining and Quarrying 1.0 2.0 2.0 2.0 7.0 10.0 10.0
i) Natural gas and crude petroleum ---- ---- ---- ---- ---- ---- ----
ii) Other mining & quarrying ---- ---- ---- ---- ---- ---- ----
4 Manufacturing 3942 6779 8937 10254 12322 14632 17175
i) Large & medium scale 1202 3441 3954 4433 5997 7124 9173
ii) Small scale 2740 3338 4983 5821 6325 7508 8002
5 Electricity, Water Supply and Gas 130 138 153 213 243 423 477
i) Electricity ---- ---- ---- ---- ---- ---- ----
ii) Gas ---- ---- ---- ---- ---- ---- ----
iii) Water ---- ---- ---- ---- ---- ---- ----
6 Construction 2191 2694 3936 4211 5249 6061 9658
7 Wholesale and Retail Trade 3972 7294 11127 10081 9906 13843 15824
8 Hotel and Restaurants
9
Transport, Storage and
Communication 5244 7132 9078 10300 11585 14700 19866
i) Land transport ---- ---- ---- ---- ---- ---- ----
ii) Water transport ---- ---- ---- ---- ---- ---- ----
iii) Air transport ---- ---- ---- ---- ---- ---- ----
iv) Support transport services, storage ---- ---- ---- ---- ---- ---- ----
v) Post and telecommunication ---- ---- ---- ---- ---- ---- ----
10 Financial Intermediations 537 735 1134 1145 1306 1573 2278
i) Bank (Monetary Intermediation) ---- ---- ---- ---- ---- ---- ----
ii) Insurance ---- ---- ---- ---- ---- ---- ----
iii) Others (Financial Intermediation) ---- ---- ---- ---- ---- ---- ----
11
Real Estate, Renting and Business
Activities 4691 5872 7878 9209 10463 11873 14176
12 Public Administration and Defense 1133 1895 2340 2928 4023 4243 5012
13 Education ---- ---- ---- ---- ---- ---- ----
14 Health and Social Works ---- ---- ---- ---- ---- ---- ----
15
Community, Social and Personal
Services 3299 4554 6089 7032 7627 8905 11624
GDP at current market price 49,853 75,752 124,369 110,320 116,003 145,194 174,047
Source: Bangladesh Bureau of Statistics

8
Table 8: GDP at current market prices (1979/80-85/86)
(Million Taka)
Industrial Origin Sector 1979-80 1980-81 1981-82 1982-83 1983-84 1984-85 1985-86
1 Agriculture and Forestry 77664 90701 100518 112259 141540 162566 177022
i) Crops & horticulture 62714 75621 85219 94945 121339 135849 141091
ii) Animal farming 11511 11144 11027 12002 12713 19201 24613
iii) Forest and related services 3439 3936 4272 5312 7488 7516 11318
2 Fishing 8715 8744 9508 10083 13233 17295 20530
3 Mining and Quarrying 1326 1510 1816 2161 2611 3118 3783
i) Natural gas and crude petroleum 380 486 662 859 1137 1460 1966
ii) Other mining & quarrying 946 1024 1154 1302 1474 1658 1817
4 Manufacturing 37850 43071 48405 58602 68390 77707 86353
i) Large & medium scale 26612 30231 33462 41122 48737 55128 60935
ii) Small scale 11238 12840 14943 17480 19653 22579 25418
5 Electricity, Water Supply and Gas 1329 2015 2497 3597 4333 5475 6947
i) Electricity 1068 1702 2125 3164 3793 4825 6120
ii) Gas 114 147 185 223 307 384 536
iii) Water 147 166 187 210 233 266 291
6 Construction 15978 18938 21691 22965 26037 31411 36037
7 Wholesale and Retail Trade 35355 40390 45072 51659 63257 72318 80470
8 Hotel and Restaurants 1571 1751 2044 2240 2704 3295 3588
9 Transport, Storage and Communication 29149 33394 38786 45505 21081 55862 61351
i) Land transport 18446 21143 24856 29671 3602 36547 40527
ii) Water transport 9234 10531 11806 13351 14242 15458 16831
iii) Air transport 206 247 314 329 638 749 807
iv) Support transport services, storage 624 751 893 1042 1256 1495 1655
v) Post and telecommunication 639 722 917 1112 1343 1613 1531
10 Financial Intermediations 3598 4141 4547 5091 6033 7048 7695
i) Bank (Monetary Intermediation) 3187 3704 4077 4576 5484 6327 6927
ii) Insurance 410 435 468 513 547 719 765
iii) Others (Financial Intermediation) 1.0 2.0 2.0 2.0 2.0 2.0 3.0
11
Real Estate, Renting and Business
Activities 23824 25428 27481 28842 35798 40452 46407
12 Public Administration and Defense 3838 4733 5115 5883 6988 8508 11268
13 Education 5411 6236 7145 8237 9021 10358 11869
14 Health and Social Works 6384 7321 8436 9248 10436 11972 13394
15 Community, Social and Personal Services 21755 25322 29879 32314 37809 41502 51819
GDP at producer price 273747 313695 352940 398686 449271 548887 618533
Growth rate 14.593 12.5106 12.961 12.688 22.1728 12.6886
Import duty 7030 8441 8801 9622 10517 13057 14158
GDP at current market price 280777 322136 361741 408308 459788 561944 632691
GDP at current market price (Tk bill) 280.777 322.136 361.741 408.31 459.79 561.944 632.691
Source: Bangladesh Bureau of Statistics

9
Table 9: GDP at current market prices (1986/87-1992/93)
(Million Taka)
Source: Bangladesh Bureau of Statistics
Industrial Origin Sector 1986-87 1987-88 1988-89 1989-90 1990-91 1991-92 1992-93
1 Agriculture and Forestry 204958 212987 230126 258830 286325 295319 261871
i) Crops & horticulture 166748 168728 181157 200801 223289 228312 191437
ii) Animal farming 25619 27989 32632 38627 40584 42678 44981
iii) Forest and related services 12591 16270 16337 19402 22452 24329 25453
2 Fishing 25529 29337 33295 36297 39714 44078 55066
3 Mining and Quarrying 4779 6129 7326 8243 9020 10517 12707
i) Natural gas and crude petroleum 2723 3769 4671 5340 5723 6499 8018
ii) Other mining & quarrying 2056 2360 2655 2903 3297 4018 4689
4 Manufacturing 94211 102894 110880 127851 144012 160620 179954
i) Large & medium scale 66745 73863 78108 90376 100861 111864 126165
ii) Small scale 27466 29031 32772 37475 43151 48756 53789
5 Electricity, Water Supply and Gas 8672 11250 13033 15138 16609 17922 19517
i) Electricity 7685 10073 11710 13630 14471 15497 16740
ii) Gas 661 813 912 1034 1607 1816 1997
iii) Water 326 364 411 474 531 609 780
6 Construction 39979 45051 51569 58199 63768 70562 75347.5
7 Wholesale and Retail Trade 89938 97125 107167 119790 133528 141565 149874
8 Hotel and Restaurants 4046 4480 5053 5743 6279.7 6835 7300
9 Transport, Storage and Communication 68786 76616 86266 96890 103611 112157 119476
i) Land transport 45620 51231 58597 66710 72280 78164 83891
ii) Water transport 17948 19227 20750 22034 22419 22884 22915
iii) Air transport 1030 1112 1250 1653 1722 1934 2381
iv) Support transport services, storage 1839 2305 2542 2622 2944 3484 4105
v) Post and telecommunication 2349 2741 3127 3871 4246 5691 6184
10 Financial Intermediations 8716 9998 11575 13432 14832 16389 18034
i) Bank (Monetary Intermediation) 7677 8678 9938 11319 12912 14373 15967
ii) Insurance 1021 1222 1489 1917 1692 1738 1737
iii) Others (Financial Intermediation) 18 98 148 196 228 278 330
11 Real Estate, Renting and Business Activities 54005 63266 75263 83280.3 92421.4 98843.5 108562
12 Public Administration and Defense 14099 16119 17920 20006 21874 25903 31063
13 Education 13374 14862 16682 18317 20542 22887.8 25707.9
14 Health and Social Works 15317 17220 21224 22320.4 24234 26587 29258
15 Community, Social and Personal Services 64402 73057 80396 91258.8 96957.1 104824 113570
GDP at producer price 710811 780391 867775 975595 1073727 1155010 1207308
Growth rate 14.9188 9.78882 11.1975 12.4249 10.0586 7.57014 4.52793
Import duty 16899 19537 22823 27693 31455 40415 46386
GDP at current market price 727710 799928 890598 1003288 1105182 1195425 1253694
GDP at current market price (Tk bill) 727.71 799.928 890.598 1003.29 1105.18 1195.42 1253.69

10
Table 10: GDP at current market prices (1993/94-99/00) (Million Taka)
Industrial Origin Sector 1993-94 1994-95 1995-96 1996-97 1997-98 1998-99 1999-2000
1 Agriculture and Forestry 269000 310059.7 324381.6 350461.6 381358.6 429901 446923
i) Crops & horticulture 194896.5 230569.7 239924.6 259974.6 284239.6 323955 334178
ii) Animal farming 47626 50547 53621 56969 60496 64431 68576
iii) Forest and related services 26477.51 28943 30836 33518 36623 41515 44169
2 Fishing 65823 76307.01 85500 96415 108742.3 124854 136738
3 Mining and Quarrying 13699 15444 16691 18002 19517 20664 23112
i) Natural gas and crude petroleum 8405 9235 9919 9898 10418 10800 12769
ii) Other mining & quarrying 5294 6209 6772 8104 9099 9864 10343
4 Manufacturing 199792 224560 246351 270605 312692 327828 348371
i) Large & medium scale 140839 160338 175732 190314 221752 235265 249387
ii) Small scale 58953 64222 70619 80291 90940 92563 98984
5 Electricity, Water Supply and Gas 21124 22685 24009 25537 26433 28381 30722
i) Electricity 17901 19056 20196 21585 22132 23879 25792
ii) Gas 2255 2641 2810 2898 3103 3184 3433
iii) Water 968 988 1003 1054 1198 1318 1497
6 Construction 83197.64 96960.52 109993.5 121694.7 138587.8 156249.1 176218
7 Wholesale and Retail Trade 163588 188727.3 206076.2 220373.6 248444.5 272319 292037
8 Hotel and Restaurants 8045 8841 9782 10328 11561.18 13165.47 14628
9 Transport, Storage and Communication 126827 135252 144832 155841 167413 180413 197433
i) Land transport 89030 95310 102758 110496 120237 130832 144626
ii) Water transport 22883 22700 22825 23102 23263 24035 24903
iii) Air transport 2654 2440 2496 2393 2797 3201 3731
iv) Support transport services, storage 4291 5296 5850 6159 6409 6762 7722
v) Post and telecommunication 7969 9506 10903 13691 14707 15583 16451
10 Financial Intermediations 20064 22464 25171 27595 29918 33511 36475
i) Bank (Monetary Intermediation) 17551 19302 21022 22433 23910 26388 28278
ii) Insurance 2111 2661 3366 3976 4707 5654 6598
iii) Others (Financial Intermediation) 402 501 783 1186 1301 1469 1599
11 Real Estate, Renting and Business Activities 119955.8 130952 151035.9 162952.3 176284.9 195837 211391
12 Public Administration and Defense 33810 36872 40165.06 44188 49604 55522.78 62340
13 Education 28241 30729 33042 36099.18 41365.87 47178 53859
14 Health and Social Works 31543 33798.19 36387.84 39423.79 43709.41 48416 53762
15 Community, Social and Personal Services 121739.4 130728 142942.9 153811.8 170285 184971 203596
GDP at producer price 1306449 1464380 1596361 1733328 1925917 2119210 2287605
Growth rate 8.21174 12.08856 9.01278 8.579946 11.11092 10.03646 7.94611
Import duty 47675 60798 66880 73685 75849 77761 83252
GDP at current market price 1354124 1525178 1663241 1807013 2001766 2196971 2370857
GDP at current market price (Tk bill) 1354.124 1525.178 1663.241 1807.013 2001.766 2196.971 2370.86
Source: Bangladesh Bureau of Statistics

11
Table 11: GDP at current market prices (2000/01-2004/05)
(Million Taka)
Industrial Origin Sector 2000-01 2001-02 2002-03 2004-05 2004-05
1 Agriculture and Forestry 456311 460034 487981 524192 561674
i) Crops & horticulture 340638 338964 360238 388835 414819
ii) Animal farming 68929 71182 74736 79155 86798
iii) Forest and related services 46744 49888 53007 56202 60057
2 Fishing 134061 138970 142588 147833 154564
3 Mining and Quarrying 26398 29973 33094 36435 40411
i) Natural gas and crude petroleum 15017 17333 18999 20854 22948
ii) Other mining & quarrying 11381 12640 14095 15581 17463
4 Manufacturing 382342 418046 458127 515268 587952
i) Large & medium scale 273404 295960 323773 363641 415350
ii) Small scale 108938 122086 134354 151627 172602
5 Electricity, Water Supply and Gas 33464 36400 39894 44245 49090
i) Electricity 28044 30529 33185 36832 40654
ii) Gas 3746 3991 4377 4801 5320
iii) Water 1674 1880 2332 2612 3116
6 Construction 193344 211586 230156 253966 290608
7 Wholesale and Retail Trade 324789 353122 391027 441031 502782
8 Hotel and Restaurants 15902 17404 19438 22021 25117
9 Transport, Storage and Communication 221285 255237 311122 344443 382890
i) Land transport 160985 188693 240961 268602 293741
ii) Water transport 26156 27245 27925 28858 29942
iii) Air transport 3927 4128 4198 4385 4669
iv) Support transport services, storage 9338 9918 10357 10695 11712
v) Post and telecommunication 20879 25253 27681 31903 42826
10 Financial Intermediations 39106 42069 47182 51974 59343
i) Bank (Monetary Intermediation) 29878 31785 35396 38886 44508
ii) Insurance 7604 8613 9988 11109 12590
iii) Others (Financial Intermediation) 1624 1671 1798 1979 2245
11 Real Estate, Renting and Business Activities 223653 239947 256784 276006 297443
12 Public Administration and Defense 66952 71174 77832 86237 96374
13 Education 58518 63516 70644 78733 87882
14 Health and Social Works 57221 60792 66015 71969 81043
15 Community, Social and Personal Services 216645 236983 266845 300278 338763
GDP at producer price 2449991 2635253 2898729 3194631 3555936
Growth rate 7.098516 7.561742 9.998129 10.20799 11.30976
Import duty 85472 102048 107072 135100 151133
GDP at current market price 2535463 2737301 3005801 3329731 3707069
GDP at current market price (Tk bill) 2535.463 2737.301 3005.801 3329.731 3707.069
Source: Bangladesh Bureau of Statistics

12
Table 12: GDP at current market prices (2005/06-2009/10)
(Million Taka)
Source: Bangladesh Bureau of Statistics
Industrial Origin Sector 2005-06 2006-07 2007-08 2008-09 2009-10
1 Agriculture and Forestry 622234 701242 802015 894264 1005880
i) Crops & horticulture 461182 524676 605784 672467 753391
ii) Animal farming 96821 107803 121182 140022 162188
iii) Forest and related services 64231 68763 75049 81775 90301
2 Fishing 163168 177827 197901 218064 242229
3 Mining and Quarrying 46431 53217 61517 70910 81141
i) Natural gas and crude petroleum 25683 28453 31641 35900 40393
ii) Other mining & quarrying 20748 24764 29876 35010 40748
4 Manufacturing 689227 811780 939008 1064453 121081
i) Large & medium scale 489736 576881 667587 756104 848991
ii) Small scale 199491 234899 271421 308349 352090
5 Electricity, Water Supply and Gas 53915 55899 60704 65421 71945
i) Electricity 44551 45671 49551 53109 58398
ii) Gas 5940 6512 7162 7929 8762
iii) Water 3424 3716 3991 4,383 4,786
6 Construction 327970 375432 438538 501,253 556,581
7 Wholesale and Retail Trade 569842 660113 782203 882,764 1,002,946
8 Hotel and Restaurants 28532 32893 38889 44,598 51,501
9 Transport, Storage and Communication 432056 489084 569073 642,803 718,796
i) Land transport 328407 368526 428575 483,648 541,588
ii) Water transport 31370 33067 36211 39,230 42,137
iii) Air transport 5003 5094 5461 5,892 6,491
iv) Support transport services, storage 12604 14199 15689 17,582 19,380
v) Post and telecommunication 54672 68198 83137 96,452 109,201
10 Financial Intermediations 66839 77436 89548 102,453 122,998
i) Bank (Monetary Intermediation) 49948 57969 66564 76,135 90,631
ii) Insurance 14296 16397 19300 22,010 27,016
iii) Others (Financial Intermediation) 2595 3070 3684 4,308 5,351
11 Real Estate, Renting and Business Activities 321569 349286 380580 416,164 456,830
12 Public Administration and Defense 110355 127432 144270 163,604
187,569
13 Education 99345 117760 135315 154,940 179,084
14 Health and Social Works 90220 103066 118191 133,908 151,424
15 Community, Social and Personal Services 382832 435676 502002 583,643 684,655
GDP at producer price 4004535 4568143 5259754 5924072 6691435
Growth rate 12.6155 14.07424 15.13987 12.63021 12.62
Import duty 152744 156626 198469 225360 232360
GDP at current market price 4157279 4724769 5458223 6,147,952 6,943,243
GDP at current market price (Tk bill) 4157.279 4724.769 5458.223 6147.952 6943.243

13
Table 13: Sectoral Share of GDP (%) at current market prices (1979/80-1984/85)
Industrial Origin Sector 1979-80 1980-81 1981-82 1982-83 1983-84 1984-85
1 Agriculture and Forestry 27.66 28.16 27.79 27.49 30.78 28.93
i) Crops & horticulture 22.34 23.47 23.56 23.25 26.39 24.17
ii) Animal farming 4.10 3.46 3.05 2.94 2.76 3.42
iii) Forest and related services 1.22 1.22 1.18 1.30 1.63 1.34
2 Fishing 3.10 2.71 2.63 2.47 2.88 3.08
3 Mining and Quarrying 0.47 0.47 0.50 0.53 0.57 0.55
i) Natural gas and crude petroleum 0.14 0.15 0.18 0.21 0.25 0.26
ii) Other mining & quarrying 0.34 0.32 0.32 0.32 0.32 0.30
4 Manufacturing 13.48 13.37 13.38 14.35 14.87 13.83
i) Large & medium scale 9.48 9.38 9.25 10.07 10.60 9.81
ii) Small scale 4.00 3.99 4.13 4.28 4.27 4.02
5 Electricity, Water Supply and Gas 0.47 0.63 0.69 0.88 0.94 0.97
i) Electricity 0.38 0.53 0.59 0.77 0.82 0.86
ii) Gas 0.04 0.05 0.05 0.05 0.07 0.07
iii) Water 0.05 0.05 0.05 0.05 0.05 0.05
6 Construction 5.69 5.88 6.00 5.62 5.66 5.59
7 Wholesale and Retail Trade 12.59 12.54 12.46 12.65 13.76 12.87
8 Hotel and Restaurants 0.56 0.54 0.57 0.55 0.59 0.59
9 Transport, Storage and Communication 10.38 10.37 10.72 11.14 4.58 9.94
i) Land transport 6.57 6.56 6.87 7.27 0.78 6.50
ii) Water transport 3.29 3.27 3.26 3.27 3.10 2.75
iii) Air transport 0.07 0.08 0.09 0.08 0.14 0.13
iv) Support transport services, storage 0.22 0.23 0.25 0.26 0.27 0.27
v) Post and telecommunication 0.23 0.22 0.25 0.27 0.29 0.29
10 Financial Intermediations 1.28 1.29 1.26 1.25 1.31 1.25
i) Bank (Monetary Intermediation) 1.14 1.15 1.13 1.12 1.19 1.13
ii) Insurance 0.15 0.14 0.13 0.13 0.12 0.13
iii) Others (Financial Intermediation) 0.00 0.00 0.00 0.00 0.00 0.00
11 Real Estate, Renting and Business Activities 8.49 7.89 7.60 7.06 7.79 7.20
12 Public Administration and Defense 1.37 1.47 1.41 1.44 1.52 1.51
13 Education 1.93 1.94 1.98 2.02 1.96 1.84
14 Health and Social Works 2.27 2.27 2.33 2.26 2.27 2.13
15 Community, Social and Personal Services 7.75 7.86 8.26 7.91 8.22 7.39
GDP at producer price 100.00 100.00 100.00 100.00 100.00 100.00
Source: Bangladesh Bureau of Statistics
14
Table 14: Sectoral Share of GDP (%) at current market prices (1985/86-1991/92)
Industrial Origin Sector 1985-86 1886-87 1987-88 1988-89 1989-90 1990-91 1991-92
1 Agriculture and Forestry 27.98 28.16 26.63 25.84 25.80 25.91 24.70
i) Crops & horticulture 22.30 22.91 21.09 20.34 20.01 20.20 19.10
ii) Animal farming 3.89 3.52 3.50 3.66 3.85 3.67 3.57
iii) Forest and related services 1.79 1.73 2.03 1.83 1.93 2.03 2.04
2 Fishing 3.24 3.51 3.67 3.74 3.62 3.59 3.69
3 Mining and Quarrying 0.60 0.66 0.77 0.82 0.82 0.82 0.88
i) Natural gas and crude petroleum 0.31 0.37 0.47 0.52 0.53 0.52 0.54
ii) Other mining & quarrying 0.29 0.28 0.30 0.30 0.29 0.30 0.34
4 Manufacturing 13.65 12.95 12.86 12.45 12.74 13.03 13.44
i) Large & medium scale 9.63 9.17 9.23 8.77 9.01 9.13 9.36
ii) Small scale 4.02 3.77 3.63 3.68 3.74 3.90 4.08
5 Electricity, Water Supply and Gas 1.10 1.19 1.41 1.46 1.51 1.50 1.50
i) Electricity 0.97 1.06 1.26 1.31 1.36 1.31 1.30
ii) Gas 0.08 0.09 0.10 0.10 0.10 0.15 0.15
iii) Water 0.05 0.04 0.05 0.05 0.05 0.05 0.05
6 Construction 5.70 5.49 5.63 5.79 5.80 5.77 5.90
7 Wholesale and Retail Trade 12.72 12.36 12.14 12.03 11.94 12.08 11.84
8 Hotel and Restaurants 0.57 0.56 0.56 0.57 0.57 0.57 0.57
9 Transport, Storage and Communication 9.70 9.45 9.58 9.69 9.66 9.38 9.38
i) Land transport 6.41 6.27 6.40 6.58 6.65 6.54 6.54
ii) Water transport 2.66 2.47 2.40 2.33 2.20 2.03 1.91
iii) Air transport 0.13 0.14 0.14 0.14 0.16 0.16 0.16
iv) Support transport services, storage 0.26 0.25 0.29 0.29 0.26 0.27 0.29
v) Post and telecommunication 0.24 0.32 0.34 0.35 0.39 0.38 0.48
10 Financial Intermediations 1.22 1.20 1.25 1.30 1.34 1.34 1.37
i) Bank (Monetary Intermediation) 1.09 1.05 1.08 1.12 1.13 1.17 1.20
ii) Insurance 0.12 0.14 0.15 0.17 0.19 0.15 0.15
iii) Others (Financial Intermediation) 0.00 0.00 0.01 0.02 0.02 0.02 0.02
11 Real Estate, Renting and Business Activities 7.33 7.42 7.91 8.45 8.30 8.36 8.27
12 Public Administration and Defense 1.78 1.94 2.02 2.01 1.99 1.98 2.17
13 Education 1.88 1.84 1.86 1.87 1.83 1.86 1.91
14 Health and Social Works 2.12 2.10 2.15 2.38 2.22 2.19 2.22
15 Community, Social and Personal Services 8.19 8.85 9.13 9.03 9.10 8.77 8.77
GDP at producer price 100 100 100 100 100 100 100
Source: Bangladesh Bureau of Statistics

15
Table 15: Sectoral Share of GDP (%) at current market prices (1992/93-1998/99)
Industrial Origin Sector 1992-93 1993-94 1994-95 1995-96 1996-97 1997-98 1998-99
1 Agriculture and Forestry 20.89 19.87 20.33 19.50 19.39 19.05 19.57
i) Crops & horticulture 15.27 14.39 15.12 14.43 14.39 14.20 14.75
ii) Animal farming 3.59 3.52 3.31 3.22 3.15 3.02 2.93
iii) Forest and related services 2.03 1.96 1.90 1.85 1.85 1.83 1.89
2 Fishing 4.39 4.86 5.00 5.14 5.34 5.43 5.68
3 Mining and Quarrying 1.01 1.01 1.01 1.00 1.00 0.97 0.94
i) Natural gas and crude petroleum 0.64 0.62 0.61 0.60 0.55 0.52 0.49
ii) Other mining & quarrying 0.37 0.39 0.41 0.41 0.45 0.45 0.45
4 Manufacturing 14.35 14.75 14.72 14.81 14.98 15.62 14.92
i) Large & medium scale 10.06 10.40 10.51 10.57 10.53 11.08 10.71
ii) Small scale 4.29 4.35 4.21 4.25 4.44 4.54 4.21
5 Electricity, Water Supply and Gas 1.56 1.56 1.49 1.44 1.41 1.32 1.29
i) Electricity 1.34 1.32 1.25 1.21 1.19 1.11 1.09
ii) Gas 0.16 0.17 0.17 0.17 0.16 0.16 0.14
iii) Water 0.06 0.07 0.06 0.06 0.06 0.06 0.06
6 Construction 6.01 6.14 6.36 6.61 6.73 6.92 7.11
7 Wholesale and Retail Trade 11.95 12.08 12.37 12.39 12.20 12.41 12.40
8 Hotel and Restaurants 0.58 0.59 0.58 0.59 0.57 0.58 0.60
9 Transport, Storage and Communication 9.53 9.37 8.87 8.71 8.62 8.36 8.21
i) Land transport 6.69 6.57 6.25 6.18 6.11 6.01 5.96
ii) Water transport 1.83 1.69 1.49 1.37 1.28 1.16 1.09
iii) Air transport 0.19 0.20 0.16 0.15 0.13 0.14 0.15
iv) Support transport services, storage 0.33 0.32 0.35 0.35 0.34 0.32 0.31
v) Post and telecommunication 0.49 0.59 0.62 0.66 0.76 0.73 0.71
10 Financial Intermediations 1.44 1.48 1.47 1.51 1.53 1.49 1.53
i) Bank (Monetary Intermediation) 1.27 1.30 1.27 1.26 1.24 1.19 1.20
ii) Insurance 0.14 0.16 0.17 0.20 0.22 0.24 0.26
iii) Others (Financial Intermediation) 0.03 0.03 0.03 0.05 0.07 0.06 0.07
11
Real Estate, Renting and Business
Activities 8.66 8.86 8.59 9.08 9.02 8.81 8.91
12 Public Administration and Defense 2.48 2.50 2.42 2.41 2.45 2.48 2.53
13 Education 2.05 2.09 2.01 1.99 2.00 2.07 2.15
14 Health and Social Works 2.33 2.33 2.22 2.19 2.18 2.18 2.20
15 Community, Social and Personal Services 9.06 8.99 8.57 8.59 8.51 8.51 8.42
GDP at producer price 100 100 100 100 100 100 100
Source: Bangladesh Bureau of Statistics

16
Table 16: Sectoral Share of GDP (%) at current market prices (1999/00-2004/05)
Industrial Origin Sector 1999-000 2000-01 2001-02 2002-03 2004-05 2004-05
1 Agriculture and Forestry 18.85 18.00 16.81 16.23 15.74 15.15
i) Crops & horticulture 14.10 13.43 12.38 11.98 11.68 11.19
ii) Animal farming 2.89 2.72 2.60 2.49 2.38 2.34
iii) Forest and related services 1.86 1.84 1.82 1.76 1.69 1.62
2 Fishing 5.77 5.29 5.08 4.74 4.44 4.17
3 Mining and Quarrying 0.97 1.04 1.09 1.10 1.09 1.09
i) Natural gas and crude petroleum 0.54 0.59 0.63 0.63 0.63 0.62
ii) Other mining & quarrying 0.44 0.45 0.46 0.47 0.47 0.47
4 Manufacturing 14.69 15.08 15.27 15.24 15.47 15.86
i) Large & medium scale 10.52 10.78 10.81 10.77 10.92 11.20
ii) Small scale 4.18 4.30 4.46 4.47 4.55 4.66
5 Electricity, Water Supply and Gas 1.30 1.32 1.33 1.33 1.33 1.32
i) Electricity 1.09 1.11 1.12 1.10 1.11 1.10
ii) Gas 0.14 0.15 0.15 0.15 0.14 0.14
iii) Water 0.06 0.07 0.07 0.08 0.08 0.08
6 Construction 7.43 7.63 7.73 7.66 7.63 7.84
7 Wholesale and Retail Trade 12.32 12.81 12.90 13.01 13.25 13.56
8 Hotel and Restaurants 0.62 0.63 0.64 0.65 0.66 0.68
9 Transport, Storage and Communication 8.33 8.73 9.32 10.35 10.34 10.33
i) Land transport 6.10 6.35 6.89 8.02 8.07 7.92
ii) Water transport 1.05 1.03 1.00 0.93 0.87 0.81
iii) Air transport 0.16 0.15 0.15 0.14 0.13 0.13
iv) Support transport services, storage 0.33 0.37 0.36 0.34 0.32 0.32
v) Post and telecommunication 0.69 0.82 0.92 0.92 0.96 1.16
10 Financial Intermediations 1.54 1.54 1.54 1.57 1.56 1.60
i) Bank (Monetary Intermediation) 1.19 1.18 1.16 1.18 1.17 1.20
ii) Insurance 0.28 0.30 0.31 0.33 0.33 0.34
iii) Others (Financial Intermediation) 0.07 0.06 0.06 0.06 0.06 0.06
11 Real Estate, Renting and Business Activities 8.92 8.82 8.77 8.54 8.29 8.02
12 Public Administration and Defense 2.63 2.64 2.60 2.59 2.59 2.60
13 Education 2.27 2.31 2.32 2.35 2.36 2.37
14 Health and Social Works 2.27 2.26 2.22 2.20 2.16 2.19
15 Community, Social and Personal Services 8.59 8.54 8.66 8.88 9.02 9.14
GDP at producer price 100 100 100 100 100 100
Source: Bangladesh Bureau of Statistics
17
Table 17: Sectoral Share of GDP (%) at current market prices (2005/06-09/10)
Industrial Origin Sector 2005-06 2006-07 2007-08 2008-09 2009-10
1 Agriculture and Forestry 14.97 15.35 15.25 15.06 14.98
i) Crops & horticulture 11.09 11.49 11.52 11.32 11.22
ii) Animal farming 2.36 2.36 2.30 2.36 2.42
iii) Forest and related services 1.51 1.51 1.43 1.38 1.34
2 Fishing 3.89 3.89 3.76 3.67 3.61
3 Mining and Quarrying 1.12 1.16 1.17 1.19 1.21
i) Natural gas and crude petroleum 0.62 0.62 0.60 0.60 0.60
ii) Other mining & quarrying 0.50 0.54 0.57 0.59 0.61
4 Manufacturing 16.58 17.77 17.85 17.92 17.89
i) Large & medium scale 11.78 12.63 12.69 12.73 12.64
ii) Small scale 4.80 5.14 5.16 5.19 5.24
5 Electricity, Water Supply and Gas 1.30 1.22 1.15 1.10 1.07
i) Electricity 1.07 1.00 0.94 0.89 0.87
ii) Gas 0.14 0.14 0.14 0.13 0.13
iii) Water 0.08 0.08 0.07 0.07 0.07
6 Construction 7.89 8.22 8.34 8.44 8.29
7 Wholesale and Retail Trade 13.71 14.45 14.87 14.86 14.94
8 Hotel and Restaurants 0.69 0.72 0.74 0.75 0.77
9 Transport, Storage and Communication 10.39 10.71 10.82 10.82 10.70
i) Land transport 7.90 8.07 8.15 8.14 8.07
ii) Water transport 0.75 0.72 0.69 0.66 0.63
iii) Air transport 0.12 0.11 0.10 0.10 0.09
iv) Support transport services, storage 0.30 0.31 0.30 0.30 0.29
v) Post and telecommunication 1.32 1.49 1.58 1.62 1.63
10 Financial Intermediations 1.61 1.70 1.70 1.73 1.83
i) Bank (Monetary Intermediation) 1.20 1.27 1.27 1.28 1.35
ii) Insurance 0.34 0.36 0.37 0.37 0.40
iii) Others (Financial Intermediation) 0.06 0.07 0.07 0.07 0.08
11 Real Estate, Renting and Business Activities 7.74 7.65 7.24 7.01 6.80
12 Public Administration and Defense 2.65 2.79 2.74 2.75 2.79
13 Education 2.39 2.58 2.57 2.61 2.67
14 Health and Social Works 2.17 2.26 2.25 2.25 2.26
15 Community, Social and Personal Services 9.21 9.54 9.54 9.83 10.20
GDP at producer price 100.00 100.00 100.00 100.00 100.00
Source: Bangladesh Bureau of Statistics
18
Table 18: GDP Growth by Industrial Sector (1980/81-86/87), 1995/96=100
Industrial Origin Sector 1980-81 1981-82 1982-83 1983-84 1984-85 1985-86 1986-87
1 Agriculture and Forestry 3.82 0.21 3.69 5.40 -0.02 3.49 -0.25
i) Crops & horticulture 4.45 -0.77 3.78 5.88 0.11 3.62 -0.49
ii) Animal farming 1.95 1.98 2.01 2.04 2.08 2.11 2.14
iii) Forest and related services 1.42 6.33 5.94 7.09 -4.74 4.76 -2.34
2 Fishing 0.43 5.67 5.29 1.98 1.93 2.33 2.32
3 Mining and Quarrying 5.17 12.41 6.60 8.75 8.47 7.55 10.66
i) Natural gas and crude petroleum 10.01 29.72 11.32 15.96 14.28 13.37 17.50
ii) Other mining & quarrying 2.93 3.85 3.68 3.97 4.18 2.84 4.54
4 Manufacturing 4.37 1.25 3.43 8.92 5.55 7.31 7.95
i) Large & medium scale 4.20 -0.29 2.60 10.31 5.36 7.71 8.45
ii) Small scale 4.81 5.12 5.40 5.70 6.02 6.36 6.74
5 Electricity, Water Supply and Gas 10.21 14.75 14.67 16.98 17.46 6.05 15.64
i) Electricity 11.80 17.42 16.30 17.14 15.72 7.44 17.95
ii) Gas 3.55 3.03 7.30 20.88 30.80 0.00 4.60
iii) Water 6.65 7.72 8.26 6.36 13.16 0.00 5.50
6 Construction 6.29 7.47 3.72 9.19 5.55 5.19 8.02
7 Wholesale and Retail Trade 4.11 3.31 5.46 6.52 3.84 4.19 4.58
8 Hotel and Restaurants 3.50 3.62 3.74 3.90 4.02 4.17 4.32
9 Transport, Storage and Communication
4.99 6.53 5.74 5.47 5.09 3.29 4.57
i) Land transport 5.98 7.32 7.50 6.13 5.24 4.86 4.52
ii) Water transport 2.37 3.20 2.36 1.54 2.01 0.43 0.35
iii) Air transport 12.56 23.79 -3.06 86.32 15.35 3.02 23.06
iv) Support transport services, storage 8.09 11.31 8.11 10.94 12.29 2.44 4.49
v) Post and telecommunication 6.76 16.17 -0.52 4.56 21.02 -6.03 36.59
10 Financial Intermediations 5.16 0.93 1.96 5.55 4.62 6.25 5.65
i) Bank (Monetary Intermediation) 6.21 1.16 2.21 6.72 3.34 6.55 3.37
ii) Insurance -2.99 -1.07 -0.27 -4.88 17.53 3.58 24.47
iii) Others (Financial Intermediation) 0.00 20.00 0.00 0.00 -16.67 20.00 516.67
11 Real Estate, Renting and Business Activities
3.11 3.14 3.20 3.21 3.28 3.26 3.24
12 Public Administration and Defense 3.66 1.72 7.60 8.08 8.91 21.59 12.30
13 Education 2.94 1.49 4.55 2.78 2.74 5.21 1.11
14 Health and Social Works 2.43 2.06 2.55 2.67 2.65 2.72 2.62
15 Community, Social and Personal Services
2.42 2.56 2.37 2.31 2.29 2.40 2.52
GDP at producer price 3.74 2.69 4.05 5.41 3.05 4.33 3.64
Import duty 6.12 -9.11 2.71 -4.18 11.05 1.01 7.66
GDP at constant prices 3.80 2.38 4.02 5.18 3.22 4.25 3.73
GDP at current market price (Tk bill) 3.80 2.38 4.02 5.18 3.22 4.25 3.73
Source: Bangladesh Bureau of Statistics

19
Table 19: GDP Growth by Industrial Sector (1987/88-1993/94), 1995/96=100
Industrial Origin Sector 1987-88 1988-89 1989-90 1990-91 1991-92 1992-93 1993-94
1 Agriculture and Forestry -0.87 -0.38 10.75 1.25 1.39 1.35 -0.65
i) Crops & horticulture -2.19 -1.14 13.64 0.84 1.11 0.97 -1.66
ii) Animal farming 2.18 2.22 2.25 2.29 2.34 2.38 2.42
iii) Forest and related services 5.66 1.49 1.78 3.19 2.29 2.97 2.80
2 Fishing 1.08 0.40 2.06 7.89 8.24 8.49 7.91
3 Mining and Quarrying 10.55 8.96 7.08 1.63 6.61 8.91 5.15
i) Natural gas and crude petroleum 16.50 13.09 9.74 1.69 9.79 12.25 4.83
ii) Other mining & quarrying 4.57 4.33 3.83 1.55 2.53 4.30 5.62
4 Manufacturing 0.65 2.77 7.68 6.38 7.38 8.62 8.15
i) Large & medium scale 0.69 2.07 8.25 6.02 7.34 9.00 8.25
ii) Small scale 0.53 4.51 6.29 7.28 7.48 7.70 7.88
5 Electricity, Water Supply and Gas 16.19 9.18 10.94 7.43 6.35 7.01 6.54
i) Electricity 18.61 10.19 11.89 4.50 5.68 7.12 6.11
ii) Gas 3.46 2.16 2.94 35.48 8.66 3.24 7.42
iii) Water 3.41 5.81 9.71 7.85 14.71 15.92 12.69
6 Construction 5.49 4.40 4.85 0.59 5.94 5.99 9.28
7 Wholesale and Retail Trade 3.96 5.50 3.54 4.73 5.51 3.08 5.55
8 Hotel and Restaurants 4.47 4.64 4.79 4.97 4.98 4.98 4.98
9
Transport, Storage and
Communication 3.07 3.04 4.77 1.60 3.66 3.04 4.02
i) Land transport 3.48 3.46 5.33 3.66 3.49 3.91 3.91
ii) Water transport 0.91 1.65 0.07 -2.91 -1.42 -2.99 -1.83
iii) Air transport 3.99 10.34 25.53 -5.72 0.57 11.83 8.14
iv) Support transport services, storage 17.40 0.90 -1.37 3.45 8.87 9.18 1.20
v) Post and telecommunication -2.21 2.95 22.02 -6.66 34.03 8.66 28.86
10 Financial Intermediations 2.95 1.97 1.95 4.86 3.79 2.84 5.01
i) Bank (Monetary Intermediation) 1.43 0.87 0.06 8.32 4.56 3.83 3.75
ii) Insurance 7.48 7.31 13.13 -16.19 -3.53 -6.60 14.70
iii) Others (Financial Intermediation) 397.30 32.61 15.98 10.60 14.70 10.86 14.82
11
Real Estate, Renting and Business
Activities 3.13 3.15 3.18 3.23 3.27 3.37 3.33
12 Public Administration and Defense 4.11 1.13 1.68 2.87 12.83 14.77 5.64
13 Education 1.18 1.68 0.42 5.52 6.15 7.50 6.61
14 Health and Social Works 2.36 3.22 4.03 2.16 4.52 5.32 4.63
15
Community, Social and Personal
Services 2.48 2.61 2.53 2.69 2.71 2.72 2.74
GDP at producer price 2.03 2.44 5.78 3.24 4.35 4.34 4.19
Import duty 7.44 9.67 11.79 6.86 28.38 10.97 1.33
GDP at constant prices 2.16 2.61 5.94 3.34 5.04 4.57 4.08
GDP at current market price (Tk bill) 2.16 2.61 5.94 3.34 5.04 4.57 4.08
Source: Bangladesh Bureau of Statistics

20
Table 20: GDP Growth by Industrial Sector (1994/95-99/00), 1995/96=100
Industrial Origin Sector 1994-95 1995-96 1996-97 1997-98 1998-99 1999-000
1 Agriculture and Forestry -1.93 2.03 5.57 1.64 3.24 6.92
i) Crops & horticulture -3.42 1.74 6.44 1.07 3.11 8.10
ii) Animal farming 2.47 2.51 2.58 2.64 2.69 2.74
iii) Forest and related services 2.84 3.46 4.03 4.51 5.16 4.94
2 Fishing 6.79 7.39 7.60 8.98 9.96 8.87
3 Mining and Quarrying 9.65 7.81 3.56 5.76 1.32 9.48
i) Natural gas and crude petroleum 9.88 7.41 -0.99 4.80 -2.46 14.55
ii) Other mining & quarrying 9.33 8.40 10.23 7.02 6.18 3.47
4 Manufacturing 10.48 6.41 5.05 8.54 3.19 4.76
i) Large & medium scale 11.44 5.67 3.97 9.28 4.19 4.35
ii) Small scale 8.10 8.28 7.75 6.77 0.75 5.80
5 Electricity, Water Supply and Gas 5.29 5.43 1.93 2.01 6.00 6.78
i) Electricity 5.17 5.52 1.98 1.30 6.75 6.87
ii) Gas 7.43 6.24 1.39 5.30 0.63 5.60
iii) Water 2.07 1.52 2.49 7.20 6.44 8.10
6 Construction 9.56 8.50 8.64 9.48 8.92 8.48
7 Wholesale and Retail Trade 7.96 4.63 5.48 5.98 6.51 7.30
8 Hotel and Restaurants 4.98 4.98 4.98 6.50 6.65 6.94
9 Transport, Storage and Communication 4.95 5.15 5.50 5.69 5.90 6.08
i) Land transport 5.13 5.50 5.44 6.75 6.62 6.32
ii) Water transport -2.12 -1.46 -0.84 -0.92 1.60 1.78
iii) Air transport -8.42 6.26 -10.70 16.91 14.43 16.80
iv) Support transport services, storage 21.02 9.98 0.72 3.36 4.25 13.14
v) Post and telecommunication 19.29 14.70 25.57 7.42 5.96 5.57
10 Financial Intermediations 5.09 4.87 5.14 5.27 5.40 5.50
i) Bank (Monetary Intermediation) 3.22 1.94 2.34 3.49 3.85 3.87
ii) Insurance 18.35 18.35 13.28 14.95 13.05 13.10
iii) Others (Financial Intermediation) 17.07 46.36 45.34 6.50 6.20 5.51
11
Real Estate, Renting and Business
Activities 3.48 3.40 3.54 3.80 3.82 3.83
12 Public Administration and Defense 4.47 4.16 5.50 5.90 5.70 5.97
13 Education 4.49 2.57 4.77 8.10 7.70 7.74
14 Health and Social Works 2.89 2.70 3.90 4.59 4.60 4.80
15 Community, Social and Personal Services 2.75 2.78 2.79 2.85 2.95 3.06
GDP at producer price 4.61 4.47 5.21 5.34 4.99 6.14
Import duty 13.27 8.35 9.63 2.57 1.97 1.31
GDP at constant prices 4.93 4.62 5.39 5.23 4.87 5.94
GDP at current market price (Tk bill) 4.93 4.62 5.39 5.23 4.87 5.94
Source: Bangladesh Bureau of Statistics
21
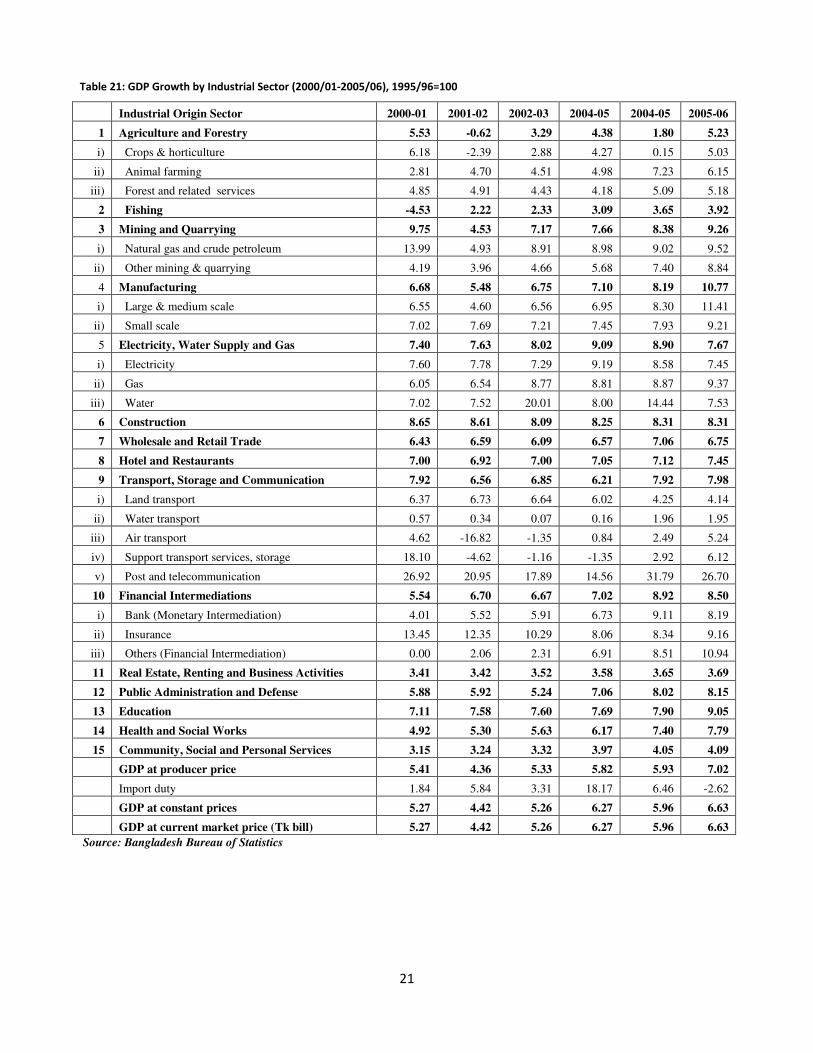
Table 21: GDP Growth by Industrial Sector (2000/01-2005/06), 1995/96=100
Industrial Origin Sector 2000-01 2001-02 2002-03 2004-05 2004-05 2005-06
1 Agriculture and Forestry 5.53 -0.62 3.29 4.38 1.80 5.23
i) Crops & horticulture 6.18 -2.39 2.88 4.27 0.15 5.03
ii) Animal farming 2.81 4.70 4.51 4.98 7.23 6.15
iii) Forest and related services 4.85 4.91 4.43 4.18 5.09 5.18
2 Fishing -4.53 2.22 2.33 3.09 3.65 3.92
3 Mining and Quarrying 9.75 4.53 7.17 7.66 8.38 9.26
i) Natural gas and crude petroleum 13.99 4.93 8.91 8.98 9.02 9.52
ii) Other mining & quarrying 4.19 3.96 4.66 5.68 7.40 8.84
4 Manufacturing 6.68 5.48 6.75 7.10 8.19 10.77
i) Large & medium scale 6.55 4.60 6.56 6.95 8.30 11.41
ii) Small scale 7.02 7.69 7.21 7.45 7.93 9.21
5 Electricity, Water Supply and Gas 7.40 7.63 8.02 9.09 8.90 7.67
i) Electricity 7.60 7.78 7.29 9.19 8.58 7.45
ii) Gas 6.05 6.54 8.77 8.81 8.87 9.37
iii) Water 7.02 7.52 20.01 8.00 14.44 7.53
6 Construction 8.65 8.61 8.09 8.25 8.31 8.31
7 Wholesale and Retail Trade 6.43 6.59 6.09 6.57 7.06 6.75
8 Hotel and Restaurants 7.00 6.92 7.00 7.05 7.12 7.45
9 Transport, Storage and Communication 7.92 6.56 6.85 6.21 7.92 7.98
i) Land transport 6.37 6.73 6.64 6.02 4.25 4.14
ii) Water transport 0.57 0.34 0.07 0.16 1.96 1.95
iii) Air transport 4.62 -16.82 -1.35 0.84 2.49 5.24
iv) Support transport services, storage 18.10 -4.62 -1.16 -1.35 2.92 6.12
v) Post and telecommunication 26.92 20.95 17.89 14.56 31.79 26.70
10 Financial Intermediations 5.54 6.70 6.67 7.02 8.92 8.50
i) Bank (Monetary Intermediation) 4.01 5.52 5.91 6.73 9.11 8.19
ii) Insurance 13.45 12.35 10.29 8.06 8.34 9.16
iii) Others (Financial Intermediation) 0.00 2.06 2.31 6.91 8.51 10.94
11 Real Estate, Renting and Business Activities 3.41 3.42 3.52 3.58 3.65 3.69
12 Public Administration and Defense 5.88 5.92 5.24 7.06 8.02 8.15
13 Education 7.11 7.58 7.60 7.69 7.90 9.05
14 Health and Social Works 4.92 5.30 5.63 6.17 7.40 7.79
15 Community, Social and Personal Services 3.15 3.24 3.32 3.97 4.05 4.09
GDP at producer price 5.41 4.36 5.33 5.82 5.93 7.02
Import duty 1.84 5.84 3.31 18.17 6.46 -2.62
GDP at constant prices 5.27 4.42 5.26 6.27 5.96 6.63
GDP at current market price (Tk bill) 5.27 4.42 5.26 6.27 5.96 6.63
Source: Bangladesh Bureau of Statistics

22
Table 22: GDP Growth by Industrial Sector (2006/07-09/10), 1995/96=100
Industrial Origin Sector 2006-07 2007-08 2008-09 2009-10
1 Agriculture and Forestry 4.69 2.93 4.10 5.56
i) Crops & horticulture 4.43 2.67 4.02 6.13
ii) Animal farming 5.49 2.44 3.48 3.38
iii) Forest and related services 5.24 5.47 5.69 5.23
2 Fishing 4.07 4.18 4.16 4.15
3 Mining and Quarrying 8.33 8.94 9.84 8.80
i) Natural gas and crude petroleum 8.03 8.26 9.15 8.12
ii) Other mining & quarrying 8.80 10.01 10.90 9.84
4 Manufacturing 9.72 7.21 6.68 6.50
i) Large & medium scale 9.74 7.26 6.58 5.98
ii) Small scale 9.69 7.10 6.90 7.77
5 Electricity, Water Supply and Gas 2.10 6.77 5.91 7.28
i) Electricity 1.08 6.68 5.39 7.21
ii) Gas 7.37 7.72 8.42 7.51
iii) Water 7.09 6.02 8.39 7.77
6 Construction 7.01 5.68 5.70 6.01
7 Wholesale and Retail Trade 8.04 6.82 6.21 5.87
8 Hotel and Restaurants 7.52 7.55 7.58 7.61
9 Transport, Storage and Communication 8.04 8.55 8.01 7.69
i) Land transport 4.18 4.54 5.17 5.98
ii) Water transport 1.73 2.55 2.46 1.01
iii) Air transport 2.03 6.21 7.38 9.13
iv) Support transport services, storage 8.94 8.45 9.64 8.15
v) Post and telecommunication 23.30 21.64 16.11 12.95
10 Financial Intermediations 9.18 8.89 8.99 11.64
i) Bank (Monetary Intermediation) 9.34 8.38 9.05 10.47
ii) Insurance 8.21 10.03 8.83 14.88
iii) Others (Financial Intermediation) 11.62 12.47 11.13 16.10
11 Real Estate, Renting and Business Activities 3.76 3.75 3.81 3.89
12 Public Administration and Defense 8.41 6.21 7.01 8.35
13 Education 8.96 7.80 8.05 9.24
14 Health and Social Works 7.64 7.02 7.20 8.10
15 Community, Social and Personal Services 4.58 4.62 4.70 4.72
GDP at producer price 6.83 5.87 5.82 6.01
Import duty -3.96 15.27 7.60 -2.50
GDP at constant prices 6.43 6.19 5.74 6.07
GDP at current market price (Tk bill) 6.43 6.19 5.74 6.07
Source: Bangladesh Bureau of Statistics

23
Table 23: GDP by Expenditure Categories at current market price (FY 1990-FY 95)
Source: Bangladesh Bureau of Statistics
Table 24: GDP by Expenditure Categories at current market price (FY 1996-FY 00)
(In Million TK) FY 90 FY 91 FY 92 FY 93 FY 94 FY 95
A. Domestic Demand 1045328 1131853 1236555 1321497 1425874 1613582
1.Consumption 874226 945122 1029686 1096499 1176681 1321971
Private 832089 899408 976475 1034393 1110557 1251357
General Government 42137 45714 53211 62106 66124 70614
2.Investment 171102 186731 206869 224998 249193 291611
Private 98426 113448 123502 143787 159209 188828
Public 72676 73283 83367 81211 89984 102783
B. Resource Balance (3-4) -74329 -61499 -56910 -63776 -65848 -98835
3.Exports 61422 73634 90693 113049 121892 165705
4.Imports 135751 135133 147603 176825 187740 264540
C. Gross Domestic Expenditure at c.m.p 970999 1070354 1179645 1257721 1360026 1514747
5. Gross Domestic products at c.m.p 1003288 1105181 1195424 1253695 1354123 1525178
6. Statistical Discrepancy 32289 35827 15779 -4026 -5903 10431
7.Net factor income from abroad 20915 23600 29020 34122 42338 46512
8.Gross National Income 1024203 1128781 1224444 1287817 1396461 1571690
9.Net current transfer from abroad 26616 32576 35997 36826 34703 44942
10.Gross Disposable National Income 1050819 1161357 1260441 1324643 1431164 1616632
11. Gross Domestic Savings 129062 160059 165738 157196 177442 203207
12. Gross National Savings 176593 216235 230755 228144 254483 294661
13. Current Account Balance -26798 -6323 8107 7172 11193 -7381
(in Million TK) FY 96 FY 97 FY 98 FY 99 FY 00
A. Domestic Demand 1747937 597405 2086264 2295531 2492779
1.Consumption 1415402 222940 1653234 1807956 1946914
Private 1342157 144076 1558563 1707131 1838528
General Government 73245 78864 94671 100825 108386
2.Investment 332535 374465 433030 487575 545865
Private 225803 247510 305569 339949 370149
Public 106732 126955 127461 147626 175716
B. Resource Balance (3-4) -126554 -108868 -99064 -120066 -124406
3.Exports 184359 216723 266809 289861 331446
4.Imports 310913 325591 365873 409927 455852
C. Gross Domestic Expenditure at c.m.p 1621383 488537 1987200 2175465 2368373
5. Gross Domestic products at c.m.p 1663240 1807013 2001766 2196972 2370856
6. Statistical Discrepancy 41857 21786 14566 21508 2482
7.Net factor income from abroad 495436 58458 64972 75526 87135
8.Gross National Income 2158676 1865471 2066738 2272498 2457991
9.Net current transfer from abroad 38186 44049 22363 25600 36532
10.Gross Disposable National Income 2196862 1909520 2089101 2298098 2494523
11. Gross Domestic Savings 247838 1584073 348532 389016 423942
12. Gross National Savings 781460 1686580 435867 490142 547609
13. Current Account Balance 407068 1290329 -11729 -18941 -738

24
Table 25: GDP by Expenditure Categories at current market price (FY 01-FY 05)
(in Million TK) FY 01 FY 02 FY 03 FY 04 FY 05
A. Domestic Demand 2664543 2868349 3149214 3479179 3874361 1.Consumption 2079180 2235957 2445697 2679274 2965120
Private 1964929 2099316 2284988 2495207 2759817
General Government 114251 136641 160709 184067 205303
2.Investment 585363 632392 703517 799905 909241
Private 401546 458383 517169 593673 679182
Public 183817 174009 186348 206232 230059
B. Resource Balance (3-4) -155134 -130346 -174982 -178093 -239642 3.Exports 390000 390021 427239 514938 614681
4.Imports 545134 520367 602221 693031 854323
C. Gross Domestic Expenditure at c.m.p 2509409 2738003 2974232 3301086 3634719 5. Gross Domestic products at c.m.p 2535464 2732010 3005801 3329731 3707070
6. Statistical Discrepancy 26055 -5993 31569 28645 72351
7.Net factor income from abroad 88413 125425 165831 175529 1899280
8.Gross National Income 2623877 2857435 3171632 3505260 5606350
9.Net current transfer from abroad 23392 18902 21583 21207 26808
10.Gross Disposable National Income 2647269 2876337 3193215 3526467 5633158
11. Gross Domestic Savings 456284 496053 560104 650457 741950
12. Gross National Savings 568089 640380 747518 847193 2668038
13. Current Account Balance -43329 13981 12432 18643 1686446
Source: Bangladesh Bureau of Statistics
Table 26: GDP by Expenditure Categories at current market price (FY 2006-FY 2010)
(in Million TK) FY 06 FY 07 FY 08 FY 09 FY 10
A. Domestic Demand 4340318 4919075 5671036 6411787 7337054
1.Consumption 3315523 3763172 4349714 4923379 5608791
Private 3085199 3502116 4061404 4604413 5234195
General Government 230324 261056 288310 318966 374596
2.Investment 1024795 1155903 1321322 1488408 1728264
Private 775464 898618 1050900 1203518 1398165
Public 249331 257285 270422 284890 330098
B. Resource Balance -260703 -327225 -459139 -587527 -442659
3.Exports 788788 934403 1110181 1287810 1283145
4.Imports 1049491 1261628 1569320 1875337 1725804
C. Gross Domestic Expenditure at c.m.p 4079615 4591850 5211897 5824260 6894395
5. Gross Domestic products at c.m.p 4157279 4724769 5458224 6155479 6923795
6. Statistical Discrepancy 77664 132919 246327 331219 29400
7.Net factor income from abroad 272075 352755 483895 682873 647727
8.Gross National Income 4429354 5077524 5942119 6838352 7571522
9.Net current transfer from abroad 36529 39885 56713 77073 27922
10.Gross Disposable National Income 4465883 5117409 5998832 6915425 7599445
11. Gross Domestic Savings 841756 961597 1108510 1232100 1315004
12. Gross National Savings 1150360 1354237 1649118 1992046 1990654
13. Current Account Balance 47901 65415 81469 172419 232991
Source: Bangladesh Bureau of Statistics

25
Table 27: Fiscal Components as % of GDP (FY73-FY87)
Source: Ministry of Finance
2. Revenue
Fiscal Year FY73 FY74 FY75 FY76 FY77 FY78 FY79 FY80 FY81 FY82 FY83 FY84 FY85 FY86 FY87
Variables/Items (As Percentage of GDP)
Total Revenue 3.43 3.86 4.06 7.69 7.96 7.94 8.15 6.04 7.13 6.48 6.05 5.70 6.36 6.45 6.44
Tax Revenue 3.41 3.81 3.46 6.47 6.64 6.88 6.99 5.20 5.69 5.47 5.23 4.84 5.28 5.22 5.31
Non-Tax Revenue 0.03 0.04 0.60 1.22 1.32 1.07 1.16 0.84 1.44 1.01 0.82 0.85 1.08 1.23 1.13
Total Expenditure 11.5 10.1 9.1 16.2 16.6 16.2 15.0 11.9 11.9 11.9 14.2 12.4 11.7 12.2 12.8
Revenue expenditure 5.8 4.8 5.2 8.8 8.1 7.5 6.5 4.5 4.6 5.1 5.3 5.1 5.2 5.4 5.4
ADP expenditure 5.6 5.3 3.9 7.3 8.5 8.7 8.5 7.4 7.3 6.6 6.6 6.1 5.6 5.7 6.1
overall balance(excluding grant)
15.7 8.5 7.7 11.7 12.1 12.3 11.2 9.4 7.8 9.0 11.5 10.4 8.6 8.4 9.1
overall balance(including grant)
8.0 6.2 5.1 8.5 8.7 8.2 6.8 5.9 4.8 5.4 8.1 6.7 5.4 5.8 6.3
Financing 15.7 8.5 7.7 11.7 12.1 12.3 11.2 9.4 7.8 9.0 11.5 10.4 8.6 8.4 9.1
External 8.6 4.8 6.0 10.4 6.8 8.3 8.6 6.4 5.6 6.6 6.4 6.1 5.4 5.6 6.1
Grants 7.7 2.3 2.7 3.2 3.4 4.1 4.4 3.6 3.0 3.6 3.4 3.7 3.2 2.6 2.8
Loan 1.0 2.6 3.8 7.7 3.7 4.6 4.6 3.2 2.8 3.3 3.4 2.7 2.6 3.6 3.9
Amortization 0.1 0.1 0.4 0.5 0.3 0.4 0.4 0.4 0.2 0.2 0.5 0.4 0.5 0.5 0.6
Domestic 7.1 3.8 1.7 1.2 5.3 4.0 2.7 3.1 2.2 2.4 5.2 4.3 3.2 2.7 3.1
Bank 0.3 0.9 -0.7 -1.0 1.2 0.1 0.9 1.6 1.6 1.3 2.8 2.5 1.7 1.7 1.7
Non- bank 0.2 0.6 -0.2 -1.0 0.7 0.2 1.7 1.4 0.7 1.1 2.4 1.8 1.5 1.3 1.4
Memorandum Item:
Nominal GDP (billion tk) 50 76 124 110 116 145 174 281 322 362 408 490 562 633 728

26
Table 28: Table: Fiscal Components as % of GDP (FY88-FY03)
FY88 FY89 FY90 FY91 FY92 FY93 FY94 FY95 FY96 FY97 FY98 FY99 FY00 FY01 FY02 FY03
(As Percentage of GDP)
Total Revenue 6.50 6.48 6.69 7.26 8.33 9.17 9.33 9.38 9.25 9.17 9.20 8.81 8.47 9.60 10.23 10.31
Tax Revenue 5.53 5.44 5.70 5.96 6.61 7.30 7.18 7.44 7.32 7.44 7.39 7.17 6.79 7.80 7.83 8.26
Non-Tax Revenue 0.97 1.04 0.99 1.30 1.72 1.87 2.15 1.93 1.93 1.73 1.81 1.64 1.69 1.80 2.40 2.05
Total Expenditure 12.4 13.2 13.4 13.3 13.0 13.0 15.0 14.4 13.9 13.3 12.9 13.6 14.5 14.8 14.9 14.5
Revenue expenditure 5.9 6.9 6.7 6.6 6.6 6.8 6.8 6.8 7.1 6.9 7.2 7.6 7.8 8.1 8.3 8.4
ADP expenditure 5.2 5.2 5.7 4.8 5.0 5.2 6.6 6.8 6.0 6.1 5.5 5.7 6.5 6.4 5.2 5.1
overall balance(excluding
grant) 9.1 9.2 9.2 8.7 7.3 6.3 7.8 -4.6 -4.7 -3.7 -3.4 -4.6 -6.1 -5.2 -4.7 -4.2
overall balance(including
grant) 5.8 6.8 6.7 6.0 4.7 3.8 5.7 -2.2 -3.0 -2.0 -2.1 -3.2 -4.5 -4.1 -3.7 -3.4
Financing 8.9 9.3 8.4 8.2 7.9 7.2 7.8 4.9 4.8 4.2 3.7 4.7 5.3 4.8 4.8 3.5
External 5.8 5.4 5.3 5.0 4.5 4.5 3.8 3.8 2.8 2.8 2.1 2.5 2.4 2.0 2.1 2.2
Grants 3.2 2.4 2.5 2.7 2.6 2.6 2.1 2.3 1.7 1.7 1.1 1.5 1.5 1.1 1.0 1.0
Loan 3.2 3.6 3.4 2.9 2.5 2.7 2.5 2.2 1.9 1.8 1.7 1.9 1.8 1.8 2.0 2.1
Amortization 0.6 0.6 0.6 0.6 0.7 0.7 0.8 0.8 0.8 0.7 0.7 0.8 0.9 0.9 0.9 0.9
Domestic 3.2 3.9 3.1 3.3 3.4 2.7 4.0 1.2 2.0 1.5 1.6 2.2 2.9 2.8 2.7 1.3
Bank 1.4 1.8 1.8 2.2 1.9 0.9 1.6 0.5 1.1 0.9 0.6 0.9 1.5 1.1 0.9 -0.3
Non- bank 1.7 2.0 1.2 1.1 1.5 1.9 2.4 0.7 1.0 0.5 1.0 1.3 1.4 1.7 1.7 1.6
Memorandum Item:
Nominal GDP (billion taka) 799 890 1003 1105 1195 1254 1354 1525 1663 1807
2001 2197 2370 2535 2732 3005
Source: Ministry of Finance

27
Table 29: Fiscal Components as % of GDP (FY04-FY10)
FY-04 FY05 FY06 FY07 FY08 FY09 FY10
(As Percentage of GDP)
Total Revenue 10.32 10.42 10.57 10.41 11.41 10.41 10.91
Tax Revenue 8.19 8.47 8.48 8.25 9.11 8.67 9.00
Non-Tax Revenue 2.13 1.96 2.09 2.16 2.30 1.8 1.9
Total Expenditure 14.8 15.0 14.7 14.1 17.2 14.3 14.6
Revenue expenditure 8.6 9.4 9.2 9.6 10.6 11.2 11.0
ADP expenditure 5.1 5.1 4.6 3.8 3.1 3.2 3.7
overall balance(excluding grant) -4.2 -4.4 -3.9 3.7 5.7 -3.9 -3.7
overall balance(including grant) -3.4 -3.7 -3.3 4.6 6.6 -4.2 -4.3
Financing 3.3 3.5 3.8 3.5 4.4 3.9 3.7
External 1.1 1.8 1.6 1.6 1.9 0.8 1.4
Grants 0.6 0.4 0.8 0.8 0.8 0.3 0.6
Loan 1.2 2.1 1.7 1.5 1.8 1.6
Amortization 0.7 0.7 0.8 0.8 0.7 0.8 0.7
Domestic 2.2 1.8 2.2 1.9 2.6 3.1 2.3
Bank 0.8 1.0 1.5 0.9 2.0 2.2 -0.3
Non- bank 1.4 0.8 0.7 1.0 0.6 0.9 2.6
Memorandum item
Nominal GDP (billion taka) 3329.7 3707.1 4157.3 4724.8 5458.2 6148.4 6943.2
Source: Economic Review, Ministry of Finance, Bangladesh
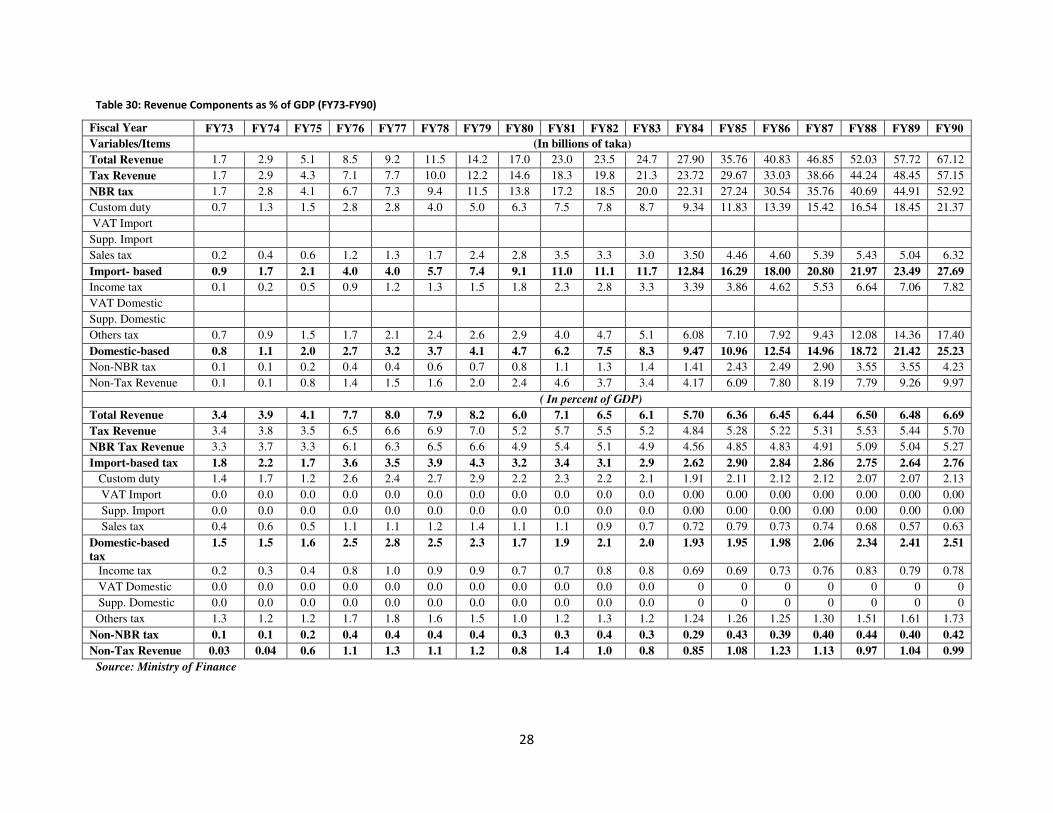
28
Table 30: Revenue Components as % of GDP (FY73-FY90)
Fiscal Year FY73 FY74 FY75 FY76 FY77 FY78 FY79 FY80 FY81 FY82 FY83 FY84 FY85 FY86 FY87 FY88 FY89 FY90
Variables/Items (In billions of taka)
Total Revenue 1.7 2.9 5.1 8.5 9.2 11.5 14.2 17.0 23.0 23.5 24.7 27.90 35.76 40.83 46.85 52.03 57.72 67.12
Tax Revenue 1.7 2.9 4.3 7.1 7.7 10.0 12.2 14.6 18.3 19.8 21.3 23.72 29.67 33.03 38.66 44.24 48.45 57.15
NBR tax 1.7 2.8 4.1 6.7 7.3 9.4 11.5 13.8 17.2 18.5 20.0 22.31 27.24 30.54 35.76 40.69 44.91 52.92
Custom duty 0.7 1.3 1.5 2.8 2.8 4.0 5.0 6.3 7.5 7.8 8.7 9.34 11.83 13.39 15.42 16.54 18.45 21.37
VAT Import
Supp. Import
Sales tax 0.2 0.4 0.6 1.2 1.3 1.7 2.4 2.8 3.5 3.3 3.0 3.50 4.46 4.60 5.39 5.43 5.04 6.32
Import- based 0.9 1.7 2.1 4.0 4.0 5.7 7.4 9.1 11.0 11.1 11.7 12.84 16.29 18.00 20.80 21.97 23.49 27.69
Income tax 0.1 0.2 0.5 0.9 1.2 1.3 1.5 1.8 2.3 2.8 3.3 3.39 3.86 4.62 5.53 6.64 7.06 7.82
VAT Domestic
Supp. Domestic
Others tax 0.7 0.9 1.5 1.7 2.1 2.4 2.6 2.9 4.0 4.7 5.1 6.08 7.10 7.92 9.43 12.08 14.36 17.40
Domestic-based 0.8 1.1 2.0 2.7 3.2 3.7 4.1 4.7 6.2 7.5 8.3 9.47 10.96 12.54 14.96 18.72 21.42 25.23
Non-NBR tax 0.1 0.1 0.2 0.4 0.4 0.6 0.7 0.8 1.1 1.3 1.4 1.41 2.43 2.49 2.90 3.55 3.55 4.23
Non-Tax Revenue 0.1 0.1 0.8 1.4 1.5 1.6 2.0 2.4 4.6 3.7 3.4 4.17 6.09 7.80 8.19 7.79 9.26 9.97
( In percent of GDP)
Total Revenue 3.4 3.9 4.1 7.7 8.0 7.9 8.2 6.0 7.1 6.5 6.1 5.70 6.36 6.45 6.44 6.50 6.48 6.69
Tax Revenue 3.4 3.8 3.5 6.5 6.6 6.9 7.0 5.2 5.7 5.5 5.2 4.84 5.28 5.22 5.31 5.53 5.44 5.70
NBR Tax Revenue 3.3 3.7 3.3 6.1 6.3 6.5 6.6 4.9 5.4 5.1 4.9 4.56 4.85 4.83 4.91 5.09 5.04 5.27
Import-based tax 1.8 2.2 1.7 3.6 3.5 3.9 4.3 3.2 3.4 3.1 2.9 2.62 2.90 2.84 2.86 2.75 2.64 2.76
Custom duty 1.4 1.7 1.2 2.6 2.4 2.7 2.9 2.2 2.3 2.2 2.1 1.91 2.11 2.12 2.12 2.07 2.07 2.13
VAT Import 0.0 0.0 0.0 0.0 0.0 0.0 0.0 0.0 0.0 0.0 0.0 0.00 0.00 0.00 0.00 0.00 0.00 0.00
Supp. Import 0.0 0.0 0.0 0.0 0.0 0.0 0.0 0.0 0.0 0.0 0.0 0.00 0.00 0.00 0.00 0.00 0.00 0.00
Sales tax 0.4 0.6 0.5 1.1 1.1 1.2 1.4 1.1 1.1 0.9 0.7 0.72 0.79 0.73 0.74 0.68 0.57 0.63
Domestic-based tax
1.5 1.5 1.6 2.5 2.8 2.5 2.3 1.7 1.9 2.1 2.0 1.93 1.95 1.98 2.06 2.34 2.41 2.51
Income tax 0.2 0.3 0.4 0.8 1.0 0.9 0.9 0.7 0.7 0.8 0.8 0.69 0.69 0.73 0.76 0.83 0.79 0.78
VAT Domestic 0.0 0.0 0.0 0.0 0.0 0.0 0.0 0.0 0.0 0.0 0.0 0 0 0 0 0 0 0
Supp. Domestic 0.0 0.0 0.0 0.0 0.0 0.0 0.0 0.0 0.0 0.0 0.0 0 0 0 0 0 0 0
Others tax 1.3 1.2 1.2 1.7 1.8 1.6 1.5 1.0 1.2 1.3 1.2 1.24 1.26 1.25 1.30 1.51 1.61 1.73
Non-NBR tax 0.1 0.1 0.2 0.4 0.4 0.4 0.4 0.3 0.3 0.4 0.3 0.29 0.43 0.39 0.40 0.44 0.40 0.42
Non-Tax Revenue 0.03 0.04 0.6 1.1 1.3 1.1 1.2 0.8 1.4 1.0 0.8 0.85 1.08 1.23 1.13 0.97 1.04 0.99
Source: Ministry of Finance

29
Table 31: Revenue Components as % of GDP (FY91-FY02)
Source: Ministry of Finance
FY91 FY92 FY93 FY94 FY95 FY96 FY97 FY98 FY99 FY00 FY01 FY02
(In billions of taka)
Total Revenue 80.3 99.6 115.0 126.4 143.0 153.8 165.7 184.2 193.5 200.9 243.4 279.6
Tax Revenue 65.9 79.0 91.5 97.3 113.5 121.7 134.5 147.9 157.5 160.9 197.8 214.0
NBR tax 61.5 73.5 85.4 90.0 105.2 113.7 125.0 138.0 148.7 151.3 187.8 202.9
Custom duty 23.7 27.5 28.8 29.8 36.8 37.7 40.1 45.4 47.4 42.5 51.0 54.0
VAT Import 12.7 17.3 17.1 22.2 25.6 27.9 29.1 30.5 30.6 36.8 37.6
Supp. Import 0.3 0.3 0.7 1.9 3.6 4.5 5.6 7.7 9.5 12.6 13.3
Sales tax 8.0
Import- based 31.7 40.4 46.4 47.7 60.8 66.9 72.5 80.1 85.5 82.7 100.4 104.9
Income tax 11.3 12.9 16.1 17.0 14.9 15.3 16.6 19.7 23.6 26.1 35.1 38.8
VAT Domestic 4.7 8.3 10.3 12.5 13.0 15.5 16.9 18.1 21.1 27.0 32.0
Supp. Domestic 0.3 9.8 11.8 13.4 14.6 16.2 17.2 17.1 17.2 21.1 22.8
Others tax 18.5 15.2 4.7 3.1 3.6 3.8 4.2 4.2 4.3 4.4 4.2 4.4
Domestic-based 29.8 33.1 40.0 42.3 44.4 46.8 52.5 57.9 63.1 68.7 87.4 98.1
Non-NBR tax 4.4 5.5 6.2 7.3 8.3 8.0 9.5 9.9 8.8 9.6 10.0 11.1
Non-Tax Revenue 14.4 20.6 23.5 29.1 29.5 32.1 31.2 36.3 36.0 40.0 45.6 65.6
(In Percent of GDP)
Total Revenue 7.3 8.3 9.2 9.3 9.4 9.3 9.2 9.2 8.8 8.5 9.6 10.2
Tax Revenue 6.0 6.6 7.3 7.2 7.4 7.3 7.4 7.4 7.2 6.8 7.8 7.8
NBR Tax Revenue 5.6 6.2 6.8 6.6 6.9 6.8 6.9 6.9 6.8 6.4 7.4 7.4
Import-based tax 2.9 3.4 3.7 3.5 4.0 4.0 4.0 4.0 3.9 3.5 4.0 3.8
Custom duty 2.2 2.3 2.3 2.2 2.4 2.3 2.2 2.3 2.2 1.8 2.0 2.0
VAT Import 0.0 1.1 1.4 1.3 1.5 1.5 1.5 1.5 1.4 1.3 1.5 1.4
Supp. Import 0.0 0.02 0.02 0.05 0.1 0.2 0.3 0.3 0.4 0.4 0.5 0.5
Sales tax 0.7 0.0 0.0 0.0 0.0 0.0 0.0 0.0 0.0 0.0 0.0 0.0
Domestic-based tax 2.7 2.8 3.1 3.1 2.9 2.8 2.9 2.9 2.9 2.9 3.5 3.6
Income tax 1.0 1.1 1.3 1.3 1.0 0.9 0.9 1.0 1.1 1.1 1.4 1.4
VAT Domestic 0.0 0.4 0.7 0.8 0.8 0.8 0.9 0.8 0.8 0.9 1.1 1.2
Supp. Domestic 0.0 0.02 0.8 0.9 0.9 0.9 0.9 0.9 0.8 0.8 0.8 0.8
Others tax 1.7 1.3 0.4 0.2 0.2 0.2 0.2 0.2 0.2 0.2 0.2 0.2
Non-NBR tax 0.4 0.5 0.5 0.5 0.6 0.5 0.5 0.5 0.4 0.4 0.4 0.4
Non-Tax Revenue 1.3 1.7 1.9 2.2 1.9 1.9 1.7 1.8 1.6 1.7 1.8 2.4
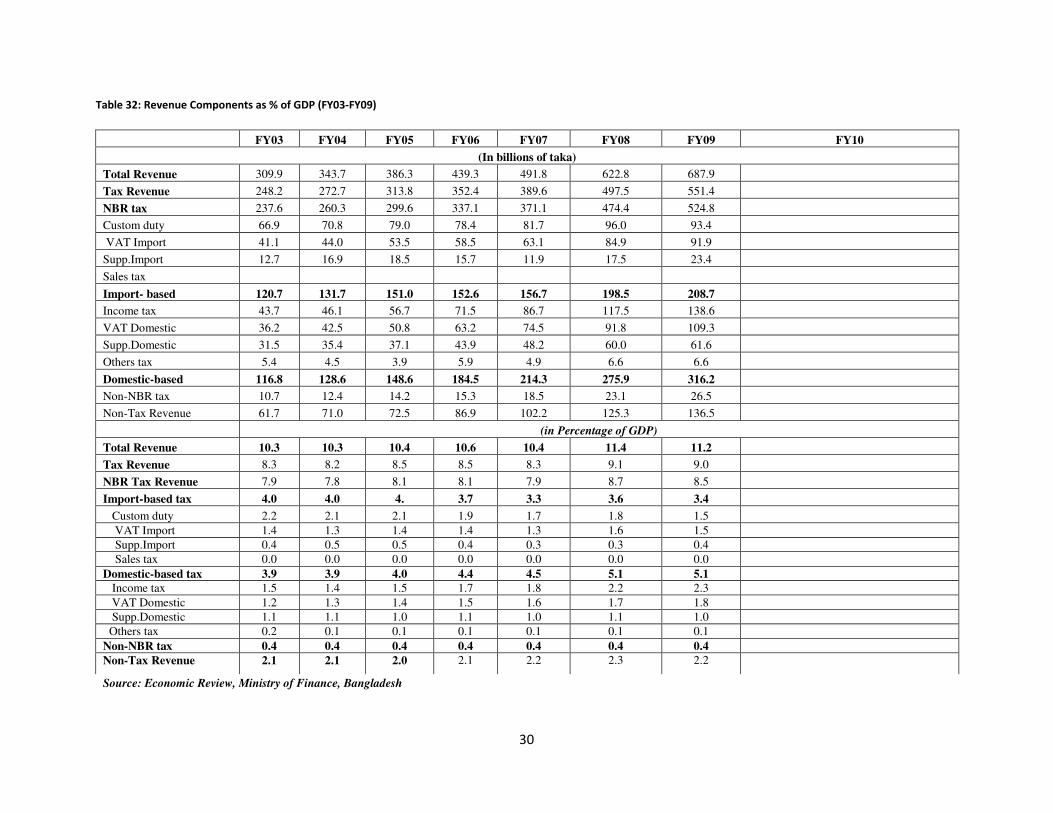
30
Table 32: Revenue Components as % of GDP (FY03-FY09)
FY03 FY04 FY05 FY06 FY07 FY08 FY09 FY10
(In billions of taka)
Total Revenue 309.9 343.7 386.3 439.3 491.8 622.8 687.9
Tax Revenue 248.2 272.7 313.8 352.4 389.6 497.5 551.4
NBR tax 237.6 260.3 299.6 337.1 371.1 474.4 524.8
Custom duty 66.9 70.8 79.0 78.4 81.7 96.0 93.4
VAT Import 41.1 44.0 53.5 58.5 63.1 84.9 91.9
Supp.Import 12.7 16.9 18.5 15.7 11.9 17.5 23.4
Sales tax
Import- based 120.7 131.7 151.0 152.6 156.7 198.5 208.7
Income tax 43.7 46.1 56.7 71.5 86.7 117.5 138.6
VAT Domestic 36.2 42.5 50.8 63.2 74.5 91.8 109.3
Supp.Domestic 31.5 35.4 37.1 43.9 48.2 60.0 61.6
Others tax 5.4 4.5 3.9 5.9 4.9 6.6 6.6
Domestic-based 116.8 128.6 148.6 184.5 214.3 275.9 316.2
Non-NBR tax 10.7 12.4 14.2 15.3 18.5 23.1 26.5
Non-Tax Revenue 61.7 71.0 72.5 86.9 102.2 125.3 136.5
(in Percentage of GDP)
Total Revenue 10.3 10.3 10.4 10.6 10.4 11.4 11.2
Tax Revenue 8.3 8.2 8.5 8.5 8.3 9.1 9.0
NBR Tax Revenue 7.9 7.8 8.1 8.1 7.9 8.7 8.5
Import-based tax 4.0 4.0 4. 3.7 3.3 3.6 3.4
Custom duty 2.2 2.1 2.1 1.9 1.7 1.8 1.5
VAT Import 1.4 1.3 1.4 1.4 1.3 1.6 1.5
Supp.Import 0.4 0.5 0.5 0.4 0.3 0.3 0.4
Sales tax 0.0 0.0 0.0 0.0 0.0 0.0 0.0
Domestic-based tax 3.9 3.9 4.0 4.4 4.5 5.1 5.1 Income tax 1.5 1.4 1.5 1.7 1.8 2.2 2.3
VAT Domestic 1.2 1.3 1.4 1.5 1.6 1.7 1.8
Supp.Domestic 1.1 1.1 1.0 1.1 1.0 1.1 1.0
Others tax 0.2 0.1 0.1 0.1 0.1 0.1 0.1
Non-NBR tax 0.4 0.4 0.4 0.4 0.4 0.4 0.4
Non-Tax Revenue 2.1 2.1 2.0 2.1 2.2 2.3 2.2
Source: Economic Review, Ministry of Finance, Bangladesh

31
Fiscal Year FY73 FY74 FY75 FY76 FY77 FY78 FY79 FY80 FY81 FY82 FY83 FY84 FY85
Variables/Items (Components of Current Expenditure as % of GDP)
Total Expenditure 11.5 10.1 9.1 16.2 16.6 16.2 15.0 11.9 11.9 11.9 14.2 12.4 11.7
Revenue Expenditure 5.8 4.8 5.2 8.8 8.1 7.5 6.5 4.5 4.6 5.1 5.3 5.1 5.2
Defense 2.8 1.9 1.6 2.2 3.2 2.3 2.0 1.1 0.9 1.0 1.0 1.0 0.9
Education 1.5 1.1 0.8 1.0 1.2 1.1 1.0 0.8 0.6 0.6 0.7 0.7 0.9
Health 0.4 0.4 0.3 0.6 0.6 0.6 0.5 0.3 0.2 0.2 0.2 0.3 0.3
Subsidies 0.01 0.01 0.74 0.94 0.93 0.61 0.71 0.75 0.72 0.89 0.88 0.43 0.47
Interest on foreign debt
Interest on domestic debt
(Components of ADP Expenditure as % of GDP)
ADP Expenditure 5.6 5.3 3.9 7.3 8.5 8.7 8.5 7.4 7.3 6.6 6.6 6.1 5.6
Agriculture 0 0 0 0 0 0 0 0 0 0 0 0 0
Education 0 0 0 0 0 0 0 0 0 0 0 0 0
Health & Population 0 0 0 0 0 0 0 0 0 0 0 0 0
Power, Oil & Gas 0 0 0 0 0 0 0 0 0 0 0 0 0
Transport & communication
0 0 0 0 0 0 0 0 0 0 0 0 0
Rural Development & Institution
0 0 0 0 0 0 0 0 0 0 0 0 0
Nominal GDP 49.9 75.8 124.4 110.3 116.0 145.2 174.0 280.8 322.1 361.7 408.3 489.8 561.9
Source: Ministry of Finance
3. Expenditure
Table 33: Expenditure Components as Percent of GDP (FY73-FY85)
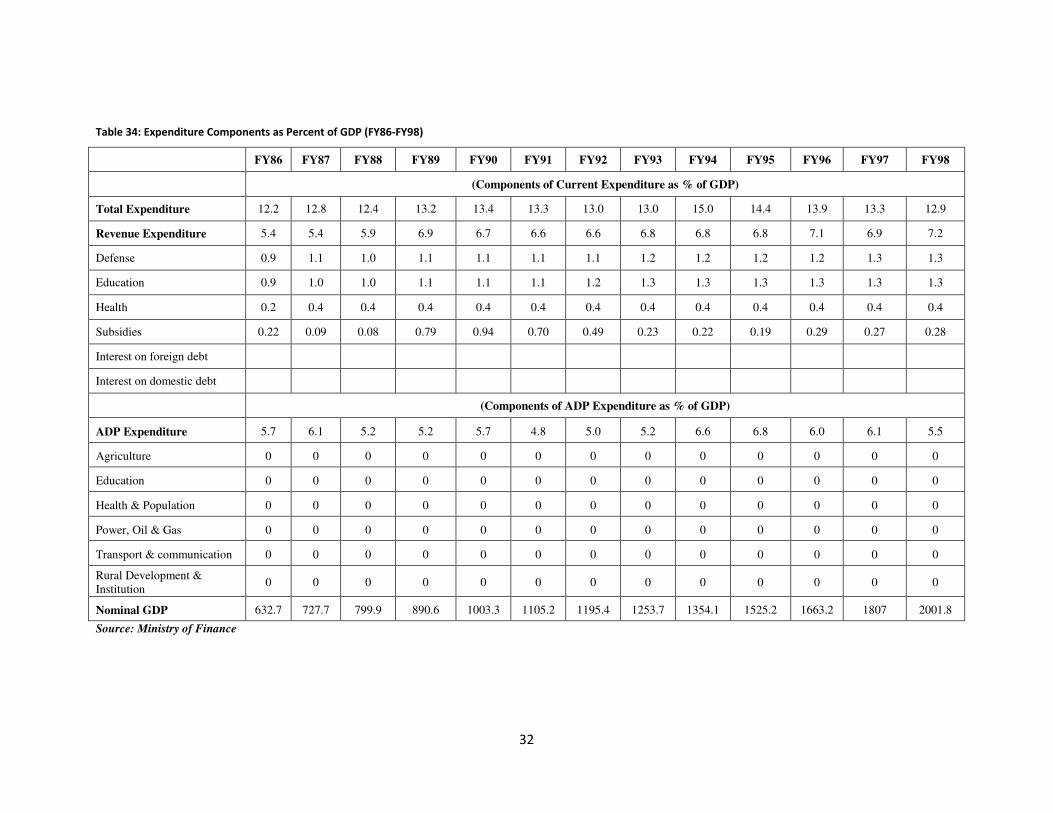
32
Table 34: Expenditure Components as Percent of GDP (FY86-FY98)
FY86 FY87 FY88 FY89 FY90 FY91 FY92 FY93 FY94 FY95 FY96 FY97 FY98
(Components of Current Expenditure as % of GDP)
Total Expenditure 12.2 12.8 12.4 13.2 13.4 13.3 13.0 13.0 15.0 14.4 13.9 13.3 12.9
Revenue Expenditure 5.4 5.4 5.9 6.9 6.7 6.6 6.6 6.8 6.8 6.8 7.1 6.9 7.2
Defense 0.9 1.1 1.0 1.1 1.1 1.1 1.1 1.2 1.2 1.2 1.2 1.3 1.3
Education 0.9 1.0 1.0 1.1 1.1 1.1 1.2 1.3 1.3 1.3 1.3 1.3 1.3
Health 0.2 0.4 0.4 0.4 0.4 0.4 0.4 0.4 0.4 0.4 0.4 0.4 0.4
Subsidies 0.22 0.09 0.08 0.79 0.94 0.70 0.49 0.23 0.22 0.19 0.29 0.27 0.28
Interest on foreign debt
Interest on domestic debt
(Components of ADP Expenditure as % of GDP)
ADP Expenditure 5.7 6.1 5.2 5.2 5.7 4.8 5.0 5.2 6.6 6.8 6.0 6.1 5.5
Agriculture 0 0 0 0 0 0 0 0 0 0 0 0 0
Education 0 0 0 0 0 0 0 0 0 0 0 0 0
Health & Population 0 0 0 0 0 0 0 0 0 0 0 0 0
Power, Oil & Gas 0 0 0 0 0 0 0 0 0 0 0 0 0
Transport & communication 0 0 0 0 0 0 0 0 0 0 0 0 0
Rural Development & Institution
0 0 0 0 0 0 0 0 0 0 0 0 0
Nominal GDP 632.7 727.7 799.9 890.6 1003.3 1105.2 1195.4 1253.7 1354.1 1525.2 1663.2 1807 2001.8
Source: Ministry of Finance

33
Table 35: Expenditure Components as Percent of GDP (FY99-FY09)
FY99 FY00 FY01 FY02 FY03 FY04 FY05 FY06 FY07 FY08 FY09 FY10
(Components of Current Expenditure as % of GDP)
Total Expenditure 13.6 14.5 14.8 14.9 14.5 14.8 15.0 14.7 14.1 17.2 15.3
Revenue Expenditure 7.6 7.8 8.1 8.3 8.4 8.6 9.4 9.2 9.6 10.6 11.0
Defense 1.3 1.4 1.3 1.2 1.1 1.1 1.1 1.1 1.1 1.1 1.0
Education 1.4 1.4 1.4 1.4 1.3 1.3 1.4 1.5 1.7 1.6 1.4
Health 0.4 0.4 0.4 0.5 0.4 0.4 0.5 0.5 0.6 0.5 0.6
Subsidies 0.20 0.25 0.21 0.25 0.49 0.40 0.58 0.42 0.67 1.09 1.09
Interest on foreign debt
Interest on domestic debt
(Components of ADP Expenditure as % of GDP)
ADP Expenditure 5.7 6.5 6.4 5.2 5.1 5.1 5.1 4.6 3.8 3.1 3.2
Agriculture 0 0 0 0.2 0.2 0.2 0.2 0.2 0.2 0.2 0.2
Education 0 0 0 0.7 0.8 0.6 0.5 0.6 0.6 0.5 0.5
Health & Population 0 0 0 0.4 0.4 0.4 0.4 0.4 0.4 0.4 0.3
Power, Oil & Gas 0 0 0 0.8 1.0 1.1 1.1 0.1 0.6 0.5 0.4
Transport & communication 0 0 0 0.8 1.0 1.1 1.1 0.1 0.6 0.5 0.4
Rural Development & Institution 0 0 0 0.4 0.4 0.4 0.4 0.4 0.4 0.4 0.3
Nominal GDP 2197 2370.9 2535.5 2732 3005 3329.7 3707.1 4157.3 4724.8 5458.2 6149.4
Source: Ministry of Finance

34
Table 36: Expenditure Components
Description FY05 FY06 FY07 FY08 FY09 FY10 FY11(B)
( In Crore Taka)
1. President 0 0 0 0 0 0 0.0
2. National Parliament 5.4 12.9 8.4 6.6 0.1 0.6 1.0
3. Prime Minister 173.3 185.9 206.9 140.4 105.8 164.2 87.0
4. Cabinet Division 0.1 0.1 0.3 0.1 2 0.3 7.0
5. Election Commission 1.9 0.6 6.5 332.1 99.7 104 301.0
6. Ministry of Establishment 52.2 81 36.9 107.5 59 59.2 114.0
7. Public Service Commission 0 3.7 9.2 2 0.4 1.2 1.0
8. Finance Division-loans and advances, except repayment of domestic loan & investment
140 154.1 95.4 105.3 115.2 140.4 254.0
9. Internal Resources Division 0 0 0 4.5 39.6 21.3 36.0
10. Economic Relations Division 1 0.9 2.7 20.3 5.6 4.1 15.0
11. Planning Division 13.6 46 31.7 51.5 55.6 62.3 1654.0
12. IMED 5.6 6.7 6.9 12.1 17.6 29.5 182.0
13. Ministry of Foreign Affairs 0 0 0 0 0 0 7.0
14. Tax Ombudsman Office 0 0 0 0 0 0 0.0
15. Local Government Division 4185.3 3803.3 4668.3 4290.2 4855.7 6295.2 8178.0
16. Rural Development and Cooperatives Division 93.2 144.2 150.4 243.6 249.4 385.4 469.0
17. Ministry of Chittagong Hill tracts Affairs 155.7 207.3 173 150.5 311 382 357.0
18. Ministry of Defense 45.2 31.5 28.8 130.3 82.1 55.2 226.0
19. Ministry of Law and Justice 55 42.8 24.9 18.6 30.9 32.7 29.0
20. Supreme Court 0 0 0 0 0 0 0.0
21. Ministry of Home Affairs 103.9 133.5 178.2 132.4 257.4 494 316.0
22. Anticorruption Commission 0 0 0 1.7 1.4 0.2 0.0
21. Ministry of Primary and Mass Education 836.1 1604.4 1719.1 1740.9 1848.5 3299.3 3207.0
22. Ministry of Education 1081.1 933.6 927.3 903.9 937.2 1572.6 1686.0
23. Ministry of Science and Technology 60.7 46 66.2 102.1 105 116.9 170.0
24. Ministry of Health and Family Welfare 1136 885.9 1502.6 1760.1 1832.4 2374.8 3473.0
25. Ministry of Social Welfare 54.2 50.6 51.5 41.1 54.8 73.8 235.0
26. Ministry of Women and Children Affairs 61.5 75.5 67.3 78 113.5 152.7 209.0

35
Description FY05 FY06 FY07 FY08 FY09 FY10 FY11(B)
( In Crore Taka)
27. Ministry of Food and Disaster Management 520.1 428 138 626.3 1439.2 1574.7 539.0
28. Ministry of Liberation Affairs 48.3 60.5 6.4 9 4.8 6.2 29.0
29. Ministry of Housing and Public Works 82.9 69.9 34.8 167.8 324.5 537.1 479.0
30. Ministry of Information 22.2 14.1 20.1 47.2 11.9 68.7 105.0
31. Ministry of Cultural Affairs 29.2 36.5 39.6 33.2 59.8 49.3 128.0
32. Ministry of Religious Affairs 37.5 53.8 94.8 107.5 118.4 181.6 137.0
33. Ministry of Youth and Sports 125.5 189.1 82.9 49.8 28 111.4 268.0
34. Energy and Mineral Resources Division 873.9 327.3 253.4 324.6 214.3 1448.1 1080.0
35. Power Division 3029.4 3463.6 3536.4 2505.2 2211.6 2903.3 4995.0
36. Ministry of Agriculture 485.4 614.3 617 634.8 650.6 834.9 1054.0
37. Ministry of Fisheries and Livestock 166.1 139.8 104.2 138.5 150.7 297.3 373.0
38. Ministry of Environment and Forest 126.1 140.8 86.3 83.5 60.7 59.3 243.0
39. Ministry of Land 51.6 10.8 18.2 13.6 27.7 87.3 99.0
40. Ministry of Water Resources 713.8 730.7 597.5 656.3 711.9 1061 1407.0
41. Ministry of Industries 437 203.3 252.4 140.2 295.2 424.1 475.0
42. Ministry of Textile and Jute 29.1 23.1 11.3 23.6 26.8 44.9 103.0
43.Ministry of Commerce 23.6 50 94.4 64.6 77.2 78.6 123.0
44. Ministry of Labour and Manpower 71.7 86.2 58.4 56.1 80 30.9 33.0
45. Ministry of Expatriate Welfare & employment 0 0 0 16.7 15 2.1 85.0
46. Ministry of Communication 3119.7 2326.3 2590.8 1920.6 1656.2 2571.8 4679.0
47. Ministry of Shipping 36 100.5 80.2 60.4 86.1 155.5 409.0
48. Ministry Civil Aviation and Tourism 33.7 85.1 28.1 16.3 23.2 8.4 283.0
49 Ministry of Post and Telecommunication 1040.7 301.1 400.3 198.4 136.3 141.6 160.0
Total ADP Expenditures 19364.5 17905.3 19108 18270 19590 26200 34801
Source: Ministry of Finance

36
Table 37: Debt Components as % of GDP (FY73-FY86)
Fiscal Year FY73 FY74 FY75 FY76 FY77 FY78 FY79 FY80 FY81 FY82 FY83 FY84 FY85 FY86
Variables/Items (In billions of taka or otherwise indicated)
Total Public Debt 15.15 20.94 29.76 39.50 50.95 62.09 77.50 92.28 110.93 142.00 172.98 200.36 233.68
of Which:
External Debt (in Usd) 0.1 0.5 1.0 1.6 1.8 2.8 3.2 3.4 4.4 5.0 5.5 5.9 6.3 7.4
External Debt (in TK) 0.5 4.0 8.6 23.7 28.2 42.1 48.6 52.7 71.3 99.5 129.7 148.2 163.1 222.3
Domestic Debt 11.16 12.30 6.02 11.30 8.88 13.49 24.83 21.02 11.43 12.27 24.79 37.28 11.39
(As % of GDP): (% of GDP)
Total Public Debt … 20.00 16.84 26.97 34.05 35.09 35.68 27.60 28.65 30.67 34.78 35.32 35.65 36.93
of Which:
External Debt … 5.27 6.95 21.52 24.31 28.98 27.93 18.76 22.12 27.51 31.77 30.26 29.02 35.13
Domestic Debt … 14.73 9.89 5.45 9.74 6.12 7.75 8.84 6.52 3.16 3.00 5.06 6.63 1.80
Nominal GDP 49.9 75.8 124.4 110.3 116.0 145.2 174.0 280.8 322.1 361.7 408.3 489.8 561.9 632.7
Source: External Resource Division, ministry of finance, Bangladesh
Table 38: Debt Components as % of GDP (FY87-FY98)
Fiscal Year FY87 FY88 FY89 FY90 FY91 FY92 FY93 FY94 FY95 FY96 FY97 FY98
Variables/Items (In billions of taka or otherwise indicated)
Total Public Debt 275.20 316.78 371.50 432.86 492.42 540.31 578.44 645.27 709.72 774.61 836.21 896.61
of Which:
External Debt (in US$) 8.4 9.5 9.9 10.6 12.7 13.3 13.6 15.4 16.8 15.2 15.0 14.0
External Debt (in TK) 256.2 296.0 317.5 349.3 453.6 508.5 532.9 614.9 674.0 619.3 641.6 637.9
Domestic Debt 19.02 20.83 53.99 83.60 38.85 31.84 45.56 30.34 35.68 155.28 194.63 258.72
(As % of GDP): (% of GDP)
Total Public Debt 37.82 39.60 41.71 43.14 44.56 45.20 46.14 47.65 46.53 46.57 46.28 44.79
of Which:
External Debt 35.20 37.00 35.65 34.81 41.04 42.54 42.50 45.41 44.19 37.24 35.51 31.87
Domestic Debt 2.61 2.60 6.06 8.33 3.51 2.66 3.63 2.24 2.34 9.34 10.77 12.92
Nominal GDP 727.7 799.9 890.6 1003.3 1105.2 1195.4 1253.7 1354.1 1525.2 1663.2 1807.0 2001.8
Source: External Resource Division, ministry of finance, Bangladesh
4. Debt

37
Table 39: Debt Components as % of GDP (FY99-FY09)
Fiscal Year FY99 FY00 FY01 FY02 FY03 FY04 FY05 FY06 FY07 FY08 FY09 FY10
Variables/Items (In billions of taka or otherwise indicated)
Total Public Debt 983.02 1104.21 1211.20 1314.24 1415.16 1540.22 1683.53 1821.17 1960.50 2233.65 2443.50
of Which:
External Debt (in US$)
14.8 16.2 15.1 16.3 17.4 18.5 19.3 19.4 20.7 21.3 21.9
External Debt (in TK)
713.4 815.6 813.4 934.8 1008.1 1091.0 1184.0 1302.7 1429.9 1460.8 1503.4
Domestic Debt 269.60 288.62 397.82 379.43 407.06 449.27 499.49 518.48 530.64 772.84 940.12
(As % of GDP): (% of GDP)
Total Public Debt 44.74 46.57 47.77 48.11 47.09 46.26 45.41 43.81 41.49 40.92 39.74
of Which:
External Debt 32.47 34.40 32.08 34.22 33.55 32.76 31.94 31.33 30.26 26.76 24.45
Domestic Debt 12.27 12.17 15.69 13.89 13.55 13.49 13.47 12.47 11.23 14.16 15.29
Nominal GDP 2197.0 2370.9 2535.5 2732.0 3005.0 3329.7 3707.1 4157.3 4724.8 5458.2 6149.4
Source: External Resource Division, ministry of finance, Bangladesh

38
Table 40: Monetary Development
(Billion taka)
Source:Bangladesh Bank
5. Money and Prices
Period Reserve Money M1 (Narrow
Money) M2 (Broad Money)
1973-74 3.1 7.5 12.4
1974-75 3.7 8.0 12.6
1975-76 4.2 8.8 14.0
1976-77 3.9 9.7 17.4
1977-78 4.3 12.2 21.4
1978-79 5.2 15.2 27.6
1979-80 6.8 17.3 32.4
1980-81 8.4 19.9 41.4
1981-82 14.3 20.1 45.5
1982-83 19.1 26.3 59.0
1983-84 25.9 35.5 83.9
1984-85 29.4 42.3 105.3
1985-86 31.5 49.3 123.4
1986-87 46.0 52.6 143.5
1987-88 51.0 50.5 164.1
1988-89 56.9 54.6 190.8
1989-90 59.5 63.7 223.0
1990-91 59.4 72.0 250.0
1991-92 71.9 82.6 285.3
1992-93 89.4 90.6 315.4
1993-94 113.1 111.7 364.0
1994-95 106.3 131.8 422.7
1995-96 110.0 144.6 457.6
1996-97 123.9 151.7 507.1
1997-98 136.2 158.9 558.7
1998-99 147.4 172.5 630.3
1999-00 170.6 198.8 747.6
2000-01 189.3 223.5 871.7
2001-02 235.3 241.6 986.2
2002-03 243.1 267.4 1139.9
2003-04 262.6 305.0 1297.7
2004-05 295.5 355.5 1515.9
2005-06 378.6 431.3 1811.6
2006-07 445.6 506.5 2119.9
2007-08 527.9 593.1 2487.9
2008-09 693.9 664.3 2971.3
2009-10 805.1 879.9 3630.3

39
Table 41: Monetary Development
(Annual Percentage Change)
Period Reserve Money
M1 (Narrow Money)
M2 (Broad Money)
1974-75 18.1 7.2 1.2
1975-76 12.9 10.4 10.9
1976-77 -6.2 10.3 24.5
1977-78 9.8 25.8 23.0
1978-79 20.4 24.6 28.9
1979-80 30.8 13.6 17.6
1980-81 24.0 14.7 27.5
1981-82 69.3 1.3 10.0
1982-83 34.1 30.9 29.7
1983-84 35.2 34.8 42.2
1984-85 13.8 19.2 25.6
1985-86 7.1 16.4 17.1
1986-87 45.8 6.8 16.3
1987-88 10.9 -4.1 14.3
1988-89 11.5 8.2 16.3
1989-90 4.6 16.6 16.9
1990-91 -0.1 13.1 12.1
1991-92 20.9 14.6 14.1
1992-93 24.5 9.8 10.6
1993-94 26.4 23.2 15.4
1994-95 -6.0 18.0 16.1
1995-96 3.5 9.7 8.3
1996-97 12.6 4.9 10.8
1997-98 9.9 4.8 10.2
1998-99 8.3 8.6 12.8
1999-00 15.7 15.3 18.6
2000-01 10.9 12.4 16.6
2001-02 24.3 8.1 13.1
2002-03 3.3 10.7 15.6
2003-04 8.0 14.0 13.8
2004-05 12.5 16.5 16.8
2005-06 28.1 21.3 19.5
2006-07 17.7 17.4 17.0
2007-08 18.5 17.1 17.4
2008-09 31.4 12.0 19.4
2009-10 16.0 32.5 22.2
Source: Bangladesh Bank

40
Table 42: Domestic Credit Development
(Billion taka)
Period Domestic Credit
Claims on Public Sector
Claims on Private Sector
1973-74 13.4 10.2 3.2
1974-75 15.0 12.1 2.9
1975-76 17.6 14.1 3.5
1976-77 19.8 14.7 5.2
1977-78 24.7 17.5 7.2
1978-79 30.2 20.9 9.3
1979-80 39.5 25.5 14.0
1980-81 52.7 35.1 17.6
1981-82 64.6 41.0 23.6
1982-83 71.7 40.7 31.0
1983-84 95.4 46.2 49.1
1984-85 121.1 52.2 68.9
1985-86 141.8 58.3 83.6
1986-87 153.1 63.3 89.7
1987-88 169.7 60.8 109.0
1988-89 192.6 59.0 133.6
1989-90 230.3 70.3 160.0
1990-91 253.7 75.5 178.2
1991-92 272.1 92.7 179.4
1992-93 292.7 99.6 193.2
1993-94 307.0 97.2 209.7
1994-95 360.9 95.2 265.6
1995-96 434.5 117.9 316.6
1996-97 494.0 138.9 355.0
1997-98 599.7 157.6 442.1
1998-99 687.0 175.7 511.2
1999-00 778.2 213.0 565.2
2000-01 910.5 253.9 656.6
2001-02 1024.0 278.4 745.5
2002-03 1106.5 266.2 840.3
2003-04 1267.9 309.2 958.7
2004-05 1488.4 368.2 1120.2
2005-06 1790.9 467.7 1323.2
2006-07 2056.7 535.0 1521.8
2007-08 2486.8 585.4 1901.4
2008-09 2885.5 706.2 2179.3
2009-10 3401.8 694.2 2707.6
Source: Bangladesh Bank
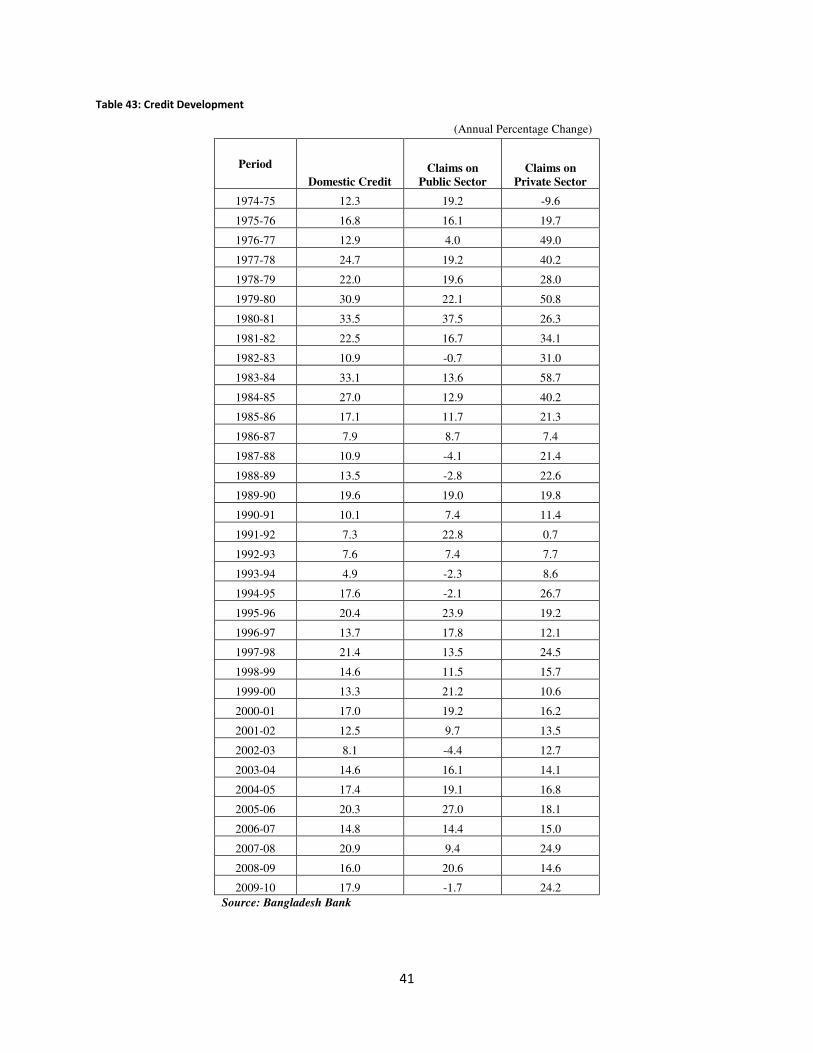
41
Table 43: Credit Development
(Annual Percentage Change)
Period
Domestic Credit Claims on
Public Sector Claims on
Private Sector
1974-75 12.3 19.2 -9.6
1975-76 16.8 16.1 19.7
1976-77 12.9 4.0 49.0
1977-78 24.7 19.2 40.2
1978-79 22.0 19.6 28.0
1979-80 30.9 22.1 50.8
1980-81 33.5 37.5 26.3
1981-82 22.5 16.7 34.1
1982-83 10.9 -0.7 31.0
1983-84 33.1 13.6 58.7
1984-85 27.0 12.9 40.2
1985-86 17.1 11.7 21.3
1986-87 7.9 8.7 7.4
1987-88 10.9 -4.1 21.4
1988-89 13.5 -2.8 22.6
1989-90 19.6 19.0 19.8
1990-91 10.1 7.4 11.4
1991-92 7.3 22.8 0.7
1992-93 7.6 7.4 7.7
1993-94 4.9 -2.3 8.6
1994-95 17.6 -2.1 26.7
1995-96 20.4 23.9 19.2
1996-97 13.7 17.8 12.1
1997-98 21.4 13.5 24.5
1998-99 14.6 11.5 15.7
1999-00 13.3 21.2 10.6
2000-01 17.0 19.2 16.2
2001-02 12.5 9.7 13.5
2002-03 8.1 -4.4 12.7
2003-04 14.6 16.1 14.1
2004-05 17.4 19.1 16.8
2005-06 20.3 27.0 18.1
2006-07 14.8 14.4 15.0
2007-08 20.9 9.4 24.9
2008-09 16.0 20.6 14.6
2009-10 17.9 -1.7 24.2
Source: Bangladesh Bank

42
Table 44: Interest Rates
(Percentage per annum)
Period Commercial
Lending Rate (%)
Deposit Interest Rate (%) (Three months to less
than six months)
Bank Rate
1974-75 11.28 3.51 8.00
1975-76 11.62 4.23 8.00
1976-77 11.03 4.32 8.00
1977-78 10.66 4.22 8.00
1978-79 11.12 4.27 8.00
1979-80 11.04 4.31 10.50
1980-81 13.07 6.98 10.50
1981-82 13.53 7.29 10.50
1982-83 13.55 7.36 10.50
1983-84 13.75 8.11 10.50
1984-85 14.5 8.13 11.25
1985-86 14.66 8.54 10.75
1986-87 14.7 8.59 10.75
1987-88 14.66 8.69 10.75
1988-89 14.68 8.88 10.75
1989-90 14.83 9.06 9.75
1990-91 14.99 9.11 9.25
1991-92 15.12 8.11 8.50
1992-93 14.39 6.51 6.00
1993-94 12.78 5.34 5.50
1994-95 12.22 4.86 6.00
1995-96 13.41 6.11 7.00
1996-97 13.69 6.67 8.00
1997-98 12.96 8.93 8.00
1998-99 13.09 9.54 7.00
1999-00 13.03 8.64 7.00
2000-01 12.62 8.85 7.00
2001-02 13.02 9.12 6.00
2002-03 12.24 7.51 5.00
2003-04 11.16 6.38 5.00
2004-05 10.52 5.51 5.00
2005-06 11.06 5.77 5.00
2006-07 12.28 6.51 5.00
2007-08 12.63 7.23 5.00
2008-09 13.36 7.97 5.00
2009-10 12.75 7.34 5.00
Source: Bangladesh Bank

43
Table 45: Average Exchange Rate
Period Taka per US Dollar
1971/72 7.30
1972/73 7.88
1973/74 7.97
1974/75 8.88
1975/76 15.05
1976/77 15.43
1977/78 15.12
1978/79 15.22
1979/80 15.49
1980/81 16.26
1981/82 20.07
1982/83 23.80
1983/84 24.94
1984/85 25.96
1985/86 29.89
1986/87 30.63
1987/88 31.24
1988/89 32.14
1989/90 32.92
1990/91 35.68
1991/92 38.15
1992/93 39.14
1993/94 40.00
1994/95 40.20
1995/96 40.84
1996/97 42.70
1997/98 45.46
1998/99 48.06
1999/00 50.31
2000/01 53.96
2001/02 57.43
2002/03 57.90
2003/04 58.94
2004/05 61.39
2005/06 67.08
2006/07 69.03
2007/08 68.60
2008/09 68.72
2009/10 69.40
Source: Economic Review, Ministry of Finance.

44
Table 46: Yearly Average Consumer Price Index (CPI)
(1995/96=100)
National Urban Rural
Period General
Food,
beverage
& tobacco
Non-food General
Food,
beverage
& tobacco
Non-food General
Food,
beverage &
tobacco
Non-food
1971/72 6.82
1972/73 10.17
1973/74 15.74
1974/75 19.15
1975/76 19.63
1976/77 20.53
1977/78 21.61
1978/79 24.78
1979/80 28.13
1980/81 32.68
1981/82 36.75
1982/83 40.22
1983/84 44.47
1984/85 49.20
1985/86 54.64
1986/87 59.85 61.04 57.88
1987/88 63.66 65.24 60.99
1988/89 69.01 70.67 66.20
1989/90 71.67 72.46 70.44
1990/91 77.63 78.31 76.59
1991/92 81.17 81.58 80.63
1992/93 83.39 83.10 84.11
1993/94 86.12 85.55 87.40
1994/95 93.76 93.49 94.54
1995/96 100.00 100.00 100.00 100.00 100.00 100.00 100.00 100.00 100.00
1996/97 103.96 103.67 104.47 104.50 104.53 104.46 103.74 103.32 104.47
1997/98 112.96 114.51 110.73 112.08 114.00 110.25 113.31 114.72 110.93
1998/99 120.94 125.16 115.10 119.41 125.55 113.56 121.57 125.00 115.73
1999/00 124.31 128.52 118.64 123.82 130.68 117.29 124.58 127.63 119.19
2000/01 126.72 130.30 122.25 125.70 133.15 118.61 127.21 129.13 123.75
2001/02 130.26 132.43 127.89 129.92 135.93 124.19 130.48 130.99 129.41
2002/03 135.97 137.01 135.13 134.48 138.77 130.40 136.58 136.29 137.06
2003/04 143.90 146.50 141.03 142.54 149.61 135.81 144.47 145.22 143.18
2004/05 153.23 158.08 147.14 151.29 161.14 141.90 154.03 156.82 149.29
2005/06 164.21 170.34 156.56 161.39 174.18 149.20 165.37 168.77 159.59
2006/07 176.04 184.16 165.79 172.72 189.03 157.17 177.41 182.16 169.33
2007/08 193.54 206.78 176.26 189.65 213.73 166.69 195.14 203.93 180.19
2008/09 206.43 221.64 186.67 201.49 229.60 174.69 208.46 218.38 191.59
2009/10 221.53 240.55 196.84 217 251.59 183.17 222.98 235.28 202.06
Source: Bangladesh Bureau of Statistics

45
Table 47: Nominal Wage Rate Indices
(1969-70=100)
Year General Manufacturing
Industry Construction Agriculture
1969-70 100.0 100.0 100.0 100.0
1970-71 105.3 107.3 102.1 105.1
1971-72 106.5 109.6 108.4 99.7
1972-73 130.7 134.4 132.3 128.8
1973-74 173.1 161.2 201.1 185.6
1974-75 221.3 192.4 263.7 261.4
1975-76 244.0 204.9 305.3 279.2
1976-77 252.1 222.4 310.8 267.7
1977-78 279.8 251.3 333.9 311.6
1978-79 321.2 294.3 393.3 342.1
1979-80 432.9 389.0 491.7 443.3
1980-81 492.1 452.3 544.6 482.0
1981-82 566.2 515.3 616.3 566.9
1982-83 598.0 558.0 677.0 558.0
1983-84 684.0 721.0 755.0 572.0
1984-85 734.0 776.0 775.0 642.0
1985-86 895.0 958.0 938.0 767.0
1986-87 1085.0 1154.0 1122.0 941.0
1987-88 1201.0 1220.0 1326.0 1049.0
1988-89 1288.0 1325.0 1452.0 1115.0
1989-90 1426.0 1502.0 1475.0 1245.0
1990-91 1482.0 1575.0 1487.0 1321.0
1991-92 1553.0 1641.0 1512.0 1425.0
1992-93 1638.0 1724.0 1579.0 1523.0
1993-94 1709.0 1828.0 1598.0 1593.0
1994-95 1786.0 1947.0 1613.0 1653.0
1995-96 1900.0 2064.0 1754.0 1738.0
1996-97 1989.0 2161.0 1848.0 1804.0
1997-98 2141.0 2395.0 1990.0 1870.0
1998-99 2259.0 2522.0 2163.0 1950.0
1999-00 2390.0 2702.0 2286.0 2037.0
2000-01 2489.0 2832.0 2356.0 2141.0
2001-02 2637.0 3035.0 2444.0 2262.0
2002-03 2926.0 3501.0 2624.0 2443.0
2003-04 3111.0 3765.0 2669.0 2582.0
2004-05 3293.0 4015.0 2758.0 2719.0
2005-06 3906.0 4293.0 2889.0 2925.0
2006-07 3779.0 4636.0 3135.0 3156.0
2007-08 4227.0 5197.0 3549.0 3524.0
2008-09 5025.7 6128.4 4311.3 4273.7
Source: Bangladesh Bureau of Statistics
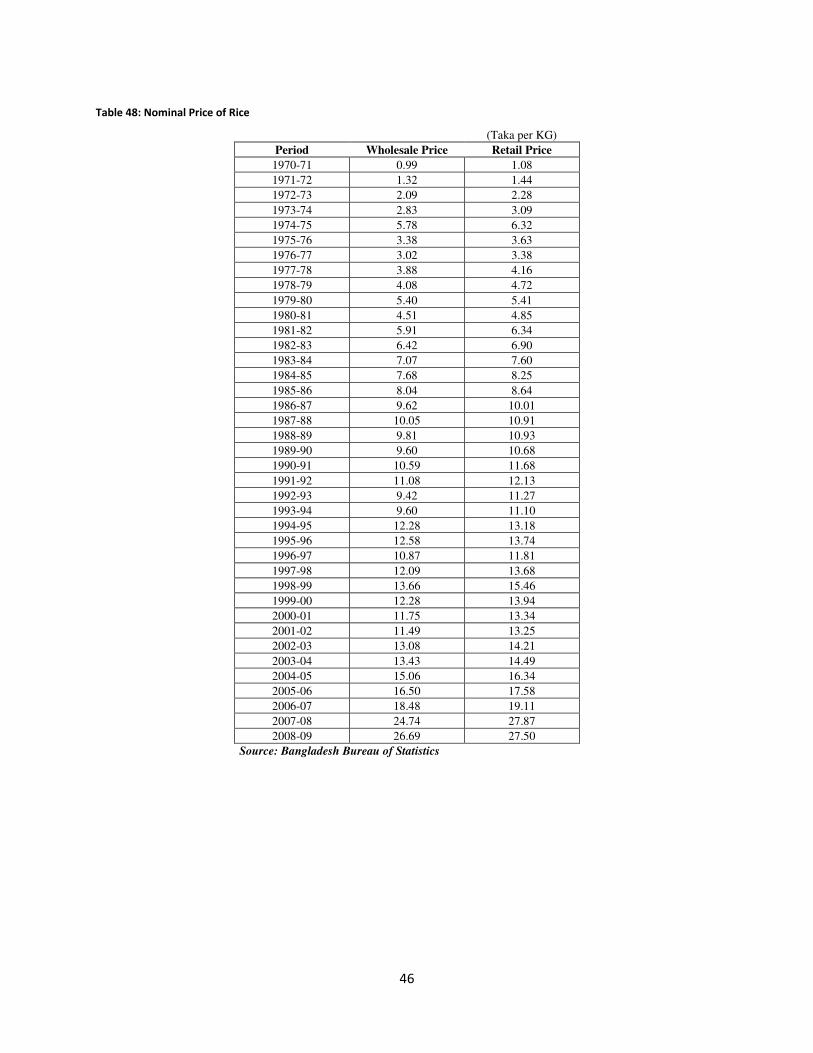
46
Table 48: Nominal Price of Rice
(Taka per KG)
Period Wholesale Price Retail Price
1970-71 0.99 1.08
1971-72 1.32 1.44
1972-73 2.09 2.28
1973-74 2.83 3.09
1974-75 5.78 6.32
1975-76 3.38 3.63
1976-77 3.02 3.38
1977-78 3.88 4.16
1978-79 4.08 4.72
1979-80 5.40 5.41
1980-81 4.51 4.85
1981-82 5.91 6.34
1982-83 6.42 6.90
1983-84 7.07 7.60
1984-85 7.68 8.25
1985-86 8.04 8.64
1986-87 9.62 10.01
1987-88 10.05 10.91
1988-89 9.81 10.93
1989-90 9.60 10.68
1990-91 10.59 11.68
1991-92 11.08 12.13
1992-93 9.42 11.27
1993-94 9.60 11.10
1994-95 12.28 13.18
1995-96 12.58 13.74
1996-97 10.87 11.81
1997-98 12.09 13.68
1998-99 13.66 15.46
1999-00 12.28 13.94
2000-01 11.75 13.34
2001-02 11.49 13.25
2002-03 13.08 14.21
2003-04 13.43 14.49
2004-05 15.06 16.34
2005-06 16.50 17.58
2006-07 18.48 19.11
2007-08 24.74 27.87
2008-09 26.69 27.50
Source: Bangladesh Bureau of Statistics

47
Table 49: Balance of Payments of Bangladesh
Items FY 98 FY 99 FY 00 FY 01 FY 02 FY 03 FY 04 FY 05 FY 06 FY 07 FY 08 FY 09 FY 10
Trade balance -1669 -1934 -1865 -2011 -1768 -2215 -2319 -3297 -2889 -3458 -5541 -4708 -5152 Export f.o.b.(including EPZ) 5103 5283 5701 6419 5929 6492 7521 8573 10412 12053 13945 15583 16236 Import f.o.b (including EPZ) -6772 -7217 -7566 -8430 -7697 -8707 -9840 -11870 -13301 -15511 -19486 -20291 -21388
Services -570 -603 -645 -914 -499 -691 -874 -870 -1023 -1255 -1525 -1621 -1237 Receipts 707 707 849 759 865 887 924 1177 1340 1484 1879 1832 2471 Payments -1277 -1310 -1494 -1673 -1364 -1578 -1798 -2047 -2363 -2739 -3404 -3453 -3708
Income -100 -135 -302 -344 -402 -358 -374 -680 -702 -905 -1005 -1361 -1487 Receipts 91 91 97 97 50 64 63 116 136 244 221 95 52 Payments -191 -226 -399 -441 -452 -422 -437 -796 -838 -1149 -1226 -1456 -1539 Of which : Official interest payments
-161 -167 -175 -203 -201 -212 -234 -238 -213
Current transfers 1876 2195 2394 2171 2826 3440 3743 4290 5438 6554 8743 10226 11610 Official transfers 126 220 165 72 69 82 61 37 125 97 127 72 122 Private transfers 1750 1975 2229 2099 2757 3358 3682 4253 5313 6457 8616 10154 11488 Of which : Workers' remittances 1525 1706 1949 1882 2847.658 3062 3372 3848 4802 5979 7915 9689 10987
Current Account Balance -463 -477 -418 -1098 157 176 176 -557 824 936 672 2536 3734
Financial and Capital Account 605 17 445 1114 801 841 165 947 234 1252 145 -357 -869
Capital account 445 387 561 432 410 428 196 163 375 490 576 451 442 Capital transfers 445 387 561 432 410 428 196 163 375 490 576 451 442
Financial account 160 -370 -116 682 391 413 -31 784 -141 762 -431 -808 -1311 Foreign direct investment (net) 249 198 383 550 391 376 276 800 743 793 650 941 636
Portfolio investment 3 -6 0 0 -6 2 6 0 32 106 48 -159 -117 Medium and Long Term loans 659 780 933 777 298 466 147 491 535 512 758 563 914
Disbursement 706 821 806 790 733 918 544 940 1023 1037 1338 1204 1601 Amortization -47 -41 127 -13 -435 -452 -397 -449 -488 -525 -580 -641 -687
Other Capital -751 -1342 -1432 -645 -292 -431 -460 -507 -1451 -649 -1887 -2153 -2188 o/w Short-term oil import credit (net)
-41 -58 -190 -114 63 142 13 241 -256 493 -160 -169 205
o/w Trade credits (net) 29 -61 -276 114 -253 -499 -321 -320 -898 -481 -1010 -1280 -1045 o/w Commercial banks (net) -90 -31 -161 147 27 71 14 -200 235 -102 -133 26 -315
Errors and omissions -88 267 152 -297 -550 -202 -170 -323 -720 -695 -213 -121 -556
Overall Balance 54 -193 179 -281 408 815 171 67 338 1493 604 2058 2865
Source: Bangladesh Bank
6. Balance of Payments

48
B. Poverty and Social Safety Net Block
Table 50: Incidence of poverty
Numbers of Population with Daily Calorie Intake/Person (Millions)
YEAR 1973 1981 1983 1985 1988 1991 1995 2000 2005
2122 calories
Rural 57.4 60.9 47.0 44.2 40.5 44.8 45.7 42.6 41.2
Urban 5.6 6.4 7.1 7.0 10.8 6.8 9.6 13.2 14.8
National 63.0 67.3 54.1 51.2 51.3 51.6 55.3 55.9 56.0
1805 calories
Rural 30.7 43.1 31.3 19.1 24.9 26.6 23.9 18.9 18.7
Urban 2.0 3.0 3.8 2.4 5.0 3.8 5.2 6.3 8.3
National 32.7 46.1 35.1 21.5 29.9 30.4 29.1 25.2 27.0
Percentage of Population with Daily Calorie Intake/Person
YEAR 1973 1981 1983 1985 1988 1991 1995 2000 2005
2122 calories
Rural 83.0 74.0 57.0 51.0 48.0 47.6 47.1 42.3 39.5
Urban 81.0 66.0 66.0 56.0 44.0 46.7 49.7 52.5 43.2
National 92.0 73.0 58.0 52.0 47.0 47.5 47.5 44.3 40.4
1805 calories
Rural 44.0 52.0 38.0 22.0 30.0 28.3 24.6 18.7 17.9
Urban 29.0 31.0 35.0 19.0 21.0 26.3 27.3 25.0 24.4
National 48.0 50.0 38.0 22.0 27.0 30.4 29.1 25.2 27.0
Source: Household Expenditure Survey,2000 BBS;2005-HIES
Table 50-incidence of poverty (contd.)
Head Count Ratio (Cost of Basic Needs Method)
YEAR 1973 1981 1983 1985 1991 1995 2000 2005 2010
Using the Lower Poverty Line
Rural - - - - 43.7 39.4 37.9 28.6 21.1
Urban - - - - 23.6 13.7 20.0 14.6 7.7
National - - - - 41 35.1 34.3 25.1 17.6
Using the Upper Poverty Line
Rural - - - - 58.7 54.5 52.3 43.8 35.16
Urban - - - - 42.7 27.8 35.2 28.4 21.28
National - - - - 56.6 50.1 48.9 40.0 31.50
Source: Household Expenditure Survey,2000 BBS;2005-HIES;2010-HIES
1. Poverty

49
Table 51: Percentile Distribution of Income and Gini Coefficient
1983-84 1985-86 1988-89 1991-92 1995-96 2000 2005
National Total National 100 100 100 100 100 100 100
Lowest 5% 1.17 1.18 1.06 1.03 0.88 0.92 0.77
Decile 1 2.89 2.81 2.64 2.58 2.24 2.4 2
Decile 2 4.31 4.18 4 3.94 3.47 3.75 3.26
Decile 3 5.39 5.13 4.96 4.95 4.46 4.45 4.1
Decile 4 6.36 6.05 5.93 5.94 5.37 5.23 5
Decile 5 7.38 6.98 6.95 7.08 6.35 6.09 5.96
Decile 6 3.56 8.09 8.1 8.45 7.53 7.08 7.17
Decile 7 9.99 9.48 9.61 10 9.15 8.44 8.73
Decile8 11.74 11.25 11.62 12.1 11.35 10.35 11.06
Decile 9 15.08 14.58 15.2 15.64 15.4 13.93 15.07
Decile10 28.3 31.46 31 29.23 34.68 38.14 37.64
Top 10% 18.3 21.35 20.51 18.85 23.62 28.66 26.93
Gini Coeff. 0.36 0.397 0.397 0.388 0.432 0.417 0.467
Rural Total Rural 100 100 100 100 100 100 100
Lowest 5% 1.19 1.23 1.1 1.07 1 1.06 0.88
Decile 1 2.95 2.92 2.74 2.67 2.56 2.77 2.25
Decile 2 4.37 4.3 4.13 4.07 3.93 4.32 3.63
Decile 3 5.46 5.3 5.1 5.1 4.97 5.23 4.54
Decile 4 6.46 6.2 6.05 6.05 5.97 5.95 5.42
Decile 5 7.53 7.16 7.21 7.21 6.98 6.82 6.43
Decile 6 8.67 8.2 8.25 8.57 8.16 7.85 7.63
Decile 7 10.11 9.55 9.69 10.28 9.75 9.07 9.27
Decile 8 11.75 11.3 11.74 12.3 11.87 10.91 11.49
Decile 9 14.81 14.07 15.1 15.71 15.58 14.07 15.43
Decile10 27.89 31 30.08 28.04 30.23 32.95 33.92
Top 5% 18.14 21.36 19.81 17.8 19.73 24.12 23.03
Gini Coeff. 0.35 0.36 0.368 0.364 0.384 0.366 0.428
Urban Total Urban 100 100 100 100 100 100 100
Lowest 5% 1.18 1.2 1.12 1.09 0.74 0.77 0.67
Decile 1 2.82 2.84 2.76 2.64 1.92 1.99 1.8
Decile 2 4.1 4.08 4.05 4.06 3.2 3.05 3.02
Decile 3 5.02 5.09 4.91 5.01 4.06 3.84 3.87
Decile 4 5.93 5.99 5.8 5.88 4.98 4.65 4.61
Decile 5 7 7.04 6.84 6.8 6.97 5.58 5.66
Decile 6 8.34 8.29 7.91 8.11 7.2 6.67 6.78
Decile 7 10.09 10.3 9.42 9.66 8.98 8.24 8.53
Decile 8 12.48 12.24 11.57 11.77 11.35 10.4 10.18
Decile 9 16.39 15.73 15.56 15.64 16.29 13.92 14.48
Decile10 27.83 28.41 31.19 30.43 36.05 41.62 41.08
Top 5% 16.83 18.04 20.02 19.42 24.3 32.4 30.37
Gini Coeff. 0.37 0.37 0.381 0.398 0.444 0.452 0.497
Source: Household Expenditure Survey,2000 BBS;2005-HIES

50
Table 52: Dimensions of poverty by CBN method across regions (in percent)
Poverty line and Region Poverty Gap Squared Poverty Gap
National Rural Urban National Rural Urban
2000 2005 2000 2005 2000 2005 2000 2005 2000 2005 2000 2005
Lower poverty line
National 7.5 4.6 8.3 5.3 4.1 2.6 2.4 1.3 2.6 1.5 1.2 0.7
Barisal 6.9 9.1 7 9.6 4.9 6.4 1.9 3.3 2 3.4 1.6 2.6
Chittagong 5.7 2.2 6.3 2.7 3.6 0.9 1.7 0.5 1.9 0.6 1.1 0.2
Dhaka 8.1 3.5 10.5 4.9 3 1.5 2.6 1 3.5 1.4 0.8 0.3
Khulna 5.6 6.2 5.7 6.3 4.5 5.5 1.4 1.7 1.4 1.7 1.3 1.7
Rajshahi 10.4 6.4 10.5 6.5 7.8 5.5 3.5 1.8 3.6 1.8 2.7 1.6
Sylhet 4.4 3.4 4.4 3.7 4.5 1.9 1.1 0.8 1.1 0.8 1.2 0.5
Upper poverty line
National 12.8 9 13.7 9.8 9.1 6.5 4.6 2.9 4.9 3.1 3.3 2.1
Barisal 13.7 15.5 14.2 16.3 8.3 10.7 4.7 6.3 4.9 6.6 3.1 4.3
Chittagong 11.3 6.3 11.2 6.5 11.4 5.6 3.9 1.7 3.9 1.7 4.2 1.6
Dhaka 12.9 6.9 15.9 8.6 6.6 4 4.7 2.1 6 2.7 2.2 1.1
Khulna 10 10.8 10 10.4 10.3 12.3 3 3.5 2.9 3.2 3.7 4.6
Rajshahi 16.2 11.9 16.5 12 13.6 11.4 6.2 3.8 6.3 3.8 5.4 3.9
Sylhet 9.2 7.2 9 7.6 12.5 4.5 2.8 2.1 2.7 2.2 4.1 1.5
Source: HIES, 2005
Table 53: Gini index of per capita expenditure
1991-92 1995-96 2000 2005 2010
National 0.26 0.31 0.334 0.332 0.321
Urban 0.31 0.37 0.373 0.365 0.338
Rural 0.25 0.27 0.279 0.284 0.275
Source: HIES (different rounds)
Note: 1) Nominal consumption are adjusted for spatial/regional price differences (deflated by Upper PL) to obtain “real” ginis for each year
2) Gini index for year t is half the ratio of mean absolute deviations (MAD) of per capita exp to the mean of the distribution in year t.

51
Table 54: Targeted Agricultural and Specialized Credit Program through Public Sector Banks and Cooperatives
(Taka in Crore)
Year BRDB &
BSBL
Specialized Banks (Agricultural Development
Banks)
State owned commercial Banks
Total public sector targeted credit disbursement
Share of Specialized
Banks
1999-00 408.31 1905.51 537.47 2851.29 66.83
2000-01 251.81 2189.88 577.98 3019.67 72.52
2001-02 313.7 2042.25 598.96 2954.91 69.11
2002-03 354.88 2243.1 680.39 3278.37 68.42
2003-04 502.48 2640.87 905.66 4049.01 65.22
2004-05 665.32 3149.32 1142.14 4956.78 63.54
2005-06 752.12 3551.66 1192.43 5496.21 64.62
2006-07 782.69 3482.02 1027.8 5292.51 65.79
2007-08 740.36 4061.12 1365.5 6166.98 65.85
2008-09 698.99 4703.69 1588.89 6991.57 67.28
Source: Ministry Paper
Table 55: Trend in Number of Employment Abroad and Amount of Remittances
Amount of remittances
Fiscal year Number of
employment abroad ('000)
Million (US $) Percentage
Change Taka in Crore
Percentage Change
1999-00 248 1949.32 14.28 9825.4 19.63
2000-01 213 1882.1 -3.45 10266 4.48
2001-02 195 2503.44 32.81 14390.19 40.17
2002-03 251 3060.31 22.25 17719.58 23.14
2003-04 277 3372.49 10.2 19872.39 12.15
2004-05 250 3848.3 14.11 23646.97 18.99
2005-06 291 4801.88 24.78 32274.6 36.49
2006-07 564 5978.47 24.5 41298.5 27.96
2007-08 981 7914.78 32.39 54293.24 31.47
2008-09 650 9689.16 16.22 66674.87 22.8
Source: Ministry Paper
Table 56: Bangladesh Micro Finance- Operational Outreach
(in million) 2003 2004 2005 2006 2007 2008 Annual average
change
Members 17.75 20.68 24.37 29.00 33.14 35.87 13.77
Borrowers 13.45 15.61 18.96 25.99 29.05 29.28 17.34
MFI branches (No.) 6,837 9,165 9,253 11,368 14,577 14,577 15.38
Source: Background Study by BIDS
2. Social safety net tables

52
Table 57: Financial outreach of the MFIs, 2003-08
(Tk. In billion) 2003 2004 2005 2006 2007 2008 Annual growth
rate
Loans disbursement 60.85 69.16 92.59 124.44 176.45 209.18 26.51
Loans Oustanding (LO) 52.5 64.4 83.7 110.9 138.6 158.8 23.21
Net Savings (NS) 28.9 38.5 52.0 73.1 87.8 104.4 26.39
NS as % of LO 55.1 59.8 62.1 65.9 63.3 65.7
LO/Borrowers (Tk) 4,087 4,231 4345 4536 5106 9.17
NS/Borrowers (Taka) 2324 2615 2275 2926 3296 12.61
Source: Background Study by BIDS
Table 58: Social Protection Programs in Bangladesh, 2009/10
Sl. No. Number of total beneficiaries 93.84 million persons
1. Beneficiaries in terms of man-month 28.71 million
2. Total employment creation 2.385 million
3. Estimated budget for Social Protection: 1732.73 billion
4. Estimated National Budget 11381.9 billion
5. SP budget as percentage of total budget: 15.22 %
6. Total GDP 68673.00 billion
7. SP budget as percentage of GDP 2.52 %
Souce: Ministry of Finance, Budget Documents
Table 59: Serious Floods and Damages in the Last 25 Years
Year Inundated Area (sq.km)
Damages
(m.US $) Deaths (no.)
1984 50000 380 0
1987 50000 1000 2050
1988 85000 1200 2000-6500
1998 100000 2800 1100
2004 55000 2000 700
2007 32000 1000 650
Source: Zulfiqar (2009)

53
C. Human Development
Table 60: Population Size and Growth Rates, 1951- 2001
Census Year 1951 1961 1974 1981 1991 2001
Population size (Million) 44.1 55.2 76.3 89.9 111.5 130.0
Annual Growth rate in Percent 2.27 2.52 2.37 2.18 1.54
Source: Bangladesh Bureau of Statistics
Table 60: Age Sex Composition of Population by Age Group, 2001
Age group 0-4 5-9 10-14 15-19 20-24 25-29 30+ 100.0
Male % 13.1 13.8 13.2 9.9 7.6 7.7 34.7 100.0
Female % 12.9 13.3 12.4 9.5 10.1 9.8 32.0 100.0
Both 13.0 13.5 12.7 9.7 9.7 8.7 32.7 100.0
Source: Bangladesh Bureau of Statistics
Table 61: Population Projection of Bangladesh (2006-2051)
Year A B
Male Female Total Male Female Total
2006 73.0 68.8 141.8 73.1 68.9 142.0
2011 77.9 73.6 151.4 78.7 74.4 153.1
2016 82.7 78.3 161.0 84.0 79.6 163.6
2021 88.1 83.7 171.7 89.4 84.9 174.3
2026 93.4 88.9 182.2 94.7 90.2 184.9
2031 98.1 93.5 191.6 99.7 35.0 194.7
2036 102.1 97.5 199.5 104.0 99.3 203.3
2041 105.6 100.9 206.5 107.9 103.1 211.0
2046 108.9 104.0 212.9 111.5 106.3 217.8
2051 112 106.7 218.6 114.7 109.2 223.9
Source: FRWPD, 2008
1. Education

54
Table 62: Population Projection of Bangladesh by 5 year Age Group 2006-2021 (Million)
Age Group
2006 2010 2015 2020
Male Female Total Male Female Total Male Female Total Male Female Total
0-4 8.02 7.53 15.55 7.27 6.82 14.09 7.33 6.86 14.19 7.65 7.18 14.83
5-9 8.6 7.91 16.51 8.01 7.50 15.51 7.12 6.66 13.78 7.07 6.61 13.68
10-14 9.21 8.30 17.51 8.67 7.97 16.64 7.97 7.44 15.41 7.16 6.69 1385
15-19 8.80 7.76 16.56 9.08 8.18 17.26 8.45 7.76 16.21 7.98 7.43 15.41
20-24 6.57 5.91 12.48 8.24 7.35 15.59 8.61 8.16 16.77 8.64 7.92 16.56
25-29 5.07 6.31 11.38 6.24 5.78 12.20 8.22 7.29 15.51 9.04 8.10 17.14
30+ 26.76 25.07 51.83 29.18 28.73 57.91 33.97 33.19 67.16 39.40 38.64 78.04
Total 73.03 68.77 141.8 76.87 72.33 149.20 81.67 77.36 159.03 86.44 82.57 163.51
Source: Based on Table 19, FRWPD, 2009.
Table 63: Projected Pre-primary Age- (4-5) Population 2005-2020 (Million).
Year 2005 2006 2010 2015 2020
Boys 3.25 3.32 3.06 2.89 2.94
Girls 3.15 3.09 2.86 2.70 2.76
Both 6.40 6.41 5.92 5.59 5.70
Table 64: Projection Primary Age Population (6-10) of Bangladesh for 2006-2020 (in Million)
Year 2005 2006 2010 2015 2020
Boys 8.4 8.73 8.05 7.71 7.63
Girls 7.82 8.03 7.83 7.50 7.42
Both 15.86 16.76 15.88 15.21 15.05
Source: CPD (2003).
Table 65: Projected 11-13 year age group population for 2005-2020 (in Million).
Year 2005 2006 2010 2015 2020
Boys 4.72 4.74 4.823 4.802 4.549
Girls 4.59 4.61 4.660 4.670 4.423
Both 9.31 9.35 9.483 9.472 8.97
Source: CPD (2003).

55
Table 66: Projection 14-15 years age group and 11-15 year age group population for 2006-2020
(in Million).
Year 14-15, year, Population 11-15 year age group population
2005 2006 2010 2015 2020 2005 2006 2010 2015 2020
Boys 3.15 3.16 3.20 3.21 3.11 7.87 7.90 8.02 8.01 7.66
Girls 3.03 3.03 3.09 3.08 2.99 7.62 7.64 7.75 7.75 7.41
Both 6.18 6.19 6.29 6.29 6.10 15.49 15.54 15.77 15.76 15.07
Table 67: Projection Population for the 16- 17 years age group for 2006-2020 (Million)
Year 2005 2006 2010 2015 2020 Boys 3.158 3.151 3.123 3.20 3.17
Girls 3.00 2.995 2.973 3.04 3.02
Both 6.158 6.15 6.10 6.24 6.19
Source: CPD (2003).
Table 68: Projected 18-21 and 22-24 Age Group Population for 2006-2020 (in Million)
Year 18-21 Age Group 22-24 Age Group 2005 2010 2015 2020 2005 2010 2015 2020
Boys 6.33 6.23 6.24 6.22 4.75 4.68 4.62 4.71
Girls 5.99 5.95 6.00 6.06 4.51 4.54 4.54 4.59
Both 12.32 12.18 12.24 12.28 9.26 9.22 9.16 9.30
Source: CPD (2003)
Table 70: Time series data of Pre Primary Students (2001-2008) Continued
Sch_type 2001 2002 2003 2004
Boys Girls Total Boys Girls Total Boys Girls Total Boys Girls Total
Govt. Primary
School 348606 340529 689135 383750 375811 759561 287150 283970 571120 269516 269123 538639
Regd. NGPS 137740 136833 274573
Non-regd.
NGPS 10479 10410 20889
Experimental
Schools 0 0 0
Ebtedaee
Madrashas 32940 31958 64898
Kindergarten 339958 319895 659853 341568 322604 664172 306237 290084 596321 47639 36159 83798
NGO Schools 3722 3768 7490
Community
Schools 16455 16886 33341
Primary of
High
Madrashas
33015 30620 63635
Primary of
High Schools 14163 14450 28613
Total: 688564 660424 1348988 725318 698415 1423733 593387 574054 1167441 565669 550207 1115876
Source: DPE
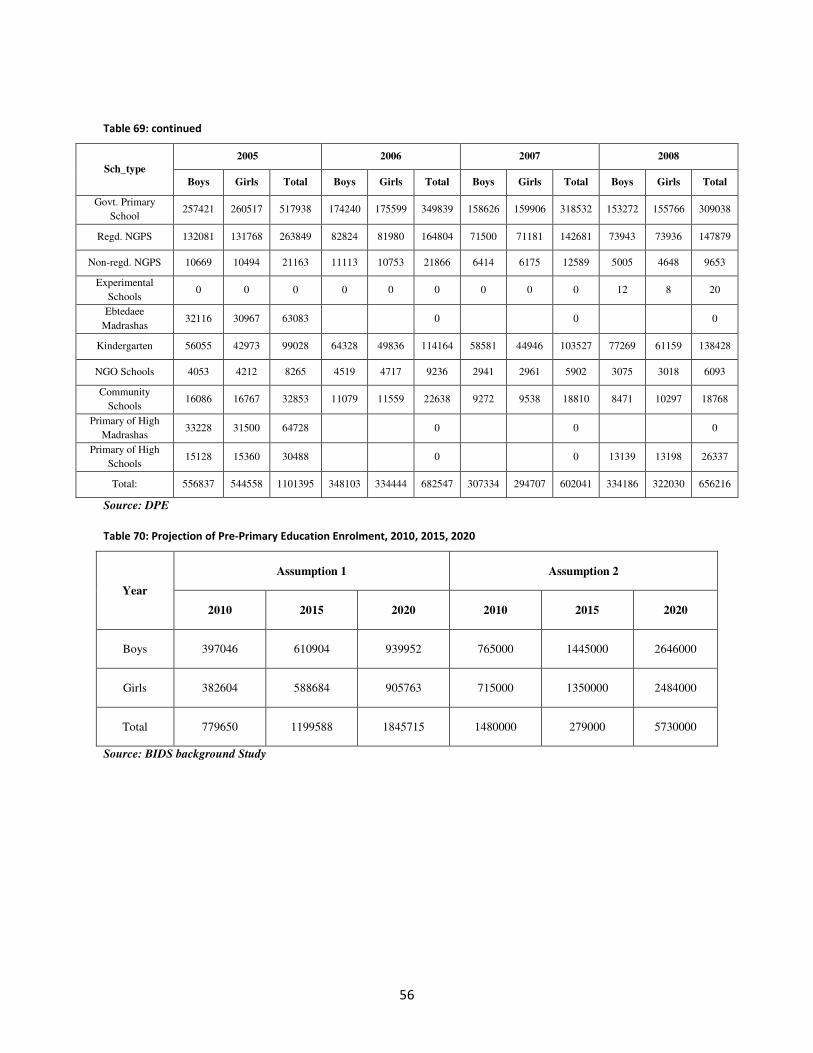
56
Table 69: continued
Sch_type
2005 2006 2007 2008
Boys Girls Total Boys Girls Total Boys Girls Total Boys Girls Total
Govt. Primary
School 257421 260517 517938 174240 175599 349839 158626 159906 318532 153272 155766 309038
Regd. NGPS 132081 131768 263849 82824 81980 164804 71500 71181 142681 73943 73936 147879
Non-regd. NGPS 10669 10494 21163 11113 10753 21866 6414 6175 12589 5005 4648 9653
Experimental
Schools 0 0 0 0 0 0 0 0 0 12 8 20
Ebtedaee
Madrashas 32116 30967 63083 0 0 0
Kindergarten 56055 42973 99028 64328 49836 114164 58581 44946 103527 77269 61159 138428
NGO Schools 4053 4212 8265 4519 4717 9236 2941 2961 5902 3075 3018 6093
Community
Schools 16086 16767 32853 11079 11559 22638 9272 9538 18810 8471 10297 18768
Primary of High
Madrashas 33228 31500 64728 0 0 0
Primary of High
Schools 15128 15360 30488 0 0 13139 13198 26337
Total: 556837 544558 1101395 348103 334444 682547 307334 294707 602041 334186 322030 656216
Source: DPE
Table 70: Projection of Pre-Primary Education Enrolment, 2010, 2015, 2020
Year
Assumption 1 Assumption 2
2010 2015 2020 2010 2015 2020
Boys 397046 610904 939952 765000 1445000 2646000
Girls 382604 588684 905763 715000 1350000 2484000
Total 779650 1199588 1845715 1480000 279000 5730000
Source: BIDS background Study

57
Table 71: Primary Education Statistics of Schools, Teachers, Student by Type of School and Gender: 2008.
School type No. of
Schools
Working Teachers Class 1 Class 2
Total Female Total Girls Total Girls
Govt. Primary
School
37672 182899 96543 2459076 1225076 2137612 1087888
Regd. NGPS 20083 76875 25299 1011770 799422 798687 401355
Non-regd. NGPS 966 2460 1579 29333 14236 22823 11189
Experimental
Schools
54 221 91 2112 1067 2170 1134
Ebtedaee Madrashas 6726 28227 2987 278469 134581 228520 112664
Kindergarten 2987 16980 9937 63670 27697 53992 23440
NGO Schools 408 763 503 6776 3359 5885 2971
Community Schools 3263 8772 6513 130250 64624 98326 49418
Primary of High
Madrashas
8920 35707 3734 256280 114786 240003 109791
Primary of High
Schools
1139 13021 5855 45358 24256 47049 24709
Total: 82218 365925 153041 4283094 2109104 3635067 1824559
Table 72: Continued
School type Class 3 Class 4 Class 5 Class 1-5
Total Girls Total Girls Total Girls Total Girls
Govt. Primary
School 1995109 1031280 1740566 913859 1205208 635112 9537571 4893215
Regd. NGPS 680570 346654 595155 305012 386617 201108 3472799 1753551
Non-regd. NGPS 19543 9685 16157 8031 11708 5905 99564 49046
Experimental
Schools 2263 1145 2031 994 1770 828 10346 5168
Ebtedaee
Madrashas 185463 90352 131663 63665 94950 46141 919065 447403
Kindergarten 44574 19163 36541 15735 27410 11516 226187 97551
NGO Schools 5116 2634 4471 2300 3624 1912 25872 13176
Community
Schools 68337 35310 54504 28530 36634 19906 388051 19778
Primary of High
Madrashas 200759 97385 189931 85505 164387 75296 1051360 482763
Primary of High
Schools 56109 29004 60456 31722 61818 32416 270790 142107
Total: 3257843 1662612 2831475 1455353 1994126 1030140 16001605 8081768
Data Sources: School census 2008 of Directorate of Primary Education (DPE)
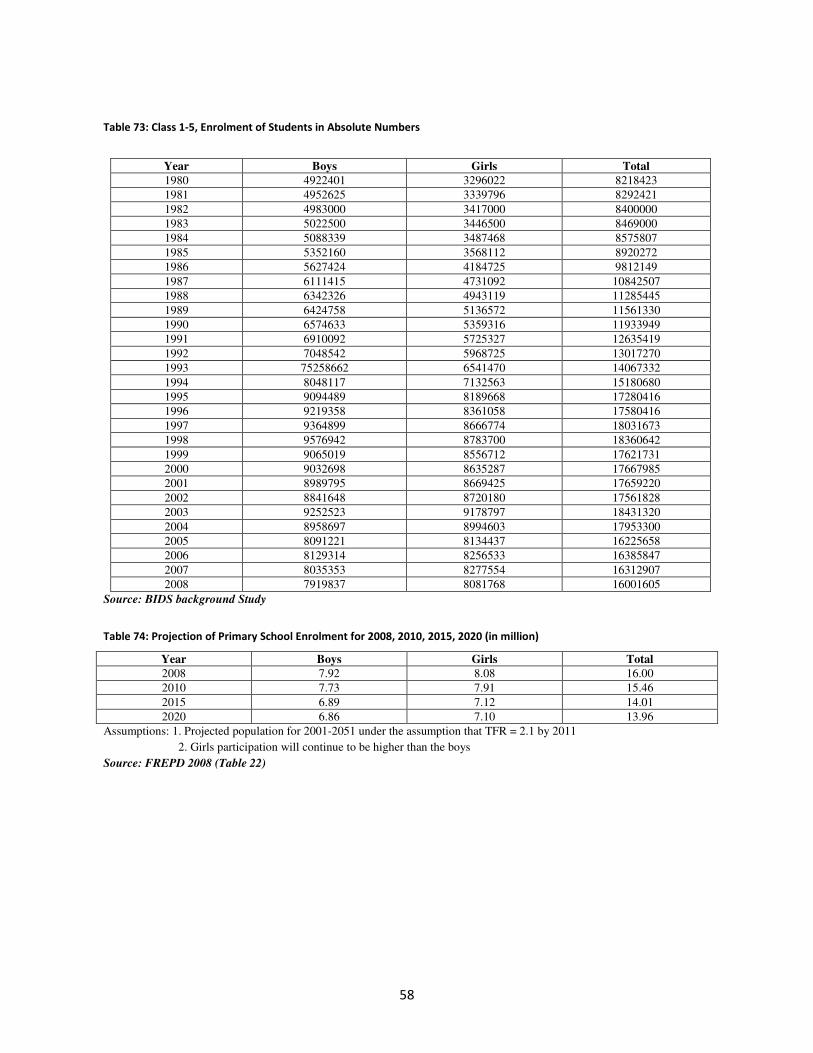
58
Table 73: Class 1-5, Enrolment of Students in Absolute Numbers
Year Boys Girls Total 1980 4922401 3296022 8218423
1981 4952625 3339796 8292421
1982 4983000 3417000 8400000
1983 5022500 3446500 8469000
1984 5088339 3487468 8575807
1985 5352160 3568112 8920272
1986 5627424 4184725 9812149
1987 6111415 4731092 10842507
1988 6342326 4943119 11285445
1989 6424758 5136572 11561330
1990 6574633 5359316 11933949
1991 6910092 5725327 12635419
1992 7048542 5968725 13017270
1993 75258662 6541470 14067332
1994 8048117 7132563 15180680
1995 9094489 8189668 17280416
1996 9219358 8361058 17580416
1997 9364899 8666774 18031673
1998 9576942 8783700 18360642
1999 9065019 8556712 17621731
2000 9032698 8635287 17667985
2001 8989795 8669425 17659220
2002 8841648 8720180 17561828
2003 9252523 9178797 18431320
2004 8958697 8994603 17953300
2005 8091221 8134437 16225658
2006 8129314 8256533 16385847
2007 8035353 8277554 16312907
2008 7919837 8081768 16001605
Source: BIDS background Study
Table 74: Projection of Primary School Enrolment for 2008, 2010, 2015, 2020 (in million)
Year Boys Girls Total 2008 7.92 8.08 16.00
2010 7.73 7.91 15.46
2015 6.89 7.12 14.01
2020 6.86 7.10 13.96
Assumptions: 1. Projected population for 2001-2051 under the assumption that TFR = 2.1 by 2011
2. Girls participation will continue to be higher than the boys
Source: FREPD 2008 (Table 22)

59
Table 75: Number of Students in Post Primary Education (1990-2008)
Level of
Education Type
1990 1995 2000 2005
Total Girls Total Girls Total Girls Total Girls
Junior
Secondary
School 2127851 761419 3645339 1767153 5004753 2780838 5142895 2690780
Madrasah 267775 18119 524375 150102 926750 421035 1089539 547185
Total 2395626 779538 4169714 1917255 5931503 3201873 6232434 3237965
Secondary
Level
School 865882 254326 1413271 605689 2642132 1239399 2255657 1177234
Madrasah 105508 5909 206612 48961 452092 182381 507816 248773
Total 971390 260235 1619883 654650 3094224 1421780 2763473 1426007
Higher
Secondary
College 568461 160397 910873 319763 1032083 437259 833777 327512
Madrasah 37859 489 54859 5540 166298 44498 120580 39382
Total 606320 160886 965832 325303 1198381 481757 954357 366894
Bachelor Degree Level 283112 49344 378130 106882 718958 248903 481703 159913
Masters’ Level 24114 3101 45164 11254 85216 27414 111759 34858
Fazil 21929 83 33822 3823 37220 5382 40320 7912
Kamil 11733 26 18903 811 21532 1255 16875 1985
Tech-Voc Education 22382 1210 38346 3711 116055 28126 241336 62562
Professional Education 46525 12066 54930 15885 60547 20329 59536 20925
Teacher Education 9393 3793 11170 4397 20911 7619 36265 13525
Data Source: BANBEIS, Ministry of Education
Table 76: Continued
Level of
Education Type
2006 2007 2008 2009
Total Girls Total Girls Total Girls Total Girls
Junior
Secondary
School 5162703 2700316 4600755 2483907 4648842 2494760 4988201 2587092
Madrasah 1095961 551254 1105960 598002 1137540 623783 1232875 670009
Total 6258664 3251570 5706715 3081909 5786382 3118543 6221076 3257101
Secondary
Level
School 2256476 1176673 2033802 1079853 2191699 1153429 2568592 129446
Madrasah 511315 250674 498915 253614 527763 272965 590444 302394
Total 2767791 1427347 2532717 1333467 2719462 1426394 3159036 431840
Higher
Secondary
College 1001669 443423 942122 443283 1059526 494217 1196405 554777
Madrasah 121126 39876 126999 49749 143710 59661 161852 71328
Total 1122795 483299 1069121 493032 1203236 553878 1358257 626105
Bachelor Degree Level 812534 293768 953760 338270 1178397 433540 1173916 459968
Masters’ Level 122175 41443 153815 49896 133735 44321 276785 90200
Fazil 53821 12728 55111 15258 57577 16711 59184 16574
Kamil 21319 3214 24175 4446 25579 4611 23235 4523
Tech-Voc Education 268184 66918 283522 75854 314142 84505 475848 113078
Professional Education 61097 21227 69988 22436 74327 23224 62818 21657
Teacher Education 37558 13807 40189 15916 42363 17278 42249 6929
Data Source: BANBEIS, Ministry of Education

60
Table 77: Projected GER in Junior Secondary Education (in percent).
Type Sex 2008 2010 2015 2020 School Boys 45 48 50 52
Girls 53 55 57 59
Madrasa Boys 10.7 12 14 16
Girls 13 15 17 19
Table 80: Projection of Enrolment in Junior Education, 2010-2020, (in lacs).
Type Bench Mark 2008 2010 2015 2020
Boys Girls Total Boys Girls Total Boys Girls Total Boys Girls Total
School 21.6 24.9 46.5 23.2 25.6 48.8 24.01 26.6 50.7 23.6 26.1 49.7
Madrasha 5.2 6.2 11.4 5.8 6.99 12.8 6.72 7.9 14.5 7.3 7.3 15.7
Total 26.8 31.1 57.9 29.0 32.6 61.6 30.7 34.5 65.2 30.9 30.9 65.4
Table 81: Projected GER for 2008 to 2020 for the Age Group 14-15 yrs
Years 2008 2010 2015 2020
Schools Boys 33 35 40 45
Girls 36 38 43 48
Madrasha Boys 8 11 18 25
Girls 9 12 19 26
Source: BIDS background Study
Table 78: Projected Secondary Enrolment for 2008-2020, (in million)
Year 2008 2020 2015 2020
Boy Girl Total Boy Girl Total Boy Girl Total Boy Girl Total
Secondary School
1.04 1.15 2.19 1.12 1.17 2.29 2.29 1.28 2.60 1.40 1.44 2.84
Secondary Madrasha
02548 02729 05277 0.35 0.37 0.72 0.72 0.58 1.17 0.78 .78 1.56
Secondary 1.30 1.42 2.72 1.42 1.54 3.01 3.01 1.86 3.77 2.18 2.12 4.30
Source: BIDS background Study
Table 79: Projected Higher Secondary Enrolment for 2008 - 2020 (in million)
Year 2008 2010 2015 2020
Boy Girl Total Boy Girl Total Boy Girl Total Boy Girl Total
College/ schools
0.565 0.494 1.059 0.586 .559 1.145 .641 .762 1.403 .701 1.039 1.740
Madrasha .0843 0.0597 .144 .0922 .064 .157 .115 .0769 .192 .144 .0922 .236
Total .649 .554 1.203 .678 .623 1.302 0.756 .839 1.595 .845 1.131 1.976
Source: BIDS background Study

61
Table 80: Number of Secondary Educational Institutions in General Stream by Year and Level of Education
Year
Level of education
Junior Secondary
Secondary1 Higher secondary
School & College2/ immediate college
Degree college3 Total
1995 2,349 9,663 603 671 13,286
1996 2,687 10,291 652 717 14,347
1997 3,002 10,776 901 664 15,343
1998 2,985 11,553 1,041 739 16,298
1999 2,846 12,614 1,422 785 17,667
2000 3,063 12,657 1,466 826 18,012
2001 3,245 12,921 1,485 868 18,519
2002 3,287 13,275 1,559 911 19,031
2003 3,982 13,404 1,579 1,069 20,034
2004 4,157 14,110 1,538 1,144 20,949
2005 4,322 14,178 1,813 1,187 21,500
2006 3,251 15,449 1,861 1,248 21,809
2007 3,355 15,056 1,845 1,303 21,559
2008 3,458 14,660 1,823 1,354 21,295
2009 3,494 14,619 1,932 1,324 21,369
Notes: 1 All of these institutions have junior secondary section and few have primary section 2 A third of these institutions have junior secondary and secondary sections 3 these institutions do not have junior secondary and secondary sections but have tertiary section BANBEIS
Table 81: Number of Secondary Educational Institutions in Madrasa Stream by Year and Level of Education
Year Level of education
Dakhil Alim and others Total
1995 4,121 1,856 5,977
1996 4,687 1,968 6,655
1997 4,795 2,056 6,851
1998 4,868 2,088 6,956
1999 4,890 2,232 7,122
2000 5,015 2,264 7,279
2001 5,391 2,260 7,651
2002 5,536 2,284 7,820
2003 5,995 2,415 8,410
2004 6,315 2,504 8,819
2005 6,685 2,529 9,214
2006 6,798 2,563 9,361
2007 6,788 2,585 9,373
2008 6,779 2,605 9,384
2009 6,771 2,701 9,472
Notes: All these institutions have ebtedyee (primary) section, BANBEIS
2 3

62
Table 82: Number of Secondary Students in General
Year Level of education
Junior secondary (Grades VI-VIII)
Secondary (Grades IX-X)
Higher secondary (Grades XI-XII)
Total
1995 36,45,339 (61.1) 14,13,270 (23.7) 9,10,873 (15.2) 59,69,482 (100.0)
1996 40,25,340 (63.1) 15,60,466 (24.5) 7,93,049 (12.4) 63,78,855 (100.0)
1997 44,13,416 (63.0) 17,10,909 (24.4) 8,82,526 (12.6) 70,06,851 (100.0)
1998 47,09,540 (61.4) 20,59,538 (26.8) 9,02,384 (11.8) 76,,71,462 (100.0)
1999 50,47,183 (61.6) 21,89,756 (26.8) 9,52,850 (11.6) 81,89,789 (100.0)
2000 52,04,753 (60.0) 24,42,132 (28.1) 10,32,083 (11.9) 86,78,968 (100.0)
2001 53,40,818 (60.4) 25,46,192 (28.8) 9,51,747 (10.8) 88,38,757 (100.0)
2002 55,30,209 (60.6) 26,31,925 (28.8) 9,70,379 (10.6) 91,32,513 (100.0)
2003 55,01,195 (60.2) 26,25,167 (28.7) 10,09,272 (11.1) 91,35,634 (100.0)
2004 51,44,193 (62.2) 23,59,054 (28.5) 7,67,789 (9.3) 82,71,036 (100.0)
2005 51,42,895 (62.5) 22,55,657 (27.4) 8,33,777 (10.1) 82,32,329 (100.0)
2006 51,62,703 (62.5) 22,56,476 (27.3) 8,44,596 (10.2) 82,63,775 (100.0)
2007 43,39,617 (60.2) 19,43,080 (27.0) 9,21,415 (12.8) 72,04,120 (100.0)
2008 46,63,908 (60.0) 21,55,840 (27.4) 10,58,813 (13.3) 78,78,561 (100.0)
2009 49,88,201 (58.3) 23,68,592 (27.7) 11,96,215 (14.0) 85,53,008 (100.0)
Source: BANBEIS (Percentage of students in parenthesis)
Table 83: Number of Secondary Students in Madrasa Stream by Year and Level of Education
Year
Level of education
Junior secondary
(Grades VI-VIII)
Secondary
(Grades IX-X)
Higher secondary
(Grades XI-XII) Total
1995 5,24,375 (66.7) 2,06,612 (26.3) 54,959 (7.0) 7,85,946 (100.0)
1996 5,76,620 (66.7) 2,27,197 (26.3) 60,435 (7.0) 8,64,252 (100.0)
1997 6,00,358 (66.5) 2,40,065 (26.6) 61,927 (6.9) 9,02,350 (100.0)
1998 8,22,054 (62.8) 3,60,780 (27.6) 1,25,743 (9.6) 13,08,577 (100.0)
1999 9,05,874 (60.0) 4,41,910 (29.3) 1,62,566 (10.8) 15,10,350 (100.0)
2000 9,26,750 (60.0) 4,52,092 (29.3) 1,66,298 (10.8) 15,45,140 (100.0)
2001 10,52,304 (60.8) 5,35,057 (30.9) 1,43,289 (8.3) 17,30,650 (100.0)
2002 10,73,968 (61.3) 5,45,518 (30.9) 1,45,972 (8.3) 17,65,458 (100.0)
2003 10,95,728 (63.5) 5,68,907 (31.8) 1,23,437 (6.9) 17,88,072 (100.0)
2004 10,37,799 (63.4) 4,83,704 (29.6) 1,13,731 (7.0) 16,35,234 (100.0)
2005 10,89,537 (63.4) 5,07,818 (29.6) 1,20,580 (7.0) 17,17,935 (100.0)
2006 10,95,961 (63.32) 5,11,315 (29.54) 1,23,584 (07.14) 17,30,860 (100)
2007 11,17,585 (63.32) 5,20,932 (29.51) 1,26,586 (07.17) 17,65,103 (100)
2008 11,39,203 (62.80) 5,30,547 (29.25) 1,44,216 (07.95) 18,13,966 (100)
2009 12,32,875 (61.12) 5,90,444 (29.74) 1,61,852 (08.15) 19,85,171 (100)
Source: BANBEIS (Percentage of students in parenthesis)
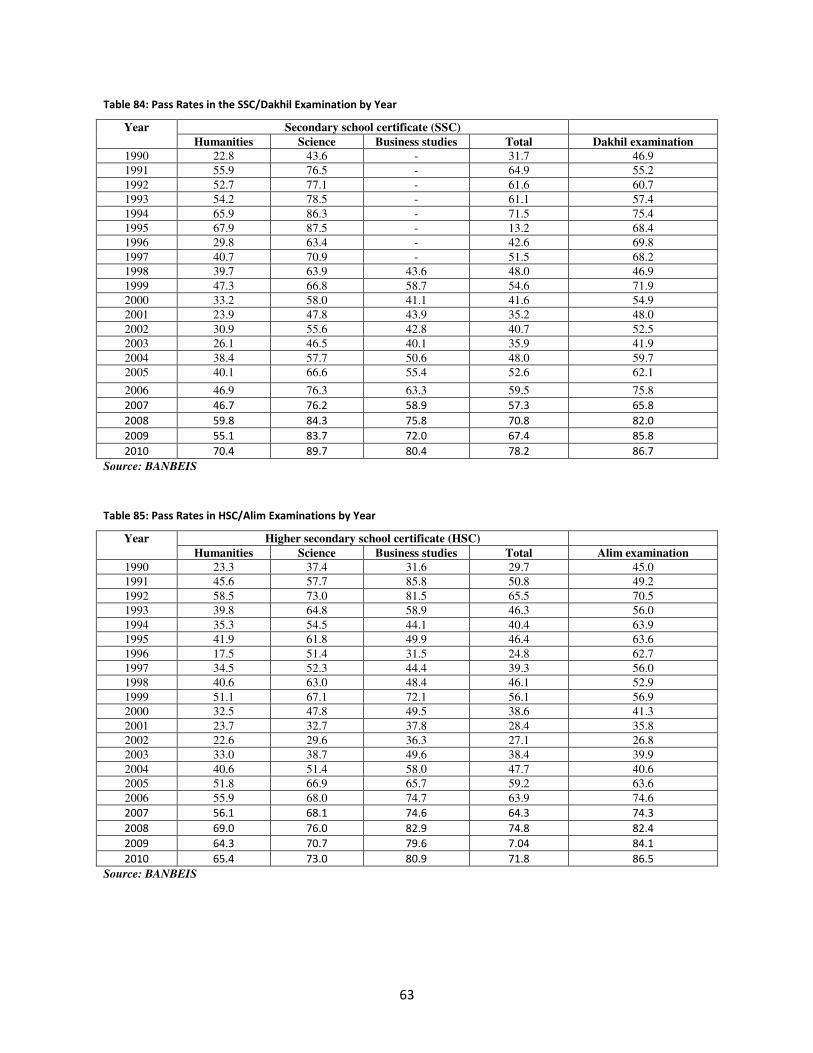
63
Table 84: Pass Rates in the SSC/Dakhil Examination by Year
Year Secondary school certificate (SSC)
Humanities Science Business studies Total Dakhil examination 1990 22.8 43.6 - 31.7 46.9
1991 55.9 76.5 - 64.9 55.2
1992 52.7 77.1 - 61.6 60.7
1993 54.2 78.5 - 61.1 57.4
1994 65.9 86.3 - 71.5 75.4
1995 67.9 87.5 - 13.2 68.4
1996 29.8 63.4 - 42.6 69.8
1997 40.7 70.9 - 51.5 68.2
1998 39.7 63.9 43.6 48.0 46.9
1999 47.3 66.8 58.7 54.6 71.9
2000 33.2 58.0 41.1 41.6 54.9
2001 23.9 47.8 43.9 35.2 48.0
2002 30.9 55.6 42.8 40.7 52.5
2003 26.1 46.5 40.1 35.9 41.9
2004 38.4 57.7 50.6 48.0 59.7
2005 40.1 66.6 55.4 52.6 62.1
2006 46.9 76.3 63.3 59.5 75.8
2007 46.7 76.2 58.9 57.3 65.8
2008 59.8 84.3 75.8 70.8 82.0
2009 55.1 83.7 72.0 67.4 85.8
2010 70.4 89.7 80.4 78.2 86.7
Source: BANBEIS
Table 85: Pass Rates in HSC/Alim Examinations by Year
Year Higher secondary school certificate (HSC)
Humanities Science Business studies Total Alim examination 1990 23.3 37.4 31.6 29.7 45.0
1991 45.6 57.7 85.8 50.8 49.2
1992 58.5 73.0 81.5 65.5 70.5
1993 39.8 64.8 58.9 46.3 56.0
1994 35.3 54.5 44.1 40.4 63.9
1995 41.9 61.8 49.9 46.4 63.6
1996 17.5 51.4 31.5 24.8 62.7
1997 34.5 52.3 44.4 39.3 56.0
1998 40.6 63.0 48.4 46.1 52.9
1999 51.1 67.1 72.1 56.1 56.9
2000 32.5 47.8 49.5 38.6 41.3
2001 23.7 32.7 37.8 28.4 35.8
2002 22.6 29.6 36.3 27.1 26.8
2003 33.0 38.7 49.6 38.4 39.9
2004 40.6 51.4 58.0 47.7 40.6
2005 51.8 66.9 65.7 59.2 63.6
2006 55.9 68.0 74.7 63.9 74.6
2007 56.1 68.1 74.6 64.3 74.3
2008 69.0 76.0 82.9 74.8 82.4
2009 64.3 70.7 79.6 7.04 84.1
2010 65.4 73.0 80.9 71.8 86.5
Source: BANBEIS

64
Table 90: Number of Institutions and Teachers by Management and type of Secondary Educational Institution
Type of secondary institutions Number of institutions Number of teachers Government institutions
Secondary school 317 7,306
Intermediate college 10 143
Degree college 125 3,023
Degree honours college
50 2,027
Master college 66 4,905
Total 568 17,404
Non-Government institutions
Junior secondary School
3,461 24,751
Secondary school 14,352 1,66,999
Intermediate college 1,154 21,189
School and College 640 23,393
Degree college 1,141 41,331
Degree honours college
45 2,557
Masters college 24 1,161
Total 20,817 2,81,381
Source: BANBEIS
Table 91: Government Expenditure on Secondary Education as % of GNI
Financial year Revenue Development Total
1999-2000 0.80 0.45 1.25
2000-2001 0.83 0.44 1.27
2001-2002 0.82 0.44 1.26
2002-2003 0.84 0.45 1.29
2003-2004 0.84 0.42 1.26
2004-2005 0.91 0.42 1.33
2005-2006 1.01 0.28 1.29
2006-2007 1.02 0.29 1.31
Source: Al-Samarrai (2007). Financing Basic Education in Bangladesh,
Sussex: CREAT and discussion with the author
Table 92: Average Private Expenditure for Secondary Education
Wealth status (Quintiles)
Total expenditure Expenditure for private tutoring
% share for private tutoring in total cost
Rural Urban Rural Urban Rural Urban Poorest (bottom 20%) 4,049 5,295 663 1,327 16.4 25.1
Poor (next 20%) 5,115 7,562 1,071 2,417 20.9 32.0
Middle (next 20%) 6,024 10,312 1,452 3,563 24.1 34.6
Rich (next 20%) 7.330 13,676 2,154 5,091 29.4 37.2
Richest (top 20%) 9.426 17,135 3,116 7,140 33.1 41.7
Source: CAMPE (2007)

65
Table 86: Percentage Population by Sex and Age Group (1974-2001)
Year Sex Total 0-4 5-9 10-14 15-24 25-34 35-44 45-59 60+
1974 Both Sex 100.0 16.9 18.3 12.8 15.1 12.5 10.0 8.7 5.7
Male 100.0 16.2 17.8 13.5 15.0 11.8 10.2 9.3 6.2
Female 100.0 17.6 18.9 12.2 15.3 13.2 9.1 7.7 5.2
1981 Both Sex 100.0 17.0 16.3 13.4 17.1 13.1 9.3 8.2 5.6
Male 100.0 16.6 16.0 13.9 16.4 12.8 9.5 8.7 6.1
Female 100.0 17.4 16.5 12.9 17.9 13.5 9.1 7.7 5.1
1991 Both Sex 100.0 16.8 16.5 12.1 16.9 14.6 9.8 8.8 4.4
Male 100.0 16.5 16.6 12.5 16.0 4.0 10.3 8.3 5.8
Female 100.0 17.0 16.4 11.6 17.9 15.2 9.2 7.6 5.1
1995 Both Sex 100.0 14.1 15.5 13.3 19.2 15.3 9.6 8.8 4.4
Male 100.0 13.9 15.2 13.2 19.1 15.3 9.3 9.8 5.1
Female 100.0 14.3 16.0 13.4 19.3 15.2 9.8 8.5 7.6
1996 Both Sex 100.0 12.7 15.3 12.7 17.4 14.2 11.0 8.8 8.0
Male 100.0 12.6 15.5 12.5 17.2 13.8 11.0 9.0 8.4
Female 100.0 12.8 15.1 12.8 17.7 14.7 10.9 8.5 7.6
2001 Both Sex 100.0 12.9 13.4 12.8 18.7 15.8 11.4 8.9 6.1
Male 100.0 13.0 13.7 13.1 17.5 14.5 12.0 9.5 6.7
Female 100.0 12.7 13.2 12.4 19.8 17.1 10.8 8.2 5.7
Source: Bangladesh Bureau of Statistics, 2009 & 1999
2. Health Indicators

66
Table 87: Human Development Indicators (1981-2008)
Crude Death Rate [per
thousand]
Crude Birth Rate [per
thousand] Infant Mortality Rate [per thousand] Life Expectancy at Birth [years]
Year National Rural Urban National Rural Urban National Rural Urban Male Female National Rural Urban Male Female
1981 11.5 12.2 7.2 34.6 35.7 24.8 111.5 112.5 99.4 113.4 109.4 54.8 54.3 60.1 55.3 54.4
1982 12.2 12.8 6.9 34.8 36.9 22.9 121.9 123.2 103.0 124.4 119.4 54.5 53.9 60.6 54.4 54.8
1983 12.3 13.2 7.5 35.0 36.4 27.1 117.5 120.8 98.8 118.8 116.0 53.9 53.1 60.3 54.2 53.6
1984 12.3 12.9 8.5 34.6 36.1 25.0 121.8 122.0 119.5 113.5 109.3 54.8 54.4 58.7 5.9 54.7
1985 12.0 12.9 8.3 34.6 35.3 28.0 112.0 113.0 99.0 114.2 109.0 55.1 54.7 60.1 55.7 54.6
1986 11.9 12.3 8.4 34.4 35.4 25.9 116.0 118.0 101.0 122.0 111.0 55.2 54.8 58.8 55.2 55.9
1987 11.5 11.8 7.6 33.3 34.6 24.8 113.0 115.0 95.0 120.0 105.0 56.4 56.1 60.0 55.6 54.9
1988 11.3 11.8 7.4 33.2 34.5 24.9 110.0 112.0 91.0 116.0 105.0 56.0 55.4 60.9 57.0 56.0
1989 11.4 12.0 7.3 33.0 34.2 24.3 98.0 105.0 84.0 102.0 95.0 56.0 55.0 61.0 56.0 55.6
1990 11.3 11.8 7.9 32.8 34.3 24.6 94.0 97.0 71.0 98.0 91.6 56.0 55.4 60.5 56.3 55.6
1991 11.0 11.5 7.3 31.7 32.9 23.9 90.6 94.4 69.3 94.4 86.8 56.1 55.8 60.0 56.5 55.6
1992 11.0 11.3 7.5 31.4 32.2 23.7 88.0 91.0 65.0 90.0 86.0 56.3 56.0 60.5 56.8 55.9
1993 10.0 10.4 7.2 28.8 30.0 21.0 84.0 88.0 61.0 86.0 81.0 57.9 57.5 60.6 58.2 57.7
1994 9.3 9.3 7.1 27.0 29.1 20.2 77.0 79.0 57.0 77.0 76.0 58.0 57.7 60.0 58.2 57.9
1995 8.7 9.0 6.7 26.5 28.5 19.4 71.0 78.0 53.0 73.0 70.0 58.7 57.5 60.9 58.4 58.1
1996 8.2 8.8 6.5 25.6 27.8 19.0 67.0 76.0 50.0 68.0 67.0 58.9 58.2 60.9 58.4 58.1
1997 5.9 6.5 4.2 21.0 16.2 14.0 60.0 69.0 49.0 61.0 59.0 60.1 59.4 62.3 60.5 59.7
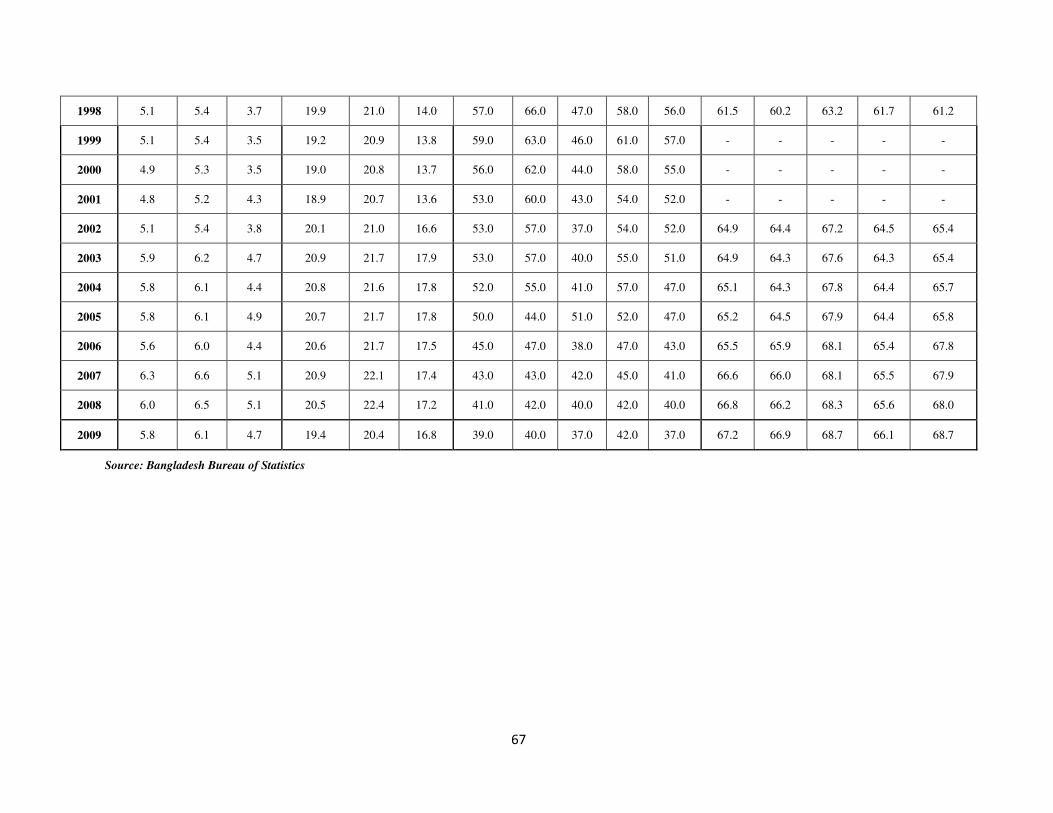
67
1998 5.1 5.4 3.7 19.9 21.0 14.0 57.0 66.0 47.0 58.0 56.0 61.5 60.2 63.2 61.7 61.2
1999 5.1 5.4 3.5 19.2 20.9 13.8 59.0 63.0 46.0 61.0 57.0 - - - - -
2000 4.9 5.3 3.5 19.0 20.8 13.7 56.0 62.0 44.0 58.0 55.0 - - - - -
2001 4.8 5.2 4.3 18.9 20.7 13.6 53.0 60.0 43.0 54.0 52.0 - - - - -
2002 5.1 5.4 3.8 20.1 21.0 16.6 53.0 57.0 37.0 54.0 52.0 64.9 64.4 67.2 64.5 65.4
2003 5.9 6.2 4.7 20.9 21.7 17.9 53.0 57.0 40.0 55.0 51.0 64.9 64.3 67.6 64.3 65.4
2004 5.8 6.1 4.4 20.8 21.6 17.8 52.0 55.0 41.0 57.0 47.0 65.1 64.3 67.8 64.4 65.7
2005 5.8 6.1 4.9 20.7 21.7 17.8 50.0 44.0 51.0 52.0 47.0 65.2 64.5 67.9 64.4 65.8
2006 5.6 6.0 4.4 20.6 21.7 17.5 45.0 47.0 38.0 47.0 43.0 65.5 65.9 68.1 65.4 67.8
2007 6.3 6.6 5.1 20.9 22.1 17.4 43.0 43.0 42.0 45.0 41.0 66.6 66.0 68.1 65.5 67.9
2008 6.0 6.5 5.1 20.5 22.4 17.2 41.0 42.0 40.0 42.0 40.0 66.8 66.2 68.3 65.6 68.0
2009 5.8 6.1 4.7 19.4 20.4 16.8 39.0 40.0 37.0 42.0 37.0 67.2 66.9 68.7 66.1 68.7
Source: Bangladesh Bureau of Statistics

68
Table 88: Training capacities in Public and Accredited Private Institutions, 1998 and 2005
Level/Course
1998
Number of Institution Intake Capacity1 Private Share
Public Private Public Private Institutions Students Vocational Education
Basic Skill Level 64 3 23,500 1,500 4% 6%
Certificate Level…
- SSC (Voc)8 62 510 5,380 25,800 89% 83%
- HSC (BM) - 220 - 8,800 100% 100%
- HSC (Voc) 51 - 1,520 - 0% 0%
Vocational Training
Diploma Level 36 7 13,155 1,160 16% 8%
Total 213 520 43,555 28,460 71% 40%
Level/Course
2005
Number of Institution Intake Capacity Private Share
Public Private Public Private Institutions Students Vocational Education
Basic Skill Level 76 414 12,370 13,300 84% 52%
Certificate Level…
- SSC (Voc) 110 1,303 23,570 63,450 92% 73%
- HSC (BM) - 955 - 50,000 100% 100%
- HSC (Voc) 64 - 5,560 - 0% 0%
Vocational Training
Diploma Level 54 73% 47%
Total 304 1,860 56,520 89,980 86% 61%
Source: DTE, BTEB
1) This number is the total number of seats available for the first year of the course. The enrollment numbers will be higher
as some of these courses (e.g. SSC/HSC are 2 year courses)
3. Human Resource Development

69
Table 89: Capacity Utilization in the VET System
Vocational Education Vocational Training
Public Private Total Public Private Total
No. of Institutes 48 252 300 9 17 26
Total Student Capacity 20,416 38,146 58,562 7,020 3,800 10,820
Total Registered Students 9,617 17,990 27,607 4,451 1,991 6,442
% Unutilitzed 52.9 52.8 52.9 36.6 47.6 40.5
Source: BIDS background Study
Table 90: Status of VET Students after Graduation
Employed (%) Self-Employed (%) Higher (%) Unemployed (%)
Gov. Pvt. Total Gov. Pvt. Total Gov. Pvt. Total Gov. Pvt. Total
Vocational Education
Basic trades 9.80 15.60 14.10 2.00 4.80 4.00 21.60 24.50 23.70 66.70 55.10 58.10
SSC (Voc) 2.80 3.30 3.10 1.10 0.70 0.90 46.70 47.90 47.40 49.30 48.10 48.70
HSC (Voc) 28.60 NA 28.60 1.10 NA 1.10 20.90 NA 20.90 49.50 NA 49.50
HSC (BM) NA 4.70 4.70 NA 0.70 0.70 NA 53.50 53.50 NA 41.10 41.10
Vocational Training
Diploma and Others
28.55 15.32 18.25 1.79 2.53 2.39 21.41 36.24 32.92 48.22 45.89 46.41
Total 9.10 6.50 7.26 1.23 1.29 1.28 39.03 46.91 44.66 50.58 45.29 46.84
Source: BIDS background Study

70
D. Regional Disparity Block
Table 91: Population Growth in Greater Districts, 1974 to 1991
(Population in ’000)
1974 to 1981 to
Greater District 1974 1981 1991 1981 1991
Barisal 3928 4667 5413 2.49 1.49
Bogra 2231 2728 3434 2.91 2.33
Chittagong 4315 5491 6715 3.50 2.03
Chittagong HT 508 580 744 1.91 2.52
Comilla 5819 6881 8207 2.42 1.78
Dhaka 7611 10014 13232 4.00 2.83
Dinajpur 2571 3200 3983 3.18 2.21
Faridpur 4060 4764 5424 2.31 1.31
Jamalpur 2059 2452 3013 2.53 2.08
Jessore 3327 4020 4848 2.74 1.89
Khulna 3557 4329 5039 2.85 1.53
Kushtia 1884 2292 2801 2.84 2.03
Mymensingh 5508 6568 7994 2.55 1.98
Noakhali 3234 3816 4626 2.39 1.94
Pabna 2815 3424 4183 2.84 2.02
Patuakhali 1499 1843 2050 3.00 1.07
Rajshahi 4268 5270 6594 3.06 2.27
Rangpur 5447 6510 8015 2.58 2.10
Sylhet 4759 5656 6765 2.50 1.81
Tangail 2078 2444 3002 2.34 2.08
Note: Italic terms are exponential growth rates (in percents)
Source: Statistical Yearbook (2008)

71
Table 92: District-wise Population Density in 2001 and Total Fertility Rate (TFR) in Rural Areas, 2001 to 2007
(Population per square k.m.)
2001 TFR
Ranking Division District Pop Dens. 2001 2003 2005 2007 2009
1 Dhaka Dhaka 5802.999 2.54 1.82 1.89 1.69 1.57
2 Dhaka Narayanganj 2860.526 2.65 2.02 1.94 2.21 1.74
3 Dhaka Narsingdi 1749.343 2.97 2.99 2.68 2.83 2.15
4 Chittagong Comilla 1489.465 2.69 2.50 2.26 2.51 1.87
5 Dhaka Munshiganj 1353.927 2.26 1.98 1.85 1.58 1.64
6 Chittagong Feni 1337.284 2.55 2.41 2.50 2.30 2.01
7 Chittagong Chandpur 1314.554 2.68 2.63 2.97 2.76 2.06
8 Chittagong Chittagong 1251.609 2.50 2.24 2.05 1.86 1.75
9 Chittagong Brahmanbaria 1244.421 2.70 3.09 2.90 2.94 2.26
10 Dhaka Sherpur 1229.808 2.53 2.70 2.67 2.96 2.41
11 Dhaka Gazipur 1166.571 2.78 2.02 2.01 1.80 1.62
12 Rajshahi Rangpur 1099.653 2.65 2.60 2.54 2.41 2.04
13 Rajshahi Sirajganj 1078.062 2.53 2.36 2.55 2.56 2.28
14 Khulna Kushtia 1074.028 2.07 2.27 2.35 1.99 1.92
15 Dhaka Jamalpur 1036.909 2.40 3.02 3.62 3.15 2.81
16 Rajshahi Bogra 1031.849 2.41 2.22 2.00 2.17 2.10
17 Dhaka Mymensingh 1029.115 2.54 3.38 2.92 3.27 2.54
18 Chittagong Lakshmipur 1024.055 2.62 3.58 2.88 3.51 2.80
19 Dhaka Madaripur 1008.803 2.50 2.98 2.67 2.34 2.27
20 Rajshahi Gaibandha 980.284 2.57 2.80 2.45 2.51 2.38
21 Dhaka Tangail 964.265 2.28 2.99 2.16 2.47 2.54
22 Khulna Jessore 962.992 2.40 2.37 2.42 2.21 2.00
23 Rajshahi Nilphamari 956.760 2.58 3.07 3.08 3.07 2.40
24 Dhaka Kishoreganj 951.300 2.74 3.21 3.97 3.54 2.96
25 Rajshahi Rajshahi 949.730 2.47 2.18 2.06 1.98 1.98
26 Rajshahi Lalmonirhat 938.240 3.13 2.62 2.82 2.50 2.00
27 Dhaka Manikganj 932.511 3.07 2.20 1.91 2.24 3.12
28 Rajshahi Pabna 917.334 2.28 2.23 2.48 2.54 1.84
29 Barisal Jhalakati 916.777 2.27 2.46 1.95 2.14 2.14
30 Dhaka Shariatpur 915.398 2.63 2.94 2.86 3.26 2.36
31 Rajshahi Joypurhat 877.720 3.03 1.41 2.01 1.85 1.76
32 Khulna Chuadanga 870.354 2.71 2.37 2.14 2.00 2.07
33 Dhaka Rajbari 850.760 2.49 2.63 2.46 2.59 2.19
34 Barisal Pirojpur 850.153 2.07 2.39 1.76 2.36 2.16

72
2001 TFR
Ranking Division District Pop Dens. 2001 2003 2005 2007 2009
35 Dhaka Faridpur 847.008 2.66 2.82 2.55 2.73 2.31
36 Barisal Barisal 844.086 2.27 2.33 2.18 2.42 1.65
37 Rajshahi Nawabganj 837.250 3.32 2.33 2.53 2.54 2.57
38 Khulna Meherpur 822.626 3.07 1.76 2.53 2.17 1.82
39 Khulna Jhenaidaha 805.711 2.66 2.47 2.47 2.31 2.01
40 Rajshahi Natore 802.639 2.48 2.32 1.66 1.86 2.28
41 Khulna Magura 785.510 2.82 3.31 2.63 2.41 2.69
42 Dhaka Gopalganj 781.208 2.35 3.05 2.47 2.36 2.17
43 Rajshahi Kurigram 780.488 2.70 2.69 2.90 2.92 2.41
44 Rajshahi Dinajpur 768.537 2.87 3.22 2.49 2.35 2.31
45 Sylhet Sylhet 732.875 2.35 2.31 2.34 1.96 2.32
46 Chittagong Noakhali 715.635 2.45 2.82 2.66 2.67 2.22
47 Chittagong Cox's Bazar 711.878 3.07 3.75 3.61 2.53 2.50
48 Dhaka Netrokona 707.473 2.84 3.75 3.55 4.18 2.57
49 Khulna Narail 705.051 2.63 2.51 2.64 2.89 1.87
50 Rajshahi Naogaon 696.070 2.39 1.96 1.67 1.76 1.79
51 Rajshahi Thakurgaon 669.431 2.64 2.96 2.75 2.79 2.37
52 Sylhet Habiganj 666.667 2.51 3.52 3.54 3.74 2.95
53 Rajshahi Panchagarh 594.729 2.72 2.34 3.00 2.61 2.37
54 Khulna Bagerhat 584.877 2.18 2.35 1.94 2.22 2.05
55 Sylhet Moulavibazar 557.632 2.64 2.71 2.55 2.23 2.21
56 Sylhet Sunamganj 546.070 2.64 2.98 3.66 2.13 2.89
57 Khulna Khulna 541.278 2.34 2.45 2.19 2.25 1.92
58 Khulna Satkhira 482.893 2.70 2.23 2.49 2.13 1.91
59 Barisal Barguna 463.681 1.94 2.20 2.13 2.15 2.41
60 Barisal Bhola 455.981 2.53 3.29 3.12 2.72 2.02
61 Barisal Patuakhali 453.727 2.19 1.81 2.36 2.65 2.44
62 Chittagong Khagrachhari 194.887 2.55 2.26 2.84 2.31 1.98
63 Chittagong Rangamati 83.074 2.59 1.87 1.84 2.21 1.78
64 Chittagong Bandarban 66.518 2.69 2.32 1.95 2.13 1.87
Note: Ranking in descending order of population density by district
Source: BBS

73
Table 100: Land Utilization Statistics of Bangladesh, 1984-85 to 2005-06
(in 000 acres)
Year Single Double Triple Net Area Total Area Intensity of
Cropped Cropped Cropped Cropped Cropped Cropping
1984-85 11682 8199 1472 21353 32496 152
1985-86 11516 8492 1653 21661 33459 154
1986-87 10781 9189 1908 21878 34883 159
1987-88 9168 8949 2361 20478 34148 167
1988-89 8825 8908 2415 20148 33887 168
1989-90 8980 9191 2463 20633 34750 168
1990-91 8140 9634 2424 20198 34680 172
1991-92 7702 9623 2391 19716 34121 173
1992-93 6411 9996 2485 18892 33858 179
1993-94 7229 9497 2364 19090 33315 175
1994-95 7228 9530 2375 19133 33413 175
1995-96 7875 8702 2704 19281 33391 173
1996-97 7196 9722 2483 19401 34089 176
1997-98 7083 10094 2513 19690 34810 177
1998-99 7408 9914 2419 19741 34493 175
1999-00 7395 10246 2460 20101 35267 175
2000-01 7141 10293 2536 19970 35335 177
2001-02 7097 10200 2527 19824 35076 177
2002-03 7108 10193 2544 19845 35126 177
2003-04 7094 10212 2538 19843 35129 177
2004-05 7091 10082 2530 19703 34845 177
2005-06 7041 9841 2407 19289 33944 176
Source: BBS, Statistical Pocketbooks of Bangladesh, Various Years

74
Table 101: Intensity of Cropping Statistics of Bangladesh, by Former Districts, 1999-00 to 2004-05
Year
District 1999-00 2000-01 2001-02 2002-03 2003-04 2004-05 mean Stdev
Bandarban 146.38 144.28 143.08 140.91 142.42 138.46 142.59 2.73
Chittagong 173.96 179.95 179.58 179.21 178.74 177.74 178.20 2.21
Comilla 191.62 190.42 189.68 190.25 183.64 176.47 187.01 5.88
Khagrachhari 163.04 160 159.02 157.31 168.05 166.15 162.26 4.23
Noakhali 185.3 187.4 187.38 188.06 186.39 182.03 186.09 2.21
Rangamati 144.44 154.08 156.56 154.45 156.86 153 153.23 4.56
Sylhet 146.63 147.84 145.65 145.62 144.34 148.96 146.51 1.67
Dhaka 173.9 173.91 176.06 175.85 175.42 172.82 174.66 1.30
Faridpur 182.42 181.81 182.31 182.05 186.06 183.14 182.97 1.58
Jamalpur 197.91 198.08 200.17 199.82 199.65 199.82 199.24 0.98
Kishoreganj 165.79 164.38 161.19 160.58 156.3 157.41 160.94 3.73
Mymensingh 193.99 196.07 195.34 194.87 196.02 196.8 195.52 1.00
Tangail 175.16 194.42 187.39 187.42 187.41 186.32 186.35 6.22
Barisal 171.09 170.94 170.99 170.51 168.87 166.26 169.78 1.91
Jessore 192.9 195.45 198.22 199.9 202.91 208.5 199.65 5.55
Khulna 136.93 133.92 134.33 136.36 137.81 134.66 135.67 1.58
Kushtia 195.6 194.45 196.51 196.7 201.82 201.15 197.71 3.04
Patuakhali 146.12 149.94 151.76 151.93 156.5 156.05 152.05 3.89
Bogra 209.52 209.7 209.78 209.13 212 214.73 210.81 2.17
Dinajpur 185.74 189.8 187.45 187.34 187.89 187.69 187.65 1.30
Pabna 191.63 191.52 193.65 194.05 197.18 199.48 194.59 3.16
Rajshahi 148.17 150.38 153.12 153.98 154.92 157.41 153.00 3.30
Rangpur 201.99 202.02 200.06 199.93 194.58 196.17 199.13 3.08
Bangladesh 175.45 176.94 176.94 177 177.03 176.85 176.70 0.62
Source: BBS, Statistical Yearbooks of Bangladesh, Various Years

75
Table 102: Percent of High Yielding Variety (HYV) in Cropped Area by Former Districts, 2001-02 to 2005-06
District Crop 2001-02 2002-03 2003-04 2004-05 2005-06
Bandarban Aus 20.897 22.008 21.919 22.842 23.642
Aman 89.815 89.622 90.016 90.227 92.129
Boro 100.000 100.000 100.000 100.000 100.000
Chittagong Aus 51.294 55.284 58.193 65.898 71.612
Aman 81.901 84.078 84.805 85.057 85.343
Boro 100.000 100.000 100.000 100.000 100.000
Comilla Aus 62.248 60.638 56.942 71.278 75.219
Aman 47.586 49.759 49.005 58.482 56.319
Boro 98.595 98.630 98.576 98.731 98.883
Khagrachhari Aus 76.538 75.993 76.150 79.344 76.219
Aman 93.443 93.679 95.366 94.282 95.085
Boro 100.000 100.000 100.000 100.000 100.000
Noakhali Aus 38.636 36.757 38.169 37.549 36.526
Aman 33.567 33.614 35.287 33.685 35.125
Boro 100.000 100.000 100.000 100.000 100.000
Rangamati Aus 37.714 32.492 36.034 68.093 29.748
Aman 98.130 98.240 98.170 98.032 98.132
Boro 99.876 99.873 100.000 100.000 100.000
Sylhet Aus 50.465 50.433 58.436 59.166 59.944
Aman 35.650 35.438 36.002 41.720 44.699
Boro 58.683 64.435 51.579 62.934 65.276
Dhaka Aus 14.340 14.171 13.860 21.090 26.401
Aman 34.390 35.872 38.282 39.760 44.176
Boro 97.420 97.617 97.787 97.694 97.852
Faridpur Aus 0.015 0.016 0.064 0.104 0.218
Aman 14.792 18.089 16.669 20.082 26.086
Boro 94.967 95.002 96.487 96.616 96.685
Jamalpur Aus 30.600 34.773 30.639 33.905 56.238
Aman 45.955 48.287 48.840 54.736 58.047
Boro 96.925 96.654 97.575 98.076 98.533
Kishoreganj Aus 69.422 73.351 69.085 69.878 78.712
Aman 58.299 57.638 55.260 58.904 62.239
Boro 92.598 92.955 93.105 93.773 94.993
Mymensingh Aus 69.466 70.116 68.791 74.798 87.287
Aman 48.363 49.510 52.155 52.436 56.269
Boro 97.899 98.134 98.383 98.490 98.678
Tangail Aus 17.423 20.869 19.531 29.110 43.291
Aman 37.587 36.253 41.784 44.367 48.534

76
District Crop 2001-02 2002-03 2003-04 2004-05 2005-06
Boro 99.022 99.141 99.195 99.353 99.363
Barisal Aus 23.397 24.458 25.061 24.838 35.484
Aman 5.373 7.234 8.284 8.297 14.636
Boro 96.663 96.279 96.113 95.857 93.325
Jessore Aus 42.505 45.486 42.236 55.322 60.966
Aman 61.753 80.478 82.193 82.419 85.920
Boro 99.420 99.553 99.601 99.680 99.754
Khulna Aus 48.130 49.327 52.250 47.091 48.434
Aman 50.426 49.859 52.330 54.904 58.780
Boro 92.610 92.794 93.256 93.116 95.001
Kushtia Aus 32.150 35.245 33.002 54.269 63.664
Aman 93.838 95.364 95.464 96.994 98.506
Boro 100.000 100.000 100.000 100.000 100.000
Patuakhali Aus 16.758 18.480 25.149 32.110 31.928
Aman 24.098 20.716 18.505 19.081 20.159
Boro 30.769 29.365 26.887 28.116 1.899
Bogra Aus 99.557 99.443 99.553 99.591 100.000
Aman 72.285 72.193 73.915 71.550 82.528
Boro 99.781 99.791 99.794 99.812 99.811
Dinajpur Aus 89.712 89.956 89.348 89.351 100.000
Aman 54.907 58.213 63.034 65.834 74.030
Boro 100.000 100.000 100.000 100.000 100.000
Pabna Aus 1.082 0.964 0.950 1.152 12.662
Aman 49.228 49.321 48.166 49.953 52.011
Boro 99.188 99.211 99.201 98.685 98.507
Rajshahi Aus 47.452 53.424 54.319 64.781 70.831
Aman 82.290 81.178 80.975 81.185 78.570
Boro 99.783 99.804 99.830 99.903 99.919
Rangpur Aus 38.120 35.419 16.724 14.019 17.634
Aman 69.457 70.983 72.989 74.584 79.316
Boro 99.867 99.857 99.696 99.806 99.804
Bangladesh Aus 36.199 37.520 37.596 44.013 49.974
Aman 50.010 51.711 52.591 55.039 58.823
Boro 94.640 95.372 94.718 95.375 95.715
Source: BBS, Yearbook of Agricultural Statistics, Various Years

77
Table 93: Percentages of Non-firm and Farm Households by Land Ownership by District, 2005-06
Non-Farm Farm Marginal Small Medium Large
HH HH 0.05-0.49 0.50-2.49 2.50-7.49 7.50+
% % % % % %
Bangladesh 46.427 53.573 38.629 49.854 10.344 1.173
Barisal Div. 26.869 73.131 47.128 39.325 11.937 1.611
Barisal 25.958 74.042 48.587 42.967 7.871 0.576
Bhola 33.351 66.649 45.048 41.903 11.556 1.493
Jhalokati 23.127 76.873 53.534 34.705 11.103 0.659
Pirojpur 20.164 79.836 49.228 38.456 11.117 1.199
Barguna 21.641 78.359 43.898 38.165 15.486 2.451
Patuakhali 31.382 68.618 43.689 34.237 18.194 3.880
Chittagong Div. 47.671 52.329 42.980 49.049 7.328 0.643
Bandarban 30.665 69.335 21.214 42.810 29.719 6.260
Chittagong 70.818 29.182 45.123 48.339 6.078 0.460
Cox's Bazar 52.035 47.965 44.159 47.990 7.401 0.450
Brahmanbaria 41.010 58.990 32.747 59.730 7.006 0.517
Chandpur 41.797 58.203 53.679 43.071 3.144 0.105
Comilla 35.804 64.196 44.354 51.904 3.633 0.109
Khagrachhari 24.375 75.625 27.045 54.005 17.448 1.501
Feni 40.044 59.956 46.300 47.619 5.778 0.303
Lakshmipur 30.592 69.408 52.656 41.615 5.347 0.382
Noakhali 37.071 62.929 43.331 46.716 8.720 1.233
Rangamati 39.308 60.692 14.366 47.175 35.527 2.933
Dhaka Div. 55.181 44.819 37.295 53.002 8.879 0.824
Dhaka 88.806 11.194 51.486 41.347 6.328 0.840
Gazipur 60.056 39.944 43.580 48.976 6.920 0.525
Manikganj 42.697 57.303 35.036 57.468 7.177 0.318
Munshiganj 59.729 40.271 47.290 45.261 6.875 0.574
Narayanganj 79.815 20.185 50.999 44.635 4.036 0.330
Narsingdi 46.735 53.265 42.895 51.874 5.052 0.180
Faridpur 42.013 57.987 32.679 55.153 11.410 0.758
Gopalganj 33.471 66.529 26.081 57.201 15.519 1.201
Madaripur 37.994 62.006 32.863 56.202 10.343 0.592
Rajbari 41.877 58.123 33.639 55.611 10.006 0.744
Shariatpur 27.832 72.168 40.450 52.078 7.088 0.384
Jamalpur 38.287 61.713 35.608 55.093 8.606 0.694
Sherpur 36.837 63.163 34.007 54.967 10.073 0.953
Kishoreganj 46.766 53.234 33.616 54.703 10.144 1.537
Netrokona 37.795 62.205 29.104 52.991 15.351 2.555
Mymensingh 42.161 57.839 34.888 55.417 8.969 0.726
Tangail 32.598 67.402 39.465 53.134 6.895 0.506

78
Non-Farm Farm Marginal Small Medium Large
HH HH 0.05-0.49 0.50-2.49 2.50-7.49 7.50+
% % % % % %
Khulna Div. 40.853 59.147 40.186 48.238 10.504 1.072
Jessore 38.824 61.176 41.588 49.622 8.082 0.709
Jhenaidah 32.978 67.022 35.595 52.271 11.278 0.856
Magura 33.488 66.512 35.741 51.753 11.911 0.594
Narail 22.027 77.973 30.317 53.794 15.080 0.808
Bagerhat 28.364 71.636 43.809 40.329 13.842 2.020
Khulna 63.847 36.153 42.808 43.384 11.708 2.099
Satkhira 45.461 54.539 50.094 40.456 8.309 1.141
Chuadanga 33.435 66.565 35.863 52.348 10.903 0.887
Kushtia 44.608 55.392 40.290 50.829 8.278 0.603
Meherpur 30.445 69.555 33.842 55.785 9.607 0.765
Rajshahi Div. 42.941 57.059 34.651 51.879 12.006 1.464
Bogra 43.022 56.978 36.772 53.709 8.918 0.601
Joypurhat 35.117 64.883 32.302 55.286 11.134 1.277
Dinajpur 45.698 54.302 28.309 51.955 17.106 2.630
Panchagarh 36.488 63.512 25.835 54.849 16.701 2.615
Thakurgaon 30.058 69.942 24.253 54.697 17.925 3.125
Pabna 50.744 49.256 34.226 52.241 12.155 1.379
Sirajganj 48.882 51.118 34.978 53.980 10.125 0.917
Naogaon 35.334 64.666 30.359 51.426 15.819 2.395
Natore 37.392 62.608 36.158 49.751 12.131 1.960
Nawabganj 50.314 49.686 32.316 48.204 17.291 2.189
Rajshahi 44.788 55.212 40.399 48.966 9.617 1.018
Gaibandha 44.364 55.636 40.382 51.052 7.840 0.726
Kurigram 39.730 60.270 41.308 49.279 8.583 0.829
Lalmonirhat 38.849 61.151 39.161 49.922 10.080 0.837
Nilphamari 42.799 57.201 33.580 52.475 12.739 1.206
Rangpur 46.622 53.378 36.608 52.669 9.802 0.921
Sylhet Div. 41.857 58.143 35.434 46.854 15.186 2.526
Hobiganj 39.684 60.316 30.319 50.904 16.414 2.363
Moulavibazar 32.557 67.443 42.341 47.307 9.552 0.800
Sunamganj 41.821 58.179 21.157 52.120 21.344 5.380
Sylhet 49.648 50.352 46.896 38.051 13.462 1.590
Source: BBS, Yearbook of Agricultural Statistics, 2005-06

79
Table 94: Literacy Rate for Persons aged 7 years and above by District, 1991 and 2001
1991
2001
Ranking Both Male Female Both Male Female
(from lowest Bangladesh 32.400 38.900 25.450 46.150 50.270 41.800
as of 1991)
1 Sherpur 19.490 24.630 14.090 31.890 35.040 28.550
2 Jamalpur 21.480 26.640 16.000 31.800 35.440 28.020
3 Cox's Bazar 21.890 28.160 14.900 30.180 34.010 26.000
4 Sunamganj 22.290 27.550 16.730 34.370 38.070 30.470
5 Kurigram 22.330 29.860 14.700 33.450 39.420 27.550
6 Meherpur 23.110 27.360 18.620 37.800 39.890 35.600
7 Kishoreganj 23.270 28.460 17.840 38.270 41.350 35.110
8 Lalmonirhat 23.810 31.400 15.690 42.330 48.190 36.250
9 Bandarban 23.820 32.190 13.460 31.670 38.240 23.670
10 Nawabganj 23.840 28.450 19.100 35.920 37.370 34.440
11 Bhola 23.950 28.580 19.000 36.890 39.500 34.090
12 Gaibandha 24.340 31.630 16.930 35.730 40.870 30.510
13 Shariatpur 24.410 30.310 18.450 38.950 42.170 35.770
14 Hobiganj 24.550 30.410 18.540 37.720 41.760 33.620
15 Chuadanga 25.240 30.510 19.560 40.880 43.520 38.080
16 Nilphamari 25.350 33.160 16.980 38.840 44.730 32.580
17 Mymensingh 25.470 30.700 19.950 39.110 41.860 36.260
18 Kushtia 25.770 30.850 20.280 40.370 43.400 37.190
19 Jhenaidah 25.850 32.340 18.900 44.660 48.780 40.260
20 Netrokona 25.970 31.220 20.440 34.940 37.880 31.880
21 Khagrachhari 26.320 34.640 16.860 41.810 49.940 32.650
22 Rajbari 26.430 32.700 19.680 39.810 43.660 35.750
23 Brahmanbaria 26.590 32.660 20.320 39.460 42.260 36.690
24 Rangpur 26.700 33.520 19.400 41.910 46.500 37.060
25 Pabna 26.830 31.790 21.460 42.440 45.180 39.500
26 Manikganj 26.910 33.680 20.070 41.020 46.030 35.980
27 Natore 26.950 32.990 20.550 41.550 45.450 37.410
28 Sirajganj 27.000 33.410 20.170 40.590 45.460 35.360
29 Thakurgaon 27.340 36.800 17.160 41.820 48.440 34.770
30 Faridpur 27.840 34.610 20.750 40.850 44.640 36.960
31 Magura 28.210 35.230 20.860 44.710 49.160 40.100
32 Naogaon 28.360 35.930 20.440 44.390 49.420 39.120
33 Bogra 28.410 35.400 21.000 42.890 47.990 37.530
34 Tangail 29.420 36.130 22.420 40.460 44.940 35.880
35 Narsingdi 29.570 35.030 23.660 42.910 46.140 39.500
36 Dinajpur 29.850 37.780 21.270 45.670 51.520 39.990
37 Joypurhat 30.170 37.470 22.190 49.620 55.010 43.950
38 Satkhira 30.540 39.730 21.000 45.520 51.840 38.910
39 Panchagarh 30.580 39.830 20.790 43.890 50.120 37.330

80
1991
2001
Ranking Both Male Female Both Male Female
(from lowest Bangladesh 32.400 38.900 25.450 46.150 50.270 41.800
as of 1991)
40 Rajshahi 30.590 37.640 23.160 47.540 52.270 42.480
41 Moulavibazar 30.840 36.830 24.560 42.060 45.590 38.450
42 Lakshmipur 32.250 38.790 29.740 42.940 44.250 41.660
43 Madaripur 32.560 39.960 24.890 42.140 46.870 37.290
44 Comilla 33.140 40.200 26.030 45.990 49.370 42.640
45 Jessore 33.370 41.020 25.070 51.290 56.150 46.090
46 Sylhet 33.850 39.870 27.490 45.590 49.430 41.550
47 Narail 35.650 42.230 28.930 48.560 52.380 44.690
48 Munshiganj 35.820 40.250 31.140 51.620 45.130 49.070
49 Patuakhali 36.410 42.650 30.050 51.650 55.540 47.730
50 Rangamati 36.480 45.820 24.680 43.600 51.470 34.210
51 Gazipur 36.610 43.160 29.350 56.400 60.470 51.900
52 Noakhali 37.070 42.950 31.480 51.670 53.510 49.900
53 Chandpur 37.810 42.720 32.990 50.290 51.910 48.740
54 Gopalganj 38.230 44.730 31.640 51.370 55.230 47.440
55 Narayanganj 39.840 46.230 32.240 51.750 55.930 46.900
56 Barguna 40.140 45.150 35.050 55.590 57.700 52.830
57 Feni 40.650 48.210 33.150 54.270 57.470 51.190
58 Barisal 43.040 47.890 37.910 56.990 59.010 54.920
59 Chittagong 43.200 50.280 34.990 55.550 59.790 50.830
60 Khulna 43.860 52.160 34.560 57.810 63.260 51.830
61 Bagerhat 44.330 49.540 38.860 58.730 60.820 56.490
62 Pirojpur 48.610 52.890 44.270 54.310 65.580 63.020
63 Jhalokati 51.190 55.870 46.450 65.350 67.380 63.350
64 Dhaka 53.890 60.110 45.930 64.790 69.580 58.740
Source: BBS, Statistical Yearbook, 2008

81
Table 95: Road Density by District, 2000 to 2005 (in meter per square k.m.)
Total R&H Total R&H Total R&H
Ranking District 2000 2004 2005
1 Rangamati 40.549 40.549 45.476
2 Shariatpur 41.731 41.731 34.049
3 Khulna 71.217 71.217 85.499
4 Sunamganj 72.207 72.207 78.777
5 Jamalpur 79.232 79.232 136.294
6 Thakurgaon 86.788 86.788 92.101
7 Patuakhali 87.051 87.051 93.847
8 Bagerhat 88.659 88.659 102.389
9 Panchagar 91.815 91.815 136.085
10 Habiganj 94.046 94.046 116.193
11 Narail 95.960 95.960 154.687
12 Netrokona 96.797 96.797 136.456
13 Chuadanga 97.582 97.582 79.603
14 Dhaka 102.459 102.459 216.694
15 Chapai Nawabganj 104.583 104.583 127.209
16 Dinajpur 105.876 105.876 116.414
17 Jessore 112.972 112.972 127.456
18 Tangail 113.064 113.064 120.422
19 Bandarban 113.641 113.641 102.853
20 Kurigram 116.725 116.725 152.983
21 Natore 117.616 117.616 167.526
22 Maulavibazar 120.043 118.971 97.328
23 Barguna 122.271 122.271 104.503
24 Noakhali 122.744 122.744 107.509
25 Nilphamari 123.705 123.705 77.386
26 Sylhet 126.074 126.074 146.169
27 Naogaon 126.310 126.310 144.107
28 Joypurhat 131.606 130.570 199.523
29 Gaibandha 134.006 134.006 140.913
30 Rajshahi 134.607 134.607 155.289
31 Manikganj 137.781 137.781 160.167
32 Rangpur 139.948 139.948 125.230
33 Faridpur 140.376 140.376 141.269
34 Sirajganj 145.717 145.717 150.588
35 Lamonirhat 148.148 148.148 148.478
36 Kushtia 148.674 284.392 270.222
37 Mymensingh 148.980 148.980 116.186
38 Bhola 149.868 149.868 74.487
39 Brahmanbaria 149.974 149.974 149.595
40 Madaripur 152.838 152.838 135.930
41 Gazipur 155.083 155.083 260.511

82
Total R&H Total R&H Total R&H
Ranking District 2000 2004 2005
42 Pabna 156.896 156.896 175.888
43 Cox's Bazar 157.705 157.705 215.405
44 Magura 159.199 159.199 239.485
45 Kishoreganj 160.283 160.283 162.361
46 Bogra 171.575 171.575 209.021
47 Khagrachari 174.074 174.074 128.185
48 Chandpur 174.883 174.883 204.043
49 Jhenidah 197.348 197.348 205.166
50 Barisal 198.137 198.137 121.265
51 Munshiganj 209.424 209.424 322.618
52 Jhalokati 212.401 212.401 229.604
53 Rajbari 215.371 215.371 141.707
54 Satkhira 225.233 225.233 192.972
55 Chittagong 232.444 232.444 179.152
56 Narsingdi 255.916 255.916 318.440
57 Sherpur 260.264 260.264 177.676
58 Lakshmipur 264.423 264.423 208.201
59 Narayanganj 276.680 276.680 399.183
60 Comilla 292.058 292.058 227.196
61 Meherpur 307.263 n.a. n.a.
62 Feni 327.586 327.586 291.886
63 Gopalganj 334.228 334.228 189.570
64 Pirojpur 379.969 379.969 264.946
Source: BBS, Statistical Yearbook

83
Table 96: 14 Maximum Demand for Electricity
Maximum Demand
Year East Zone West Zone System Total % Change over previous year
1994-95 1472.000 498.000 1970.000
1995-96 1497.000 590.400 2087.400 5.959
1996-97 1594.300 520.100 2114.400 1.293
1997-98 1559.600 576.500 2136.100 1.026
1998-99 1828.000 620.500 2448.500 14.625
1999-00 1878.000 787.000 2665.000 8.842
2000-01 2175.000 858.200 3033.200 13.816
2001-02 2447.000 770.500 3217.500 6.076
2002-03 2511.500 916.500 3428.000 6.542
2003-04 2640.000 946.100 3586.100 4.612
2004-05 2649.500 971.300 3620.800 0.968
2005-06 2809.000 973.100 3782.100 4.455
2006-07 2725.000 992.800 3717.800 -1.700
Source: BBS, Statistical Yearbook
Table 97: Growth Rate of Male Agricultural Day Laborer’s Nominal Daily Wage by Region,
1993/94 (July to Dec.) and 2006/07 (July to Dec.)
Avg.
St. dev.
CV Avg. St.
dev. CV growth growth
1993/94 2006/07 July Dec
District Jul Dec Jul Dec 93 to 06 93 to
06
Barisal 37.67 2.73 7.25 39.00 41.00 107.33 2.94 2.74 104.00 110.00 7.84 7.89
Patuakhali 34.17 8.50 24.86 43.00 41.00 106.00 3.41 3.21 105.00 100.00 7.11 7.10
Bandarban 56.50 1.22 2.17 57.00 54.00 114.67 2.58 2.25 115.00 118.00 5.55 6.20
Chittagong 61.83 2.48 4.02 64.00 62.00 124.83 4.49 3.60 120.00 130.00 4.95 5.86
Comilla 48.83 1.33 2.72 48.00 49.00 95.50 6.60 6.91 83.00 100.00 4.30 5.64
Khagrachari 48.83 1.33 2.72 48.00 49.00 116.00 2.00 1.72 116.00 120.00 7.02 7.13
Noakhali 44.33 2.34 5.27 46.00 47.00 112.67 2.07 1.83 111.00 115.00 7.01 7.13
Rangamati 50.33 2.34 4.65 51.00 48.00 118.50 1.22 1.03 120.00 117.00 6.80 7.09
Sylhet 44.83 2.93 6.53 42.00 49.00 105.33 3.98 3.78 100.00 110.00 6.90 6.42
Dhaka 44.17 0.75 1.70 44.00 45.00 106.33 2.50 2.35 109.00 110.00 7.23 7.12
Faridpur 33.00 0.63 1.92 33.00 33.00 99.17 3.76 3.80 95.00 105.00 8.47 9.31
Jamalpur 31.00 3.46 11.17 30.00 34.00 99.67 0.52 0.52 100.00 100.00 9.70 8.65
Kishoregonj 37.17 2.40 6.46 36.00 42.00 92.50 7.15 7.73 88.00 100.00 7.12 6.90
Mymensingh 34.00 2.00 5.88 33.00 34.00 94.50 4.64 4.91 95.00 100.00 8.47 8.65
Tangail 33.00 1.26 3.83 33.00 33.00 97.50 4.18 4.29 95.00 100.00 8.47 8.90
Jessore 31.83 2.14 6.71 31.00 32.00 85.00 6.32 7.44 80.00 90.00 7.57 8.28
Khulna 39.50 4.76 12.06 42.00 44.00 93.83 5.04 5.37 86.00 100.00 5.67 6.52
Kushtia 39.50 4.76 12.06 42.00 44.00 83.83 4.49 5.36 75.00 85.00 4.56 5.20
Bogra 34.33 2.88 8.37 35.00 32.00 89.33 5.89 6.59 80.00 95.00 6.57 8.73
Dinajpur 29.17 2.23 7.64 29.00 31.00 73.17 2.23 3.05 75.00 75.00 7.58 7.03
Pabna 28.33 1.37 4.82 28.00 28.00 84.83 3.19 3.76 90.00 85.00 9.40 8.92
Rajshahi 32.83 2.48 7.56 34.00 37.00 83.33 2.25 2.70 81.00 85.00 6.91 6.61
Rangpur 25.00 2.10 8.39 25.00 25.00 64.33 1.03 1.61 65.00 65.00 7.63 7.63
Nat. Avg. 39.14 1.67 4.26 39.70 40.61 97.67 1.97 2.01 95.00 100.00 6.94 7.18
Source: BBS, Yearbook of Agricultural Statistics, Various Years

84
Table 98: Growth of Regional Farm and Non-Farm Per Capita Incomes by District and Division,
1995-96 to 1999-2000
District Agri. Agri. Non-agri. Non-agri. Agri. Non-Agri. & Division Rpcinc. Rpcinc. Rpcinc. Rpcinc. Growth Growth
1995-96 1999-2000 1995-96 1999-2000 1995-2000 1995-2000 Barguna 5720.22 6745.74 6370.79 7502.13 4.21 4.17 Barisal 2951.60 3505.30 7304.80 8467.42 4.39 3.76 Bhola 5068.05 5792.74 6454.44 7523.46 3.40 3.91
Jhalokati 3296.05 3476.25 6377.63 7338.75 1.34 3.57 Patuakhali 6176.92 7176.16 7022.38 8211.26 3.82 3.99 Pirojpur 3539.50 3938.89 6466.39 7383.33 2.71 3.37 Barisal 4329.59 4993.61 6795.62 7897.65 3.63 3.83
Bandarban 5422.22 5544.83 1170.37 1362.07 0.56 3.86
Brahmanbaria 2711.74 3078.33 8431.58 9286.31 3.22 2.44 Chandpur 3134.33 3778.23 5888.84 6820.56 4.78 3.74
Chittagong 2350.81 2706.50 17784.84 20742.30 3.59 3.92 Comilla 3176.56 3443.43 6879.78 7537.17 2.04 2.31
Cox's Bazar 5292.73 6432.39 8670.91 9910.80 5.00 3.40 Feni 2738.58 3215.56 6496.85 7305.19 4.10 2.98
Khagrachari 3017.50 3323.26 7747.50 9011.63 2.44 3.85 Lakshmipur 5061.59 5645.63 6401.99 7420.63 2.77 3.76
Noakhali 3483.53 4233.21 6338.04 7419.93 4.99 4.02 Rangamati 6343.48 7277.08 13363.04 15754.17 3.49 4.20 Chittagong 3269.15 3759.88 9880.09 11346.96 3.56 3.52
Habiganj 3549.71 3846.49 7740.57 8606.49 2.03 2.69
Maulavibazar 3788.54 4065.27 6620.38 7435.93 1.78 2.95 Sunamganj 3560.20 3960.58 6089.29 6920.19 2.70 3.25
Sylhet 3249.80 3589.77 7893.17 9761.36 2.52 5.45 Sylhet 3504.50 3832.85 7146.85 8352.00 2.26 3.97
Dhaka 346.05 399.63 31963.08 36131.06 3.66 3.11
Faridpur 3176.47 3628.33 6788.82 7849.44 3.38 3.70 Gazipur 2242.55 2541.00 22356.38 25944.50 3.17 3.79
Gopalganj 3300.00 3857.60 6446.22 7373.60 3.98 3.42 Jamalpur 3112.68 3758.41 6655.87 7854.42 4.83 4.23
Kishoreganj 3754.41 4293.09 6291.57 7279.64 3.41 3.71 Madaripur 2780.99 3455.12 6009.09 7007.87 5.58 3.92 Manikganj 3325.00 3825.18 4339.39 5378.42 3.57 5.51 Munshiganj 2285.71 2602.14 7690.23 8769.29 3.29 3.34
Mymensingh 4472.38 5252.11 6591.09 7756.33 4.10 4.15 Narayanganj 1020.83 1201.00 22325.52 26006.00 4.15 3.89
Narsingdi 2325.53 2737.69 10625.53 12328.64 4.16 3.79 Netrokona 5059.90 5714.90 6104.06 7124.52 3.09 3.94
Rajbari 3478.95 3995.05 6497.89 7569.31 3.52 3.89 Shariatpur 3379.05 3913.27 5903.81 6738.94 3.74 3.36 Sherpur 3455.38 4075.18 6101.54 7200.00 4.21 4.23 Tangail 2952.79 3228.25 6535.19 7589.47 2.25 3.81 Dhaka 2683.09 3081.70 13285.22 15414.98 3.52 3.79
Bagerhat 4617.79 5686.63 7055.21 8354.65 5.34 4.32
Chuadanga 3921.74 4671.43 7984.78 9348.98 4.47 4.02 Jessore 4216.60 4733.33 9034.85 10625.88 2.93 4.14
Jhenaidah 4579.35 5078.18 7122.58 8333.94 2.62 4.00 Khulna 3569.30 4233.99 13707.46 15099.21 4.36 2.45 Kushtia 3497.66 4125.97 8328.07 9801.66 4.22 4.16 Magura 4990.24 5744.83 6293.90 7439.08 3.58 4.27
Meherpur 4282.14 5044.07 7612.50 9172.88 4.18 4.77 Narail 5308.33 5950.67 6325.00 7466.67 2.90 4.24
Satkhira 4277.35 5223.56 6941.44 8202.09 5.12 4.26 Khulna 4197.44 4908.92 8573.53 9991.67 3.99 3.90
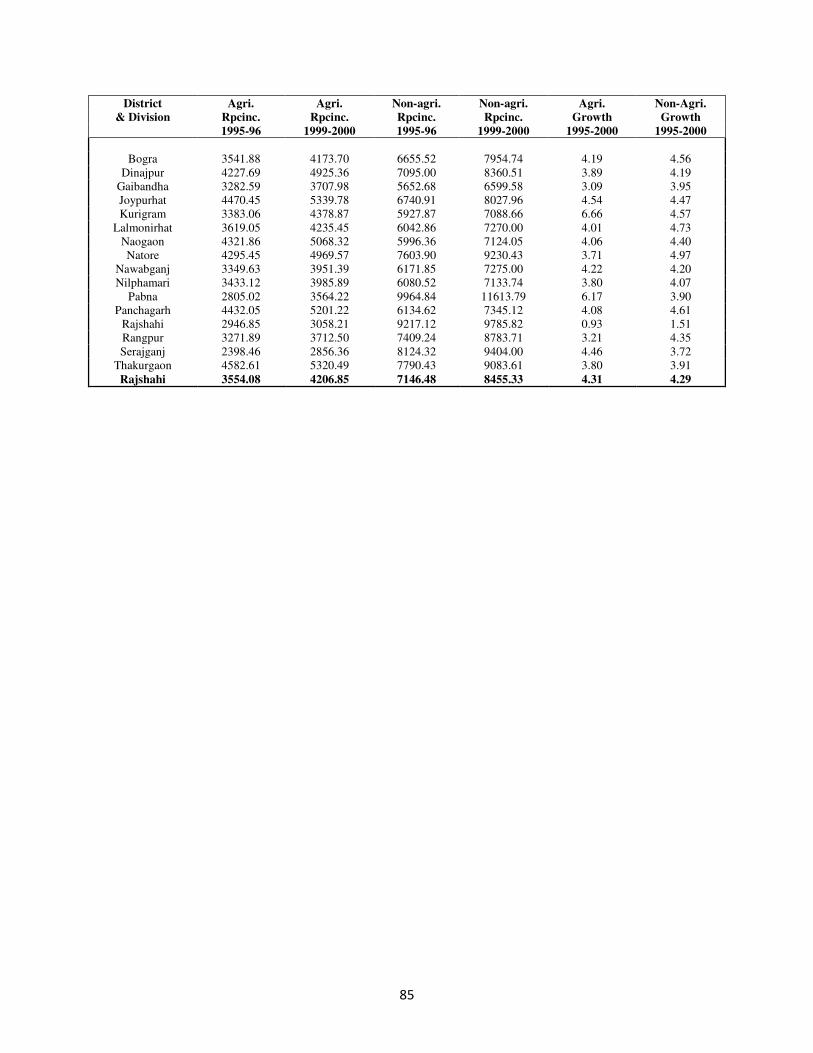
85
District Agri. Agri. Non-agri. Non-agri. Agri. Non-Agri. & Division Rpcinc. Rpcinc. Rpcinc. Rpcinc. Growth Growth
1995-96 1999-2000 1995-96 1999-2000 1995-2000 1995-2000
Bogra 3541.88 4173.70 6655.52 7954.74 4.19 4.56 Dinajpur 4227.69 4925.36 7095.00 8360.51 3.89 4.19
Gaibandha 3282.59 3707.98 5652.68 6599.58 3.09 3.95 Joypurhat 4470.45 5339.78 6740.91 8027.96 4.54 4.47 Kurigram 3383.06 4378.87 5927.87 7088.66 6.66 4.57
Lalmonirhat 3619.05 4235.45 6042.86 7270.00 4.01 4.73 Naogaon 4321.86 5068.32 5996.36 7124.05 4.06 4.40 Natore 4295.45 4969.57 7603.90 9230.43 3.71 4.97
Nawabganj 3349.63 3951.39 6171.85 7275.00 4.22 4.20 Nilphamari 3433.12 3985.89 6080.52 7133.74 3.80 4.07
Pabna 2805.02 3564.22 9964.84 11613.79 6.17 3.90 Panchagarh 4432.05 5201.22 6134.62 7345.12 4.08 4.61
Rajshahi 2946.85 3058.21 9217.12 9785.82 0.93 1.51 Rangpur 3271.89 3712.50 7409.24 8783.71 3.21 4.35 Serajganj 2398.46 2856.36 8124.32 9404.00 4.46 3.72
Thakurgaon 4582.61 5320.49 7790.43 9083.61 3.80 3.91 Rajshahi 3554.08 4206.85 7146.48 8455.33 4.31 4.29

86
Table 99: Allocation of Public Expenditure (Development) -- Recent Trends
Development Expenditure ( Taka in Thousand )
District 2006-07 2007-08 2008-09 (Upto March)
Actual Per capita Actual Per capita Actual Per capita
Dhaka 18,440,244 2.035 16,832,243 1.857 6,457,023 0.713
Narayanganj 4,315,195 1.864 3,084,685 1.333 979,068 0.423
Munshiganj 3,608,165 2.619 1,787,134 1.297 774,149 0.562
Manikganj 2,378,153 1.738 2,161,739 1.580 758,914 0.555
Gazipur 5,109,497 2.362 5,100,798 2.358 2,411,477 1.115
Narsingdi 4,887,213 2.421 3,117,675 1.544 1,056,650 0.523
Faridpur 3,025,562 1.618 2,453,185 1.312 1,458,123 0.780
Rajbari 1,060,005 1.046 1,089,068 1.075 460,650 0.455
Gopalganj 1,818,880 1.466 1,777,569 1.433 909,587 0.733
Madaripur 1,489,019 1.220 1,457,036 1.194 760,147 0.623
Shariatpur 1,739,169 1.509 2,407,116 2.089 991,925 0.861
Tangail 4,160,525 1.187 3,495,794 0.998 1,364,073 0.389
Jamalpur 2,814,511 1.254 2,233,966 0.996 999,234 0.445
Sherpur 1,431,126 1.050 1,526,921 1.121 560,864 0.412
Mymensingh 3,975,613 0.832 4,395,705 0.920 1,906,972 0.399
Netrokona 2,602,165 1.229 2,385,643 1.127 1,327,527 0.627
Kishoreganj 2,466,505 0.893 3,167,648 1.147 1,307,185 0.473
Dhaka Division 65,321,546 1.571 58,473,925 1.407 24,483,567 0.589
Chittagong 13,159,876 1.869 9,590,203 1.362 6,021,030 0.855
Cox's Bazar 4,293,809 2.274 3,304,685 1.750 840,547 0.445
Rangamati 5,348,414 9.885 4,370,133 8.077 2,570,956 4.752
Bandarban 1,430,262 4.506 1,559,521 4.913 643,730 2.028
Khagrachori 1,656,434 2.960 2,307,560 4.123 803,826 1.436
Comilla 11,838,272 2.419 7,788,233 1.592 3,649,269 0.746
Chandpur 3,730,216 1.543 2,664,986 1.102 1,220,709 0.505
Brahmanbaria 3,117,586 1.221 3,186,584 1.248 1,712,356 0.671
Noakhali 3,094,904 1.128 4,509,121 1.643 2,613,490 0.952
Feni 2,353,311 1.782 2,180,674 1.651 1,537,114 1.164
Lakshmipur 3,621,558 2.283 3,188,340 2.010 1,135,729 0.716
Chittagong Division 53,644,640 2.074 44,650,040 1.726 22,748,755 0.880
Rajshahi 4,791,517 1.968 4,156,184 1.707 2,041,266 0.838
Naogaon 2,983,438 1.172 2,568,163 1.009 1,211,550 0.476
Nawabganj 1,474,330 0.972 1,462,892 0.964 592,038 0.390
Natore 2,665,674 1.646 2,137,338 1.320 823,199 0.508
Bogra 7,105,944 2.215 4,850,150 1.512 1,929,340 0.601
Jaipurhat 912,032 1.012 919,822 1.020 270,789 0.300
Rangpur 2,206,202 0.815 2,747,169 1.015 2,088,731 0.772

87
Development Expenditure ( Taka in Thousand )
District 2006-07 2007-08 2008-09 (Upto March)
Actual Per capita Actual Per capita Actual Per capita
Nilphamari 1,296,114 0.775 1,546,051 0.924 1,116,180 0.667
Kurigram 2,544,704 1.334 2,362,608 1.238 962,512 0.504
Lalmonirhat 1,255,070 1.063 1,145,093 0.969 691,547 0.585
Gaibandha 1,501,548 0.660 1,520,869 0.668 896,907 0.394
Dinajpur 4,484,554 1.594 2,266,956 0.806 960,311 0.341
Thakurgaon 926,073 0.716 1,035,581 0.801 383,508 0.297
Panchagarh 1,288,769 1.448 1,648,536 1.852 458,360 0.515
Pabna 2,082,855 0.899 3,060,284 1.321 1,695,272 0.732
Sirajganj 3,259,726 1.137 2,682,750 0.935 2,188,241 0.763
Rajshahi Division 40,778,550 1.268 36,110,449 1.123 18,309,750 0.569
Khulna 4,444,806 1.755 4,938,189 1.950 2,641,141 1.043
Bagerhat 2,824,016 1.712 2,660,301 1.613 1,081,572 0.656
Satkhira 1,733,984 0.873 1,776,007 0.895 825,665 0.416
Jessore 2,738,257 1.041 2,611,890 0.993 1,000,467 0.380
Narail 926,937 1.246 957,107 1.287 396,365 0.533
Jhenaidah 2,692,028 1.601 3,482,324 2.071 1,047,228 0.623
Magura 1,030,843 1.175 1,419,556 1.617 529,338 0.603
Kushtia 2,288,937 1.235 2,174,427 1.174 1,012,267 0.546
Chuadanga 771,836 0.720 1,058,811 0.987 456,335 0.426
Meherpur 1,216,403 1.932 1,034,019 1.642 242,874 0.386
Khulna Division 20,668,047 1.320 22,112,633 1.412 9,233,250 0.590
Barisal 4,379,137 1.746 5,256,184 2.095 2,453,658 0.978
Pirojpur 2,240,765 1.894 1,945,643 1.645 901,750 0.762
Jhalokati 2,343,374 3.170 2,083,656 2.819 487,244 0.659
Bhola 3,782,708 2.086 2,794,800 1.541 983,647 0.542
Patuakhali 2,541,247 1.634 2,559,183 1.645 976,162 0.628
Barguna 1,530,710 1.694 2,940,816 3.255 1,229,515 1.361
Barisal Division 16,817,941 1.933 17,580,282 2.020 7,031,976 0.808
Sylhet 9,762,114 3.588 7,186,796 2.641 2,944,513 1.082
Sunamganj 2,784,917 1.299 3,422,981 1.596 1,425,804 0.665
Moulvibazar 3,574,250 2.082 2,549,813 1.485 858,688 0.500
Habiganj 2,616,422 1.398 3,074,534 1.643 1,003,285 0.536
Sylhet Division 18,737,702 2.217 16,234,124 1.920 6,232,290 0.737
Total 215,968,427 1.631 195,161,453 1.474 88,039,589 0.665

88
Table 100: Allocation of Public Expenditure (Non-Development) -- Recent Trends
Non-Development Expenditure (Taka in Thousand )
2006-07 2007-08 2008-09 (Upto March)
District Actual Per capita Actual Per capita Actual Per capita
Dhaka 59,564,026 6.573 176,042,300 19.426 115,353,475 12.729
Narayanganj 4,776,192 2.063 9,725,487 4.202 3,753,456 1.622
Munshiganj 3,998,232 2.902 4,676,175 3.394 2,601,556 1.888
Manikganj 3,530,015 2.580 5,822,338 4.255 3,037,974 2.220
Gazipur 4,646,532 2.148 6,793,197 3.140 4,011,656 1.854
Narsingdi 3,392,393 1.681 5,427,377 2.689 3,219,235 1.595
Faridpur 4,631,367 2.476 7,919,647 4.235 4,536,314 2.426
Rajbari 1,972,198 1.946 3,344,852 3.300 1,922,152 1.897
Gopalganj 2,605,334 2.100 4,714,193 3.800 2,620,682 2.112
Madaripur 2,322,508 1.903 4,752,211 3.894 2,412,905 1.977
Shariatpur 1,863,769 1.617 3,287,122 2.853 1,872,599 1.625
Tangail 6,403,010 1.828 11,400,377 3.254 7,350,428 2.098
Jamalpur 4,150,260 1.850 7,509,901 3.347 4,690,191 2.090
Sherpur 3,043,221 2.234 5,433,713 3.988 3,685,212 2.705
Mymensingh 10,079,366 2.109 16,732,710 3.500 9,996,756 2.091
Netrokona 4,298,877 2.031 6,491,872 3.067 4,452,421 2.103
Kishoreganj 4,359,536 1.578 6,918,515 2.504 4,351,141 1.575
Dhaka Division 125,636,837 3.022 286,991,987 6.904 179,868,154 4.327
Chittagong 29,101,866 4.134 51,580,847 7.327 29,713,813 4.221
Cox's Bazar 3,321,118 1.759 4,885,977 2.587 3,032,323 1.606
Rangamati 4,919,122 9.091 8,054,117 14.886 4,672,369 8.635
Bandarban 2,551,877 8.040 3,996,785 12.592 2,423,338 7.635
Khagrachori 4,192,722 7.491 6,199,699 11.077 3,911,680 6.989
Comilla 10,296,224 2.104 15,797,756 3.229 9,246,500 1.890
Chandpur 4,012,639 1.659 6,302,487 2.606 3,848,217 1.591
Brahmanbaria 4,735,247 1.854 7,421,897 2.907 4,721,487 1.849
Noakhali 5,208,772 1.898 7,802,074 2.843 4,760,609 1.735
Feni 3,315,810 2.511 5,207,015 3.943 3,109,696 2.355
Lakshmipur 2,730,444 1.721 4,060,148 2.559 2,527,661 1.593
Chittagong Division 74,385,843 2.876 121,308,802 4.691 71,967,692 2.783
Rajshahi 12,348,797 5.072 18,742,015 7.697 12,276,215 5.042
Naogaon 6,995,200 2.747 11,485,565 4.511 8,097,642 3.180
Nawabganj 2,803,236 1.847 4,647,310 3.062 3,057,969 2.015
Natore 4,179,074 2.580 5,659,003 3.494 4,112,502 2.539
Bogra 11,882,096 3.704 20,977,314 6.539 13,587,208 4.235
Jaipurhat 3,032,226 3.364 5,478,771 6.077 4,040,345 4.482

89
Non-Development Expenditure (Taka in Thousand )
2006-07 2007-08 2008-09 (Upto March)
District Actual Per capita Actual Per capita Actual Per capita
Rangpur 9,084,926 3.356 13,960,235 5.157 8,161,975 3.015
Nilphamari 3,361,684 2.009 5,338,669 3.190 3,651,741 2.182
Kurigram 4,863,391 2.549 7,595,793 3.981 4,654,112 2.439
Lalmonirhat 3,124,353 2.645 4,234,044 3.585 3,113,174 2.636
Gaibandha 5,044,991 2.216 8,091,431 3.554 5,082,706 2.233
Dinajpur 10,849,365 3.856 16,182,157 5.751 11,419,897 4.058
Thakurgaon 5,577,280 4.314 8,091,431 6.258 6,013,355 4.651
Panchagarh 2,470,366 2.775 3,776,423 4.242 2,631,984 2.956
Pabna 5,844,561 2.522 10,502,034 4.532 6,631,034 2.862
Sirajganj 5,034,754 1.755 8,729,987 3.044 5,904,685 2.059
Rajshahi Division 96,496,300 3.001 153,492,180 4.773 102,436,543 3.186
Khulna 12,791,992 5.050 23,633,624 9.331 13,059,507 5.156
Bagerhat 3,854,165 2.337 6,306,712 3.824 3,041,017 1.844
Satkhira 3,538,735 1.782 6,329,945 3.188 3,930,806 1.980
Jessore 6,840,897 2.600 11,525,695 4.380 6,831,421 2.596
Narail 1,847,467 2.484 3,048,455 4.099 1,834,782 2.467
Jhenaidah 3,428,031 2.038 5,796,289 3.447 3,646,960 2.169
Magura 2,109,441 2.403 3,952,431 4.503 2,229,036 2.540
Kushtia 4,375,839 2.362 7,711,958 4.162 4,809,293 2.596
Chuadanga 2,326,678 2.170 3,894,701 3.632 2,579,387 2.405
Meherpur 1,226,084 1.947 1,916,373 3.043 1,152,335 1.830
Khulna Division 42,339,327 2.704 74,116,182 4.734 43,114,544 2.754
Barisal 8,786,177 3.503 15,592,179 6.216 8,476,248 3.379
Pirojpur 2,775,939 2.347 5,948,360 5.028 2,689,361 2.273
Jhalokati 2,140,150 2.895 3,445,529 4.661 1,676,558 2.268
Bhola 2,761,153 1.523 4,619,149 2.547 2,731,960 1.507
Patuakhali 3,095,919 1.991 6,338,393 4.075 2,898,442 1.864
Barguna 1,790,977 1.982 3,665,186 4.057 1,727,416 1.912
Barisal Division 21,350,316 2.453 39,608,796 4.551 20,199,985 2.321
Sylhet 9,161,888 3.367 14,309,434 5.259 8,365,839 3.075
Sunamganj 3,048,529 1.422 4,876,824 2.275 2,867,580 1.337
Moulvibazar 3,220,271 1.876 4,863,448 2.833 2,928,870 1.706
Habiganj 3,392,772 1.813 4,293,182 2.294 2,829,328 1.512
Sylhet Division 18,823,461 2.227 28,342,888 3.353 16,991,617 2.010
Total 379,032,083 2.863 703,860,835 5.316 434,578,535 3.282

90
Table 101: Acreage and Production of Rice in Greater Districts (1990-91 to 2005-06)
District Total Rice (area in acres and production in metric tons) Area Area Area Area Yield Yield Yield Yield
1990-91 1995-96 2001-02 2005-06 1990-91 1995-96 2001-02 2005-06
Bandarban 49000 58260 50110 38206 0.764 0.774 0.859 0.835 Ranking 21 21 23 23 8 9 17 21
Chittagong 1078760 907090 1033630 1007742 0.762 0.973 1.040 1.052 Ranking 15 16 16 16 10 1 3 12
Comilla 1693970 1811660 1758020 1560697 0.794 0.747 1.010 1.097 Ranking 4 3 4 6 3 11 6 7
Khagrachari 34160 29910 59910 78108 0.925 0.889 0.948 1.084 Ranking 23 23 21 21 1 2 12 9
Noakhali 1282520 1200080 1176830 1087020 0.587 0.615 0.835 0.843 Ranking 9 9 13 13 20 20 20 20
Rangamati 43200 50350 52340 56390 0.774 0.791 0.986 0.963 Ranking 22 22 22 22 6 8 8 16
Sylhet 2228500 2204750 2133850 2108852 0.612 0.659 0.864 0.925 Ranking 2 1 2 2 19 18 16 19
Dhaka 1204440 1033540 1202530 1063917 0.764 0.746 1.065 1.118 Ranking 11 14 11 14 9 12 1 5
Faridpur 1292670 1171660 1259160 1134246 0.528 0.476 0.766 0.958 Ranking 8 10 10 11 22 23 21 17
Jamalpur 775900 847360 846560 849743 0.695 0.677 0.933 1.071 Ranking 17 17 18 18 15 17 14 10
Kishoreganj 1237720 1334890 1267680 1230882 0.765 0.852 1.029 1.195 Ranking 10 8 9 9 7 4 4 1
Mymensingh 1190030 1135730 1301270 1270531 0.633 0.656 0.946 0.971 Ranking 13 11 8 8 18 9 13 15
Tangail 708100 636640 757470 714475 0.653 0.727 0.996 1.107 Ranking 18 19 19 19 16 13 7 6
Barisal 1536400 1375590 1512520 1497400 0.563 0.496 0.666 0.735 Ranking 5 5 6 7 21 22 22 22
Jessore 1317040 1369730 1636180 1582275 0.787 0.844 0.977 1.190 Ranking 7 7 5 4 4 5 9 2
Khulna 1203620 1078780 1105790 1117000 0.645 0.701 0.843 0.955 Ranking 12 12 14 12 17 15 19 18
Kushtia 586780 518320 601790 575524 0.703 0.720 0.959 1.023 Ranking 20 20 20 20 14 14 10 14
Patuakhali 971780 1027230 1060660 1041475 0.430 0.528 0.626 0.659 Ranking 16 15 15 15 23 21 23 23
Bogra 1111430 1039260 1187030 1210934 0.886 0.886 1.049 1.119 Ranking 14 13 12 10 2 3 2 4
Dinajpur 1425510 1370300 1477960 1578019 0.738 0.701 0.857 1.029 Ranking 6 6 7 5 12 16 18 13
Pabna 704710 638790 887640 900754 0.741 0.771 0.953 1.093 Ranking 19 18 17 17 11 10 11 8
Rajshahi 1771560 1631660 1909170 2040576 0.779 0.807 1.022 1.148 Ranking 3 4 3 3 5 6 5 3
Rangpur 2338460 2145650 2265650 2273645 0.735 0.791 0.908 1.060 Ranking 1 2 1 1 13 7 15 11
Bangladesh 25786260 24617230 26543750 26018411 0.692 0.718 0.915 1.020
Source: BBS, Yearbook of Agricultural Statistics, Various Years and Authors' Calculations

91
Table 102: District and Division-wise Share of Manufacturing in Regional GDP,
Regional Per Capita Income in 1999-2000 (in 1995-96 constrant Prices) and Regional Per Capita Manufacturing Income in 1999-2000
Mansh Mansh Mansh Mansh Mansh Rpcin Rpcmin
1995-96 1996-97 1997-98 1998-99 1999-00 1999-00 1999-00
Barisal 3.822 3.850 4.073 3.873 3.829 14883.744 569.956
Barguna 2.315 2.398 2.350 2.263 2.241 16850.160 377.622
Barisal 6.727 6.546 7.000 6.741 6.737 14195.546 956.348
Bhola 2.703 2.704 2.965 2.754 2.732 14967.387 408.922
Jholkati 3.494 3.675 3.942 3.692 3.614 12981.010 469.176
Patuakhali 2.188 2.244 2.358 2.196 2.147 16943.104 363.734
Pirojpur 3.578 3.709 3.792 3.838 3.613 13255.865 478.954
Chittagong 15.022 15.121 15.599 15.311 15.227 16803.493 2558.724
Bandarban 0.179 0.225 0.239 0.247 0.260 15979.950 41.551
Brahmanbaria 10.596 10.552 10.671 10.833 10.814 14405.268 1557.813
Chandpur 5.308 5.514 5.189 5.276 5.257 12482.908 656.198
Chittagong 27.699 27.703 28.389 27.894 27.822 25190.259 7008.348
Comilla 6.904 7.118 7.513 7.351 7.306 12420.117 907.430
Cox's Bazar 6.802 6.647 6.701 6.326 6.310 17360.581 1095.389
Feni 8.085 8.366 8.766 8.421 8.411 12458.965 1047.927
Khagrachari 2.678 2.710 2.793 2.688 2.618 10480.833 274.337
Lakshmipur 2.668 2.842 3.132 2.830 2.767 14867.072 411.336
Noakhali 5.441 5.559 5.710 5.420 5.461 13093.260 714.993
Rangamati 5.396 5.604 5.758 5.427 5.373 17751.178 953.848
Sylhet 6.931 7.030 7.299 7.181 7.129 13332.018 950.416
Habiganj 3.855 4.014 4.120 4.109 4.133 13670.925 565.005
Maulavibazar 7.988 8.083 8.477 8.259 8.285 12851.773 1064.764
Sunamganj 6.067 6.050 6.278 6.252 6.279 12068.367 757.815
Sylhet 9.069 9.178 9.527 9.239 8.982 14368.081 1290.546
Dhaka 22.900 22.813 23.399 23.300 22.983 20310.262 4667.957
Dhaka 33.856 33.592 34.156 34.065 33.914 36554.420 12396.937
Faridpur 5.950 6.094 6.152 6.130 6.109 12606.973 770.189
Gazipur 39.878 39.655 40.176 40.582 40.330 30291.160 12216.470
Gopalganj 5.551 5.730 5.869 5.768 5.741 12999.493 746.284
Jamalpur 6.186 6.193 6.380 6.159 6.094 13141.986 800.926
Kishoreganj 4.827 5.038 5.189 5.034 4.983 13225.601 659.071
Madaripur 5.344 4.994 5.765 5.313 5.281 12229.171 645.800
Manikganj 9.799 9.456 10.100 10.036 9.936 14011.345 1392.224
Munshiganj 13.321 13.706 13.737 13.963 13.782 12930.577 1782.149
Mymensingh 3.708 3.974 4.054 3.888 3.744 14590.104 546.281
Narayanganj 38.059 37.925 38.511 38.576 38.338 27269.410 10454.562
Narsingdi 25.780 25.217 25.314 25.311 25.032 16859.689 4220.285
Netrokona 2.341 2.465 2.542 2.444 2.374 14486.057 343.859

92
Mansh Mansh Mansh Mansh Mansh Rpcin Rpcmin
1995-96 1996-97 1997-98 1998-99 1999-00 1999-00 1999-00
Rajbari 7.549 7.697 7.822 7.762 7.577 13052.271 989.005
Shariatpur 5.249 5.336 5.517 5.434 5.349 11944.775 638.922
Sherpur 4.461 4.437 4.512 4.386 4.440 12974.144 576.050
Tangail 8.400 8.312 8.636 8.535 8.338 12574.159 1048.496
Khulna 9.842 9.823 10.164 9.887 9.820 16654.195 1635.468
Bagerhat 3.864 3.882 4.058 3.804 3.769 16759.071 631.610
Chuadanga 7.542 7.489 7.673 7.509 7.372 14587.719 1075.436
Jessore 13.441 13.456 13.833 13.717 13.693 16946.023 2320.360
Jhenaidah 7.491 7.718 7.915 7.603 7.628 14984.171 1143.043
Khulna 13.560 13.370 14.055 13.664 13.556 22015.941 2984.439
Kushtia 14.251 14.241 14.462 14.138 13.994 15529.479 2173.168
Magura 4.988 5.021 5.033 4.953 4.963 14888.652 738.931
Meherpur 9.863 10.168 10.344 9.950 9.969 15255.044 1520.779
Narail 3.288 3.299 3.341 3.299 3.270 15349.409 501.932
Satkhira 6.363 6.318 6.612 6.293 6.243 14656.739 915.049
Rajshahi 7.374 7.320 7.477 7.243 7.160 14082.854 1008.283
Bogra 4.995 5.015 5.072 4.915 4.917 13886.254 682.791
Dinajpur 5.487 5.450 5.669 5.484 5.448 14698.460 800.762
Gaibandha 3.262 3.265 3.474 3.321 3.287 12105.018 397.930
Joypurhat 5.383 5.328 5.435 5.226 5.150 15456.431 795.931
Kurigram 2.697 2.606 2.540 2.508 2.515 13054.500 328.340
Lalmonirhat 1.983 1.967 1.965 1.893 1.869 12158.263 227.257
Naogaon 2.529 2.555 2.635 2.499 2.488 14110.731 351.104
Natore 8.721 8.847 9.495 8.935 8.793 15815.368 1390.611
Nawabganj 2.933 3.005 3.075 2.905 2.866 11890.009 340.796
Nilphamari 2.092 2.065 2.105 2.040 2.006 12191.163 244.608
Pabna 20.265 19.984 20.257 19.934 19.747 17316.408 3419.397
Panchagarh 2.664 2.699 2.701 2.586 2.576 13008.663 335.060
Rajshahi 7.228 7.379 7.447 7.164 7.040 15854.792 1116.187
Rangpur 5.532 5.520 5.690 5.566 5.562 13584.865 755.537
Serajganj 21.399 21.324 21.391 20.776 20.360 13205.137 2688.534
Thakurgaon 3.178 3.225 3.285 3.163 3.158 15355.025 484.878
Source: BBS, Regional Income Data 1995-96 to 1999-2000, and Authors' Calculation

93
Table 103: Economically Active Population (15+) (in '000) and Labour Force Participation Rates, 2005-06
Division/ Economically Active Pop. Participation Rate
District Total Male Female Total Male Female
Bangladesh 49461 37330 12131 58.47 86.80 29.17
Chittagong 9661 7254 2405 57.09 84.83 28.73
Bandarban 127 82 45 69.21 86.48 50.71
Brahmanbaria 1138 753 385 69.17 89.35 47.99
Chandpur 659 617 42 45.62 84.18 5.95
Chittagong 2908 2128 780 57.43 82.68 31.32
Comilla 1949 1393 556 59.03 85.49 33.26
Cox's Bazar 913 570 343 76.09 90.16 60.41
Feni 334 271 63 42.87 74.58 15.16
Khagrachari 165 138 27 54.60 88.03 18.48
Lakhsmipur 414 383 30 45.33 87.24 6.42
Noakhali 829 766 62 47.37 84.26 7.39
Rangamati 225 153 72 66.11 87.71 43.25
Dhaka 15621 11657 3967 58.52 86.51 30.02
Dhaka 3498 2758 741 52.12 81.82 22.17
Faridpur 674 541 133 56.24 85.99 23.40
Gazipur 991 603 388 71.51 88.89 54.86
Gopalganj 356 317 40 45.94 81.21 10.34
Jamalpur 1077 599 479 84.86 92.24 77.13
Kishoreganj 896 718 179 55.14 87.84 22.10
Madaripur 471 359 111 58.64 88.35 28.11
Manikganj 613 420 193 66.00 88.00 42.73
Munshiganj 471 380 91 51.44 86.46 19.12
Mymensingh 1658 1204 453 61.43 88.69 33.80
Narayanganj 849 705 145 51.98 85.95 17.78
Narshingdi 660 537 122 54.21 85.79 20.71
Netrokona 752 586 166 58.18 87.74 26.59
Rajbari 377 310 67 57.38 90.30 21.32
Sariatpur 420 317 103 58.50 86.71 29.24
Sherpur 666 374 292 84.00 92.02 75.57
Tangail 1192 929 264 57.54 89.80 25.40
Khulna 5722 4451 1271 57.250 87.360 25.930
Bagerhat 592 440 152 59.39 86.37 31.17
Chuadanga 402 302 100 60.79 88.94 31.04
Jessore 925 723 202 56.57 86.70 25.20
Jhenaidah 584 498 87 53.91 88.22 16.71
Khulna 924 768 156 53.46 87.14 18.46

94
Division/ Economically Active Pop. Participation Rate
District Total Male Female Total Male Female
Kushtia 758 513 244 65.29 87.40 42.62
Magura 330 269 61 55.30 88.62 20.88
Meherpur 244 170 74 67.12 90.84 42.02
Narail 287 226 61 55.66 84.28 24.60
Satkhira 676 542 134 53.96 87.53 21.10
Rajshahi 11282 8784 2500 58.39 88.26 26.68
Bogra 1013 822 191 53.09 85.89 20.06
Dinajpur 1146 763 383 68.09 89.83 45.94
Gaibandha 647 568 80 49.82 87.84 12.19
Joypurhat 268 239 29 51.37 88.35 11.54
Kurigram 601 517 84 52.59 87.79 15.16
Lalmonirhat 439 333 107 60.99 88.91 30.82
Naogaon 774 658 116 54.19 90.21 16.60
Natore 499 420 79 53.90 86.74 17.91
Nawabganj 523 414 110 57.98 90.61 24.57
Nilphamari 529 492 37 51.77 91.11 7.71
Pabna 1004 686 318 67.25 86.29 45.55
Panchagarh 424 254 169 75.59 87.20 63.00
Rajshahi 782 669 113 54.26 88.11 16.60
Rangpur 821 727 94 51.62 90.62 11.93
Sirajganj 1196 868 328 63.75 87.22 37.24
Thakurgaon 616 354 262 76.56 86.33 66.39
Barisal 3554 2583 970 61.55 86.94 34.61
Barguna 415 261 154 70.82 88.47 52.98
Barisal 890 698 191 54.43 83.41 23.98
Bhola 895 590 305 71.45 89.34 51.51
Jalokati 235 201 34 49.84 86.18 14.37
Patuakhali 723 501 222 66.92 88.92 42.95
Perojpur 396 332 64 52.91 86.74 17.52
Sylhet 3621 2603 1019 61.56 87.82 34.91
Hobiganj 884 601 283 68.05 92.25 43.68
Moulavibazar 714 500 215 64.00 91.09 37.82
Sunamganj 971 685 286 65.15 88.68 39.81
Sylhet 1052 817 235 53.19 82.45 23.82
Source: BBS Labor Force Survey 2005-06

95
Table 104: Unemployment Rate (15 years and above) by Division and District, 2005-06
Unemployment Rate (15+) (in percent)
Division/ Bangladesh Urban Rural
District Total Male Female Total Male Female Total Male Female
Bangladesh 4.254 3.349 7.040 4.305 3.546 6.676 4.238 3.287 7.151
Chittagong 4.782 4.453 5.780 5.175 5.003 5.819 4.670 4.304 5.779
Bandarban 2.362 2.439 2.222 0.000 0.000 0.000 3.093 3.279 2.857
Brahmanbaria 1.406 0.664 2.597 1.613 1.087 3.125 1.381 0.756 2.550
Chandpur 4.097 3.890 7.143 3.659 2.778 11.111 4.159 4.044 6.061
Chittagong 5.330 5.028 6.154 5.384 5.762 4.101 5.284 4.183 7.576
Comilla 4.002 4.523 2.698 5.769 5.000 8.333 3.848 4.478 2.308
Cox's Bazar 0.986 1.404 0.292 3.614 3.175 0.000 0.843 0.984 0.311
Feni 20.060 11.808 55.556 11.628 5.263 60.000 21.306 12.876 55.172
Khagrachari 3.636 2.899 7.407 6.667 5.405 12.500 2.479 1.980 5.263
Lakhsmipur 10.386 9.399 20.000 1.852 2.041 25.000 11.389 10.778 19.231
Noakhali 6.031 4.439 25.806 6.250 3.077 21.429 6.142 4.708 27.083
Rangamati 3.556 4.575 0.000 7.273 8.696 0.000 1.765 2.778 0.000
Dhaka 5.928 3.354 13.486 4.361 2.872 8.819 6.799 3.630 16.003
Dhaka 2.344 2.647 1.215 1.950 2.148 1.192 7.090 8.586 2.899
Faridpur 2.819 3.512 0.752 1.149 1.667 0.000 3.066 3.534 0.943
Gazipur 23.108 3.483 53.608 15.718 3.716 40.559 28.986 3.268 61.382
Gopalganj 3.933 4.101 2.500 2.857 4.167 0.000 4.037 4.110 3.333
Jamalpur 0.464 0.668 0.209 0.000 0.000 0.000 0.556 0.795 0.252
Kishoreganj 7.589 5.153 17.318 4.237 3.125 8.696 8.098 5.466 19.231
Madaripur 2.972 2.786 3.604 11.538 9.524 30.000 1.914 1.893 0.990
Manikganj 17.455 6.429 41.451 14.286 14.286 16.667 17.647 5.882 42.246
Munshiganj 11.253 12.105 7.692 14.815 13.333 22.222 10.817 12.275 6.098
Mymensingh 2.232 2.492 1.545 2.730 2.959 2.419 2.125 2.413 1.216
Narayanganj 4.829 3.688 10.345 6.250 4.450 12.712 2.295 2.518 0.000
Narshingdi 3.636 2.421 9.016 1.818 1.000 0.000 4.000 2.740 9.821
Netrokona 7.181 3.413 20.482 9.459 5.455 20.000 7.090 3.202 21.233
Rajbari 2.653 2.258 5.970 1.786 2.564 5.882 2.804 2.214 6.000
Sariatpur 3.333 2.839 5.825 5.405 7.692 0.000 3.394 2.414 6.452
Sherpur 0.450 0.802 0.000 0.000 0.000 0.000 0.504 0.896 0.000
Tangail 12.584 3.660 44.318 16.505 3.540 31.183 11.854 3.558 50.877
Khulna 2.866 2.561 3.934 4.362 3.952 5.611 2.442 2.205 3.406
Bagerhat 3.716 2.955 5.921 5.195 4.762 7.143 3.301 2.387 5.797
Chuadanga 0.995 0.993 0.000 1.905 1.299 0.000 0.673 0.889 0.000
Jessore 1.946 1.660 2.970 0.943 1.575 0.000 2.388 1.846 5.128

96
Unemployment Rate (15+) (in percent)
Division/ Bangladesh Urban Rural
District Total Male Female Total Male Female Total Male Female
Jhenaidah 1.027 1.004 1.149 2.151 1.639 0.000 0.815 0.688 1.818
Khulna 5.952 4.818 11.538 6.767 5.594 11.650 4.835 4.130 11.111
Kushtia 1.319 1.754 0.410 1.563 2.041 0.000 1.299 1.724 0.437
Magura 2.121 0.372 8.197 2.857 0.000 14.286 1.695 0.415 7.407
Meherpur 1.230 1.765 0.000 4.167 5.000 0.000 0.913 1.333 0.000
Narail 3.136 2.655 4.918 0.000 0.000 0.000 3.462 2.899 3.774
Satkhira 4.438 4.244 4.478 8.696 7.692 28.571 4.127 4.175 3.937
Rajshahi 2.819 2.823 2.800 3.050 3.136 2.796 2.772 2.751 2.804
Bogra 3.060 2.920 3.665 2.759 3.509 0.000 3.111 2.966 4.403
Dinajpur 0.960 1.048 0.783 1.744 1.852 1.563 0.821 0.916 0.627
Gaibandha 5.410 5.282 5.000 4.412 1.786 16.667 5.527 5.664 4.478
Joypurhat 1.866 1.674 3.448 3.704 4.167 0.000 1.660 1.395 3.846
Kurigram 1.830 1.161 5.952 0.000 0.000 0.000 2.227 1.345 10.204
Lalmonirhat 1.367 0.901 2.804 0.000 0.000 0.000 1.583 1.020 3.529
Naogaon 3.230 2.888 5.172 4.054 5.085 0.000 2.996 2.671 5.882
Natore 2.405 1.905 6.329 2.778 3.448 7.143 2.342 1.657 6.154
Nawabganj 6.119 5.314 9.091 5.385 7.368 0.000 6.107 4.702 12.162
Nilphamari 1.323 1.016 2.703 1.266 1.587 6.250 1.111 0.932 4.762
Pabna 2.988 4.373 0.000 1.523 1.282 0.000 3.346 5.094 0.000
Panchagarh 1.887 2.362 1.183 2.174 4.000 0.000 1.592 2.174 1.351
Rajshahi 4.476 3.587 9.735 4.235 4.082 4.839 4.622 3.302 15.686
Rangpur 1.462 1.100 5.319 1.596 0.730 1.961 1.580 1.017 6.977
Sirajganj 4.348 5.530 1.524 7.627 8.602 4.000 3.985 5.161 0.987
Thakurgaon 0.812 0.847 0.763 4.444 3.704 5.556 0.524 0.612 0.410
Barisal 4.755 4.568 5.258 5.325 5.585 4.545 4.662 4.442 5.244
Barguna 5.060 4.981 5.195 5.455 2.941 4.545 5.278 5.286 5.263
Barisal 4.607 5.301 2.094 5.696 6.667 2.632 4.241 5.009 1.961
Bhola 3.464 4.068 2.295 4.724 6.818 0.000 3.255 3.586 2.632
Jalokati 6.809 5.970 11.765 5.405 5.882 0.000 7.071 6.024 12.903
Patuakhali 5.809 4.591 8.108 6.452 4.545 11.111 5.598 4.595 7.843
Perojpur 4.798 3.012 14.063 2.941 1.786 8.333 4.878 2.909 15.385
Sylhet 1.823 2.151 0.981 2.956 2.994 4.110 1.680 2.070 0.740
Hobiganj 0.905 0.832 1.060 2.804 1.266 7.143 0.644 0.766 0.392
Moulavibazar 1.961 1.800 2.326 3.077 1.961 7.143 1.849 1.782 1.990
Sunamganj 1.545 2.044 0.350 2.299 2.817 0.000 1.471 1.951 0.372
Sylhet 2.757 3.305 0.426 4.082 4.511 0.000 2.544 3.216 0.452
Source: BBS Labor Force Survey 2005-06, and Calculations

97
Table 105: Some Indicators for Eastern and Western Region
2000 2005
LIR IR LIR IR
Head count ratio (upper poverty line) 53 46 50 33
Real per capita expenditure 727 800 1046 1207
Electricity in Mouza 67% 63% 80% 83%
BD Krishi Bank in Mouza 7% 17% 27% 45%
Commercial Bank in Mouza 17% 17% 25% 40%
Grameen Bank in Mouza 13% 13% 29% 40%
Market/Bazar in Mouza 53% 61% 64% 77%
Distance to thana HQ (km) 10.7 11.1 9.7 15.5
Travel time to thana HQ ('00 mins) 0.6 0.7 0.5 0.7
Distance to zila HQ (km) 27.7 33.0 28.6 33.5
Travel time to zila HQ ('00 mins) 1.1 1.2 1.0 2.0
Distance to Dhaka HQ (km) 296.2 169.7 294.4 168.7
Travel time to Dhaka HQ ('00 mins) 4.2 3.0 4.5 3.2
Any banks in Mouza 25% 24% 35% 46%
Source: Shilpi (2009), from HIES 2000 and HIES 2005
Table 106: Distribution of Households Receiving Benefits of Social Safety Net Programmes, 2005
Division % of Household Received Benefit
Total Rural Urban
National 13.06 15.64 5.45
Barisal 13.34 14.79 5.00
Chittagong 11.05 12.89 5.72
Dhaka 14.33 19.98 4.94
Khulna 9.51 11.03 4.23
Rajshahi 12.35 13.02 7.71
Sylhet 22.42 24.31 11.25
Source: HIES (2005)
Table 107: Reductions in Central Government Transfers (Government grants to Pourashavas, 1996-2002)
Year Total Municipal Number of Average Govt. Grants for
Pourashavas (million TK.)
Govt. Grants (million TK.) Pourashava
1996-97 1200 133 9.02
1997-98 1050 160 6.56
1998-99 1150 181 6.35
1999-00 1250 213 5.87
2000-01 1300 226 5.75
2001-02 1300 252 5.16
2002-03 1200 276 4.35
Source: Ministry of Local Government, GoB, Dhaka in World Bank (2007)
98
Part 2: Technical Framework
Macroeconomic Scenario for the Sixth Five Year Plan
(2011-2015)

99
Introduction
A centre piece of the plan is the delineation of the country’s macroeconomic outlook during the
SFYP. Based on the technical framework, background studies and related work, this paper
provides three scenarios of macroeconomic outlook4. These have been supplemented by sectoral
outlooks as well as employment and poverty implications.
Technical Framework for SFYP Scenario
The scenarios are generated using four linked models. These are:
• A macro-economic framework containing five accounts delineating the economy to generate
consistent macro economic outlook over 2003 to 2015 period.
• A dynamic computable general equilibrium (DCGE) model based on an updated input-output
table and a social accounting matrix for Bangladesh for FY07. The key outcomes of the
macroeconomic framework are fed into the DCGE model to derive the sectoral implications.
• An Employment Satellite Matrix (ESM), constructed for FY07. The sectoral value additions
and outputs are linked with the ESM to calculate sectoral employment impacts under
alternative scenarios.
• The Distribution and Poverty Module has been developed using the information of
Household Income and Expenditure Survey (HIES) 2005. Household income, consumption
and sectoral price information generated in the DCGE are linked with this module to assess
the poverty situation.
The rest of the note is organized as follows. In sections 3 and 4, key features the modeling
system are discussed. The macroeconomic outlooks under three alternative scenarios are
provided in section 5.
4 These scenarios are undergoing revisions to reflect revised data for the base years as well as changes in key assumptions; parameter and elasticity values. Therefore, the final macroeconomic scenario for the SFYP may show some differences than the scenarios presented in this report.

100
Modeling System and Its Interdependence
The interdependence of the modeling system is shown in Figure 1.
Figure 1: Interdependence of SFYP Modeling System
Real Side
Budget
Money
BOP
Debt
Prices
Macro Frame
Projection:2011-15
Data: 2002-10
IOT 2006/07
SAM 2006/07
Production andSupply
Factor Market
Government
Household
SectoralDynamic CGE(SDCGE)
External
Prices
Projection:2011-15
Benchmarked2010
Distributionand PovertyModule
6FYP Indicators
EmploymentSatteliteModule
Modelling System for 6FYP
Inputs from Macro frame to SDCGE Model

101
Macroeconomic Framework
The Macroeconomic Framework (MEF) has been developed to assist the preparation of short and
medium term macroeconomic outlook for the SFYP. The MEF architecture is best described as
an extension of the ‘Finance Programming’ family of models.5,6 The MEF extends the
characteristics of the Finance Programming Model by incorporating an explicit specification of
output generation that takes into account production and factor market behaviour, incorporation
of response parameters for key behaviours. It accounts for the linkages of production with
money-and-credit, the balance of payments, and the government budget. The system has an
integrated distribution and poverty module for examining the linkage between growth and
poverty, which further extends MEF analytical capability.
The main feautres of the MEF are:
1. The MEF consists of five accounts: (i) real side; (ii) fiscal; (iii) money and credit; (iv)
balance of payments (BoP); and (v) poverty and distribution. In addition to these blocks, a
debt block is appended to capture debt dynamics.
2. Behavioural specifications for some keys variables namely the production function; revenue
functions; capital formation; private investment functions; private consumption, CPI etc are
defined. Real income generation is specified by a Cobb-Douglas function. Real private
consumption, real private investment, CPI, real exports and imports are specified using
estimated response parameters.
3. There are three ways of estimating the parameters of individual equations of the specified
model. The choices are: (i) econometric/statistical estimation, (ii) exact
computation/calibration, (iii) a mixture of econometric and calibrated estimates. In MEF,
paramters of the framework are specified using a a mixture of econometric and calibrated
estimates.
4. All accounts are inter-linked. Inter-dependence between variables of different blocks namely
between real side and government budget; government budget, money and BoP; money and
real side are active. For instance, domestic revenue generation critically depends on two
components: (i) revenue base and (ii) tax rate. The normal growth of revenue base depends
on the growth of the economy i.e. the revenue base is linked to the estimated GDP and
import values.
5 Barth, R.C., and Hemphill, W. (2000): Financial Programming and Policy: The Case of Turkey, Washington: IMF Publication Services. 6 ‘Theoretical Aspects of the Design of Fund-supported Adjustment Programmes’ Occasional Paper 55, Washington DC: International Monetary Fund, Sept 1987. “... A Financial Programming Model is an instrument composed of accounting identities complemented by a set of behavioral relationships. For analysis, this instrument can be applied to any package of policy measures designed to achieve a given set of user-defined macroeconomic goals. The MEF architecture expresses exactly these attributes; and the expression occurs within the context of consistent economic frameworks (SAM/Flow-of-Funds) that can be moved forward in time to analyze and forecast policy impacts on the economy.

102
5. All key prices are endogenous. These include:
• Consumer price index
• Investment price
• Export price
• Import price
• GDP deflator
• Exchange rate
Data and Parameters
Data period considered in MEF is FY03 to FY10. The figures for FY10 are estimates. Almost all
data used in the macroeconomic framework has been collected from secondary sources such as
the Finance Division. Data sets (e.g. from mid-1980s to current years) for regression analyses
were obtained from various officials documents such as Economic Review and Bangladesh
Statistical Year Books. The deficit data have been provided by the Finance Division. Breakdown
of value added (i.e. GDP) by labour and capital was obtained from the updated social accounting
matrix (SAM) for Bangladesh for 2005. The World Economic Outlook forecasts were reviewed
to get parameters for external sector (e.g. world prices of imports and exports, world inflation
rate etc.).
As mentioned above, the time series data covering the period between the mid 1980s and the
current years (in most cases thereby providing 20 to 25 year time series) were available to assess
the regression coefficients (i.e. response parameters) of the explanatory variables. Regressions
were conducted for real private investment; real private consumption; real exports; real imports;
and consumer price index. The values of response parameters (i.e. estimated regression
coefficients) are then linked to the relevant explanatory variables to first assess the generation of
the series of explained variable in question.
Model Specification
Specification of the macroeconomic framework is discussed in this section. These are discussed
in terms of five sub-sections such as (a) Production, Supply and Demand; (b) Government
Income and Expenditure; (c) Balance of Payment; (d) Money and Credit; and (e) Government
Debt.

103
Following notations are introduced for identification and references.
Symbol Description
R = Real Variable
─1 = Previous Year
G = Growth Rate
T = Tax Rate
∆ = Change over previous year
T = Time
Production, Supply and Demand
Nominal Variables
1. Nominal GDP GDP = r_GDP * PGDP
Derivations of r_GDP and GDP deflator are provided in equations (6)
and (26) respectively.
2. Private
Consumption
Cpv =(Cpv-1 *(r_Cpv / r_Cpv-1)*(1+CPI))
Derivations of real private consumption (r_Cpv) and CPI are provided
in equations (12) and (18) respectively.
3. Government
Consumption
Cg = (Cg-1 * ((PAL + GDS)/(PAL-1 + GDS-1))
Allocations for Pay-allowances and good-services are found in current
expenditure component of government budget (see equations 44 and
45)
4. Private
Investment
Ipv = (Ipv-1 *(r_Ipv / r_Ipv-1)*(1+PI))
Derivations of real private investment (r_Ipv) and PI are provided in
equations (9) and (25) respectively.
5. Public
Investment
Ipb = ( Ipb-1 * ((ADP + Non-ADP)/(ADP-1 + Non-ADP-1))
ADP and Non-ADP allocations are found in expenditure component of
government budget (see equations 51 and 52)

104
Real Variables
Two alternative specifications are employed to specify the real production of good and services.
In the first specification, labour and capital factors are organized in a Cobb-Douglas production
function to generate real value addition (i.e. r_GDP). The specification is shown below.
6. Real GDP βα KALGDPr =_
Where, α and β denote labour and capital shares respectively.
Separation of real value addition between labour and capital factors is
not readily available for all years of the data period. As an alternative
data on the distribution of real value added between labour and capital
factors found in the input-output table (IOT) of Bangladesh for 2007
has been used to separate the real value added between labour and
capital7.
Once the values of α and β parameters are known, the only unknown
parameter (i.e. A─ shift parameter or intercept term) is calculated
using the following specification.
βαKL
GDPrA
_=
6.1 Real GDP r_GDP = r_GDP-1*(1+g r_GDP)
Alternatively real GDP or real value addition can be specified to grow
at assumed rates or rates based on observed (reported) ICOR. A
‘switch’ function (i.e. logical option attribute available in Excel) is
used to switch between the endogenous specification (equation 6) and
exogenous specification (equation 6.1).
7. Capital Stock K = Ks *(1─ κ)
Gross Capital is depleted annually by the depreciation and obsolescence to provide net capital stock available for production. Here κ refers to the rate of depreciation and obsolescence.
Gross capital stock is specified as: Ks = K0 + r_I-1. The specification envisages one year lag between planned and realized investment (given the experience of Bangladesh this appears a reasonable assumption).
7 Values of all parameters (including production function) are contained in the five worksheets of the macro economic framework.

105
8. Labour
Demand K
w
rL
β
α=
Labour demand is usually derived from the solution of the first order
cost minimization condition involving the production function and the
cost function (i.e. C = wL + rK). Here w and r denote returns to labour
and capital respectively. The demand function suggests that, given the
ratios of factor share and factor return, increase in capital led to a
proportionate rise in labour demand. For instance, doubling of capital
will double the labour demand.
Such a strong proportionate relationship can be modified by imposing
labour absorption elasticity with respect to capital. Such a
modification may allow us to invoke feature the observed condition of
jobless growth or growth with less than proportionate employment.
The modified labour demand function may take the following form8.
ρ
β
α /1Kw
rL =
Alternatively, constant elasticity substitution (CES) function or
generalized Leontief function may also be adopted to specify the
production behaviour.
9. Real Private
Investment
r_Ipv = ψ0 + ψ1* ∆ GDP + ψ2* r_GDP-1
Although a number of explanatory variables may explain the real
private investment, a review of estimated equations (please Annex 4)
suggests above specification to be the appropriate one given data
constraints, statistical significance and relevance (or linkages) to other
variables used in this framework.
10. Real Public
Investment
r_Ipb = (r_Ipb-1 * (Ipb / Ipb-1) / (1+PI))
Derivations of public investment (Ipb) and investment price (PI) are
provided in equations (5) and (25) respectively.
11. Real
Investment
r_I = r_Ipv + r_Ipb
8 Alternatively, labour demand may assume to grow at the observed growth rate reflecting a steady state. According to labour force statistics labour demand grew at 4 percent between 2000 and 2003 and by 5 percent between 2003 and 2005. In this exercise, scope to adopt alternative specifications – modified labour demand and steady state is allowed to assess impacts of these specifications.

106
12. Real Private
Consumption
r_Cpv =λ0 + λ1* r_GDP + λ2 * ∆ GDP ─ λ3 * ATD Rate
Although a number of explanatory variables may explain the real
private consumption in Bangladesh, a review of estimated equations
suggests above specification to be the appropriate one given data
constraints, statistical significance and relevance (or linkages) to other
variables used in this framework.
13. Real
Government
Consumption
r_Cpb = (r_Cpb-1 * (Cpb / Cpb-1) / (1+CPI))
Derivations of public consumption (Cpb) and CPI are provided in
equations (3) and (18) respectively.
14. Potential real
GDP
r_TGDP =γ0 + γ1* T
Where, γ0 and γ1 denote intercept and slope parameters.
15. Excess
Demand
Excess Demand (GAP) = r_TGDP ─ r_GDP
16. Real Imports r_M = µ0 + µ1* r_GDP + µ2 *GAP+ µ3 * r_Remit
Although a number of explanatory variables may explain the real
private imports in Bangladesh, a review of estimated equations
suggests above specification to be the appropriate one given data
constraints, statistical significance and relevance (or linkages) to other
variables used in this framework.
17. Real Exports r_E = ή0 + ή1* r_GDP + ή2 *GAP
Although a number of explanatory variables may explain the real
private exports, a review of estimated equations (please Annex 4)
suggests above specification to be the appropriate one given data
constraints, statistical significance and relevance (or linkages) to other
variables used in this framework.

107
Prices
18. Consumer
Price Index
CPI = φ0 + φ1* M2 + φ2 * Deficit ─ φ3 * (Subsidy + Food
Allocations)
Although a number of explanatory variables may explain the
consumer price index in Bangladesh, a review of estimated equations
suggests above specification to be the appropriate one given data
constraints, statistical significance and relevance (or linkages) to other
variables used in this framework.
19. Import Price PM = MPI *(1+ AER + Tm )
20. Import Price Index
MPI = MPI-1 * (1+ gM_Deflator)
Following small country assumption, Bangladesh is a price taker and thus import and export indices are exogenous. Lagged import price index is adjusted by growth of import deflator (gM_Deflator). Growth of import deflator is based on the estimates of the ‘World Economic Outlook’.
Variation in world price import will thus transmit to the domestic economy via these two prices (i.e. PM and MPI).
21. Export Price PE = EPI * (1+ AER)
22. Export Price
Index
EPI = EPI-1 * (1+ gE_Deflator)
Lagged export price index is augmented by growth of export deflator
(gE_Deflator) which is based on the estimates of the ‘World
Economic Outlook’.
23. Average
Exchange
Rate
⋅
+
+⋅=
−
−
1
1Re
Re
1
1
R
R
gFPI
gCPIAERAER
Where, gCPI= domestic inflation; gFPI = foreign inflation which is
exogenous and based on world economic outlook; ReR = Real
effective exchange rate. Values of real effective exchange rate are
exogenous.
24. Exchange
Rate End
Period
( ) 12 −−⋅= ERPAERERP
Where, FRP-1 = lagged value of end period exchange rate.

108
25. Investment
Price Index
PI = ζm * PM + ζd * CPI
Where, ζm = share capital goods import; ζd = share domestic capital
goods.
26. GDP Deflator PGDP = CPI *(r_Cpv / r_GDP) + CPI *(r_Cg / r_GDP) +
PI *(r_Ipv / r_GDP) + PI *(r_Ipb / r_GDP) +
PE *(r_E / r_GDP) ─ PM *(r_M / r_GDP)
Accounting identity states GDP = Cpv + Cpb + Ipv + Ipb + E ─
M.
Dividing both sides by r_GDP gives:
GDPr
M
GDPr
E
GDPr
Ipv
GDPr
Ipv
GDPr
Cpb
GDPr
Cpv
GDPr
GDP
____
___
−+
++=
<
The terms on the right-hand side may be decomposed into two
factors as follows:
+++=GDPr
Ipvr
Ipvr
Ipv
GDPr
Cpbr
Cpbr
Cpb
GDPr
Cpvr
Cpvr
Cpv
GDPr
GDP
_
_
__
_
__
_
__
GDPr
Mr
Mr
M
GDPr
Er
Er
E
GDPr
Ipbr
Ipbr
Ipb
_
_
__
_
__
_
_−+

109
This gives us the specification for GDP deflator as follows.
+++=GDPr
IpvrPI
GDPr
CpbrCPI
GDPr
CpvrCPIPGDP
_
_
_
_
_
_
GDPr
MrPM
GDPr
ErPE
GDPr
IpbrPI
_
_
_
_
_
_−+
Fiscal Side: Government Income and Expenditure Revenue
Revenue mobilization is usually classified under three heads in Bangladesh-NBR tax; Non-NBR
tax and Non-tax revenue. Almost all major tax sources are covered under the NBR tax head and
thus constitute the major revenue source. All types direct and indirect taxes are covered under
this head. In order to provide scopes to assess implication of tax base change as well as tax rate
change on revenue, revenue specifications are defined in terms of estimated legal tax bases and
effective tax rates. Legal bases of a particular tax system constitute a smaller segment of the
corresponding economy-wide bases (i.e. GDP for domestic taxes, imports for trade taxes, etc.),
which are considered as the tax bases for levying tax rates. Legal bases (for instance the base of
domestic VAT) are usually significantly smaller than the economy-wide bases (the economy-
wide base for domestic VAT is GDP or consumption) due to exemptions, exclusions and
deductions. Following example describes the relationship between economy-wide base and the
legal base.
Tax Revenue = Legal Tax Base x Tax Rate. Where, Legal Tax Base ≤ Economy Wide Base.
The advantages of this specification are briefly discussed.
• It allows endogenous adjustment of the legal bases due to variations in the corresponding
economy-wide bases.
• It thus shows, with fixed tax rates, revenue changes due mainly to the endogenous legal
base change.
• The size of legal bases can be altered by introducing new measures to change coverage.
• It thus captures, with fixed tax rates, revenue changes due to the endogenous legal base
change and new measures led coverage change.

110
• It also captures, with varying legal bases (either due to endogenous change or due to new
coverage measures), revenue changes due to the imposition of new tax rates.
The major problem with the above specification is the non availability of legal base data by
various tax systems. However, this information can be obtained from the records of the National
Board of Revenue (NBR)9.
As mentioned above, according to the adopted classification, total revenue is composed of tax
revenue and non tax revenue. Tax revenue is generated from two broad heads: NBR taxes and
Non-NBR tax. NBR tax accounts for about 95 percent of tax revenue collection. It includes
revenue mobilization from income bases; domestic production/consumption bases and
international trade bases. The revenue generations are defined below.
27. Total Revenue Total Revenue = Tax Revenue + Non Tax Revenue
28. Tax Revenue Tax Revenue = NBR Tax + Non NBR Tax
29. NBR Tax NBR Tax = YTax + DoMTax + Trade Tax
30. Income Tax YTax = YhTAX + YcorTAX
Specifications of personal income tax (YhTAX) and corporate
income tax (YcorTAX) are discussed below.
31. Personal
Income Tax
YhTAX = b_YhTAX x tyh
Where, b_YhTAX = [υ1 x Yh]; υ1 = current coverage; tyh = average
income tax rate. Household income is defined as Yh = GDP +
Remittance. Household income generation is endogenous.
32. Corporate
Income Tax
YcorTAX = b_YcorTAX x tycor
Where, b_YcorTAX = [υ2 x GDP]; υ2 = current coverage; tycor = average corporate income tax rate. Appropriate base for the corporate income tax is corporate profit. Since data on the corporate profit is not readily available, as a proximate base GDP is used.
33. Taxes on
Domestic
Production
DoMTax = DoMVAT + DoMSUP + ExciseDuty + OtherTax
Specifications of these taxes are discussed below.
9 In an earlier paper Mansur and Khondker (1994) estimated the legal base of the Bangladesh tax system. For details please see Ahsan H. Mansur and Bazlul Haque Khondker (1994), “Some Estimates of Tax Potential with Reference to Bangladesh”, Dhaka University Journal of Business Studies, Vol. 15(1), 117-119.

111
34. Domestic VAT
Revenue
DoMVAT = b_DoMVAT x tvat
Where, b_DoMVAT = [α1 x GDP]; α1 = current coverage; tvat = vat
rate. The economy wide base GDP is derived endogenously in the
real side.
35. Domestic
Supplementary
Duty
DoMSUP = DoMVAT x tsd
Where, tsd = supplementary duty rate
36. Excise Duty ExciseDuty= b_ExcDuty x texcise
Where, b_ExcDuty = [α2 x GDP]; α2 = current coverage; texcise =
excise duty
37. Other Tax
Revenue
OtherTax= b_OthTax x tothtax
Where, b_OthTax = [α3 x GDP]; α3 = current coverage; texcise =
other tax rate
38. Taxes on
International
Trade
Trade Tax = CustomDuty + MVAT + MSUP
Specifications of these taxes are discussed below.
39. Custom Duty CustomDuty= b_CuSDuty x tcd
Where, b_CuSDuty = [σ1 x M]; σ1 = current coverage;
tcd = Custom Duty. The economy wide base import (M) is derived
endogenously in the real side and BoP side.
40. Import VAT MVAT= b_MVAT x tvat
Where, b_MVAT = [(σ2 x M) + (CustomDuty) ];
σ2 = current coverage; tvat = vat rate
41. Supplementary MSUP = MVAT x tsd

112
Duty
Where, tsd = supplementary duty rate
42. Non NBR Tax
Revenue
Non NBR Tax = NonNBRTax-1 * (1+gNonNBRTax)
Where, gNonNBRTax = Non NBR tax growth. Non NBR tax growth
adopted for the projection period in the trend case may be varied
under scenario simulation indicating changed policy outlook.
43. Non Tax
Revenue
Non Tax = NonTax-1 * (1+gNonTax)
Where, gNonTax = Non tax growth. Growth rates adopted for the
projection period in the trend case may be varied under scenario
simulation indicating changed policy outlook.
Expenditure
Government expenditure is classified into four different categories. These are (i) pay-allowances
and purchases of goods and services; (ii) interest payment on domestic and external debt; (iii)
subsidies and transfers; and (iv) Capital and development expenditure.
Specifications for pay and allowances and purchases of goods and services are provided below.
44. Pay and
Allowances
PAL = PAL-1 * [1+ (gPAL+ θgCPI)]
Where, gPAL = pay and allowance growth; θgCPI = inflation indexing subject to the value of θ. The value of θ ranges between 0 and 1. Condition θ = 0 implies no inflation indexing whereas condition θ = 1 delineates full inflation indexing. CPI is derived endogenously. Value of gPAL captures rise in pay and allowances due to new employment and measures.
45. Goods and
Services
GDS = GDS-1 * [1+ (gGDS+ θgPGDP)]
Where, gGDS = good and services growth; θgPGDP = general price
indexing subject to the value of θ. The value of θ ranges between 0

113
and 1. Condition θ = 0 implies no indexing whereas condition θ = 1
delineates full inflation indexing. GDP deflator is derived
endogenously. Value of gGDS captures increased allocation for new
purchases.
A significant part of resources is spent to pay for interest accrued to domestic and external debt.
The size of interest payment depends on debt dynamics. Interest payment projections are derived
in the debt block and hence are obtained directly from the debt block.
46. Domestic
Interest
DoMInTPay
Derived in the debt block. See equation 69.
47. External
Interest
ExTInTPay
Derived in the debt block. See equation 70.
Allocations for subsidies and various transfer programme have been increasing in recent years to
mitigate real income loss of various vulnerable groups as; income loss of public enterprises and
to restrict full incidence of world prices of key importable on the domestic economy10. The
specifications for transfers and subsidies are provided below.
48. Subsidy and
Transfers
SAT = SAT-1 * [1+ (gSAT+ χ1PM)]
Where, gSAT = subsidy and transfer growth; χ1PM = indexing to rise
in import prices of other than food items (i.e. fuel and fertilizer)
subject to the value of χ1. The value of χ1 ranges between 0 and 1.
Condition χ1 = 0 implies no indexing whereas condition χ1 = 1
delineates full indexing. Value of gSAT envisages trend rise as well
as rise due to new measures.
49. Block
Allocation
BAC = BAC-1 * (1+gBAC)
Where, gBAC = block allocation growth.
10 Although it is expected that subsidies restraint full transmission of world import prices the association between subsidy and CPI could not tested due to lack time series data. We could collect data for 10 years i.e. 1989 to 2007.

114
50. Food Account FAC = FAC-1 * [1+ (gFAC+ χ2PM)]
Where, gSAT = subsidy and transfer growth; χ2PM = indexing to rise
in food import prices subject to the value of χ2. The value of χ2
ranges between 0 and 1. Condition χ2 = 0 implies no indexing
whereas condition χ2 = 1 delineates full indexing. Value of gFAC
envisages trend rise as well as rise due to new measures.
The main objectives of development and capital expenditures are to create opportunities for
economic growth in line with the overall development perspective. Thus allocations may vary in
accordance to the development goals. Such decisions although consistent with the development
goals and other key parameters, they are usually exogenous to the system. The specifications of
the development and capital expenditures are shown below.
51. Annual
Development
Programme
ADP = ADP-1 * (1+gADP)
Where, gADP = ADP growth. Growth rates adopted for the
projection period in the trend case may be varied under scenario
simulation indicating changed policy outlook.
52. Non ADP
Capital
Expenditure
NonADP_CAP = NonADP_CAP -1 * (1+gNonADP_CAP)
Where, gNonADP_CAP = Non ADP capital expenditure growth.
Growth rates adopted for the projection period in the trend case may
be varied under scenario simulation indicating changed policy
outlook.
53. Net Lending NeTLend = NeTLend -1 * (1+gNeTLend)
Where, gNeTLend = Net lending growth. Growth rates adopted for
the projection period in the trend case may be varied under scenario
simulation indicating changed policy outlook.
54. Extra ordinary ExOrd = ExOrd -1 * (1+gExOrd)
Where, gExOrd = Extra ordinary expenditure growth. Growth rates
adopted for the projection period in the trend case may be varied
under scenario simulation indicating changed policy outlook.

115
The difference between government income (i.e. total revenue) and total government expenditure
(i.e. total expenditure) shows the balance of the government budget. This is defined as:
55. Budget Balance Deficit = Total Revenue ─ Total Expenditure
The financing dynamics are captured below.
56. Deficit
Financing
DeficitFinance = NetLoan + Non Bank + Bank
Where, Netloan amounts are taken from BOP and are exogenous.
Derivation of domestic borrowings is shown below.
57. Non Bank
Borrowing
Non Bank = ωYh
Where, Yh is household income and defined as Yh = GDP + Remit. Parameters ω denote propensity of household to allocated money for non bank savings instruments. This is derived from the data of non bank borrowing amounts (d non Bank) and estimated household income data (dYh). More specifically, ω = dNon Bank / dYh. Propensity observed for the data period is maintained for the projection period in the trend case.
58. Bank Borrowing Bank =Deficit ─ (NetLoan + Non Bank)
Bank borrowing act as the balancing item and established the link with monetary system. Given the constancy of monetary variables, the higher the bank borrowing requirements the higher could be the pressure on money supply.
Money Side: Money Supply and Domestic Credit
The money stock (or supply) is an important policy instrument. Authorities influence the
macroeconomic dynamic by changing the size of the money supply. Changes in money supply
lead to changes in liquidity, which may affect expenditure, production, employment, as well as
the balance of payments. The liquidity position also affects factors such as real incomes, prices
and interest rates, which usually influences the behaviour of how money is held. Furthermore, in

116
a resource scarce economy under conditions of declining external inflows, governments usually
turn to the banking sector for funds to bridge budget and resource gaps. Thus, the size of the
money supply and the behaviour of other related monetary variables determine the size of
government borrowing.
Furnished by its member countries, the International Monetary Fund (IMF) presents monetary
and financial data on three levels. The balance sheets of the monetary authority (MA), usually
central banks and deposit money banks (DMB) are included in this first level. In the second
level, the balance sheets of MA and DBM are consolidated into a Monetary Survey. A monetary
survey provides a statistical measure of money and credit. Finally, the third level data
consolidates the balance sheets of a monetary survey and non-bank financial institutions (NBFIs)
into a Financial Survey. In creating the macroeconomic framework described in this paper, the
focus is on the monetary survey or banking system11 since it provides sufficient information
concerning money and credit.
Money supply (M2) is determined by the combined sizes of the net domestic assets and net
foreign assets. The money supply function is specified as:
59. Money
Supply
M2 = NDA + NFA
As mentioned above, NDA is based on public and private credit. Public
credit requirement is generated in the fiscal side as a result of
endogenous revenue generation and policy driven as well as
endogenous expenditures. It thus established linkages with fiscal side.
Moreover, since generations of revenue, expenditure and deficit are
influenced by movements of real variables and prices, money supply is
endogenous, consistent and interdependent.
Net foreign asset is a policy variable determined with respect to the overall money and credit
situation. This is defined as:
60. Net Foreign Asset NFA = NFA -1 x (1 + g NFA)
Where, g NFA = NFA growth. Growth rates adopted for
11 Three reasons are cited for focusing on the banking system rather than the entire financial system. (1) Empirical evidence suggests a strong association between the monetary liabilities of the banking sector and aggregate nominal expenditure in an economy thereby affecting inflation, balance of payments and growth. (2) Ready availability of banking sector data for monitoring and analysis. (3) For most of the developing and transition economics, where the financial markets are still not well developed, the banking system accounts for a major segment of the economy’s financial assets and liabilities.

117
the projection period in the trend case may be varied under
scenario simulation indicating changed policy outlook.
The stock of net domestic asset (NDA) is defined by the combined sizes of the domestic credit
(DCR) and nets other asset (NOA).
61. Net Domestic Asset NDA = DCR + NOA
In this exercise, the required level of money supply is contingent on the size of domestic credit in particular the required size of public credit (CRg) from the baking system. The required size of public credit is equal to the gap between the budget deficit amount and combined resources expected from foreign loan and non bank borrowing. Credits to the private (CRpv) and non financial sector (CRnonfin) are policy variables determined with respect to the investment planning. Domestic credit flow at a particular time is composed of flows of all types of credit. This is defined as:
62. Domestic Credit DCR = CRpb + CRpv + CRnonfin
Where, public credit is determined in the fiscal side and is
defined as CRpb = Budget Deficit ─ (Loan + Non Bank).
As mentioned, the required size of public credit is equal to the gap between the budget deficit
amount and combined resources expected from foreign loan and non bank borrowings.
Variations in public credit requirement based on the size of budget deficit, foreign loan and non-
borrowing may likely to influence the size of money supply12. The association between fiscal
and money sectors is depicted in .
12 The association may be governed by the liquidity positions of the banking system. In a situation of high liquidity required public borrowings may be covered from the existing liquidity leading to negligible impact on the growth of money supply. In other situation, the impact may be significant.

118
Figure 2.

119
Figure 2: Linkage between Fiscal side and Money side
Credit to private sector (CRpv) and non financial (CRnonfin) is a policy variable determined
with respect to the investment planning. Domestic credit flow at a particular time is composed of
flows of public and private credit. This is defined as:
63. Private Credit CRpv = CRpv-1 x (1 + gCRpv)
Where, gCRpv = private credit growth. Growth rates
adopted for the projection period in the trend case may be
varied under scenario simulation indicating changed policy
outlook.
64. Credit Non Financial CRnonfin = CRnonfin -1 x (1 + g CRnonfin)
Where, CRnonfin = credit growth of the non financial sector. Growth rates adopted for the projection period in the trend case may be varied under scenario simulation indicating changed policy outlook.
Net other asset is a policy variable determined with respect to the overall money and credit
situation. This is defined as:
REVENUE EXPENDITURE
BUDGET BALANCE
LOAN NON-BANK BANKCREDITPUBLIC
CREDITPRIVATE
DOMESTICCREDIT
NOA
NDA
NFA
MONEY SUPPLY
PRICES
GDP IMPORT SECTORSDEBT

120
65. Net Other Asset NOA = NOA -1 x (1 + g NOA)
Where, g NOA = private credit growth. Growth rates
adopted for the projection period in the trend case may be
varied under scenario simulation indicating changed policy
outlook.
Stock of Debt and Interest Payment
Allocation for interest payment essentially depends on the size of debt stock and effective rate of
interest. Although a detail debt stock model is usually used to estimates stock of outstanding
debt, here a simplified framework is adopted to capture debt dynamics and corresponding
interest payment liabilities. Current levels of borrowings are added to their outstanding debt to
estimate stock of debt. Effective interest rates are then applied to the debt stock to calculate
interest payment liabilities of the current year13. The estimated interest payment liabilities are
directly linked to expenditure component of the government budget to capture allocation for
interest payment. Debt and interest payment specifications are shown below.
66. Domestic Debt:
Bank Borrowing
Debt_Bank = Debt_Bank0 + Bank (Fiscal)
Where, Debt_Bank0 = initial outstanding domestic debt from the bank sector. In this case debt at year 2002 (i.e. the initial year); Bank = borrowing from the banking system (observed for years 2002 to 2010; estimates for projection years) to cover the budget deficit. These estimates (i.e. bank borrowings) are found in the expenditure component of the government budget. It thus establishes links to fiscal side. Variations in bank borrowing will implicate the debt dynamics and interest payment liabilities.
67. Domestic Debt:
Non Bank Borrowing
Debt_NonBank = Debt_NonBank0 + NonBank (Fiscal)
Where, Debt_Bank0 = initial outstanding domestic debt
from the private sector; NonBank = borrowing from the
13
As mentioned, a detailed debt model may be used to capture dynamics. A detail debt model usually captures
debt by different agencies and differential interest rates and maturity period. The results of such a detailed debt
framework can easily be linked to the other blocks of the existing framework.

121
private sector (observed for years 2002 to 2010; estimates
for projection years) to cover the budget deficit. These
estimates (i.e. non bank borrowings) are found in the
expenditure component of the government budget. It thus
establishes links to fiscal side as well as with the real side.
Variations in non bank borrowing will implicate the debt
dynamics and interest payment liabilities.
68. External Debt:
Foreign Loan
Debt_Loan = Debt_Loan0 + NetLoan (Fiscal/BoP)
Where, Debt_Loan0 = initial outstanding foreign debt.
NetLoan = net borrowing from the external which is
calculated by deducting ‘amortization’ from ‘loan
disbursement’. The figures for years 2002 to 2010 are
observed and for projection years they are estimated. These
estimates (i.e. net loan) are found in the BoP as well as in
the expenditure component of the government budget. It
thus establishes links to fiscal side as well as with BoP.
Variations in net loan will affect the debt dynamics and
foreign interest payment liabilities.
Interest payment liabilities reported for the data periods are divided by their respective
outstanding debts to derive the average effective interest rates for the domestic and external loan.
The estimated average effective rates are also adopted in the projection years to estimate the
interest payment liabilities.
69. Domestic Interest
Payment Liabilities
DoM_IntPay = (Debt_Bank + Debt_NonBank) x dom_rate
Where, DoM_IntPay = domestic interest payment
liabilities; dom_rate = average effective domestic interest
rate. The average effective domestic interest rates may be
varied for the projection periods capturing outlook
changes.
70. External Interest
Payment Liabilities
FoR_IntPay = Debt_Loan x for_rate
Where, FoR_IntPay = external interest payment liabilities; for_rate = average effective foreign interest rate. The average effective foreign interest rates may be varied for the projection periods capturing outlook changes.

122
Balance of Payment: External Account
Trade balance is defined as the difference between the exports and imports. The specification is
shown below.
71. Trade Balance TradeBal = E─ M
Derivations of E and M are shown below.
Lagged Exports is augmented by growth rate to derive the exports of goods and services. The growth is specified as a product of the growth of real exports and export price index (EPI). The specification is shown below.
72. Exports E = (E-1 *(r_E / r_E-1)*(1+EPI))
Derivations of real exports (r_E) and EPI are shown above. Variations in real side as well as prices will effect exports and hence balance of trade.
Lagged Imports is augmented by growth rate to derive the imports of goods and services. The growth is specified as a product of the growth of real imports and import price index (MPI). The specification is shown below.
73. Imports M =(E-1 *(r_M / r_M-1)*(1+MPI))
Derivations of real exports (r_M) and MPI are provided above. Variations in real side as well as prices will effect imports and hence balance of trade.
Service balance is defined as the difference between the receipts and payments. This is specified
as:
74. Service Net SrvNet = SrvReceipts ─ SrvPayments
Derivations of receipts and payments are shown below.
75. Service Receipts SrvReceipts = SrvReceipts-1 x (1 + g SrvReceipts)
Where, g SrvReceipts = receipts growth. Growth rates adopted for the projection period in the trend case may be varied under scenario simulation indicating changed policy outlook.

123
76. Service Payments SrvPayments = SrvPayments-1 x (1 + gPayments)
Where, gPayments = payment growth. Growth rates adopted for the projection period in the trend case may be varied under scenario simulation indicating changed policy outlook.
Balance of income component is defined as the difference between the receipts and payments. This is specified as:
77. Income Net YNet = YReceipts ─ YPayments
Derivations of receipts and payments are shown below.
78. Income Receipts YReceipts = YReceipts-1 x (1 + gYReceipts)
Where, gYReceipts = receipts growth. Growth rates
adopted for the projection period in the trend case may be
varied under scenario simulation indicating changed policy
outlook.
79. Income Payments YPayments = YPayments-1 x (1 + gPayments)
Where, gPayments = payment growth. Growth rates
adopted for the projection period in the trend case may be
varied under scenario simulation indicating changed policy
outlook.
Current transfer is composed of official and private transfers. Inflow of remittance is included in
the private transfer flows. Their specifications are shown below:
80. Current Transfer CuRTransfer = PbTransfer + PvTransfer
81. Public Transfer PbTransfer = PbTransfer -1 x (1 + gPbTransfer)
Where, g Public Transfer = public transfer growth. Growth
rates adopted for the projection period in the trend case
may be varied under scenario simulation indicating
changed policy outlook.

124
82. Private Transfer PvTransfer = PvTransfer -1 x (1 + gPvTransfer)
Where, g PvTransfer = private transfer growth. Growth
rates adopted for the projection period in the trend case
may be varied under scenario simulation indicating
changed policy outlook.
Remittance Remit = Remit-1 x (1 + gRemit)
Where, gRemit = remittance growth. Growth rates adopted
for the projection period in the trend case may be varied
under scenario simulation indicating changed policy
outlook.
Balance of current account composes of balances of trade, service, income and current transfers.
This is defined as:
83. Current Account Balance CAB = TradeBal + SrvNet +YNet + CuRTransfer
Capital account is defined to move in line with the observed growth rate. The growth rate may be varied to capture changes in the account with consequent impacts on the overall balance of the BoP account. The specification of the capital account is shown below.
84. Capital Account Balance CpAB = CpAB-1 x (1 + gCpAB) Where, g CpAB = growth.
Financial account consists of a number of elements. They include foreign direct investment; foreign portfolio investment; net foreign loan; other long and short term loans; other assets; trade credit; net of commercial bank activities. In the trend case, these elements are defined to move in line with their observed growth rates. Each of growth rates may be varied to capture changes in the respective component with consequent impacts on financial balance and the overall balance of the BoP account. Specifications of all components of financial accounts are shown below.
85. Financial Account Balance FAB = FDI + FPI + NetLoan + NetLongLoan + NetShortLoan + OthAsset + TrdCredit + ComBank
86. Foreign Direct Investment FDI = FDI-1 x (1 + gFDI) Where, gFDI = growth.
87. Foreign Portfolio Investment
FPI = FPI-1 x (1 + gFPI) Where, gFPI = growth.
88. Net Loan NetLoan = Disbursement ─ Amortization.

125
89. Disbursement Disbursement = Disbursement -1 x (1 + gDisbursement)
Where, gDisbursement = growth.
90. Amortization Amortization = Amortization -1 x (1 + gAmortization)
Where, gAmortization = growth.
91. Net Long Term Loan NetLongLoan = NetLongLoan -1 x (1 + g NetLongLoan)
Where, g NetLongLoan = growth.
92. Net Short Term Loan NetShortLoan = NetShortLoan -1 x (1 + g NetShortLoan)
Where, gNetShortLoan = growth.
93. Other Assets OthAsset = OthAsset -1 x (1 + gOthAsset)
Where, gOthAsset = growth.
94. Trade Credit TrdCredit = TrdCredit -1 x (1 + gTrdCredit)
Where, gTrdCredit = growth.
95. Net Commercial Bank CoMBank = CoMBank-1 x (1 + gCoMBank)
Where, gCoMBank = growth.
Balance of the BOP is captured in the overall balance. It is derived from the sum of all the three balances discussed above.
96. Overall Balance OVB = CAB + CpAB + FAB
The overall balance is covered by resource from the central bank. Any further discrepancies
between the balance and the central bank resource are put into the error and omissions head.
97. Financing BoPFinance = BBank + Errors and Omissions
98. Bangladesh Bank BBank = BbAssets + BbLiabilities
Bangladesh Bank Assets BbAssets = BbAssets-1 * (1+gBbAsset)
Bangladesh Bank Liability BbLibility = BbLibility-1 * (1+gBbLibility)
99. Errors and Omissions Errors and Omissions = OvBalance ─ BBank

126
SFYP Scenario
Key Assumptions for Setting the Scenarios
1. The main source of growth envisaged during the SFYP is the accumulation of factor especially capital. Factor accumulation is supplemented by technological shift for some activities such as agriculture. Moderate improvement in capital accumulation is expected under the baseline scenario whereas substantially large improvements in investment and capital accumulation are required under the high and the medium policy shift scenarios. It is also assumed that agriculture activities will experience significant improvement in production technology which may allow more than 4.5 percent growth in agriculture under the high policy shift scenario.
2. In line with the past experience, the private sector would play the prime role in mobilizing resources for the SFYP. It is assumed that investment environment as well as the confidence of investors (i.e. local and external) will enhance with discernible improvements in following key areas:
o Infrastructure-road, railways, dykes and bridges
o Energy security-electricity and gas
o Telecommunication
o Ports
o Economic administration including legal framework
o Project implementation capacity
o Overall socioeconomic environment including law and order situation
3. The public sector will assume the pivotal role for creating conducive environment for investment by bringing visible improvements in the above mentioned areas. Historically, the government has relied on the Annual Development Program (ADP) to implement public projects including those in infrastructure. Although, the ADP model has worked in the past when the domestic resource base was small and the country was highly dependent on foreign assistance to carry out public sector investment programs, it is now apparent that it is no longer an adequate mechanism and this will be more evident during the SFYP. Experiences in many countries suggest that Public Private Partnership (PPP) model is an effective alternative arrangement for implementing large scale infrastructure projects.14 Thus, in addition to existing project implementation mechanism through ADP, a strengthened PPP framework especially for implementing infrastructure and energy projects would be critical for the SFYP. It is likely that PPP investment as a share of GDP would need to rise to at least 3 percent in FY15.
4. Large inflow of foreign direct investment (FDI) has been assumed especially under the
high/medium policy shift scenarios. Financial intermediation process must improve
14
Many countries in the region have successfully adopted the right PPP framework for accelerating investment in
the critical infrastructure sectors. The examples of China, East Asia, Middle East and India are particularly
noteworthy. In the oil producing Gulf Cooperation Council (GCC) countries, the massive $2 trillion investment plan
currently underway, is largely being implemented under various PPP arrangements. Infrastructure investment in
India under PPP is projected to increase to US$500 billion under the current five year plan.

127
substantially to tap domestically available resources (e.g. foreign remittances) for investment
as well.
5. Considering the important role of remittances, appropriate policies will be needed to promote
remittances as a tool of promoting both welfare of recipient households and raising
productive investments. Along with institutional support to maximize remittance inflows
through formal channels, better investment opportunities would be created for sustainable
and productive use of remittance incomes via investment opportunity development,
microenterprise development and enterprise development support.
6. Tax effort is very low in Bangladesh. ‘Bangladesh collects only 9 percent of GDP as taxes
whereas tax potential is likely to be in the range of 14-15 percent. The gap between this
potential and actual collection is an indication of poor tax administration in Bangladesh
which needs to be addressed during SFYP. For widening of tax base, SFYP would need
measures to phase-out tax incentives, improve structural tax characteristics, administration
and compliance. It is assumed that current initiatives to reform the VAT and income tax
system within FY11 will help raise the tax effort.
Under the medium and high policy shift scenarios, the ready-made garment sector will continue
to experience high rate of growth. Also, exports from the non-RMG sector will rise substantially.
The current concentrated export basket will be diversified which will reduce vulnerability of the
economy to any negative external shocks. The skill of the manpower will be enhanced with a
view to fulfilling the need of the expanding sectors.
Regional integration effort through SAFTA, BIMSTEC and bilateral FTAs would be promoted
with a view to enhancing Bangladesh’s access to markets of neighboring countries.
The Padma Bridge will be completed by 2013 invoking salutary effects on income generation,
trade facilitation and poverty reduction. The Padma Bridge would boost the country's GDP by
1.2 percent, revive the fortune of Mongla Port and cut poverty in the poorest south-west region
of the country. The government needs to take advantage of the Padma Bridge to embark on
development plan for the southwestern region covering a number of areas e.g. development of
multi-modal transport system; revival of Mongla port and establishment of export zones; rail link
with other regions; and exploiting farm and non-farm growth potentials.

128
Table 1: SFYP Scenario for Key Economic Indicators , FY10 to FY15
FY10 FY11 FY12 FY13 FY14 FY15
Average (FY11-15)
Components: (Actual) (Projection)
Real GDP Growth 6.1 6.7 7.0 7.2 7.6 8.0 7.3 Nominal GDP Growth 12.9 13.4 14.3 13.8 14.1 14.3 14.0 CPI Inflation (average) 7.3 8.0 7.5 7.0 6.5 6.0 7.0 Gross investment 24.4 24.7 26.8 29.6 31.0 32.5 29.3 Private 19.4 19.5 22.2 22.7 23.8 25.0 22.6 Public 5.0 5.3 6.6 6.9 7.2 7.5 6.7 National Savings 30.0 28.4 28.7 29.4 30.7 32.1 29.9
Total Revenue and Grants (% of GDP)
Total Revenue 10.9 12.1 13.2 13.4 14.0 14.6 13.4 Tax 9.0 10.0 10.6 11.2 11.8 12.4 11.2 Non Tax 1.9 2.0 2.5 2.2 2.2 2.2 2.2 Grants 0.6 0.5 0.5 0.6 0.5 0.5 0.5 Total Expenditures 14.6 16.5 18.2 18.4 19.0 19.6 18.3 Current Expenditures 9.6 9.8 9.8 10.3 10.5 10.8 10.3 ADP (PPP + Public entities) 3.7 4.5 5.1 5.3 5.7 6.1 5.3 Others Expenditures 1.4 2.2 3.3 2.8 2.8 2.7 2.7 Overall balance (including grants) -3.1 -3.9 -4.5 -4.4 -4.5 -4.5 4.4 Overall balance (Excluding grants) -3.7 -4.4 -5.0 -5.0 -5.0 -5.0 -4.9 Primary balance -1.6 -2.6 -3.1 -3.1 -3.0 -3.0 2.9
Financing (net) 3.7 4.4 5.0 5.0 5.0 5.0 4.9 External 1.4 1.3 2.0 2.0 2.0 2.0 1.8 Domestic 2.3 3.1 3.0 3.0 3.0 3.0 3.0
Total debt 40.0 39.9 40.0 39.5 39.2 38.8 39.9 External 20.3 19.4 19.0 18.1 17.4 16.8 18.6 Domestic 19.7 20.5 21.0 21.4 21.8 22.1 21.3
Money and Credit (End of fiscal year in billion TK), percentage change)
Net foreign assets 671 655 722 822 950 1085 846.9 (% Change) 39.9 -2.3 10.2 13.7 15.6 14.2 10.3 Credit to private sector 2708 3439 4126 4869 5746 6780 4991.9 (% Change) 24.2 27.0 20.0 18.0 18.0 18.0 20.2 Broad money(M2) 3630 4357 5054 5862 6800 7888 5992.0 (% Change) 22.4 20.0 16.0 16.0 16.0 16.0 16.8
Balance of payments
Exports (In billions US$) 16.2 22.4 25.7 29.4 33.8 38.8 30.0 (annual percentage change) 4.2 38.0 14.5 14.5 14.5 15.0 19.4 Import (In billions US$) 21.4 31.0 35.4 40.3 46.1 52.8 41.1 (annual percentage change) 5.4 45.0 14.0 14.0 14.5 14.5 20.4 Current Account Balance(in billions US$) 3.7 -0.3 -0.2 -0.2 -0.5 -0.7 -0.4 (percent of GDP) 3.7 -0.3 -0.2 -0.2 -0.3 -0.4 -0.3 Capital Account Balance(In billions US$) -0.9 0.2 1.1 1.5 2.1 2.3 1.4 Overall balance 2.9 -0.2 0.9 1.3 1.6 1.6 1.0 Gross official reserves in billion US$) 10.7 10.7 11.6 12.9 14.5 16.1 13.2 In months of imports 5.1 3.6 3.4 3.4 3.4 3.3 3.5
Memorandum:
Nominal GDP (In billions taka) 6943 7875 8999 10245 11685 13351 10430.8 Gross investments(in billion taka) 1694 1945 2592 3032 3622 4339 3106.1 Gross national savings(In billion Taka) 1953 1918 2577 3015 3587 4286 3076.7

129
Table 2: SFYP Scenario: Government Budget, FY10 to FY15
FY10 FY11 FY12 FY13 FY14 FY15 Average(FY11-15)
Actual Budget Projection
( In billions of taka)
Total revenue and grants 797 991 1237 1428 1690 2015 1472 Total revenue 757 949 1186 1373 1636 1953 1419 Tax revenue 625 788 958 1147 1379 1660 1186 NBR taxes 597 756 922 1106 1327 1602 1143 Nontax revenue 132 161 229 225 257 294 233
Foreign grants 40 42 51 55 54 61 53
Total expenditure 1014 1292 1639 1882 2217 2617 1929 Current expenditure 666 774 886 1055 1227 1442 1077 Pay and allowances 161 204 234 277 316 374 281 Goods and services 87 108 118 143 164 200 147 Interest payments 149 150 180 195 234 267 205 Subsidies and transfers 267 310 352 410 479 561 422 Block allocations 3 2 2 31 35 40 22
ADP(PPP+ Public entities) 257 345 460 545 669 808 566 Non-ADP capital spending 87 87 146 184 210 227 171 Net lending 9 72 140 102 117 133 113 Other expenditures -6 14 0 0 0 0 3
Overall balance (including grants) -217 -301 -402 -454 -527 -602 -457 Primary balance -108 -194 -272 -315 -347 -397 -305 (Excluding grants) -257 -343 -452 -509 -581 -664 -510
Net financing 257 343 452 509 581 664 510 External 104 98 181 195 230 261 193 Domestic 153 244 271 309 351 403 316 Banks -21 173 201 229 260 299 232
Nonbanks 174 71 70 80 91 104 83
(In Percent of GDP)
Total revenue and grants 11.5 12.6 13.7 13.9 14.5 15.1 14.0 Total revenue 10.9 12.1 13.2 13.4 14.0 14.6 13.5 Tax revenue 9.0 10.0 10.6 11.2 11.8 12.4 11.2 NBR taxes 8.6 9.6 10.2 10.8 11.4 12.0 10.8 Nontax revenue 1.9 2.0 2.5 2.2 2.2 2.2 2.2
Foreign grants 0.6 0.5 0.5 0.6 0.5 0.5 0.5 Total expenditure 14.6 16.5 18.2 18.4 19.0 19.6 18.3 Current expenditure 9.6 9.8 9.8 10.3 10.5 10.8 10.3 Pay and allowances 2.3 2.6 2.6 2.7 2.7 2.8 2.7 Goods and services 1.3 1.4 1.3 1.4 1.4 1.5 1.4 Interest payments 2.1 1.9 2.0 1.9 2.0 2.0 2.0 Subsidies and transfers 3.8 3.9 3.9 4.0 4.1 4.2 4.0 Block allocations 0.0 0.0 0.0 0.3 0.3 0.3 0.2
ADP 3.7 4.5 5.1 5.3 5.7 6.1 5.3 Non-ADP capital & Net lending 1.4 2.0 3.2 2.8 2.8 2.7 2.7 Overall balance (excluding grants) -3.7 -4.4 -5.0 -5.0 -5.0 -5.0 4.9 Primary balance -1.6 -2.6 -3.1 -3.1 -3.0 -3.0 2.9
Net financing 3.7 4.4 5.0 5.0 5.0 5.0 4.9 External 1.4 1.3 2.0 2.0 2.0 2.0 1.8 Domestic 2.3 3.1 3.0 3.0 3.0 3.0 3.0 Banks -0.3 2.3 2.1 2.2 2.2 2.2 2.2 Nonbanks 2.6 0.8 0.9 0.8 0.8 0.8 0.8
Memorandum Item
Nominal GDP(in billion of taka) 6943 7875 8999 10245 11685 13351 10431

130
Table 3: SFYP Scenario for Balance of Payments, FY10 to FY15
(In millions of US$ or otherwise indicated)
FY 10 FY 11 FY 12 FY 13 FY 14 FY 15
Items
Trade balance -5152.0 -8606.9 -9699.9 -10929.6 -12367.5 -13991.9
Export f.o.b.(including EPZ) 16236.0 22405.7 25654.5 29374.4 33780.6 38847.7
Import f.o.b (including EPZ) -21388.0 -31012.6 -35354.4 -40304.0 -46148.1 -52839.5
Services -1237.0 -2252.4 -2385.6 -2493.0 -2609.0 -2744.1
Receipts 2471.0 2550.5 2782.6 2842.0 2929.1 2999.4
Payments -3708.0 -4803.0 -5168.3 -5335.1 -5538.1 -5743.5
Income -1487.0 -1727.9 -1784.2 -1956.4 -2146.5 -2377.8
Receipts 52.0 65.0 78.0 92.0 106.8 123.3
Payments -1539.0 -1792.9 -1862.2 -2048.4 -2253.2 -2501.1
Current transfers 11610.0 12212.4 13677.6 15149.6 16684.5 18465.2
Official transfers 122.0 150.0 120.0 120.0 120.0 120.0
Private transfers 11488.0 12062.4 13557.6 15029.6 16564.5 18345.2
Of which : Workers' remittances 10987.0 11536.4 12690.0 14212.8 15918.3 17828.5
Current Account Balance 3734.0 -374.9 -192.1 -229.4 -438.5 -648.5
Financial and Capital Account -869.0 160.6 1094.4 1519.1 2051.0 2286.0
Capital account 442.0 465.5 584.1 643.0 629.0 715.0 Capital transfers 442.0 465.5 584.1 643.0 629.0 715.0
Financial Account -1311.0 -304.9 510.2 876.1 1422.0 1571.0
Foreign Direct Investment 636.0 950.0 1050.0 1250.0 1350.0 1590.0
Foreign Portfolio Investment -117.0 -80.0 -50.0 -50.0 -50.0 -50.0
Net Aid Loans 914.0 788.1 1802.6 1989.1 2378.7 2681.0
Loan Disbursements 1601.0 1505.6 2544.1 2895.1 3434.7 3881.0
Debt Amortization -687.0 -717.5 -741.5 -906.0 -1056.0 -1200.0
Other Long term Loans (net) -156.0 -200.0 -200.0 -50.0 -120.0 -170.0
Other Short term Loans (net) 231.0 412.0 347.6 407.0 513.3 520.0
Other Capital -903.0 -910.0 -950.0 -1050.0 -900.0 -1200.0
Trade Credits (net) -1045.0 -1105.0 -1250.0 -1250.0 -1350.0 -1450.0
Commercial Banks (net) -315.0 -160.0 -240.0 -370.0 -400.0 -350.0
Errors and Omissions -556 0.0 0.0 0.0 0.0 0.0
Overall Balance 2865.0 -214.3 902.3 1289.7 1612.5 1637.5
Reserve Assets -3113.0 1093.1 -293.6 -934.8 -1096.4 -1079.4
Bangladesh Bank -3113.0 1093.1 -293.6 -934.8 -1096.4 -1079.4
Assets -3616.0 743.1 -576.6 -1217.8 -1379.4 -1362.4
Liabilities 751.0 350.0 283.0 283.0 283.0 283.0
FY'10 FY'11 FY'12 FY'13 FY'14 FY'15
Exchange rate (%) 69.29 71.51 74.29 76.97 79.60 82.17
Inflation(Trading Partners) % 3.3 3.0 2.8 2.5 2.5 2.5
Export as (%) of GDP 16.2 20.3 21.2 22.1 23.0 23.9
Import as (%) of GDP 21.3 28.2 29.2 30.3 31.4 32.5
Remittance as (%) of GDP 10.9 10.5 10.5 10.3 10.2 10.0
Current Account Balance as (%) of GDP 3.7 -0.3 -0.2 -0.2 -0.3 -0.4
FDI as (%) of GDP 0.6 0.9 0.9 0.9 0.9 1.1
MLT as (%) of GDP 1.6 1.4 2.1 2.2 2.3 2.4
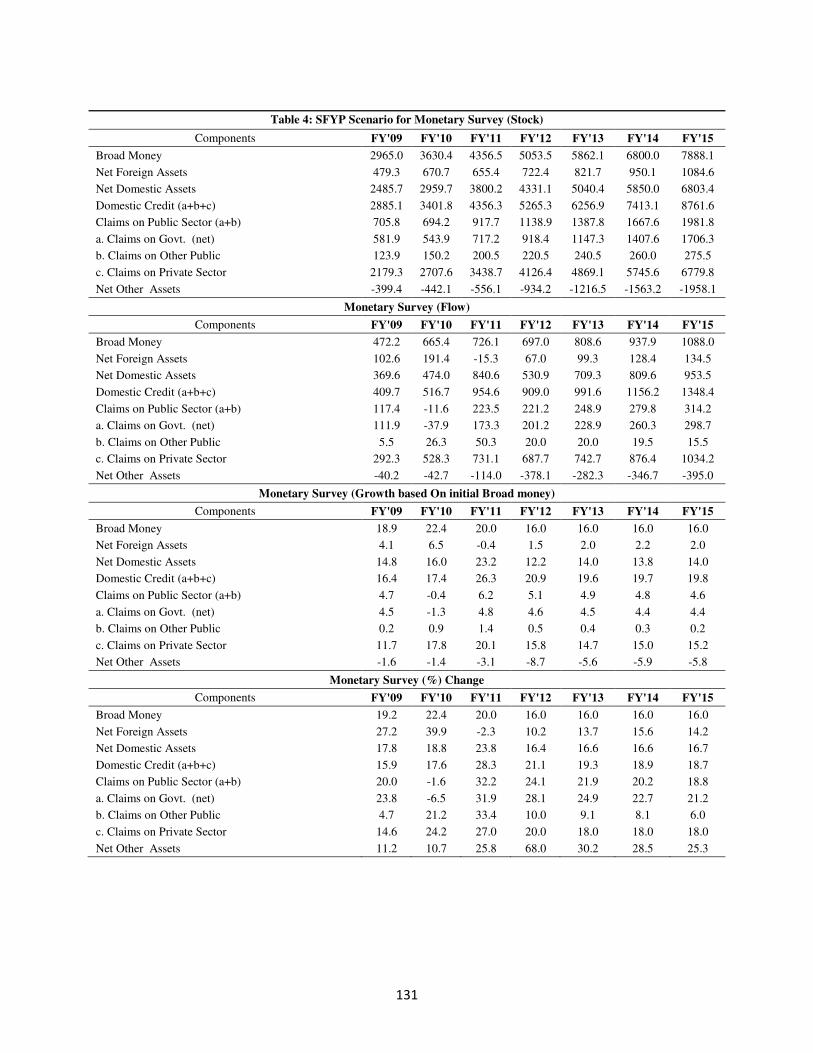
131
Table 4: SFYP Scenario for Monetary Survey (Stock)
Components FY'09 FY'10 FY'11 FY'12 FY'13 FY'14 FY'15
Broad Money 2965.0 3630.4 4356.5 5053.5 5862.1 6800.0 7888.1
Net Foreign Assets 479.3 670.7 655.4 722.4 821.7 950.1 1084.6
Net Domestic Assets 2485.7 2959.7 3800.2 4331.1 5040.4 5850.0 6803.4
Domestic Credit (a+b+c) 2885.1 3401.8 4356.3 5265.3 6256.9 7413.1 8761.6
Claims on Public Sector (a+b) 705.8 694.2 917.7 1138.9 1387.8 1667.6 1981.8
a. Claims on Govt. (net) 581.9 543.9 717.2 918.4 1147.3 1407.6 1706.3
b. Claims on Other Public 123.9 150.2 200.5 220.5 240.5 260.0 275.5
c. Claims on Private Sector 2179.3 2707.6 3438.7 4126.4 4869.1 5745.6 6779.8
Net Other Assets -399.4 -442.1 -556.1 -934.2 -1216.5 -1563.2 -1958.1
Monetary Survey (Flow)
Components FY'09 FY'10 FY'11 FY'12 FY'13 FY'14 FY'15
Broad Money 472.2 665.4 726.1 697.0 808.6 937.9 1088.0
Net Foreign Assets 102.6 191.4 -15.3 67.0 99.3 128.4 134.5
Net Domestic Assets 369.6 474.0 840.6 530.9 709.3 809.6 953.5
Domestic Credit (a+b+c) 409.7 516.7 954.6 909.0 991.6 1156.2 1348.4
Claims on Public Sector (a+b) 117.4 -11.6 223.5 221.2 248.9 279.8 314.2
a. Claims on Govt. (net) 111.9 -37.9 173.3 201.2 228.9 260.3 298.7
b. Claims on Other Public 5.5 26.3 50.3 20.0 20.0 19.5 15.5
c. Claims on Private Sector 292.3 528.3 731.1 687.7 742.7 876.4 1034.2
Net Other Assets -40.2 -42.7 -114.0 -378.1 -282.3 -346.7 -395.0
Monetary Survey (Growth based On initial Broad money)
Components FY'09 FY'10 FY'11 FY'12 FY'13 FY'14 FY'15
Broad Money 18.9 22.4 20.0 16.0 16.0 16.0 16.0
Net Foreign Assets 4.1 6.5 -0.4 1.5 2.0 2.2 2.0
Net Domestic Assets 14.8 16.0 23.2 12.2 14.0 13.8 14.0
Domestic Credit (a+b+c) 16.4 17.4 26.3 20.9 19.6 19.7 19.8
Claims on Public Sector (a+b) 4.7 -0.4 6.2 5.1 4.9 4.8 4.6
a. Claims on Govt. (net) 4.5 -1.3 4.8 4.6 4.5 4.4 4.4
b. Claims on Other Public 0.2 0.9 1.4 0.5 0.4 0.3 0.2
c. Claims on Private Sector 11.7 17.8 20.1 15.8 14.7 15.0 15.2
Net Other Assets -1.6 -1.4 -3.1 -8.7 -5.6 -5.9 -5.8
Monetary Survey (%) Change
Components FY'09 FY'10 FY'11 FY'12 FY'13 FY'14 FY'15
Broad Money 19.2 22.4 20.0 16.0 16.0 16.0 16.0
Net Foreign Assets 27.2 39.9 -2.3 10.2 13.7 15.6 14.2
Net Domestic Assets 17.8 18.8 23.8 16.4 16.6 16.6 16.7
Domestic Credit (a+b+c) 15.9 17.6 28.3 21.1 19.3 18.9 18.7
Claims on Public Sector (a+b) 20.0 -1.6 32.2 24.1 21.9 20.2 18.8
a. Claims on Govt. (net) 23.8 -6.5 31.9 28.1 24.9 22.7 21.2
b. Claims on Other Public 4.7 21.2 33.4 10.0 9.1 8.1 6.0
c. Claims on Private Sector 14.6 24.2 27.0 20.0 18.0 18.0 18.0
Net Other Assets 11.2 10.7 25.8 68.0 30.2 28.5 25.3

132
Annex 1: Regression Results
Table 108: Regression Results Private Consumption
Equation No. Dependent
Variable
Constant r_GDP ∆r_GDP r_GDP-1 r_GDP-2 rTd R2
1. r_Cpv 219.47
(3.98)
0.71
(19.74)
-.0026
(-0.04)
-0.017
(-2.02)
0.996 27
2. r_Cpv 219.47
(3.98)
0.707
(12.02)
0.0026
(0.04)
-0.017
(-2.02)
0.996 27
3. r_Cpv 217.57
(3.39)
0. 667
(15.40)
0.048
(0.93)
-0.019
(-2.22)
0.997 26
4. r_Cpv 107.03
(3.98)
0.701
(11.98)
0.055
(0.89)
-0.0228
(-3.47)
0.998 27
5. r_Cpv 103.6
(4.39)
0.657
(15.40)
0.11
(2.19)
-0.023
(-3.97)
0.999 26
Note: in the first three equations nominal private consumption data was deflated by CPI GDP deflator to calculate the real series.
In other two equations nominal private consumption data was deflated by GDP deflator to get the real series.
Table 2: Regression Results Private Investment
Equation
No.
Dependen
t Variable
Constant r_GDP ∆r_GDP r_GDP-1 Reer Reer-1 Reer-2 Ria R2
6. r_Ipv -83.98
(-1.66)
0.366
(21.52)
-0.061
(-1.52)
-3.196
(-4.11)
-4.525
(-1.44)
0.997 25
7. r_Ipv -83.98
(-1.66)
0.305
(7.73)
0.366
(21.26)
-3.196
(-4.11)
-4.525
(-1.44)
0.997 25
8. r_Ipv -165.76
(-2.28)
0.336
(7.7.6)
0.071
(1.64)
-3.29
(-2.87)
-9.59
(-2.25)
0.995 25
9. r_Ipv -192.14
(-1.92)
0.336
(5.96)
0.103
(1.80)
-3.903
(-1.91)
-8.11
(-1.55)
0.994 26
10. r_Ipv -165.76
(-2.28)
0.406
(14.22)
-3.29
(-2.87)
-9.59
(-2.25)
0.996 25
Note: in the first two equations nominal private investment data was deflated by GDP deflator to calculate the real series.
In other three equations nominal private investment data was deflated by CPI to get the real series

133
Table 3: Regression Results Export
Equation No. Dependent Variable Constant r_GDP r_GDP-1 r_Exdd XPI R2
11. r_E
-272.24
(-9.18)
0.238
(37.76)
0.067
(2.89)
0.89
(1.96)
0.994 25
12. r_E
-261.92
(-9.11)
0.132
(2.63)
0.119
(1.81)
0.108
(3.40)
0.64
(1.40)
0.995 25
Table 4: Regression Results CPI
Equation
No.
Dependent
Variable Constant PM PM-1 RREEM BM g_M2 M2 M2-1 PSBR R2
13. CPI
-9.21
(-1.05)
1.12
(8.80)
-0.83
(-2.9)
0.106
(2.03)
0.976 20
14. CPI
-25.57
(-1.65)
1.20
(4.0)
0.058
(0.95)
0.003
(0.24)
0.963 20
15. CPI
35.38
(8,62)
0.0488
(5.74)
0.185
(2.54)
0.927 20
16. CPI
34.98
(9,13)
0.056
(6.28)
0.187
(2.81)
0.935 20
17. CPI
70.775
(3.21)
0.275
(1.74)
0.0926
(4.30)
0.162
(4.45)
0.923 25
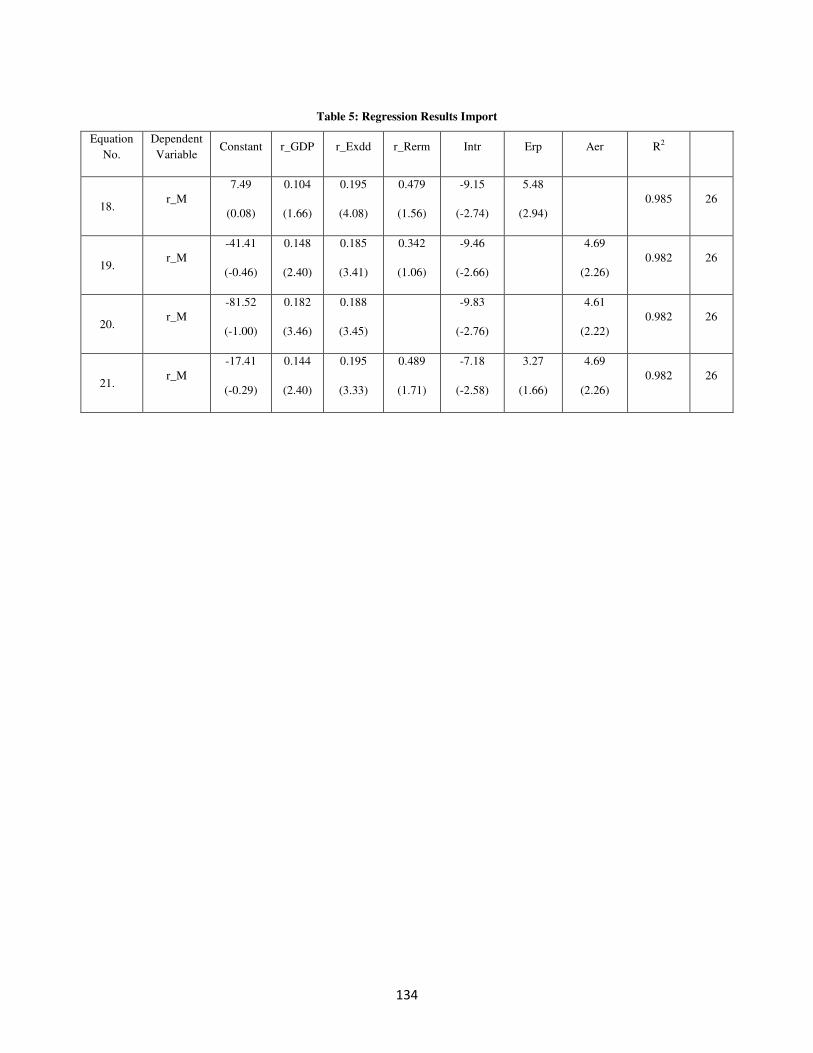
134
Table 5: Regression Results Import
Equation
No.
Dependent
Variable Constant r_GDP r_Exdd r_Rerm Intr Erp Aer R2
18. r_M
7.49
(0.08)
0.104
(1.66)
0.195
(4.08)
0.479
(1.56)
-9.15
(-2.74)
5.48
(2.94)
0.985 26
19. r_M
-41.41
(-0.46)
0.148
(2.40)
0.185
(3.41)
0.342
(1.06)
-9.46
(-2.66)
4.69
(2.26)
0.982 26
20. r_M
-81.52
(-1.00)
0.182
(3.46)
0.188
(3.45)
-9.83
(-2.76)
4.61
(2.22)
0.982 26
21. r_M
-17.41
(-0.29)
0.144
(2.40)
0.195
(3.33)
0.489
(1.71)
-7.18
(-2.58)
3.27
(1.66)
4.69
(2.26)
0.982 26

135
Annex 2: Some Tax Revenue Sources and Their Proxy Bases
Tax Revenue Sources Tax Bases, Proxies
A. Taxes on Net Income and Profits
1. Corporate Enterprise Profits on derived from National Account; Operating Surplus of
the Enterprise; GDP
2. Individual Wages and Salaries and Other Private Income from the National Accounts
; National Income; GDP
B. Social Insurance Taxes or Contributions
3. Employer Wages and Salaries; GDP
4. Employee Wages and Salaries; and Non-wage Income of Self-employed persons
C. Taxes on Property
5. Real Estate Rents; Aggregate Value of Real Estate; Aggregate Wealth
6. Personal Wealth Property Income; National Income; Wealth
7. Death and Gift Taxes Demographic Incidence of Deaths and Number of Persons in the Highest
Income Brackets; GDP
8. Property Transfers Value of Urban Properties and Number of Transactions
D. Taxes on Production, Consumption and Sales
9. Sales, Turnover, or Value-Added Tax Private Consumption; Retail Sales
10. Selective Excises Production or Consumption Figures on Major Excisable Commodities;
Private Consumption
11. Profits of Fiscal Monopolies Value or Volume of Consumption of Fiscal Monopoly Commodities; GDP
E. Taxes on International Trade and Transactions
12. Import Duties Value and Volume of Imports
13. Export Duties Value and Volume of Exports
14. Export Marketing Boards Estimated Profits on Exports Handled by Boards; Total Exports
15. Exchange Profits Value of Exchange Transactions
F. Other Taxes
16. Business and Professional Licenses Number of Licenses Issued; Nominal Value Added in Retailing; GDP
17. Poll Taxes or Personal Taxes Demographic Data for Relevant Age Group
18. Stamp Taxes Value of Important Categories of Transactions Involved and Estimated
Frequency of Transactions
19. All Other Taxes on Income, Property,
Production and Trade
National Income; GDP
Note: The Table is adapted from Sheetal Chand, “Some Procedures for Forecasting Tax Revenue in Developing Countries,”
DM/75/91, IMF, October 1975.

136
Results from the Dynamic CGE Model of Bangladesh

137
Introduction
The macro-economic framework for the SFYP has been used to generate consistent macro
economic projections for the plan period. A dynamic computable general equilibrium (DCGE)
model, based on an updated input-output table and a social accounting matrix (SAM) for
Bangladesh for FY07, has been used to derive the sectoral implications of the macro projections
considered in the SFYP. The key outcomes of the macroeconomic framework are linked to the
DCGE model. Furthermore, an Employment Satellite Matrix (ESM), constructed for FY07 has
been linked to the sectoral output growth derived from the DCGE model to generate the sectoral
employment impacts.
The reason for employing a dynamic CGE model is due to fact that a dynamic CGE model is
capable of capturing the growth effects of policy reforms. The inability of the static CGE model
to account for growth effects make them inadequate for long-run analysis of the economic
policies. They exclude accumulation effects and do not allow the study of transition path of an
economy where short-run policy impacts are likely to be different from those of the long-run. To
overcome this limitation we use a sequential dynamic CGE model. This kind of dynamics will
not be the result of inter-temporal optimisation by economic agents. Instead, these agents have
myopic behaviour. It is a series of static CGE models that are linked between periods by
updating procedures for exogenous and endogenous variables. Capital stock is updated
endogenously with a capital accumulation equation, whereas population (and total labour supply)
is updated exogenously between periods. Also other variables such as public expenditure,
transfers, technological change or debt accumulation are updated over time. The sequential
dynamic CGE model has two major modules: static module and dynamic module. Descriptions
of the static and dynamic modules of the model are presented in the subsequent sections.
Static Module of the DCGE Model
Production bloc
In each sector there is a representative firm, which earns capital income, pays dividends to
households and pays direct income taxes to the government. We adopt a nested structure for
production. Sectoral output is a Leontief function of value added and total intermediate
consumption. Value added is in turn represented by a CES function of capital and composite
labour. The latter is also represented by a CES function of two labour categories: skilled labour
and unskilled labour. Both labour categories are assumed to be fully mobile in the model. In
different production activities we assume that a representative firm remunerates factors of
production and pays dividends to households.
The equations of the production bloc are provided below. The description of the variables and
parameters is provided in the Annex.
(1)

138
(2)
(3)
(4)
(5)
(6)
(7)
Income and demand bloc
Households earn their income from production factors: skilled and unskilled labour, agricultural and non-agricultural capital. They also receive dividends, intra-household transfers, government transfers and remittances and pay direct income tax to the government. Household savings are a fixed proportion of total disposal income. Household demand is represented by a linear expenditure system (LES) derived from the maximisation of a Stone-Geary utility function. The model includes nine household categories according to characteristics of the household head, as identified in the HES household survey. Five of these categories correspond to rural households and four are of urban households. Minimal consumption levels are calibrated by using guess-estimates of the income elasticity and the Frisch parameters.
The government receives direct tax revenue from households and firms and indirect tax revenue on domestic and imported goods. Its expenditure is allocated between the consumption of goods and services (including public wages) and transfers. The model accounts for indirect or direct tax compensation in the case of a tariff cut. The equations are provided below:
(8)
(9)
(10)
(11)
(12)
(13)
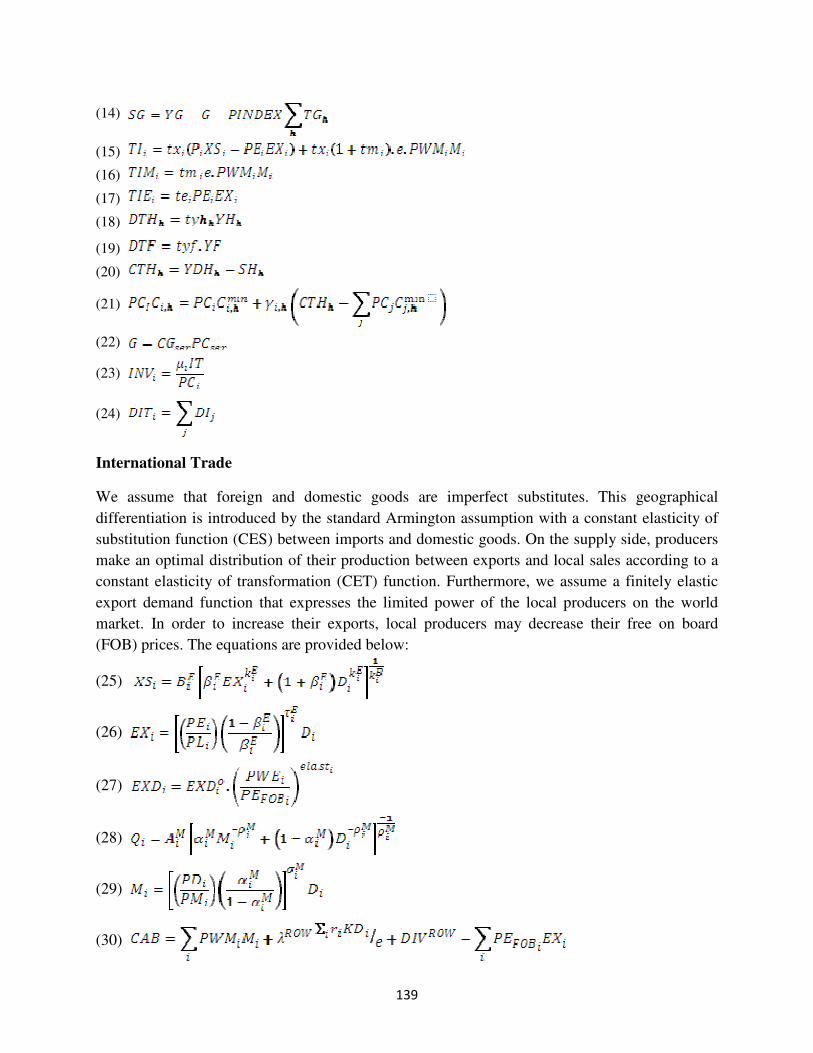
139
(14)
(15)
(16)
(17)
(18)
(19)
(20)
(21)
(22)
(23)
(24)
International Trade
We assume that foreign and domestic goods are imperfect substitutes. This geographical
differentiation is introduced by the standard Armington assumption with a constant elasticity of
substitution function (CES) between imports and domestic goods. On the supply side, producers
make an optimal distribution of their production between exports and local sales according to a
constant elasticity of transformation (CET) function. Furthermore, we assume a finitely elastic
export demand function that expresses the limited power of the local producers on the world
market. In order to increase their exports, local producers may decrease their free on board
(FOB) prices. The equations are provided below:
(25)
(26)
(27)
(28)
(29)
(30)
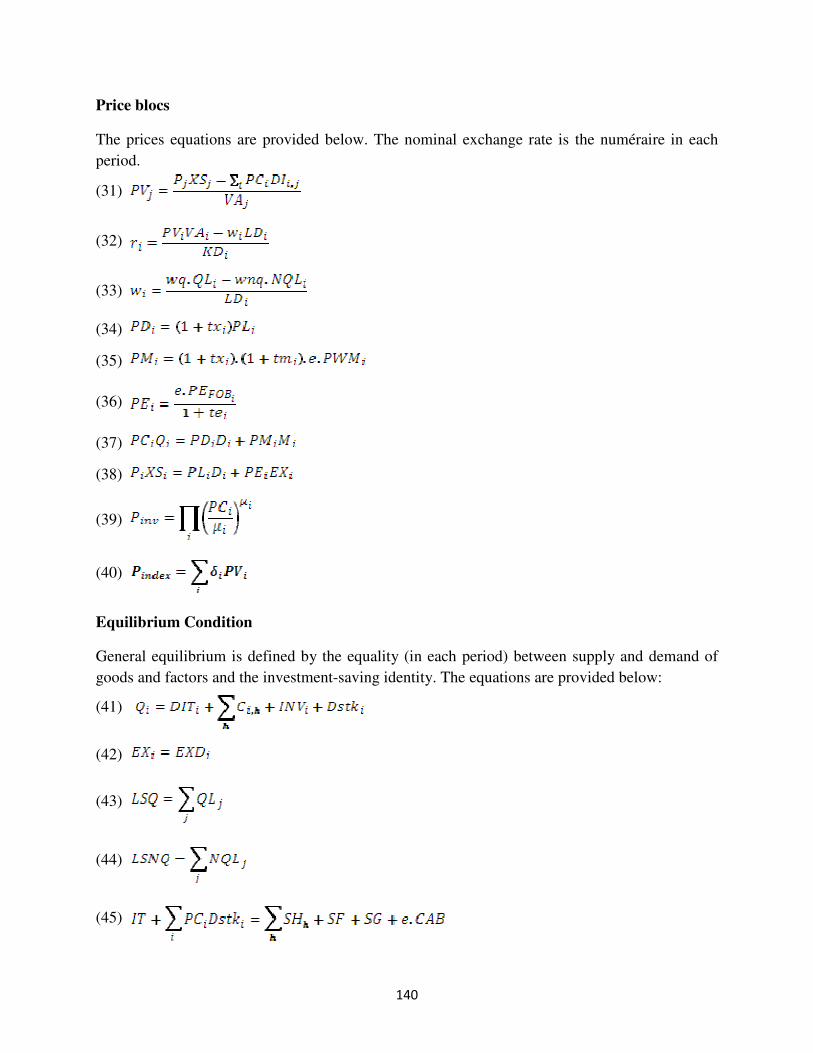
140
Price blocs
The prices equations are provided below. The nominal exchange rate is the numéraire in each
period.
(31)
(32)
(33)
(34)
(35)
(36)
(37)
(38)
(39)
(40)
Equilibrium Condition
General equilibrium is defined by the equality (in each period) between supply and demand of
goods and factors and the investment-saving identity. The equations are provided below:
(41)
(42)
(43)
(44)
(45)

141
Dynamic Module of the DCGE Model
In every period capital stock is updated with a capital accumulation equation. We assume that the
stocks are measured at the beginning of the period and that their flows are measured at the end of
the period. We use an investment demand function to determine how new investments will be
distributed between the different sectors. This can also be done through a capital distribution
function15. Investment here is not by origin (product) but rather by sector of destination. The
investment demand function used here is similar to those proposed by Bourguignon et al. (1989),
and Jung and Thorbecke (2003). The capital accumulation rate (ratio of investment to capital
stock) is increasing with respect to the ratio of the rate of return to capital and its user cost. The
latter is equal to the dual price of investment times the sum of the depreciation rate and the
exogenous real interest rate. The elasticity of the accumulation rate with respect to the ratio of
return to capital and its user cost is assumed to be equal to two. By introducing investment by
destination, we respect the equality condition with total investment by origin in the SAM (Social
Accounting Matrix). Besides this, investment by destination is used to calibrate the sectoral
capital stock in base run.
Total labour supply is an endogenous variable, although it is assumed to simply increase at the
exogenous population growth rate. Note that the minimal level of consumption in the LES
function also increases (as do other nominal variables, like transfers) at the same rate. The
exogenous dynamic updating of the model includes nominal variables (that are indexed),
government savings and the current account balance. The equilibrium between total savings and
total investment is reached by means of an adjustment variable introduced in the investment
demand function. Moreover, the government budget equilibrium is met by a neutral tax
adjustment.
The model is formulated as a static model that is solved sequentially over a certain period time
horizon.16 The model is homogenous in prices and calibrated in a way to generate "steady state"
paths. In the baseline all the variables are increasing, in level, at the same rate and the prices
remain constant. The homogeneity test (for example, a shock on the numéraire – the nominal
exchange rate – with the “steady state” characteristics) generates the same shock on prices, and
unchanged real values, along the counterfactual path. This method is used to facilitate welfare
and poverty analysis since all prices remain constant along the business as usual (BaU) path.
It is, however, important to note that, in contrast to the static CGE models, which make
counterfactual analysis with respect to the base run (generally the initial SAM), a dynamic CGE
model allows the economy to grow even in the absence of a shock. This scenario of the economy
(without a shock) is termed as the business-as-usual (BAU) scenario. The counterfactual analysis
of any simulation under the dynamic CGE model is, therefore, done with respect to this growth
15 Abbink et al (1995) use a sequential dynamic CGE model for Indonesia where total investment is distributed as a function of base year sectoral shares in total capital remuneration and sectoral profit rates. 16 The model is formulated as a system of non linear equations solved simultaneously as a constrained non-linear system (CNS) with GAMS/Conopt3 solver.

142
path. One of the salient features of the dynamic model is that it takes into account not only
efficiency effects, as also present in the static models, but also accumulation effects. The sectoral
accumulation effects are linked to the ratio between the rate of return to the capital stock and the
cost of investment goods. The equations of the dynamic bloc are provided below.
(46)
(47)
(48)
(49)
(50)
(51)
(52)
(53)
(54)
(55)
(56)
(57)
(58)
(59)
(60)
(61)
(62)
The Bangladesh Social Accounting Matrix for 2006-07
For the purpose this exercise, a SAM for 2006/07 for Bangladesh has been constructed. SAM
2006/07 composed of 189 accounts. The distributions of 189 accounts are: (i) 86 activities; (ii)
86 commodities; (iii) 4 factors of production; (iv) 11 current institutions; and (v) 2 capital
institutions. Data on various components of the demand side have been collected from
Bangladesh Bureau of Statistics (BBS). In particular, data on public consumption by 86
commodities, gross fixed capital formation by 86 commodities, and private consumption by 86
commodities have been obtained from BBS. The vector of private consumption data is further
distributed among the eight representative household groups using the unit record data of

143
Household Income and Expenditure Survey (HIES) of 2005. Data on exports of goods and
services are collected from the Export Promotion Bureau and Bangladesh Bank (i.e. the central
bank of Bangladesh). Supply side composed of value added and imports of goods and services.
We used disaggregated BBS data to derive the value added vector for the 86 activities. Data on
imports of goods and services are collected from the Bangladesh Bank and the National Board of
Revenue. Information on direct and indirect taxes and subsidies has been collected from the
National Board of Revenue and the Finance division, Ministry of Finance. Input-output flow
matrix for 2006/07 has been derived by using newly conducted surveys for few selected
activities and updating the previous technology vectors using secondary information. More
specifically, out of the 86 activities, technology vectors of five important activities such as
paddy, livestock, poultry, pharmaceuticals and information technology (ICT) have been derived
using the field survey data. The technology vectors of the remaining activities are updated using
secondary information.
For the DCGE model, we use an aggregated version of the SAM of Bangladesh that includes 15
sectors, four factors of production: skilled and unskilled labour, agricultural and non-agricultural
capital. An important feature of the SAM is the decomposition of the households into seven
groups. Households are classified in terms of location - urban and rural. In case of rural
households, occupation and ownership of agricultural capital by the household is the main
criterion to differentiate household groups. Initially making a preliminary distinction between
agricultural and non-agricultural occupation groups, the agricultural group is then classified into
four classes according to ownership of agricultural capital. Thereby there are five groups:
Landless (No cultivable land); marginal farmers (up to 0.49 acre of land); small farmers (0.5 to
2.49 acres of land); large farmers (2.50 acres of land and above); Non- Agricultural. Urban
households are classified into two categories according to the educational level of the household
head. These are: Low Education (below class X) and High Education (above class X). Table 1
provides the features of the 2006-07 SAM of Bangladesh.
Table 1: Features of 2006-07 SAM of Bangladesh
Set Description of Elements
Activities
Agriculture (5) Cereal Crops, Commercial Crops, Livestock-Poultry-fishing, Forestry, Other
Agriculture
Industries (7) Other Food, Leather Products, Textile, Chemical-Fertilizer, Machinery,
Petroleum Products, Other Industries
Services (2) Construction, Services.

144
Institutions
Households (7) - Rural Agriculture: 4 categories according to land ownership: Landless,
Marginal Farmer, Small Farmer, and Large Farmer.
- Rural Non-Farmer: 1 category according to occupation
- Urban: 2 categories according to the level of education of the household’s
head: Low Education and High Education.
Others (2) Government, Rest of the World
Factors of production
Labour (4) Unskilled Male: Class 0-IX
Unskilled Female: Class 0-IX
Skilled Male: Class X and above
Skilled Female: Class X and above
Capital (2) Agricultural capital
Non agricultural capital
Results of the DCGE Model and the Projections
Sectoral Growth Rates
The growth rates for 14 sectors of the DCGE model for the period between 2009-10 and 20014-
15 are reported in Table 2. It appears that the cereal crop sector will experience a growth rate of
around 4.7 percent during the plan period, whereas the commercial crops sector will experience
higher growth rate than that of crop agriculture suggesting a shift in the production pattern in the
agricultural sector. By 2014-15, the growth rate of the overall agricultural sector will be 4.3
percent. The overall industrial sector will experience a rise in growth rate by almost 100 percent
at the end of plan period from its current growth rate. Growth in the textile and clothing sector,
machinery sector and other industries will be the major drivers of the industrial growth rate. The
construction and services sectors will also experience steady rise in growth rates.

145
Table 2: Sectoral Growth Rates
2009-10 (actual) 2010-11 (est) 2011-12 2012-13 2013-14 2014-15
Agriculture 5.3 4.9 4.5 4.4 4.3 4.3
Cereal Crops 5.8 5.4 5.0 4.8 4.7 4.7
Commercial Crops 6.5 6.0 5.5 5.4 5.3 5.3
Livestock-Poultry-fishing 4.0 3.7 3.4 3.3 3.2 3.2
Forestry 5.2 4.8 4.4 4.3 4.2 4.2
Other Agriculture 2.1 1.9 1.7 1.7 1.7 1.7
Industry 6.6 9.2 9.6 9.9 10.5 11.5
of which Manufacturing 6.5 9.5 9.8 10.1 10.7 11.7
Other Food 6.1 7.2 8.4 8.7 10.5 12.5
Leather Products 7.7 8.5 9.4 10.5 11.2 12.2
Textile and Clothing 7.6 14.4 13.5 13.8 14.2 15.1
Chemical-Fertilizer 5.3 6.1 6.7 6.8 7.0 7.4
Machinery 5.9 6.2 6.6 6.7 7.2 7.9
Petroleum Products 4.3 4.7 5.5 5.6 5.9 6.1
Other industries 8.2 8.4 8.9 9.1 9.2 9.3
Construction 6.0 6.4 6.6 6.8 7.8 8.1
Services 6.5 6.6 6.8 7.1 7.3 7.8
GDP GROWTH 6.2 6.7 6.9 7.2 7.6 8.0
Source: DCGE Model
Sectoral Shares in GDP
Differential growth rates for different sectors, as reported in Table 2, lead to varying sectoral
shares in GDP over the plan period. The agricultural sector, as a whole, will experience decline
in the share in GDP from 18.6 percent in 2009-10 to 15.5 percent in 2014-15. All the agricultural
sub-sectors will experience decline in their respective shares. The major fall will be in the case of
cereal crops.
In the case of industrial sector, the overall share will rise from 19.1 percent in 2009-10 to 22.3
percent in 2014-15. All industrial sub-sectors, except chemical-fertiliser, will experience rise in
their shares in GDP. The most notable rise will be in the cases of textile and clothing and
machinery sectors.

146
The share of construction sector in GDP will rise by 0.3 percentage points by the end of the plan
period from its current share. The share of services sector will fall by 0.4 percentage points by
the end of the plan period.
Table 3: Sectoral Shares in GDP
2009-10 (actual) 2010-11 (est) 2011-12 2012-13 2013-14 2014-15
Agriculture 18.6 18.4 17.7 16.9 16.2 15.5
Cereal Crops 6.4 6.3 6.0 5.7 5.4 5.1
Commercial Crops 4.8 4.7 4.5 4.4 4.3 4.2
Livestock-Poultry-fishing 3.3 3.3 3.2 3.0 2.9 2.8
Forestry 1.4 1.4 1.4 1.3 1.2 1.1
Other Agriculture 2.7 2.7 2.6 2.5 2.4 2.3
Industry 19.1 19.4 19.9 20.8 21.6 22.3
of which Manufacturing 17.9 18.2 18.7 19.6 20.4 21.1
Other Food 2.5 2.5 2.6 2.7 2.8 2.9
Leather Products 0.9 0.9 0.9 1.0 1.1 1.1
Textile and Clothing 6.6 6.8 7.0 7.4 7.8 8.2
Chemical-Fertilizer 2.0 2.0 2.1 2.2 2.3 2.4
Machinery 5.1 5.2 5.3 5.4 5.5 5.6
Petroleum Products 0.8 0.8 0.8 0.9 0.9 0.9
Other industries 1.2 1.2 1.2 1.2 1.2 1.2
Construction 8.3 8.2 8.4 8.5 8.6 8.6
Services 54.0 54.0 54.0 53.8 53.6 53.6
100.0 100.0 100.0 100.0 100.0 100.0
Source: DCGE Model
Sectoral Employment
As mentioned before, the sectoral output changes from the DCGE model are linked to the
employment satellite matrix to derive the sectoral employment effects of the sectoral growth.
Table 4 presents the projections of the total number of labour force to be employed by different
sectors during the plan period. The number of labour force employed in the agricultural sector
will rise from 25628150 in 2009-10 to 31159781 in 2014-15. All agricultural sub-sectors will
experience rise in employment. However, the most significant rise in employment will be
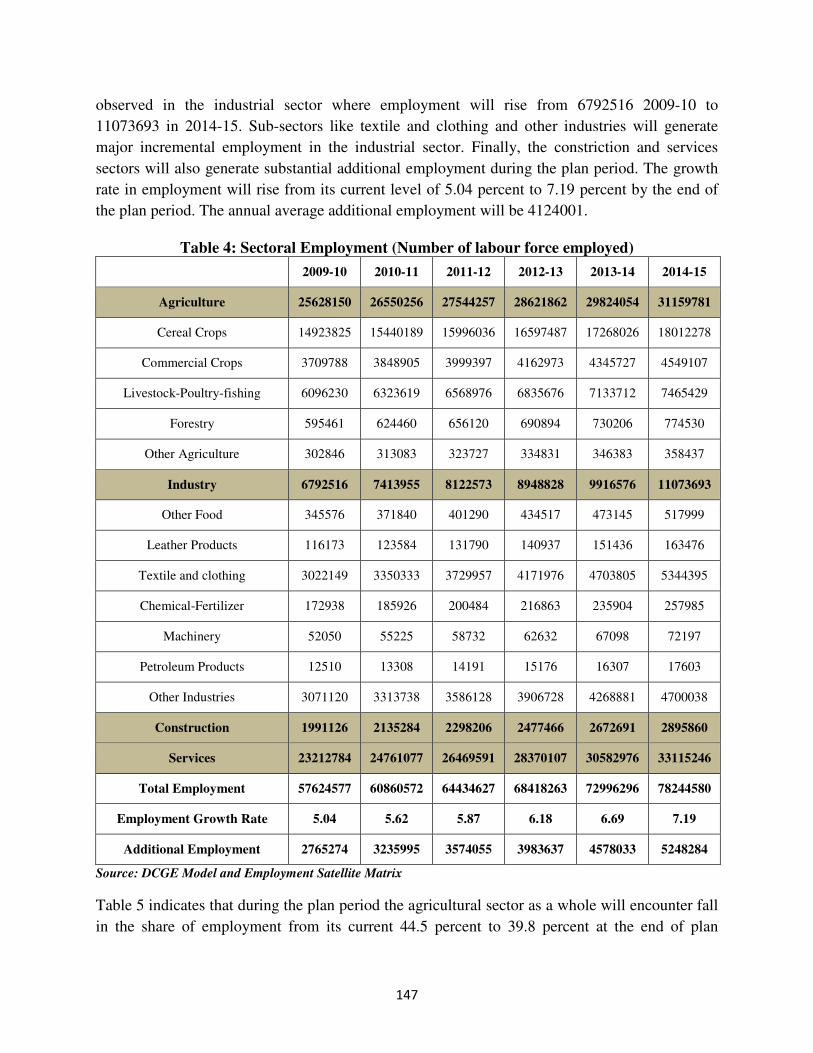
147
observed in the industrial sector where employment will rise from 6792516 2009-10 to
11073693 in 2014-15. Sub-sectors like textile and clothing and other industries will generate
major incremental employment in the industrial sector. Finally, the constriction and services
sectors will also generate substantial additional employment during the plan period. The growth
rate in employment will rise from its current level of 5.04 percent to 7.19 percent by the end of
the plan period. The annual average additional employment will be 4124001.
Table 4: Sectoral Employment (Number of labour force employed)
2009-10 2010-11 2011-12 2012-13 2013-14 2014-15
Agriculture 25628150 26550256 27544257 28621862 29824054 31159781
Cereal Crops 14923825 15440189 15996036 16597487 17268026 18012278
Commercial Crops 3709788 3848905 3999397 4162973 4345727 4549107
Livestock-Poultry-fishing 6096230 6323619 6568976 6835676 7133712 7465429
Forestry 595461 624460 656120 690894 730206 774530
Other Agriculture 302846 313083 323727 334831 346383 358437
Industry 6792516 7413955 8122573 8948828 9916576 11073693
Other Food 345576 371840 401290 434517 473145 517999
Leather Products 116173 123584 131790 140937 151436 163476
Textile and clothing 3022149 3350333 3729957 4171976 4703805 5344395
Chemical-Fertilizer 172938 185926 200484 216863 235904 257985
Machinery 52050 55225 58732 62632 67098 72197
Petroleum Products 12510 13308 14191 15176 16307 17603
Other Industries 3071120 3313738 3586128 3906728 4268881 4700038
Construction 1991126 2135284 2298206 2477466 2672691 2895860
Services 23212784 24761077 26469591 28370107 30582976 33115246
Total Employment 57624577 60860572 64434627 68418263 72996296 78244580
Employment Growth Rate 5.04 5.62 5.87 6.18 6.69 7.19
Additional Employment 2765274 3235995 3574055 3983637 4578033 5248284
Source: DCGE Model and Employment Satellite Matrix
Table 5 indicates that during the plan period the agricultural sector as a whole will encounter fall
in the share of employment from its current 44.5 percent to 39.8 percent at the end of plan

148
period. Three major agricultural sub-sectors, i.e. cereal crops, commercial crops and livestock-
poultry-fishing will experience fall in the shares by notable margins.
In the case of industry, the sector as a whole will experience a rise in the share of total
employment from 11.8 percent in 2009-10 to 14.2 percent in 2014-15. The notable rises in the
shares of employment are observed in sub-sectors like textile and clothing and other industries.
The construction sector will go through some marginal rise in the share whereas the services
sector will experience rise in the share by 2 percentage points during the plan period.
Table 5: Sectoral Employment Share
2009-10 2010-11 2011-12 2012-13 2013-14 2014-15
Agriculture 44.5 43.6 42.7 41.8 40.9 39.8
Cereal Crops 25.9 25.4 24.8 24.3 23.7 23.0
Commercial Crops 6.4 6.3 6.2 6.1 6.0 5.8
Livestock-Poultry-fishing 10.6 10.4 10.2 10.0 9.8 9.5
Forestry 1.0 1.0 1.0 1.0 1.0 1.0
Other Agriculture 0.5 0.5 0.5 0.5 0.5 0.5
Industry 11.8 12.2 12.6 13.1 13.6 14.2
Other Food 0.6 0.6 0.6 0.6 0.6 0.7
Leather Products 0.2 0.2 0.2 0.2 0.2 0.2
Textile and Clothing 5.2 5.5 5.7 6.1 6.4 6.8
Chemical-Fertilizer 0.3 0.3 0.3 0.3 0.3 0.3
Machinery 0.1 0.1 0.1 0.1 0.1 0.1
Petroleum Products 0.0 0.0 0.0 0.0 0.0 0.0
Other Industries 5.3 5.4 5.6 5.7 5.8 6.0
Construction 3.5 3.5 3.6 3.6 3.7 3.7
Services 40.4 40.8 41.2 41.5 41.9 42.4
Total Employment 100.0 100.0 100.0 100.0 100.0 100.0
Source: DCGE Model and Employment Satellite Matrix

149
Reference
Abbink, G. A., M. C. Braber, and S. I. Cohen. 1995. “A SAM-CGE Demonstration Model for
Indonesia: A Static and Dynamic Specifications and Experiments.” International Economic
Journal 9 (3): 15–33.
Bourguignon, F., W. H. Branson, and J. de Melo. 1989. “Macroeconomic Adjustment and
Income Distribution: A Macro-Micro Simulation Model.” OECD Technical Paper 1. Paris.
Jung, H. S., and E. Thorbecke. 2003. “The Impact of Public Education Expenditure on Human
Capital, Growth, and Poverty in Tanzania and Zambia: A General Equilibrium Approach.”
Journal of Policy Modeling 25: 701–25.

150
Annex
Description of the Variables and Parameters of the Dynamic CGE Model
Endogenous variables
, :i hC Household h's consumption of good i (volume)
:CF Composite agricultural capital-labor factor (volume)
:jC I Total intermediate consumption of activity j (volume)
:hCT H Household h's total consumption (value)
:iD Demand for domestic good i (volume)
, :i jDI Intermediate consumption of good i in activity j (volume)
:iDIT Intermediate demand for good i (volume)
:DTF Receipts from direct taxation on firms' income
:hDT H Receipts from direct taxation on household h's income
:iEX Exports in good i (volume)
:G Public expenditures
:iINV Investment demand for good i (volume)
:IT Total investment
:jL D Activity j demand for labor (volume)
:iM Imports in good i (volume)
:iP Producer price of good i
:iPC Consumer price of composite good i
:iPD Domestic price of good i including taxes
:iPE Domestic price of exported good i
:P in d ex GDP deflator

151
:Pinv Price index of investment
:iPL Domestic price of good i (excluding taxes)
:iPM Domestic price of imported good i
:jP V Value added price for activity j
:iQ Demand for composite good i (volume)
:ir Rate of return to capital in activity i
:rl Rate of return to agricultural land
:r c Rate of return to composite factor
:SF Firms' savings
:SG Government's savings
:hSH Household h's savings
:iTI Receipts from indirect tax on i
:iTIE Receipts from tax on export i
:iT IM Receipts from import duties i
:jVA Value added for activity j (volume)
:w Wage rate
:iXS Output of activity i (volume)
:hY DH Household h's disposable income
:Y F Firms' income
:Y G Government's income
:hY H Household h's income
:LS Total labor supply (volume)
:iKD Demand for capital in activity i (volume)
:CA B Current account balance

152
, :i tInd Demand for capital in activity i (volume)
:tU Capital user cost
min, :i hC Minimum consumption of good i by household h
Exogenous variables
:iPW E World price of export i
:iPW M World price of import I
:e Nominal Exchange rate (numéraire)
Parameters
Production functions
:jA Scale coefficient (Cobb-Douglas production function)
, :i jaij Input-output coefficient
:ja Elasticity (Cobb-Douglas production function)
:jio Technical coefficient (Leontief production function)
:jv Technical coefficient (Leontief production function)
CES function between capital and labor
:K LiA Scale coefficient
:K Lia Share parameter
:KLir Substitution parameter
:K Lis Substitution elasticity

153
CES function between skilled and unskilled labor
:LLiA Scale coefficient
:LLia Share parameter
:LLir Substitution parameter
:LLis Substitution elasticity
CES function between imports and domestic production
:MiA Scale coefficient
:Mia Share parameter
:Mir Substitution parameter
:Mis Substitution elasticity
CET function between domestic production and exports
:EiB Scale coefficient
:Eib Share parameter
:Eik Transformation parameter
:Eit Transformation elasticity
LES consumption function
, :i hg Marginal share of good i
Tax rates
:ite Tax on exports i
:itm Import duties on good i

154
:itx Tax rate on good i
:htyh Direct tax rate on household h's income
:tyf Direct tax rate on firms' income
Other parameters
:jd Share of activity j in total value added
:Lhl Share of land income received by household h
:LFl Share of land income received by firms
:L R O Wl Share of land income received by foreigners
:Rhl Share of capital income received by household h
:R Fl Share of capital income received by firms
:R OWl Share of capital income received by foreigners
:Whl Share of labour income received by household h
:hy Propensity to save
:im Share of the value of good i in total investment
:ng Population growth rate
:d Capital depreciation rate
1 :ig Parameter in the investment demand function
2 :ig Parameter in the investment demand function
:i r Real interest rate