skema jawapan modul ppd pasir gudang 2016 biologi kertas 2 ... · pdf file*note that all...
TRANSCRIPT
SKEMA JAWAPAN
MODUL PPD
PASIR GUDANG 2016
BIOLOGI KERTAS 2
- T5 -

CHAPTER 1: TRANSPORT
No Mark Scheme Sub Mark
Total Mark
1 (a) Able to state the importance of septum Answer P1: The septum prevents the oxygenated blood in left side of the blood from mixing with the deoxygenated blood in the right side of the heart. P2 : This is to ensure that the enough amount of oxygen is supplied to the body cells.
1 1
2
(b) Able to explain how the artificial pacemaker works. Answer P1: The artificial pacemaker generates small amount of electrical charges. P2: The electrical charges stimulate the nerve impulses to be transmitted to the both atrium. P3: This cause both atria to contract simultaneously P4: The contraction of atria causes high pressure of blood in the atria P5: The impulses generated by sinoatrial node (SA node) reach the atrioventricular node (AV node) P6: The AV node ensure that all blood in from the atria has entered the ventricles P7: The AV node relays the impulses to the bundle of His and the Purkinje fibres P8: The impulses than reach the apex of heart P9: The ventricles contract and cause the blood pressure to increase P10: Blood is pumped out of the heart P11: The pacemaker could be adjusted to pump 72 times per minutes as to ensure the normal blood flow
[Any Four]
1 1 1 1 1 1 1 1 1 1 1
4
(c) Able to state the consequence of using artificial pacemaker Answer P1: Causes atrial septal defect (hole in the heart) P2: Causes infection
1 1

P3: Agglutination of blood P4: Internal bleeding after operation P5: Difficulty in breathing P6: Irregular heart beat rate P7: Faulty of artificial pacemaker can cause death P8: Artificial pacemaker must be changed after a period of using *note that all answer about the implication of surgery can be accepted.
[Any Three]
1 1 1 1 1 1
3
(d) Able to suggest the steps that you should do to reduce the risk of cardiovascular disease Answer P1: Consume balance diet// Reduce intake of sugar/ fats P2: Physically active// Exercise regularly P3: Maintain the healthy body weight P4: Do not smoke P5: Managing the stress level
[Any Three]
1 1 1 1 1
3
TOTAL
12
2 (a) Able to draw diagram correctly Answer
1 1
2
(b) Able to explain the type and mechanism of body’s defence. Answer F: Second line defence E1: Phagocytosis (process) E2: Phagocyte engulf pathogen E3: digest the pathogen
[Any three]
1 1 1 1
3

(c) Able to name Cell A and Substance X Answer Cell A: Lymphocyte// White blood cell Substance X: Antibody
1 1
2
(d) Able to state the types of body defence shown in Diagram 2.3. Answer Third line (body) defence
1
1
(e) Able to explain one characteristic of the third line defence Answer F: Specific// Targeted defence E: The antibodies recognise/ destroy/ against specific pathogens
1 1
2
(f) Able to explain the effects of the HIV on the body defence mechanism. Answer F: The immune system gradually/ slowly/ become weakened/ defenceless against disease E1: T cell cannot recognise/ detect antigen/ pathogen/ microbes/ bacteria/ virus E2: Lymphocytes cannot produce (specific) antibodies E3: The person is prone to infection/ easily infected
[Any two]
1 1 1 1
2
TOTAL 12

CHAPTER 2: LOCOMOTION AND SUPPORT
No Mark Scheme Sub Mark
Total Mark
1 (a) Able to state the type of skeleton of an earthworm. Answer Hydrostatic skeleton Rangka hidrostatik
1
1
(b) Able to explain how the earthworm moves forward. Answer P1: The circular and longitudinal muscles / antagonistic pair of muscles contract and relax Otot lingkar dan membujur / pasangan otot antagonistik mengecut dan mengendur P2: To produce peristaltic waves along the body Untuk menghasilkan gelombang peristaltik sepanjang badan P3: When the circular muscles contract, the longitudinal muscles relax Apabila otot lingkar mengecut, otot membujur mengendur P4: The earthworm becomes thinner and longer Cacing menjadi mengecil dan memanjang P5: When the longitudinal muscles contract, the circular muscles relax Apabila otot membujur mengecut, otot lingkar mengendur P6: The earthworm becomes thicker and shorter Cacing menjadi menebal dan memendek [Any three] [Mana-mana tiga]
1 1 1 1 1 1
3
(c) (i) Able to identify the fracture bone Answer: Fibula Fibula
1
1
(c) (ii) Able to explain why the cast is use to treat fracture leg Answer: P1: To immobilize / realign bone Untuk tidak menggerakkan / menyusun semula tulang
1

P2: Prevent affected bone from moving / to prevent further injury Mengelakkan tulang yang cedera daripada bergerak / untuk mengelakkan kecederaan yang lebih serius P3: Bone cells / tissues build / grow new bone cells / tissues // repair / connect the fracture / broken bone Sel tulang / tisu bina / tumbuh sel / tisu tulang yang baru // membaiki / menyambungkan tulang yang retak / patah P4: Artificial bone is used to replace severely damaged / discard Bone Tulang buatan digunakan untuk menggantikan tulang yang rosak / tidak boleh digunakan
1 1 1
4
(c)(iii) Able to suggest the diet that should consumed by patient Answer: P1: Food rich in calcium and phosphorus Makanan yang kaya dengan kalsium dan fosforus P2: To increase the formation of bone mass Untuk meningkatkan penghasilan jisim tulang P3: Food rich in Vitamin D Makanan yang kaya dengan Vitamin D P4: To increase reabsorption of calcium Untuk meningkatkan penyerapan semula kalsium [Any three] [Mana-mana tiga]
1 1 1 1
3
TOTAL 12

CHAPTER 3: COORDINATION AND RESPONSE
No Mark Scheme Sub
Mark
Total
Mark
1 (a) Able to complete Diagram 1 by drawing the neurons and
arrows to show the direction of impulse transmission in a
reflex arc.
Able to label all the neurones.
Answer
Correct pathways and arrows
Correct label (afferent neurone)
Correc label (efferent neurone)
1
1
1
3
(b)(i) Able to state how the quadriceps muscle changes when the
tendon is tapped gently.
Answer
Quadricep muscle becomes stretched
1
1
(b)(ii) Name the structure that detects this change.
Answer
Stretch receptor
1
1
(c)(i) Name the structure that is formed when two neurones meet.
Answer
Synapse
1
1
(c)(ii) Name the part of the spinal cord that has this structure.
Answer
Grey matter
1
1
(d) Able to name two reflex actions that involve glands as the
Afferent neurone
Efferent neurone
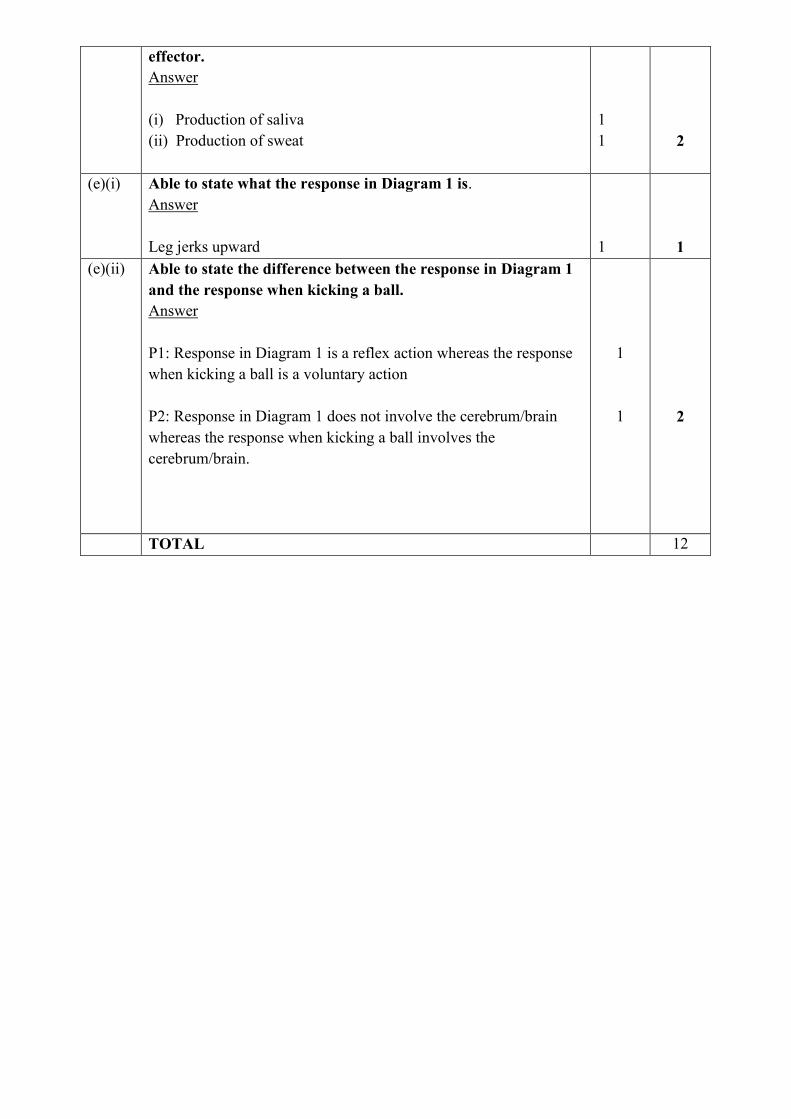
effector.
Answer
(i) Production of saliva
(ii) Production of sweat
1
1
2
(e)(i) Able to state what the response in Diagram 1 is.
Answer
Leg jerks upward
1
1
(e)(ii) Able to state the difference between the response in Diagram 1
and the response when kicking a ball.
Answer
P1: Response in Diagram 1 is a reflex action whereas the response
when kicking a ball is a voluntary action
P2: Response in Diagram 1 does not involve the cerebrum/brain
whereas the response when kicking a ball involves the
cerebrum/brain.
1
1
2
TOTAL 12

CHAPTER 4: REPRODUCTION AND GROWTH
No Mark Scheme Sub Mark
Total Mark
1 (a) Able to name the label Answer A: Pollen tube Tiub debunga B: Embryo sac Pundi embrio C: Male gametes Gamet jantan
3 – 2M
2 – 1M
1 – 0M
2
(b) (i) Able to explain the function of Structure A Answer F: It grows down the style in ovary / enters the ovule Ia memanjang menuruni stil di ovari / masuk ke ovul P2: By secretes enzymes to digest the stil tissues as it grows towards an ovul Dengan merembeskan enzim untuk mencernakan tisu stil semasa pemanjangannya ke arah ovul
1 1
2
(b) (ii) Able to explain the process occur Answer P1: One of the male gamete / Structure C fuse with egg cells to form a diploid zygote Satu daripada gamet jantan / Struktur C bercantum dengan sel telur untuk menghasilkan zigot diploid. P2: The other male gamete / Structure C fuses with the two polar nuclei forming a triploid nucleus Gamet jantan yang lain / Struktur C bercantum dengan dua nukleus kutub membentuk nukleus triploid P3: This process is known as double fertilization Proses ini dikenali sebagai persenyawaan ganda dua.
1 1 1
3
(c) Able to explain the developement of fruit and seed Answer E1: After fertilization, the ovary becomes a fruit Selepas persenyawaan, ovari menjadi buah
1

E2: The ovule become a seed Ovul menjadi biji benih E3: The triploid nucleus becomes the endorsperm Nukleus triploid menjadi endosperma E4: Integuments becomes the seed coat. Integumen menjadi kulit biji [Any three] [Mana-mana tiga]
1 1 1
3
(d) Able to suggest to prevent germination of A Answer P1: Place it in dry condition Letakkan ia dalam keadaan kering P2: Keep in air tight container Simpan dalam bekas kedap udara
1 1
2
TOTAL 12

CHAPTER 5: INHERITANCE
NUM. SCORING CRITERIA MARKS
1(a)
(b)
(c)
Able to state the genotype and phenotype of A and C.
Answer:
Genotype and phenotype A: Grey body normal wing GGNN
Genotype and Phenotype C: Grey body normal wing GgNn
Able to explain why the inheritance is dihybrid
Suggested answer:
F: Involve two characteristic
Able to draw a genetic diagram between T and U to show ratio
V, W, X and Y using Punnett Square
Suggested answer:
Parent (P) Grey body normal wing X Grey body normal wing
GgNn GgNn
Meiosis
Gamete GN Gn gN gn GN Gn gN gn
Male
gamete
Female
gamate
GN
Gn
gN
gn
GN
GGNN
Grey body
normal
wing
GGNn
Grey body
normal
wing
GgNN
Grey body
normal
wing
GgNn
Grey body
normal
wing
Gn
GGNn
Grey body
normal
wing
GGnn
Grey body
normal
wing
GgNn
Grey body
normal
wing
Ggnn
Grey body
short
wing
gN
GgNN
Grey body
normal
wing
GgNn
Grey body
normal
wing
ggNN
black body
normal
wing
ggNn
black body
normal
wing
gn
GgNn
Grey body
normal
wing
Ggnn
Grey body
short
wing
ggNn
black body
normal
wing
ggnn
black body
normal
wing
Notes: accept genotype only
Correct Genotype 12 – 16 2m
7 – 11 1m
Phenotype Grey body Grey body Black body Black body
Ratio normal wing short wing normal wing short wing
9 : 3 : 3 : 1
1
1
1
1
1
2
1
1
2
1
5

(d)
5(e)
Able to explain why the ratio of genetic diagram from the
above diagram follow Mendel Second Law.
Suggested answer:
F: during metaphase 1, homologous pair of chromosome/ paternal
and maternal chromosome arrange at random// independent
assortment of chromosome
E1: results in a variety of gametes/ each with different
combinations of maternal and paternal chromosome
E2:result new combination/ recombination trait in F2 generation
Able to state Mendel Second Law
Suggested answer:
E1: During gamete formation, each member of a pair of alleles
may combine randomly
E2: with either member of another pair of allele
1
1
1
1
1
2
2
TOTAL 12

CHAPTER 6: VARIATION
No Mark Scheme Sub Mark
Total Mark
1 (a)(i) Able to state the types of variation shown by the Diagram
1.1 (a) and 1.1 (b).
Answer Diagram 1.1 (a) : Discontinuous variation Diagram 1.1 (b) : Continuous variation
1 1
2
(b) Able to state two differences between the two types of variation. Answer
Continuous variation Discontinuous variation
D1: Differences are not clear/
not distinctive
D1: Differences are clear/
distinctive
D2: Controlled by
environmental and
genetic factor
D2: Controlled by
genetic factor only
D3: Shows the graph normal
distribution
D3: Shows the graph discrete
distribution
D4: Shows intermediate
character
D4: Do not shows
intermediate character
D5: Controlled by
polygene/many pairs of
alelle
D5: Controlled by one gene/
one pair of alelle
D6: Quantitative// Can be
measured
D6: Qualitative// Cannot be
measured
[Any two]
1 1 1 1 1 1
2
(c) Able to explain the importance of variation. Answer P1: (Some individuals) adapt better to environment condition P2: These individuals are better adapted for survival P3: They can transmit the advantageous genes to their offspring
[Any two]
1 1 1
2
(d) (i) Able to name the processes involved in the mutation of P and Q. Answer P: Deletion Q: Duplication
1 1
2

(ii) Able to explain one factor that causes mutation. Answer F1: Mutagen is radioactive radiation// X-ray// Formaldehyde// Carcinogens// monosodium glutamate/ Any suitable example E1: The mutagen has high penetrating power/ high radiation// mutagen able to reach the DNA in the cells/ nucleus/ chromosomes E2: causing (drastic) change to the structure of chromosome E3: resulting section P to be deleted// gene to be missing// Section Q to be duplicated
[Any two]
1 1 1 1
2
(iii) Able to explain one bad effect caused by mutation. Answer P1: Mutation that occurs in a somatic cell may damage the cell P2: This makes the cell cancerous cell// kill the cell
1 1
2
TOTAL 12

SKEMA JAWAPAN
MODUL PPD
PASIR GUDANG 2016
BIOLOGI KERTAS 3
- T5 -

CHAPTER 1: TRANSPORT
Question 1
1 (a) [KB0603 - Measuring Using Number]
Score Criteria
3 Able to state all the change in volume of water in cm3. Criteria:
C1 Correct value with or without the correct unit C2 One decimal place
Sample answers: Mass of calcium chloride (g) 20 40 80
Change in volume of water (cm3) 2.8 4.6 8.2
2 Able to state any 2 of the change in volume of water OR 3 correct value with wrong unit.
1 Able to state any 1 of the change in volume of water OR 2 correct value with wrong unit.
1 (b) (i) [KB0601 - Observation]
Score Criteria
3 Able to state any two observations correctly according to the criteria:
C1 Mass of calcium chloride (g)
C2 Change in volume of water (cm3)
Sample answers: Horizontal 1. (When the) mass of calcium chloride is 20g, the change in volume of water is 2.8cm3. 2. (Air with) 20g calcium chloride, the water level is 2.8cm3. Vertical
3. When more (mass of) calcium chloride is used, the level of water decreases. Horizontal/Vertical 4. 20g of calcium chloride, the level of water is high / higher / highest.
2 Able to state any one observation correctly and one incomplete observation.
or Able to state any two incomplete observations.
Sample answers for incomplete observations: Horizontal/Vertical 1. 20g of calcium chloride is used. 2. The level of water decreases.
1 Able to/state any one idea of observation (Any 1 criterion)
Sample answers: 1. Different mass of calcium chloride is used. 2. The level of water change.

1 (b) (ii) [KB0604 - Making inference]
Score Criteria
3 Able to make one logical inference for each observation based on the criteria:
C1 Plant / root absorbs water
C2 Plant / shoot loses water // Water is transpired // Water is evaporated from plant
C3 Air contains less water (vapour) // Relative humidity / air humidity is less / low
// Air is drier.
Sample answers:
Horizontal/Vertical
C1+C2
1. Plant absorbs less water because less water is lost.
2. More transpiration / lost by plant so more water is absorbed (by plant).
3. More water is lost by plant so more water is absorbed.
C1+C3
4. Plant absorbs more water because the air drier.
5. In low air humidity, more water is absorbed by plant.
C2+C3
6. More water is lost by plant because the air is drier.
2 Able to make one logical inference for any one observation and one inaccurate inference
for the other observation.
or
Able to make two inaccurate inferences base on one criterion (C1, C2 or C3) for each
observation.
Sample answers for incomplete inferences:
1. Plant / root absorbs water
2. Plant / shoot loses water // Water is transpired // Water is evaporated from plant
3. Air contains less water (vapour) // Relative humidity / air humidity is less / low
// Air is drier.
1 Able to make an idea of inference with one criterion.
Sample answers:
1. Water is absorbed
2. Water is lost // Water is evaporated
3. Humidity is less / low // No water
For 1(b)(i) Observation and (ii) Inference:
Score Accurate Inaccurate Idea Wrong
3
2
1
0

1 (c) [KB061001 - Controling Variables]
Score Criteria
3 Able to state all the variables and the method to handle the variables correctly.
Sample answers: Variables Method to handle the variables Manipulated variable:
Mass of calcium chloride Use different mass/amount of calcium chlorida // Relative humidity // Air humidity // Use 20, 40, and 80g of calcium chloride Responding variable:
Water level (in the pipette) after 10 (Measure and) record by using the pipette minutes // Final water level (in the pipette) // Change in water level/volume // Calculate (change in water level/volume) by using formula: Final level/volume – Initial level/volume // Rate of transpiration // Calculate (rate of transpiration) by using formula: Change in water level/volume Time/10 Controlled variable:
Type of plant/shoot Fix / use hibiscus plant/shoot // Size of U-tube // Use same U-tube // Size/volume of glass box // Use same glass box
// Initial water level in the pipette // Initial water level (in the pipette) is 0 cm3 // Time // Fix 10 minutes
2 Able to state 4 - 5 of the variables and the method to handle the variables correctly.
1 Able to state 1 - 3 of the variables and the method to handle the variables correctly.
1 (d) [KB0611 - Making Hypothesis]
Score Criteria
3 Able to state a hypothesis to show a relationship between the manipulated variable and responding variable and the hypothesis can be validated, base on 3 criteria: C1 Manipulated variable C2 Responding variable C3 Relationship (more/less) (Accept if wrong theory)
Sample answers: 1. The lower/higher the air humidity, the lower/higher rate of transpiration. 2. When less/more calcium chloride (is used), the lower/higher the final water level (in the pipette) 3. The lower/higher the relative humidity, the less/more the change in the water level/volume (in the pipette) 4. The lower/higher the amount of calcium chloride, the lower/higher the water level (in the pipette) after10 minutes.

2 Able to state less accurate hypothesis to show a relationship between manipulated variable and responding variable base on 2 criteria.
Sample answers: 1. The lower/higher the humidity, the lower/higher rate of transpiration. (No C1) 2. The lower/higher the air humidity, the lower/higher the transpiration. (No C2) 3. When less/more calcium chloride (is used), the lower/higher the water level. (No C2) 4. The lower/higher the relative humidity, the less/more the water level/volume. (No C2) 5. The amount of calcium chloride affects the water level after10 minutes. (No C3) 6. The rate of transpiration depends on the air humidity. (No C3) 7. The air humidity depends on the rate of transpiration. (Reverse / No C3)
1 Able to state idea of hypothesis to show a relationship between manipulated variable and
responding variable base on 1 criterion.
Sample answers (Idea of C1 and C2): 1. The lower/higher the humidity, the lower/higher the transpiration. 2. When calcium chloride is used, the lower/higher the water level. 3. Transpiration occurs based on humidity. 4. The water level affects the calcium chloride.
1 (e) (i) [KB0606 - Communicating]
Score Criteria
3 Able to tabulate a table and fill in data accurately base on three criteria:
C1: Titles with correct units
C2: Recording data, for Mass of calcium chloride and Change in volume of water
C3: Calculation, for Rate of transpiration
Sample answer:
Mass of calcium Change in volume of Rate of transpiration
chloride water
3 -1 3
(g) // (gram) (cm3) (cm minute ) // cm per minute)
20 2.8 0.28
40 4.6 0.46
80 8.2 0.82
2 Able to tabulate a table base on two criteria.
1 Able to tabulate a table base on one criterion.
1 (e) (ii) [KB0608 - Space and Time Relationship]
Score Criteria
3 Able to draw a line-graph based on three criteria: C1: The x-axis and the y-axis are marked with appropriate values and constant scale. C2: All points are transferred correctly C3: Smooth/straight line touching all points (No extrapolation; not more than 3
small squares)
2 Any two criteria 1 Any one criterion

1 (e) (iii) [KB0607 - Interpreting Data]
Score Criteria
3 Able to state and explain the relationship between the rate of transpiration and the mass of calcium chloride and any two explanations. C1: Relationship Sample 1 – The more/higher the mass of calcium chloride, the more/higher the rate of transpiration. (If reverse – idea only) Sample 2 – The rate of transpiration increase linearly with the increase in the mass of calcium chloride. (If reverse – idea only) (Reject: Proportional) C2: Two Explanations: Sample 1 – Plant / root absorbs more water Sample 2 – Plant / shoot loses more water // More water is transpired // More water is evaporated from plant Sample 3 – Air contains less water (vapour) // Low relative humidity / air humidity is low // Air is drier.
Sample answer: 1. The higher the mass of calcium chloride, the higher the rate of transpiration, because the plant absorbs more water and more water is transpired. 2. The more the mass of calcium chloride, the more the rate of transpiration, because the air is drier and more water is evaporated from the plant.
2 Able to state the relationship and any one explanation, or idea of relationship and two explanations.
1 Able to state the relationship, or idea of relationship and one explanation.
1 (f) [KB0609 - Define Operationally]
Score Criteria
3 Able to state the meaning of transpiration operationally, based on the experiment.
Criteria: C1 Transpiration is the evaporation of water from hibiscus plants / shoot. C2 Determined by the change in volume of water in 10 minutes / change in water level in the pipette after 10 minutes C3 Depends on air humidity / amount of water vapour in the air
Sample answer: 1. Transpiration is the evaporation of water from hibiscus shoot. The rate of transpiration is determined by the change in the volume of water in 10 minutes and is affected by the amount of water vapour in the air.
2 Able to state any two criteria
Sample answers: 1. Transpiration is the evaporation of water from shoot. The rate of transpiration is determined by the change in the volume of water in 10 minutes and is affected by the amount of water vapour in the air. 2. Transpiration is the evaporation of water from hibiscus shoot. The rate of transpiration is determined by the change in the volume of and is affected by the amount of water vapour in the air.
1 Able to state any one criterion or at idea level only.
Sample answers:

1. Transpiration is the lost of water in the form of water vapour from plants // Theory 2. Transpiration is the evaporation of water from shoot. 3. The rate of transpiration is determined by the change in the volume of water. 4. Transpiration is affected by the amount of water vapour.
1 (g) [KB0605 - Predicting]
Score Criteria
3 Able to predict the rate of transpiration when another hibiscus shoot with six number of leaves is used and the air is treated with 40g of calcium chloride, and explain the prediction based on three criteria.
C1 Prediction: Any value more than 0.46 cm3 minute -1 // Higher than 0.46 cm3 minute -1. (Higher / without unit – idea level, no marks, can consider C2 and C3) C2 Explanation 1: Larger surface area of leaves // More number of stomata C3 Explanation 2: More water evaporated from leaves
Sample answer:
1. (The rate of transpiration is) 0.50 cm3 minute-1 because larger surface area of leaves and more water is evaporated from the leaves.
2. More than 0.46 cm3 minute-1 because more stomata so more water is transpired out from the plant.
2 Able to predict less accurately (Prediction+1explanation//Prediction (idea)+ 2 Explanations)
Sample answer: 1. The rate of transpiration is more because more stomata so more water is transpired out from the plant.
2. 0.50 cm3, because larger surface area of leaves and more water is evaporated from the leaves.
1 Able to give idea of prediction. (Prediction // Prediction (idea) + 1 Explanation)
Sample answer:
3. 0.50 cm3, because more water is evaporated from the leaves. 4. More because more stomata on the leaves.
1 (h)
[KB0602 - Classifying]
Score Criteria
3 Able to classify each character to the correct category of factor.
Sample answer:
Biotic factor Abiotic factor
Surface area of leave Relative humidity
Number of stomata Topography
- Temperature - Light intensity
2 Able to classify any 4 correctly.
1 Able to classify any 2 correctly.

Question 2
Problem Statement
Score Criteria
3
Able to state the problem statement of the experiment correctly that include criteria:
Manipulate variables
Responding variables
Relation in question form and question symbol [?]
Sample answers:
1. Does the number of leaves affect the rate of transpiration (in hibiscus plants)?
2. What is the relationship between the number of leaves and the rate of
transpiration (in a hibiscus plant)?
2
Able to state the problem statement of the experiment with two criteria.
Sample answers:
1. Do leaves affect the rate of transpiration (in a plant)?
2. Does the number of leaves affect the rate of transpiration.
3. What is the relationship between the number of leaves and transpiration?
1
Able to state the of problem statement with one criteria.
Sample answers:
1. Do leaves affect the transpiration (in a plant)?
2. Does transpiration occurs through the leaves (in plants)?
Hypothesis
Score Criteria
3 Able to state the hypothesis correctly according to the criteria:
Manipulate variables
Responding variables
Relationship of the variables
Sample answers:
1. The more the number of leaves the higher rate of transpiration.
2. When the number of leaves increases the rate of transpiration increases.
Correct hypothesis but wrong concept based on theory
3. The more the number of leaves the lower rate of transpiration.
4. More leaves cause the rate of transpiration to decrease.

2 Able to state the hypothesis with two criteria
Sample answers: 1. When the number of leaves increases the transpiration increases. 2. The number of leaves affects the rate of transpiration in plants.
1 Able to state the idea of the hypothesis.
Sample answers: 1. The number of leaves affects transpiration in plants.
Variables
Score Criteria Able to state the three variables correctly
Sample answers:
Manipulated variable: Number of leaves / stomata Responding variable: Distance travelled by air bubble (in five minutes)
// The rate of transpiration Controlled variable: Type of (terrestrial) plant / hibiscus // Light intensity //
Surrounding temperature Materials and Apparatus
Score Criteria
3 Able to state all functional materials / 2*materials + 1 other material and 2*apparatus + 4 other apparatus for the experiment.
Materials: *Hibiscus shoot / plant, water, and plasticine. Apparatus: *Ruler / weighing balance, capillary tube + rubber tubing // potometer //
stoppered conical flask, beaker / basin, (sharp) knife, stopwatch, string / marker pen and tissue paper / filter paper.
2 Able to state all functional materials / 2*materials and 2*apparatus + 2 other
apparatus for the experiment.
1 Able to state all functional materials / 2*materials and 2*apparatus for the experiment.

Procedure
Score Criteria
3 Able to state five procedures P1, P2, P3, P4 and P5 correctly.
P1 : How to Set Up The Apparatus (5P1)
P2 : How to Make Constant The Control Variable (1P2)
P3 : How to Manipulate The Manipulated Variable (1P3)
P4: How to Record The Responding Variable (2P4)
P5 : Precaution / Accuracy (2P5)
2 Able to state three of any procedures: 4P1 / 1P2 / 1P3 / 2P4 / 2P5 correctly
1 Able to state two of any procedures: 4P1 / 1P2 / 1P3 / 2P4 / 2P5 correctly
Example of Procedure:
1. (Diagram of experimental setup with at least 5 functional labels). P1
2. Obtain a hibiscus shoot P1
and immediately immerse in water. P5
3. By using a sharp knife, cut off 4 cm of the hibiscus stem under water. P5
4. Fill in the capillary tube with attached rubber tubing / potometer with water. P1
5. Fix in the stem of the hibiscus shoot into the rubber tubing / potometer. P1
Make sure no air bubble trapped. P5
6. Immerse the capillary tube / potometer in a beaker of water. P1
7. Wipe dry the leaves with tissue papers. P5
8. Leave the setup for 5 minutes (for the plant to adapt with the new environment). P5
9. Lift the capillary tube from the water to trap a column of air bubble // Trap an air P1
bubble in the capillary tube / potometer.
10. Tie a string on the capillary tube to mark the initial position of the air bubble. P1
11. Start the stopwatch. P1
12. After 5 minutes tie another string to mark the final position of the air bubble. P1
13. Repeat step 12 to get another reading. P5
14. Measure both distances by using a ruler. P4
Calculate the average distance traveled by the air bubble in 5 minute. P4
Record in a table // Tabulate the data. P4
15. By using the same plant, P2
repeat steps 7 until 13 by removing one leave each time. P3
16. Calculate the rate of transpiration. P4

25
Score Criteria Able to construct the correct table with titles and units based on three criteria.
Number of leaves Distance travelled (cm) // Time taken (minute) 1m Rate of transpiration (cm minute-1)
Sample answers:
Number of Distance travelled by air bubble Rate of transpiration
in 5 minutes (cm)
leaves
(cm minute-1)
First reading Second reading Average
OR
Number of Time taken for the air bubble to travel a Rate of transpiration
distance of 5 cm (minutes)
leaves (cm minute-1)
First reading Second reading Average
(*First and second readings + average = 1P5 Procedure)

26
CHAPTER 3: COORDINATION AND RESPONSE
ITEM NO 1
SCORE
EXPLANATION
REMARKS
(a) KB0603 – Measuring using numbers
3
Able to record all eight data correctly Sample answer
Volume of water intake
(ml)
Volume of urine produced (ml)
First time Second time 100 ml 80 82 200 ml 150 170 300 ml 200 250 400 ml 360 370
2
Able to record 5-7 data correctly
1
Able to record 2-4 data correctly
0
Not able to give any response or wrong response
(b) (i) KB0601 – Observing Accepted: Any suitable answer
3
Able to state any two observations correctly Sample answer 1. At the first time volume of water intake (about 100ml mineral water), student A produces urine about 80ml and at the second time volume of water intake (about 100ml mineral water), student A produces urine about 82ml. 2. At the first time volume of water intake (about 400ml mineral water), student D produces urine about 360ml and at the second time volume of water intake (about 400ml mineral water), student D produces about 370ml. 3. At the first time volume of water intake, student A produces the least urine about 80ml and 82ml compare to the student B/C/D which produces urine about 150ml and 170ml/200ml and 250ml/360ml and 370ml

27
2
Able to state any one of the above observation correctly and one idea of observation Sample answer
1. When student A drinks less mineral water, he/she produce less urine.
2. When student D drinks more mineral water, he/she produced more urine
1
Able to state two ideas of the above observations correctly Sample answer
1. Student A produced less urine 2. Student D produced more urine
0
Not able to give any response or wrong response
(b) (ii)
KB0604 – Making inference
3 Able to state two possible inferences for each observation based on the following: P1: More / less water reabsorbed from the tubule of kidney into blood capillary P2: High/ low blood osmotic pressure Sample answer 1. Student A produces less urine because more water can be reabsorbed from the tubule of kidney into blood capillary due to high blood osmotic pressure 2. Student D produces more urine because less water can be reabsorbed from the tubule of kidney into blood capillary due to low osmotic pressure 3. Student A produces less urine than student B/C/D because more water B/C/D
2
Able to state any one possible inference for each observation and one inference that less accurate Sample answer 1. Student A produce less urine because more water can be reabsorbed from the tubule of kidney into blood capillary /due to high blood osmotic pressure 2. Student D produce more urine because less water can be reabsorbed from the tubule of kidney into blood capillary / due to low blood osmotic pressure

28
1
Able to state two inferences but less accurate Sample answer 1. Student A kidney’s tubule reabsorbs more water 2. Student D has low osmotic pressure
0
Not able to give any response or wrong response
(c) KB0610 – Controlling variables 3
Able to state any 5-6 items from the table Variable Particular to be implemented Manipulated variable Volume of water intake
Used different volume of water intake by each student such as 100ml, 200ml, 300ml and 400ml
Responding variable Volume of urine produce
Measure and record the volume of urine produce by using a measuring cylinder
Constant variable Time (before collecting urine) Same student
Fixed the time about 30 minutes before collecting the urine produced by each student // carry out by the same student
Constant variable : Accepted any suitable answer
2
Able to state any 3-4 items from the above
1
Able to state any 2 items from the above
0
Not able to give any response or wrong response
(d)
KB0611 – Stating a hypothesis 3
Able to write a complete hypothesis statement showing the relationship between manipulated variable and responding variable correctly. P1 = manipulated variable P2 = responding variable H = Link/ relationship Sample answer 1. The higher the volume of water intake, the higher the volume of urine produced/ output. 2. If more / higher volume of water intake, so more / higher volume of urine produced/ output
P1 – volume of water intake P2 – volume of urine produced H – relationship * wrong hypothesis was accepted
29
2
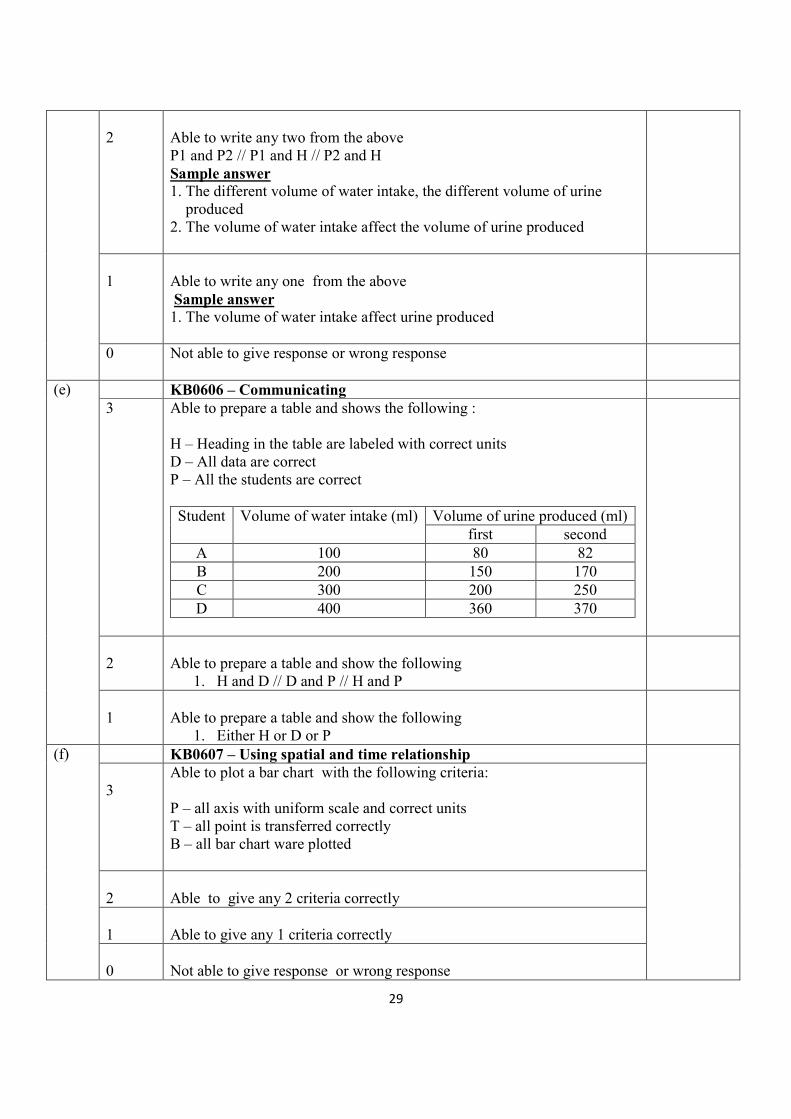
Able to write any two from the above P1 and P2 // P1 and H // P2 and H Sample answer 1. The different volume of water intake, the different volume of urine produced 2. The volume of water intake affect the volume of urine produced
1
Able to write any one from the above Sample answer 1. The volume of water intake affect urine produced
0 Not able to give response or wrong response
(e) KB0606 – Communicating 3 Able to prepare a table and shows the following :
H – Heading in the table are labeled with correct units D – All data are correct P – All the students are correct Student Volume of water intake (ml) Volume of urine produced (ml)
first second A 100 80 82 B 200 150 170 C 300 200 250 D 400 360 370
2
Able to prepare a table and show the following
1. H and D // D and P // H and P
1
Able to prepare a table and show the following
1. Either H or D or P
(f) KB0607 – Using spatial and time relationship 3
Able to plot a bar chart with the following criteria: P – all axis with uniform scale and correct units T – all point is transferred correctly B – all bar chart ware plotted
2
Able to give any 2 criteria correctly
1
Able to give any 1 criteria correctly
0
Not able to give response or wrong response

30
(g) KB0608 – Interpreting Data
3 Able to explain the relationship between the volume of water intake and the volume of urine produced Sample answer: If the volume of water intake is higher, more volume of urine will be produced because low blood osmotic pressure will cause less water to be reabsorbed from the tubule of the kidney into blood capillary
2 Able to write any two from the above E1 and E2 // E1 and E3 // E2 and E3
1 Able to write any one from the above E1 // E2 //E3
0 Not able to give response or wrong response
(h)
KB0605 – Predicting 3
Able to predict the Sample answer E1 – volume of urine produced decrease / reduced/low/less than 370ml E2 – because orange juice contains more sugar/solute substance E3 – causing blood osmotic pressure is high, so more water can be reabsorbed from the tubule of the kidney into blood capillary
2
Able to state any two from the above
1
Able to state any one from the above
0
Not able to give response or wrong response
(i)
KB0609 – Defining by operation 3
Able to describe the concept of osmoregulation correctly based on the observation Sample answer Osmoregulation is E1 – a process of maintaining blood osmotic pressure of the four student/student A, B, C and D E2 – which can be determined by the volume of urine produced in first and second time E3 – Volume of urine produced is affected by the volume of water intake.

31
2
Able to state any two from the above
1
Able to state any one from the above
0
Not able to give response or wrong response
(j)
KB0602 – Classifying
3
Able to classify correctly the list of apparatus and materials according to the variables Sample answer
Variable Apparatus Material Manipulated Mineral bottle Mineral water Responding Measuring cylinder Urine Controlled Stopwatch Student
2
Able to classify the list of apparatus and materials according to any two variables
1
Able to state the materials in any one class completely
0
Not able to give response or wrong response
Question 2
Problem Statement
Score Criteria
3
Able to state the problem statement of the experiment correctly that includes criteria:
Manipulate variables
Responding variables
Relation in question form and question symbol [?]
Sample answers:
1. What is the effect of water intake on urine output?
32
2. Does drinking a lot of mineral water causes high amount of urine produced?
2
Able to state the problem statement of the experiment with any 2 criteria.
Sample answers:
1. Does drinking a lot of mineral will have an effect to human?
2. What is the effect of water intake?
1
Able to state the of problem statement with any 1 criterion.
Sample answer:
Water intake causes urine production.
0 Not able to response or wrong response.
Hypothesis
Score Criteria
3
Able to state the hypothesis correctly according to the criteria:
Manipulate variables
Responding variables
Relationship of the variables
Sample answers:
1. If more water is taken, more urine will be released.
2. The higher the volume of water intake, the higher the amount of urine produced.

33
2
Able to state the hypothesis with any 2 criteria
Sample answer:
1. Drinking a lot of mineral water will cause a higher amount of urine production.
1
Able to state the idea of the hypothesis.
Sample answer:
1. Water intake causes urine production.
0 Not able to response or wrong response.
Variables
Score Criteria
3 Able to state the 3 variables correctly.
Sample answers:
Manipulated variable: Volume of water
Responding variable: Volume of urine released
Controlled variable: Same student / same environment
2 Able to state the any 2 variables correctly.
1 Able to state the any 1 variable correctly.
0 Not able to response or wrong response.
Materials and Apparatus
Score Criteria
3
Able to state all functional materials= 2 materials and 4 apparatus
Materials : 1. Drinking water
2. Student

34
Apparatus : 1. Beakers
2. Measuring cylinder
3. Cup/mug
4. Stopwatch
2
Able to state 3 materials and 2 apparatus s for the experiment.
1 Able to state 2 materials and 1 apparatus for the experiment.
0 Not able to response or wrong response.
Procedure
Score Criteria
3
Able to state five procedures K1, K2, K3, K4 and K5 correctly.
K1 : Steps to set up the apparatus ( at least three K1)
K2 : Steps to handle the fixed variable (one K2)
K3 : Steps to record the responding variable (one K3)
K4 : Steps to handle the manipulated variable (one K4)
K5 : Precautionary steps / steps taken to get accurate results / readings (one K5)
2 Able to state 3-4 of any procedures correctly
1 Able to state 2 of any procedures correctly
0 Not able to response or wrong response.
35
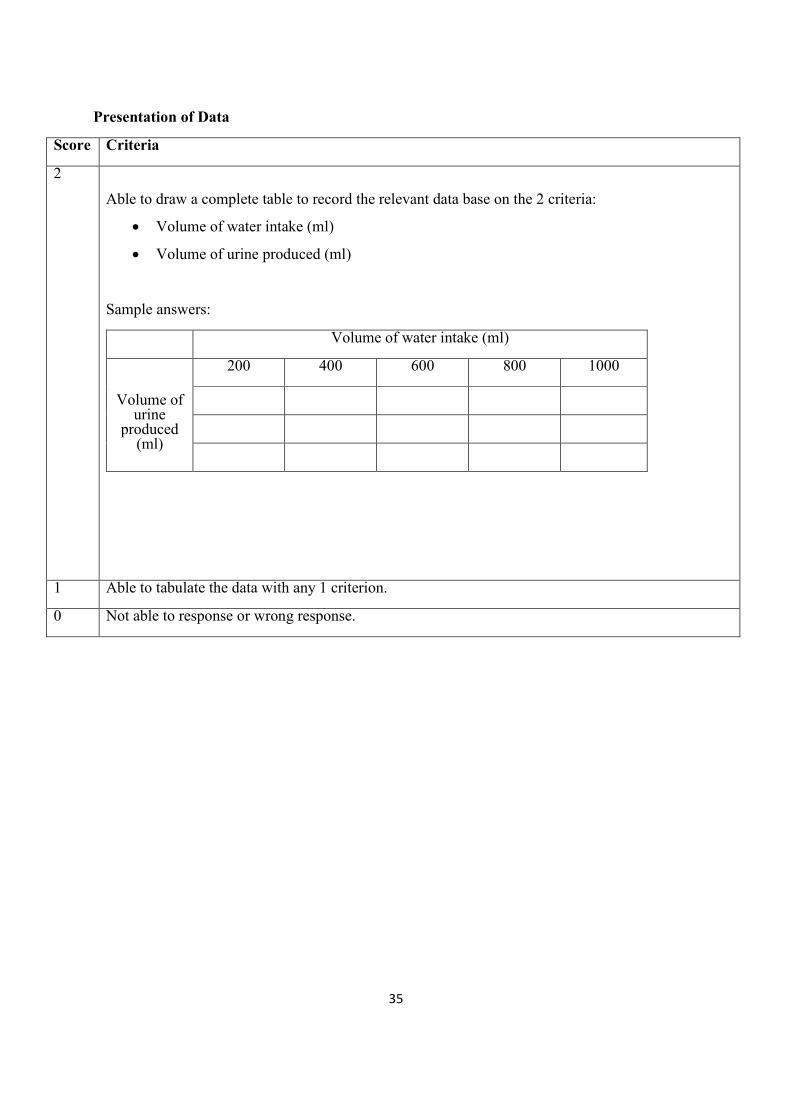
Presentation of Data
Score Criteria
2
Able to draw a complete table to record the relevant data base on the 2 criteria:
Volume of water intake (ml)
Volume of urine produced (ml)
Sample answers:
Volume of water intake (ml)
Volume of urine
produced (ml)
200 400 600 800 1000
1 Able to tabulate the data with any 1 criterion.
0 Not able to response or wrong response.

36
CHAPTER 6: VARIATION
QUESTION 1
(a)[KB0603-measuring using number]
Score Item Criteria 3
1(a)
Able to record correctly all the mass of 10 tomatoes and average mass for each tomato in Table 1. Sample answer:
Glass house Duration tomato plant exposed to the light
intensity daily (hour)
Mass of 10 tomatoes (kg)
Average mass of
each tomato (kg)
A 12 3 0.3
B 6 2 0.2
2 Able to record 3 readings correctly 1 Able to record 2 reading correctly 0 Not able to response or wrong response (b) (i) [KB0601 - Observation]
Score Item Criteria
3 1(b)(i) Able to state the correct observations based on the following criteria:
P1: Glass house/Duration tomato plant exposed to the light intensity daily P2: Mass of 10 tomatoes/ Average mass of each tomato Sample answer: 1. When the duration of tomato plant exposed to the light intensity Daily is 12hours , the mass of 10 tomatoes is 3 kilograms. 2. When the duration of tomato plant exposed to the light intensity daily is 6hours , the mass of 10 tomatoes is 2 kilograms. 3. In Glass house A, average mass of each tomato is 0.3kg. 4. In Glass house B, average mass of each tomato is 0.2kg.
2 Able to state any one observation correctly with or
Able to state any two incomplete observations.
1 Able to state any one idea of observation
0 Not able to response or wrong response
(b) (ii) [KB0602- Making Inference]
Score Item Criteria
3 Able to state correct inference for each observation based on any two
37
criterias: P1: time exposed to the light/light intensity P2: growth rate of tomato P3: causes variation on tomatoes Sample answer: Inference 1: When time exposed to the light is long/light intensity is high, the growth rate of tomato is high//Light intensity is high, it causes variation on tomatoes. Inference 2: When time exposed to the light is short/light intensity is low, the growth rate of tomato is low//Light intensity is low, it causes variation on tomatoes.
2 Able to state any one inference correctly or
Able to state any two incomplete inferences
Sample answer:
1. High/low light intensity affect growth in tomato plant 2. Variation of tomato influenced by light intensity
1 Able to state any one idea of inference Sample answer:
1. Light intensity cause growth
0 Not able to response or wrong response
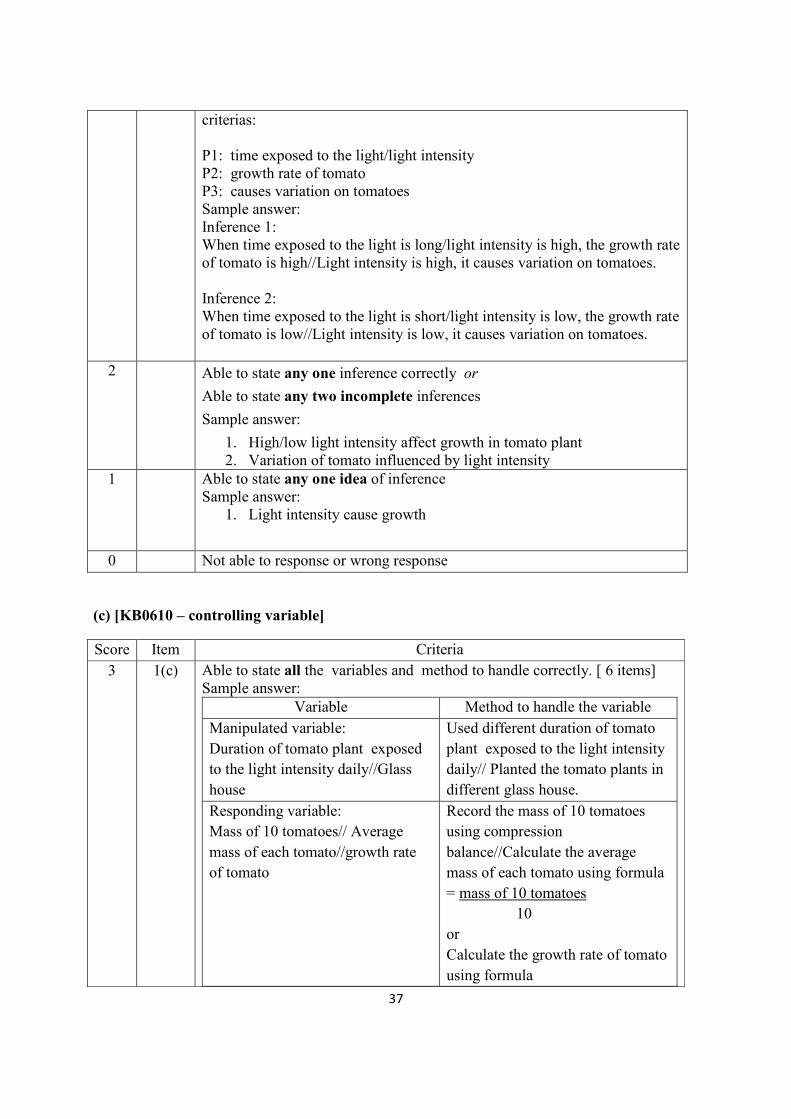
(c) [KB0610 – controlling variable]
Score Item Criteria
3
1(c)
Able to state all the variables and method to handle correctly. [ 6 items] Sample answer:
Variable Method to handle the variable
Manipulated variable:
Duration of tomato plant exposed
to the light intensity daily//Glass
house
Used different duration of tomato
plant exposed to the light intensity
daily// Planted the tomato plants in
different glass house.
Responding variable:
Mass of 10 tomatoes// Average
mass of each tomato//growth rate
of tomato
Record the mass of 10 tomatoes
using compression
balance//Calculate the average
mass of each tomato using formula
= mass of 10 tomatoes
10
or
Calculate the growth rate of tomato
using formula
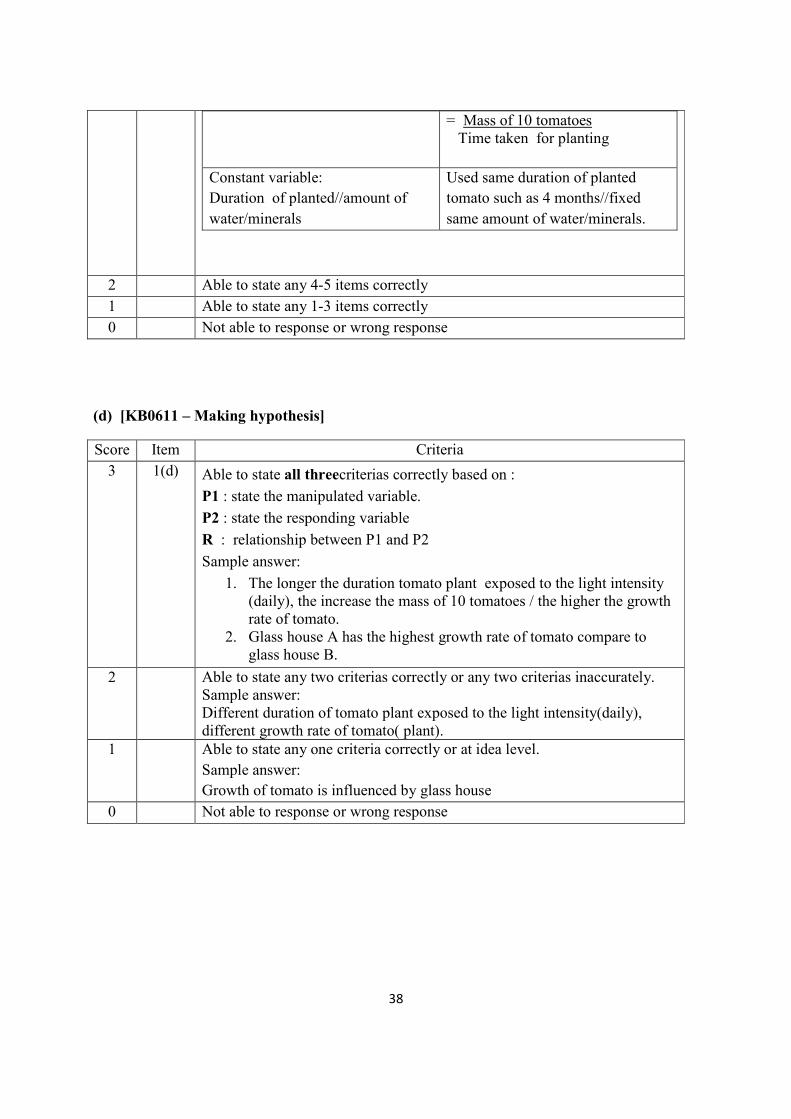
38
= Mass of 10 tomatoes Time taken for planting
Constant variable:
Duration of planted//amount of
water/minerals
Used same duration of planted
tomato such as 4 months//fixed
same amount of water/minerals.
2 Able to state any 4-5 items correctly
1 Able to state any 1-3 items correctly
0 Not able to response or wrong response
(d) [KB0611 – Making hypothesis]
Score Item Criteria
3 1(d) Able to state all threecriterias correctly based on :
P1 : state the manipulated variable.
P2 : state the responding variable
R : relationship between P1 and P2
Sample answer:
1. The longer the duration tomato plant exposed to the light intensity (daily), the increase the mass of 10 tomatoes / the higher the growth rate of tomato.
2. Glass house A has the highest growth rate of tomato compare to glass house B.
2 Able to state any two criterias correctly or any two criterias inaccurately. Sample answer: Different duration of tomato plant exposed to the light intensity(daily), different growth rate of tomato( plant).
1 Able to state any one criteria correctly or at idea level.
Sample answer:
Growth of tomato is influenced by glass house
0 Not able to response or wrong response

39
(e)(i) [KB 0606 – Communicating skill ]
Score Item Criteria
3 Able to construct a table and record all the data correctly based on :
T: Title with correct units
D: Correct data
S: Correct growth rate of tomato
Sample answer:
Glass
house
Duration tomato plant exposed to the light
intensity daily (hour)
Mass of 10 tomatoes (kg)
Growth rate of
tomato (kg/months)
A 12 3 0.75
B 6 2 0.50
2 Able to state any two criterias correctly
1 Able to state any one criterias correctly
0 Not able to response or wrong response
(e) (ii) [KB0607 – Using spatial and time relationship]
Score Item Criteria
3 Able to draw a bar chart graph based on the following criteria :
P :Correct axis label with unit/ uniform scale.
T : all points are plotted correctly.
B: Correct shape of graph
2 Any two criterias
1 Any one criteria
0 Not able to response or wrong response
(e)(iii) [KB0608- Interpreting data ]
Score Item Criteria
3 Able to explain the relationship between the growth rate of tomato against duration of tomato plant exposed to the light intensity dailybased on: P1: correct conclusion
T
D S

40
The longer the duration of tomato plant exposed to the light intensity daily,
the higher the growth rate of tomato.
P2: more photosynthesis/more organic substances/glucose produced
P3:causes mass of tomato increases/variation
Sample answer:
The longer the duration of tomato plant exposed to the light intensity daily,
the higher the growth rate of tomato because more organic substance is
produced causes variation between the tomatoes.
2 Able to state P1 and P2 / P3
1 Able to state P1 only
0 Not able to response or wrong response
(g) [KB0605 – Predicting]
Score Item Criteria
3 Able to predict the mass of 10 tomatoes that will be provided when exposed the tomato plant to the light intensity for 4 hours daily correctly based on : P1: Mass of 10 tomatoes less than 2kg
P2: less photosynthesis/less organic substance/glucose produced
P3: causes growth rate of tomato decrease
Sample answer:
Mass of 10 tomatoes less than 2 kg because less photosynthesis causes
growth rate of tomato decrease
2 Able to predict any P1 and P2 / P3
1 Able to predict any P1 only
0 Not able to response or wrong response
(h) [ KB060902 - Operational definition]
Score Item Criteria
3 Able to define continous variation operationally based on :
P1: Differences between the tomato plants that have same genetic
P2: Shown by the mass of 10 tomatoes
P3: Growth rate of tomato is affected by the duration of tomato plant
exposed to the light intensity daily/glass house
Sample answer:
Continuos variation is the differences between the tomato plants that have
same genetic and can be shown by the mass of 10 tomatoes.
Growth rate of tomato is affected by the duration of tomato plant
exposed to the light intensity daily/glass house

41
2 Able to predict any 2 criterias
1 Able to predict any one criteria
0 Not able to response or wrong response
(i) [ KB0602 - Classifying]
Score Item Criteria
3 Able to classify correctly based on 3 materials and 3 apparatus ( 6 correct
ticks):
Sample answer:
Variable Pembolehubah
Apparatus Radas
Material Bahan
Manipulated Manipulasi
Light bulb Tomato plant
Responding Bergerak balas
Compression balance Tomato
Controlled Dimalarkan
Calendar Tomatoes Fertiliser
2 Any 4 to 5 ticks
1 Any 1 to 3 ticks
0 Not able to response or wrong response
Question 2
Problem statement
Score Criteria
3 Able to state the problem statement of the experiment correctly that include criteria
Manipulate variables
Responding variables
Relation in question form and question symbol [?]

42
Sample answer
Does ability to roll the tongue is discontinuous variations?
What is the types of variation of ability to roll the tongue?
Hypothesis Score Criteria
3
Able to state the hypothesis correctly according to the criteria:
Manipulate variables Responding variables Relationship of the variables
Sample answers:
1. Ability to roll the tongue is discontinuous variation Correct hypothesis but wrong concept based on theory
2. Ability to roll the tongue is continuous variation
Variables Score Criteria
3
Able to state the three variables correctly: Manipulated variable: Type of trait// Ability to roll the tongue Responding variable: Number of student which able and unable to roll the tongue Constant variable: Total number of students

43
Materials and apparatus
Score Criteria
3
Able to state all the functional apparatus and materials. Sample answer Table of ability to roll tongue classification, students, graph paper, ruler
Procedures Score Criteria
3
Able to state five procedures P1, P2, P3, P4 and P5 correctly. K1 : How to Set Up The Apparatus (4 K1) K2 : How to Make Constant The Control Variable (1K2) K3 : How to Manipulate The Manipulated Variable (1K3) K4: How to Record The Responding Variable (1 K4) K5 : Precaution / Accuracy (1 K5)
Sample answer 1. Choose 30 students from form 5 students as samples of the experiment. 2. Conduct survey among them to determine ability to roll the tongue 3. Count and record ability of students to roll tongue in a table. 4. Draw a bar chart based on data collected
Presentation of data
Score Criteria
2 Able to construct the correct table with titles and units based on two criteria.
Ability to roll the tongue Number of students
Able
Unable
END OF ANSWER SCHEME