sketching shiny surfaces: 3d shape extraction and ... · sketching shiny surfaces: 3d shape...
TRANSCRIPT

Sketching Shiny Surfaces: 3D Shape Extraction andDepiction of Specular Surfaces
ULRICH WEIDENBACHER, PIERRE BAYERL, and HEIKO NEUMANN
University of Ulm
and
ROLAND FLEMING
Max Planck Institute for Biological Cybernetics
Many materials including water, plastic, and metal have specular surface characteristics. Specular reflections have commonly
been considered a nuisance for the recovery of object shape. However, the way that reflections are distorted across the surface
depends crucially on 3D curvature, suggesting that they could, in fact, be a useful source of information. Indeed, observers can have
a vivid impression of, 3D shape when an object is perfectly mirrored (i.e., the image contains nothing but specular reflections).
This leads to the question what are the underlying mechanisms of our visual system to extract this 3D shape information
from a perfectly mirrored object. In this paper we propose a biologically motivated recurrent model for the extraction of visual
features relevant for the perception of 3D shape information from images of mirrored objects. We qualitatively and quantitatively
analyze the results of computational model simulations and show that bidirectional recurrent information processing leads to
better results than pure feedforward processing. Furthermore, we utilize the model output to create a rough nonphotorealistic
sketch representation of a mirrored object, which emphasizes image features that are mandatory for 3D shape perception (e.g.,
occluding contour and regions of high curvature). Moreover, this sketch illustrates that the model generates a representation of
object features independent of the surrounding scene reflected in the mirrored object.
Categories and Subject Descriptors: I.4.7 [Image Processing and Computer Vision]: Feature Measurement—invariants; I.4.7
[Image Processing and Computer Vision]: Scene Analysis—shape; I.3.3 [Computer Graphics]: Picture/Image Generation—
line and curve generation
General Terms:
Additional Key Words and Phrases: Nonphotorealistic rendering, 3D shape perception, perfectly specular surfaces, human visual
perception
1. INTRODUCTION
Computer vision systems for recovering a three-dimensional (3D) shape from single static images typ-ically impose stringent restrictions on the lighting conditions or reflectance properties of the objectunder scrutiny. For example, it is common for shape-from-shading algorithms to require orthographicprojection, a single, infinitely distant point light source, or Lambertian reflectance [e.g., Bruckstein
Authors’ addresses: Ulrich Weidenbacher, Pierre Bayerl, and Heiko Neumann, University of Ulm, Ulm, Germany. Roland
Fleming, Max Planck Institute for Biological Cybernetics, Tubingen, Germany.
Permission to make digital or hard copies of part or all of this work for personal or classroom use is granted without fee provided
that copies are not made or distributed for profit or direct commercial advantage and that copies show this notice on the first
page or initial screen of a display along with the full citation. Copyrights for components of this work owned by others than
ACM must be honored. Abstracting with credit is permitted. To copy otherwise, to republish, to post on servers, to redistribute
to lists, or to use any component of this work in other works requires prior specific permission and/or a fee. Permissions may be
requested from Publications Dept., ACM, Inc., 2 Penn Plaza, Suite 701, New York, NY 10121-0701, USA, fax +1 (212) 869-0481,
c© 2006 ACM 1544-3558/06/0700-0262 $5.00
ACM Transactions on Applied Perception, Vol. 3, No. 3, July 2006, Pages 262–285.
3D Shape Extraction and Depiction of Specular Surfaces • 263
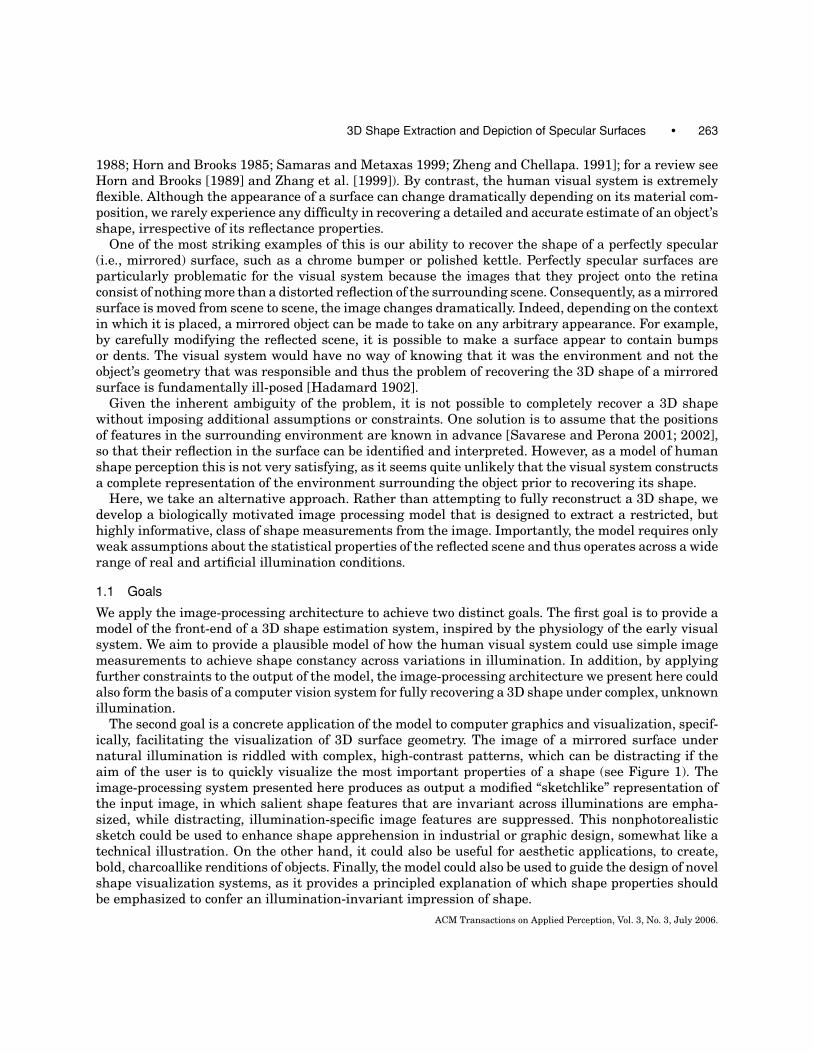
1988; Horn and Brooks 1985; Samaras and Metaxas 1999; Zheng and Chellapa. 1991]; for a review seeHorn and Brooks [1989] and Zhang et al. [1999]). By contrast, the human visual system is extremelyflexible. Although the appearance of a surface can change dramatically depending on its material com-position, we rarely experience any difficulty in recovering a detailed and accurate estimate of an object’sshape, irrespective of its reflectance properties.
One of the most striking examples of this is our ability to recover the shape of a perfectly specular(i.e., mirrored) surface, such as a chrome bumper or polished kettle. Perfectly specular surfaces areparticularly problematic for the visual system because the images that they project onto the retinaconsist of nothing more than a distorted reflection of the surrounding scene. Consequently, as a mirroredsurface is moved from scene to scene, the image changes dramatically. Indeed, depending on the contextin which it is placed, a mirrored object can be made to take on any arbitrary appearance. For example,by carefully modifying the reflected scene, it is possible to make a surface appear to contain bumpsor dents. The visual system would have no way of knowing that it was the environment and not theobject’s geometry that was responsible and thus the problem of recovering the 3D shape of a mirroredsurface is fundamentally ill-posed [Hadamard 1902].
Given the inherent ambiguity of the problem, it is not possible to completely recover a 3D shapewithout imposing additional assumptions or constraints. One solution is to assume that the positionsof features in the surrounding environment are known in advance [Savarese and Perona 2001; 2002],so that their reflection in the surface can be identified and interpreted. However, as a model of humanshape perception this is not very satisfying, as it seems quite unlikely that the visual system constructsa complete representation of the environment surrounding the object prior to recovering its shape.
Here, we take an alternative approach. Rather than attempting to fully reconstruct a 3D shape, wedevelop a biologically motivated image processing model that is designed to extract a restricted, buthighly informative, class of shape measurements from the image. Importantly, the model requires onlyweak assumptions about the statistical properties of the reflected scene and thus operates across a widerange of real and artificial illumination conditions.
1.1 Goals
We apply the image-processing architecture to achieve two distinct goals. The first goal is to provide amodel of the front-end of a 3D shape estimation system, inspired by the physiology of the early visualsystem. We aim to provide a plausible model of how the human visual system could use simple imagemeasurements to achieve shape constancy across variations in illumination. In addition, by applyingfurther constraints to the output of the model, the image-processing architecture we present here couldalso form the basis of a computer vision system for fully recovering a 3D shape under complex, unknownillumination.
The second goal is a concrete application of the model to computer graphics and visualization, specif-ically, facilitating the visualization of 3D surface geometry. The image of a mirrored surface undernatural illumination is riddled with complex, high-contrast patterns, which can be distracting if theaim of the user is to quickly visualize the most important properties of a shape (see Figure 1). Theimage-processing system presented here produces as output a modified “sketchlike” representation ofthe input image, in which salient shape features that are invariant across illuminations are empha-sized, while distracting, illumination-specific image features are suppressed. This nonphotorealisticsketch could be used to enhance shape apprehension in industrial or graphic design, somewhat like atechnical illustration. On the other hand, it could also be useful for aesthetic applications, to create,bold, charcoallike renditions of objects. Finally, the model could also be used to guide the design of novelshape visualization systems, as it provides a principled explanation of which shape properties shouldbe emphasized to confer an illumination-invariant impression of shape.
ACM Transactions on Applied Perception, Vol. 3, No. 3, July 2006.

264 • U. Weidenbacher et al.
Fig. 1. (a) Perfectly specular object illuminated by a forest scene (left) and different versions of sketch drawings created by a
skilled artist (right). Note that the artist seems to emphasize those features that seem to be important for the perception of
3D shape.
1.2 Previous Work
1.2.1 Human Perception. It is well established that specular reflections facilitate human shapeperception. Psychophysical studies have shown that specular reflections contribute to shape estimationin the presence of other cues, such as shading, binocular stereopsis, and texture [Blake and Bulthoff1990; 1991; Norman et al. 2004; Todd and Mingolla 1983; Todd et al. 1997].
Savarese et al. [2004] showed subjects patches that were cropped out of photographs of mirroredsurfaces reflecting a standard checkerboard pattern. The subjects’ task was to identify which of threecategorically different shapes the patch belonged to (sphere, cylinder or hyperbolic paraboloid). Theyfound that subjects performed barely above chance levels. By contrast, using the popular “gauge figure”task, Fleming et al. [2004] found that humans are good at estimating 3D shapes from mirrored surfaces,even when the objects are shown in isolation (i.e., so that there is no information about the surroundingscene). The inconsistency between these findings likely results from differences in the stimuli. Fleminget al. used complex, irregular object shapes; the entire object was simultaneously visible; and thepatterns reflected in the surface were richly structured real-world scenes. Under these conditions,humans seem to be excellent at inferring 3D shape from specular reflections.
1.2.2 Computational Work. Compared to the immense body of work on shape from shading, spec-ular reflections have received relatively little attention. A number of authors have used active lighttechniques to overcome the inherent ambiguity of specular reflections. For example, Ikeuchi [1981]analyzed photometric stereo for the special case of specular surfaces. Sanderson et al. [1988] developedSHINY, a structured light system to recover surface depth and orientation for industrial applications,using both single and multiple cameras. More recently, Zheng and Murata [2000] developed a systemin which a rotating specular object was illuminated by extended circular light sources. The shape foreach rotation plane was computed from motion stereo, or by tracing the specularities’ motion acrossthe surface.
Other authors have used multiple views or camera motion. Koenderink and van Doorn [1980] de-scribed the qualitative behavior of specular highlights as they move across curved surfaces in responseto viewer motion. Blake and colleagues [Blake 1985; Blake and Brelstaff 1988; Blake and Bulthoff1990; 1991] analyzed the problem of specular stereo, showing how the position, in depth, of a specularhighlight is related to the curvature of the surface. Zisserman et al. [1989] provided a quantitativeanalysis of the information available to a camera undergoing known motion. One key result was that
ACM Transactions on Applied Perception, Vol. 3, No. 3, July 2006.

3D Shape Extraction and Depiction of Specular Surfaces • 265
the convex/concave ambiguity can be resolved under unknown illumination. Oren and Nayar [1996]developed an algorithm for discriminating between real and virtual features based on their motionacross the surface. The authors use their analysis to uniquely recover 3D surface profiles by tracking asingle virtual feature across the surface.
In elegant computational work, Savarese and Perona [2001, 2002] were the first to provide a generalsolution for recovering shape from mirror reflections in single static images. However, the solutionrequires a calibrated scene to be reflected in the mirrored surface. Where three intersecting lines arevisible in the reflected pattern, first-order local information can be recovered.
Several authors have observed that the shapes of specular highlights are influenced by surface ge-ometry [Beck and Prazdny 1981; Hartung and Kersten 2003; Longuet-Higgins 1960; Todd et al. 2004],noting that this could be important in discriminating highlights from other effects, such as texturemarkings. Extending this observation, Fleming et al. [2004] showed how populations of simple filterstuned to different orientations could be used to extract information related to 3D surface curvaturesdirectly from single static images of mirrored surfaces under unknown illumination. Surface curvaturedistorts the reflected environment into complex patterns of image orientation that vary continuouslyacross the surface. Fleming et al. showed how these “orientation fields” are systematically related tothe underlying geometry.
The current work builds on this observation to create a complete neurally inspired architecture forextracting clean, reliable orientation fields from noisy images. The most important contribution is theaddition of an iterative grouping circuit, that refines the local orientation estimates depending on theneighbourhood. This substantially improves the accuracy with which shape properties can be estimated.Furthermore, it is this feedback circuit that enables the model to produce the nonphotorealistic sketchrepresentation for emphasizing the illumination-invariant features of the image.
1.2.3 Nonphotorealistic Rendering and Shape Visualization. The technical illustrator’s art is todepict the essential structural and functional components of a device without overpopulating the imagewith confusing or distracting details. It is widely believed that simplified illustrations of objects actuallyimprove perception (and/or comprehension), although the empirical evidence for this [e.g., Biederman1987; Dwyer 1967; Fraisse and Elkin 1963; Ryan and Schwartz 1956] is rather mixed, and likely dependson the task to be performed (e.g., recognition of familiar objects versus assembling a complex objectfrom instructive illustrations). However, there are certainly cases in which exaggerated or caricaturedstimuli are preferred to their realistic counterparts in a biological context [Tinbergen and Perdeck 1950;Tinbergen 1951] or yield superior task performance in humans [Benson and Perrett 1991; Rhodes et al.1987], suggesting that nonphotorealism might be exploited to facilitate perception. Here we attempt tocreate sketchlike representations of the input image (see Figure 1) to aid shape apprehension and foraesthetic applications.
There is a large body of previous research on image-based nonphotorealistic rendering (NPR), inwhich arbitrary images or videos are fully or semiautomatically modified to create the impressionof a particular medium or artistic style, including paint [Curtis et al. 1997; Hays and Essa 2004;Hertzmann 1998; Shiraishi and Yamaguchi 2000], pencil [Jin et al. 2002; Yamamoto et al. 2004], stippledrawings [Deussen and Strothotte 2000], mosaics [Hausner 2001], cubism [Collomosse and Hall 2003],impressionism [Litwinowicz 1997], or simply stylized [DeCarlo and Santella 2002].
A number of researchers have involved some degree of user interaction, to improve the quality ofresults. For example, Durand et al. [2001] developed a system for creating artistic renditions of pho-tographs, in which the user determines stroke density and important structural features to interactivelycreate the drawing. Recently, Kang et al. [2005] developed an interactive technique for generating car-toonlike sketches from photographs. The system uses wavelet frames to allow multiresolution control
ACM Transactions on Applied Perception, Vol. 3, No. 3, July 2006.

266 • U. Weidenbacher et al.
of B-splines, which represent the depictive strokes. Other NPR sketch systems are designed more togive an overall “gist” of the depicted person or object [Chen et al. 2004; Gooch et al. 2004] rather thanfaithfully showing 3D shape properties of arbitrary objects.
There has also been considerable amount of work on the optimal rendering parameters for visualizing3D shape from geometric models. Gooch et al. [1998] developed a shading technique for automaticallygenerating technical illustrations from 3D models. The resulting sketches combine edges for depictingboundaries and a highly stylized “cool-to-warm” shading to produce the impression of curvature in 3D,although no psychophysical motivation or validation was offered. Interrante and colleagues [Interranteand Kim 2001; Interrante et al. 2002; Kim et al. 2003] have systematically explored the influences oftexture on 3D shape visualization, and developed methods for depicting transparent surfaces so thattwo superimposed surface shapes can be simultaneously visualized. Recently, Bair et al. [2005] used acombination of psychophysics and machine-learning techniques to find perceptually optimal texturesfor visualizing two superimposed surfaces.
By contrast to most previous NPR research, our sketch algorithm is intended to take a single greyscaleimage as input and to automatically produce a modified version of the image as output. In the result-ing “sketch,” image regions containing reliable illumination-invariant shape features are emphasized,while regions containing spurious orientations that are because of reflections of the environment aresuppressed.
2. METHODS
In this section, we explain how a particular class of curvature-related information can be extracteddirectly from a 3D model of an object. This information (the “ground-truth”) will be used later to assessthe accuracy with which our model estimates these values from a rendered image of the object. Wethen continue to give an overview of our proposed model for the extraction of curvature information,followed by a detailed description of the model and its different components.
2.1 Extracting Ground-Truth Curvature Information from the 3D Model
The intrinsic properties of surface geometry can be described by means of differential geometry. Forexample, a regular surface in R3 is locally defined by its orientation and curvature properties depictedby mutually orthogonal tangent vectors and mutually orthogonal normal sections that define the curvesof minimal and maximal normal curvatures. The product of the normal curvatures defines the Gaussiancurvature of the surface at a selected point on the surface. In perception, we are concerned with theextraction of surface properties from images of illuminated surfaces taken from a certain viewpoint.Because of the projection of the visible surface part of an object, its shape can be described by its height,that is, as a function z = f (x, y) (known as Monge patch [do Carmo 1976]).1 In this coordinate system,(Figure 3) the first derivatives of f (i.e., the gradient of f ) describe the slant of the surface whichis the angle between the viewer’s line of sight and the surface normal. The second derivatives of thesurface (i.e., the Hessian matrix) describe the rate at which the surface normal changes with respectto the viewer. This can be described as the view-centered curvature of the surface.2 Note that this hasto be distinguished from the intrinsic curvature, which is defined in local coordinates. For example,
1We are neglecting influences of perspective projection in image acquisition by assuming that the object size is small in comparison
to viewing distance, such that the mapping can be approximated through an orthographic projection.2For convenience, from here on we refer to the Hessian matrix and related concepts loosely as “curvature.” The reader should be
careful to keep in mind that when we use the term “curvature” we mean the second derivatives, and when we speak of “principal
curvature directions” and “principal curvatures,” we mean the eigenvectors and corresponding eigenvalues of the Hessian matrix.
For Monge patches the Gaussian curvature can be calculated from the Hessian by taking its determinant scaled by a measure of
the slant [do Carmo 1976].
ACM Transactions on Applied Perception, Vol. 3, No. 3, July 2006.

3D Shape Extraction and Depiction of Specular Surfaces • 267
Fig. 2. 3D model and corresponding curvature information. Minimal curvature orientations are color coded. The anisotropy of
curvature is displayed as the intensity of the color. We use the LIC method described in Cabral and Leedom [1993] and Stalling
and Hege [1995], in addition to the color coding to illustrate local orientations. Note that there are distinct lines of isotropic
curvature (dark) which belong to inflection points of the surface. Here one curvature component changes the sign, resulting in
an abrupt change of the orientation by 90◦.
the intrinsic curvature is constant in all directions at all locations on a sphere, while the view-centeredcurvature is equal in all directions only in the middle of the projected sphere; close to the boundary, thesecond derivatives are increasingly large in the direction perpendicular to the circumference, and zeroparallel to the circumference.
Each point on the surface has a minimum and a maximum curvature direction which are alwaysperpendicular to each other. In the case of view-centered curvature, they are always perpendicular toone another in the image plane. If the maximal and the minimal curvatures have the same magnitude,we then speak of an isotropic surface. When minimal and maximal curvatures are different magnitudes,then the surface is anisotropic. Here, the ratio between maximal and minimal curvature magnitudesdescribes the strength of the anisotropy of curvature. In other words, the anisotropy of curvaturedescribes how spherical or cylindrical a surface patch is at any point. The anisotropy is very importantbecause we will later see that distortions in the mirrored scene are directly related to this parameter.To extract the discussed parameters, we need to compute the Hessian matrix (Eq. 1):
H =(
f xx fx yf yx f y y
)(1)
where f is the surface function as mentioned above. The eigenvalues (λ1, λ2) and the eigenvectors(v1, v2) of H have the following meaning:
1. The first eigenvector v1, v2 of the Hessian matrix describe the orientation of maximal curvature andminimal curvature, respectively.
2. The ratio of the eigenvalues describes the anisotropy of curvature where the term 1 − λ2
λ1yields
values between zero (isotropic) and one (anisotropic).
The directions of minimal curvature and the anisotropy computed from the 3D model represent theground-truth information, illustrated in Figure 2. To understand the ground-truth images, there are afew things worth mentioning: first, we can see that there are distinct lines of low-curvature anisotropy
ACM Transactions on Applied Perception, Vol. 3, No. 3, July 2006.

268 • U. Weidenbacher et al.
Fig. 3. View-centered coordinate sytem. The visible surface part of an object is described by its height, i.e., as a function
z = f (x, y), where z represents the depth and (x, y) are the coordinates in the image plane.
which belong to inflection points of curvature. Here, the surface curvature is equal in all directions,leading to no distortions of the reflected world on the surface. Note that as we cross these lines, theorientation of minimal surface curvature changes abruptly by 90◦. The reason for this effect is thatthe surface changes from a concave or convex to a saddle condition where one principal curvaturecomponent changes sign. Second, we can see singular points of low-curvature anisotropy, which belongto locally spherical patches (concave or convex) facing the viewer. These points are usually surroundedby a radial field of minimal curvature orientations. For more information about the surface geometrysee do Carmo [1976].
2.2 Evidence for Curvature Orientation in Image Space
When a scene is reflected in a curved mirror, the reflection is distorted in a way that depends sys-tematically on the 3D surface geometry [Beck and Prazdny 1981; Fleming et al. 2003; Fleming et al.2004; Hartung and Kersten 2003; Longuet-Higgins 1960]. Intuitively, highly curved surfaces “see” alarge angle of the surrounding scenery and thus compress many features into a small proportion ofthe image. By contrast, for slightly curved surfaces the compression is weaker (see Figure 4). Whenthe surface has different curvatures in different directions, the reflections will be differentially com-pressed in the two directions, leading to a locally affine distortion of the reflection. The strength of thedistortion depends on the ratio between minimal and maximal curvatures, which we call the surfaceanisotropy. For example, a spherical surface patch is curved equally in all directions (i.e., isotropic)and, thus, the surrounding scene is simply miniaturized in the reflection and is not subjected to anyanisotropic distortion. By contrast, a cylindrical surface patch is somewhat curved in one direction, butcompletely flat (i.e., curvature equals zero) in perpendicular direction. This leads to a strong distortionof the surrounding scene caused by a high anisotropy of curvature. In this case, the reflections tend to
ACM Transactions on Applied Perception, Vol. 3, No. 3, July 2006.

3D Shape Extraction and Depiction of Specular Surfaces • 269
Fig. 4. Image of a mirrored object. We can see that on areas with high-curvature anisotropy, such as the curvature ridge marked
in green, the surrounding scene is compressed into thin long streaks aligned along the direction of the ridge (which is the direction
of minimal curvature). Note that these areas turn out to be the locations where the local image statistics are invariant when
changing the surrounding scene. On other areas where the surface curvature is nearly isotropic (marked red), the reflected scene
shows much weaker compressions resulting in a flat mirrorlike reflection. Here, the local image statistics are very dependent on
the surrounding scene.
be distorted into parallel streaks that are aligned with the direction of minimum curvature3 (see alsoFigure 2). We can summarize that situation:
1. The orientation of structures in the mirrored scene tends to be aligned with the minimal-surfacecurvature.
2. The strength of the distortions in the mirrored scene indicates the ratio of minimum to maximumcurvature (anisotropy of curvature).
2.3 Biological Model for Extraction of Curvature Information
Our model receives as input a greyscale image of a specular object. The model is able to estimate theminimal curvature orientations and the anisotropy of curvature from the 2D input image. To measurethe success of this estimation, we can compare the results to the ground-truth information derived fromthe 3D model of the object. The model also produces a sketchlike representation of the input image. Ourproposed model consists of three main components: (1) extraction of oriented contrasts, (2) orientation-selective grouping, and (3) a recurrent feedback cycle. An overview of the model architecture is givenin Figure 5.
2.3.1 Basic Assumptions of the Model. Our model assumes that any anisotropy measured in theimage is due solely to distortions of the reflected scene caused by the geometry of the mirrored surface.This tacitly assumes that the texture of the environmental scene is isotropic (i.e., contains a uniformdistribution of orientations) [Fleming et al. 2004]. For many artificial and natural scenes, this is approx-imately true globally, although it is clearly infringed locally when the scene contains extended orientedstructures, such as trees or buildings. Despite this, the distortions introduced by surface anisotropy canbe very powerful, and—unlike naturally occurring oriented structures—affect all spatial scales equally.
3Note that the orientation of maximal curvature is always perpendicular to the orientation of minimal curvature as long as we
consider the view-centered curvature, depending on the second derivatives of the surface (Hessian matrix). As a consequence, it
is sufficient to recover the direction of minimal curvature.
ACM Transactions on Applied Perception, Vol. 3, No. 3, July 2006.

270 • U. Weidenbacher et al.
Fig. 5. Overview of the raw model architecture. Within the model we use multiple orientation layers to process each orientation
response separately.
Indeed, even environments with unnaturally anisotropic scene statistics can nevertheless yield orienta-tion fields that are predominantly biased in the correct directions, although this depends on the shapeproperties of the reflecting object. The effects of this “isotropy assumption” are discussed in greaterdetail in Section 4.
2.3.2 Extracting Oriented Contrasts Using a Population of Linear Gabor Filters. The initial stageof our model applies a family of orientation-selective Gabor filters [Daugman 1988] resembling theresponse properties of cortical simple cells [Hubel and Wiesel 1968]. The result is interpreted as apopulation code describing local contrast information. In our simulations, we employ 18 filters rotatedfrom 0 to 170◦ to extract local contrast information (Eq. 2).
Rφ = I ∗ Gφ (2)
where I is the input image of the mirrored object, Gφ is the oriented Gabor filter rotated by angleφ (see Figure 6), and ∗ is the convolution operator. In order to get a proper scaling of the computedresponses, we apply a normalization to the Gabor filter output (Eq. 3). Parameter μ affects the strengthof the normalization curve. To compensate for global contrast effects, μ is multiplied with the averagecontrast over all responses for a given orientation, where x and y are the dimensions of the image (seeEq. 4).
Sφ = Rφ
μkφ + Rφ
(3)
where
kφ =∑
Rφ
x · y(4)
In Figure 6, the population responses for two different locations in the input image are shown. Thefirst population response is extracted from a location in the image where the texture is strongly distortedin one direction, leading to strong responses in one preferred orientation. The other population responseis extracted from a location in the image where the texture is only weakly distorted. Here the populationresponses are nearly equally distributed over all orientations. Figure 6 illustrates how the directionis extracted from the orientation of the Gabor filter producing the maximum response at one specific
ACM Transactions on Applied Perception, Vol. 3, No. 3, July 2006.

3D Shape Extraction and Depiction of Specular Surfaces • 271
Fig. 6. Initial filter stage of the model (C). A family of orientation-selective Gabor filters is applied to the input image, followed
by a normalization step in order to get a proper scaling of the responses. The distribution of the filter responses is shown for
an anisotropic texture condition (A) and a nearly isotropic texture condition (B). Note that the filter, which yields maximal
response, determines the prevailing orientation of texture distortion. Note also that the more the distribution differs from an
equal distribution, the stronger the anisotropy of the texture.
location (Eq. 5).4
φmax = argmax(Sφ) (5)
We employ the ratio between minimal and maximal filter response to compute the anisotropy of thedistortion; specifically, we use the term in Eq. (6).
A = 1 − min(Sφ)
max(Sφ)(6)
which yields values between zero (isotropic) and one (anisotropic). Note that this data interpretationhas been adopted from Fleming et al. [2004].
2.3.3 Orientation-Selective Grouping. The second component of our model consists of orientation-selective grouping filters. The grouping filter is constructed of two displaced elongated Gaussian func-tions G←
σ1,σ2, G→
σ1,σ2(elongation ratio σ1 : σ2) that are combined in a multiplicative manner (Figure 7).
These filters are applied to locally enhance coherent filter responses and to enforce the initial estimatedanisotropy signal (Eqs.8–9). Note that the grouping filters are rotated in the appropriate direction φ
when they are applied for each orientation layer.
F ←φ = Sφ ∗ G←
σ1,σ2,φ (7)
F →φ = Sφ ∗ G→
σ1,σ2,φ (8)
Lφ = F ←φ · F →
φ (9)
4Note that in this case the texture distortion is always unimodal in the direction of minimal surface curvature. Moreover, our
filters are relatively small (just a few pixels per diameter) so that it is very unlikely that the distribution of orientation responses
has more than one peak. Thus, we assume that the argmax operation always yields a unique result.
ACM Transactions on Applied Perception, Vol. 3, No. 3, July 2006.

272 • U. Weidenbacher et al.
Fig. 7. Grouping stage of the model consisting of the actual grouping step and an additional normalization that is necessary
to achieve bounded output and to get a proper scaling of the filter responses (C). The grouping filter consists of two elongated
Gaussian kernels, which are combined by a multiplicative connection (A). (B) shows a comparison between filter responses in
case of an additive (dotted) and a multiplicative (solid) connection when the input is a short line segment. Note that an additive
connection would lead to smearing effect at line ends.
In particular, this kind of filter has the effect that collinear Gabor responses (from the initial stage) areenforced, while potentially erroneous responses typically occur without context and, thus, are weakenedby this operation. The multiplicative connection in Eq. (9) ensures that input from both sides of thecentre is needed to generate activation. Using an additive connection would lead to smearing effectsat line ends (see Figure 7). In other words, this stage produces strong responses if the underlyinginput signals a continuous orientation pattern. This is consistent with physiological findings aboutnonlinearities in the response of V2 contrast cells [von der Heydt et al. 1984].
Finally the grouping filter responses are passed through a second normalization step (Eq. 10) similarto the operation in Eq. (3). This operation is necessary to keep the filter responses bounded while strongfilter responses are enforced and weak filter responses are diminished.
Mφ = Lφ
1 + Lφ
(10)
2.3.4 Full Recurrent Model. So far we have described feedforward connections of the model. Now weuse the locally grouped information (Eq. 10) to iteratively refine the initial estimates (Eq. 3). This oper-ation can be realized by using the grouped filter responses as a recurrent feedback signal. Physiologicalevidence supports the view that top-down projections serve primarily as a modulation mechanism tocontrol the responsiveness of cells in the primary visual cortex [Bullier et al. 1988]. Accordingly, we usethe grouped Gabor responses (Mφ) as a feedback signal. Here, the feedback signal acts as a predictionof an error-free input pattern. The feedback modulation is realized by the following equation:
Snewφ = Sinit
φ · (1 + αMφ) (11)
where α is a parameter to adjust the influence of the feedback signal Mφ and Sinitφ is the initial signal
from Eq. (3). Note that Eq. (3) has to be replaced by Eq. (11) for the full recurrent model (see alsoFigure 8). The logic of the feedback modulation can be interpreted as follows:
ACM Transactions on Applied Perception, Vol. 3, No. 3, July 2006.

3D Shape Extraction and Depiction of Specular Surfaces • 273
Fig. 8. The full recurrent model in detail. The model receives a greyscale image of a specular object as input (1) First, a family of
orientation-selective Gabor filters is applied to the image (a) followed by a normalization step (b) to get a proper scaling. Second,
a grouping filter is applied for each orientation to enhance collinear features (c), followed by another normalization step (d). The
signal is then fed back to iteratively refine the initial Gabor responses. Model outputs are the orientation of minimal curvature
and the anisotropy of curvature (2). Furthermore, a sketch representation of the input image is extracted in (3).
The input signal is enhanced at locations where the initial signal matches the feedback signal. Thus,the feedback signal can be regarded as an expectation signal-biasing local input activations. In caseswhere feedback is zero, the “one” in Eq. (11) ensures that the initial signal remains unchanged. Iterativefeedback processing thus strengthens collinear features over time and helps to reduce the influence ofnoise and the prece of errors.
2.3.5 Output Signals. There are three output signals of the model. The first and second outputsignal of the model yield the estimated minimal surface curvature orientation5 (from Eq. 5) and theanisotropy signal (Eq. 6), respectively. Both output signals are illustrated in one single output image
5Recall that features on the mirrored surface are aligned with the direction of minimal surface curvature. Thus, the filter direction
with maximal response determines the minimal estimated curvature.
ACM Transactions on Applied Perception, Vol. 3, No. 3, July 2006.

274 • U. Weidenbacher et al.
where the orientations are color coded and the anisotropy is coded as the intensity of the colors (seeFigure 8, Part 2). The third output signal (Figure 8, Part 3) is an image of a nonphotorealistic sketch ofthe input image. The sketch ouput is computed by the difference between maximal and minimal activityof the filter responses (Eq. 12). Note that the sketch signal is similar to the anisotropy signal (Eq. 6).However, it is extracted after the grouping stage of the model and with a slightly different computationrule.
Asketch = max(Sφ) − min(Sφ) (12)
3. SIMULATIONS
In this section, we show the competencies of our proposed model for three different specular objects,depicted in Figure 9. In particular, we show the estimated minimal curvature directions in combina-tion with the anisotropy of curvature and a sketch representation of the object for a variety of modelparameters.
3.1 Model Input
As input, we use greyscale images of synthetically generated specular objects. All objects have asmoothly curved surface containing concavities and convexities, as well as self-occlusions. To give theobjects a specular surface, we used reflection maps from Debevec et al. [2000]. In Figure 9, the objectsare depicted in a mesh style (to give a clear impression of the shape) and with a perfectly specularsurface (used as model input). For computational simulations we utilize input images with a resolutionof 600 × 600 pixels. Figure 9 also shows a reflection map from Debevec et al. [2000], where the worldaround the mirrored objects is compressed into a 2D image.6
3.2 Evaluation of Principal Curvature Orientations and Anisotropy
In Figure 10 we show the orientation error depending on the actual level of curvature anisotropy. Theresults demonstrate that for isotropic curvature conditions the orientation error is significantly higherthan for the anisotropic curvature conditions. We further illustrate the initial estimates of curvaturedirections and surface anisotropy (without feedback and grouping) for different Gabor sizes in Figure 11.It is clearly visible that small Gabor filters, tuned to high frequency components lead to better resultsthan Gabor filters of larger scale. We also demonstrate qualitatively (Figure 11) and quantitatively(Figure 12b) that the orientation error increases as we enlarge the size of the Gabor filters. As aconsequence of this, we use small-sized Gabor filters (σ = 0.9) for all subsequent simulations.
In Figure 13, we show the curvature directions/anisotropy of curvature initially detected by the modeland after 10 time steps of grouping and feedback. The initial output qualitatively matches the groundtruth, except for some noise in areas where the surface curvature is isotropic. Figure 13, shows thatthe process of directional grouping and recurrent feedback removes noise in these areas and enhancesthe anisotropy signal. To corroborate this, in Figure 12a, we show quantitatively that the orientationerror decreases significantly over several steps of iterative feedback and converges after 10 iterations.
In Figure 14, we show the extracted sketch from the input image for different grouping filter ratios. Asthe elongation ratio of the Gabor filters (grouping stage) increases, more and more collinear features areenhanced and grouped together. By subsequently applying these grouping filters within the recurrentfeedback cycle, smoothly connected object structures, such as curvature ridge lines and self-occlusions,are enhanced and completed over time (principle of good continuation).
6Each pixel in the reflection map belongs to a specific direction in space. The spherical surrounding can be divided into degrees
of latitude and longitude where each pixel in the reflection map belongs to a specific coordinate in latitude/longitude space. In
other words, the reflection map is simply used as a look-up table in the rendering process.
ACM Transactions on Applied Perception, Vol. 3, No. 3, July 2006.

3D Shape Extraction and Depiction of Specular Surfaces • 275
Fig. 9. Three synthetically created specular input objects (d–f) and their corresponding 3D-models (a–c). The objects are mirrored
with the “Eucalyptus Grove” reflection map from Debevec et al. [2000] (g). Object (a) was inspired by [Todd 2004] and shows
a plane perturbed by a circular wave function. Object (b) shows a sphere, which was also squeezed and stretched to achieve a
smoothly varying curved surface. Object (c) was created by bending and squeezing an ellipsoid, which leads to a surface shape
where nearly all possible curvature conditions are visible.
Figure 15 shows that the quality of the sketch depends on the combination of the two parametersα and μ. The strength of the initial normalization step is controlled by parameter μ and the strengthof the feedback signal is controlled by parameter α. In Figures 16 and 17, we employed two differentobjects rendered under four different surrounding scenes as input for the model. Model simulationsshow that the extracted sketch images produced from a given shape under different environmentalscenes exhibit only marginal differences. Figure 16 therefore gives a very powerful impression that
ACM Transactions on Applied Perception, Vol. 3, No. 3, July 2006.

276 • U. Weidenbacher et al.
Fig. 10. The figure illustrates orientation error as a function of surface anisotropy. Left plot shows individual observations, where
each dot represents the measurement from a single pixel (several objects and environmental scenes were used). Right plot shows
box plots computed from (a), where we divided the anisotropy axis into 11 bins (box represents lower quartile, median and upper
quartile). For low-curvature anisotropies the distribution of orientation errors is spread from 0 to 90◦, while for high-curvature
anisotropies, the distribution is only spread between 0 and 25◦. Mean orientation error drops from 30◦ (isotropic condition) to
about 10◦ (anisotropic condition). Note that in both plots we use a logarithmic scale for the x axis. Note also that as we employ
only 18 different filter orientation in steps of 10◦, the resulting mean orientation error cannot be lower than 10◦.
Fig. 11. Initial detected minimal curvature orientation and anisotropy of curvature for different sizes of the initial Gabor filter
stage. In (a) we employed small Gabor filters (4 pixels /cycle), (b) shows results for medium sized Gabor filters (8 pixels/cycle), and
(c) shows results for large-sized Gabor filters (16 pixels/cycle). We can see clearly, that as the size of the Gabor filter increases,
we lose more and more detail information. For an explanation of the color code, see Figure 13.
the produced sketch is independent of the surrounding scene. Additional results are also shown inFigure 18.
To demonstrate the performance of the model with images of real-world objects, we have also producedsketches from photographs of a kettle and a tap (see Figure 19).
4. DISCUSSION AND CONCLUSION
We have shown that by making some simple measurements on the image of a mirrored object it ispossible to estimate surface-curvature properties accurately and reliably. We have shown that thesemeasurements can be performed by extracting and interpreting population codes using simple
ACM Transactions on Applied Perception, Vol. 3, No. 3, July 2006.

3D Shape Extraction and Depiction of Specular Surfaces • 277
Fig. 12. The graph in (a) shows the orientation error computed from one object/scene configuration over subsequent time steps
of the feedback cycle. We can see that the error is decreasing with each time step and nearly converging after 10 time steps to
a value of 5.6◦ . The graph in (b) shows the median orientation error across different Gabor sizes of the initial filter stage. We
can find a minimum error of 6.9◦ for a Gabor filter size of σ = 0.9. Increasing the size of the Gabor filters leads to a monotonic
increase of the orientation error. We can also observe that too small Gabor filters have a negative effect by producing slightly
higher error measures.
Fig. 13. The figure shows measures of the minimal curvature orientations and the anisotropy of curvature. Curvature orienta-
tions are coded in color, whereas the anisotropy is displayed as the intensity of the color (dark means isotropic curvature). The
ground-truth information (c) is compared to the initial detected curvature (a) (no grouping/feedback) and to the refined model
output (b) after 10 cycles of grouping and feedback. We can see that especially in areas where the ground-truth image shows
isotropic curvatures, the feedback helps to reduce orientation errors and to stress the anisotropy signal.
orientation-selective linear filters. We improved these initial measurements by collinear grouping of per-ceptually relevant features, which mainly occurs at locations where the surface anisotropy is high. Wehave shown that recurrent combination of contextual features substantially enhances the quality of theestimates. In addition, it is possible to extract a sketchlike representation from the input image, which isnearly invariant to the surrounding scene. The iterative grouping stage has the effect that isolated errorsand noise are reduced in the curvature estimates and that the extracted sketch becomes more distinct.
The model dynamics were developed in the context of contour perception by Neumann and Sepp[1999]. We bring together and further extend previous proposals on perceptual grouping of surfacefeatures [Grossberg and Mingolla 1985] with recent proposals of human shape perception of specular
ACM Transactions on Applied Perception, Vol. 3, No. 3, July 2006.

278 • U. Weidenbacher et al.
Fig. 14. Sketch output of the model for different grouping filter elongation ratios. We used elongated Gabor filters with a ratio
σ1 : σ2 = 2, 4, and 6 (filter shapes are illustrated scaled uniformly by a factor 3). We show the initial model output (without
feedback) (first row) and the output after 10 iterations (second row) for each filter configuration. A low elongation ratio (resulting
in a short-range grouping filter) produces a rather noisy initial output, whereas a medium or high filter ratio produces more
clear and smooth results. Note that even for short-range grouping filters the feedback helps to improve the signal by closing
discontinuities between collinear features.
Fig. 15. This figure shows sketch results after 10 iterations of feedback for different parameterizations of α and μ, where α
adjusts the influence of the feedback signal and μ, adjusts the strength of the initial normalization step. The figure illustrates
that both parameters have to be chosen carefully in order to receive good looking sketch results. In cases where α is very low, the
feedback signal has less influence. Thus, the resulting sketch shows insufficient detail. In cases where α (feedback contribution)
is high in combination with a low μ (normalization), this leads to an overemphasized sketch result. If not mentioned otherwise,
we used α = 100 and μ = 100 for model simulations.
ACM Transactions on Applied Perception, Vol. 3, No. 3, July 2006.

3D Shape Extraction and Depiction of Specular Surfaces • 279
Fig. 16. Input images rendered with four different environmental scenes (first row). The specular objects are rendered with
the “Eucalyptus Grove” scene (a), “St Peters Basilica” (b), “Galileo’s Tomb” (c), and the “Overcast Breezeway” (d). The reflection
maps are taken from Debevec et al. [2000]. For each different scene, we show the sketch output of the model after 10 cycles of
feedback (second row). We can see that although the input images look quite different, the sketch output looks very similar in
all four cases.
Fig. 17. We show another mirrored object rendered under four different environmental scenes: (a) “Eucalyptus Grove,” (b) “St
Peters Basilica,” (c) “Galileo’s Tomb,” and (d) “Overcast Breezeway.” Model parameters are the same as used in Figure 16. The
figure illustrates that the resulting sketches look very similar, even though environmental scenes do not perfectly obey the
assumption of isotropic scene statistics.
surfaces [Fleming et al. 2004]. Our model employs simple biologically motivated mechanisms as it iswell known that primary visual cortex contains cells that are tuned to different image orientations[Hubel and Wiesel 1968].
It is important to note that our model output can only provide constraints on 3D shape, rather than acomplete estimate of the shape model. Orientation fields are inherently ambiguous. For example, convex
ACM Transactions on Applied Perception, Vol. 3, No. 3, July 2006.

280 • U. Weidenbacher et al.
Fig. 18. Model output for two different objects (rendered with the “Eucalyptus Grove” scene and parameters (α = 10, μ = 10)).
We show the estimated minimal curvature orientations in combination with the anisotropy of curvature after 10 iterations of
feedback (c + d) in comparison to the ground-truth image images (a + b). We also show the sketch computed from each object
(e + f).
and concave surface patches cannot be distinguished locally. However, human vision almost certainlyapplies additional constraints to resolve these ambiguities, e.g., by enforcing boundary conditions basedon occluding contours [Koenderink 1984], or by enforcing global constraints, such as smoothness.
Our model naturally extracts object structures, such as smooth occlusion contours and curvatureridge lines. These features have been described by Todd [2004] as typical features of line drawingshowing 3D objects. Indeed, the fact that image orientations tend to align with these shape featuresmay provide an explanation of why artists choose to depict these features, in particular. Our simulationsalso demonstrate that the model sketch can be used as an abstract representation of the 3D object,invariant to the reflected scene (Figure 16). The sketch tends to emphasize regions of high-curvature.Previous work on the perception of 2D shape, has suggested that high-curvature regions are the mostinformative locations on a 2D curve [Attneave 1954; Feldman and Singh 2005].
Previous work on 3D shape visualization has suggested the utility of aligning texture with the intrin-sic principal directions of the surface [Interrante and Kim 2001; Interrante et al. 2002; Kim et al. 2003].Here, we suggest that the principal directions defined in view-centered coordinates may also be usefulfor conveying surface shape. Note that areas of high curvature tend to bear patterns of high spatialfrequency, because this is where the reflection is most compressed. By emphasizing fine structures, theextracted sketch also looks subjectively like a charcoal drawing.
4.1 Limitations of the Model
Although our model behaves well for most objects and surrounding scenes, there are, of course, somespecial cases where the model fails to provide accurate estimates. As mentioned earlier, our model
ACM Transactions on Applied Perception, Vol. 3, No. 3, July 2006.
3D Shape Extraction and Depiction of Specular Surfaces • 281
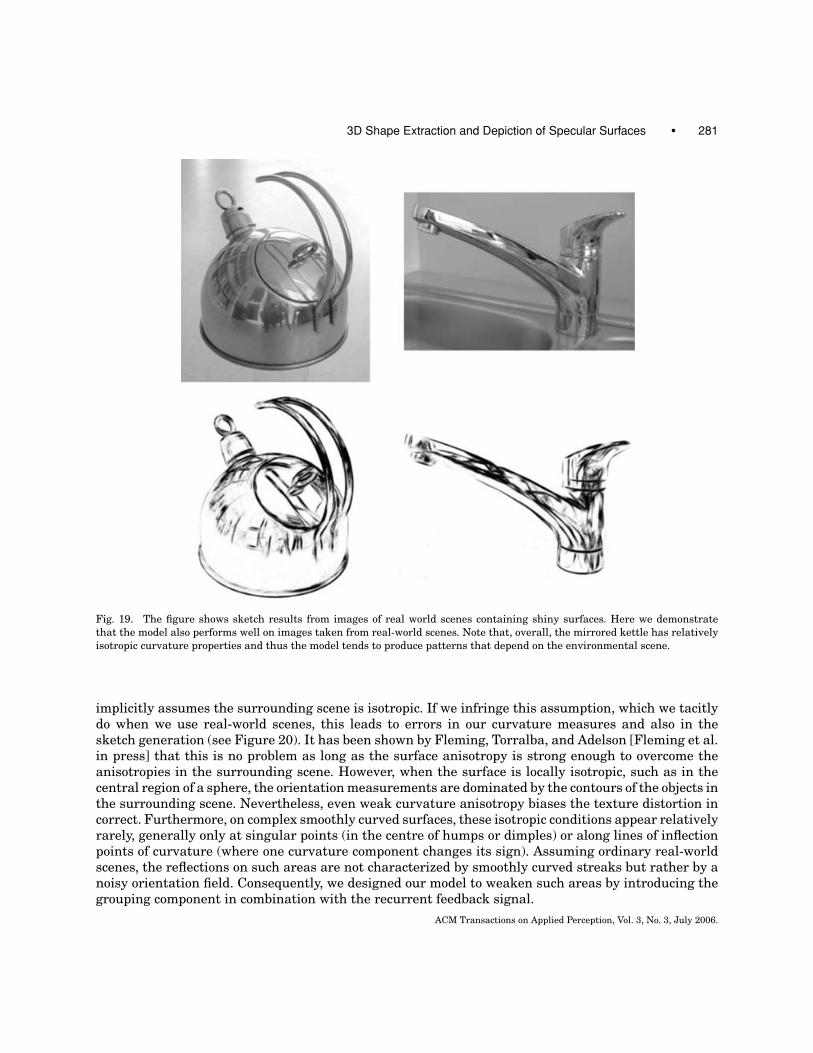
Fig. 19. The figure shows sketch results from images of real world scenes containing shiny surfaces. Here we demonstrate
that the model also performs well on images taken from real-world scenes. Note that, overall, the mirrored kettle has relatively
isotropic curvature properties and thus the model tends to produce patterns that depend on the environmental scene.
implicitly assumes the surrounding scene is isotropic. If we infringe this assumption, which we tacitlydo when we use real-world scenes, this leads to errors in our curvature measures and also in thesketch generation (see Figure 20). It has been shown by Fleming, Torralba, and Adelson [Fleming et al.in press] that this is no problem as long as the surface anisotropy is strong enough to overcome theanisotropies in the surrounding scene. However, when the surface is locally isotropic, such as in thecentral region of a sphere, the orientation measurements are dominated by the contours of the objects inthe surrounding scene. Nevertheless, even weak curvature anisotropy biases the texture distortion incorrect. Furthermore, on complex smoothly curved surfaces, these isotropic conditions appear relativelyrarely, generally only at singular points (in the centre of humps or dimples) or along lines of inflectionpoints of curvature (where one curvature component changes its sign). Assuming ordinary real-worldscenes, the reflections on such areas are not characterized by smoothly curved streaks but rather by anoisy orientation field. Consequently, we designed our model to weaken such areas by introducing thegrouping component in combination with the recurrent feedback signal.
ACM Transactions on Applied Perception, Vol. 3, No. 3, July 2006.
282 • U. Weidenbacher et al.
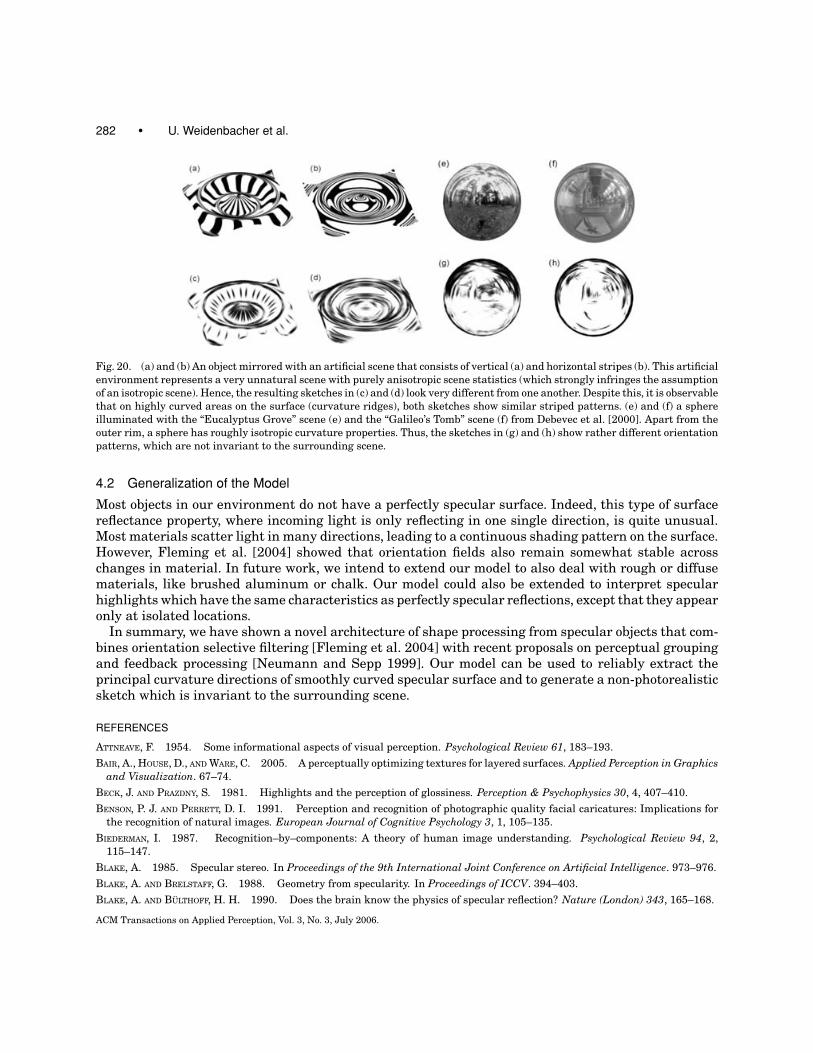
Fig. 20. (a) and (b) An object mirrored with an artificial scene that consists of vertical (a) and horizontal stripes (b). This artificial
environment represents a very unnatural scene with purely anisotropic scene statistics (which strongly infringes the assumption
of an isotropic scene). Hence, the resulting sketches in (c) and (d) look very different from one another. Despite this, it is observable
that on highly curved areas on the surface (curvature ridges), both sketches show similar striped patterns. (e) and (f) a sphere
illuminated with the “Eucalyptus Grove” scene (e) and the “Galileo’s Tomb” scene (f) from Debevec et al. [2000]. Apart from the
outer rim, a sphere has roughly isotropic curvature properties. Thus, the sketches in (g) and (h) show rather different orientation
patterns, which are not invariant to the surrounding scene.
4.2 Generalization of the Model
Most objects in our environment do not have a perfectly specular surface. Indeed, this type of surfacereflectance property, where incoming light is only reflecting in one single direction, is quite unusual.Most materials scatter light in many directions, leading to a continuous shading pattern on the surface.However, Fleming et al. [2004] showed that orientation fields also remain somewhat stable acrosschanges in material. In future work, we intend to extend our model to also deal with rough or diffusematerials, like brushed aluminum or chalk. Our model could also be extended to interpret specularhighlights which have the same characteristics as perfectly specular reflections, except that they appearonly at isolated locations.
In summary, we have shown a novel architecture of shape processing from specular objects that com-bines orientation selective filtering [Fleming et al. 2004] with recent proposals on perceptual groupingand feedback processing [Neumann and Sepp 1999]. Our model can be used to reliably extract theprincipal curvature directions of smoothly curved specular surface and to generate a non-photorealisticsketch which is invariant to the surrounding scene.
REFERENCES
ATTNEAVE, F. 1954. Some informational aspects of visual perception. Psychological Review 61, 183–193.
BAIR, A., HOUSE, D., AND WARE, C. 2005. A perceptually optimizing textures for layered surfaces. Applied Perception in Graphicsand Visualization. 67–74.
BECK, J. AND PRAZDNY, S. 1981. Highlights and the perception of glossiness. Perception & Psychophysics 30, 4, 407–410.
BENSON, P. J. AND PERRETT, D. I. 1991. Perception and recognition of photographic quality facial caricatures: Implications for
the recognition of natural images. European Journal of Cognitive Psychology 3, 1, 105–135.
BIEDERMAN, I. 1987. Recognition–by–components: A theory of human image understanding. Psychological Review 94, 2,
115–147.
BLAKE, A. 1985. Specular stereo. In Proceedings of the 9th International Joint Conference on Artificial Intelligence. 973–976.
BLAKE, A. AND BRELSTAFF, G. 1988. Geometry from specularity. In Proceedings of ICCV. 394–403.
BLAKE, A. AND BULTHOFF, H. H. 1990. Does the brain know the physics of specular reflection? Nature (London) 343, 165–168.
ACM Transactions on Applied Perception, Vol. 3, No. 3, July 2006.

3D Shape Extraction and Depiction of Specular Surfaces • 283
BLAKE, A. AND BULTHOFF, H. H. 1991. Shape from specularities: Computation and psychophysics. Philosophical Transactionsof the Royal Society of London B 331, 237–252.
BRUCKSTEIN, A. M. 1988. On shape from shading. Comput. Vision Graph. Image Process. 44, 2, 139–154.
BULLIER, J. H., MCCOURT, M. E., AND HENRY., G. H. 1988. Physiological studies of the feedback connection to the striate cortex
from areas 18 and 19 of the cat. Exp. Brain Res. 70, 90–98.
CABRAL, B. AND LEEDOM, L. C. 1993. Image vector fields using line integral convolution. In SIGGRAPH. 263–270.
CHEN, H., LIU, Z., C.ROSE, XU, Y., SHUM, H., AND SALESIN, D. 2004. Example-based composite sketching of human portraits. In
Proc. 3rd International Symposium on Non-Photorealistic Animation and Rendering.
COLLOMOSSE, J. P. AND HALL, P. M. 2003. Cubist style rendering from photographs. IEEE Transactions on Visualization andComputer Graphics 9, 4, 443–453.
CURTIS, C. J., ANDERSON, S. E., SEIMS, J. E., FLEISCHER, K. W., AND SALESIN, D. H. 1997. Computer-generated watercolor. In
SIGGRAPH ’97: Proceedings of the 24th Annual Conference on Computer Graphics and Interactive Techniques. ACM
Press/Addison-Wesley Publishing, New York. 421–430.
DAUGMAN, J. 1988. Complete discrete 2d gabor transforms by neural networks for image analysis and compression. Trans.Acoustics, Speech, and Signal Proc. 36, 7, 1169–1179.
DEBEVEC, P. E., HAWKINS, T., TCHOU, C., DUIKER, H. P., SAROKIN, W., AND SAGAR, M. 2000. Acquiring the reflectance field of a
human face. Computer Graphics (SIGGRAPH).DECARLO, D. AND SANTELLA, A. 2002. Stylization and abstraction of photographs. ACM Trans. Graph. 21, 3, 769–776.
DEUSSEN, O. AND STROTHOTTE, T. 2000. Computer-generated pen-and-ink illustration of trees. In SIGGRAPH. 13–18.
DO CARMO, M. P. 1976. Differential Geometry of Curves and Surfaces. Prentice Hall, Englewood Cliffs, NJ.
DURAND, F., OSTROMOUKHOV, V., MATHIEU MILLER, F. D., AND DORSEY, J. 2001. Decoupling strokes and high-level attributes for
interactive traditional drawing. In Proceedings of the 12th Eurographics Workshop on Rendering.
DWYER, F. M. J. 1967. Adapting visual illustrations for effective learning. Harvard Educational Review 37, 250–263.
FELDMAN, J. AND SINGH, M. 2005. Information along contours and object boundaries. Psychological Review 112, 243–252.
FLEMING, R., TORRALBA, A., AND ADELSON, E. Three Dimensional Shape Perception (in press). Springer, Chapter Shape From
Sheen.
FLEMING, R., TORRALBA, A., DROR, R. O., AND ADELSON, E. H. 2003. How image statistics drive shape-from-texture and shape-
from-specularity. J. Vision 3, 9, 73–73.
FLEMING, R. W., TORRALBA, A., AND ADELSON, E. H. 2004. Specular reflections and the perception of shape. J. Vision 4, 9, 798–820.
FRAISSE, P. AND ELKIN, E. H. 1963. Etude genetique de l’influence des modes de presentation sur le seuil de reconnaissance
d’objets familiers. Annee Psychologique 63, 1–12.
GOOCH, A., GOOCH, B., SHIRLEY, P., AND COHEN, E. 1998. A nonphotorealistic lighting model for automatic technical illustration.
SIGGRAPH. 447–452.
GOOCH, B., REINHARD, E., AND GOOCH, A. 2004. Human facial illustrations: Creation and psychophysical evaluation. ACMTransactions on Graphics 23, 1, 27–44.
GROSSBERG, S. AND MINGOLLA, E. 1985. Neural dynamics of form perception: Boundary completion, illusory figures and neon
color spreading. Psych. Rev. 92, 2, 173–211.
HADAMARD, J. 1902. Sur les problemes aux derivees partielles et leur signification physique. Princeton University Bulletin,
49–52.
HARTUNG, B. AND KERSTEN, D. 2003. How does the perception of shape interact with the perception of shiny material? J. Vis. 3, 9
(10), 59–59.
HAUSNER, A. 2001. Simulating decorative mosaics. In SIGGRAPH. 573–580.
HAYS, J. AND ESSA, I. 2004. Image and video based painterly animation. In NPAR ’04: Proceedings of the 3rd InternationalSymposium on Non-Photorealistic Animation and Rendering. ACM Press, New York. 113–120.
HERTZMANN, A. 1998. Painterly rendering with curved brush strokes of multiple sizes. In SIGGRAPH. 453–460.
HORN, B. AND BROOKS, M. 1985. Shape and source from shading. In Proceedings of International Joint Conference on ArtificialIntelligence. 932–936.
HORN, B. AND BROOKS, M. 1989. Shape from Shading. Book, MIT Press, Cambridge, MA.
HUBEL, D. H. AND WIESEL, T. N. 1968. Receptive fields and functional architecture of monkey striate cortex. J. Physiology(London) 195, 215–243.
IKEUCHI, K. 1981. Recognition of 3-d objects using the extended gaussian image. In Proc. of the 7th International JointConference on Artificial Intelligence. 595–600.
ACM Transactions on Applied Perception, Vol. 3, No. 3, July 2006.

284 • U. Weidenbacher et al.
INTERRANTE, V. AND KIM, S. 2001. Investigating the effect of texture orientation on shape perception. Proc. Human Vision andElectronic Imaging 6, 330–339.
INTERRANTE, V., KIM, S., AND HAGH-SHENAS, H. 2002. Conveying 3d shape with texture: Recent advances and experimental
findings. Proc. Human Vision and Electronic Imaging 7, 197–206.
JIN, W., HUJUN, B., WEIHUA, Z., QUNSHENG, P., AND YINGQING, X. 2002. Automatic image-based pencil sketch rendering. J. Comput.Sci. Technol. 17, 3, 347–355.
KANG, H., HE, W., CHUI, C., AND CHAKRABORTY, U. 2005. Interactive sketch generation. The Visual Computer 21, 9, 821–830.
KIM, S., HAGH-SHENAS, H., AND INTERRANTE, V. 2003. Showing shape with texture: Two directions seem better than one. In Proc.Human Vision and Electronic Imaging 8, 332–339.
KOENDERINK, J. AND VAN DOORN, A. 1980. Photometric invariants related to solid shape. Optica Acta 27, 7, 981–996.
KOENDERINK, J. J. 1984. What does the occluding contour tell us about solid shape. Perc. 13, 312–330.
LITWINOWICZ, P. 1997. Processing images and video for an impressionist effect. In SIGGRAPH ’97: Proceedings of the 24thAnnual Conference on Computer Graphics and Interactive Techniques. ACM Press/Addison-Wesley Publishing, New York.
407–414.
LONGUET-HIGGINS, M. S. 1960. Reflection and refraction at a random moving surface. i. pattern and paths of specular points.
Journal of the Optical Society of America 50, 9, 838–844.
NEUMANN, H. AND SEPP, W. 1999. Recurrent v1-v2 interactions in early boundary processing. Biol. Cybern. 81, 425–444.
NORMAN, J. F., TODD, J. T., AND ORBAN, G. A. 2004. Perception of three-dimensional shape from specular highlights, deformations
of shading, and other types of visual information. Psychological Science 15, 565–570.
OREN, M. AND NAYAR, S. 1996. A theory of specular surface geometry. Int. J. Computer Vision 24, 105–124.
RHODES, G., BRENNAN, S., AND CAREY, S. 1987. Identification and ratings of caricatures: Implications for mental representations
of faces. Cognitive Psychology 19, 473–497.
RYAN, T. AND SCHWARTZ, C. 1956. Speed of perception as a function of mode of presentation. American Journal of Psychology 69,
60–69.
SAMARAS, D. AND METAXAS, D. 1999. Coupled lighting direction and shape estimation from single images. In ICCV ’99: Proceed-ings of the International Conference on Computer Vision-Volume 2. IEEE Computer Society, Washington, DC. 868.
SANDERSON, A. S., WEISS, L. E., AND NAYAR, S. K. 1988. Structured highlight inspection of specular surfaces. IEEE Trans. PatternAnal. Mach. Intell. 10, 1, 44–55.
SAVARESE, S., FEI-FEI, L., AND PERONA, P. 2004. What do reflections tell us about the shape of a mirror? In Proc. Appl. Perc. inGraph. and Visual. 1, 115–118.
SAVARESE, S. AND PERONA, P. 2001. Local analysis for 3d reconstruction of specular surfaces. In Proc. of IEEE Computer SocietyConference on Computer Vision and Pattern Recognition. 738–745.
SAVARESE, S. AND PERONA, P. 2002. Local analysis for 3d reconstruction of specular surfaces—part ii. In Proc. 7th EuropeanConference on Computer Vision. 759–774.
SHIRAISHI, M. AND YAMAGUCHI, Y. 2000. An algorithm for automatic painterly rendering based on local source image approxi-
mation. In NPAR ’00: Proceedings of the 1st International Symposium on Non-Photorealistic Animation and Rendering. ACM
Press, New York. 53–58.
STALLING, D. AND HEGE, H.-C. 1995. Fast and resolution independent line integral convolution. In SIGGRAPH. 249–256.
TINBERGEN, N. 1951. The Study of Instinct. Clarendon, Oxford.
TINBERGEN, N. AND PERDECK, A. C. 1950. On the stimulus situation releasing the begging response in the newly hatched herring
gull chick (larus argentatus argentatus pont). Behaviour 3, 1–39.
TODD, J. AND MINGOLLA, E. 1983. Perception of surface curvature and direction of illumination from patterns of shading. Journalof Experimental Psychology: Human Perception and Performance 10, 740–745.
TODD, J., NORMAN, J., KOENDERINK, J., AND KAPPERS, A. M. L. 1997. Effects of texture, illumination and surface reflectance on
stereoscopic shape perception. Perception 26, 806–822.
TODD, J. T. 2004. The visual perception of 3d shape. Trends in Cognitive Sciences 9, 3, 115–121.
TODD, J. T., NORMAN, J. F., AND MINGOLLA, E. 2004. Lightness constancy in the presence of specular highlights. PsychologicalScience 15, 1, 33–39.
VON DER HEYDT, R., PETERHANS, E., AND BAUMGARTNER, G. 1984. Illusory contours and cortical neuron responses. Science 224,
1260–1262.
YAMAMOTO, S., MAO, X., TANII, K., AND IMAMIYA, A. 2004. Enhanced lic pencil filter. Proceedings of International Conference onComputer Graphics, Imaging and Visualization. 251–256.
ACM Transactions on Applied Perception, Vol. 3, No. 3, July 2006.

3D Shape Extraction and Depiction of Specular Surfaces • 285
ZHANG, R., TSAI, P.-S., CRYER, J. E., AND SHAH, M. 1999. Shape from shading: A survey. IEEE Trans. Pattern Anal. Mach.Intell. 21, 8, 690–706.
ZHENG, J. Y. AND MURATA, A. 2000. Acquiring a complete 3d model from specular motion under the illumination of circular-
shaped light sources. IEEE Trans. Pattern Anal. Mach. Intell. 22, 8, 913–920.
ZHENG, Q. AND CHELLAPA., R. 1991. Estimation of illuminant direction, albedo, and shape from shading. IEEE Transactions onPattern Analysis and Machine Intelligence. 13, 7, 680–702.
ZISSERMAN, A., GIBLIN, P. J., AND BLAKE, A. 1989. The information available to a moving observer from specularities. ImageVision Comput. 7, 1, 38–42.
Received December 2005; revised March 2006; accepted July 2006
ACM Transactions on Applied Perception, Vol. 3, No. 3, July 2006.