sketching the graphs of rational equations. consider the equation below: solve for the...
TRANSCRIPT

Sketching the Graphs of Rational Equations
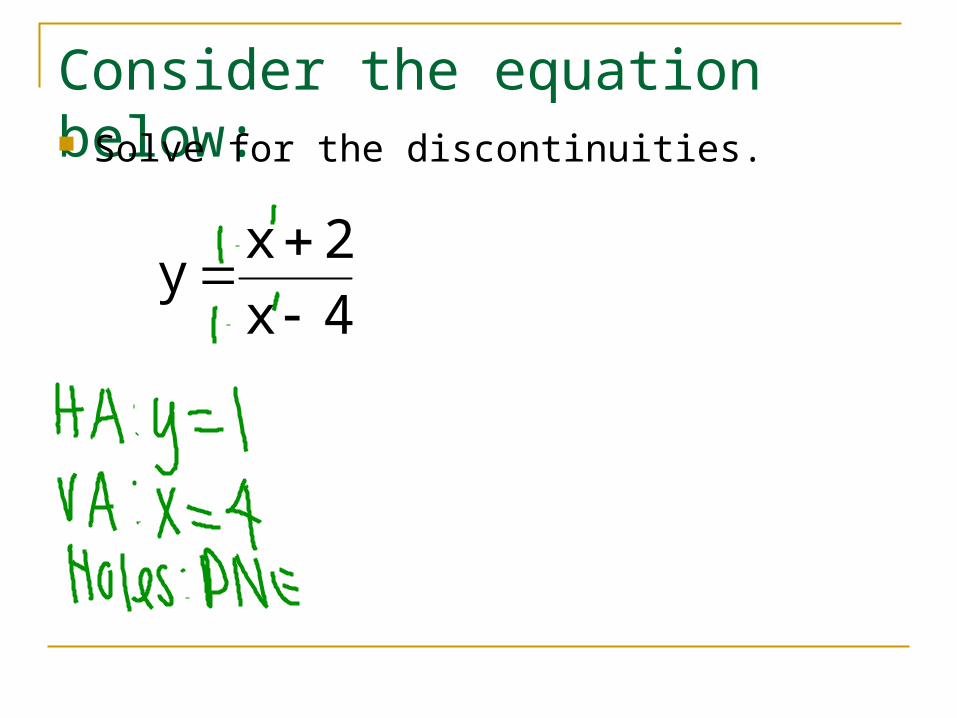
Consider the equation below: Solve for the discontinuities.
4x
2xy
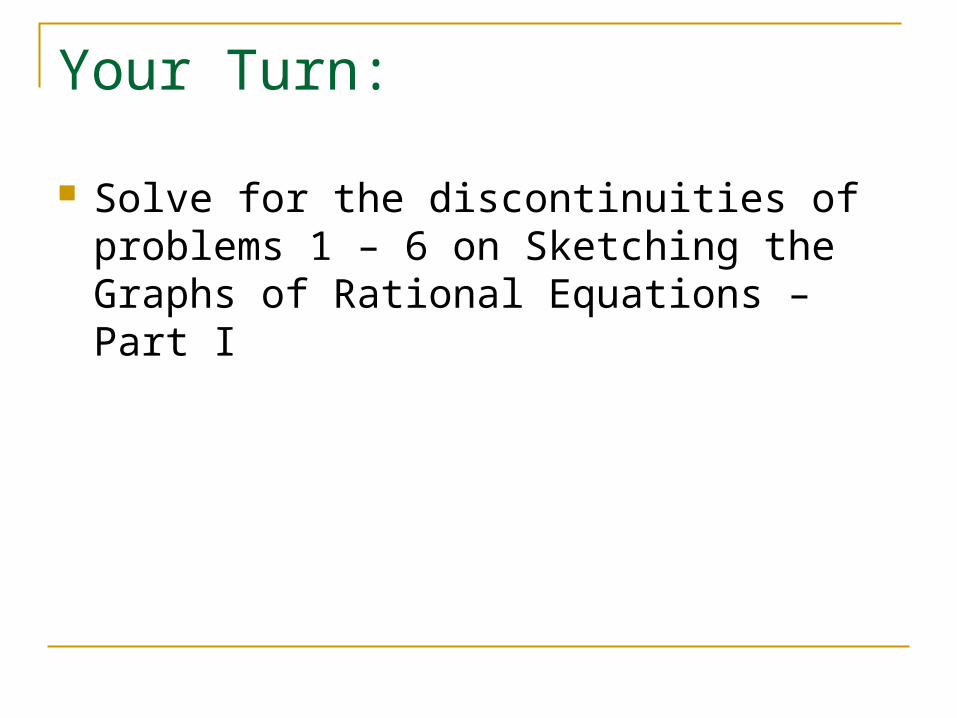
Your Turn:
Solve for the discontinuities of problems 1 – 6 on Sketching the Graphs of Rational Equations – Part I
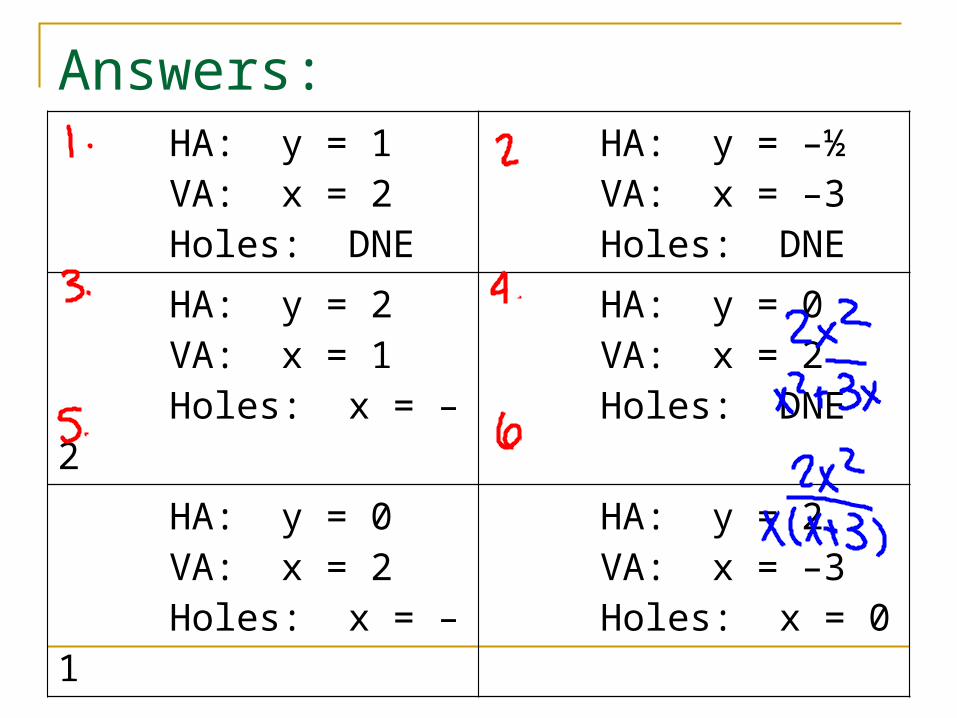
Answers: HA: y = 1 VA: x = 2 Holes: DNE
HA: y = –½ VA: x = –3 Holes: DNE
HA: y = 2 VA: x = 1 Holes: x = –2
HA: y = 0 VA: x = 2 Holes: DNE
HA: y = 0 VA: x = 2 Holes: x = –1
HA: y = 2 VA: x = –3 Holes: x = 0
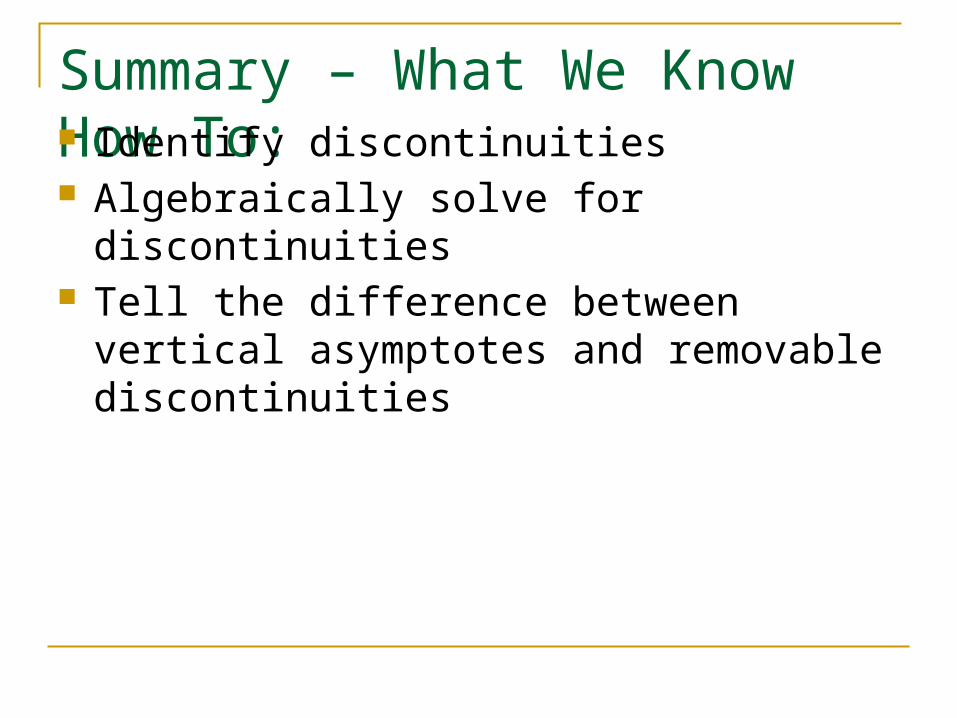
Summary – What We Know How To: Identify discontinuities Algebraically solve for discontinuities Tell the difference between vertical
asymptotes and removable discontinuities
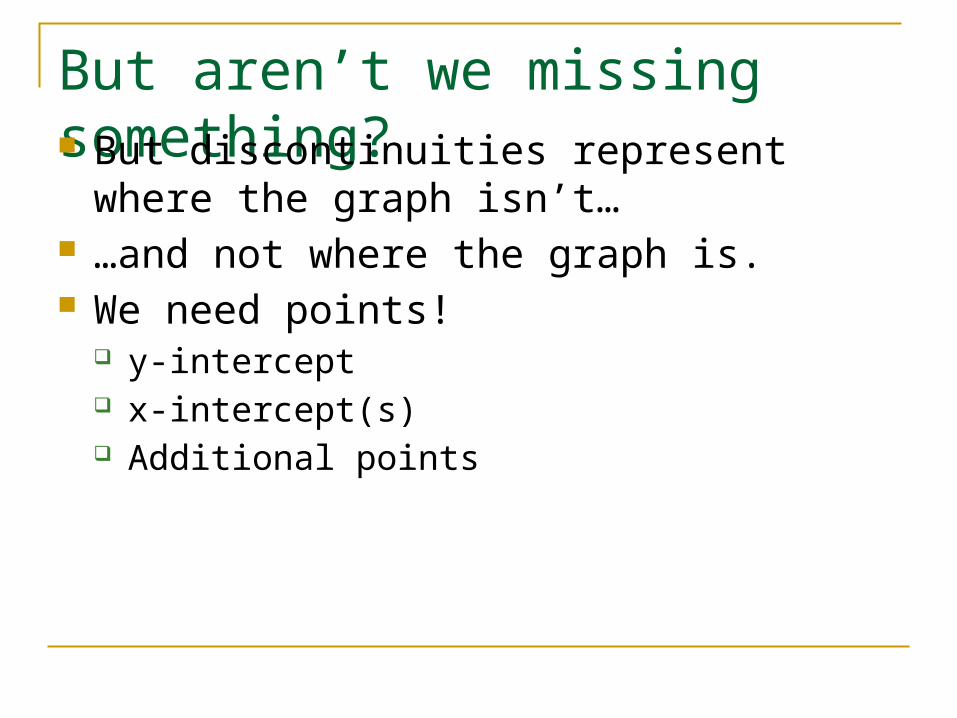
But aren’t we missing something? But discontinuities represent where the graph
isn’t… …and not where the graph is. We need points!
y-intercept x-intercept(s) Additional points
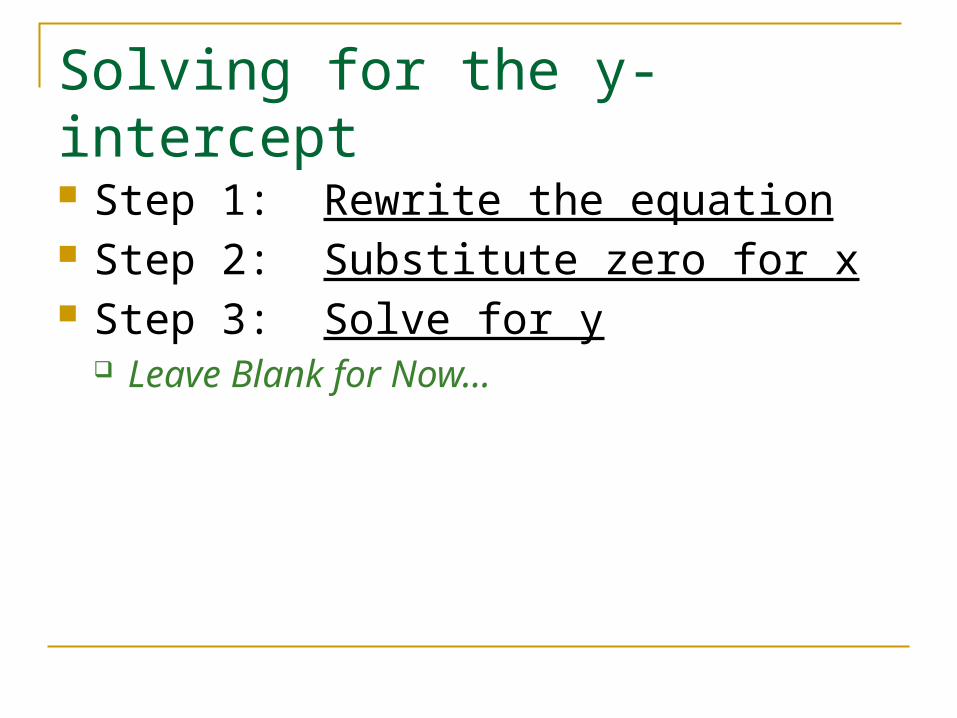
Solving for the y-intercept
Step 1: Rewrite the equation Step 2: Substitute zero for x Step 3: Solve for y
Leave Blank for Now…
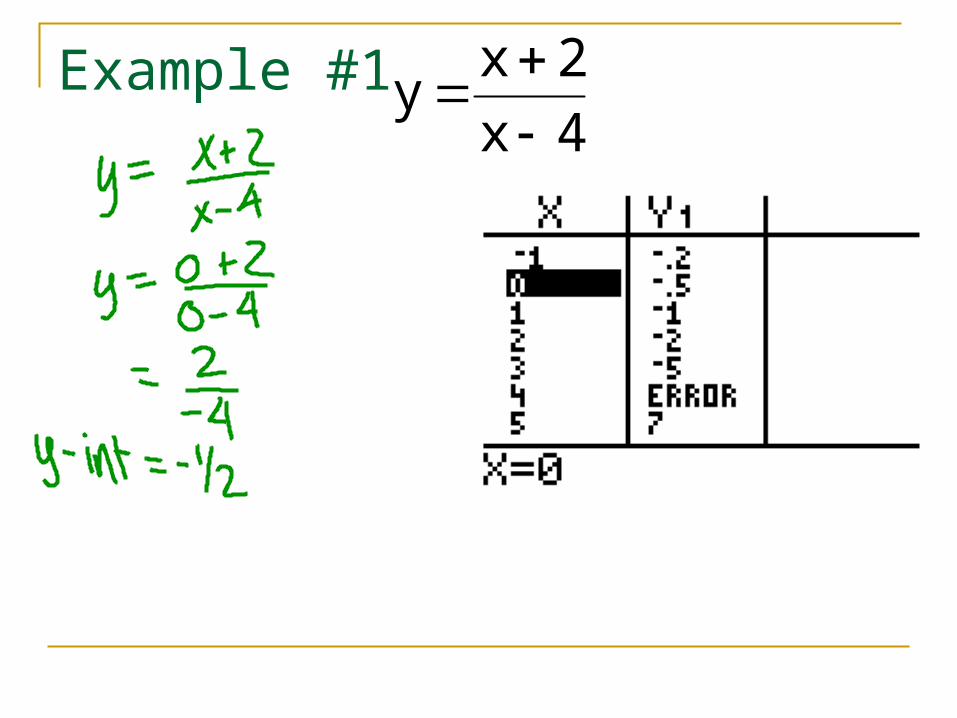
Example #14x
2xy
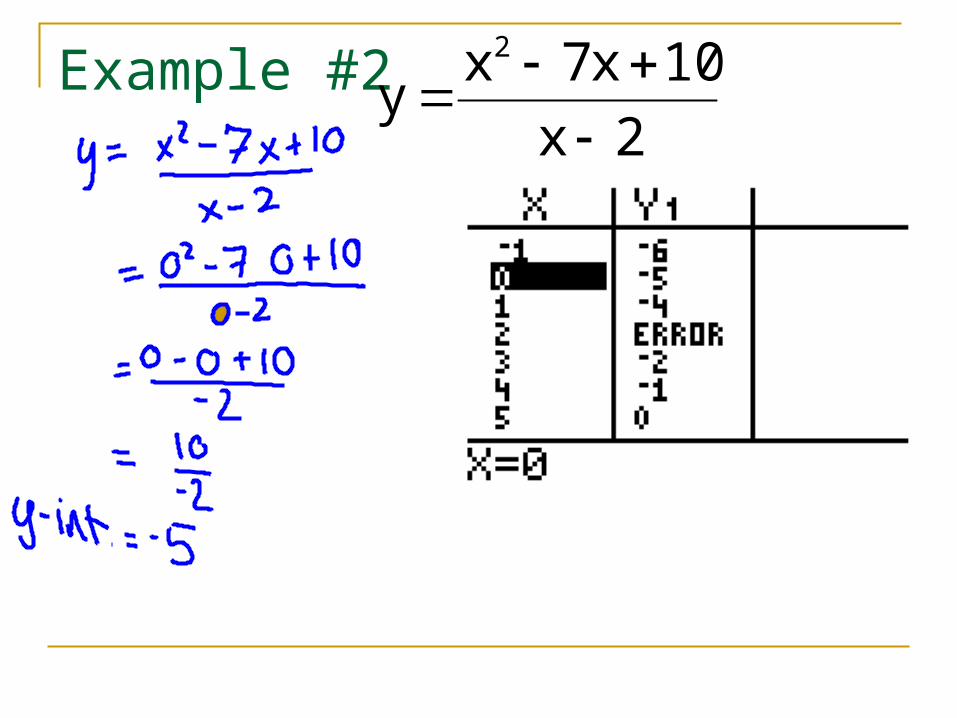
Example #22x
10x7xy
2

Your Turn:
For problems 1 – 6, solve for the y-intercept. Check your answers in your graphing calculator!!!
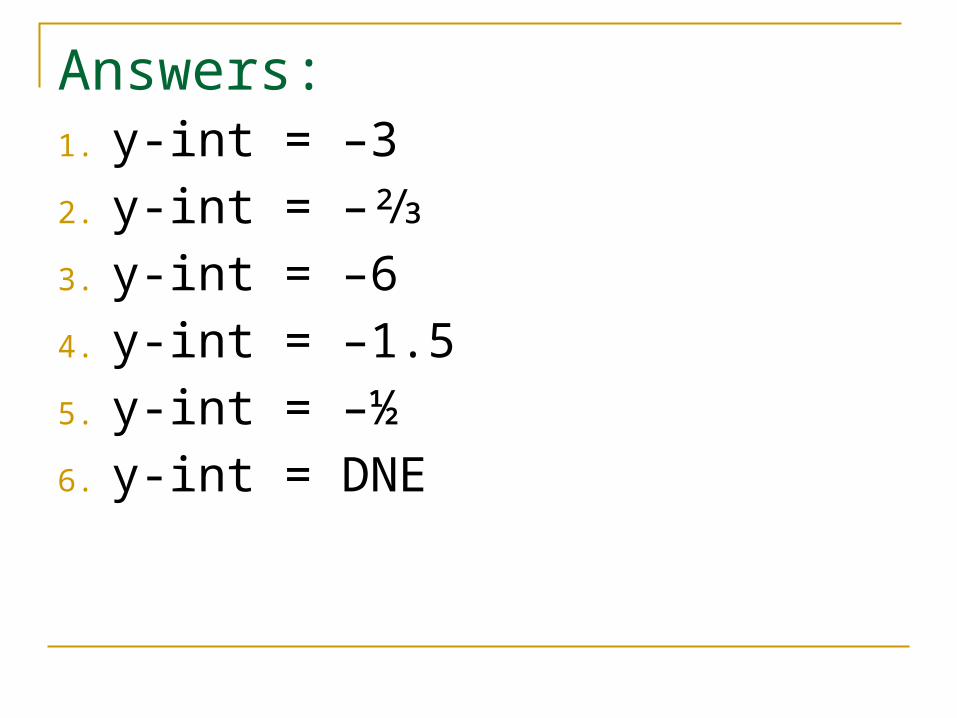
Answers:1. y-int = –3
2. y-int = –⅔
3. y-int = –6
4. y-int = –1.5
5. y-int = –½
6. y-int = DNE
HA: y = 2VA: x = –3Holes: x = 0
x3x
x2y
2
2
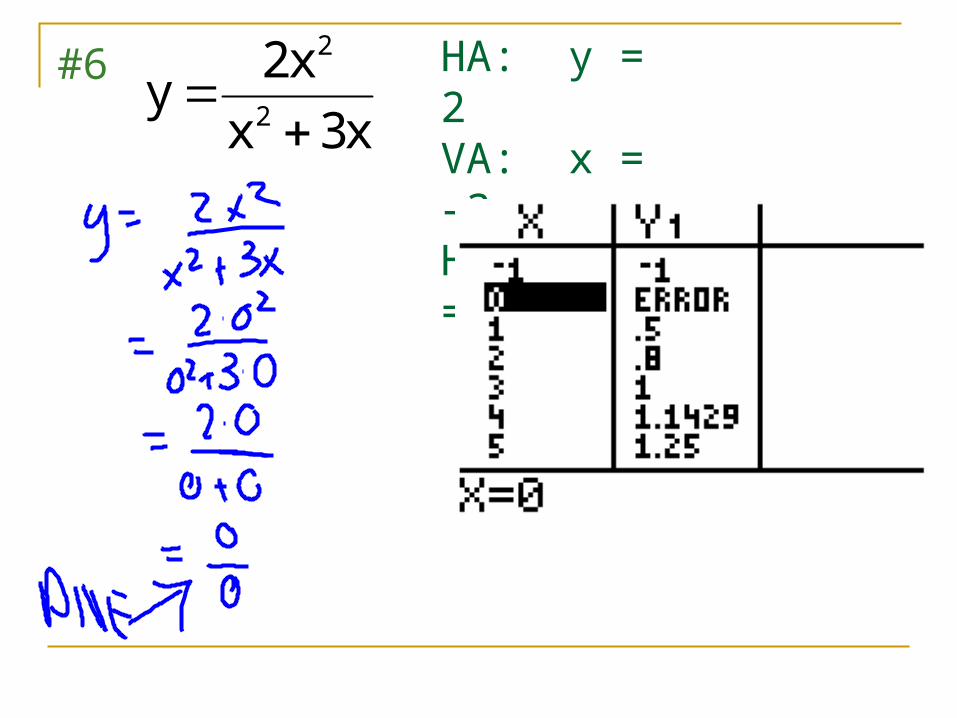
#6
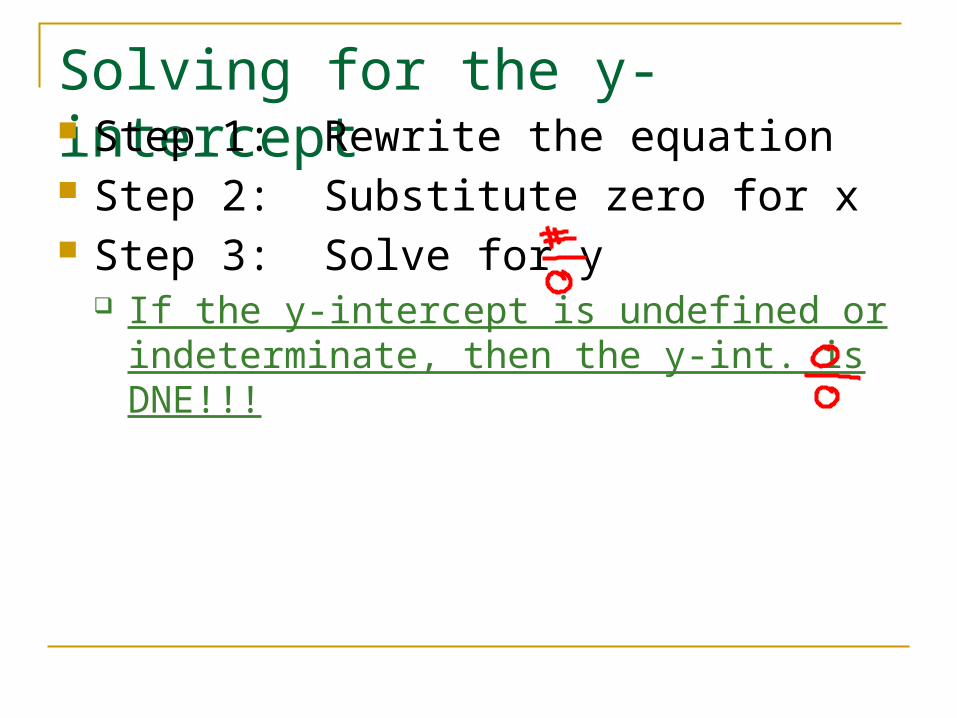
Solving for the y-intercept Step 1: Rewrite the equation Step 2: Substitute zero for x Step 3: Solve for y
If the y-intercept is undefined or indeterminate, then the y-int. is DNE!!!
HA: y = 0VA: x = 0Holes: DNE
2x
2xy
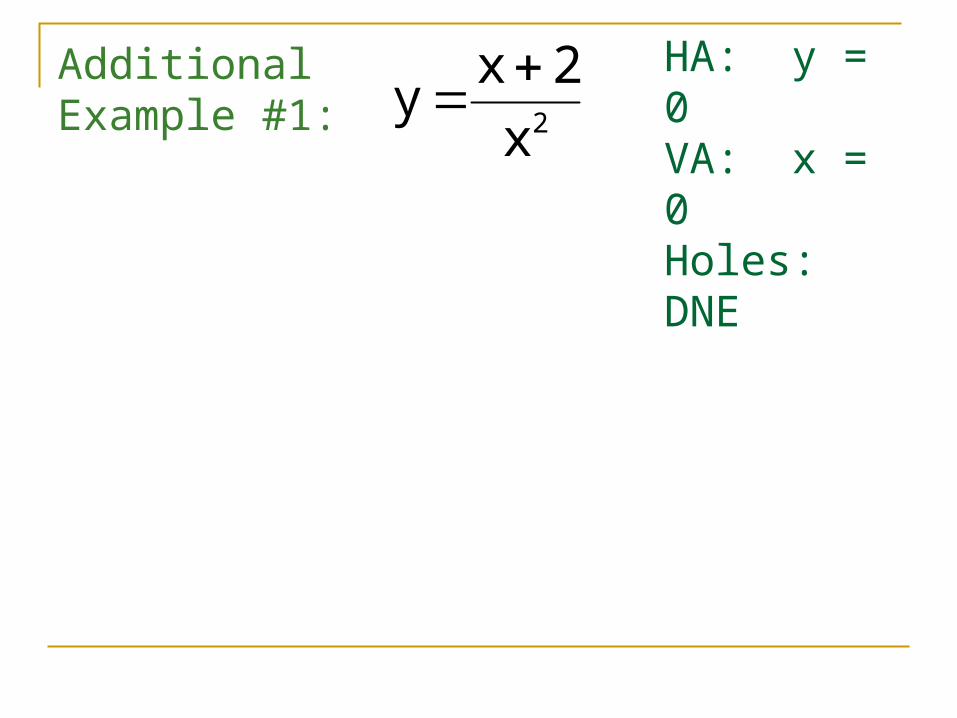
AdditionalExample #1:
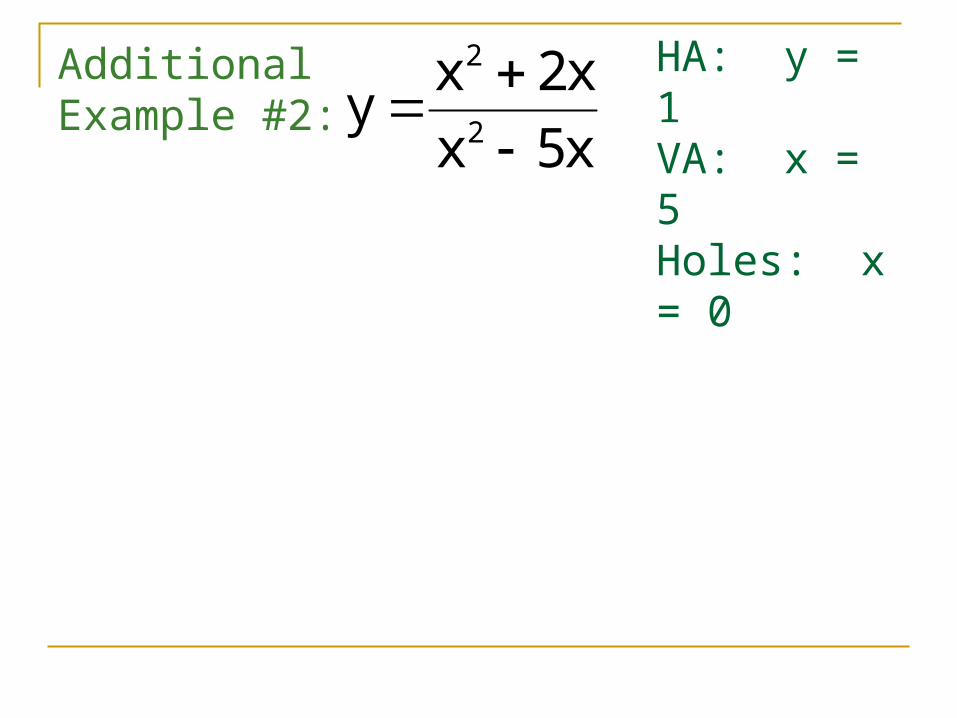
HA: y = 1VA: x = 5Holes: x = 0
x5x
x2xy
2
2
AdditionalExample #2:
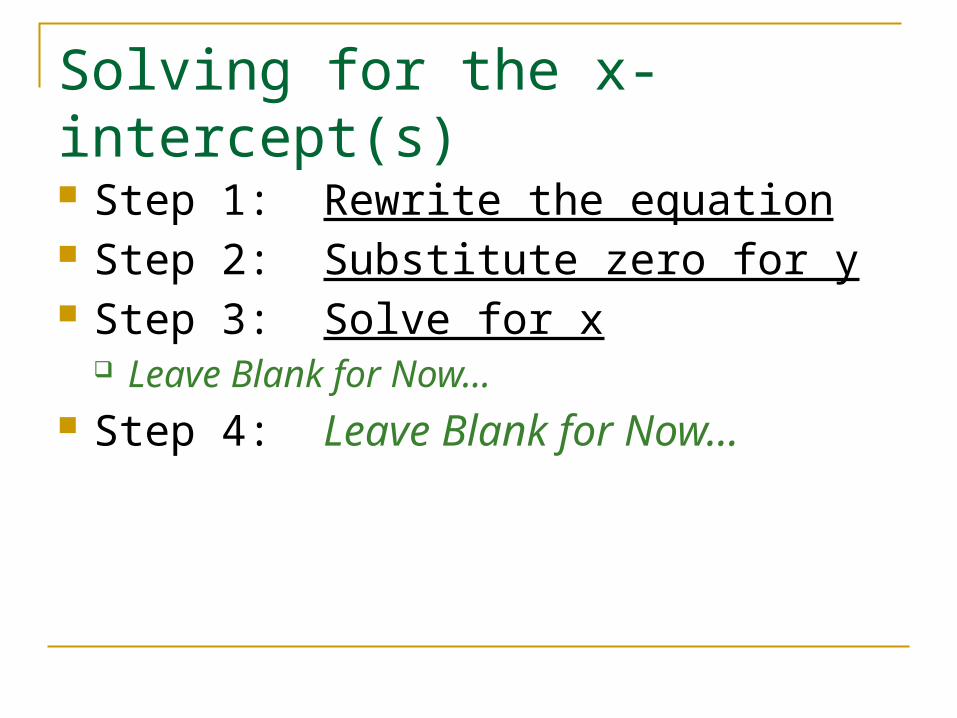
Solving for the x-intercept(s)
Step 1: Rewrite the equation Step 2: Substitute zero for y Step 3: Solve for x
Leave Blank for Now… Step 4: Leave Blank for Now…
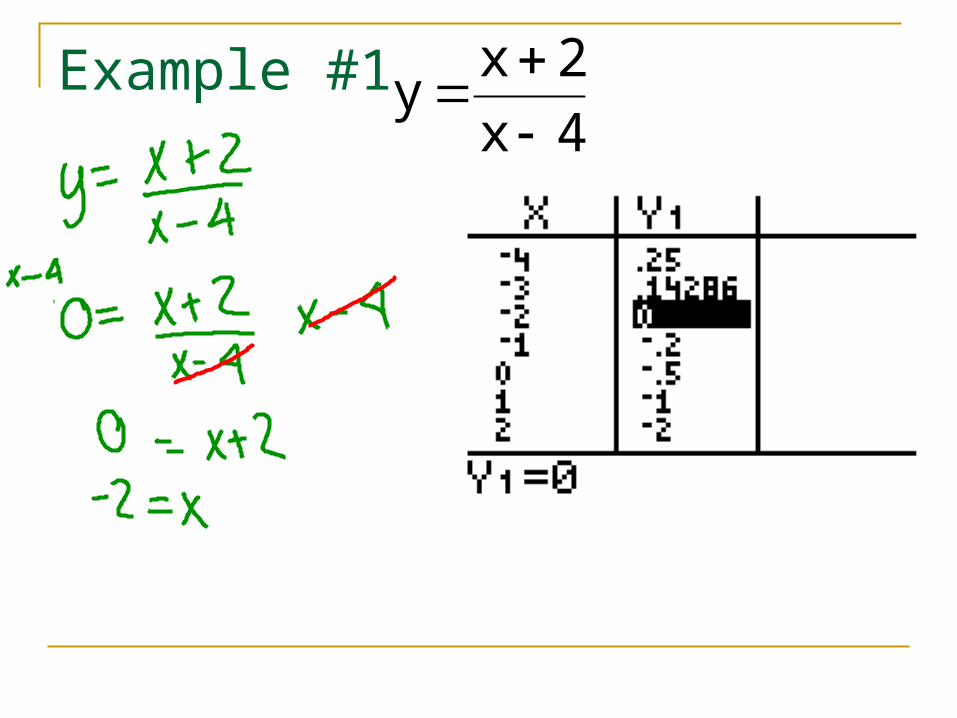
Example #14x
2xy
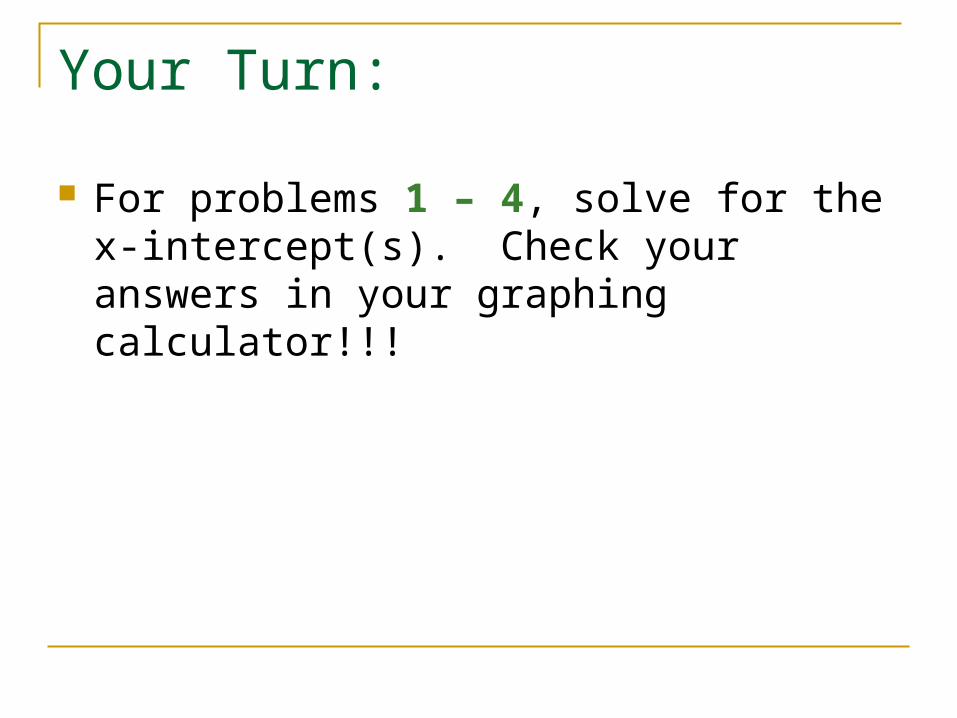
Your Turn:
For problems 1 – 4, solve for the x-intercept(s). Check your answers in your graphing calculator!!!
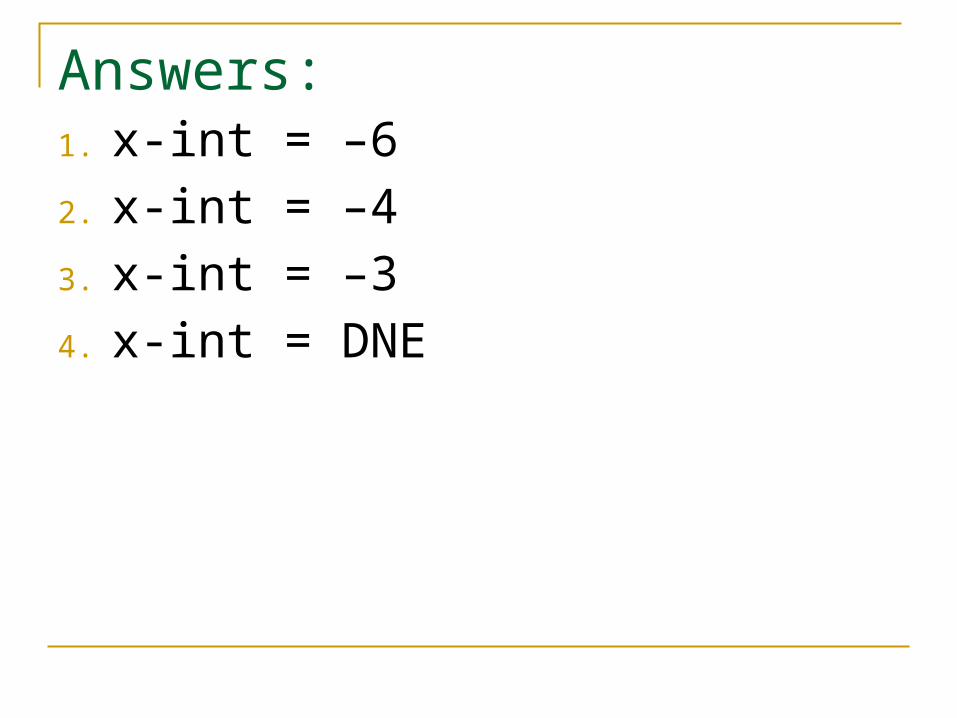
Answers:1. x-int = –6
2. x-int = –4
3. x-int = –3
4. x-int = DNE
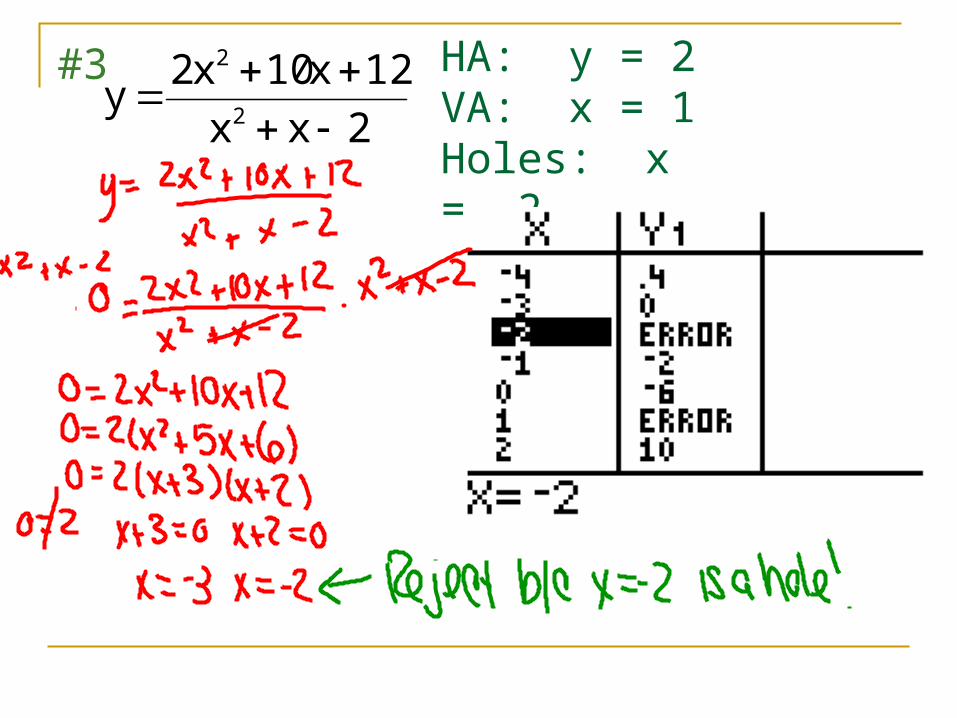
HA: y = 2VA: x = 1Holes: x = –2
2xx
12x10x2y
2
2
#3
HA: y = 0VA: x = 2Holes: DNE
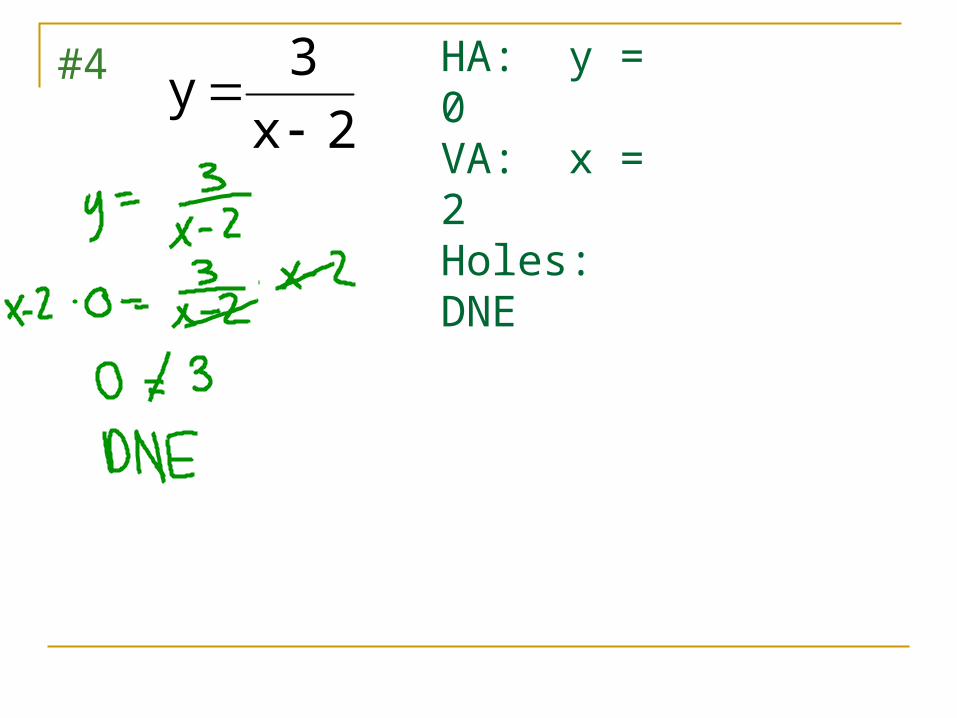
2x
3y
#4
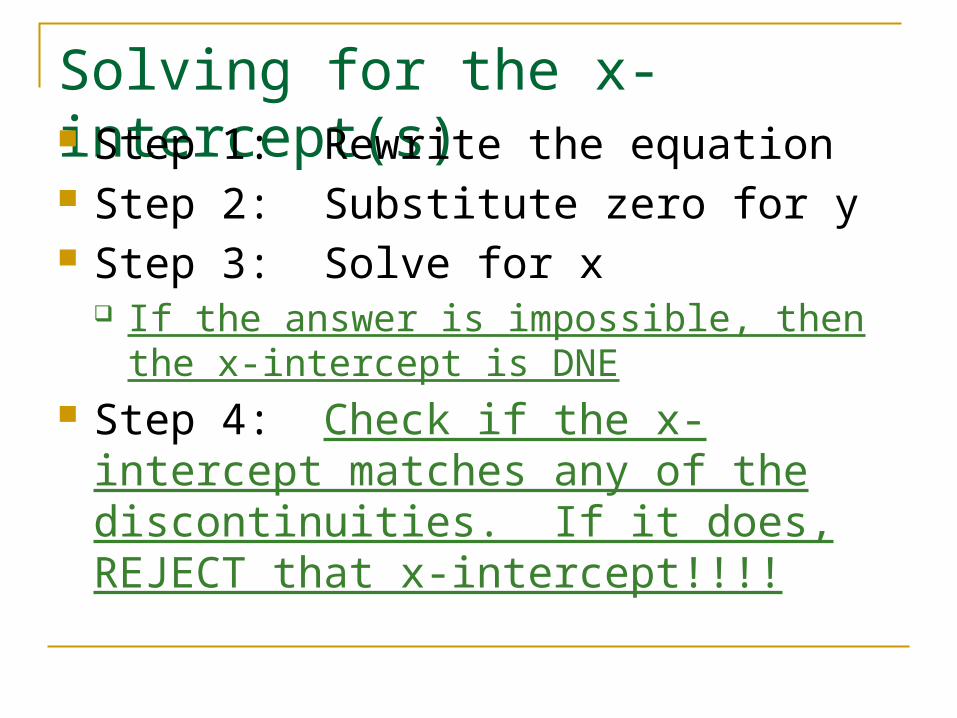
Solving for the x-intercept(s) Step 1: Rewrite the equation Step 2: Substitute zero for y Step 3: Solve for x
If the answer is impossible, then the x-intercept is DNE
Step 4: Check if the x-intercept matches any of the discontinuities. If it does, REJECT that x-intercept!!!!
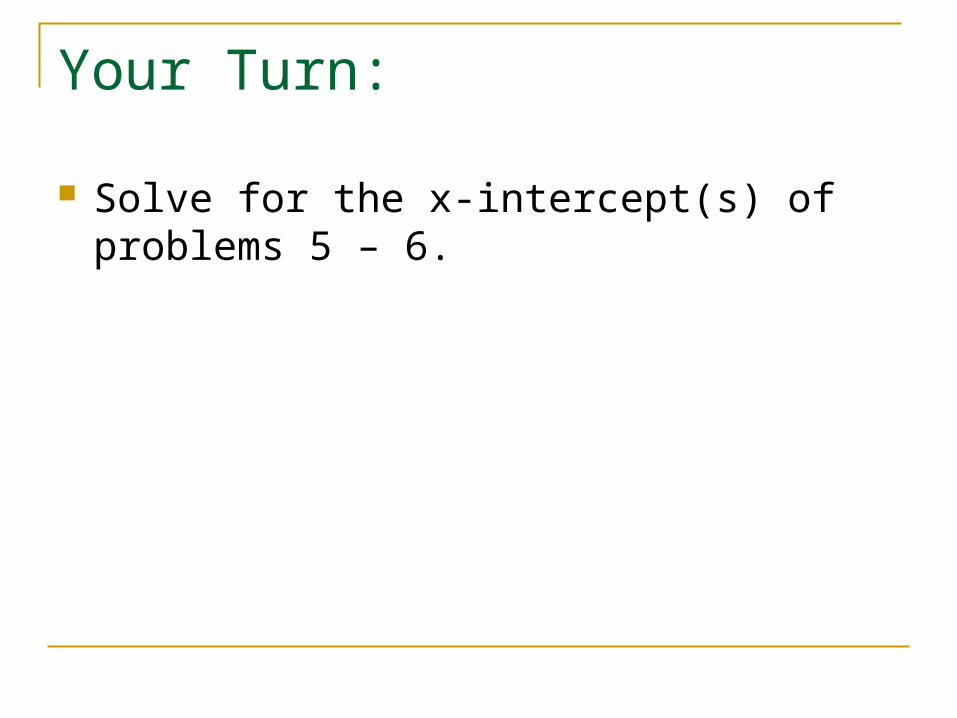
Your Turn:
Solve for the x-intercept(s) of problems 5 – 6.

HA: y = 0VA: x = 2Holes: x = –1
2xx
1xy
2
#5
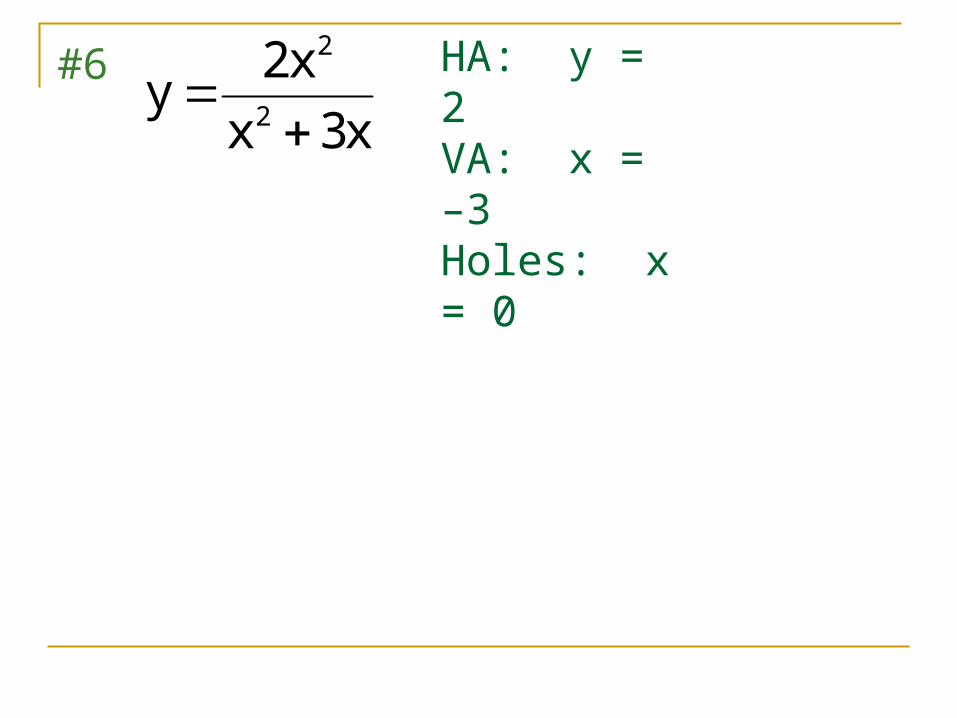
HA: y = 2VA: x = –3Holes: x = 0
x3x
x2y
2
2
#6
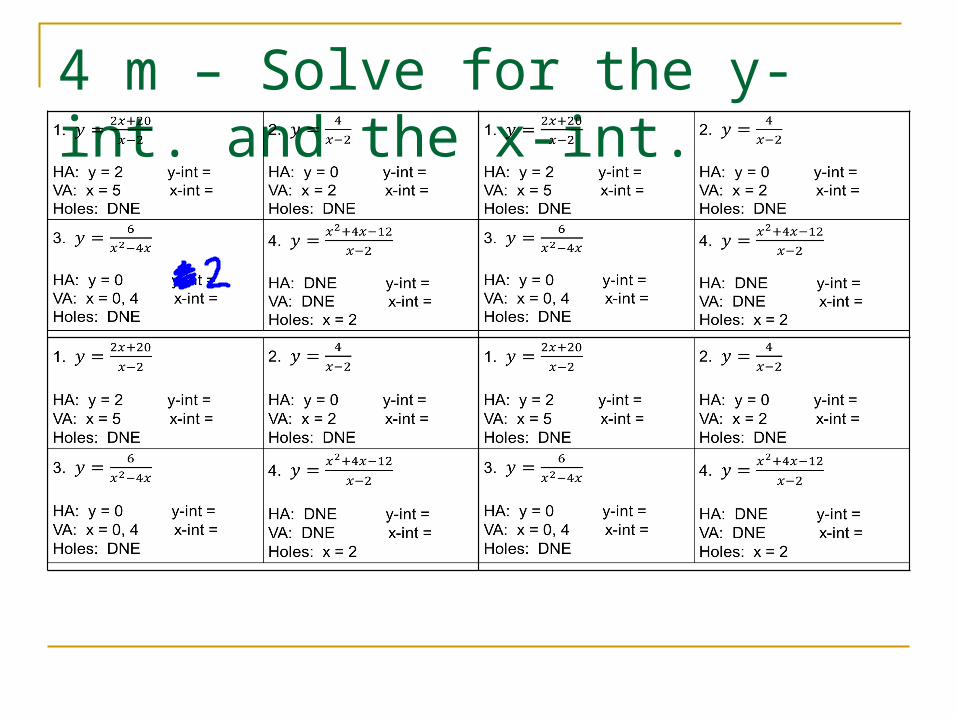
4 m – Solve for the y-int. and the x-int.

Finding Additional Points We can use our graphing calculators to find
additional points! Step 1: Make a table that has two points before
and after each VA and hole. Step 2: Type the equation into y1 of graphing
calculator. Step 3: Use the table function to find points to
fill into the table. Pick points that are easy to graph!!!
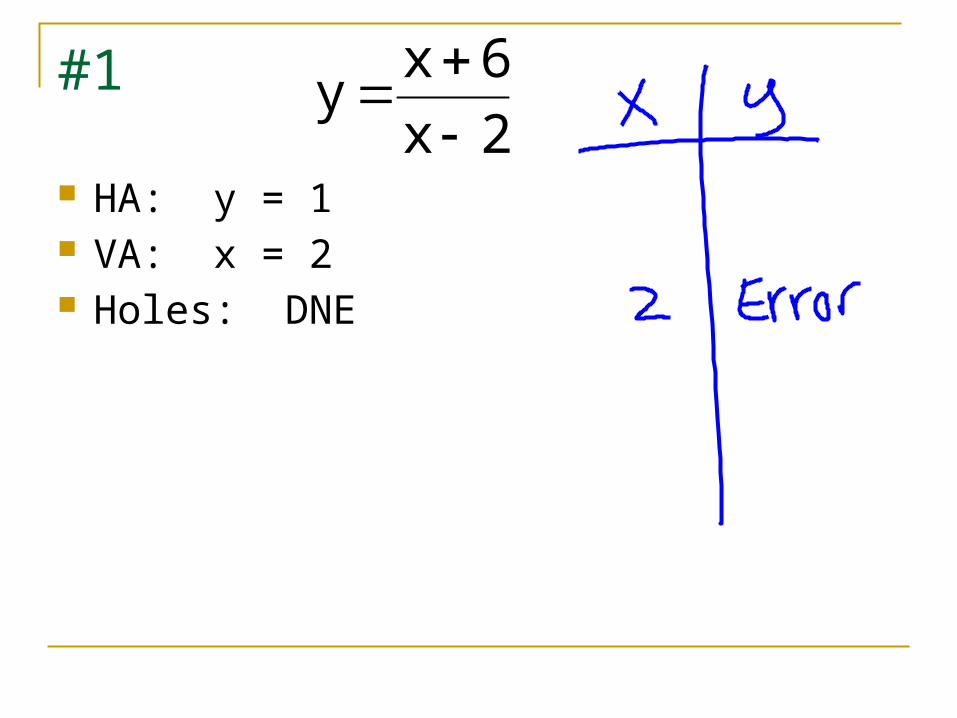
#1
HA: y = 1 VA: x = 2 Holes: DNE
2x
6xy

#3
HA: y = 2 VA: x = 1 Holes: x = –2
2xx
12x10x2y
2
2
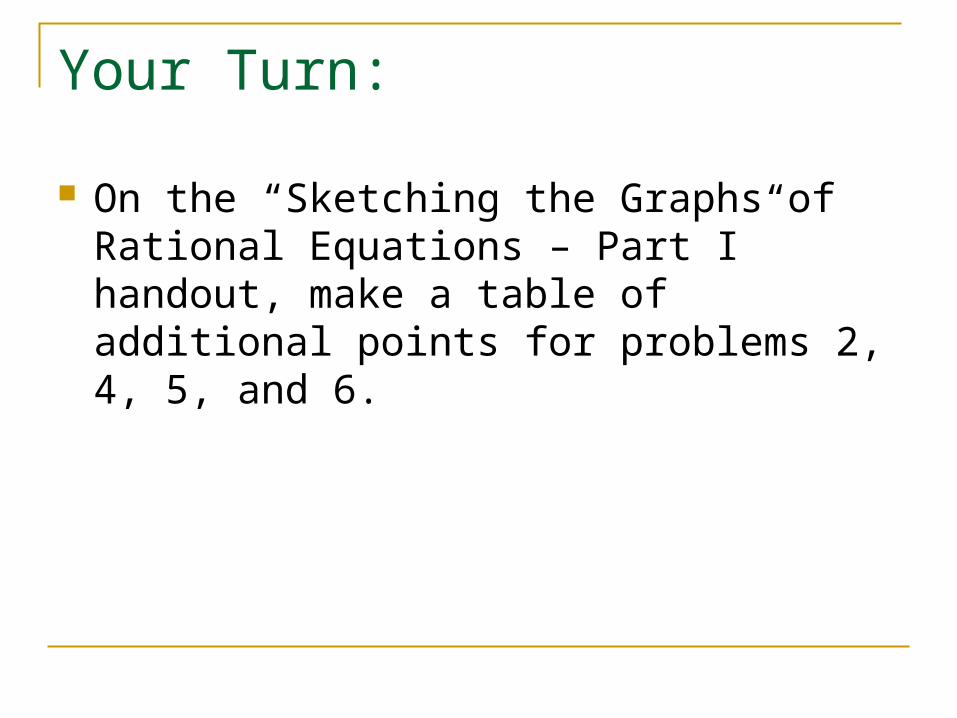
Your Turn:
On the “Sketching the Graphs of Rational Equations – Part I” handout, make a table of additional points for problems 2, 4, 5, and 6.

Sketching – Putting It All Together!!! Step 1: Graph the HAs and VAs
Remember, we use dashed lines to represent asymptotes!
Step 2: Graph the y-intercept and the x-intercept(s) (if they exist)
Step 3: Graph the points from the table Step 4: Connect the points with lines Step 5: Graph any holes
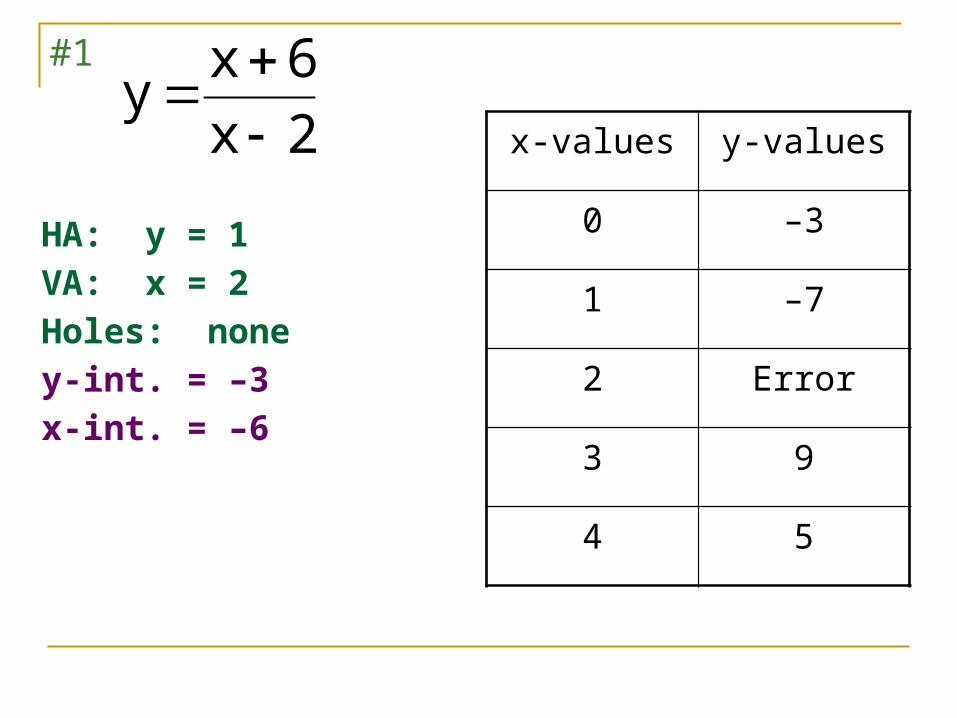
HA: y = 1
VA: x = 2
Holes: none
y-int. = –3
x-int. = –6
x-values y-values
0 –3
1 –7
2 Error
3 9
4 5
2x
6xy
#1
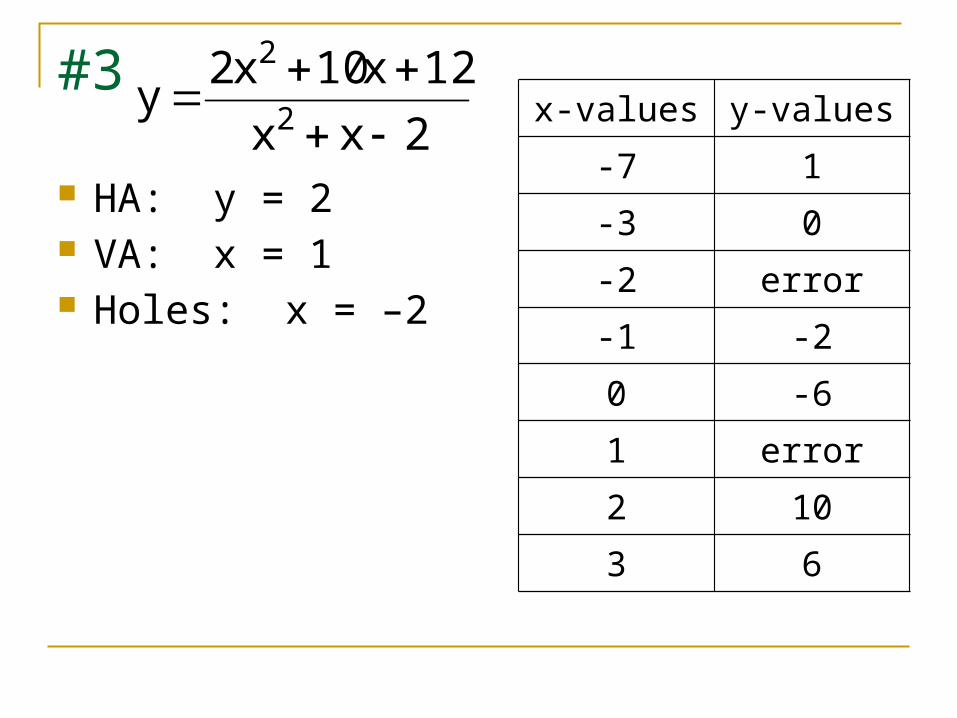
#3
HA: y = 2 VA: x = 1 Holes: x = –2
2xx
12x10x2y
2
2
x-values y-values
-7 1
-3 0
-2 error
-1 -2
0 -6
1 error
2 10
3 6
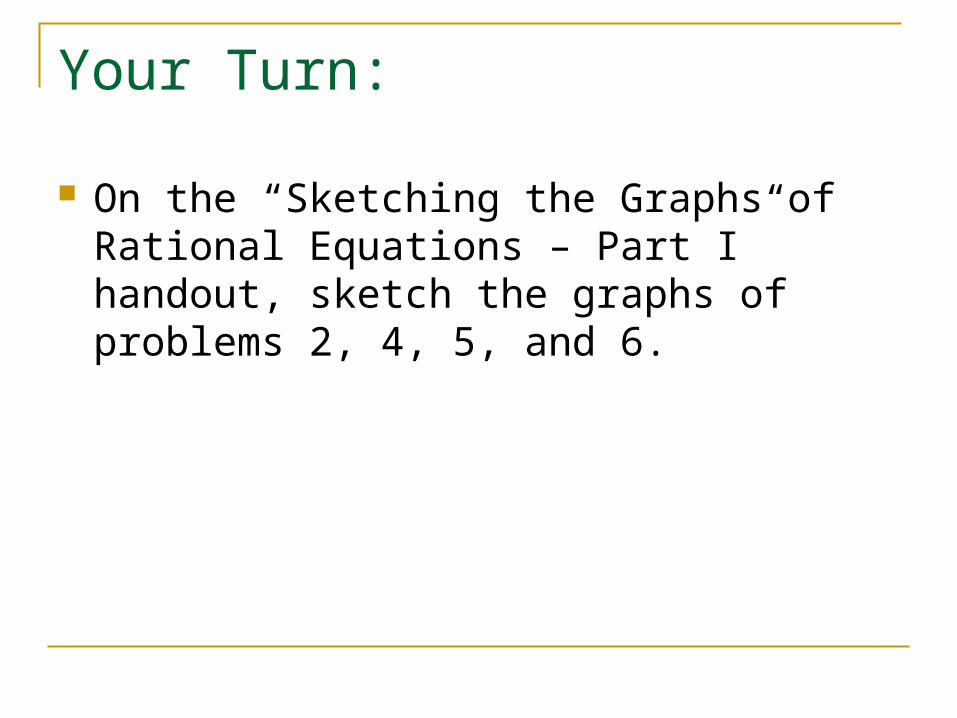
Your Turn:
On the “Sketching the Graphs of Rational Equations – Part I” handout, sketch the graphs of problems 2, 4, 5, and 6.
Homework
Create a table for and sketch the graphs of problems #4 - #6 on “Sketching the Graphs of Rational Equations – Part II”.
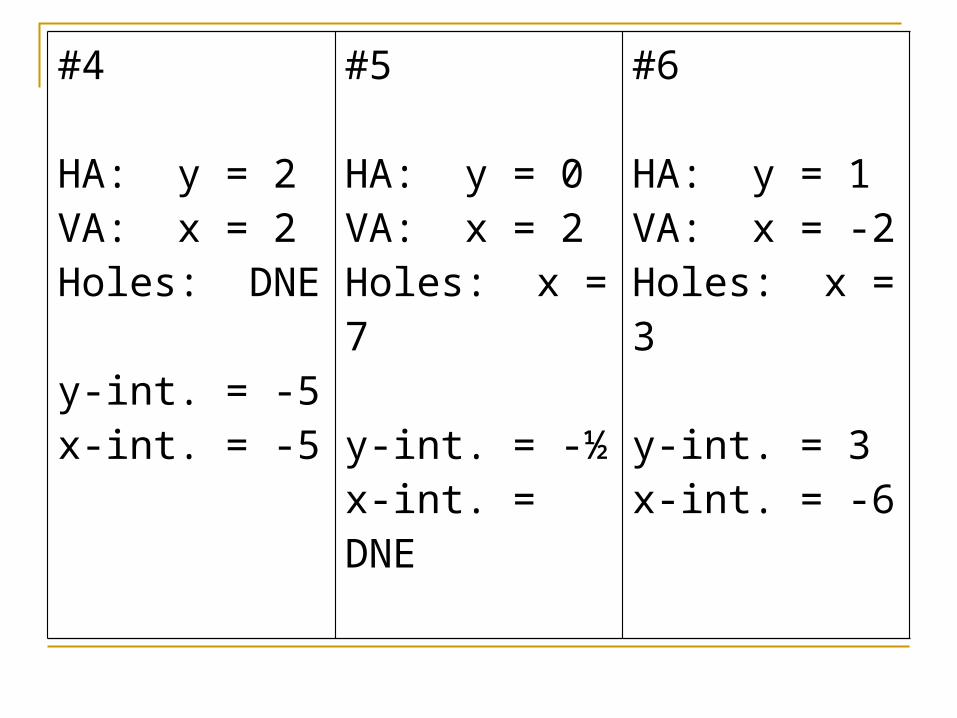
#4
HA: y = 2VA: x = 2Holes: DNE
y-int. = -5x-int. = -5
#5
HA: y = 0VA: x = 2Holes: x = 7
y-int. = -½ x-int. = DNE
#6
HA: y = 1VA: x = -2Holes: x = 3
y-int. = 3x-int. = -6