skilled immigration and the employment structures of … · linked to all other census bureau ......
TRANSCRIPT

Skilled Immigration and theEmployment Structures of US Firms
Sari Kerr William Kerr William Lincoln
1 / 56

Disclaimer: Any opinions and conclusions expressed herein are thoseof the authors and do not necessarily represent the views of the U.S.Census Bureau. All results have been reviewed to ensure that noconfidential information is disclosed.
2 / 56

3 / 56

4 / 56

5 / 56

6 / 56

Main Objective
Hope to build a deeper view of the firm’s role in immigration
(Was) the first study we know of to consider the effects ofimmigration using employer-employee data
Study how high skilled immigration affects the employment structuresof US firms
7 / 56

8 / 56

9 / 56
Overview of Results
Total skilled employment expands with the hiring of highly skilledimmigrants
Employment expansion is larger for young skilled natives relative toolder natives
10 / 56
Overview
Data
Conceptual framework
OLS Estimations
IV Estimations
11 / 56

LEHD Employment Data
12 / 56
LEHD Data
All private firms and their employees
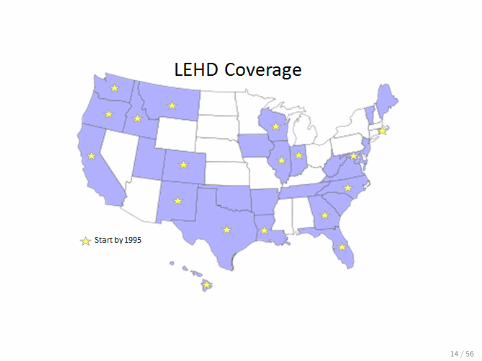
Sourced from unemployment insurance filingsCombined with information from social security filings29 participating states with various start years, from ∼1990 to 2002,and end year of 2008
Information for each firm:
LEHD: establishment code, industry, total employment, payroll andexact locationLinked to all other Census Bureau operating data
13 / 56
14 / 56

LEHD Data
Information for each employee:
Quarterly earningsAge, gender, and raceCitizenship status: US citizen, naturalized citizen, non-citizenPlace of birthNo information on occupationEducation is imputedExact location within state for firm establishments but is imputed forworkers
15 / 56

Firm Sample
Focus: major employers & patenting firms
Sample meets one of following criteria:
Accounts for >0.05% of patents 2001-2004Top 100 "employer name" in LBD during any year from 1990-2008Top 100 Compustat worldwide sales or employment over full 1990-2008periodA Fortune 200 company in 2009
16 / 56

Firm Sample
Firm selection
Consider 18 states present by 1995Drop firms with <25% employment in LEHD statesFinal group on average >50% in LEHD states
Sample: 319 firms
Average employment is ∼52k workers in 18 LEHD core states
17 / 56
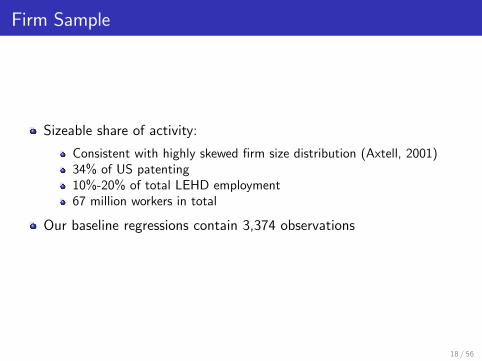
Firm Sample
Sizeable share of activity:
Consistent with highly skewed firm size distribution (Axtell, 2001)34% of US patenting10%-20% of total LEHD employment67 million workers in total
Our baseline regressions contain 3,374 observations
18 / 56

Sample Group: Employees
Skilled definition:
Median earnings over $50,000 in real $2008
Calculated over employment spells 1995-200835% of workforce earns $50k+
Aged 18-65, young-old split at 40 yrs
19 / 56

Conceptual Framework
20 / 56

Conceptual Framework
We are interested in looking at how changes in the employment ofskilled immigrants affect changes in the employment of other groups
"Microsoft has found that for every H-1B hire we make, we add onaverage four additional employees to support them in variouscapacities" - Bill Gates in 2008 Congressional Testimony
We consider a simple conceptual framework that will allow us to
think about these employment patterns in a straightforward way interms of substitution and complementarity between different types ofworkersallow us to relate our findings to arguments made in the public debateover high skilled immigrationgive us guidance for empirical work
21 / 56

Conceptual Framework
A firm that makes output using two types of labor– domestic andimmigrant– with the concave production function Q = Q (LD , LI )
Positive but diminishing marginal returns to each type of labor
The concave revenue function of the firm is R (Q, y), with yrepresenting economic conditions exogenous to the firm
22 / 56
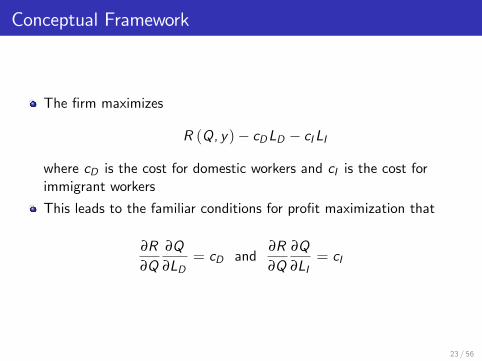
Conceptual Framework
The firm maximizes
R (Q, y)− cDLD − cILI
where cD is the cost for domestic workers and cI is the cost forimmigrant workers
This leads to the familiar conditions for profit maximization that
∂R∂Q
∂Q∂LD
= cD and∂R∂Q
∂Q∂LI
= cI
23 / 56
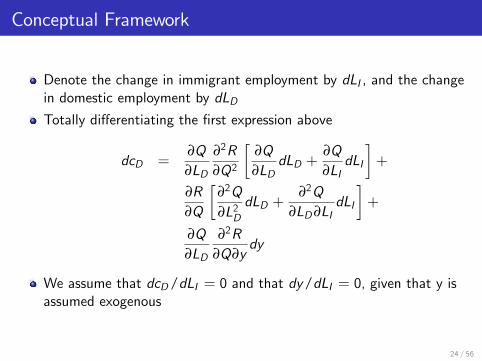
Conceptual Framework
Denote the change in immigrant employment by dLI , and the changein domestic employment by dLDTotally differentiating the first expression above
dcD =∂Q∂LD
∂2R∂Q2
[∂Q∂LD
dLD +∂Q∂LI
dLI
]+
∂R∂Q
[∂2Q∂L2D
dLD +∂2Q
∂LD∂LIdLI
]+
∂Q∂LD
∂2R∂Q∂y
dy
We assume that dcD/dLI = 0 and that dy/dLI = 0, given that y isassumed exogenous
24 / 56

Conceptual Framework
We can then rearrange the remaining terms to be
dLD =
[∂Q∂LD
∂Q∂LI
∂2R∂Q 2 +
∂R∂Q
∂2Q∂LD ∂LI
]−[(
∂Q∂LD
)2∂2R∂Q 2 +
∂R∂Q
∂2Q∂L2D
]dLIGiven our assumptions, the denominator is positive
The relationship between dLD and dLI will be positive only if∂2Q
∂LD ∂LI> 0 and is suffi ciently large to offset the magnitude of the
(negative) first term in the summation of the numerator
25 / 56

Conceptual Framework
We can then rearrange the remaining terms to be
dLD =
[∂Q∂LD
∂Q∂LI
∂2R∂Q 2 +
∂R∂Q
∂2Q∂LD ∂LI
]−[(
∂Q∂LD
)2∂2R∂Q 2 +
∂R∂Q
∂2Q∂L2D
]dLIThis makes sense intuitively– if domestic and immigrant workeremployment are complementary and suffi ciently strong to overcomethe concavity of the revenue function, then we should see a positiverelationship between growth in domestic employment and growth inimmigrant employment in the data
26 / 56

OLS Estimations
27 / 56

Following the results from the conceptual framework we consider thefollowing specification
∆Yf ,t = β · ∆ ln(EmpYSIf ,t ) + δ · ∆Xf ,t + ηi ,t + εf ,t ,
Firm f, sector i, year t
ln(EmpYSIf ,t ) is the log number of young skilled immigrants employedin year t by firm f
Yf ,t is the outcome variable of interest
Xf ,t is a vector of firm-year controls
ηi ,t are sector-year fixed effects
28 / 56

Firm-Year Controls Xf ,tLocal area controls– calculate firm’s initial employment across countiesand then weight county trends by these shares: LEHD employment,immigrant share, and share of workers over 40 (Card)"Supply-Push" controls– Calculate each firm’s initial skilled immigrantdistribution across 12 geographic groups (Europe, Latin America, etc.).Then interact this with the growth of skilled immigrants at the nationallevel, weighting by the initial distribution. Do the same for low skilledworkers. (Card)Age-education controls– calculate firm’s initial employmentdistribution across 6 age-education cells (young, old; HS or less, somecollege, college or more) and interact this with national growth inskilled immigration in these categories (Borjas)
29 / 56
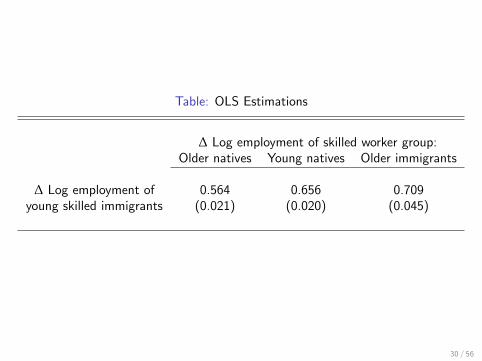
Table: OLS Estimations
∆ Log employment of skilled worker group:Older natives Young natives Older immigrants
∆ Log employment of 0.564 0.656 0.709young skilled immigrants (0.021) (0.020) (0.045)
30 / 56

Table: OLS Estimations
∆ Log total ∆ Older skilled ∆ Older native skilledskilled emp. worker share worker share
∆ Log employment of 0.626 -0.031 -0.019young skilled immigrants (0.020) (0.003) (0.003)
31 / 56

IV Estimations
32 / 56
Instrumental Variable Estimations
While the OLS estimations account for fixed effects and a widevariety of additional controls, there still may be omitted factorsdriving the results
We now turn to an IV approach that uses large changes in nationalhigh skilled immigration policy
33 / 56

Instrumental Variable Estimations
Specifically, we take advantage of changes in the limit on H-1B visas
H-1B is a non-immigrant visa
Category governing high-skilled immigrationEmployment in "specialty occupations"Employer is responsible for visa applicationThree-year visa, renewable oncePrevailing wage requirementCap on visa issuances since 1990Computer-related and SE occupations (∼60%)Large percentage coming from India (∼40%) or China (∼10%)
34 / 56

H-1B National Trends
35 / 56
Instrumental Variable Estimations
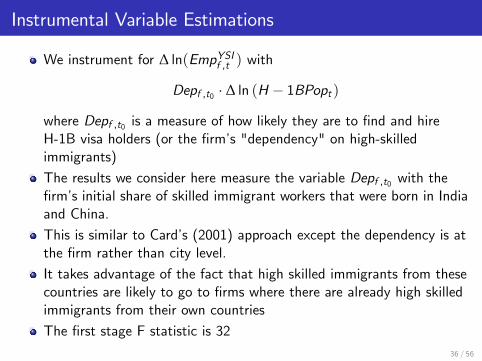
We instrument for ∆ ln(EmpYSIf ,t ) with
Depf ,t0 · ∆ ln (H − 1BPopt )
where Depf ,t0 is a measure of how likely they are to find and hireH-1B visa holders (or the firm’s "dependency" on high-skilledimmigrants)
The results we consider here measure the variable Depf ,t0 with thefirm’s initial share of skilled immigrant workers that were born in Indiaand China.
This is similar to Card’s (2001) approach except the dependency is atthe firm rather than city level.
It takes advantage of the fact that high skilled immigrants from thesecountries are likely to go to firms where there are already high skilledimmigrants from their own countries
The first stage F statistic is 3236 / 56

Table: IV Estimations Using the Chinese and Indian Worker Dependency
∆ Log employment of skilled worker group:Older natives Young natives Older immigrants
∆ Log employment of 0.449 0.740 0.597young skilled immigrants (0.115) (0.083) (0.104)
37 / 56
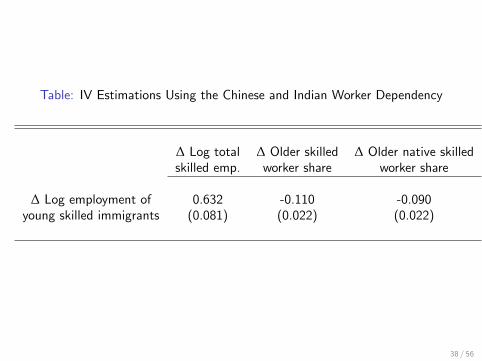
Table: IV Estimations Using the Chinese and Indian Worker Dependency
∆ Log total ∆ Older skilled ∆ Older native skilledskilled emp. worker share worker share
∆ Log employment of 0.632 -0.110 -0.090young skilled immigrants (0.081) (0.022) (0.022)
38 / 56

Instrumental Variable Estimations
We also considered two alternative instruments, interacting thechange in the log national H-1B population with
The log ratio of the firm’s LCAs (H-1B applications) to its skilledemployment in 2001Share of the firm’s workforce in STEM occupations
We come to similar conclusions with these instruments
We also consider similar IV estimations controlling for changes inmedium-skilled employment. This approach is somewhat more robustand yields similar magnitudes.
39 / 56

Interpretation
If high skilled immigrants are unique inputs (especially at the highend), then being able to hire more could expand firm market shareand lead to greater use of citizen workers (relation to trade literature,innovation).
It could be that immigrants and citizen workers are substitutes withinoccupation categories but are complements across categories.
40 / 56
Conclusions
Total skilled employment expands with the hiring of highly skilledimmigrants
Employment expansion is larger for young skilled natives relative toolder natives
41 / 56

Thank You
42 / 56

Appendix
43 / 56
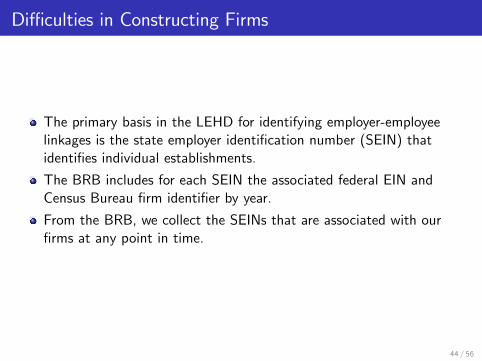
Diffi culties in Constructing Firms
The primary basis in the LEHD for identifying employer-employeelinkages is the state employer identification number (SEIN) thatidentifies individual establishments.
The BRB includes for each SEIN the associated federal EIN andCensus Bureau firm identifier by year.
From the BRB, we collect the SEINs that are associated with ourfirms at any point in time.
44 / 56

Diffi culties in Constructing Firms
This collection of complete SEIN records is important as firmsoccasionally change SEINs for reasons unrelated to our interests, andthese legal adjustments could otherwise be confused with actualchanges in the company’s employment dynamics.
With the collected SEINs, we then prepare the employment recordsfor our firm sample.
We need each SEIN to be uniquely associated with a firm, andtherefore we research any overlapping identifiers and assign them tothe appropriate company.
As many of our firms are multi-establishment companies, on averageour composite firms contain roughly 200 SEINs.
45 / 56

Firm Sample
Sample: 319 firms
Older natives are 50% of skilled groupYounger natives are 31% of skilled groupImmigrants are 19% of skilled groupHiring and departing rate of 13-14% per year
46 / 56

Firm Sample
Sector distribution within LEHD:
Manufacturing: ∼30%Wholesale and retail trade: ∼25%FIRE and services: ∼30%Other sectors: ∼15%
47 / 56

OLS Robustness
Similar results when
Controlling for changes in medium skilled immigrationWhen considering the subsample of just top patenting firmsConsidering different weighting strategiesUsing a firm-state approach using all 29 statesRaising the threshold to 66% employment in LEHD statesSplitting the sample by the long-term growth rates of the firmsSetting minimum employment thresholds for companiesUsing alternative definitions of skilled workers
48 / 56
IV Robustness
Similar results when
When considering the subsample of just top patenting firmsUsing a balanced panelDropping major M&A firmsDropping firms that lobby about immigrationSplitting the sample across industries
49 / 56

STEM Match
CPS collects employment data from a random group of workers in theUS every year
A bridge between the 1986-1997 CPS and LEHD has been established
Ascertain the occupations of over 25k workers in our firm sample atthe time of their inclusion in the CPS survey
Share of the firm’s workforce in STEM occupations measured in thefirst three years where matched employees are observed, which maybe later than the typical initial period. Winsorize these shares at the5% and 95% values.
50 / 56
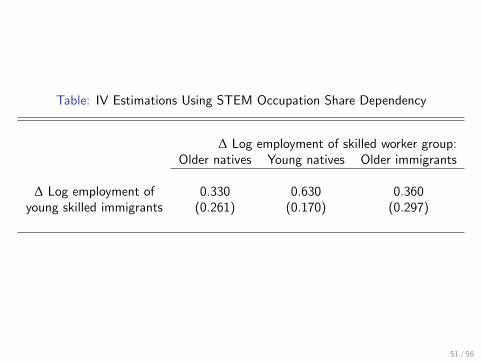
Table: IV Estimations Using STEM Occupation Share Dependency
∆ Log employment of skilled worker group:Older natives Young natives Older immigrants
∆ Log employment of 0.330 0.630 0.360young skilled immigrants (0.261) (0.170) (0.297)
51 / 56

Table: IV Estimations Using STEM Occupation Share Dependency
∆ Log total ∆ Older skilled ∆ Older native skilledskilled emp. worker share worker share
∆ Log employment of 0.583 -0.140 -0.104young skilled immigrants (0.167) (0.057) (0.049)
52 / 56

Table: IV Estimations Using the Chinese and Indian Worker Dependency withMedium Skilled Workforce Control
∆ Log employment of skilled worker group:Older natives Young natives Older immigrants
∆ Log employment of 0.442 0.736 0.591young skilled immigrants (0.098) (0.077) (0.098)
53 / 56

Table: IV Estimations Using the Chinese and Indian Worker Dependency withMedium Skilled Workforce Control
∆ Log total ∆ Older skilled ∆ Older native skilledskilled emp. worker share worker share
∆ Log employment of 0.627 -0.112 -0.092young skilled immigrants (0.071) (0.018) (0.020)
54 / 56
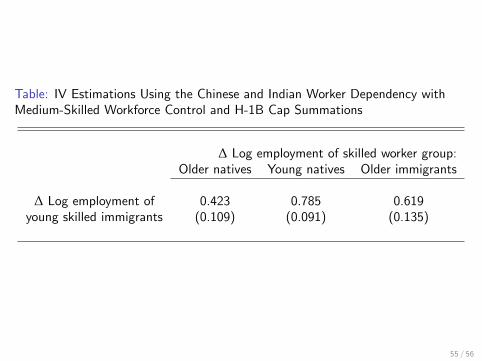
Table: IV Estimations Using the Chinese and Indian Worker Dependency withMedium-Skilled Workforce Control and H-1B Cap Summations
∆ Log employment of skilled worker group:Older natives Young natives Older immigrants
∆ Log employment of 0.423 0.785 0.619young skilled immigrants (0.109) (0.091) (0.135)
55 / 56

Table: IV Estimations Using the Chinese and Indian Worker Dependency withMedium Skilled Workforce Control and H-1B Cap Summations
∆ Log total ∆ Older skilled ∆ Older native skilledskilled emp. worker share worker share
∆ Log employment of 0.654 -0.130 -0.116young skilled immigrants (0.078) (0.024) (0.026)
56 / 56