skin electrical properties and physical aspects of
TRANSCRIPT
Skin electrical properties and physicalaspects of hydration of keratinized
tissues
by
Gorm Krogh Johnsen
Thesis submitted for the degree ofPhilosophiae Doctor
Department of PhysicsUniversity of Oslo
June 2010

© Gorm Krogh Johnsen, 2010 Series of dissertations submitted to the Faculty of Mathematics and Natural Sciences, University of Oslo No. 1015 ISSN 1501-7710 All rights reserved. No part of this publication may be reproduced or transmitted, in any form or by any means, without permission. Cover: Inger Sandved Anfinsen. Printed in Norway: AiT e-dit AS. Produced in co-operation with Unipub. The thesis is produced by Unipub merely in connection with the thesis defence. Kindly direct all inquiries regarding the thesis to the copyright holder or the unit which grants the doctorate.

Acknowledgements
I am deeply indebted to Ørjan Martinsen and Sverre Grimnes for beingsuperb supervisors over the last four years. Your insight in the field ofbioimpedance as well as your patience has been invaluable for me all theway since I was fumbling around way off the frontier of research. Also, yourfriendly attitude and fine, but still a bit dry wit has been very much appre-ciated, as well as all the laughs in your office.
I am also grateful to Lars Norlen for a good and interesting collabora-tion regarding aspects within skin research. Carsten Lutken deserves specialthanks for introducing me to the treasurous seas of memristors. I would liketo thank Christian Tronstad for fully jumping onto the last project in mythesis, involving very hard and much work over a long period with reallytight time limits.
I have also had the pleasure of collaborating with Havard Kalvøy, Anne-Berit Haugsnes, and Per Høyum, as well as Bernt Nordbotten concerningsmall and even smaller problems on a daily basis. Jan Gorgol at the SMSLtd (London) has been very helpful concerning the use and maintenance ofthe DVS instrument. All conference-trips with the friendly gang of OsloBioimpedance Group have been inspiring, but more importantly, very nice.
Øyvind Grøn has been extremely friendly and easy to work with con-cerning my teaching duties over the last three years. Your pedagogical andinspiring explanations to small subtleties within General Relativity have beenindispensable in my work. I am also grateful to the always positive librariansat the Department of Physics, and for their effort in digging up old literature.
Finally, I would like to thank my family for all support, and in particularJosefine for being the best ever, never letting me bury myself in the mysteriesof bioimpedance.
i


List of abbreviations
SC - stratum corneum
RH - relative humidity
EDR - electrodermal response
EP - electrode polarization
DC - direct current
AC - alternating current
LF - low frequency
HF - high frequency
TEWL - trans-epidermal water-loss
CPE - constant phase element
DVS - dynamic vapor sorption
SSCD - skin surface conductance density
TS - test subject
IQR - interquartile range
EEA - effective electrode area
iii

Preface
The first four chapters in this thesis are written with the purpose of intro-ducing the reader to the field of bioimpedance, skin sorption properties aswell as the thrilling memristor circuit element that all have been key topics inmy research. The topics covered are naturally biased, as well as limited, bymy own overview of these fields, but nevertheless the introduction is meantto serve as guide and motivation to the papers that are the final outcome ofmy research during the last years.
The anatomy and physiology of the human skin are treated in chapter1. Chapter 2 introduces skin electrical properties, whereas its correspondingwater holding capacities are briefly discussed in chapter 3. Memristor theory,suitable for biological systems, is introduced in chapter 4. Finally, in chapter5 I summarize the main findings in my thesis, sharing also some thoughtsabout natural follow-up studies.
Electrical bioimpedance is a field of research that has evolved mainly inthe last 30 years and this research has provided a detailed knowledge aboutthe passive (i.e. no internal current source) electrical properties of humanas well as other tissues. One possible application that has been quite thor-oughly studied, is the ability of giving a description of the hydration state ofthe stratum corneum (SC), the uppermost part of the human skin, by meansof electrical measurements. As the general hydration state of the SC is con-nected to its passive electrical properties as well as to the overall functionof the SC, serving as a protective shield against the environments, the roleof water in the skin has been studied with interest within dermatology aswell as by researchers concerned with bioimpedance and bioelectrical phe-nomena. In general, information gathered from impedance measurements isa fingerprint of the tissue properties as well as of tissue alterations, and so asan example skin hydration can be linked to the physical parameters of skinbarrier functions or alterations can be linked to specific skin related diseases.
Thus, being able to estimate the actual content of water within the SCcan be expected to be a strong clinical tool, enabling better diagnostics, anda good precision of the estimates is thus desirable. As one of the foremost
v

vi
functions of the SC is to provide a diffusion barrier towards the environments,its water hydration characteristics have been and will be important in astructure function understanding of the SC. This argument also applies forkeratinized tissue, that is a more general grouping of tissue in the humanintegument such as hair, nail and SC.
Modeling the human SC as well as the rest of the skin is important inorder to actually understand the underlying physics and hence possibly alsoenable improved diagnostics in some applications. It is desirable that themodeling, often based on a more or less intricate combination of elementarycircuit elements is not only precise in its description (i.e. mimicking theobservations to a good precisison), but also conceptually correct, giving animproved understanding of the physical phenomena at their fundamentallevel. This is where the memristor comes in.
It is important to keep in mind that electrical measurements on or withinthe human body involve electrodes, i.e. the site where charge carriers shiftfrom electrons to ions, and electrodes will in general influence the signalsthat are measured. Hence, electrodes should always be chosen carefully inorder to be most suitable for the intended use.
Six papers are presented in this thesis and are referred to by Romannumbers I-VI throughout the text. These papers represent, at least in part,answers to some of the key questions that during the last four years haveserved as a motivation for my daily work. The two first papers describemethods for estimating the stratum corneum water content, both based onelectrical measurements (Paper I) as well as on skin water evaporation mea-surements (Paper II) and are steps towards an objective measure of the hy-dration state of the stratum corneum. These are methods that, if sufficientlyprecise, would be useful in evaluating the protective properties of the stratumcorneum as well as within understanding of skin diseases. Paper III and IVdeal with the water sorption properties, intimately related to skin electricalproperties, of keratinized tissues. In Paper V the memristor, which is thefourth and final passive circuit element, complementing resistors, capacitorsand coils, is introduced to the world of bioimpedance, and human sweat ductconductivity in particular. The memristor shows promising abilities in ex-plaining some puzzling non-linear phenomena in circuit theory, and hencealso in bioimpedance measurements. Finally, Paper VI deals with the samesweat ducts, but now with focus on how different types of electrodes will in-fluence the final signals that are recorded, and we will see that an electrodeis not necessarily just an electrode.

List of papers
Paper I: GK. Johnsen, ØG. Martinsen, and S. Grimnes,Estimation of in vivo water content of the stratum corneum from
electrical measurements,Open Biomed Eng J, 3, 8-12, 2009.
Paper II: GK. Johnsen, AB. Haugsnes, ØG. Martinsen, and S. Grimnes,A new approach for an estimation of the equilibrium stratum
corneum water content,Skin Res Technol, 16, 142-145, 2010.
Paper III: GK. Johnsen, L. Norlen, ØG. Martinsen, and S. Grimnes,Sorption properties of the human stratum corneum,Skin Pharmacol Physiol (submitted), 2010.
Paper IV: GK. Johnsen, ØG. Martinsen, and S. Grimnes,Sorption studies of human keratinized tissues,J Phys Conf Ser, 224, 012094, 2010.
Paper V: GK. Johnsen, CA. Lutken, ØG. Martinsen, and S. Grimnes,A memristive model of electro-osmosis in skin,J Phys D (submitted), 2010.
Paper VI: C. Tronstad, GK. Johnsen, S. Grimnes, and ØG. Martinsen,A study on electrode gels for skin conductance measurements,Physiol Meas, 31, 1395-1410, 2010.
vii


Contents
I Introduction 1
1 Anatomy and functionality of the skin 3
1.1 The epidermis . . . . . . . . . . . . . . . . . . . . . . . . . . . 41.1.1 The stratum corneum and its barrier function . . . . . 51.1.2 The Barrier properties . . . . . . . . . . . . . . . . . . 6
1.2 Nail and hair . . . . . . . . . . . . . . . . . . . . . . . . . . . 71.3 Sweat ducts . . . . . . . . . . . . . . . . . . . . . . . . . . . . 8
2 Electrical properties of human tissue 11
2.1 Cell membranes and tissue . . . . . . . . . . . . . . . . . . . . 122.2 Keratinized tissues . . . . . . . . . . . . . . . . . . . . . . . . 152.3 Electro-osmosis . . . . . . . . . . . . . . . . . . . . . . . . . . 162.4 Influence from electrodes . . . . . . . . . . . . . . . . . . . . . 18
3 Skin hydration properties 21
3.1 Sorption of water in keratinized tissue . . . . . . . . . . . . . . 223.1.1 The water sorption isotherm . . . . . . . . . . . . . . . 223.1.2 Our findings and the link to bioimpedance . . . . . . . 24
3.2 Trans-epidermal water-loss . . . . . . . . . . . . . . . . . . . . 253.3 Sweat measurements . . . . . . . . . . . . . . . . . . . . . . . 253.4 Ethical aspects of our study . . . . . . . . . . . . . . . . . . . 26
4 Memristance of human skin 29
4.1 Properties of memristors . . . . . . . . . . . . . . . . . . . . . 304.2 Memristors and bioimpedance . . . . . . . . . . . . . . . . . . 324.3 A few final remarks on our model . . . . . . . . . . . . . . . . 34
II Conclusion 37
5 Summary of my results 39
ix

x CONTENTS
5.1 Look ahead . . . . . . . . . . . . . . . . . . . . . . . . . . . . 41
Bibliography 48
III Papers 49

Part I
Introduction
1


Chapter 1
Anatomy and functionality of
the skin
The skin is the largest organ of the human body with a size of approximately1.8 m2 and a thickness ranging from 5 μm to as much as 1 mm or moreat the sole of the foot. The skin is, provided being properly hydrated, anelastic barrier controlling the evaporational loss of body water as well asprotecting vital organs against chemical and physiological substances of theenvironments.
Despite consisting of merely dead cells, the stratum corneum (SC), whichis the uppermost layer, holds many remarkable and interesting properties,and is interesting for many reasons: Trans-dermal drug delivery has beenstudied and developed since the famous attempt by Munk [1] . The SC barrierfunction itself is of central importance within the pharmaceutical industry aswell as in medicine, especially in the branches focusing on penetration and theunderstanding of skin diseases characterized by a deficient barrier functionsuch as atopic dermatitis [2, 3]. The construction of a barrier between thebody and environment is perhaps the foremost function of the skin.
The skin consists of three primary layers: Epidermis, dermis, and sub-cutis. The epidermis is the outermost layer and provides a chemical anddiffusional barrier towards the environment. The dermis is located beneaththe epidermis and is constructed from connective tissue, containing proteins,collagen, elastin and reticulum in a ground substance which is more or lessstructureless [4]. The dermis is much thicker than the epidermis and serves asa shield against any external mechanical influence. Beneath the dermis is thesubcutis, containing mostly fat tissue serving as a heat isolating shield. Thesubcutis is a basement layer that connects the skin to underlying structuressuch as bone and muscles.
3
4 Chapter 1.Anatomy and functionality of the skin
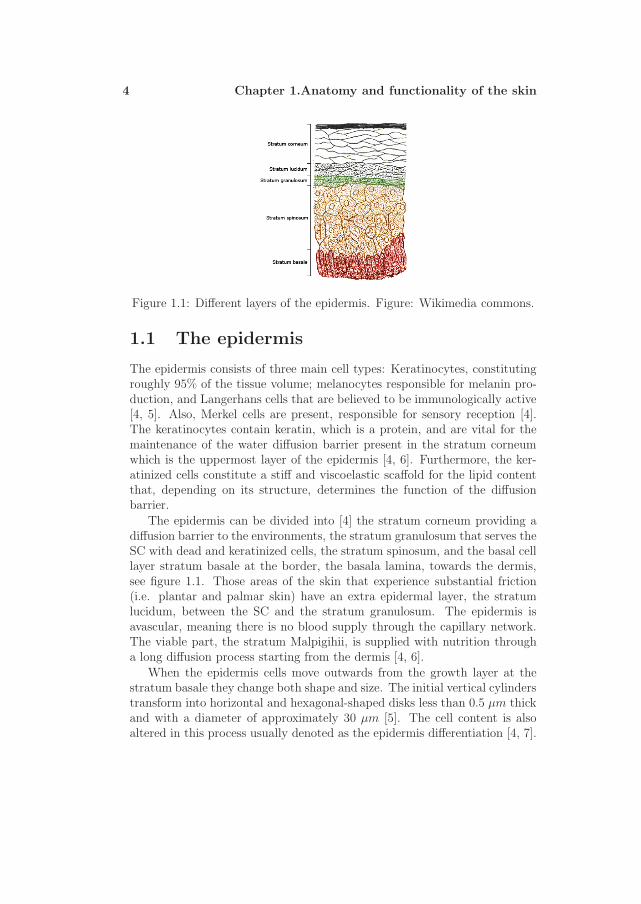
Figure 1.1: Different layers of the epidermis. Figure: Wikimedia commons.
1.1 The epidermis
The epidermis consists of three main cell types: Keratinocytes, constitutingroughly 95% of the tissue volume; melanocytes responsible for melanin pro-duction, and Langerhans cells that are believed to be immunologically active[4, 5]. Also, Merkel cells are present, responsible for sensory reception [4].The keratinocytes contain keratin, which is a protein, and are vital for themaintenance of the water diffusion barrier present in the stratum corneumwhich is the uppermost layer of the epidermis [4, 6]. Furthermore, the ker-atinized cells constitute a stiff and viscoelastic scaffold for the lipid contentthat, depending on its structure, determines the function of the diffusionbarrier.
The epidermis can be divided into [4] the stratum corneum providing adiffusion barrier to the environments, the stratum granulosum that serves theSC with dead and keratinized cells, the stratum spinosum, and the basal celllayer stratum basale at the border, the basala lamina, towards the dermis,see figure 1.1. Those areas of the skin that experience substantial friction(i.e. plantar and palmar skin) have an extra epidermal layer, the stratumlucidum, between the SC and the stratum granulosum. The epidermis isavascular, meaning there is no blood supply through the capillary network.The viable part, the stratum Malpigihii, is supplied with nutrition througha long diffusion process starting from the dermis [4, 6].
When the epidermis cells move outwards from the growth layer at thestratum basale they change both shape and size. The initial vertical cylinderstransform into horizontal and hexagonal-shaped disks less than 0.5 μm thickand with a diameter of approximately 30 μm [5]. The cell content is alsoaltered in this process usually denoted as the epidermis differentiation [4, 7].

1.1 The epidermis 5
The cells are keratinized, i.e. filled with keratin, which is a protein, andtherefore called keratinocytes.
Due to the anaerobe metabolic activity above the basala lamina, nutritionneeded for the cell processes is taken from the phospholipids which are themain constituent in cell membranes. Thus, the further up in the epidermis,the more decomposed cell membranes are expected. There is also a synthesisof new lipids, and those lipids that eventually are going to constitute thestratum corneum lipid phase are gathered in a special structure called thelamellar bodies or the Odland bodies [8, 9]. These bodies are membranecoated granules, and thus giving name to the stratum granulosum cell layer.
As the epidermal cells enter the stratum granulosum from beneath, theircell nuclei start decomposing and the cell membrane is replaced by a newand much more solid membrane, the corneocyte envelope [4] that is veryimportant in the water diffusion barrier located in the stratum corneum[10, 11, 12, 13, 14]. This last stage of the epidermal cell differentiation isa sort of a programmed cell death where the final product is the stratumcorneum cells and their lipid rich surroundings.
1.1.1 The stratum corneum and its barrier function
In this section I will shortly go through some of the main principles of the SCbarrier function, as this is also related to the skin hydration state that is oneof the main topics in this thesis. The stratum corneum is considered to bethe barrier to diffusion, being 10 to 30 cell layers thick [4, 15, 16, 17, 18], andits water hindrance is depending on the content and structure of extracellularlipids. There are two main components: a hydrophobic part (extracellularlipids), and a hydrophilic part (the keratin of the corneocytes), where thelipid part is particularly vital in the regulation of water transport throughthe skin [19]. The SC cells, the corneocytes, are “bricks” that are surroundedby extracellular lipids, that constitute approximately 10 − 20% of the totalcell volume [3, 19, 20]. Apart from the secretion of water from the sweatglands, an amount, depending on the environmental temperature, of about380 − 700 ml in total is lost through the skin every day [21]. This is theso-called perspiratio insensibilis, that is an unnoticed perspiration of waterfrom the skin. This provides the water needed as a plasticizer for the keratinin the corneocytes to remain their function and the total rate of water lossfrom the skin will be a measure of the barrier function. As the epidermal toplayer is constantly abraded due to mechanical and chemical environmentalconditions, a continuous renewal of the diffusion barrier is needed. In orderfor the SC to remain a constant thickness in time (not location), the addingof new SC material must be correlated with the pace of the shed of the surface

6 Chapter 1.Anatomy and functionality of the skin
layer, which is often referred to as the stratum disjunctum.The flat, protein rich hexagonal corneocyte cells are interconnected through
desmosomes and filled with keratin fibrils. The fibrils span the cell interiorhorizontally, and this robust net of threads hinders any expansion in thehorizontal plane when the cells take up water and swell, which then only ispossible vertically. According to Norlen et al. [22] the SC cells can swell20% vertically due to the elastic corneocyte envelope, but only a few percenthorizontally. This ensures area preserving, preventing skin ruptures and isnecessary for a functional barrier. The keratin in the corneocytes is charac-terized by a high sulfur content, and its high affinity for water [23].
The stratum corneum lipids provide the main barrier to diffusion of watersoluble substances across the epidermis and variations in the barrier func-tion is often due to alterations here [19, 24]. The lipid synthesis deeper inthe epidermis provides the SC with the proper lipids for constituting thisbarrier. Those lipids that are meant to constitute the SC lipid phase aregathered in the Odland bodies in the stratum granulosum, and the lipidsform a continuous compartment in contradiction to the more open spaces ofthe Malphighian layers of the epidermis [16, 25]. These membrane coatedgranules are smooth structures surrounded by a double membrane not verydifferent from the cell membrane [6]. The lipids therein are in a crystallinearrangement, and on the SC side of the stratum granulosum these bodiesextrude their lipid content into the extracellular space of the SC, that is, thelipids surround the corneocytes, making the SC a dense layer.
1.1.2 The Barrier properties
The lipids capable of forming biological membranes typically have one hy-drophilic and one hydrophobic part. The lipids will seek the most stablestate by placing the hydrophobic parts, that consist of long hydrocarbones,towards one another so that the hydrophilic parts face the extracellular waterin the SC. Hence, there are several water tight layers arranged on top of eachother [13], containing both non-polar and polar domains.
How well the stratum corneum is hindering diffusion of water depends on
• The length of the hydrophobic chains.
• The amount of saturation of the lipids.
• Temperature.
The chains are held tightly together by attractive van der Waals forces, andthe longer the chains, the less amount of water is able to penetrate. As the

1.2 Nail and hair 7
attractive van der Waals forces are only effective on short, atomic diameterscales, the amount of unsaturation (double bonds) of the lipids will influencethe barrier density [19]. Chains with a large amount of double bonds willnot be able to be packed densely enough since the double bonds will induce“bends” on the chains. This means that the van der Waals forces can nolonger contribute to tighten the barrier, and thus increasing saturation ofthe lipids will induce a more water tight envelope of the body.
The temperature is very vital in this sense. Lipids in the stratum corneumcan exist either in a crystalline state or a liquid crystalline state [19]. Iftemperature is sufficiently low, i.e. below a certain transition limit, thelipids turn into a crystalline form [19, 26] which is non-permeable to watercontrary to the more transparent liquid form. The transition temperaturedepends on the composition of the lipids as well as their chain lengths. Thelonger the lipid chains, the higher the transition temperature. Also, if thechains are saturated, the transition temperature increase. For human cells,the transition temperature for lipids is in the range from about 0 − 40◦C,which corresponds to chain lengths of roughly 18 carbon atoms [19]. However,as these lengths are found to increase substantially from the basal cell layerto the SC, the transition temperature can be expected to be higher thannormal skin surface temperature [19]. In the SC the lipids are of a length of30 C-atoms or more [27], and thus SC is in the water tight phase at normalskin and environmental temperatures.
1.2 Nail and hair
Both nail and hair, along with SC, are parts of the family called keratinizedtissues [28]. Nail tissue is composed of two main constituents which arethe dorsal (upper) and ventral (lower) nail plate [29, 30]. The dorsal plateconsists of flat, keratinized and dead cells that are oriented in such a way thatthe shortest typical diameter is perpendicular to the nail surface. Studies ofnail by electron microscopy have shown that there are very tight-junction-likecontacts between the cells that essentially are glued together [6].
The ventral part lies beneath the much more stiff dorsal top, and is aless tightly bound structure allowing flexibility of the nail. The orientationof the fibrils are more ordered than in the dorsal top and is perpendicular tothe growth direction [29], preventing the nail plate from being split all theway down to its tunnel from where it originates. Mechanical strength of thenail plate, which is a very convenient property for nails, is ensured by thetwo main curvatures of the plate, one fairly large in the direction of growth,the other, much shorter, horizontally but perpendicular to the direction of

8 Chapter 1.Anatomy and functionality of the skin
growth. A curved sheet of paper (i.e. cylinder shaped) has a much greatermechanical stability than a correspondingly flat, and pays as an illustrationof how nail composition ensures a stiffness suitable for the intended use.
Hair fibers consist of cortex cells that are protected by about 10 cuticlecell layers, concentrically oriented around them. The building blocks arekeratinized cells that are cemented tightly together and filled with proteinfilaments [3]. The structure is relatively dry and compact, and the hair fibersare the final result of a differentiation process, just as in nail and SC [4, 6].The cells in the hair follicle are pushed outwards, through a tight tunnel,and eventually run through a programmed cell death. The cells of hair fibersare about 120 μm long and elongated in shape in the direction of growth.The elongated shape is due to the squeezing of the cells as they are pushedout of a very rigid and tight hair follicle-tunnel. The cortical cells are heldtightly together in a substance that is present between the cortex membranes.Within each of the cortical cells, there is a micro filament matrix structurecomposed by filaments. These filaments are constructed from three α- helixesthat are coiled into a larger coil, similar to the composition of an old fashionrope. This provides a robust structure, especially in the longitudinal direction[3].
1.3 Sweat ducts
The human skin has two types of sweat ducts. The by far common most isthe ecrine. These ducts are distributed mainly all over the skin, and theirmain function is to spread water onto the skin surface, contributing to thetemperature regulation of the human body as the water evaporates.
The highest concentration of these ducts are found in palmar and plantarskin sites where hair is absent [4], and one way to think of this is thatthis increased density is to ensure a proper and necessary hydration of thehands and the sole of foot to give a decent grip needed for running andclimbing and so on. The ecrine ducts are long, thin tubes, originating indermis or even in subcutis. In the SC the ducts are spiral shaped, a shapethat ensures the ducts being squeezed to close when SC swells, preventing toomuch water entering within the integument barrier or that essential nutrientsbeing washed out of the skin. Contrary to sweat activity at other skin sites,the palms and soles are thought of to produce sweat only due to sensoryor mental stimulation, and not due to thermal activity [31]. This kind ofsweat activity is often called exosomatic electrodermal response (EDR) [32]and will be treated in Paper VI considering electrode gels used for sweatmeasurements based on skin conductance recordings.

1.3 Sweat ducts 9
The other type of sweat ducts are the apocrine that segregate fluids fromthe upper part of the hair follicle where the duct opening is located. Bacterialdecomposition of this secreted material results in a more or less personal odor.The apocrine ducts are mainly found around genitals and in the axilla [4].

Chapter 2
Electrical properties of human
tissue
In this chapter I will try to give a short overview of passive electrical proper-ties of tissue, that essentially is the key focus within the field of bioimpedance.In particular, the electrical properties of keratinized tissue will be paid at-tention since I in this thesis am not much interested in things being alive,but actually only care about the thin and dead envelope of the human body.
Electrical admittivity of human tissue may be predominantly conductiveor capacitive, or a combination of these, depending on tissue type, availabilityof charge carriers, frequency of the applied electric field, and is carried out byions, dipoles or electrons, as well as holes (semiconductor) [33]. Electrolytes,both intra and extracellular, are responsible for a conductivity of the orderof 1 S/m, and are considered to be more or less frequency independent upto roughly 10 MHz [34]. The dominant factor regarding charge carriers inbiological materials are ions, but also purely electronic currents have beenreported to take place, for instance in DNA molecules [33]. In keratinizedtissues, as will be the main topic of interest in this study, admittivity is verymuch dependent on the amount of water therein and to what extent it isbound to the tissue structure [35, 36, 37]. As water is highly polar it can bebound to other polar groups, for instance in proteins, with a strength thatvaries from very bound (essentially a solid phase) to more or less free water,and water can be regarded as the most relevant parameter concerning theelectrical properties of such protein-rich tissue.
The high relative permittivity of water is perhaps the main reason of itsdissociative properties due to a weakening of the electrostatic forces betweenpolar biological molecules. Since binding of water in biomaterials varies fromvery firm, with water practically immobile to more or less free water, itcontributes to both ionic and dielectric admittivity. Protonic conductivity is
11

12 Chapter 2.Electrical properties of human tissue
HFLF
Figure 2.1: Principle of high and low frequency current pathways in tissue.Figure redrawn from [32].
purely DC and is carried out by the H+ and H3O+ cations where the protons
are hopping from neighboring water molecules by a tunneling effect that ismuch faster than ordinary ion mobility in an electric field, since the latter isslowed by viscous forces.
2.1 Cell membranes and tissue
The polar lipids (i.e. with a net dipole moment) are the most abundant con-stituents of the capacitive cell membrane, which is a necessary condition forliving cells by keeping the interior constituents in a controlled environment.Cell membranes are thin films, 7 nm thick, consisting of phospholilpids, andhave a very low conductivity, but on the other hand a high capacitance, thatis assumed to be frequency independent [32]. However, admittance across acell or a suspension of cells is highly dependent on frequency, and figure 2.1reflects the capacitive versus the resistive nature of cells and tissue. At lowfrequencies, current must pass extracellularly as the cells will have a shadoweffect because the poorly conducting cell membrane forces the current to goround the cells. This may induce very narrow current paths where the currentdensity can be much higher than the average in the volume. As frequency isincreased, current passes also through the cells due to the capacitive shuntingof the cell membranes.
Tissue homogeneity, or more likely the lack of it, is important regardingcurrent paths in human tissues, and from an electrical point of view, tissue isas good as always inhomogeneous. Such an anisotropy is present all the wayfrom lipids and cell membranes at a micro level up to organs and long muscle

2.1 Cell membranes and tissue 13
102 104100 106 108 1010
f [Hz]
100
102
104
106
108
0.1
1
10
100
Re
lati
ve
pe
rmit
tiv
ity
σ’
σ’ (S
/m)
α
β
γ
Figure 2.2: Dispersions in human tissue. Figure taken from [32].
fibres, and would highly influence the recorded signals at low frequencies, butthe effect of it is more or less absent as the frequency is very high.
Polarization mechanisms
In human tissue, there are a high number of frequency-dependent admit-tance mechanisms, and these were sorted out and classified in dispersions bySchwan in the 1950’s [38] and are illustrated in figure 2.2. The dispersions aredrops in relative permittivity over well-defined and sometimes very narrowfrequency ranges. Permittivity of biological materials typically decrease asthe frequency is increased as charges (i.e. dipoles) are too slow to follow thechanges in the applied electric field. The most distinct dispersions are thoseof cell suspensions and other simple biological systems. In tissue and skin,however, complexity is much higher, yielding a high variety of polarizationmechanisms, and dispersions are much broader in the frequency range andoverlap, sometimes giving a continuous fall with increasing frequency.
Literature reports on at least four different dispersions or dominatingpolarization mechanisms in human skin, and some of the mechanisms behindare due to [32]: the counter-ion effect at the cell surface (α), Maxwell-Wagnerpolarization at interfaces between different dielectrics and capacitive chargingof cell membranes (β, δ), large and small polar molecules (α, β, δ ), and dueto the dipolar nature of the water molecule (γ).
In a Wessel plot, the imaginary part of the electrical recordings are plottedas a function of the real part, and in 1940 K.S. Cole proposed an empirical

14 Chapter 2.Electrical properties of human tissue
απ/2
ω
R∞
−Im(Z)[Ω]
R0 Re(Z) [Ω]
Figure 2.3: Wessel plot of the Cole equation.
equation to describe tissue impedance
Z = R∞ +ΔR
1 + (jωτ)α, ΔR = R0 − R∞, (2.1)
where R∞ is the impedance in the high frequency limit, often called the seriesimpedance, R0 the corresponding impedance at DC currents, ω is the signalfrequency and τ is the characteristic time constant of the system of interest.The entry of this simple equation was strongly motivated by the fact thatmany biological systems produce circular arcs in impedance space, howeverwith a locus located beneath the real axis. A typical illustration of such adepressed arc is shown in figure 2.3.
If α = 1, the Cole equation gives a full semicircle in the complex Wes-sel plane with its center on the real axis, and there is now also a uniquecorrespondence to physical elements in equivalent models of the biologicalmaterial, in this particular case consisting of two (ideal) resistors and one(frequency independent) capacitor that often may be given physical inter-pretations such as current pathways through extra -and intracellular tissueand capacitive current pathways of lipid cell membranes.
However, in more complex tissue, α < 1, and there is no longer a di-rect relation to pure physical elements, but the Cole equation now includeswhat is often called a constant phase element (CPE) that is not actuallya physical component and can not be realized in terms of a finite numberof traditional passive circuit elements (RLC), but is related to the complextheory of dielectric dispersions and often thought of as a distribution of timeconstants.

2.2 Keratinized tissues 15
2.2 Keratinized tissues
Keratinized tissue is composed of membrane-coated cells that are cementedtightly together, and the cells are normally arranged in layers. Electricalimmittance across such a layer is dependent on how the cells are connected,the amount of intercellular space, the hydration state as well as any shuntingmechanism through channels such as sweat ducts perforating the entire SC.
The most important parameter governing the admittivity of keratinizedtissue is the amount of water therein, and admittivity typically shows anexponential dependence with relative uptake of water [35, 36, 37]. A possibleexplanation to the behavior of conductance upon the amount of water is sug-gested in the early work of Algie [39], and is connected to “proton hopping”between water molecules. As water content increases, water is eventuallymore loosely bound, and the binding energy to hydrophilic groups is re-duced. Along with shorter average distance between the water molecules,this yields a rapid and exponential increase in conductance.
The SC, hair and nail are relatively dry compared to other bodily tissues.For the SC this is particularly true in the uppermost parts, and so it willdominate impedance with an increased dominance as frequency is lowered,since stratum corneum in general is a poorly conducting layer on top of a wellconducting viable skin. It has been shown, performing finite element analysis,that at frequencies of the order of 10 Hz, the SC would totally dominate themeasured tissue information, but at frequencies above 100 kHz, less than 10%of the received information stems from the top epidermal layer, and as a ruleof thumb skin impedance is dominated by SC at frequencies below 10 kHz [40,41]. Hence, an increase of frequency then generally leads to measurements ondeeper tissue layers. However, this will very much depend on the hydrationstate of the skin, and electrode configuration such as geometry and size. Skinimmitance also varies between different sites on the skin as well as betweenindividuals [32]. In particular, sweat activity and relative humidity in theambient air will play a key role due to increased duct filling and hydration ofthe SC. Increased RH will also result in increase of water bound in nail andhair, and in general the electric properties of nail and hair resemble thoseof SC, although there are reported on some differences in nail concerninglow frequency susceptance values [37]. Different sorption properties, as seenin Paper IV, may also influence on how these tissues respond to an appliedelectric field.
Data on skin impedance have been retrieved by Yamamoto and Ya-mamoto [42] by means of tape stripping, and relevant parameters are shownin figure 2.4. These data again illustrate the following important point: Asthe frequency increases the contributions of the SC on the recorded signals
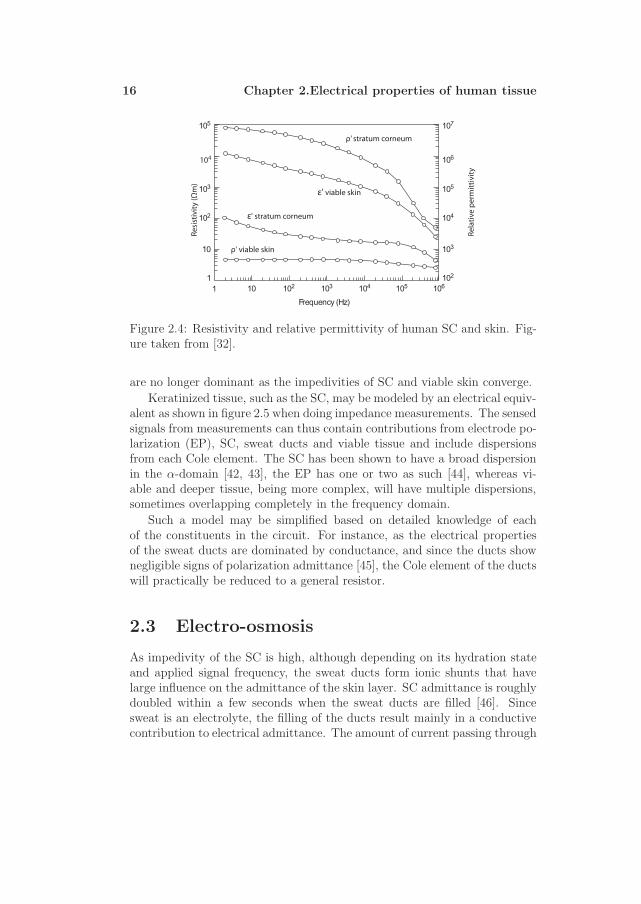
16 Chapter 2.Electrical properties of human tissue
1
1
10
102
103
104
105
102
103
104
105
106
107
10 102 103 104 105 106
Frequency (Hz)
Rela
tive
perm
ittiv
ity
ρ' viable skin
ε’ viable skin
ε' stratum corneum
Resi
stiv
ity (Ω
m)
ρ’ stratum corneum
Figure 2.4: Resistivity and relative permittivity of human SC and skin. Fig-ure taken from [32].
are no longer dominant as the impedivities of SC and viable skin converge.
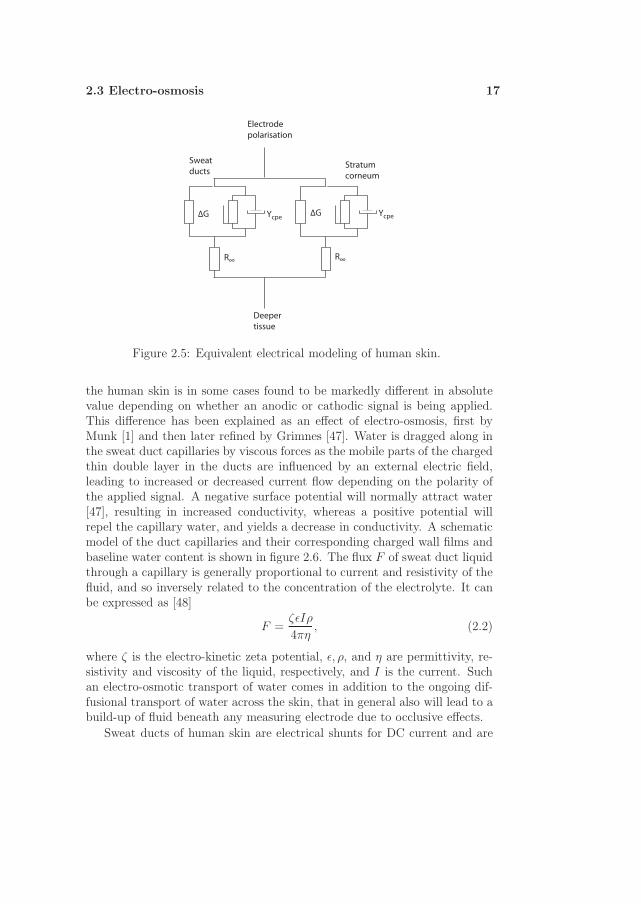
Keratinized tissue, such as the SC, may be modeled by an electrical equiv-alent as shown in figure 2.5 when doing impedance measurements. The sensedsignals from measurements can thus contain contributions from electrode po-larization (EP), SC, sweat ducts and viable tissue and include dispersionsfrom each Cole element. The SC has been shown to have a broad dispersionin the α-domain [42, 43], the EP has one or two as such [44], whereas vi-able and deeper tissue, being more complex, will have multiple dispersions,sometimes overlapping completely in the frequency domain.
Such a model may be simplified based on detailed knowledge of eachof the constituents in the circuit. For instance, as the electrical propertiesof the sweat ducts are dominated by conductance, and since the ducts shownegligible signs of polarization admittance [45], the Cole element of the ductswill practically be reduced to a general resistor.
2.3 Electro-osmosis
As impedivity of the SC is high, although depending on its hydration stateand applied signal frequency, the sweat ducts form ionic shunts that havelarge influence on the admittance of the skin layer. SC admittance is roughlydoubled within a few seconds when the sweat ducts are filled [46]. Sincesweat is an electrolyte, the filling of the ducts result mainly in a conductivecontribution to electrical admittance. The amount of current passing through
2.3 Electro-osmosis 17
R∞R∞
ΔG ΔGYcpe Ycpe
Sweatducts
Stratumcorneum
Electrodepolarisation
Deepertissue
Figure 2.5: Equivalent electrical modeling of human skin.
the human skin is in some cases found to be markedly different in absolutevalue depending on whether an anodic or cathodic signal is being applied.This difference has been explained as an effect of electro-osmosis, first byMunk [1] and then later refined by Grimnes [47]. Water is dragged along inthe sweat duct capillaries by viscous forces as the mobile parts of the chargedthin double layer in the ducts are influenced by an external electric field,leading to increased or decreased current flow depending on the polarity ofthe applied signal. A negative surface potential will normally attract water[47], resulting in increased conductivity, whereas a positive potential willrepel the capillary water, and yields a decrease in conductivity. A schematicmodel of the duct capillaries and their corresponding charged wall films andbaseline water content is shown in figure 2.6. The flux F of sweat duct liquidthrough a capillary is generally proportional to current and resistivity of thefluid, and so inversely related to the concentration of the electrolyte. It canbe expressed as [48]
F =ζεIρ
4πη, (2.2)
where ζ is the electro-kinetic zeta potential, ε, ρ, and η are permittivity, re-sistivity and viscosity of the liquid, respectively, and I is the current. Suchan electro-osmotic transport of water comes in addition to the ongoing dif-fusional transport of water across the skin, that in general also will lead to abuild-up of fluid beneath any measuring electrode due to occlusive effects.
Sweat ducts of human skin are electrical shunts for DC current and are

18 Chapter 2.Electrical properties of human tissue
+
+
+
+
+
+
+
+
+
+
+
+
+
+
+
+
+
+
+
+
+
+
Skin
Sweat
duct
Mobile part of
double layer
Alternating
water filling
Applied potential
Figure 2.6: Schematic model of sweat ducts in human skin.
not responsible for the capacitance of the SC, due to the lack of counterion re-laxation phenomena [45]. In the light of the discussion in Paper V, the sweatducts can in some cases be memristive rather than conductive (resistive),due to the memory effect of the resistance upon the amount of charge havingpassed the duct. The modeling and investigation of sweat duct conductivityhas been one of the main subjects in this thesis.
2.4 Influence from electrodes
Electrodes used for electrical immittance measurements will practically al-ways influence the signals that are measured, and so a proper choice of typeis very vital [32, 49, 50]. By onset of electrodes on the skin surface, waterwill immediately start building up underneath it due to the water concentra-tion profile present in the SC. This process will generally lead to increasedadmittance with time, and an important question in this manner is when astable state is reached, or more likely: To what degree does one eventuallyhave stable conditions?
Not only the amount of water building up beneath the electrode, but alsothe characteristic time for this process will in general be important for theresult. The rate of build-up will typically be largest just after onset, and thendecreases with time, reflecting the nature of many physical processes wherethe rate of change is proportional to the concentration difference betweenthe present and equilibrium value of the actual physical quantity. Thus, onedoes not measure on the skin “as it was“ prior to onset of the electrode formonitoring. Still, it is the pre-occlusional value that is most representative

2.4 Influence from electrodes 19
for the actual hydration state of the skin, and this is a challenge in mostset-ups for skin hydration recordings.
Also, the initial hydration state of the skin will influence the immittance,and thus environmental conditions such as RH and temperature will gov-ern the content of water prior to any electrode onset. This in particularmeans that it is not possible to construct an electrode that just stabilizes thehydration level beneath the electrode.
Electrode gels are constructed with the aim of establishing an electricalcontact between the electronic conduction in any metal wire and the rel-atively dry SC layer. Depending on the relation between the water vaporpressure of SC and the gel, water will flow either to or from the SC just af-ter electrode onset. Furthermore, electrolytic concentration of the electrodegel used as the contact medium plays a significant role. Depending on thisconcentration the skin will be wetted or dried out due to osmotic effects. Ahigh electrolytic concentration in the gel will likely induce an increased watertransport from deeper skin, containing much more water than the dry toplayer, towards the surface and so results in increased skin admittance. For adry metal plate electrode, admittance increases instantly after onset due to awater contact film build-up between the metal and the SC surface. Wet anddry gels can result in both increased or decreased admittance, depending onwhich way there is a net transport of water. However, wet gels will usuallygive a markedly jump in admittance due to their rapid wetting of the SC.Using wet hydrogels with low viscosity opens for the possibility that the gelpenetrates the sweat ducts that normally are empty or partly filled [47]. Sincesuch gels may have much higher conductivity than the sweat electrolyte andalso open for an increased duct filling, the result is an increased admittivityof the skin. And as the ducts are believed to have negligible polarization, thefactor influenced is the conductance. Especially in skin conductance mea-surements, where among others sweat activity can be monitored using a lowfrequency set-up [51], such gel behavior would for instance yield a decreasein skin conductance during a sweat response, due to the replacement of highconductive gel with the lower, but still highly conductive sweat as seen inPaper VI. Yet, as gels usually have a high conductivity at low frequenciescompared to the SC, individual differences in gel conductivity will thereforenot be expected to influence low frequency conductance unless the gels areable to penetrate down in the ducts, giving an effective change in filling.
Occlusion over time may not necessarily only influence the SC hydrationstate (i.e. a low-frequency phenomenon), but may also induce changes inimmittance in the high-frequency area, normally ascribed to effects found indeeper tissue. Irritation and altered water content are possible explanations,but still only at a speculative level, as discussed briefly in Paper VI.

20 Chapter 2.Electrical properties of human tissue
Electrode size and shape, as well as the distance between them will alsoaffect the final outcome, and I refer to Grimnes et al. (p. 190-191) for a morerigorous treatment of this subject [32].
In Paper VI the role of different electrode choice on the final result for skinconductance measurements and sweat activity has been studied, comparinglow frequency skin conductance recordings with the water sorption propertiesof the gels of the electrodes.

Chapter 3
Skin hydration properties
As the hydration state of the epidermal stratum corneum is vital for a properfunction as well as visual aspects of the skin, a large variety of techniques andapproaches have been carried out with the purpose of giving better estimatesof skin water content. The methods include, among others, microwave, spec-troscopic, gravimetry or by means of nuclear magnetic resonance [32]. Hence,a direct, simple, low-cost, non-invasive and reliable method for estimating hu-man SC hydration will be of great interest and has for over 30 years beendeveloped within the field of bioimpedance [52, 53, 54, 55, 56].
Although it has been challenging to reach consensus on how to get the bestestimate of skin hydration, a low and single frequency susceptance methodwill be suitable if the aim is to measure superficial hydration such as in thehuman SC [40, 56]. Since the sweat ducts are predominantly conductive,the proper electric parameter to be used for SC hydration assessments is lowfrequency susceptance or AC conductance [32]. However, if one wants to findabsolute water content (as gram water per gram dry skin per unit area) acalibration of such a susceptance based hydration method against the weightof SC water content must be carried out, as is attempted gravimetrically in
vitro in Martinsen et al. [36]. In vivo the water concentration profile acrossthe SC, that is present due to the ongoing transport of water, complicatesthings further. The possibility of estimating absolute water content in vivo
from low frequency electrical measurements is a challenging task, at leastto a good precision, and Paper I represents a step in that direction. Adifferent approach is tested out in Paper II where measurements of perspiratio
insensibilis, often called trans-epidermal water-loss (TEWL), are combinedwith water desorption properties of SC in vitro to yield an estimate of theaverage and stable state in vivo SC water content.
21

22 Chapter 3.Skin hydration properties
3.1 Sorption of water in keratinized tissue
Keratins have, as we have seen, an important function forming the interfacebetween the bodily interior and the external environment. However, theiroverall functions may be influenced by ambient factors that may alter theirnature. In particular water is important in this manner due to its high dipolenature and the ability of forming bonds with side-chain-endings in keratin,and it is known that SC needs a content of roughly 10% water in orderto remain its primary functions [57]. Water has a very strong influence onthe physical properties of hair, nail and SC, and for instance the elasticitymodulus changes with a factor of about 100 from dry to humid conditions[29, 58]. The electrical dependence upon water content is already described,and further details can be found in [32].
3.1.1 The water sorption isotherm
A common way to present sorption data of water into keratinized tissue isby means of sorption isotherms, which give the amount of water that can becontained at a given relative humidity when the temperature is fixed.
A typical example is shown in figure 3.1 for keratinized tissue, others arefound in [29, 57, 59, 60], where the SC curve shows a sigmoid shape thatis more profound compared to those of hair and nail. Such isotherms aretypical for tissue rich on proteins [3]. As the relative humidity is at its highend, SC takes up considerably more water than the other two types of tissue,an effect that probably is ascribed to the restrictions upon swelling for hairand nail as they have stronger internal constructions and filament networks[6, 29, 62]. The isotherms provide knowledge about the interactions thattake place between water and different chemical groups in the tissue underinvestigation, and Paper III is concerned with some of these questions.
The increase or decrease in water uptake will in general be diffusion con-trolled as long as the temperature is above a certain limit, Tg, that definesthe transition between more complex diffusion-relaxation sorption processesand processes governed by Fick’s laws of diffusion. For keratinized tissues,Tg is below 20◦ C [63, 64], and so the amount of water sorbed, M(t), as afunction of time, is a solution of Fick’s 2. law of diffusion [64]
M(t)
M∞
= 1 −8
π2
∞∑m=0
1
(2m + 1)2exp
[−
D(2m + 1)2π2t
d2
], (3.1)
where M∞ is the mass when the sample is in a stable state with its environ-ments, D is the diffusion coefficient, assumed to be concentration indepen-dent (which is not always a good approximation as relative humidity is much

3.1 Sorption of water in keratinized tissue 23
0 20 40 60 80 1000.9
1
1.1
1.2
1.3
1.4
1.5Relative water uptake of keratinized tissues during sorption
Re
lative
wa
ter
ga
in
Relative humidity (%)
SC abs
SC des
Nail abs
Nail des
Hair abs
Hair des
Figure 3.1: Typical water sorption isotherms for keratinized tissue. Figuretaken from Johnsen et al. [61].
altered, cf. Paper III), and d the thickness of the sample. In contrast tothe isotherms described earlier, the time course given in equation (3.1) willprovide information about the rapidity of water sorption into the specimenof interest, such as SC, hair and nail. This will for example be relevant whenambient RH changes, inducing an altered hydration level of the SC, or whenelectrodes are attached, with the inevitable effect of hydration or depletionof the underlying SC.
It is worth noticing that isotherms in general are in vitro results. In vivo
there is a different situation as there is a water concentration profile acrossthe SC thickness that is responsible for the never ending flow of water throughthe human skin. Also segregation of sweat will influence in vivo sorption ofthe SC.
When water is absorbed in SC, it is typically bound as three differentphases: strongly bound, bound, and bulk water, although their respectiveamounts vary in the literature [3, 59, 60, 65]. The characteristic time forSC to reach its equilibrium state will be different depending on which of thethree types of water that is being bound. This is further discussed in PaperIII, where the general sorption characteristics of SC were investigated.

24 Chapter 3.Skin hydration properties
3.1.2 Our findings and the link to bioimpedance
In our sorption measurements, using a DVS Intrinsic setup (SMS Ltd, Lon-don, UK) we found no hysteresis of significance for the SC samples from heeland breast. This means that the sample contained the same amount of water,having reached its equilibrium state during absorption and desorption as longas the relative humidity of the ambient air was fixed. This result is in contra-diction to a previous study where the same setup was used, however with alower resolution as discussed in Paper III. If present, a hysteresis could havebeen an indication of structural changes of the tissue during a sorption cycle,i.e. giving altered water holding capacities. However, in Paper IV, where thesorption properties of nail, hair and SC, all belonging to the keratinized tis-sues, were investigated, a hysteresis was visible for hair and nail. Seemingly,keratinized tissues responded differently to changes in relative humidity andshowed different abilities to bind water, a property that most likely can beexpected to influence the output in i.e. immittance measurements.
The observed differences may, at least in part, be ascribed to differencesin structure as hair and nail cells are formed by restrictions imposed by theshape of their anatomical site, whereas SC cells do not have such restrictions,and hence are able to swell, at least vertically [3, 22, 29].
The triphasic behavior of the absorption constant of SC is perhaps themost interesting finding in our study in Paper III. In short, this means thatthe time needed for SC to reach equilibrium with the environments in theDVS measurement chamber was highly dependent on the relative humid-ity of the surrounding air. We propose as a potential explanation to thisphenomenon the possibility of the SC keratin filament network within thecorneocytes to exist in various “phases” [66]. The observed increase in ab-sorption time constant τ with water content is somewhat contra intuitiveas the diffusion constant satisfies D ∝ τ−1 and will normally increase in amedium as its water content rises. We believe that this can be explained bythe non-hydrophilic behavior of the keratin filaments in the SC as is discussedin further detail in Paper III. This pattern in absorption time constants ispresent both for heel and breast samples, although with somewhat differ-ent curve forms. It should be commented, however, that since these twosample types had been stored very differently prior to the measurements, acomparison is of reduced value.
As water is highly influencing tissue admittivity, and water bound indifferent ways and configurations (water strongly bound to polar groups givedielectric properties, bulk water contribute to ionic conductivity) this is alsoone of the key questions within bioimpedance, as more detailed knowledgemay contribute to more detailed explanatory models without loosing the high

3.2 Trans-epidermal water-loss 25
precision that usually is present for more overall descriptive models based onequivalent circuits.
3.2 Trans-epidermal water-loss
Water can be lost from the skin surface both by sensible and insensible perspi-ration, where sweating is the main contributor to the former, whereas passivediffusion processes are dominant in the latter. Trans-epidermal water-loss(TEWL) includes both as it is the quantity of water passing through the epi-dermis, starting from the highly hydrated viable tissue of the human body.TEWL is a useful measure of the insensible water loss, and hence the SC bar-rier function as long as sweating is not present. One then measures purelydiffusional water loss. A reduced SC barrier function will generally lead toincrease in TEWL-values as water then diffuses more rapidly from deeperskin towards the skin surface from which it evaporates. However, TEWL ismuch sensitive to the relative humidity in the surrounding air as well as aseries of other factors such as temperature, anatomical sites, skin diseasesand so on [3].
3.3 Sweat measurements
Sweat activity on palmar and plantar skin sites are very sensitive to psycho-logical stimuli [32, 51], and is in general not related to thermal sweating dueto i.e. physical activity, but rather psychological factors such as conscious-ness or stress-related situations [31]. Such an activity is called electrodermalactivity [32] and has been studied since the late 19th. century. Later, theorigin of psychogalvanic phenomenon was suggested to be in relation with thesweat ducts [67]. In the recent decades, electrodermal measurements havebeen studied also in connection with the field of psychophysiology [68].
By means of TEWL-measurements, the amount (given in liter pr minpr area) of sweat evaporating from the skin can be estimated, and so yielda quantitative estimate of the sweat production. This amount is not thesame as the sweat filling of the capillaries that is more related to electro-dermal measurements. Skin conductance levels are hence more related tosweat gland activity and capillary filling than sweat evaporation from theskin. Conductance is in general a better measure of the sweat activity thanresistance since conductance is related to susceptance and a parallel setup,whereas resistance correlates to reactance and a corresponding series circuit.In the human skin the ionic conductivity in the sweat ducts is in parallel with
26 Chapter 3.Skin hydration properties
the remaining parts of the SC where the capacitive parts are found [45, 56].Tronstad et al. has reported on a portable instrument capable of quan-
tifying sweat activity by means of low frequency monopolar conductancemeasurements [51]. Capacitive contributions will not be of interest sincethey in general are related to the SC hydration and not duct filling [45].Clinically, these types of sweat recordings can be used as a diagnostic toolas well as in treatments of diseases such as hyperhidrosis, where the sweatlevel of the patient is elevated. The sweat pattern of hyperhidrosis is partlyunknown [51, 69], and so objective methods for studying these patterns areimportant. A part of such a set-up involves also the understanding of theinfluence from different electrodes on the final measured electrical signals.This was the main motivation for the studies performed in Paper VI.
3.4 Ethical aspects of our study
In studies where measurements are performed on human test subjects aswell as with animals, it is, depending on how much the test subjects canbe expected to be exposed to hazards as well as the sensitive informationneeded, normal practice to apply the local ethics committee for approvalprior to the initiation of the study. In the measurements that have beenperformed in our study, including both the preparation of SC samples withthe dermatome “cheese knife” as well as in the conductance measurementswith the Sudologger [51] and the Solartron 1260+1294 equipment, we havecome to the conclusion that an application to the regional ethics committeewas not required prior to the onset of these studies.This can be argued forbased on the following knowledge on which aspects our studied contained aswell as the actual equipment that was used.
• The dermatome (Braun, Tuttlingen, Germany), that was used to pre-pare the SC samples used in Paper II, Paper III, and Paper IV, isCE marked, meaning that it fulfills the EU regulations with respect tosecurity, health and environmental control.
• In Paper VI, where electrode properties were monitored, both instru-ments used (the Sudologger and Solarton setup) are CE marked, en-abling secure measurements on the group of volunteer test persons.Furthermore the test persons were well informed prior to the initiationof the measurements, and were allowed to abort the study at any timewithout any reason for this.
• All the methods that have been carried out in this thesis have beennon-invasive. The dermatome used to harvest SC from the test subjects

3.4 Ethical aspects of our study 27
had a high precision, ensuring a non-invasive procedure where only theouter layers of the heel SC were removed.
• No measurements were performed on test subjects that can be regardedas particularly vulnerable. The test subjects involved in our studieswere mainly gathered from our scientific milieu.
• No sensitive personal information was gathered or stored during ourdifferent studies.


Chapter 4
Memristance of human skin
In this chapter I will introduce memristors as a potential new building blockin circuit modeling of electrical properties that are found in biological sys-tems. The emphasis will be on possible applications within the field ofbioimpedance. The memristor is probably equally fundamental as it is un-common in electric circuit theory. Predicted to exist from purely theoreticalsymmetry arguments [70], the memristor, as a passive physical component re-mained unrealized until quite recently when scientists at the Hewlett-Packardlab constructed it as a nano-device that was in accordance with conventionalsemi-conductor theory [71].
Based on the four fundamental circuit variables; current i, voltage v,charge q, and flux φ, six distinct relations can be found. Two of them are thedefinition of electric current q(t) =
∫ t
−∞i(t′)dt′ and Faraday’s law of induc-
tion φ =∫ t
−∞v(t′)dt′, and in addition the definitions of the four axiomatic
circuit elements, which are the resistor R = dvdi
, the capacitor C = dq
dv, the
inductor L = dφ
di, and finally the memristor M = dφ
dq. The complete set of
combinations is illustrated in figure 4.1. As we see from the diagram, memris-tors are fully different from the other and more traditional circuit elements.This means that no combination of passive RLC circuit components can re-place the memristor, no matter how non-linear these resistors, capacitorsand inductors might be. An extra circuit component may not sound thatspectacular, but consider you have been living for 40 years with shoes, socksand trousers, but no sweater available, and then suddenly get one. Initially,it may be hard to use it properly (mixing it up with the other three) and tosee its final potential, but who knows how nice it eventually may be if thesweater also turns out to be of a convenient size.
29

30 Chapter 4.Memristance of human skin
v
i q
∫
φ
φ = v dt
q=∫i dt
M
CR
L
Figure 4.1: Symmetry diagram that shows the need of introducing memris-tors.
4.1 Properties of memristors
Although defined as such, memristors do not necessarily involve explicit mag-netic fields. This is easily seen by realizing that memristance, in terms ofFaraday’s law of induction, can be rewritten as
M(q) =dφ
dq=
v(t)
i(t), [Ω], (4.1)
and so looks very much like ordinary resistance, which it also is under cer-tain circumstances. When Strukov et al. discovered the memristor (oftencalled Maxwell’s hidden solution), or more precisely they found a memristivesystem, they took advantage of the fact that memristors require a nonlinearrelationship between the integrals of current and voltage, and not magneticfields explicitly. Earlier searches for memristors probably involved magneticsystems, which was a natural starting point considering how memristors aredefined. This search in “wrong places” is likely to be one of the main reasonswhy memristors, although equally fundamental as the RLCs, were undiscov-ered for an additional century after Maxwell came with his famous equations.
Memristors can be generalized into memristive systems, and so was donein 1976 by Chua [72]. These systems can be defined as
v = R(x)i (4.2)
dx
dt= f(x, i), (4.3)
which actually is a generalization of Ohm’s law where v is the voltage, theresistance, R depends on the state variable x whose time derivative is in turn

4.1 Properties of memristors 31
a function of itself and the current i. The system above equals Strukov’s [71],but can also be further generalized with additional state variables (not justx).
Letting charge be proportional to the state variable, x, resistance will bea function of the amount of charge having passed the element and in gen-eral not a constant, which furthermore results in a non-linear iv-characteristicparametric curve. In other words, a non-linear version of Ohm’s law. The re-sistor is therefore now said to have some memory since its resistance dependson past events, and from that the name memristor arose quite naturally. Asmemristors are rather uncommon in traditionally circuit theory, it may beof some pedagogical value to illustrate their most important properties byan example following the procedure that actually led to the discovery of thememristor as a physical component [71]. This memristor was realized as adevice that possessed a net resistance R that switched between a more con-ductive state Ron and a less conductive state Roff depending on the currentpassing the component
R(x) = x(t)Ron + (1 − x(t))Roff , (4.4)
where the state variable x ∈ [0, 1] and was set to be proportional to electriccharge. This principle is also the basis for the memristive description of skinelectrical conductance in Paper V where dx
dt∼ i(t) and where the charge
carriers, through electro-osmosis, will influence the degree of water filling inthe sweat duct, and hence also the net resistance.
The memristor produced in the HP lab was made of titanium oxide thathad been ion doped and then tightly squeezed in between two metal contactsseparated by a distance D as illustrated in figure 4.2 where 17 memristors areshown in parallel. The electrical properties of this nano-device alter whenthe ions drift in an applied electric field and total resistance can then begiven as [71]
M(q) = Roff
(1 −
μV Ron
D2q(t)
), (4.5)
where μV is just the average ion mobility in this material. This expressionin particular serves as a good illustration of typical properties of memristors:The scale dependence and the charge dependence on the resistive memory-effect. As the typical scale, D, of the system decreases, the term involvingthe charge-dependency (i.e. giving the non-linear characteristics of the mem-ristor) rapidly plays a more dominating role in the total resistance, and somemristors are typically to be found in small scale systems. As the systemis sufficiently small, memristive effects will totally dominate the resistivityof the given component, but as D is large, the memristor degenerates to

32 Chapter 4.Memristance of human skin
Figure 4.2: The first memristor realized as a physical component. Figure:Wikimedia commons.
an ordinary resistor. The charge-dependence in equation (4.5) ensures thebehavior as a non-linear resistor with memory.
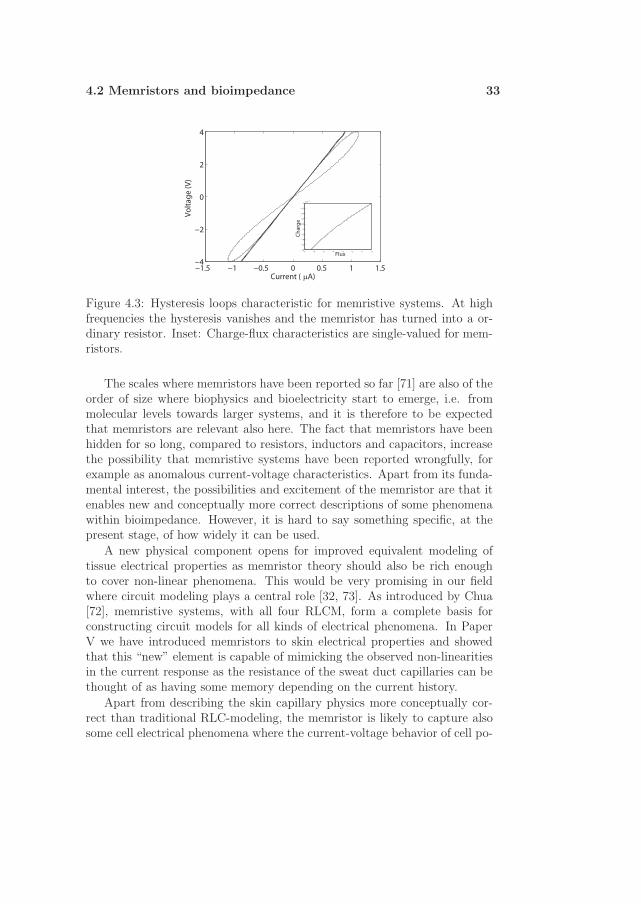
Typically memristive devices show double-loop hysteresis in a parametriccurrent-voltage plot. An example is illustrated in figure 4.3 where suitableparameters are chosen based on the model in Paper V. At higher frequenciesthe memristor degenerates to a simple resistor with a straight iv line. Usingthe state variables q and φ as a basis for a parametric plot, we retrieve asingle-valued and non-linear characteristic for memristors as seen in the insetin figure 4.3. Again, if the qφ curve is simply a straight line, memristancehas degenerated to resistance, or to state it otherwisely, M is just a constant.
4.2 Memristors and bioimpedance
So far we have gone trough some generic properties of memristors that per-haps were mainly of general interest, but have not yet considered the newpossibilities that necessarily arise with the introduction of a new fundamentalcircuit element. Within the field of bioimpedance and bioelectricity, as wellas in biology, a lot of non-linearities are present in biological systems [32],but may sometimes be of an unknown origin. Especially in systems at smallscales, where memristive effects are expected to be of increasing significance,one should open the possibility that non-linear phenomena are sometimesbetter modeled memristively than by the conventional RLC circuit elements,or by the CPE for that matter.
4.2 Memristors and bioimpedance 33
−1.5 −1 −0.5 0 0.5 1 1.5−4
−2
0
2
4
Current ( μA)
Volta
ge (V
)
−7 −6 −5 −4 −3 −2 −1 0−1.8
−1.6
−1.4
−1.2
−1
−0.8
−0.6
−0.4
−0.2
0x 10
−6
Flux
Char
geFigure 4.3: Hysteresis loops characteristic for memristive systems. At highfrequencies the hysteresis vanishes and the memristor has turned into a or-dinary resistor. Inset: Charge-flux characteristics are single-valued for mem-ristors.
The scales where memristors have been reported so far [71] are also of theorder of size where biophysics and bioelectricity start to emerge, i.e. frommolecular levels towards larger systems, and it is therefore to be expectedthat memristors are relevant also here. The fact that memristors have beenhidden for so long, compared to resistors, inductors and capacitors, increasethe possibility that memristive systems have been reported wrongfully, forexample as anomalous current-voltage characteristics. Apart from its funda-mental interest, the possibilities and excitement of the memristor are that itenables new and conceptually more correct descriptions of some phenomenawithin bioimpedance. However, it is hard to say something specific, at thepresent stage, of how widely it can be used.
A new physical component opens for improved equivalent modeling oftissue electrical properties as memristor theory should also be rich enoughto cover non-linear phenomena. This would be very promising in our fieldwhere circuit modeling plays a central role [32, 73]. As introduced by Chua[72], memristive systems, with all four RLCM, form a complete basis forconstructing circuit models for all kinds of electrical phenomena. In PaperV we have introduced memristors to skin electrical properties and showedthat this “new” element is capable of mimicking the observed non-linearitiesin the current response as the resistance of the sweat duct capillaries can bethought of as having some memory depending on the current history.
Apart from describing the skin capillary physics more conceptually cor-rect than traditional RLC-modeling, the memristor is likely to capture alsosome cell electrical phenomena where the current-voltage behavior of cell po-

34 Chapter 4.Memristance of human skin
tentials are due to the flux of ions. This is a charge controlled system, firstdescribed by Hodgin and Huxley [74] in 1952, that can be described memris-tively as was later mentioned by Chua [72]. Such cell electrical phenomena,although not passive (the ion pumping needed for a potential build-up isenergy consuming), satisfy the two criteria for memristors since they arecharge controlled as well as in the nanometer scale where memristive effectsare believed to be present.
Although the concept of memristance has not yet been adapted in model-ing biophysical electricity, a few things are important in order to include alsothis building block: Any current responding to an applied sinusoidal voltageshould from now on be interpreted with also the memristor element readyin the modeling toolbox. Especially if the iv curve turns out to be doublelooped with hysteresis pinched in the origin, memristors may provide justthe suitable description of the observed phenomenon. This is also the caseif one obseves a “positive differential resistance” in a iv parametric plot, i.e.that the current continues to increase for some time after the applied voltagestarted to decrease. Such a positive feedback effect is visible in figure 4.3.It is worth remembering, looking for memristive signs, that the memristoris basically an element that works under AC conditions where the appliedvoltage depends sinusoidally with time.
Moreover, memristors have been shown to be useful in describing theprocess of learning for very small and simple organisms [75]. It is believedthat this understanding of very primitive intelligence, and the correspond-ing memristor circuit describing this process, is similar to neurons in thebrain and applications are believed to be found in desribing neural networkssomeday in the future.
It is not easy at the present stage to see the full potential of the mem-ristor in bioimpedance. It is possible that it turns out trivial with very fewapplications far from our everyday measurements. However, as stated above,there are typical memristive fingerprints that should be kept in mind wheninterpreting the measurements. Also, there are a number of non-linear phe-nomena that are not memristive. As an example the traditional resistor mayalso be non-linear, i.e. it the resistance is current dependent. This neednecessarily not be due to a memory function, and so current dependence isnot the same as charge dependence.
4.3 A few final remarks on our model
In Paper V we have generalized the memristor concept into memristive sys-tems containing two coupled state variables (not just one as in Strukov et al.

4.3 A few final remarks on our model 35
Electrode
x
Skin
y
Figure 4.4: A simple illustration of a memristive system containing two statevariables.
[71]) so that in a general form the governing set of equations is given by
v = R(x, y)i (4.6)
dx
dt= f1(x, y, i) (4.7)
dy
dt= f2(x, y, i), (4.8)
where f1 and f2 are general, coupled functions. This is shown in a simplesketch in figure 4.4 where, as in Paper V, y is the relative height of the wettingfilm, and x is the relative height of the water filling in the duct. I refer toPaper V for further details. Such a memristive system, with the coupledequations, quickly gets intricate. However, as the value of y is constantfor all times greater than t = T/2, where T is the period of the appliedvoltage signal, our model simplifies to a memristive system with only onestate variable.
An open question left in this thesis is whether a constant phase element(CPE), that frequently is used in circuit modeling of the human skin, canbe identified as a memristive system. It is generally known that such anelement cannot be realized by a finite number of RLC-components, and ithas been thought of as purely unphysical. The CPE is known to have acontinuous distribution of time constants [32], and Chua [72] shows thatmemristive systems, under certain circumstances, may be realized as systemshaving similar properties. A problem that necessarily arises in this manner isthat the definition of memristive systems yields zero current as the potentialvanishes, as seen in equation (4.2) and (4.3). This induces a phase anglethat is not constant with time. Thus, within memristive systems, the phaseangle seems non-constant which is incompatible with a CPE. As this is notentirely investigated, and presently only at a speculative level, it demands amore thorough study before such a very useful connection eventually can beestablished (or rejected), and is without the scope of this thesis.


Part II
Conclusion
37


Chapter 5
Summary of my results
The papers that are presented in this thesis do not necessarily form sub-sequent steps, all in the same direction and within the same branch inbioimpedance. On the contrary, they approach the core topics in my studyfrom different angles such as skin hydration assessments (Paper I and II),water holding properties of keratinized tissues (Paper III and IV), electri-cal properties, that intimately are linked to SC hydration (Paper V), andskin conductance measurements viewed in the light of electrode gel sorptionproperties (Paper VI).
Here, I will in short summarize the main findings in my papers, and finallyshare some thoughts about potential future topics of relevance.
Paper I
In this paper, which purely is a theoretical work, a method for estimation ofin vivo SC water content is carried out. The method combines the experi-mentally established dependence of electrical susceptance on water contentwith the shape of the water concentration profile across the SC.
Paper II
Trans-epidermal water-loss (TEWL) is combined with SC desorption prop-erties to form a non-invasive method for estimating in vivo SC steady watercontent, and so this paper has the same aim as Paper I. Baseline TEWL-dataand evaporation rate of water from the SC enable a calculation of the totalcontent of water in the SC area of interest.
39

40 Chapter 5.Summary of my results
Paper III
This paper is concerned with the water sorption properties of the humanSC, that is, how water is bound and released depending on time as well asexternal factors such as relative humidity. SC samples from both heel andbreast are investigated. The implications of hysteresis, or the lack of it,during a full sorption cycle are discussed as well as the triphasic patternsseen in the absorption time constants.
Paper IV
In this paper we followed up the previous with a broader study regardingwater holding properties of keratinized tissues such as hair, nail and SC.Water uptake was found to be quite different between these three sampletypes, although being similar in composition and structure. The SC wasfound to take up considerable more water than hair and nail, and this isrelated to differences in internal structure, and “armoring” that preventsswelling.
Paper V
In this paper we developed a new model for sweat duct conductivity based onmemristor theory. Memristors are the fourth fundamental circuit element,but has remained “unused” for many years, due to their late realization asa physical component. Current responses of human sweat capillaries areshown to behave as memristive systems since the resistance of the capillariesdepends on the current history, i.e. behaving memristively.
Paper VI
Electrodes are known to influence the electrical properties of human skin (seei.e. [32]), and hence a proper choice of electrodes for the intended use is vital.In this paper we found a clear correspondence between gel water content freeto evaporate and skin electrical recordings after electrode onset. In addition,the viscosity of the gel was found to be important, as a low viscosity gelopens for sweat duct penetration, giving an inverse sweat response, increasethe probability of mechanical instability as well as reduce the ability of therecordings to return to baseline after any response.

5.1 Look ahead 41
5.1 Look ahead
Below are a few of many topics that could be possible for future studies:
• The knowledge of how water is bound in the SC should be used in orderto better understand the observed SC electrical properties.
• The possibilities of a calibration of in vivo water content against lowfrequency susceptance measurements should be investigated further.
• The “new” element - the memristor - opens for improved circuit mod-eling within bioimpedance, and these possibilities should be followedup, including e.g. a potential CPE-modeling.
• The memristive model of skin conductance should be developed further,including also the “clipping”-effects that are believed to influence thesweat duct conductance.
• The inverse sweat response, present for gels with low viscosity, shouldbe studied further with the aim of revealing the mechanisms that governthis interesting phenomenon.
• How will the electrode induced effects to skin conductance behave ifAC is replaced by DC current, that is more frequently used in clinicalstudies? Electro-osmotic effects are likely to be present in the DCsituation.
• The characteristic time constants should be found also for hair andnail with the aim of better understanding water holding properties ofkeratinized tissues.


Bibliography
[1] H. Munk. Uber die galvanische einfuhrung differenter flussigkeiten inder unversehrten lebenden organismus. Arch Anat Physiol Wissens Med,pages 505–516, 1873.
[2] ØG. Martinsen, S. Grimnes, T. Kirkhus, L . Mørkrid, and K. Aas. In-creased moisture content in children’s atopic skin. Eur J Pedriat Der-
matol, 17:17–20, 2007.
[3] J. Fluhr, P. Elsner, E. Berardesca, and HI. Maibach, editors. Bioengi-
neering of the skin. Water and the stratum corneum. CRC Press (BocaRaton), 2005.
[4] W. Montagna and PF. Parakkal. The structure and function of the skin.Academic Press, 1974.
[5] RL. Eckert. Structure, function, and differentiation of the keratinocyte.Physiol Rev, 69:1316–1346, 1989.
[6] B. Forslind and M. Lindberg, editors. Skin, hair, and nails: Structure
and function. New York: Marcel Decker, 2004.
[7] T. von Zglinicki, M. Lindberg, GM. Roomans, and B. Forslind. Waterand ion distribution profiles in human skin. Acta Dermatol Venereol,73:340–343, 1993.
[8] GF. Odland. A submicroscopic granular component in human epidermis.J Invest Dermatol, 34:11–15, 1960.
[9] AG. Matolsy and PE. Parakkal. Membrane-coating granules of kera-tinizing epithelia. J Cell Biol, 24:297–307, 1965.
[10] DC. Swartzendruber, PW. Wertz, KC. Madison, and DT. Downing.Evidence that the corneocyte has chemically bound lipid envelope. J
Invest Dermatol, 88:709–713, 1987.
43
44 BIBLIOGRAPHY
[11] DC. Swartzendruber, PW. Wertz, DJ. Kitko, KC. Madison, and DT.Downing. Molecular models of the intercellular lipid lamellae in mam-malian stratum corneum. J Invest Dermatol, 92:251–257, 1989.
[12] PW. Wertz, KC. Madison, and DT. Downing. Covalently bound lipidsof human stratum corneum. J Invest Dermatol, 91:109–111, 1989.
[13] DT. Downing. Lipid and protein structures in the permeability barrierof mammalian epidermis. J Lipid Res, 33:301–313, 1992.
[14] PW. Wertz. The nature of the epidermal barrier: Biochemical aspects.Adv Drug Deliv Rev, 18:283–294, 1996.
[15] PM. Elias. Epidermal lipids, membranes and keratinization. Int J Der-
matol, 20:1–19, 1981.
[16] PW. Wertz and DT. Downing. Glycolipids in mammalian epidermis.Structure and function in the water barrier. Science, 217:1261–1262,1982.
[17] ML. Williams and PM. Elias. The extracellular matrix of stratumcorneum: Role of lipids in normal and pathological function. CRC Crit
Rev Therap Drug Carrier Syst, 3:95–122, 1987.
[18] ML. Williams and PM. Elias. From basket weave to barrier. Unifyingconcepts for the pathogenesis of the disorders of cornification. Arch
Dermatol, 129:626–628, 1993.
[19] B. Forslind. A domain mosaic model of the skin barrier. Acta Dermatol
Venereol, 74:1–6, 1994.
[20] PM. Elias. Lipids and the permeability barrier. Arch Dermatol Res,270:95–117, 1982.
[21] LO. Lamke, GE. Nilsson, and HL. Reithner. Insensible perspirationfrom skin under standardized environmental conditions. Scand Journ
Clin Laborat Invest, 37:325–331, 1977.
[22] L. Norlen, A. Emilson, and B. Forslind. Stratum corneum swelling. Bio-physical and computer assisted quantitative assessments. Arch Dermatol
Res, 289:506–513, 1997.
[23] IH. Blank. Further observations on factors which influence the watercontent of stratum corneum. J Invest Dermatol, 21:259–271, 1953.
BIBLIOGRAPHY 45
[24] JA. Bouwstra, FER. Dubbelaar, GS. Gooris, and M. Ponec. The lipidorganisation of the skin barrier. Acta Derm Venereol, 208:23–30, 2000.
[25] PM. Elias. Epidermal barrier function: Intercellular epidermal lipidstructures, origin, composition and metabolism. J Controlled Release,15:199–208, 1991.
[26] JN. Iraelachvili, S. Marcelja, and RG. Horn. Physical principles of mem-brane organization. Quart Rev Biophys, 13:121–200, 1980.
[27] PW. Wertz, W. Abraham, L. Landmann, and DT. Downing. Prepa-ration of liposomes from stratum corneum lipids. J Invest Dermatol,87:582–584, 1986.
[28] RBD. Fraser, TP. MacRae, and Rogers GE. Keratins. CC. Thomas:Springfield, 1972.
[29] HP. Baden. The physical properties of nail. J Invest Dermatol., 55:115–122, 1970.
[30] B. Forslind. Biophysical studies of the normal nail. Acta Dermatol
Venereol, 50:161–168, 1970.
[31] Y. Kuno. Human perspiration. Springfield: Thomas, 1956.
[32] S. Grimnes and ØG. Martinsen. Bioimpedance and bioelectricity basics.Academic Press, 2008.
[33] R. Pethig. Dielectric and electronic properties of biological materials.New York: Wiley, 1979.
[34] R. Cooper. The electrical properties of salt-water solutions over thefrequency range 1-4000 Mc/s. J Inst Elect Eng, 93:69–75, 1946.
[35] ØG. Martinsen, S. Grimnes, and ES. Kongshaug. Dielectric propertiesof some keratinized tissues. Part 2: Human hair. Med Biol Eng Comput,35:177–180, 1997.
[36] ØG. Martinsen, S. Grimnes, JK. Nilsen, C. Tronstad, W. Jang, H. Kim,K. Shin, M. Naderi, and F. Thielmann. Gravimetric method for in vitro
calibration of skin hydration measurements. IEEE Trans Biomed Eng,55, 2008.
[37] ØG. Martinsen, S. Grimnes, and SH. Nilsen. Water sorption and elec-trical properties of human nail. Skin Res Technol, 14:142–146, 2008.
46 BIBLIOGRAPHY
[38] HP. Schwan. Adwances in biological and medical physics. Vol V. Aca-demic Press, 1957.
[39] JE. Algie and IC. Watt. The effect of changes of relative humidity on theelectrical conductivity of wool fibres. Textile Res J, 35:922–929, 1965.
[40] ØG. Martinsen, S. Grimnes, and E. Haug. Measuring depth depends onfrequency in electrical skin impedance measurements. Skin Res Technol,5:179–181, 1999.
[41] JJ. Ackmann and MA. Seitz. Methods of complex impedance measure-ments in biological tissue. CRC Crit Rev Biomed Eng, 11:281–311, 1984.
[42] T. Yamamoto and Y. Yamamoto. Electrical properties of the epidermalstratum corneum. Med Biol Eng, 14:592–594, 1976.
[43] S. Gabriel, RW. Lau, and C. Gabriel. The dielectric properties of bio-logical tissue: II. Measurement in the frequency range 10 Hz to 20 GHz.Phys Med Biol, 41:2251–2269, 1996.
[44] B. Onaral and HP. Schwan. Linear and nonlinear properties of plat-inum electrode polarisation. Part I: Frequency dependence at very lowfrequencies. Med Biol Eng Comp, 20:299–306, 1982.
[45] ØG. Martinsen, S. Grimnes, and J. Karlsen. Low frequency dielectricdispersion of microporous membranes in electrolyte solution. J Coll
Interface Sci, 199:107–110, 1998.
[46] S. Grimnes. Psychogalvanic reflex and charges in electrical parametersof dry skin. Med Biol Eng Comp, 20:734–740, 1982.
[47] S. Grimnes. Skin impedance and electro-osmosis in the human epider-mis. Med Biol Eng Comp, 21:739–749, 1983.
[48] S. Glasstone. Textbook of physical chemistry. London, MacMillan, 1962.
[49] MJ. Mayotte, JG. Webster, and WJ. Tompkins. A comparison of elec-trodes for potential use in pediatric infant apnea monitoring. Physiol
Meas, 15:459–467, 1994.
[50] ET. McAdams, J. Jossinet, A. Lackermeier, and F. Risacher. Factorsaffecting electrode-gel-skin impedance in electrical impedance tomogra-phy. Med Biol Eng Comp, 34:397–408, 1996.

BIBLIOGRAPHY 47
[51] C. Tronstad, GE. Gjein, S. Grimnes, ØG. Martinsen, AL. Krogstad,and E. Fosse. Electrical measurement of sweat activity. Physiol Meas,29:407–415, 2008.
[52] EJ. Clar, CP. Her, and CG. Sturelle. Skin impedance and moisturiza-tion. J Cosmet Chem, 26:337–353, 1975.
[53] JL. Leveque and J. Derigal. Impedance measurements for studying skinmoisturization. J Cosmet Chem, 34:419–428, 1983.
[54] R. Kohli, WI. Archer, JMC. Roberts, Cochran AJ., and ALW. Po.Impedance measurements for the non-invasive monitoring of skin hy-dration - a reassessment. Int J Pharmac, 26:275–287, 1985.
[55] CW. Blichmann and J. Serup. Assessment of skin moisture - measure-ment of electrical conductance, capacitance and trans-epidermal water-loss. Acta Derm Venereol, 68:284–290, 1988.
[56] ØG. Martinsen and S. Grimnes. Facts and myths about electrical mea-surement of stratum corneum hydration state. Dermatology, 202:87–89,2001.
[57] IH. Blank. Factors which influence the water content of the humanstratum corneum. J Invest Dermatol, 18:433–440, 1952.
[58] RM. Marks et al, editor. Physical nature of the skin. MTP Press,Lancaster, 1988.
[59] GB. Kasting and ND. Barai. Equilibrium water sorption in humanstratum corneum. J Pharm Sci, 92:1624–1631, 2003.
[60] RL. Anderson, JM. Cassidy, JR. Hansen, and W. Yellin. Hydration ofstratum corneum. Biopolymers, 12:2789–2802, 1973.
[61] GK. Johnsen, ØG. Martinsen, and S. Grimnes. Sorption studies ofhuman keratinized tissue. J Phys Conf Ser, 224:012094, 2010.
[62] M. Gniadecka, OF. Nielsen, DH. Christensen, and HC. Wulf. Structureof water, proteins and lipids in intact human skin, hair and nail. J Invest
Dermatol, 110:393–398, 1998.
[63] AF. El-Shimi and HM. Princen. Diffusion characteristics of water vaporin some keratins. Coll Polym Sci, 256:209–217, 1978.

48 BIBLIOGRAPHY
[64] J. Crank and GS. Park, editors. Diffusion in polymers. Academic Press,London, 1968.
[65] J. Pieper, G. Charalambopoulou, T. Steriotis, S. Vasenkov, A. Desmedt,and RE. Lechner. Water diffusion in fully hydrated porcine stratumcorneum. Chem Phys, 292:465–476, 2003.
[66] CL. Silva, D. Topgaard, V. Kocherbitov, JJS. Sousa, AACC. Pais, andE. Sparr. Stratum corneum hydration: Phase transformations and mo-bility in stratum corneum, extracted lipids and isolated corneocytes.Bioch Bioph Acta, 1768:2647–2659, 2007.
[67] JF. McClendon and A. Hemingway. Variations in the polarization ca-pacity and resistance of the skin. J Gen Phys, 13:621–626, 1930.
[68] I. Martin and P.H. Venables. Techniques in psychophysiology. Chich-ester: John Wiley, 1980.
[69] AL. Krogstad, C. Mørk, and SK. Piechnik. Daily pattern of sweating andresponse to stress and excercise in patients with palmar hyperhidrosis.BR J Dermatol, 154:1118–1122, 2006.
[70] LO. Chua. Memristor - the missing circuit element. IEEE Trans Circuit
Theory, 18, 1971.
[71] DB. Strukov, GS. Snider, DR. Stewart, and RS. Williams. The missingmemristor found. Nature, 453:80–84, 2008.
[72] LO. Chua and SM. Kang. Memristive devices and systems. Proc IEEE,64:209–223, 1976.
[73] J. Malmviuo and R. Plonsey. Bioelectromagnetism. Oxford UniversityPress, 1995.
[74] AL. Hodgin and AF. Huxley. A quantitative description of membranecurrent and its application to conductance and excitation in nerve. J
Physiol, 117:500–544, 1952.
[75] YV. Pershin, S. La Fontaine, and M. Di Ventra. Memristive descriptionof amoeba’s learning. Phys Rev E, 80:021926, 2009.

Part III
Papers
49


I


8 The Open Biomedical Engineering Journal, 2009, 3, 8-12
1874-1207/09 2009 Bentham Open
Open Access
Estimation of In Vivo Water Content of the Stratum Corneum from Electrical Measurements Gorm Krogh Johnsen*,1, Ø.G. Martinsen1,2 and S. Grimnes1,2
1Department of Physics, University of Oslo, P.O. Box 1048 Blindern, N-0316 Oslo, Norway 2Department of Clinical and Biomedical Engineering, Rikshospitalet, Oslo University Hospital, N-0027 Oslo, Norway
Abstract: In vivo water content in the epidermal stratum corneum can be estimated by means of low frequency susceptance measurements. In the in vitro calibration necessary to find the in vivo water content, the stratum corneum will have a uniform distribution of water across its thickness. However, in vivo stratum corneum has an increasing water concentration profile from the outermost towards the innermost parts. This paper will investigate the possibility of estimating the equilibrium water content in the in vivo stratum corneum non-invasively from electrical susceptance measurements. Given a known shape of the water concentration profile in the in vivo stratum corneum and the dependence of susceptance on the water content, it is possible to calculate the water content in vivo based on analytically derived expressions for the water concentration profile. A correspondence between in vivo and in vitro water content needed for this purpose is also established.
Keywords: Bioimpedance, electrical susceptance, stratum corneum, hydration.
INTRODUCTION
The vital functions of the stratum corneum (S.C.) are strongly dependent on the water content therein [1-3]. Knowledge of the water content of the S.C. in vivo has been shown to be an important factor in clinical determinations of non-visible skin diseases such as atopic eczema [4-7]. Electrical methods for measuring skin hydration have been studied for several decades and a low frequency susceptance is found to be the most adequate [8-10]. In this paper the term low frequency means a constant frequency below 100 Hz. In general higher frequencies will measure also on deeper skin layers [11]. Furthermore, the conductance of the S.C. is influenced by sweat duct filling which is an unwanted error to the measurements. The method of Martinsen et al.[12] is not affected by sweat duct filling, viable skin or temperature as it is focused on S.C. only [9]. Often a four-electrode system is used for the electrical bioimpedance measurements [13], but the susceptance data used in this paper are found with monopolar recording using a three-electrode setup following the principles of Grimnes [14]. In this theoretical paper we want to investigate the possibility of estimating the equilibrium water content of the in vivo S.C. by electrical susceptance measurements. The method we propose in this paper is non-invasive, rapid and simple. The estimation of the in vivo S.C. water content is done by calculating the relation between in vivo and in vitrosusceptance, and thereby also the connection between the corresponding water contents. Viable skin contains about 70-80 % water [1], whereas the surface of the S.C. is drier. There will therefore be a net water gradient throughout the
*Address correspondence to this author at the Department of Physics,University of Oslo, P.O. Box 1048 Blindern, NO-0316 Oslo, Norway; Tel: +4722854077; Fax: +4722856422; E-mail: [email protected]
S.C. In vitro, however, the water content may be kept uniform, due to a moisture chamber as in the measurements of Martinsen et al. [12], where an exponential correspon-dence is found between measured susceptance and water content of the S.C. given in gram water per gram dry skin. This means that any in vivo susceptance corresponds to an invitro water content. As also discussed in Johnsen et al. [15], assuming a linear water concentration profile in the in vivoS.C. it is possible to analytically find a relation between invitro and in vivo measurements, and therefore also possible to predict the water concentration profile which yields the water content of in vivo S.C. The linearity of the water concentration profile is indicated in the literature [16-20]. Also from diffusion theory the water concentration profile of the S.C. will be linear as a first approximation. The passive diffusion of water across the S.C. is governed by Fick's laws of diffusion. For the equilibrium transport of water across the thickness of the S.C. Fick's law [21, 22] yields
dzzdCDF )(= , (1)
where F is the flux of water, D is the diffusion constant, and C(z) is the concentration of water across the S.C. thickness, z. A constant value of D gives a linear gradient of water in the S.C. whereas a non-constant value, as indicated by [20, 23], will give deviations from linearity. However, a slight variation in the value of D with water content results in only small deviations from linearity with respect to the water concentration profile in the S.C. [20, 22] where the former predicts linear water profiles based on a non-constant value of D with respect to the water content of the S.C. We will show that the assumption that the concentration profile being linear is valid for our calculations even if the profile deviates from linearity, i.e. containing also higher order terms. Thus, as a first approximation we consider the in vivo water concentration profile to be linear across the entire S.C. when

Estimation of In Vivo Water Content of the Stratum Corneum The Open Biomedical Engineering Journal, 2009, Volume 3 9
we perform our estimates of in vivo water content. Any given analytic expression of the water profile will in turn make it possible to estimate in vivo water content.
METHODS
The S.C. is modeled so that the water content increases with relative depth, z, where z �[0,1]. The S.C. consists of dead and deformed keratinised cells containing water in and around them [24]. This results in strong capacitive properties at low frequencies [25, 26], and a section across the S.C. thickness is therefore modeled as a series of capacitors, each with infinitesimal thickness and a dielectric dependency on the water content at the given depth. Thus, the S.C. is viewed as a continuous series of capacitors and resistors as illustrated in Fig. (1). The current density will be equal in all infinitesimal slices of the S.C. that is being considered (i.e. under the electrode). This is ensured by using a three-electrode setup as described first by Grimnes [14]. For sufficiently low frequencies, that is, below 100 Hz, impedivity of the S.C. is much higher than for viable tissue [27]. In addition, the much larger dimension of the measuring electrode compared to the S.C. thickness also justifies a uniform representation of the current density across the S.C. thickness. Yamamoto and Yamamoto [28] report on an upper limit of linearity of skin current density to be about 10 �A/cm2 at 10 Hz and 100 �A/cm2 at 100 Hz. In this paper we will be operating well within the linear range. Electrical admittance is basically measured by applying a constant voltage and measuring the corresponding current. Furthermore, a lock-in amplifier is used to measure only the imaginary part of the admittance, i.e. the susceptance. As a general model of the water concentration profile we will introduce a linear term and also higher order terms, covering a broad class of profile shapes (depending on the values of the parameters)
2czbzaw ++= , (2)
where w is water content given in gram water per gram wet skin (i.e. skin and water), and a (dimensionless), b ([length] 1� ) and c ([length] 2� ) are constants. Thus, the outermost water content of the S.C. is then given by a and
the innermost by d = a+b+c. The parameters of the water concentration profile in our model are unbiased, meaning that the value of b and c can be negative giving a negative slope. Such a shape of the profile may appear if the relative humidity of the ambient air is sufficiently high giving a larger value of a than d. The exponential behavior of the susceptance with respect to in vitro water content, v given in gram water per gram dry skin found in Martinsen et al. [12], then yields the general form of the susceptance
)exp(0 vBB �= , (3)
where 0B represents the susceptance measured when the S.C. is only one, uniform dielectric, and � is an experimental constant that can be found in Martinsen et al. [12] in the case of in vitro S.C. taken from the heel. We want to use the linearity of the water concentration profile in the S.C. to find in vivo water content. However, the susceptance depends exponentially on gram water per gram dry skin and must therefore be converted to be a function of gram water per gram wet skin, that is, a function of w rather than v, in order to be combined with the linear water distribution. Converting v into w is done by
ws
ws
vvw
����+
= , (4)
where s� and w� are the densities of dry S.C. and water, respectively. The density of S.C. is estimated by Scheuplein [29], and the density of water is set to 1.00 g 3�cm . Eq. (3) then turns into
)1
exp( 2
2
0 czbzaczbzaBB
s ���++=
�� (5)
An expression of the infinitesimal in vivo impedance, dZ,for each thin capacitor in our model can be found through the relation 1)( �= CX � , where X is reactance, � is signal frequency, at which the susceptance is being measured, and C is the capacitance depending on the water content of the dielectric. It is worth noticing that the outermost and driest parts of the S.C. in general will contribute more to the impedance than the deeper layers. Using that relative permittivity is proportional to susceptance, we get that
)(1
0 wAdzdZ
���= (6)
)1
exp(12
2
0 czbzaczbza
A s ���++�=
��
��, (7)
where A is the cross-section area of the S.C. region being considered, 0� is the electrical permittivity of vacuum, and
)(w� is the relative dielectric permittivity which is proportional to the susceptance and therefore also a function of the water content, w. Total in vivo impedance of the S.C. is found by integrating up (7)
Fig. (1). The electrical model of the stratum corneum.

10 The Open Biomedical Engineering Journal, 2009, Volume 3 Johnsen et al.
dzczbza
czbzaA
Zs
)1
(exp12
21
00 ���++�= � �
���
(8)
We would now like to find the in vitro water content, vitroinw _ that corresponds to the in vivo impedance given in
(8). This is done by combining the in vivo result with the fact that impedance decreases exponentially with the water content, w (gram water per gram dry skin). Thus, from (8) we get that
),exp(1_
0vitroinv
AZ �
���= (9)
which results in
[ ]dzczbza
czbzavs
vitroin )1
(expln12
21
0_ ���
++��= � ��
� (10)
The in vitro water content, w ( gram water • gram wet tissue ) is then given by
1_
__ +
=svitroin
svitroinvitroin v
vw
�� , (11)
with vitroinv _ given as in (10).
RESULTS
The correspondence between in vivo and in vitro water content is given by the set of equations (10) and (11) where the in vivo water content is given by the right-hand-side (RHS) of (10). We will now show that the estimated value of in vitro water content, based on any physical in vivoconcentration profile is more or less the same when c = 0(linear profile) as when c � 0 (deviations from linearity). For any measured in vivo susceptance value, the water concentration profiles must satisfy the condition
,0),,,( _ =cbavf vitroin (12)
where
+= vitroinvitroin vcbavf __ ),,,(
dzczbza
czbzaA s
)1
(exp1ln12
21
00 ���++�� �
����
(13)
We see that the water concentration profiles are in general not unique for a given value of the in vitro water content (i.e. for an in vivo susceptance) due to the fact that both a and c are unknowns. This is as expected since two independent parameters can not be obtained from a single measurement. Hence, an in vivo susceptance will in general not be sufficient to determine the profile of the water concentration of the S.C. exactly, but rather serve us with a continuum of possible solutions. The assumption that in vivo water content of the S.C. can be estimated from susceptance measurements and a linear concentration profile is reasonable as a first approximation. We show this in Tables 1 and 2, and Fig. (2) where we compare the results of in vitro estimated values for a purely linear concentration profile (i.e. c = 0) and profiles containing also non-linearities for two different cases. The
deviation is significant only for very large negative (or positive) values of c. Physically, the numeric value of the parameter c, governing the deviation from linearity, may be limited to the interval [-0.5, 0.5]. This is due to the fact that one can not have negative values of the S.C. water content. Values exceeding the relative value of 100 % are also unphysical. The most likely value of c is that it is slightly positive due to the fact that there is a gradient from the outermost S.C. (dry) towards the interface at the vial epidermis (wet). We note that the deviations from the linear results are small in this manner. Thus, it seems to be a reasonable approximation to model the concentration profile to be linear when we want to find the correspondence between in vivo and in vitro water content, and the term 2czwill therefore be omitted in the following. Water content of the S.C. in vivo can possibly be found on the basis of the water concentration profiles. The profiles are in general given by the RHS of (10). We can think of this process of estimating in vivo water content as illustrated schematically in Fig. (3). Any susceptance corresponds to an in vitro water content which again is equivalent with in vivo water content in the S.C. It should be commented that whereas the relation between in vitro susceptance and water content in Fig. (3) is one-to-one, the correspondence between in vitro water
Table 1. In Vitro Water Contents Corresponding to a Linear Water Concentration Profile and Non-Linear Profiles when a=0.212 and b=0.288. The Constants a, b, and c are as defined in Eq. (2)
c v in_vitro
-0,4 9
-0,25 16,3
-0,1 19,32
0 20
0,1 20,42
0,25 20,86
0,25 21,39
Table 2. In Vitro Water Contents Corresponding to a Linear Water Concentration Profile and Non-Linear Profiles when a=0.132 and b=0.268. The Constants a, b, and c are as defined in Eq. (2)
c v in_vitro
-0,4 11,4
-0,25 27,12
-0,1 29,53
0 30
0,1 30,3
0,25 30,67
0,25 31,1

Estimation of In Vivo Water Content of the Stratum Corneum The Open Biomedical Engineering Journal, 2009, Volume 3 11
content and in vivo water content is not unique. This is due to the fact that a, b and c are in general not constant.
Fig. (2). The derivation of possible in vivo water gradients and then again in vivo water content with basis in an in vivo susceptance measurement.
Fig. (3). The data in Table 1 and 2 illustrated graphically. Note the nearly flat curves for positive and slightly negative values of c.
DISCUSSION
We have in this paper studied the possibility of estimating the water content in the S.C. by means of electrical susceptance measurements performed in vivo. We have found a correspondence between in vivo and in vitrowater content and shown that the estimated in vivo water content from a measured susceptance value is approximately the same when a linear water concentration profile is assumed as when a non-linear profile is used for the basis of our calculations. This is at least correct if the parameters of the profile have physically realistic values. In this paper we have found relative in vivo water content (gram water per gram skin) and not absolute content. In order to find absolute water content of the S.C. from electrical susceptance measurements, the exact shape of the profile would be needed as well as the S.C. thickness of the area being considered. This should be a topic for future studies and would include more experimental methods in order to reveal the parameters in our model. If either of the parameters in the gradient are fixed, it would be a step towards an analytical expression of the absolute S.C. water content. The value of a, the water content of the S.C. surface, will depend
on the relative humidity and temperature of the ambient air and will probably vary with time. Thus, the most likely candidate to be fixed is the water content, d, at the boundary of the S.C. towards viable skin. Viable skin contains a more or less stable content of water, independent of ambient variations such as relative hydration and temperature, which opens the possibility of boundary conditions to the innermost parts of the S.C. An important question in this context is whether the interface towards the epidermis provides natural boundary conditions to the value of the innermost water content in the S.C. This should be a topic for future studies since literature seems ambiguous at this point. Occluding the S.C. while measuring susceptance may result in an asymptotic behavior of the susceptance due to a stable content of water in the S.C. corresponding to the level of hydration of the viable skin. Another possible method to search for the value of d is from trans-epidermal-water-loss (TEWL)- measurements. Adjus-ting the relative humidity of the ambient air until TEWL vanishes probably means that the S.C. is hydrated at a level equal to d throughout its entire thickness. The S.C. thickness varies due to swelling and that the number of keratin layers vary at different parts of the human body [19, 30]. This is a problem yet to be solved. However, the interpersonal differences with respect to the S.C. thickness at equivalent parts of the body may be expected to be smaller, and therefore possible tabulated values of S.C. thickness with respect to location, age, sex etc. may show a better uniformity and possibly be good enough for our purpose. It is also worth noticing that the in vitro water content is in general not the average of the in vivo water concentration profiles. This is as expected due to the capacitive properties of the S.C. where the outermost and driest parts of the S.C. contribute more to the impedance, and hence more to the estimated corresponding in vitro water content. This is, however, also a weakness in our model since then the estimated in vivo water content may not vary much with the changes in the shape of the innermost part of the water concentration profile.
REFERENCES [1] I.H. Blank, “Factors which influence the water content of the
stratum corneum”, J. Invest. Dermatol., vol. 18, pp. 433-440, 1952. [2] I.H. Blank, “Further observations on factors which influence the
water content of the stratum corneum”, J. Invest. Dermatol., vol. 21, pp. 259-271, 1953.
[3] R.J. Scheuplein, and I.H. Blank, “Permeability of the skin”, Physiol. Rev., vol. 51, pp. 702-747, 1971.
[4] C. Blichmann, and J. Serup, “Hydration studies on scaly hand eczema”, Contact Dermatitis, vol. 16, pp. 155-159, 1987.
[5] J. Fluhr, P. Elsner, E. Berardesca, and H.I. Maibach, Bioengineering of the Skin: Water and the Stratum Corneum,London: CRC Press, 2005, pp. 97-102.
[6] E.A. Holm, H.C. Wulf, L. Thomassen, and G.B.E. Jemec, “Instrumenatal assessment of atopic eczema: Validation of transepidermal water loss, stratum corneum hydration, erythema, scaling, and edema”, J. Am. Acad. Dermatol., vol. 55, pp. 772-780, 2006.
[7] Ø.G. Martinsen, S. Grimnes, T. Kirkhus, L. Mørkrid, and K. Aas, “Increased moisture content in children's atopic skin” , Eur. J. Pediatr. Dermatol., vol. 17, pp. 17-20, 2007.
[8] W.Y. Jang, J.J. Park, H.J. Jeong, H.S. Kim, and J.C. Park, “Time series trend of the water content on the different human anatomical sites using single frequency-susceptance measuring method”, Proc. IEEE Int. Conf. (New York), 2006, pp. 3744-3746.
−0.4 −0.2 0 0.2 0.4 0.60
5
10
15
20
25
30
35
40
c
vin
vitro
Table1
Table2

12 The Open Biomedical Engineering Journal, 2009, Volume 3 Johnsen et al.
[9] Ø.G. Martinsen, and S. Grimnes, “Facts and myths about electrical measurement of stratum corneum hydration state”, Dermatology,vol. 202, pp. 87-89, 2001.
[10] Ø.G. Martinsen, S. Grimnes, and J. Karlsen, “Electrical methods for skin moisture assessment”, Skin Pharmacology, vol. 8, pp. 237-245, 1995.
[11] Ø.G. Martinsen, S. Grimnes, and O. Sveen, “Dielectric properties of some keratinized tissues. Part 1: Stratum corneum and nail in situ”, Med. Biol. Eng. Comput., vol. 35, pp. 172-176, 1997.
[12] Ø.G. Martinsen, S. Grimnes, J.K. Nilsen, C. Tronstad, W. Jang, H. Kim, and K. Shin, “Gravimetric method for in vitro calibration of skin hydration measurements”, IEEE Trans. Biomed. Eng., vol. 55(2), pp. 728-732, 2008.
[13] S. Grimnes, and Ø.G. Martinsen, “Sources of error in tetrapolar impedance measurements on biomaterials and other ionic conductors”, J. Phys. D, vol. 40, pp. 9-14, 2007.
[14] S. Grimnes, “Impedance measurement of individual skin surface electrodes”, Med. Biol. Eng. Comput., vol. 21, pp. 750-755, 1983.
[15] G.K. Johnsen, Ø.G. Martinsen, and S. Grimnes, “Water gradient and calibration of stratum corneum hydration measurements”, Proc. IFMBE 2007, vol 17, pp. 158-160.
[16] R.R. Warner, M.C. Myers, and D.A. Taylor, “Electron probe analysis of human skin: determination of the water concentration profile”, J. Invest. Dermatol., vol. 90, pp. 218-224, 1988.
[17] L. Chrit, P. Bastien, G.D. Sockalingum, D. Batisse, F. Leroy, M. Manfait, and C. Hadjur, “An in vivo randomized study of human skin moisturization by a new confocal raman fiber-optic microprobe: assessment of a glycerol-based hydration cream”, Skin Pharmacol. Physiol., vol. 19, pp. 207-215, 2006.
[18] P.J. Caspers, G.W. Lucassen, E.A. Carter, H.A. Bruining, and G.J. Puppels, “In vivo confocal raman microspectroscopy of the skin: noninvasive determination of molecular concentration profiles”, J. Raman Spectrosc., vol 31, pp. 813-818, 2001.
[19] T. Egawa, M. Hirao, and M. Takahashi, “In vivo estimation of stratum corneum thickness from water concentration profiles
obtained with raman spectroscopy”, Acta Derm. Venereol., vol. 87, pp. 4-8, 2007.
[20] I.H. Blank, J. Moloney, A.G. Emslie, I. Simon, and A. Charles, “The diffusion of water across the stratum corneum as a function of its water content”, J. Invest. Dermatol., vol. 82, pp. 188-194, 1984.
[21] A. Fick, “Uber diffusion”, Poggendorf's Ann. Phys., vol. 94, pp. 59-86, 1855.
[22] J. Crank, The Mathematics of Diffusion, England: Oxford University Press, 1956, pp. 258-261.
[23] M.S. Wu, “Water diffusivity and water concentration profile in human stratum corneum from transepidermal water loss measurements”, J. Soc. Cosmet. Chem., vol. 34, pp. 191-196, 1982.
[24] W. Montagna, and P.F. Parakkal, Eds., The Structure and Function of Skin , 3rd ed., London: Academic Press, 1974.
[25] R. Pethig, Dielectric and Electronic Properties of Biological Materials , New York: Wiley, 1997.
[26] Ø.G. Martinsen, S. Grimnes, and H.P. Schwan, “Interface phenomena and dielectric properties of biological tissue”, Encycl. Surf. Coll. Sci., pp. 2643-2652, 2002.
[27] T. Yamamoto and Y. Yamamoto, “Electrical properties of the epidermal stratum corneum”, Med. Biol. Eng., vol. 14, pp. 592-594, 1976.
[28] T. Yamamoto, and Y. Yamamoto, “Non-linear electrical properties of the skin in the low frequency range”, Med. Biol. Eng. Comp., vol. 19, pp. 302-310, 1981.
[29] R. J. Scheuplein, “Molecular structure and diffusional processes across intact epidermis”, Contract No. DA 18-108-AMC-148(A). Medical Research Laboratory, Edgewood Arsenal, Maryland, 1967.
[30] K.A. Holbrook and G.F. Odland, “Regional differences in the thickness (cell layers) of the human stratum corneum: an ultrastructural analysis”, J. Invest. Dermatol., vol. 62, pp. 415-422, 1974.
Received: December 01, 2008 Revised: February 15, 2009 Accepted: February 17, 2009
© Johnsen et al.; Licensee Bentham Open.This is an open access article licensed under the terms of the Creative Commons Attribution Non-Commercial License (http://creativecommons.org/licenses/by-nc/3.0/) which permits unrestricted, non-commercial use, distribution and reproduction in any medium, provided the work is properly cited.


II


III


Sorption Properties of the Human Stratum Corneum
Gorm K. Johnsen1, Lars Norlen2,3, Ørjan G. Martinsen1,4 and Sverre Grimnes4,1
1. Department of Physics, University of Oslo, Oslo, Norway
2. Department of Cell & Molecular Biology, Medical Nobel Institute, Karolinska Institutet,Stockholm, Sweden
3. Dermatology Clinic, Karolinska University Hospital, Stockholm, Sweden
4. Department of Clinical and Biomedical Engineering, Rikshospitalet University Hospital, Oslo, Norway
Submitted to: Skin Pharmacol Physiol
Abstract
Water sorption is important for the overall structure and function of keratinized tissues such as the human epidermal stratum corneum (SC). In this study we report on a gravimetric method for studying sorption properties of human SC, both from heel and female breast skin. Changes in mass were measured as the relative humidity was altered in steps under controlled environmental conditions. The possibility of hysteresis is also discussed. Furthermore, we have found that the sorption time constants show triphasic behaviour during absorption, but not during desorption. This behaviour is connected to the three different types of water present in the SC. Water also enters the SC much more rapid compared to its exit at relative humidities lower than 50 %. Finally, the amount of time between sample preparation and onset of measurement seemed to have an effect on the absorption rate, but less on the total amount of water absorbed.
Keywords: Skin, stratum corneum, hydration, time constants, hysteresis.
1. IntroductionThe foremost function of skin is to constitute a barrier between the body and the environment. The SC, i.e. the superficial most layer of skin, is directly responsible for skin barrier function. It is composed of dead keratinized cells embedded in a continuous extra cellular lipid structure. The major role of the keratinized cells is to constitute a both stiff and viscoelastic protective scaffold for the lipid structure. The protective mechanical properties of the stratum corneum cells are intimately linked to their water content [1-3]. Skin function is thereby largely dependent on stratum corneum water balance. Also, the stratum corneum hydration properties are important for the understanding of skin diseases characterized by deficient barrier function, such as atopic dermatitis [4-6]. The SC water content will generally vary
with both relative humidity (RH) and temperature as the partial pressure in ambient air and SC tries to equal. Water contents of more than 10 % are necessary in order for the skin to remain healthy and pliable [1].
In this study we report on a gravimetric method for studying the sorption properties of human SC, both from heel and female breast skin obtained from plastic surgery. Knowledge about SC sorption properties is central for our understanding of SC hydration. It will also aid the interpretation of electrical skin hydration measurements [7]. First we investigated the absorption and desorption properties of SC in order to evaluate if hysteresis was detectable, meaning that the amount of water absorbed at a fixed RH during absorption is different from the corresponding water content during desorption. Water uptake as a function of RH was studied as well as time constants, which are the characteristic time needed in order to reachabout 63 % of the equilibrium value.
The study was performed with a dynamic vapour sorption (DVS) instrument from Surface Measurement Systems Ltd (London, UK), where the relative humidity is altered in steps under controlled environments. Kilpatrick-Liverman et al. previously performed a similar study on porcine skin [8], but to our knowledge no such study has been performed on human skin. However, some results were presented in a preliminary study [9]. Also few, if any, consideration of the sorption time constant have earlier been carried out, although Martinsen et al. commented on some of these aspects [7], and literature reports on concentration dependent diffusion of water within the SC [10,11].
2. Materials and methods The SC heel samples were taken from the heel of 10 volunteer test persons, 5 men and 5women at the ages ranging from 24 to 29 years, all with no signs of unhealthy skin and with no history of dermatological diseases. The SC was removed by means of an Aesculap dermatome (Braun, Tuttlingen, Germany), and the sample pieces were about 4 by 5 mm in size after preparation. All samples were prepared with as equal size as possible in order to reduce any effect of geometry on the final results. Their thicknesses were 0.20 mm, which was the thinnest possible configuration provided by the dermatome.
Breast skin from 10 healthy females aged between 32 and 68 years was obtained from reconstructive surgery and kept in a freezer at -20º C for 3 months. After dissection of the subcutaneous fat, the samples were heated for 3 min at 60ºC with the dermal side in contact with a metal plate. The superficial epidermis was then pealed off with a razorblade. Next, the samples were incubated in 0.5 % trypsin with the epidermal side down for 2 h at ambient temperature to remove remnants of stratum granulosum adhering to the epidermal side of the SC. Finally, the sheets were washed four times in distilled water and dried and stored at ambient temperature under nitrogen for about 2 years.
One SC heel sample from one of the 5 male test subjects was also hydrated in HPLC water for 4 hours and then contained in a freezer at -20º C for 72 hours. This was done in order to investigate the effect of freezing on the sorption properties of the SC. Also, 3 heel samples from one of the 5 male test subjects were contained ex vivo for several days prior to experiment onset in order to discover any effects on sorption properties with respect to time between sample preparation and measurement onset.
Furthermore, a DVS was used in order to reveal the SC sorption characteristics by altering the RH in steps from 0 % until 90 %, and then back to 0 %. The steps were all pre-programmed to be of a 10 % increase in RH and temperature was kept constant at 25º C throughout the entire experiment. The DVS apparatus provides a very sensitive microbalance ���������������� ��������������������������� ���� �������������������������������s

were about 3-5 mg, whereas the breast samples, being much thinner, were about 0.4-0.6 mg, but still well within the resolution of the DVS instrument. The DVS was set to jump to the next stage, i.e. a new RH value, when the rate of sample mass, dtdM / , was less than 20 ppm per minute over a period of at least 10 minutes.
The sorption time constants were found by fitting the data to an exponential time course, )exp( ktay ��� . A course proportional to )exp( kt� would then yield time constants equal to k/1�� .
3. ResultsFigure 1 shows the time course of one of the SC samples, taken from the heel, as the RH in the DVS chamber was altered in steps of 10 %. The increment in mass corresponds to absorption of water caused by an increase in RH, whereas decreasing mass corresponds to desorption, i.e. the sample looses water to the environment. The increase (or decrease) in weight then equals the percentage of the weight of water in the skin sample relative to the dry weight of the sample. Initially, the SC sample was set to be in equilibrium with the environment at 0 % RH, giving the dry weight of the sample. Parts of this calibration is seen to the far left in the time course in figure 1 where the sample has a negative mass gain. The time evolutions of the 10 SC heel samples showed very similar time courses. We notice that the first steps in RH resulted in very small mass changes. These steps are better viewed in figure 2 where the steps corresponding to RH at 10, 20, 30 and 40 % are enlarged. The corresponding desorption time courses at low RH followed similar patterns, only now with a negative mass rate.
The alterations in mass of the samples, initiated by the instantaneous increments in RH, followed courses that were close to exponential at high RH, indicating that the mass rate was proportional to the difference between the actual mass and the equilibrium mass for each step. This is in accordance with Fick’s diffusion theory [11], and time courses of the mass for each step was therefore approximated as
� � 221)exp()( MMMtktM i ���� , (1)where 1M and 2M are the sample masses before and after a step in RH was initiated, respectively, dai ,� , so that 1�
ak is the time constant for the absorption process, whereas1�
dk is time constant for desorption. The steps at the lower part of the RH interval deviated somewhat from a purely exponential behaviour, especially courses at 30 and 40 % RH which are shown in figure 2. However, all regressions produced fits to the measured data with rootmean square error (RMSE) less than 0.2%.
In figure 3 a corresponding course is shown for a full sorption cycle for one of the samples from SC isolated from breast skin. The two different types of SC samples, heel and breast, showed very similar full sorption courses, however, with more distinct steps for the latter sample type. This may be due to the fact that breast SC samples were much thinner than SC taken from the heel, which again resulted in much larger surface to volume ratio, resultingin less time in water diffusing into the samples.

Figure 1: Time course of relative water uptake for SC from the heel during absorption and desorption.
Figure 2: Time courses of relative water uptake at RH corresponding to 10, 20, 30 and 40 % for heel SC during desorption.
Figure 3: Time course of relative water uptake for SC isolated from breast epidermis during absorption and desorption.

Figure 4: Relative water uptake for heel and breast SC during absorption and desorption.
Figure 4 shows the average water uptake of the two different sample types of human SC at 25º C as a function of ambient RH. The red, dotted graphs correspond to absorption data, and the blue, continuous graphs show desorption data. We observe that the absorption and desorption graphs were very similar, but with the desorption data slightly elevated compared to absorption, indicating that the samples contained nearly equal amounts of water during absorption and desorption at any given value of RH in the DVS closed chamber. The water sorption isotherms for heel SC showed small changes in water uptake for RH below 50 %, but a more rapid and exponential behaviour at the highest RH values. The isotherms for the SC isolated from breast skin were more elevated compared to heel data at RH below 70 %, indicating larger water uptakes. At the highest RH values, breast SC contained substantially less amount of water compared to heel SC. These shapes of isotherms correspond well with others found in previous sorption studies [1,12,13]. There was, however a much less hysteresis than reported in similar studies in porcine skin, and the tendency in our study was that desorption water contents were slightly higher than absorption data. Only at the mid range RH there were small signs of deviation between water content from absorption and desorption for heel SC, however mainly within the uncertainties in our measurements. For breast SC, the small signs of hysteresis were broader, spanning over a wider RH interval.
Figure 5 and 6 compare water uptake of heel SC from male and female test persons. The two courses were as good as identical in both cases, and no differences of significance with respect to the water contents between the genders were visible in this study. Furthermore, the sorption time constant, that is the characteristic time of water entering or leaving the SC, of the heel samples are illustrated in figure 7. The rapidity of water entering or leaving the SC varied as a function of RH. We note the significant difference of the time constants between absorption and desorption at low RH. During absorption, SC rapidly reached its equilibrium state at very low RH and then decreased with an increase of RH until 50 %. Above 50 % the absorption time constant decreased with increasing RH until 80 %, from which it again increased. The desorption time constant followed the pattern of absorption for RH above 50 %, but at lower humidities the desorption time constant was much higher and flattened out as RH approached zero. Thus, the SC seemed to allow water uptake very rapid, but as water left, the time needed was much longer.

Figure 5: Relative water uptake of male and female heel SC during absorption.
Figure 6: Relative water uptake of male and female heel SC during desorption.
The corresponding sorption time constants, now for the breast samples, are shown in figure 8. Here, the time constants are normalized with respect to the value of the time constant of the first absorption step. This was done in order to be able to compare at least curve forms with the heel data. The breast samples were much thinner than the heel samples, and the thickness of the samples will influence the numeric values of the time constants, so that thinner samples result in smaller values of the time constants [14]. However, as the thicknesses of the breast samples were unknown, and thus potentially of different values, we had to normalize the results of each sample in order to find the shape of the average curve.
We note that there were similar trends in curve form for the time constants of heel and breast SC, although there were also substantial differences. The time constants of both sets of samples experienced a peak followed by a rapid drop during absorption, but with different rates compared to the corresponding absorption trends. I figure 7 the time constant of a heel SC sample that had been hydrated and then frozen for 72 hours is shown in order to see if freezing, which had been applied to all breast samples, would affect the time constants. We note that the absorption data were elevated compared to the 10 other heel samples when RH was lower than 60 %, but that the desorption curve followed more or less the same trend as for the 10 unfrozen heel samples.

Figure 7: Time constants of heel SC during absorption and desorption.
Figure 8: Normalized time constants of SC isolated from breast epidermis.
Figure 9: Time constants of heel SC from men and female during absorption and desorption.

Figure 10: The effect of time between heel sample preparation and onset of measurement onthe absorption time constant.
Figure 11: The effect of time between heel sample preparation and onset of measurement on the desorption time constant.
Figure 12: The effect of time between heel sample preparation and onset of measurement on the relative water uptake during absorption.

Figure 13: The effect of time between heel sample preparation and onset of measurement on the relative water uptake during desorption.
A comparison of the sorption time constants between men and women are shown in figure 9. The tendency was that female skin reached the equilibrium state more rapid than male skin, and thus seemed to have a higher affinity for water. During desorption this means that male skin held water a little longer before stable state was reached.
It is also interesting to note that the absorption time constant seemed to be dependent on time between heel sample preparation and onset of experiment with the DVS instrument. Figure 10 shows that the absorption time constant increased substantially at the RH interval of 40 to 70 % when the samples were contained in the lab for several days prior to onset of experiment. The same effect was found for desorption data, however with smaller deviations from the average value of the time constants. The number of days greater than three did not seem to influence the data much.
In figure 12 and 13 the corresponding time-effect is viewed through the relative water uptake during absorption and desorption. We note only small differences in water uptake in the RH regions where the time constants altered, but there may be a weak tendency that the samples took up less water after having been stored for several days prior to the onset of measurement. One should, however, notice that in this manner only samples from one male test person was tested against this potential long-term effect of SC from the heel.
4. DiscussionIn this paper we have studied sorption properties of human SC and found that the sorption time constants varied greatly with RH of ambient air with triphasic behaviour during absorption. The sorption time courses were best described by single exponential time courses at high RH, whereas at the lowest RH both absorption and desorption showed a behaviour with slightly more pronounced deviations from exponential courses. A single exponential dependence with time may indicate that there is one underlying sorption mechanism that is strongly dominating, and a deviation from such a course could therefore be a combination of two or more mechanisms, both sorbing water, in the SC.
Studies on the diffusion properties of polymers such as keratins have shown that this type of materials show a behaviour governed by Fickian diffusion above a certain, and

material dependent temperature, the glass transition temperature, but being more complex below gT . This has usually been ascribed to the differences in mobility, above and below gT ,of keratin filaments. Diffusion of water in between the keratin filaments is therefore possible since the filaments are free to move above gT [15]. A possibility for the behaviour at low RH (i.e. at low sample water uptakes) may therefore be due to the effect of vapour induced glass transition, below which water content diffusion can be expected to deviate from purely exponential. A topic for further studies should therefore be to reveal more of the underlying mechanisms of SC water binding, and to see if SC experiences a vapour induced RH.
From figure 4 we note that our measurements show very small, if any at all, amounts of hysteresis, being of a size comparable to the uncertainties between the different samples, and may therefore be due to the relatively large inter-individual spread with respect to skin sorption properties. Hysteresis is reported, however much more substantial, in porcine skin [8], but not found in human SC from the hip [13]. Some hysteresis has been reported to be found in horn keratin [16], and Hey et al. reported on a low pressure SC hysteresis [17]. The hysteresis in our measurements was so small that it in general was within the uncertainties of the measurements. Hysteresis associated with sorption isotherms may indicate that there are mechanisms keeping more of the water within the samples during desorption compared to absorption. Significant hysteresis will in general require structural changes in the SC which again affects the water holding capacity. Such changes are, according to literature expected to take place at temperatures below the glass transition limit. For SC this limit is reported to be below 20º C [18], meaning that large amounts of hysteresis can not, in our study, be expected to occur due to glass transition structural changes.
One can not rule out the possibility that some of the deviation in absorption and desorption water uptakes are due to the necessarily present gap between absorption and desorption equilibrium masses due to the fact that one has to specify a cut-off in mass-rate (we used 20 ppm per minute) as a criterion for RH to step to the next level as well as the fact that SC varies much between individuals. The numeric value of the smallest allowed mass fluctuation in the DVS setup will influence the result, especially if it is chosen too large. A large equilibrium rate will result in short time intervals before RH is programmed to initiate a step of 10 %. This would allow little time for the SC samples to fully reach the equilibrium state, resulting in deviations between absorption and desorption, that is hysteresis. Still, as the mass rate criterion was chosen very small, and much smaller than in the similar study with SC from porcine skin [8], this effect can be assumed to be small, and is not likely to produce large gaps between absorption and desorption water uptake in a sorption cycle.
The difference between SC from heel and breast in curve form, as seen in figure 4, is hard to explain. An effect that may play a role in this manner is freezing artefacts. Ice crystal formation during freezing of skin will probably somehow disrupt the keratin filament network structure which could potentially influence the absorption and desorption properties of the corneocytes. To date little is known about such structural rearrangements upon freezing which is why speculation becomes very difficult. Cryo-electron microscopy of vitreous skin sections is likely the method to obtain such structural information in the future.
We notice that the absorption time constant showed triphasic behaviour. Our results are similar to those found in Martinsen et al. [7], but in this study the SC samples were allowed sufficient time to reach the equilibrium states after the initial calibration at 0 % RH, and a full sorption study was performed, including also desorption data. The observed triphasic behaviour may be related to the three different types of water present in the SC (strongly bound, bound and bulk) [13,19-21] and to their corresponding sorption mechanisms.Silva et al. reported on three regimes for isolated corneocytes where water contents were below 5 wt %, 5-17 wt %, and above 17 wt %, respectively [22]. This corresponds to our findings of the time constants for absorption in figure 7 and 8 combined with the mass gains

in figure 4. The strongly bound water, potentially bound to polar functional groups of lipid bilayers until monolayer coverage was reached [12,20], entered the SC very rapidly at low RH, and the increase in time constants with RH could be induced by less available sites to attach. Thereafter, as a new type of water was bound in the SC, the time constant decreased, which is an expected behaviour since the diffusion coefficient of water in SC, inversely related to the absorption time constant, usually increases with concentration [14,15]. The final and slight increase in the time constant above RH values of 80 % may be due to bulk water entering the SC combined with the onset of a swelling process that is time consuming, i.e. higher time constants, although bulk water in itself is expected to yield a more rapid diffusion. This part of the RH domain is within the swelling area which has been reported to start at 22-33 % wt [12,13,21,23].
The initial increase in absorption time constant, meaning that it took more time for water to enter the SC as RH was increased, is the opposite of the effect caused by an increasing diffusion coefficient with concentration. Rouse reported on decreasing diffusion constant (i.e. increasing time constant) with increasing concentration for polymers that were not strongly hydrophilic [24]. This effect was proposed to be due to increasing proportion of immobilized water as the water content increases, leading to water entering the polymer more slowly. It is clear that keratin filaments are not very polar as they are quite insoluble in non-denaturating buffers [25]. This relatively low polarity of keratin is further underlined by its close association to lipids in vivo [3]. It has also been reported on a rapid increase in water uptake at low and high RH, but with a slower uptake in the intermediate range [21].
The absorption and desorption time constants from heel SC differed substantially at RH lower than 50 % as seen in figure 7. This regime is likely to be the strongly bound water, and thus it seems reasonably clear that this type of water entered the SC much more rapid compared to its corresponding exit. The underlying mechanism for this peculiar difference is not clear other than that bound water prefers to remain bound. However, the increasing time constant with decreasing RH was as expected since the diffusion coefficient usually decreases with decreasing water content [13-15]. Thus, free and more mobile water will evaporate first and eventually bound water, being more strongly attracted will desorbe.
Although the sorption time constants of heel and breast SC showed similarities with respect to curve forms, including triphasic absorption, there are clearly also different patterns which are hard to explain. The time constant of heel SC stored under freezing conditions, shown in figure 7, did not follow the pattern of a low valued time constant during desorption, as was seen for SC isolated from breast skin, indicating that freezing of samples, possibly inducing distortions to the keratin matrix, was not solely responsible for the new pattern in time constants. However, a combination of freezing effects and alterations with time during storage may have contributed to this difference, as well as to the relatively large spread in time constants for breast SC. Also, the amount of water replacers such as urea and glycerol varies with age of the subjects and is expected to have an effect on the water holding properties of human SC [26].
The peculiar effect of time between preparation of the SC samples and the onset of the DVS measurements, present mainly for RH between 40 and 70 %, may be due to structural changes in the SC when being stored ex vivo over time. With time one can expect the extracellular lipid matrix as well as the keratin filament matrix of the corneocytes suffer from irreversible distortions, such as sorting of lipids in the lipid matrix with crystalline domain building, or irreversible glass transition of the keratin filament matrix as consequences [27].This effect did not seem to have much influence on the total water uptake, comparing the time constants in figure 10 and 11 with the relative water gains during absorption and desorption in figure 12 and 13, although the water holding capacities seemed to decrease slightly with time.
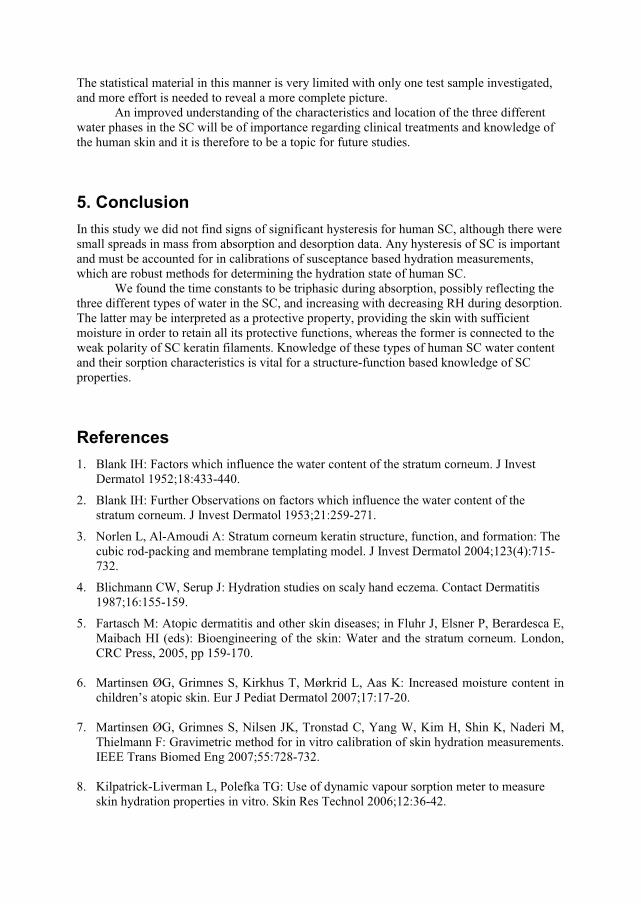
The statistical material in this manner is very limited with only one test sample investigated, and more effort is needed to reveal a more complete picture.
An improved understanding of the characteristics and location of the three different water phases in the SC will be of importance regarding clinical treatments and knowledge of the human skin and it is therefore to be a topic for future studies.
5. ConclusionIn this study we did not find signs of significant hysteresis for human SC, although there were small spreads in mass from absorption and desorption data. Any hysteresis of SC is important and must be accounted for in calibrations of susceptance based hydration measurements, which are robust methods for determining the hydration state of human SC.
We found the time constants to be triphasic during absorption, possibly reflecting the three different types of water in the SC, and increasing with decreasing RH during desorption. The latter may be interpreted as a protective property, providing the skin with sufficient moisture in order to retain all its protective functions, whereas the former is connected to the weak polarity of SC keratin filaments. Knowledge of these types of human SC water content and their sorption characteristics is vital for a structure-function based knowledge of SC properties.
References1. Blank IH: Factors which influence the water content of the stratum corneum. J Invest
Dermatol 1952;18:433-440.
2. Blank IH: Further Observations on factors which influence the water content of the stratum corneum. J Invest Dermatol 1953;21:259-271.
3. Norlen L, Al-Amoudi A: Stratum corneum keratin structure, function, and formation: The cubic rod-packing and membrane templating model. J Invest Dermatol 2004;123(4):715-732.
4. Blichmann CW, Serup J: Hydration studies on scaly hand eczema. Contact Dermatitis1987;16:155-159.
5. Fartasch M: Atopic dermatitis and other skin diseases; in Fluhr J, Elsner P, Berardesca E, Maibach HI (eds): Bioengineering of the skin: Water and the stratum corneum. London,CRC Press, 2005, pp 159-170.
6. Martinsen ØG, Grimnes S, Kirkhus T, Mørkrid L, Aas K: Increased moisture content in children’s atopic skin. Eur J Pediat Dermatol 2007;17:17-20.
7. Martinsen ØG, Grimnes S, Nilsen JK, Tronstad C, Yang W, Kim H, Shin K, Naderi M,Thielmann F: Gravimetric method for in vitro calibration of skin hydration measurements. IEEE Trans Biomed Eng 2007;55:728-732.
8. Kilpatrick-Liverman L, Polefka TG: Use of dynamic vapour sorption meter to measure skin hydration properties in vitro. Skin Res Technol 2006;12:36-42.

9. Johnsen G, Martinsen ØG, Grimnes S: A preliminary investigation of the sorption properties of the stratum corneum in vivo. Proc IFMBE 2009;25:597-599.
10. Kasting GB, Barai ND, Wang TF, Nitsche JM: Mobility of water in human stratum corneum. J Pharm Sci 2003;92:2326-2340.
11. Liron Z, Clewell HJ, McDougal JN: Kinetics of water vapor sorption in porcine stratum corneum. J Pharm Sci 1994;83:692-698.
12. Kasting GB, Barai ND: Equilibrium water sorption in human stratum corneum. J Pharm Sci 2003;92:1624-1631.
13. Anderson RL, Cassidy JM, Hansen JR, Yellin W: Hydration of stratum corneum. Biopolymers 1973;12:2789-2802.
14. Crank J, Park GS: Methods of measurement; in Crank J, Park GS (eds): Diffusion in polymers. London, Academic Press, 1968, pp 1-39.
15. Fujita H: Organic vapors above the glass transition temperature; in Crank J, Park GS (eds): Diffusion in polymers. London, Academic Press, 1968, pp 75-105.
16. King G: Permeability of keratin membranes to vater vapor. Trans Faraday Soc 1945;41:479-487.
17. Hey MJ, Taylor DJ, Derbyshire W: Water sorption by human callus. Biochim Biophys Acta 1978;540:518-533.
18. El-Shimi AF, Princen HM: Diffusion characteristics of vater vapor in som keratins. Coll Polym Sci 1978;256:209-217.
19. Potts RO; Stratum corneum hydration: Experimantal techniques and interpretations of results. J Cosmet Chem 1986;37:9-33.
20. Pieper J, Charalambopoulou G, Steriotis T, Vasenkov S, Desmedt A, Lechner RE; Water diffusion in fully hydrated porcine stratum corneum. Chem Phys 2003;292:465-476.
21. Leveque JL; Water-keratin interactions; in Fluhr J, Elsner P, Berardesca E, Maibach HI(eds): Bioengineering of the skin: Water and the stratum corneum. London, CRC Press, 2005, pp 15-26.
22. Silva CL, Topgaard D, Kocherbitov V, Sousa JJS, Pais AACC, Sparr E; Stratum corneum hydration: Phase transformations and mobility in stratum corneum, extracted lipids and isolated corneocytes. Bioch Bioph Acta 2007;1768:2647-2659.
23. Inoue T, Tsujii K, Okamoto K, Toda K; Differential scanning calorimetric studies on the melting behavior of water in the stratum corneum. J Invest Dermatol 1986;86:689-693.
24. Rouse PE; Diffusion of vapors in films. J Am Chem Soc 1947;69:1068-1073.
25. Martys JL, Ho CL, Liem RKH, Gundersen GG; Intermediate filaments in motion: Observation of intermediate filaments in cells using green fluorescent protein-vitamin. Mol Biol Cell 1999;10:1289-1295.
26. Costa-Balogh FO, Wennerstrøm H, Wadso L, Sparr E; How small polar molecules protect membrane systems against osmotic stress: The urea-water-phospholipid system. J Phys Chem B 2006;110:23845-23852.
27. Norlen L; Skin Barrier structure and function: The single gel phase model. J Invest Dermatol 2001;117(4):830-836.


IV


V


A memristive model of electro-osmosis in skin
G K Johnsen1, C A Lutken1, Ø G Martinsen1,2 and S Grimnes2,1
1 Department of Physics, University of Oslo, Pb 1048 Blindern, 0316 Oslo, Norway2 Department of Clinical and Biomedical Engineering, The National Hospital,
University of Oslo, Norway
E-mail: [email protected]
Abstract. We show that some of the non-linear conductance properties of electro-
osmosis in sweat-duct capillaries may be modeled by a memristive circuit. This
includes both the observed phase shift and amplitude modulation of the electrical
current response to a simple harmonic driving potential. The memristor, a new type
of elementary passive circuit element recently invented by the semi-conductor industry,
may therefore be expected to play a role in modeling the electrical properties of skin,
and perhaps also in other systems where non-linearities are observed in their bio-
impedance.
PACS numbers: 06.30.Ka, 07.50.Ek, 84.32.-y, 84.37.+q, 87.19.R-, 87.85.jc
Submitted to: J. Phys. D: Appl. Phys.
1. Introduction
It is well known that non-invasive measurements of the electrical conductance of skin,
obtained by placing flat electrodes on top of the epidermis, depends on the current
flowing through the skin. This may, at least in part, be due to electro-osmotic transport
of water through the sweat-duct capillaries [1]. Our purpose here is to reexamine this
explanation by showing that electro-osmosis can be described using a memristive model,
whose defining property is that it has memory of the current having passed through
it, whence the impedance is not constant but some non-linear function of the current
history.
The memristor is a new elementary passive circuit element, complementing
resistors, coils and capacitors, whose memristance M(q) = dϕ/dq = v/i is defined by
how the magnetic flux ϕ =∫
v(t)dt responds to the charge dq = idt transported by the
electrical current i(t). Predicted from symmetry arguments by Chua [2], it remained a
theoretical curiosity for almost four decades until a team from Hewlett-Packard invented
an electronic nano-memristor [3]. We want to show that the memristor concept may
be useful in describing bio-physical systems, and in particular that the electro-osmotic
behavior observed in human skin can be thought of as a memristive system. Such

A memristive model of electro-osmosis 2
Reference
+
+
+
+
+
+
+
+
+
+
+
+
+
+
+
+
+
+
+
+
+
+
Electrode
w(t)
=x(t)
L
Mobile part of
double layer
Skin
We
ttin
g
L
y(t)
L
Figure 1. Schematic illustration of a sweat-duct capillary with wetting layers.
memristive properties are now believed to be rather common in very small systems
(cmp. Ref. [3]). This includes the extremely tiny electronic components built from
semi-conductors, but this is also the scale where the collective degrees of freedom used
in bio-physics and biology start to emerge from the underlying molecular chemistry.
Memristive systems are generalizations of the memristor concept where the
memristance is controlled by a number of state variables [4]. This study extends the
preliminary results reported in an earlier study [5] to include two microscopic state
variables, whose physical origin is explained and which explains further properties of
electro-osmosis.
In dry skin most pores and capillaries are empty or only partly filled, but conductive
films are believed to be present also in the otherwise empty parts of these ducts [6, 7].
With dry electrodes applied on the skin surface on the ventral forearm, an increase in
conductance may occur if water is dragged by the applied electric field from deeper
layers towards the surface where the electrode is located. The amount of filling in the
capillary will be influenced by the electro-osmotic transport of water, as illustrated in
figure 1.
When the mobile part of the conductive double layer is subjected to an externally
applied electric field, the ions which are set in motion drag along the fluid column in the
filled part of the duct because of viscous forces. Consequently the volume V of water
in the capillary changes at a rate (flux) dV/dt, since fluid is supplied or extracted at
the bottom of the duct from or to the surrounding tissue. This flux is proportional to
the cross-section area A = πr2 of the capillary, the applied electric field E, the electro-
kinetic potential ζ at the interface between the duct wall and the fluid and the relative
permittivity ε, and inversely proportional to the viscosity η of the fluid [8]. Lumping the
systemic parameters into one with suitable dimensions for our problem, α = ζε/(4πη),
we obtain Glasstone,s fundamental equation:
dV = αAE dt . (1)

A memristive model of electro-osmosis 3
Figure 2. Current response (solid curve) and applied voltage (dashed curve) on ventral
forearm using dry disc electrodes (data from Ref. [1]).
Since E(t) = v(t)/L, with L the total length of the capillary, and α < 0 because
ζ < 0 in a sweat duct [9], we see that the volume of the water column increases when
the electrode potential is negative. A rising column reduces the total resistance so we
expect the current to increase in value.
A typical electrical current response measured on human skin using dry disc
electrodes is shown in figure 2. As expected, the value of the current increases as
the applied field changes from positive to negative polarity at the skin surface electrode,
because of the electro-osmotic transport of the filled part of the ducts. A negative
potential attracts the water column, whereas a positive potential depresses it.
Furthermore, the current amplitude was found to increase from one cycle in the
applied periodic voltage signal to the next, described as effects of “wetting” in Ref. [1].
This effect is thought of as a build-up of fluid in the duct over a series of current cycles.
As the fluid column oscillates, it deposits more water on top of the thin film covering the
wall (the duct wall is “wetted”), leading to reduced duct resistivity, and hence increased
current. The height w(t) of the water table will be a function of the amount of charge
having passed through the duct, whence we recognize this as a memristive system, i.e.
a system with some “memory” of its electrical history.
2. Memristive modeling of electro-osmosis
A partial explanation of these data was proposed in Grimnes [1], by relating the observed
changes in skin conductance to fluid motion through electro-osmosis. An improved
understanding, and a better quantitative analysis, may be obtained by using the concept
of memristance. The immitance M defined below in eq. (2) is physically distinct from
ordinary bio-electric impedance since it has memory, and is therefore an example of the
memristance of a memristive system defined by Chua [2, 4]. More precisely, by deriving

A memristive model of electro-osmosis 4
expressions for the charge function q(t) and the corresponding current i(t), we shall see
that an electro-osmotic capillary behaves like a charge-controlled memristive system.
From figure 1 it is clear that an electrical current flowing through a capillary of
total length L meets a total instantaneous (i.e., at any instant in time) resistance M(t)
composed of three resistances coupled in series:
M(t) = R(x(t), 1) + R(y(t) − x(t), τF ) + R(1 − y(t), τf) . (2)
Observe that not only are these “resistors” time dependent, their time evolutions are
inextricably intertwined with each other.
The electrical resistance of each section of the capillary depends on the length l and
thickness d of its wet volume. We normalize so that the (unobservable and microscopic)
state variable is the longitudinal filling fraction z = l/L, while the transverse filling
fraction τ(d) for a film of thickness d is the fraction of the total cross-sectional area of
the capillary that is filled by the film:
τ(d) =A(d)
A(r)=
d
r(2 −
d
r)
d<<r−→
2d
r. (3)
Thus τ(d = r) = 1 in the full part, while τ << 1 for both the thin film (f) of thickness
df << r and the fat film (F) of thickness dF << r. We then have
R(z, τ) =z(t)
τ(d)R• , (4)
where R• = ρL/A is the minimum possible total resistance, which obtains when the
capillary is completely filled (z = τ = 1) with our electrolyte (sweat), which has
electrical resistivity ρ. The maximum possible total resistance Ro = R•/τf >> R• is
reached when the capillary is completely empty save the thin film coating the capillary
wall. The longitudinal fractional filling of water is called x(t) = w(t)/L, and y(t) is the
fractional height reached by the thick film, cmp. figure 1.
The wetting problem is most naturally parametrized by
δ =τf
τF
≈df
dF
≤ 1 , (5)
with δ = 1 when there is no wetting, i.e., dF = df . We can use δ to express the total
resistance (actually, memristance) in terms of a single dimensionless function (measured
in the natural unit Ro):
M [Ro] =M
Ro
= 1 − δx(t) + (δ − 1)y(t) . (6)
Note that this memristance depends on time through the two microscopic and
unobservable state variables x(t) and y(t), and in order to progress we must now deal
with these. We first trade x for a measurable quantity (charge or current) by exploiting
Glasstones law.
During a small time interval dt the volume of water in the capillary changes by
dV = Adw = ALdx = V•dx , where V• = AL is the total volume of the capillary.
Another expression for dV follows from Glasstones law, eq. (1), if we assume that
all of the current i(t) = dq/dt passes through the water column. The potential drop

A memristive model of electro-osmosis 5
over this part of the capillary is Ew = ρwi/A, which is used to eliminate the electric
field strength from Glasstones law, giving dV = αρdq. Equating the two expressions
for dV we find the simple differential equation dx = −c1dq, where c1 = −αρ/V• > 0 is
a systemic constant.
This immediately integrates to x(t) = x0 − c1q(t), where x0 is the initial position
of the water table at t = 0. The sign of q is chosen so that a negative current gives the
water table a positive velocity dx/dt > 0, as required by the experimental findings in
Ref. [1]. Inserting this expression for x(t) into eq. (6) gives the memristance:
M [Ro] = c0(δ) + δc1q(t) , (7)
where the new function:
c0(δ) = 1 − δx0 + (δ − 1)y > 0 (8)
at first sight appears to depend on a time-dependent function y(t). However, this is a
general expression for the memristance in the duct, valid with or without wetting, and
it will turn out that y = y0 is a constant in the former case.
In the latter case δ = 1 and y drops out. This describes the first half-cycle after a
negative driving potential v(t) = −v0 sin(ωt) (v0 > 0) is applied. This ensures that the
water table that initially only is filling the lowermost parts of the sweat duct is attracted
to the electrode. Electro-osmosis will, as long as the driving potential remains negative,
drag the water table in the duct towards the electrode located at the skin surface [1].
When the driving potential after a time T/2 changes from negative to positive the water
table is at its maximum height x(T/2) = y0, and the memristance is at its lowest value.
With a positive potential the electro-osmotic force flips sign, pushing the water
table back into the sweat duct and leaving behind a thickened film. This additional
film is the wetting-effect, and now the total memristance will consist of a series of three
volume conductors: two films and the decreasing water table. The total memristance
is now lower than it would have been without wetting. The current flow is therefore
larger, pushing the water table deeper down in the duct, beyond its starting point x0.
In other words, after a full period (t = T ), the first half without wetting and the
second half with, we find that x(T ) < x0.
If we now assume that further wetting does not take place, i.e. that the film can
only have two thicknesses, then the subsequent periods are quite different since the half-
cycles are now symmetric. The water table will therefore return to the same maximum
height y0 at times tn = nT/2 for each odd integer n, and to its minimum value x(T )
at times tn for each even positive integer n. This heuristic description will be verified
analytically below.
In this model we have ignored the so-called “clipping” effect which is expected to
happen when the driving potential is positive and the water table is repelled by the
surface electrode. Then the film eventually looses contact with the electrode on top of
the duct, yielding no current for a short period until the film diffuses back and remains
in contact with the electrode which again repels the film, etc. This repeats as long as
the potential is positive and leads to a reduced current during this interval, and can

A memristive model of electro-osmosis 6
be seen in the data reproduced in figure 2. There is therefore less current to drive the
water table downwards by electro-osmosis and the table does not reach back to its lowest
position where it was one period earlier. With x(tn) > x0 (n odd) the water table will
reach higher up in the duct at its next maximum, giving a higher value of the current
due to an increase in the wetting-effect for each period of the driving potential. This is
also as reported in the original paper by Grimnes [1].
In summary, in our mathematical model, which includes wetting but not clipping,
we need a negative initial potential in order to account for the observed increase in
current amplitude with time. When clipping is present the current amplitude will
increase for each cycle as discussed above, and a positive initial potential could have
been applied.
We now look in detail at the two basic intervals of interest, where we have either
1-film or 2-film memristance.
2.1. Memristance without wetting (thin film of constant thickness)
This is the first half-period 0 < t < T/2 after the driving potential is switched on. The
memristance during this time is simply:
M(q) = Ro(c0 + c1q) , (9)
with c0 = c0(1) = 1 − x0 > 0.
By integrating Ohms law v(t)dt = M(q)dq we find the charge as a function of
magnetic flux ϕ =∫
v(s)ds:
c1q(t) = −c0 +√
c20 + 2c1ϕ(t)/Ro . (10)
As explained in the introduction we choose a driving potential v(t) = −v0 sin(2πt/T )
that starts out negative (v0 > 0), which gives the flux ϕ(t) = −(v0T/π) sin2(πt/T ). The
flux-charge characteristic is shown in the inset in figure 3.
The current is given by i = Gv, where the memductance G = 1/M is obtained from
eq. (9) by inserting our result eq. (10) for q(t):
M = Ro
√c20 + 2c1ϕ(t)/Ro . (11)
2.2. Memristance with wetting (film with varying thickness)
As soon as t > t1 = T/2 wetting starts to modify the total memristance of the system:
M(q)[Ro] = c0(δ) + δc1q , (12)
where δ = df/dF is the ratio of the thickness df of the thin film and the thickness dF of
the thick film left behind by wetting the thin film. We have no restrictions on δ in our
model, apart from δ ≤ 1.
This M governs the current for all t > t1, and the charge and current functions are
obtained by the same argument used in the non-wetting case discussed above. We find
the charge valid for t > t1 = T/2
δc1 q(t) = −c0(δ) +√
c0(δ)2 + 2δc1ϕ(t)/Ro , (13)

A memristive model of electro-osmosis 7
−1.5 −1 −0.5 0 0.5 1 1.5
x 10−5
−4
−2
0
2
4
Current (A)
Volta
ge (V
)
−7 −6 −5 −4 −3 −2 −1 0−1.8
−1.6
−1.4
−1.2
−1
−0.8
−0.6
−0.4
−0.2
0x 10
−5
Flux
Ch
arg
e
Figure 3. Current-voltage characteristic of the memristive model deduced for skin
sweat ducts, shown for ω = 2π/T = 0.2 Hz and ω = 5 Hz. Inset: Charge-flux
characteristic of the memristor.
where the c0(δ)-term has been updated by the fractional height of the thick film is
y = xmax = x(t1) = x0 − c1q(t1) in order to include also the effects of wetting.
The current is given by i = Gv, where the memductance G = 1/M is obtained
from eq. (12) by inserting our result eq. (13) for q(t):
i(t) = v(t)/Ro
√c0(δ)2 + 2δc1ϕ(t)/Ro . (14)
It is now easy to verify that q(t3 = 3T/2) = q(t1), from which it follows that x(t)
returns to the same value for all later times tk = (2k + 1)T/2 with k = 0, 1, 2 . . ., as
claimed above. The expression for i(t) deduced from M(q) is therefore valid for all
t > T/2.
Figure 3 shows this current plotted against the potential v = −v0 sin(ωt), with
ω = 2π/T and δ = 0.5. For a suitable choice of parameters hysteresis in the iv-
characteristic, which is the fingerprint of memristance, is in evidence at low frequencies,
with curves running through the origin in double loops. At higher frequencies, the iv-
characteristic degenerates to a straight line, i.e., the memristor behaves like an ordinary
resistor.
The inset in figure 3 shows the charge-flux characteristic with the harmonic
driving potential, for which the flux is ϕ(t) = −(2v0/ω) sin2(ωt/2). Evidently the qϕ-
characteristic is single valued, as it must be for charge-controlled memristive systems
[2].
A smaller δ will result in a reduced memristance M and an increased current i(t).
If δ = 1, then there is only one single film and no wetting at all, meaning no increase
in the current amplitude. Figure 4 illustrates how the current in the sweat duct given
by our memristive model behaves for a suitable choice of system parameters, for some
possible thicknesses of the wetting layer. The current response is similar to the behavior

A memristive model of electro-osmosis 8
0 2 4 6 8−1.5
−1
−0.5
0
0.5
1x 10
−5
Time (s)
Cur
rent
(A)
δ=1δ=1/2δ=1/4v(t)
“clipping”
“wetting”
dx/dt > 0 dx/dt < 0
Figure 4. Scaled applied voltage (solid) and current responses for different thicknesses
of the wetting layer.
seen in the data displayed in figure 2. The current amplitude increases with wetting
when the applied potential is negative, and the phase shift is positive so that the current
lags behind the driving potential. The positive current amplitude is larger in our model
than seen in figure 2 since the depressing clipping-effect is not accounted for.
3. Discussion
We have demonstrated that an improved understanding of skin conductance can be
obtained by using the memristive paradigm defined by Chua, which goes beyond the
traditional “resistive (RLC) framework”. This shows that that the memristor may
be a suitable circuit component for modeling bio-physical systems whose electrical
parameters depend on their (electrical) history, in particular when hysteresis and phase-
shifts are present. The expression for the memristance of sweat duct capillaries obtained
in eq. (7) clearly exhibits the explicit charge dependence of this “device”, showing that
it is memristive rather than resistive.
A closer examination of the memristance M is instructive. Resurrecting the
dependence on systemic parameters we can write eq. (7) as:
M [Ro] = c0(δ) −αδR•
L2q(t) , (15)
which exhibits how M depends on the scale L of the “device”. It is clear that M will
only deviate significantly from a resistance when L is small, as the charge-dependence is
suppressed by L2. Since there are many bio-physical systems, including skin capillaries,
that are very small, we suggest that memristance may be useful for explaining a variety
of non-linearities seen in bio-physics and bio-electricity, effects that in many cases are
not yet fully understood.

A memristive model of electro-osmosis 9
The frequency band where memristive properties are seen will in general depend
on the “speed” of the system, that is how rapid the water table responds to changes
in the driving potential. High frequencies will depress the memristive character of the
system, since the liquid column has inertia and therefore needs time to respond to the
applied field.
Figure 3 shows the typical feature of memristors when studied in the qφ plane,
giving a single-valued and non-linear characteristic. This agrees with Ref. [3], which
also reported a non-linear qφ-characteristic in the semi-conductor nano-memristor that
they invented.
The effect of “clipping” has been left out of our model due to its complexity, but
it should probably be taken into account in order to explain the continued increase in
current amplitude over several cycles observed in Grimnes [1]. The net effect of clipping
is a reduced average current, which is actually a highly jagged current smoothed out at
the small frequency (ω = 0.2Hz) used in the experiment shown in figure 2. At higher
frequencies the resolution improves, and at ω = 500 Hz the current curve appears to
be ragged around the peaks, but not elsewhere [1]. While his observation supports the
clipping-explanation, including clipping in our model would increase its non-linearity
substantially, beyond our ability to analyze the model properly.
Figure 4 shows how the value of the wetting parameter 0 < δ = df/dF ≤ 1
determines the amount of current passing through the capillary duct. Since the thickness
of the wetting-film is unknown it is hard to reach a definite conclusion about the
importance of the wetting-mechanism in real systems. A reasonable estimate is perhaps
that wetting doubles the film thickness (δ ≈ 0.5), in which case it should not be
neglected.
Another uncertain aspect of our model is that we assume that the wetting film
remains more or less constant in height y during a cycle, i.e., that diffusion processes
do not have sufficient time to smear out the film.
Our model does not so far include electrical activity in the epidermal stratum
corneum itself, which usually acts in parallel to the sweat ducts [9]. Some of the activity
in the stratum corneum is conventionally modeled using a theoretical device called “the
constant phase element (CPE)”. This is not a real device which can be built from a
finite number of conventional (RLC) passive circuit elements [9, 10]. It would be of
great interest to study how the new memristive circuit element can be used in this type
of more sophisticated modeling.
4. Conclusion
We have shown that the fourth fundamental circuit element, discovered theoretically
by Chua but “missing” in real life until HP invented such a nano-device recently, can
be used in modeling electro-osmotic properties of capillaries in skin. The memristive
paradigm should be useful in describing other non-linear phenomena that appear at
small scales. Such phenomena have frequently been observed in electronics, physics and

A memristive model of electro-osmosis 10
biological systems, but have often remained unexplained. Memristors clarify and enable
circuit modeling of non-linear systems, and therefore promise to be useful in circuit
modeling of bio-physical mechanisms, particularly bio-electrics.
References
[1] Grimnes S 1983 Med. Biol. Eng. Comput. 21 739.
[2] Chua L O 1971 IEEE Trans. Circuit Theory 18(5) 507.
[3] Struckov D B, Snider G S, Stewart D R, and Williams R S 2008 Nature 453 80.
[4] Chua L O, and Kang S M 1976 Proc. IEEE 64 209.
[5] Grimnes S, Lutken C A, and Martinsen Ø G 2009 Proc. IFMBE 25 696.
[6] Randall W C 1946 Am. J. Physiol. 147 391.
[7] Grimnes S 1982 Med. Biol. Eng. Comp. 20 734.
[8] Glasstone S 1946 Textbook of Physical Chemistry Van Nostrand.
[9] Grimnes S, and Martinsen 2008 Bioimpedance and Bioelectricity Basics, 2.Ed. Academic Press
p283.
[10] Fluhr J, Elsner P, Berardesca E, and Maibach H I 2005 Bioengineering of the Skin, 2. Ed. CRC
Press p 335.

VI


A study on electrode gels for skin conductance measurements
Christian Tronstad1, Gorm Krogh Johnsen2, Sverre Grimnes1,2 and Ørjan G. Martinsen2,1 1 Department of Clinical and Biomedical Engineering, Oslo University Hospital-Rikshospitalet, Norway 2 Department of Physics, University of Oslo, Norway
Abstract Low-frequency skin conductance is used within several clinical applications and is mainly sensitive to sweating and the moisture content of the stratum corneum (SC), but also how electrodes introduce changes in the electrical properties. Four electrode-gels were investigated with regard to sorption characteristics and electrical properties. Skin conductance time-series were collected from 18 test subjects during relaxation, exercise and recovery, wearing different pairs of electrodes contralaterally on the hypothenar and the T9 dermatome. Pressure test was applied on the T9 electrodes. Impedance frequency sweeps were taken on the T9 electrodes the same day and the next, parameterized to the Cole model. ANOVA on the initial skin conductance level change, exercise response amplitude, recovery offset and pressure-induced changes revealed significant differences among gel types. The wetter gels caused a higher positive level change, a greater response amplitude, larger recovery offset and greater pressure-induced artifacts compared to the solid gels. Sweating on the T9 site lead to negative skin conductance responses for the wetter gels. Correlations were found between the desorption measurements and the initial skin conductance level change (hypothenar: R=0.988 T9: R=0.901) RM-ANOVA on the Cole parameters revealed significant decrease in Rs of the most resistive gel. Clinical implications are discussed. PACS codes: 82.45.Fk Electrodes 84.37.+q Measurements in electric variables (including voltage, current, resistance, capacitance,
inductance, impedance, and admittance, etc.) 84.37.+q Electric impedance measurement 87.19.R- Electrical properties of tissues Submitted to Physiological Measurement Keywords: Sweat, skin conductance, electrodes, water sorption, stratum corneum, electrodermal activity, sweat glands
1. Introduction
The electrical admittance of the skin is dependent on several factors. The epidermal Stratum Corneum (SC) layer, consisting of mainly dead skin cells, gives a large impedance in series with the viable skin, dominating the measurement at low frequencies (below 10kHz) (Martinsen et al 1999). The low-frequency skin admittance measurement then becomes highly sensitive to mechanisms occurring in this layer, mainly the ionic shunting provided by the sweat ducts as they are filled with sweat and the absorption of water in the SC. The admittance contribution from the sweat duct is predominantly conductive (Martinsen et al 1998), while the SC moisture content also significantly influences the low-frequency capacitive part of the admittance (Martinsen et al 1995, 1998, Martinsen and Grimnes 2001). The high sensitivity of the skin conductance to sweat activity has opened up for several clinical applications. Due to the link between palmoplantar sweating and the sympathetic nervous system, this parameter has found its use in psychophysiology as a tool for stress assessment (Healey and Picard 2005, Setz et al 2010), assessment of psychiatric disorders (Iacono et al 1999, Nilsson et al 2006) among other uses, often in combination with other

physiological parameters. Within anesthesia, it has been proposed as a tool in pain assessment (Ledowski et al 2007, Hullett et al 2009). Skin conductance at other skin sites has been proposed for the diagnosis and treatment evaluation of hyperhidrosis (Tronstad et al 2008), and may be a promising tool for diabetes (Hoeldtke et al 2001), cystic fibrosis (Quinton 2007) and various neurological disorders. It is known that the choice of electrodes for electrical measurements will heavily influence the signals that are measured (McAdams et al 1996, Mayotte et al 1994 and Rahal et al 2009), and so it is important to find the best suited electrode for the intended use. Depending on how the measurements are interpreted, artifacts introduced by the electrodes could lead to incorrect dianostic assessments. Studies of electrode properties have previously been carried out in different ways (Rahal et al 2009, Eggins 1993), but not with focus on monopolar skin conductance measurements combined with an in vitro sorption study of the water holding properties of the electrode gels. In addition, the authors are not aware of any studies where parameters from skin conductance time-series have been compared between different electrode gel types recorded simultaneously on the same test subjects. In this study we investigated four different types of electrode gels for skin conductance measurements. As a low frequency monopolar set-up will focus mainly on the SC, its general hydration state, and sweat filling in particular, will be very dominant for what is being measured. SC hydration may be affected by occlusive effects, but also through a direct and sometimes rapid hydration from the electrode gel. We compared the amount of free water in the electrode gels in vitro with the results from electrical in vivo measurements with the aim of finding how different electrode types will affect the skin conductance recordings. In particular, we wanted to investigate the stability of the skin conductance level, the response to sweating stimuli, the post-stimulus recovery and the susceptibility to mechanical artifacts. As both SC properties and innervation differ according to skin site, especially on palmoplantar skin compared to non-palmoplantar skin (Kuno 1956), we included the T9 dermatome on the abdomen in addition to the hypothenar site on the palm for this study.
2. Materials and methods 2.1. Electrode types Four electrode types were investigated, all with similar Ag/AgCl metallic part, but different composition of the gel. The a priori gel properties of the different electrodes are listed in table 1.
Table 1. Overview of the electrode gel types examined in this study according to gel material, the intended use, effective electrode area (EEA) and type of adhesion.
Type Gel material Intended use EEA [cm2] Adhesion A Solid hydrogel ECG, neonatal 5.05 Adhesive gel B Wel gel ECG, short-term 2.54 Outer adhesive part C Isotonic EDA jelly EDA 1.95 Outer adhesive part D Karaya solid gel ECG, hypoallergenic 6.16 Adhesive gel
The brands of the electrode types were as follows: Type A: Kendall™ KittyCat™ 1050NPSM Type B: Ambu® Blue Sensor Q-00-A Type C: Discount Disposables, model TD-246 Skin Resistance – Skin Conductance Electrode Paste Type D: Kendall™ Arbo™ H83V 2.2. In vitro sorption characteristics The sorption characteristics of the four different electrode gels were obtained using a gravimetric method where water loss and water gain could be monitored carefully. A dynamic vapor sorption instrument (DVS) from the Surface Measurements Systems (London, UK) was used in this purpose. This instrument enables very sensitive gravimetrical measurements that can be performed under controlled environmental conditions, ensuring high-precision and reproducible results. The mass-resolution of the instrument is 0.1 μg, and the gel-samples in our

study had a mass in the range of 4-10 mg at measurement onset. This means that the sample masses during the entire sorption cycle were well above the resolution of the instrument, resulting in smooth time series. The gel-samples were loaded into a metal pan in a closed chamber where temperature and relative humidity (RH) was pre-programmed and carefully monitored. The two solid-gel samples, A and D, were prepared by means of sterile scalpels to be of approximately the same size and geometrical shape (cubics). The wet-gel B was scratched off the attach-surface of the electrode and placed in the metal pan as a small droplet. Finally, the cream-based gel C was loaded into the pan by gently squeezing the bottle containing the cream. The samples were measured one at the time and all four measurements were initiated immediately after sample preparation was finished. The RH was pre-programmed to increase in steps of 10%, from 0% up to 90% and then back to 0%. The temperature was kept stable during the entire measurement at 25ºC. The mass reading found at 0% RH was taken to be the dry mass of the sample. A step in RH was initiated when the mass rate, dm/dt, was less than 20 ppm for a period of at least 10 min, ensuring the samples to reach their equilibrium state at every level of RH. The characteristic time constants, which yield the time needed for the sample mass to step approximately 63% of the entire increase needed to reach its stable state value, were obtained by fitting the time courses for each increment in RH to . The time constants are then given by . 2.3. In vitro electrical characteristics Electrical impedance frequency sweeps were taken on fresh pairs of each electrode type attached front to front using a Solartron 1260+1294 setup with a constant voltage excitation of 30 mV rms and a frequency range from 1Hz to 100 kHz. 2.4. Skin conductance measurement The three-electrode system (Grimnes 1983b and Grimnes et al 2009) was used to obtain unipolar measurements of the skin surface conductance density (SSCD) of the area below the effective electrode area of the measuring electrode. AC measurement was used to avoid polarizing the skin or electrodes and to avoid contribution from endogenous potentials in the skin. For single-frequency SSCD time-series recording in four channels, the Sudologger (Tronstad et al 2008) was used. Impedance frequency sweeps from 1 Hz to 100 kHz were taken using the Solartron 1260+1294 equipment. Constant voltage excitation of 30 mV RMS magnitude was used for both equipments to keep the current density low and the measurement within the linear range. 2.5. Test subjects and protocol 18 (14M, 4F) healthy volunteers who gave informed consent were each assigned to two of the four electrode types for contralateral comparison of measured SSCD parameters. Initially, the test subject (TS) was asked to sit down in a chair while measuring electrodes were placed simultaneously on the left and right hypothenar site of the palms and about 4cm to the left and right of a point slightly above the navel on the T9 dermatome. The measuring electrodes on each side of the body were of the same type and the selection was based on a matrix of all six possible pairwise combinations of the four types.
After electrode fixation, the SC was recorded for 10 minutes while the TS was sitting still in the chair. During the last four of these minutes, the TS was asked to remain quiet and focus on relaxing in order to obtain a baseline. At the 10th minute, a loud sound (2.5s sound sample of a glass breaking played by a set of speakers at an intensity measured to be 82dB 1m in front) was played to induce a startle response and the TS was asked to stand up and perform squats for two minutes to induce thermal sweating. This was followed by 15 minutes of sitting relaxation until a test for pressure artifacts on the abdomen electrodes was performed by an operator. The TS was asked to relax the diaphragm while the operator pushed the electrodes equally and simultaneously inwardly on the abdomen for 10 seconds, pushing as far as to the point where the tissue would no longer compress easily. This was followed by two minutes of recording to check whether any SSCD offset would remain or recover to the previous level. The palmar electrodes were then removed and electrical impedance frequency sweeps were taken on both of the abdomen electrodes. The TS was then wearing these electrodes until returning the next day, approximately 24 hours later, for a control measurement. For the prewired electrodes, the wire was taped to the skin in order to

avoid pull on the electrode. The TS was instructed to pursue normal activities and not to give the electrodes any consideration except for not showering the abdomen area. For all the electrodes which were still attached on the next day, new impedance sweeps were taken both with the electrodes as they were and after a refixation of the electrodes by gentle pressure on the adhesive area. After gentle removal of the electrodes, photographs of the skin areas were taken. The pictures were evaluated by a dermatologist for signs of skin irritation caused by the electrode gel. 2.6. Data analysis Sudologger measurements were scaled to a unit of μS/cm2 (SSCD) for comparison between electrodes of different effective electrode area. For the SSCD time-series, the following parameters were extracted:
Level change during the initial 10 minutes after electrode-skin contact. Amplitude of the SSCD change during the 2 min exercise interval, calculated as the maximum deviation
from the prestimulus baseline. Offset between the prestimulus baseline and the level reached after the 15 minutes of recovery following
the exercise interval. In some cases there were spontaneous responses during the end of the recovery, hence the minimum value within the last two recovery minutes was subtraced by the prestimulus baseline to obtain this parameter.
Change induced by the pressure test on the electrodes, calculated as the maximum deviation from the prestimulus baseline during an interval of the applied pressure time + 5 s.
Offset between the level two minutes after the pressure test and the level before the applied pressure.
Separate but equal statistical analyses were done for the hypothenar and abdomen measurements. ANOVA was done on all the parameters. Test for normality was done using the Shapiro-Wilk test and the Kruskal-Wallis ANOVA on ranks was used when the test for normality test or equal variance did not pass. For pairwise multiple comparison, the Holm-Sidak t-test was used when the normality test passed and the Student-Neuman-Keuls test was applied otherwise. For cases of missing values, the Dunn’s Test was used instead. For the Solartron impedance frequency sweeps, the measurements were parameterized using a Cole system electrical equivalent model (Grimnes and Martinsen 2005). Using the curve-fitting tool in the ZView 3.0a software (Scribner Associates Inc.), the Cole-parameters Rp, Rs, Ycpe and alpha were determined with a median accuracy of 1.77% fit error. In a few cases with poor electrode-skin contact on day 2, the impedance measurement was inaccurate leading to a poor fit. The parameters with an error larger than 10% were excluded from the analysis. Repeated measures ANOVA was done on each of the Cole parameters, grouped into the day 1 measurements and both the day 2 measurements. The same tests as for the time-series parameters were applied for pairwise multiple comparison. For comparison between the wetness of the gels and the skin conductance measurements, Pearson product moment correlation coefficients and p-values were calculated between the initial relative mass change of the gels in the DVS at 0% RH and the median initial level change of the SSCD time-series. 3. Results 3.1. In-vitro results Figure 1 shows the relative water uptake of the four different gels as the RH was altered in steps from 0% up to 90%. The mass value at 0% is taken as the dry mass of the gel, meaning that the initial values at the far left in the figure represent the relative amount of water in the gel as it will be before any electrode to skin attachment in the electrical measurements. The wet gel in our study, the type B gel, contained the highest amount of water initially, almost doubled compared to the cream based C gel, whereas type A and D were very similar, with little amounts of free water to be depleted into the environments. The types B and C gels did not regain their initial water content, even at 90 % RH, although B took up an amount of water corresponding to several times its own dry weight. The A and D gel, on the other hand, more than doubled their weight during the absorption process.

There were few signs of hysteresis in our measurements, which would correspond to a gap between absorption and desorption steady-state mass values at a given value of RH. Only for the B gel there was hysteresis in a range where the RH value was between 60 % and 80 %, where the gel remained more of its water content during desorption compared to absorption. The time courses following a step in the RH were found to closely follow an exponential curve which is in accordance with Fick’s law of diffusion.
Figure 1. Relative water uptake of the four gels tested in our study. The arrows in the figure to the right indicate the
direction of the sorption process, both initially after sample placement n the DVS chamber as well as in the hysteresis.
The characteristic time constants for water entering and leaving the gels are shown in figure 2. The values to the far left in the graphs are the typical values for how rapid the gels, starting from their initial (manufactured) hydration state, will reach equilibrium with the dry air in the DVS chamber at 0% RH. The smaller this value was, the faster the gel deposited water into its environment. Again, the A and D gels showed very similar patterns, both during absorption and desorption. The B gel gained and released water very rapidly for almost all RH values, whereas the cream based C gel gained water with a markedly decreasing rate as the RH was increased. During desorption the C gel needed long time to reach its equilibrium state for each decrement in RH.
Figure 2. Time constants for the four different gels tested in our study. The points to the far left in the graphs illustrate the
characteristic time for the gels to reach equilibrium with the dry chamber, starting from their initial hydration state.
The in vitro electrical measurements of the gels revealed a higher AC resistance of gel type D than the others, represented in table 2 at 1 Hz and 100 kHz for a single electrode by halving the measured resistance. These measurements are sensitive to the dispersions from both the metal-gel polarization impedance and the gel, and would not parameterize with a good fit according to a single Cole system.
Table 2. Front to front AC resistance [Ω] at low and high frequencies for all the gel types.

Frequency A B C D 1 Hz 92.6 195.9 156.4 4870 100 kHz 48.7 24.2 41.0 177.6
3.2. In-vivo results The ANOVA revealed significant differences among the electrode types for all the time-series parameters. Figure 3 a) and b) shows that on both the hypothenar and T9 sites, electrode type B had the highest change in SSCD after electrode fixation followed by electrode C. Type A and D had lower and roughly equal medians, but with a slightly lower interquartile range (IQR) for electrode A. Figure 3 c) reveals that on the hypothenar site, electrode type B gave a significantly higher response amplitude than the other types. This is also true for the T9 site, however the type B response is negative in this case. The ability to recover towards baseline after a period of sweating is presented in figure 3 e) and f). Again, we see the highest offset for type B on both sites, while type A has the lowest median/mean offset and IQR/variance. A difference between the sites is seen on the type C offset, with clearly lower ability to recover on the T9 site than on the hypothenar site. Correlations were found between the initial change in SSCD (Fig 3 a) and b) ) and the initial relative mass change in the DVS at 0% RH with an R=0.988, p<0.05 for the hypothenar and R=0.901, p<0.1 for the T9 site. Significant differences were also found in the susceptibility of the electrode types to pressure artifacts. As figure 4 a) and b) shows, types B and C were more affected by the pressure test than types A and D. Again, type A scored the lowest offset and IQR with type D not far behind. The differences between the SSCD measurements from different electrode types were most clearly seen on the recordings using certain pairs of electrode types simultaneously on the same subject. Typical examples of these findings are presented in figure 5. The tendency of types B and C to initially increase the SSCD was absent for types A and D in the same subjects. Figure 5 b) displays how type B can feature a negative response to sweating on the T9 site while type A at the same time expectedly gives a positive response on the same site. In figure 5 a) and c), the most visible difference between the electrode types on the hypothenar is in the long-term changes of the SSCD level where type A seem to be more stable than type B and D. However, there were also some differences in the spontaneous SSCD responses recorded, where a few responses could be seen in type B which were absent or vanishingly small in type A. Figure 5 a) and d) shows the tendency of either type B or C to remain elevated after the sweating compared to type A or D. An intraindividual comparison of type B and C is shown in figure 6, exhibiting a special case on the T9 site where type B and C initially drift apart, converges and overlaps during the exercise interval and proceeds to drift apart again.
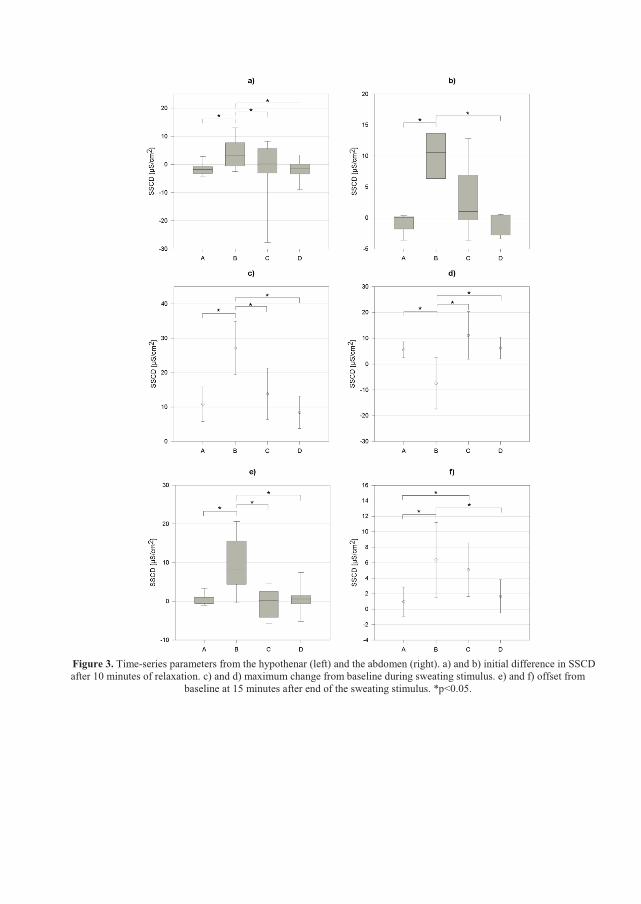
Figure 3. Time-series parameters from the hypothenar (left) and the abdomen (right). a) and b) initial difference in SSCD after 10 minutes of relaxation. c) and d) maximum change from baseline during sweating stimulus. e) and f) offset from
baseline at 15 minutes after end of the sweating stimulus. *p<0.05.

Figure 4. Quantization of pressure-induced artifact on the electrodes. a) Maximum deviation from baseline during
pressure time + 5s. b) Offset from baseline two minutes after the end of applied pressure. *p<0.05
Figure 5. Examples of features found with simultaneous recordings using different electrode types on the same subjects.
a) hypothenar recording using types A and B. b) T9 recording using types A and B. c) hypothenar recording using types A
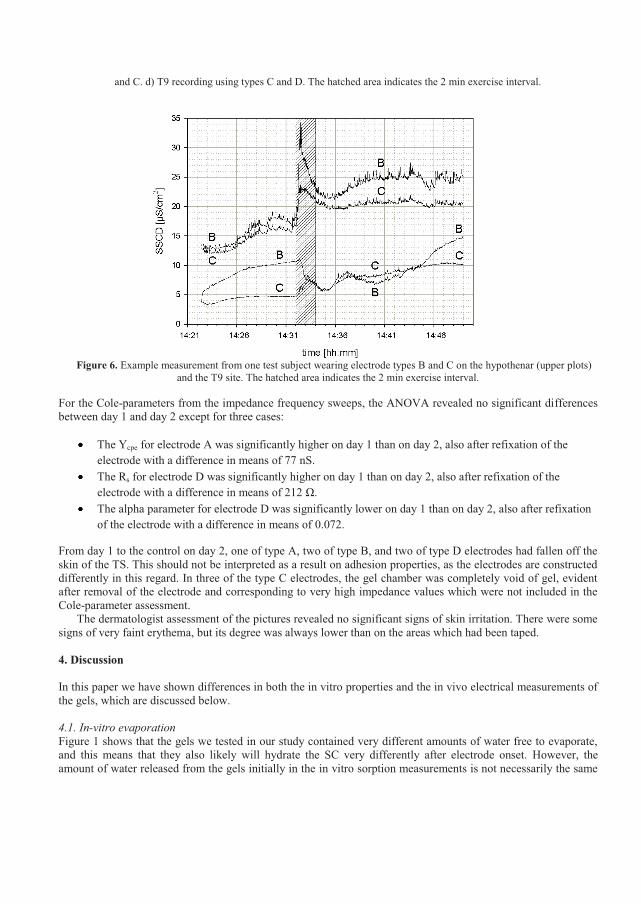
and C. d) T9 recording using types C and D. The hatched area indicates the 2 min exercise interval.
Figure 6. Example measurement from one test subject wearing electrode types B and C on the hypothenar (upper plots)
and the T9 site. The hatched area indicates the 2 min exercise interval.
For the Cole-parameters from the impedance frequency sweeps, the ANOVA revealed no significant differences between day 1 and day 2 except for three cases:
The Ycpe for electrode A was significantly higher on day 1 than on day 2, also after refixation of the
electrode with a difference in means of 77 nS. The Rs for electrode D was significantly higher on day 1 than on day 2, also after refixation of the
electrode with a difference in means of 212 Ω. The alpha parameter for electrode D was significantly lower on day 1 than on day 2, also after refixation
of the electrode with a difference in means of 0.072.
From day 1 to the control on day 2, one of type A, two of type B, and two of type D electrodes had fallen off the skin of the TS. This should not be interpreted as a result on adhesion properties, as the electrodes are constructed differently in this regard. In three of the type C electrodes, the gel chamber was completely void of gel, evident after removal of the electrode and corresponding to very high impedance values which were not included in the Cole-parameter assessment. The dermatologist assessment of the pictures revealed no significant signs of skin irritation. There were some signs of very faint erythema, but its degree was always lower than on the areas which had been taped. 4. Discussion In this paper we have shown differences in both the in vitro properties and the in vivo electrical measurements of the gels, which are discussed below. 4.1. In-vitro evaporation Figure 1 shows that the gels we tested in our study contained very different amounts of water free to evaporate, and this means that they also likely will hydrate the SC very differently after electrode onset. However, the amount of water released from the gels initially in the in vitro sorption measurements is not necessarily the same

as the amount of water entering the SC from the gel after electrode onset. The transport of water to or from the gels is in general determined by the difference in partial pressures of water between the gel and the material it is in contact with. The water in the SC will in general have a different partial pressure than the air initially in the DVS measuring chamber. Also, other transport mechanisms such as skin occlusion and osmotic transport of water to or from the electrode gel, due to differences in electrolytic concentrations between the SC and the gel, can be expected to alter the skin conductance. The type B and C gels contained large amounts of water, whereas A and D barely lost any water to the dry environments at 0% RH in the DVS measuring chamber. This is correlated with the results from the skin conductance measurements, especially in how the SSCD changes initially after the application of the electrode. This indicates that the moisture content and viscosity of the electrode gel has a major impact on the quality of the skin conductance recordings. A too wet gel such as type B will bring moisture to the SC or penetrate sweat ducts if the viscosity is low enough, introducing errors in the skin conductance measurement. For electrode A and D the lack of initial free water to hydrate the SC, opens for the possibility that the SC was depleted of moisture for a short period of time after electrode onset, depending on the ionic concentration of the hydrogel, by means of osmotic transport of water into the gel. It is seen from figure 3 a) and b) that skin conductance actually decreased during the 10 first minutes of relaxation. However, a slight reduction in skin conductance level due to a decrease in sweat activity is to be expected as the test subject is sitting down and relaxing. Also, the relatively cold gel may cause contractions in skin pores, resulting in a small decrement in sensed conductance values (Eggins 1993). Finally, the sorption results showed that the type A and D gel had very similar in vitro patterns, both regarding the relative water uptake as well as how rapid water entered or left the gel samples, supporting our findings from the skin conductance time-series. 4.2. In-vitro sorption time constants Both the amount of water free to evaporate from the gel as well as how rapid such a diffusion process takes place can be expected to influence the skin conductance values. From figure 2 we see that the type B gel deposited its free water more rapidly into the dry DVS chamber than the other gels. A corresponding effect was seen in our electrical time-series measurements, e.g. figure 5b). The type C gel, although containing high amounts of free water initially, gave lower initial skin conductance level change (figure 3 a), b) ) than gel B. This effect is probably a combination of less free water, but also a larger time constant initially for this water to evaporate from the gel into the dry chamber air. Depending on the initial hydration state of the SC, a similar trend can therefore be expected to be seen also when water diffuses from the gel into the SC. The evaporation of water from a sample, and hence the time constant, is depending on the geometry and size of the sample (Crank and Park 1968). However, as the four samples were of relatively equal size and mass, the patterns in time constants seen in figure 2 can be expected to give a representative measure of the hydration characteristics of the gels. Although gels can be expected to hydrate the SC giving increased conductance levels after onset, the water transport may potentially also go from the SC to the gel, especially during a sweat response when the moisture content locally in and around the sweat ducts increase significantly. In that sense the gel with the lowest absorption time constant (gel B) will pick up this water most rapidly, whereas gel C will not be able to gain much water. Such effects are probably slow, and only significant in long time monitoring. 4.3. Inverse sweat response From figure 3 c) all electrode types gave increased SSCD values at the hypothenar sites during the sweating stimulus, and electrode type B, the wettest gel, gave the highest response. However, for the T9 site, electrode B gave a significant decrease in SSCD during the sweat response initiated by the squats. It is our belief that this inversed sweat response is due to the effect of electrode gel having penetrated down into the sweat duct. As the conductivity of the wet gel of the type B electrode is much higher (roughly 200 μS/cm) than the sweat electrolyte solution (5.56 μS/cm, Licht et al 1957), a penetration of gel down into the ducts, that are empty or partly filled (Grimnes 1983a), will result in an increased conductivity. On the other hand, during a sweat response, the higher conducting gel will be substituted with a lower conducting sweat liquid causing a decrease in the measured skin conductance (figure 5b, figure 6). Figure 6 shows a special case where the type B and C SSCD initially drift apart, but lie on top of each other for a while during and after the exercise interval. Within the overlapping period, there are equal proportions of sweat and gel in the ducts below both electrodes, yielding equal SSCD. The

question remains why the inverse sweat response occurred on the T9 site, but not on the hypothenar site. The dependent factor may be the thickness of the SC, being several times thicker on the palmar skin than the abdominal skin (Montagna and Parakkal 1974, Ya-Xian et al 1999). Comparing figure 3 a) and b), we see that the initial SSCD change on the T9 site was more than three times as large as the change on the hypothenar. This points to the electrical shunting effect caused by gel penetrating the sweat ducts being dependent on the SC thickness and thereby the sweat duct length within the SC. It is likely that more complete shunts will occur in thinner SC than in thicker SC where partly shunting will contribute a lot less to the measurement, due to the main restricting factor to the skin conductance being the SC. Thus, a larger proportion of ducts completely shunted by the gel at the T9 site may explain why sweating induces a negative response on this site contrary to the hypothenar where the thicker SC yields a larger proportion of partly shunted ducts.
The partly shunting of the hypothenar ducts may also explain the higher SSCD amplitude of type B (fig 3 c) by a sensitivity to a greater number of sweat glands where the sweat is not pumped all the way to the orifice of the duct, which also explains why some responses are present for this type but absent for a solid hydrogel type (fig 5 a) ). This could not be due to differences in EEA as type B had the smallest EEA of all the gels. 4.4. Post-sweating recovery
After the end of the exercise epoch, the SSCD is expected to return to a level close to baseline within a few minutes as the sweat activity diminishes. As seen in figure 3 e) and f), there is still a large positive offset after 15 minutes of relaxation for electrode type B on both sites, and type C on the T9 site. We believe that this can also be attributed to the penetration of gel into the sweat ducts along with the sweat reabsorption process in the ducts or glands. As sweat is reabsorbed in the glands following the sweating period, gel is again allowed to enter the ducts, perhaps even actively transported through the ductal reabsorption process. This may explain why type B exhibits a positive offset even though the response during the exercise was in the negative direction. Another plausible explanation for the recovery offsets, also attributal to the solid gels, is the absorption of sweat in the SC following the sweat emergence, leading to a change in the total conductance. A third plausibility, concerning only the wetter gels, is that there may have been cases of a constant wetting of the SC during the whole recording period, leading to a somewhat steady increase in level as with type B in figure 5 a) and figure 6.
These hypotheses are also supported by the lower variance of the solid gel types in all the results presented in figure 5, suggesting that the artifacts introduced by the wet-gels depend on intersubjective properties of the SC such as its thickness.
4.5. Pressure artifacts The pressure artifacts showed the same pairwise pattern as the sorption results with electrode A and D very similar and relatively unaffected, but with large effects on electrode B and C. The two latter electrode types have a gel that is believed to have a much less mechanical stability and are thus sensitive to applied pressures, smearing the gel giving both better contact and possibly also an increased effective electrode area. Due to its low viscosity gel B may actively be pushed into the sweat ducts, which in that case would explain the significantly elevated level in skin conductance also after the final relaxation period.
4.6. Changes in Cole-parameters from day 1 to day 2 Although the repeated measures ANOVA resulted in few significant changes in the Cole parameters from day 1 to day 2, the test may have suffered from unapparent adhesion changes of the effective electrode areas. Even though the electrodes were gently re-fixed for a second measurement on day 2, persistent poor adhesion could alter the impedance measurements. This, along with a lowering of the number of samples due to electrodes having fallen off, may have weakened the ability of the test to find significant changes in skin impedance changes caused by the electrodes. We believe that the significant change found with type D, evident in both the Rs and the alpha parameter, could be attributed to a skin reaction occurring below the SC, but can also be explained by a lowering of the gel series resistance, as type D had a relatively high front to front resistance compared to the other gels. The latter case is also supported by the dermatologist assessment of skin reaction, where no sign of any reaction beyond very faint erythema was found. Thus, it is likely that this gel may cause a drift in long-term skin conductance measurements because of the initial low-frequency resistance of type D which is relatively high

compared to the SC resistance during sweating. This high gel resistance may also explain the slightly lower SSCD response on the hypothenar for this type compared to the other solid gel type A (fig 3 c). Another effect that may have been responsible for the changes in the type D gel is its ability to gain an amount of water corresponding to about 2.5 times its own dry weigh under humid conditions, as seen in figure 1. During a 24h electrode placement, water is building up underneath, giving a much increased water content locally beneath the electrode. Some of this water may potentially have been taken up by the gel, which surely would have resulted in a much reduced series resistance. However as such a water uptake typically has a characteristic time constant of a few hours, this effect is not seen initially, but will be present in long-time measurements.
The three (33%) cases of empty gel chambers on day 2 for type C may be due to absorption of all its moisture in the skin corresponding to its low in-vitro ability to reuptake moisture. The decrease in Ycpe from day 1 to day 2 may have been due to a net reduction in the effective electrode area due to only a partly electrode contact with the SC. Thus, a reduced number of ducts in contact with the gel would result in a net reduced low frequency admittance as a reduction of electrode area would probably also yield less water build-up in the SC due to occlusion.
4.7. Clinical implications The inverse sweat response (figure 3 d), figure 5 b) ) can obviously lead to misinterpretation in sweating-related measurements. Even though this effect did not occur on the hypothenar site in this study, we cannot exclude the possibility that it could occur on this site as well. The type B recordings were often seen to have a steady increase in SSCD level throughout our 29 minute recordings (e.g. figure 5 a) ), and it is not unlikely that inverse sweat responses could occur also on this site after a longer time of electrode-skin contact when the gel has been allowed to penetrate deeper into the ducts.
The implications of these electrode-related phenomena depend on how the measured signal is interpreted or computationally parameterized. Traditionally, both the skin conductance level and the characteristics of the skin conductance response have been used as psychophysiological parameters (Boucsein 1992) and the results in this paper points to potential sources of errors introduced by the electrodes regarding both features. The frequency of the skin conductance responses is a parameter which may not be as susceptible to these errors as the abovementioned. However, the response detection usually depends on an amplitude criterion beyond a certain threshold, which may cause electrode gel dependency in this parameter as well due to differences in amplitudes. In addition, these results indicate that the gel to duct penetration may alter the sensitivity to the sweat glands below the EEA. In other words, a moist gel with low viscosity could detect a greater number of responses than a solid gel or gel-free electrode. For the wetter gels, the results will likely have a significant dependency on the time since electrode attachment and the SC thickness.
The pressure artefacts are more relevant in situations where the patient is moving or physically active during the recordings than for controlled setups in the laboratory Pressure on the electrodes is also likely to occur during sleep monitoring as the test subject is turning around. Push or pull on the electrodes may give transient artifacts which could be detected as single responses, but the greatest source of error comes from the electrodes which cause changes that remain after the pressure is no longer applied.
The mentioned errors are probably equally relevant for dc and ac methods of skin conductance measurement, as long as these are performed within the linear range.
4.8. Summary of findings
The electrode gels can introduce large changes in the level of the skin conductance over time, corresponding with the amount of free water in the gel and its viscosity.
Sweating can lead to negative skin conductance responses for wet gels with low viscosity. This inverse sweating response effect probably depends on the thickness of the SC.
Wet gels may provide an increased sensitivity to sweat activity in partially filled ducts.

Solid gels have in general a better ability than the wetter gels to return the skin conductance to baseline during recovery after a period of sweating.
Wet gels seem to give less repeatable measurements due to the changes introduced by the gel which likely depend on the interindividual SC properties.
Expectedly, the gels with lower mechanical stability are more susceptible to pressure artifacts. The karaya-based solid gel may introduce a drift in the skin conductance measurement due to lowering of
its initially high resistivity. The Isotonic EDA Jelly (Type C) may be completely absorbed by the skin during long-term wear.
Acknowledgements The authors are grateful to Per Helsing M.D. at the Department of Dermatology, Oslo University Hospital for the evaluation of skin irritation in the photographs from all the test subjects. References Boucsein W 1992 Electrodermal Activity New York: Plenum Press. 460 pages, ISBN-10: 0306442140,
ISBN-13: 978-0306442148. Eggins B R 1993 Skin contact electrodes for medical applications. Analyst. Apr; 118 439-42 Crank J and Park G S (Eds) 1968 Diffusion in polymers. Academic Press (London), p.1-39 Grimnes S 1983a Skin impedance and electro-osmosis in the human epidermis. Med. Biol. Eng Comput. 21 739-749 Grimnes S 1983b Impedance measurement of individual skin surface electrodes. Med. Biol. Eng Comput. 21 750-755 Grimnes S, Martinsen Ø G 2005 Cole electrical impedance model – a critique and an alternative. IEEE Trans. Biomed. Eng. 52(1) 132-135 Grimnes S, Martinsen Ø G, Tronstad C 2009. Noise properties of the 3-electrode skin admittance measuring circuit. 4th European Conference of the IFMBE, Antwerp. Springer Berlin Heidelberg, IFMBE Proceedings 22 720-722. Healey J A and Picard R W 2005 Detecting stress during real-world driving tasks using physiological sensors. IEEE Trans. Intell. Transp. Syst. 2 156-166 Hoeldtke R D, Bryner K D, Horvath G G, Phares R W, Broy L F, Hobbs G R. 2001 Redistribution of sudomotor responses is an early sign of sympathetic dysfunction in type 1 diabetes. Diabetes. Feb 50(2) 436-43 Holbrook K A, Odland G F 1974 Regional differences in the thickness (cell layers) of the human stratum corneum: an
ultrastructural analysis. J. Invest. Dermatol., 62, 415-22 Hullett B, Chambers N, Preuss J, Zamudio I, Lange J, Pascoe E and Ledowski T 2009 Monitoring Electrical Skin Conductance – A tool for the Assessment of Postoperative Pain in Children? Anesthesiology 111 513-7 Iacono W G, Ficken J W and Beiser M 1999 Electrodermal activation in first-episode psychotic patients and their first- degree relatives. Psychiatry Res. 88 25-39 Kuno Y 1956 Human Perspiration. Thomas, p.113, 123, 143 Ledowski T, Bromilow, J, Wu J, Peach M J, Storm H, Schug S A 2007 The assessment of postoperative pain by monitoring skin conductance: results of a prospective study. Anesthesia 62 989-93 Licht T S, Stern M and Shwachman H 1957 Measurement of the Electrical Conductivity of Sweat. Clin. Chem. 3 37-48 Martinsen Ø G, Grimnes S, Karlsen J 1998 Low frequency dielectric dispersion of microporous membranes in electrolyte solution. J. Coll. Interface Sci. 199(2) 107-10 Martinsen Ø G, Grimnes S, Haug E 1999 Measuring depth depends on frequency in electrical skin impedance measurements. Skin Res. Technol. 5 179-81 Martinsen Ø G, Grimnes S 2001 Facts and myths about electrical measurement of stratum corneum hydration state. Dermatology 202 87-9 Mayotte M, Webster J and Tomkins W 1994 A comparison of electrodes for potential use in paedriatric/infant apnoea monitoring. Physiol. Meas. 15 459-76 McAdams E T, Jossinet J, Lackmeier A, Risacher F 1996 Factors affecting electrode-gel-skin interface impedance in electrical impedance tomography Med. Biol. Eng. Comput. 34 397-408 Montagna W and Parakkal P F 1974 The structure and function of the skin. Acadmic Press, London, p. 63 Nilsson B M, Hultman C M and Wiesel F A 2006 Niacin skin-flush and electrodermal activity in patients with schizophrenia and healthy controls. Prostaglandins Leukot. Essent. Fatty Acids 74 339-46

Quinton P M 2007 Cystic fibrosis: lessons from the sweat gland. Physiology Jun;22:212-25. Rahal M, Khor J M, Demosthenous A, Tizzard A, and Bayford R 2009 A comparison of electrodes for neonate electrocal impedance tomography. Physiol. Meas. 30 S73-S84 Setz C, Arnrich B, Schumm J, La Marca R, Tröster G and Ehlert U 2010 Discriminating stress from cognitive load using a wearable EDA device IEEE Trans. Inf.Techn.Biomed. 14 410-7 Tronstad C, Gjein G E, Grimnes S, Martinsen Ø G, Krogstad A L and Fosse E 2008 Electrical measurement of sweat activity. Physiol. Meas. 29 S407-S415 Ya-Xian Z, Suetake Y, Tagami H 1999 Number of cell layers of the stratum corneum in normal skin – relationship to the anatomical location on the body, age, sex and physical parameters Arch. Dermatol. Res. 291 555-9