sleep apnea detection based on thoracic … apnea detection based on thoracic and abdominal movement...
TRANSCRIPT

SLEEP APNEA DETECTION BASED ON THORACIC AND
ABDOMINAL MOVEMENT SIGNALS OF WEARABLE
PIEZO-ELECTRIC BANDS
YIN-YAN LIN, HAU-TIENG WU, CHI-AN HSU, PO-CHIUN HUANG, YUAN-HAO HUANG,
AND YU-LUN LO
Abstract. Physiologically, the thoracic (THO) and abdominal (ABD) move-
ment signals, captured using wearable piezo-electric bands, provide informa-tion about various types of apnea, including central sleep apnea (CSA) and
obstructive sleep apnea (OSA). However, the use of piezo-electric wearables
in detecting sleep apnea events has been seldom explored in the literature.This study explored the possibility of identifying sleep apnea events, including
OSA and CSA, by solely analyzing one or both the THO and ABD signals. An
adaptive non-harmonic model was introduced to model the THO and ABD sig-nals, which allows us to design features for sleep apnea events. To confirm the
suitability of the extracted features, a support vector machine was applied to
classify three categories – normal and hypopnea, OSA, and CSA. According toa database of 34 subjects, the overall classification accuracies were on average
75.9% ± 11.7% and 73.8% ± 4.4%, respectively, based on the cross validation.
When the features determined from the THO and ABD signals were com-bined, the overall classification accuracy became 81.8%±9.4%. These features
were applied for designing a state machine for online apnea event detection.Two event-by-event accuracy indices, S and I, were proposed for evaluating
the performance of the state machine. For the same database, the S index
was 84.01% ± 9.06%, and the I index was 77.21% ± 19.01%. The results indi-cate the considerable potential of applying the proposed algorithm to clinical
examinations for both screening and homecare purposes.
1. Introduction
Sleep-disordered breathing (SDB) is a common disorder affecting approximately14% of adult men and 5% of adult women [1]. Patients with SDB present frequentcomplete cessation of breathing and awakenings while sleeping at night, which leadsto non-restorative sleep and hence excessive daytime sleepiness and fatigue. In ad-dition, many evidences reveal that SDB is associated with several other diseases,such as hypertension [2], heart disease [3], and stroke [4]. Moreover, SDB is respon-sible for several public disasters [5]. Although SDB has attracted a great amountof attention in the past decades, unfortunately, many patients with SDB are notappropriately diagnosed, [6]. Therefore, screening subjects with SDB is a criticalpublic health concern [7].
The gold standard for SDB diagnosis is interpreting the multichannel signalsrecorded through polysomnography (PSG) [8]; However, this method has severallimitations. For example, patients feel uncomfortable because numerous sensorsmight interfere with sleep; PSG measurement is highly labor-intensive and mustbe performed in a special environment, thus limiting its application to the wholepopulation. To resolve these limitations, in the past decades, numerous efforts
1
arX
iv:1
612.
0418
5v1
[ph
ysic
s.m
ed-p
h] 2
2 N
ov 2
016

2 Y.-Y. LIN, H.-T. WU, C.-A. HSU, P.-C. HUANG, Y.-H. HUANG, AND Y.-L. LO
have been made to identify a comfortable and easy-to-install wearable device foraccurate automatic diagnosis. One frequently asked question is whether designinga screening or monitoring system with few sensors, or even one sensor (a level-IVmonitoring system [9]) is possible, without considering the electroencephalographicsignal. For this purpose, one specific challenge is evaluating the amount of clinicalinformation that could be obtained from a single-channel sensor.
The available information from some sensors in PSG, such as the nasal airflowsignal, the electrocardiogram (ECG) signal, the oximeter signal, and sound, hasbeen well explored. The nasal airflow signal is most directly related to the respi-ratory dynamics and has been widely investigated and applied to diagnose SDB[10, 11, 12, 13, 14, 15]. The ECG signal that contains the perturbed physiologicaldynamics caused by apnea events, in particular, the heart rate variability, has alsobeen extensively considered in the literature [16, 17, 18, 19]. The oximeter signalreflects the oxygen saturation and has been considered to identify sleep apnea events[20, 21]. Sound analysis provides another aspect of sleep apnea research. Specif-ically, whereas the aforementioned channels are associated with the physiologicaldynamics, snoring analysis provides more mechanical information about the upperairway structure [22, 23]. With the information available inside one single channel,integration of information from multiple channels has been beneficial for diagnosis(e.g., oximeter combined with ECG [24] and oximeter combined with ECG andsound analysis [25]). We refer the reader to the review paper [26] for a systematicsummary.
On the other hand, some commonly applied sensors in PSG have not been wellexplored, for example, the thoracic (THO) and abdominal (ABD) movement signalsrecorded by using the piezo sensors [27, 28, 29, 30]. Physiologically, these two chan-nels contain information about sleep apnea and are used to classify various typesof apnea, including central sleep apnea (CSA) and obstructive sleep apnea (OSA).However, these channels are not recommended as the first-line sensors by AmericanAcademy of Sleep Medicine (AASM) [31], probably because of the instability of thepiezo sensor [32]. From the signal processing viewpoint, this type of signal is chal-lenging because the instability nature is complicated by its non-stationarity nature,and suitable analysis tools are unavailable. This difficulty might explain its under-exploration. Based on the physiological understanding and practical clinical use ofthe THO and ABD signals, we hypothesized that in addition to providing apneaevent information, the essential information for classifying CSA and OSA eventscontained in the THO and ABD signals could be well extracted when appropriatesignal processing techniques are used.
To the best of our knowledge, few papers systematically explore the breathinginformation hidden in the THO and ABD signals. For example, the amplitude,energy and dominant frequency are considered in [27], and an 100% accuracy ofclassifying apnea and normal respiration is reported; the amplitude and phase areconsidered in [28], and a 90.63% averaged accuracy of classifying OSA, CSA, andnormal respiration is reported; in [29], in addition to the amplitude and phaseinformation, the phase relationship between ABD and THO is considered, and thebest accuracy of classifying OSA and normal respiration is 69.9% for the minuteclassification and 89% for the subject classification. While the accuracies reportedin [27] and [28] are high, only 266 and 189 episodes of respiratory signal wereanalyzed, respectively. In [29], only the OSA is considered in the study. Also,

SLEEP APNEA DETECTION VIA PIEZO-ELECTRIC BANDS 3
while the subject classification accuracy reported in [29] is high, the AHI is usedto classify the severity of subjects, and it is not clear if the predicted OSA eventsmatch the true OSA events.
In general, to properly explore the underlying information in the ABD and THOsignals, a model for the analysis is warranted. Although the respiratory signals,particularly the nasal airflow signal, have been extensively studied in the literature,no systematic model has been discussed. Based on the physiological understandingof the respiratory signal, a model could be designed to justify how and why analgorithm is applied to extract the features. Based on this model, the inevitablenoise in the recorded signals can be more easily handled. Furthermore, to properlyevaluate the performance of the algorithm, a proper accuracy metric is inevitable.The commonly applied apnea-hypopnea index (AHI) and apnea index (AI) arenot directly suitable for this purpose since only the event number is taken intoaccount in the index. However, to evaluate the accuracy of the detected events byan algorithm, we need to perform the event-by-event evaluation; that is, a detectedevent should significantly overlap with a true event determined by the sleep expert.
In this study, we applied a recently developed adaptive non-harmonic modeland designed five dynamical features by considering the physiological facts andproperties of the piezo sensor, to explore the underlying information hidden inthe ABD or THO signal. Specifically, we apply sychrosqueezing transform (SST)algorithm to reduce the influence of the inevitable noise in the recorded ABD andTHO signals. Due to the instability of the piezo sensor, we consider the amplituderatio, instead of the amplitude, as a new feature; based on the nature of the piezosensor, the frequency ratio is proposed as another new feature; the covariance ofABD and THO is considered as an auxiliary feature if both ABD and THO signalsare used in the analysis. Furthermore, a support vector machine (SVM) [33, 29]was applied to classify the extracted features. Based on the classification results,we proposed an on-line algorithm for sleep apnea event detection based on a newlydesigned finite state machine classifier. The obtained result of the finite statemachine classifier was justified by using two novel assessment indices on an event-by-event basis. The results support that with suitable signal processing, either ABD orTHO has the potential to serve as a comfortable and easy-to-install SDB detectioninstrument. A preliminary study of this work was reported in the conference [30].
The remainder of this paper is organized as follows. Section 2 introduces thephysiological and medical background of SDB and the adaptive non-harmonic modelto quantify the respiratory signals, including ABD and THO. Section 3 details thefeatures designed for ABD and THO signals and the SVM classifier. Section 4reports the study material and SVM classification results. Section 5 applies thedesigned features and established SVM classifiers to design a state machine forpotential online prediction purpose. In addition, two accuracy assessment indicesfor evaluating the event-by-event detection are introduced. Section 6 discusses ourfindings and concludes this paper.
2. Physiological background and model
This section first summarizes the essential physiological background of sleepapnea and its phenomenological behavior observed from the ABD and THO signals.Based on these physiological facts, we proposed the adaptive non-harmonic modelto quantify these signals, which serves as a basis for designing our features.

4 Y.-Y. LIN, H.-T. WU, C.-A. HSU, P.-C. HUANG, Y.-H. HUANG, AND Y.-L. LO
2.1. Physiological background. Generally, SDB comprises the following fivetypes: sleep apnea, sleep hypopnea (HYP), respiratory effort-related arousal (RERA),sleep hypoventilation, and Cheyne-Stokes breathing. These events are distinguishedby the cause of the shallowing or cessation of breathing. OSA, obstructive sleepHYP, and RERA are caused by a completely or partially blocked upper airwaycaused by decreasing muscle tone, in particular the muscles surrounding the upperairway. During these obstructive events, the subject attempts to breathe; therefore,unusual movements are observed in the THO and ABD signals. A significant pat-tern of obstructive event is a paradoxical movement, during which the direction ofthe thoracic movement is opposite to that of the abdominal movement. However,the paradoxical movement does not occur in all obstructive events.
CSA, central sleep HYP, and Cheyne-Stoke breathing are completely distinctfrom the obstructive events in terms of both the physiological mechanism andbreathing pattern. In these types, the respiratory control center in the brain isimbalanced in patients with central sleep breathing disorder – the carbon dioxidelevel in the blood is imbalanced and the neurological feedback mechanism thatmonitors the carbon dioxide level does not function properly, causing difficulty ofmaintaining the respiratory rate. By contrast to the obstructive events, the subjectwith central sleep breathing disorder completely or partially stops breathing andmakes little or no effort to breathe during those central events. Thus, the thoracicand abdominal movements decrease or disappear during those central events.
Mixed sleep apnea (MSA) is an event characterized by complete cessation ofrespiration without thoracic and abdominal movements initially. The thoracic andabdominal movements gradually appear before the end of the event. Because thebreathing pattern exhibits the characteristics of both OSA and CSA, the event istermed as MSA. Clinically, MSA has been considered as a variant of OSA, but notCSA [34]; therefore, we considered MSA events as OSA events in our study.
By contrast to obstructive, central or mixed sleep disordered events, sleep hy-poventilation is characterized by abnormal ventilation, but not apnea or HYP, andgas exchange that considerable aggravates or may only occur during sleep. Theseabnormalities result in hypercapnea and are sometimes associated with hypoxemia.Sleep hypoventilation may be primarily related to blunted chemo-responsiveness orbe comorbid with particular medical conditions that cause the impairment of gasexchange. We exclude patients with sleep hypoventilation in this study.
Quantitatively, an apnea event (OSA or CSA) is identified when the airflowbreathing amplitude decreases more than 90% for a duration ranging from 10 to120 seconds, whereas an HYP event is identified when either of the following twoconditions holds: (1) the airflow breathing amplitude decreases more than 30% ofthe pre-event baseline with ≥ 4% oxygen desaturation; (2) the airflow breathingamplitude decrease more than 50% of the pre-event baseline with ≥ 3% oxygendesaturation or with an arousal for a duration ranging from 10 to 120 seconds, butdoes not fulfill the criteria for apnea. In this study, we followed the AASM 2007 [8]and did not classify an HYP event as a central or obstructive in nature, althoughthe AASM updated the scoring criteria for sleep disordered breathing events in2012 [31]. The 2012 scoring rule [31] for sleep apnea is identical to that in 2007,whereas the HYP rule is modified as “a HYP event is identified when the airflowbreathing amplitude decreases over 30% of the pre-event baseline with ≥ 3% oxygen

SLEEP APNEA DETECTION VIA PIEZO-ELECTRIC BANDS 5
desaturation or with an arousal”. This modification, however, does not influencethe data analysis in this study, as we focus on the apnea events classification.
To quantify the severity of apnea in clinics, the AHI is applied and is defined bydividing the number of apnea and hypopnea events by the number of sleep hours.The AI and hypopnea index (HI) are defined in a similar manner. Based on theAHI index, the severity of apnea in patients is classified as normal (AHI≤ 5), mild(5 <AHI≤ 15), moderate (15 <AHI≤ 30) and severe (AHI> 30).
2.2. Adaptive non-Harmonic Model. Driven by the physiological facts dis-cussed in the previous section, we proposed an adaptive non-harmonic model toquantify the THO and ABD movement signals. Although the respiratory activ-ity is oscillatory, it is “irregular”. First, sleep is a global and systematic behaviorthat involves all body parts. In particular, even during normal sleep, the muscu-lar atonia and low amplitude electromyography (EMG) are intimately related tothe sleep cycle [35], which leads to significant changes in the breathing rate andpattern [36]. In subjects with sleep apnea, the condition is becoming more com-plicated. Moreover, in addition to the time-varying frequency caused by the sleepcycle, the amplitude of the ABD and THO signals might vary and even becomezero during a central apnea event. In addition, although not significant, the heartbeats contribute to the ABD and THO movement, and this movement becomesdominant during a CSA event. To quantify the ABD and THO movement signals,we considered the following model.
We first introduce the intrinsic mode type (IMT) function. Fix 0 ≤ ε � 1.Consider the set Cε that consists of differentiable and bounded functions g(t) =A(t)s(φ(t)), where A, s, and φ satisfy the following conditions: (1) A is positive,continuous, and bounded and its first-order derivative is continuous; (2) φ increasesmonotonically and its first two derivatives are continuous; (3) the absolute values ofthe first-order derivative of A and second-order derivative of φ at time t are boundedby εφ′(t), for all t ∈ R; and (4) s : [0, 1] → R is a continuous 1-periodic functionwith unit L2 norm such that |s`(k)| ≤ δ|s`(1)| for all k 6= 1, where δ ≥ 0 is a smallparameter. The 1-periodic function s(·) is called the wave shape function, whichdescribes the mechanism of signal oscillation over one oscillation. The theoreticaldetails of the wave shape function are described in [37, 38]. The positive functionA(t) describes the amplitude of the oscillation at time t, and the positive functionφ′(t) describes the speed of the oscillation at time t. We consider A(t) > 0 to bethe amplitude modulation (AM) and φ′(t) > 0 to be the instantaneous frequency(IF) of an oscillatory function g(t). Note that the IF and AM are always positive,but usually not constant. The conditions |A′(t)| ≤ εφ′(t) and |φ′′(t)| ≤ εφ′(t) forcethe signal to locally behave like a harmonic function. We consider g(t) that satisfiesthe aforementioned conditions as an IMT function. The theoretical details of anIMT function are described in [39] .
We introduced AM and IF to quantify the possible apnea events as well as thetime-varying breathing rate. The wave shape function was introduced to capturethe non-harmonic nature of a breathing cycle. For example, in the general respi-ratory activity, the inspiratory period is shorter than the expiratory period, whichcan not be captured by a cosine function.
In most real data, an oscillatory signal might be composed of more than oneIMTs. For example, in the THO and ABD movement signals, in addition to therespiratory movement, the oscillatory movement induced by the heart beats is also

6 Y.-Y. LIN, H.-T. WU, C.-A. HSU, P.-C. HUANG, Y.-H. HUANG, AND Y.-L. LO
recorded. Thus, we proposed to model the THO and ABD movement signals byusing the following adaptive non-harmonic model. Fix constants 0 ≤ ε � 1 andd > 0. Consider the set Cε,d that consists of differentiable and bounded functions
such that G(t) =∑K`=1 g`(t), where K is finite and gk(t) = A`(t)s`(2πφ`(t)) ∈ Cε;
when K > 1, φ′`+1(t) − φ′`(t) > d for all ` = 1, . . . ,K − 1 is satisfied. We define afunction G satisfying the aforementioned conditions as an adaptive non-harmonicmodel.
Therefore, the ABD and THO signals are modeled by using the adaptive non-harmonic model with K = 2. In this case, g1 is associated with the respiratorymovement with a lower IF of approximately 0.4 Hz and higher amplitude, whereasg2 is associated with the movement induced by the heart beats with a higher IF ofapproximately 1.2 Hz and lower amplitude.
However, because the recorded signal is contaminated by noise in practice, weconsider the final phenomenological model to describe the recorded ABD and THOsignals.
(1)
{Ytho(t) = gtho(t) + σtho(t)Φtho(t) ;Yabd(t) = gabd(t) + σabd(t)Φabd(t),
where Ytho is the recorded THO signal, gtho(t) = Atho(t)stho(2πφtho(t))+Ahb(t)shb(2πφhb(t))is the clean signal in Cε,d containing the THO movement Atho(t)stho(2πφtho(t)) ∈ Cεand the movement induced by the heart beats Ahb(t)shb(2πφhb(t)) ∈ Cε, Φtho is thestationary stochastic random process, and σtho(t) is a smooth and slowly varyingfunction. Here σtho(t)Φtho(t) models the possible non-stationarity in the measure-ment noise. A similar interpretation holds for Yabd, gabd, σabd and Φabd. Theadaptive non-harmonic model has been further discussed in [39, 40, 37].
3. Feature Design and Extraction and Classification
In this section, we propose features for the ABD and THO signals, and detailthe algorithms to extract them. On the basis of the physiological knowledge, weproposed two features, ARtho and FRtho, for the THO signal, and two features, ARabdand FRabd, for the ABD signal. Before extracting the features from each window,the online sychrosqueezing transform (SST) algorithm was applied to reduce the in-fluence of the inevitable noise in the recorded ABD and THO signals. The proposedfeatures were then fed into the SVM to obtain a two-layer binary SVM classifier.The first layer classifier, CLF N OC (CLF denotes a classifier), classifies non-apneaevent (denoted as NOR, i.e., OSA or CSA does not occur) and apnea events (OSAor CSA occurs); the second layer classifier, CLF O C, classifies apnea events to OSAand CSA. To avoid the over-fitting problem, the cross validation was applied toevaluate the proposed features and the classification accuracy of the SVM model.We did not attempt to classify NOR into hypopnea and non-hypopnea because ofthe limitation of the proposed information available in the ABD and THO signals.
3.1. Online adaptive denoise. Here we summarize an online adaptive denoisealgorithm to stabilize the possible noise in the ABD and THO signals. Considerthe recorded ABD signal Yabd(t) = gabd(t) + σabd(t)Φabd. The same algorithmcan be applied to the THO signal. Let gabd(t) = A1(t)s1(φ1(t)) + A2(t)s2(φ2(t)),where A1(t)s1(φ1(t)) represents the abdominal movement induced by respirationand A2(t)s2(φ2(t)) represents the abdominal movement induced by the heart beats.Here, A2(t) is much smaller than A1(t). During an apnea event, A1(t) diminishes

SLEEP APNEA DETECTION VIA PIEZO-ELECTRIC BANDS 7
or becomes zero whereas A2(t) remains unchanged. Although these facts allow usto distinguish various types of apnea events, obtaining A1(t) from gabd(t) directlywhen noise exists is not an easy task, particularly when the noise is non-stationary;for example, when the subject moves. To reliably obtain A1 as the feature for apneaat each time point, we applied the online SST.
Consider h(x) = e−x2/2σ2
, where σ > 0, as a window. In this study, we fixedσ = 2. At each time point t0, we estimated A1(t) by using the following threesteps. First, for t ∈ [t0−σ, t0 +σ], we evaluated the Fourier transform of the signalYabd(x)h(x− t), which is denoted as VYabd
(t, ξ). Clearly, VYabd(t, ξ) is a well-known
short time Fourier transform at time t. Second, we calculated the reassignment rule
by ωYabd(t, ξ) =
−i∂tVYabd(t0,ξ)
2πVYabd(t,ξ) when |VYabd
(t, ξ)| 6= 0, where i is the imaginary unit
and ∂t is the partial derivative with related to t, and ωYabd(t, ξ) = −∞ otherwise.
Third, the AM of the ABD signal at time t0 was evaluated by
Aabd(t0) :=
∣∣∣∣∣∫Wt0
SYabd(t0, ξ)dξ
∣∣∣∣∣ ,(2)
where Wt0 := {ξ : |φ′(t0)− ξ| ≤ ε},
(3) SYabd(t0, ξ) :=
∫Qt0
δ (|ωYabd(t0, η)− ξ|)VYabd
(t0, η)dη,
Qt0 := {η : |VYabd(t0, η)| ≥ 10−8}, and φ′1(t0) is the estimated instantaneous
frequency at t0. Similarly, we could estimate the AM of the thoracic movement,
denoted by Atho(t). Details of the algorithm and theory beyond the algorithm, inparticular, the online adaptive denoise, are presented in [39, 40, 41].
3.2. Feature Design. The physiological background of sleep apnea provided abun-dant information to guide us in selecting features for the analysis. In addition to thephysiological background, we considered the piezo-electric sensor feature to designa good feature.
First, when the amplitudes of gtho(t) and gabd(t) decrease during a hypopneaor an apnea event, the apnea or hypopnea is not the only resource for amplitudevariation. The body movement during sleep also contributes to the amplitudevariation because of the time-varying contact between the body and piezo-electricbands. Thus, the absolute amplitude is not a suitable feature for apnea eventdetection. Alternatively, because body movement is not frequent, we consideredthe ratio of amplitudes during consecutive time points to suppress the influencecaused by changes in posture. This ratio is small during an apnea event. SeeFigure 1 for an example.
Second, during the CSA events, when the respiratory activity stops completely,we could observe the high frequency oscillation induced by the heart beats in gtho(t)and gabd(t). Thus, during the CSA events, the energy on the higher frequency bandis dominant. See Figure 2 for an example. Based on these physiological facts, weconsidered two sets of features: amplitude ratio (AR) and frequency ratio (FR).Third, the paradoxical movement is a crucial feature for OSA, although it doesnot always occur during the OSA event. To quantify the paradoxical movement,we could consider the correlation between the ABD and THO movements. Thecorrelation information between two channels has been successfully used in othersleep apnea detection algorithms, for example, [42, 43, 44].

8 Y.-Y. LIN, H.-T. WU, C.-A. HSU, P.-C. HUANG, Y.-H. HUANG, AND Y.-L. LO
14 15 16 17 18 19 20
ABD
THO
CFlow
TruthGround
Time(min)
0
1
2
CSA
NOR
OSA
ARtho
ARabd
Figure 1. An illustration of amplitude ratio (AR) feature froma subject with obstructive sleep apneas (OSA). The signal dura-tion is from the 14-th min to the 20-th min after the subject fallsasleep. The top panel shows the sleep apnea state, including OSA,central sleep apnea (CSA), and non-apnea (NOR) status, evalu-ated by the sleep expert. The second panel shows the nasal flow(CFlow) signal. Clearly, intermittent apnea events occur. Thethird and fourth panels display the thoracic (THO) and abdomi-nal (ABD) movement signals. When the CFlow signal was flat, wecould observe oscillations in ABD and THO, reflecting the effortsof the subject to breathe. The bottom panel shows the AR featuresextracted from the ABD and THO signals. Clearly, when apneaevents occur, the AR features significantly decrease.
3.3. Feature Extraction. To extract the features, we segmented the signals intooverlapping windows of 10-s duration with 9.5-s overlap. These windows are calledthe current windows (CW), which provide potential information about the apneaevent. The n-th CW is denoted as CW(n) ⊂ R. Note that CW(n) 6= CW(m) whenn 6= m. For AR features, we considered the closest window of 60-s duration inwhich no apnea was reported by the sleep expert. We termed this window as thepre-window (PW), which contains the baseline information for the definition of AR.The n-th PW associated with the n-th CW is denoted as PW(n) ⊂ R. Note thatPW(n) might be the same as PW(m) when n 6= m, particularly during the apneaevent. To be more precise, the PW is fixed when the CW was moving forward ifthe CW was annotated as a sleep apnea event by the sleep expert. This result isillustrated in Figure 5 (top panel).

SLEEP APNEA DETECTION VIA PIEZO-ELECTRIC BANDS 9
284.6 284.8 285 285.2 285.4 285.6 285.8
ABD
THO
CFlow
TruthGround
Time(min)
−2
−1
0
1
2
CSA
NOR
OSA
FRtho
FRabd
Figure 2. An illustration of frequency ratio (FR) feature froma subject with obstructive sleep apneas (OSA) and central sleepapnea (CSA). The signal duration is from the 284.4-th min to the285.8-th min after the subject falls asleep. The top panel showsthe sleep apnea state, including OSA, CSA, and non-apnea (NOR)status, evaluated by the sleep expert. Second panel shows thenasal flow (Cflow) signal. Two clear apnea events can be observedaround the 284.8-th min and the 285.5-th min. The third andfourth panels display the thoracic (THO) and abdominal (ABD)movement signals. We could see a complete cessation of respira-tory movement around the 284.8-th min, which indicates the eventof CSA. Note that during this period the heart beats could be de-tected and is represented as a small and regular oscillation. Thebottom panel shows the FR features. Note that there is an obvioussurge of the FR features during the CSA event.
The selection of CW and PW durations was based on the criteria by which sleepexperts annotated the sleep apnea; in practice, they compare the amplitudes of theoral-nasal flow and THO and ABD movement signals in the current 10 s with theaverage of those in the previous 120 s to determine an event. In our application,however, we did not use the oral-nasal flow for comparison. Moreover, the aver-age information coming solely from the previous 120-s ABD and THO movementsmight comprise other events or abnormal signals and hence might downgrade theinformation in the extracted features. Therefore, we selected 60-s duration as ourPW.

10 Y.-Y. LIN, H.-T. WU, C.-A. HSU, P.-C. HUANG, Y.-H. HUANG, AND Y.-L. LO
3.3.1. Respiratory amplitude ratio. Due to the noise, to extract AR features in a
robust way, we considered Atho(t) and Aabd(t) estimated by the online SST (2)instead of the original signal. The AR of the n-th CW is derived by
ARtho(n) =Q95(Atho(t)χCW(n))
Q95(Atho(t)χPW(n))
ARabd(n) =Q95(Aabd(t)χCW(n))
Q95(Aabd(t)χPW(n)),
(4)
where ARtho(n) and ARabd(n) represent the ARs of the THO and ABD signals, re-spectively, over the n-th window, χ is the indicator function, and Q95 represents95% quantile of the given function. Here we selected the 95% quantile instead of themaximum to avoid outliers caused by the noise in the signals. One immediate ben-efit of using the ratio, rather than the absolute value, is the alleviation of commondrawbacks of the piezo sensor like the “trapping artifact” – the elastic belt tensionmight be distorted by the movement [45, p 662]. In addition, it helps automaticremoval of the inter-individual discrepancy and time-varying amplitude induced byother physiological facts. Certainly, although various subjects have varying physi-ological profiles such as tidal volume and breathing rate under various sleep stagesduring the apnea event, the AR is still small.
3.3.2. Respiratory Frequency Ratio. The FR of the n-th CW is derived by
FRtho(n) = log10
(∫ 1.5
0.8|F(Ytho(t)χCW(n))(ξ)|2dξ∫ 0.8
0.1|F(Ytho(t)χCW(n))(ξ)|2dξ
)
FRabd(n) = log10
(∫ 1.5
0.8|F(Yabd(t)χCW(n))(ξ)|2dξ∫ 0.8
0.1|F(Yabd(t)χCW(n))(ξ)|2dξ
),
(5)
where FRtho(n) and FRabd(n) denote the n-th FRs of THO and ABD movementsignals, respectively, and F represents the Fourier transform. Note that the mainpurpose of FR is to capture the possible CSA events. Specifically, when the res-piratory activity ceases completely during a CSA event, Ytho(t) and Yabd(t) arecomposed mainly of the movement caused by the heart beats, which is commonlyconsidered as the cardiogenic artifact in the peizo sensor [46, p 53]. Therefore, theintegration in the dividend of (5) ranges from 0.8 to 1.5 Hz, which is normally therange of the heart rate. Figure 3 shows an illustration of the THO movementsignal caused by the heart beats during a CSA event.
Consequently, for the n-th CW, we obtained a vector v(n) ∈ R4 composed offour features, ARtho(n), ARabd(n), FRtho(n) and FRabd(n). We termed v(n) as therespiratory activity index of the n-th CW.
3.3.3. Covariance between thoracic and abdominal movements as a feature. In ad-dition to the respiratory activity index, we quantified the paradoxical movementby using the covariance between the THO and ABD signals over CW. The featureis called Cov. Note that although the paradoxical movement is a crucial charac-teristic to define the OSA event, it is not considered as the main feature used todistinguish apnea events. Certainly, it does not occur in all OSA events because ofthe asynchronous phase caused by body movement. However, Cov could be used asan auxiliary feature to further confirm whether a given apnea event is obstructive.

SLEEP APNEA DETECTION VIA PIEZO-ELECTRIC BANDS 11
15 20 25 30 35 40 453
3.1
3.2
3.3
3.4
3.5
3.6x 10
4
Time (Sec)
TH
O a
nd E
CG
Sig
nals
(a.
u.)
ECG
THO
Figure 3. The THO signal versus ECG signal during a CSAevent. The oscillation in the THO signal is mainly dominated bythe cardiac activity when a CSA event occurs. This is commonlyknown as the cardiogenic artifact.
3.4. Ground truth by sleep experts. We considered the respiratory activityscored by sleep experts according the AASM 2007 guideline [8] as the ground truth.We referred to the expert’s score as the “PSG state.” The PSG states are evaluatedevery 0.5 s. Therefore, for a subject with a sleep record lasting for N s, we obtaineda time series, denoted as sPSG, of length 2N−139 with the range {NOR,OSA,CSA},where 139 comes from the tail waveform of the PW and CW durations.
The respiratory activity from the `-th subject was classified into four groups, N,O, C, and X, according to following rules:
(1) If sPSG = NOR over CW(n), v(n) is in the N group.(2) If sPSG = OSA over CW(n), v(n) is in the O group.(3) If sPSG = CSA over CW(n), v(n) is in the C group.(4) If sPSG contains more than one state, v(n) is in the X group.
The X group was considered as unknown and was excluded from the training process,whereas all v(n) in X are included in the testing process.
The distributions of ARtho versus ARabd and FRtho versus FRabd from the N, O,and C groups from the `-th subject are displayed in the top and bottom panels,respectively, in Figure 4 to evaluate the suitability of these features. The differencein the distributions of the respiratory activity indices from the N, O and C groups canbe visually observed. Note that FRtho and FRabd from the C group are distributedon the higher value region compared with those from the N and O groups. This

12 Y.-Y. LIN, H.-T. WU, C.-A. HSU, P.-C. HUANG, Y.-H. HUANG, AND Y.-L. LO
OSA ARabd
OS
A A
Rth
o
Mean=(0.519,0.521)
STD=(0.299,0.339)
0 1 20
1
2
0
500
1000
NOR ARabd
NO
R A
Rth
o
Mean=(0.939,0.918)
STD=(0.241,0.287)
0 1 20
1
2
0
1
2
x 104
CSA ARabd
CS
A A
Rth
o
Mean=(0.254,0.292)
STD=(0.254,0.286)
0 1 20
1
2
0
100
OSA FRabd
OS
A F
Rth
o
Mean=(−0.471,−0.367)
STD=(0.307,0.355)
−2 0 2−2
0
2
0
5000
NOR FRabd
NO
R F
Rth
o
Mean=(−0.657,−0.523)
STD=(0.277,0.319)
−2 0 2−2
0
2
0
10000
CSA FRabd
CS
A F
Rth
o
Mean=(0.125,0.135)
STD=(0.624,0.58)
−2 0 2−2
0
2
0
50
Figure 4. Feature distribution of amplitude ratio (AR) and fre-quency ratio (FR). The left, middle, and right columns display thedistributions of AR features and FR features of the non-apnea (N),obstructive sleep apnea (O), and central sleep apnea (C) groups,respectively, from all 34 subjects as two dimensional histograms.The means of the AR and FR features are superimposed on thehistogram as solid black dots, and the ellipsoids associated with thetwo principal directions of the covariance are also superimposed toenhance the visualization of the diversity the features. Note thatin the C group, the mean of AR features slightly deviates from thevisual center. This is caused by the dissemination of FR features.The mean and standard deviation (STD) of each feature are alsoshown on the plots.
phenomenon reflects the fact that during the CSA event, the movement induced bythe heart beats is dominant.
3.5. Support Vector Machine as Classifier. SVM has been widely appliedin the sleep study literature [17, 29, 36]. In a nutshell, a binary SVM classifierdetermines a hyperplane in the space separating the data set into two disjointsubsets, such that each subset lies in a different side of the hyperplane. Accordingto the reproducing kernel Hilbert space theory, SVM is generalized to the kernelSVM, which facilitates classification with a nonlinear relationship. Technical detailsare further discussed in [33]. For identifying the (possible) nonlinear relationshipbetween various sleep apnea events, in this study, we applied the kernel SVM basedon the standard radial based function as the kernel function. We applied two binarySVM classifiers, that is, the one-versus-all classification scheme [47], to achievemultiple group classification. Despite its simplicity, this scheme is highly effective.To prevent over fitting and validate the classification result, we applied the crossvalidation method. We ran the repeated random sub-sampling validation 25 timesand reported the average; that is, we randomly separated the data into the trainingdataset and testing dataset – the training dataset comprises randomly selected 80%of the subjects and the remainder serves as the testing dataset. The trained classifierbased on the training dataset was applied to predict the respiratory activity of the

SLEEP APNEA DETECTION VIA PIEZO-ELECTRIC BANDS 13
testing dataset. The classification accuracy in all subjects are reported as mean ±standard deviation unless otherwise specified.
For each subject, we trained two binary SVM classifiers from a given datasetbased on the THO signal or THO and ABD signals. The first classifier distinguishesN from OC based on the respiratory activity indices, where OC := O∪C. This classifieris denoted as CLF N OC. The second classifier distinguishes C from O based on therespiratory activity indices. This classifier is denoted as CLF O C. For a subject witha sleep record lasting for N s, the classification result of CLF N OC and CLF O C couldbe represented as a time series of length 2N−139 with the range {NOR,OSA,CSA},which is denoted by sSVM.
To evaluate the accuracy of the two layer SVM classifiers composed of CLF N OC
and CLF O C, we reported the SVM classification accuracy of the overnight data ofeach subject, in which the SVM classification was trained by the same dataset. A3-by-3 confusion percentage matrix M is defined as follows:
Mi,j =#{k|vPSG(k) = i, vSVM(k) = j}
#{k|vPSG(k) = i},(6)
where i, j = 1, 2, 3 and #X denotes the number of elements in the set X. Here, 1indicates NOR, 2 indicates OSA, and 3 indicates CSA. Clearly, Mi,i is the sensitivity(SE) of the SVM classifier at the state i. The specificity (SP) of the state i is denotedas follows:
SP(i) :=
∑j 6=i #{k|vPSG(k) = j, vSVM(k) = j}∑
l
∑j6=i #{k|vPSG(k) = j, vSVM(k) = l}
.(7)
The overall accuracy (AC) is defined as follows:
AC :=
∑3i=1 #{k|vPSG(k) = i, vSVM(k) = i}
|vPSG|.(8)
Note that these definitions are direct generalizations of the AC, SE and SP of thebinary categorical response data.
4. Database, Study Design and Results
4.1. Database. A standard PSG study was performed with at least 6 hours of sleepto confirm the presence or absence of OSA from the clinical subjects suspected ofsleep apnea at the sleep center in Chang Gung Memorial Hospital (CGMH), Linkou,Taoyuan, Taiwan. The Institutional Review Board of CGMH approved the studyprotocol (No. 101-4968A3). Subjects with AHI> 15 were enrolled, and the en-rolled subjects provided written informed consent. THO and ABD movementswere recorded by using piezo-electric bands at a sampling rate of 100 Hz on theAlice 5 data acquisition system (Philips Respironics, Murrysville, PA). Althoughother standard signals such as oral-nasal airflows, electroencephalography (EEG),and oxygen saturation (SpO2) were recorded, they were not included in our anal-ysis because we evaluated the amount of information that we could acquire fromthe ABD and THO signals. The exclusion criterion was the low quality of theTHO and ABD movement signals. If the THO and ABD movement signals weresimultaneously unrecognizable, or if the subject did not present CSA events, whichwere both determined by the sleep expert, the subject was excluded from the study.

14 Y.-Y. LIN, H.-T. WU, C.-A. HSU, P.-C. HUANG, Y.-H. HUANG, AND Y.-L. LO
Table 1. Demographic details of Subjects. Data are representedas “mean ± standard deviation”.
Group Case Averaged Age BMI CSA event OSA event HYP eventnumber AHI (years) (kg/m2) number number number
15 <AHI≤ 30 3 21.3± 2.3 59.5± 12.2 24.5± 9.2 3.4± 3.5 33± 17.9 75.1± 14.830 <AHI 31 58.2± 19.8 49.7± 12.5 27.1± 4.6 11.7± 17.4 190.7± 122.6 70.7± 61.4
Forty-seven subjects were enrolled before applying the exclusion criteria and ulti-mately, 34 subjects were included in the analysis. The demographic details of thesubjects are summarized in Table 1.
4.2. Study design. The sleep stages, apneas, and hypopneas were defined andscored by an experienced sleep technologist according to the AASM 2007 guideline[8], and the scores were reconfirmed by a physician specialized in sleep medicine.On the basis of the scoring, the respiratory states during the entire night sleep wereclassified into five major categories: NOR, OSA, CSA, HYP, and MSA. As discussedpreviously, this study considered MSA as OSA according to clinical practice. Thestatistics of OSA, CSA, and HYP event numbers are summarized in Table 1. Notethat the number of CSAs was smaller than that of OSAs, and the number of HYPswas not negligible in this dataset.
In this study, although the features of the HYP events were distinct from thatof NOR, we considered HYP as NOR and focused on classifying NOR, OSA, andCSA. In addition, for consistency with clinical practice, the ABD and THO sig-nal segments where the sleep stage was defined as awake were excluded from theanalysis. Thus, we included the ABD and THO movement signals with three respi-ratory states, NOR, OSA, and CSA, in this analysis. Note that we did not excludepatients with significant HYP.
4.3. Support Vector Machine Classification Result. Based on the two fea-tures extracted from the THO signal, the overall accuracy of the two-layer SVMclassifiers depending on CLF N OC and CLF O C was 75.9%±11.7%; the overall sensi-tivities of NOR, OSA, and CSA of the two-layer SVM classifiers were 73.4%±14.2%,80.1%±17.7%, and 81.8±21.9%, respectively; the overall specificities of NOR, OSA,and CSA of the two-layer SVM classifiers were 68.1%± 11.6%, 73.3%± 14.1%, and75.9 ± 11.8%, respectively. When only the ABD signals were used to classifynormal (NOR) or apnea (OSA+CSA) events, the overall apnea detection accuracyof the single SVM was 73.8%± 4.4%. The overall sensitivity was 69.8%± 7.8% andthe overall specificity was 73.6%± 5.4%.
Furthermore, we reported the classification results based on four features ex-tracted from the THO and ABD signals. After repeating the cross validation 25times, the overall accuracy of the two-layer SVM classifiers depending on CLF N OC
and CLF O C was 81.8%± 9.4%; the overall sensitivities of NOR, OSA, and CSA ofthe two-layer SVM classifiers were 79.4%± 9.5%, 88.6%± 9.5%, and 85.4± 16.3%,respectively; the overall specificities of NOR, OSA, and CSA of the two-layer SVMclassifiers were 73.9% ± 10.6%, 79.4% ± 9.4%, and 81.8 ± 9.5%, respectively. Evi-dently, the overall accuracy, sensitivity, and specificity increased when we combinedfeatures from the THO and ABD signals. We confirmed the effect of combining
SLEEP APNEA DETECTION VIA PIEZO-ELECTRIC BANDS 15
features from THO and ABD on improving the overall prediction accuracy by per-forming the Mann-Whitney U test. Under the null hypothesis that the predictionaccuracy is the same with the two features from the THO signal and the four fea-tures extracted from THO and ABD signals, we rejected the hypothesis by theMann-Whitney U test when the p value was less than 0.02.
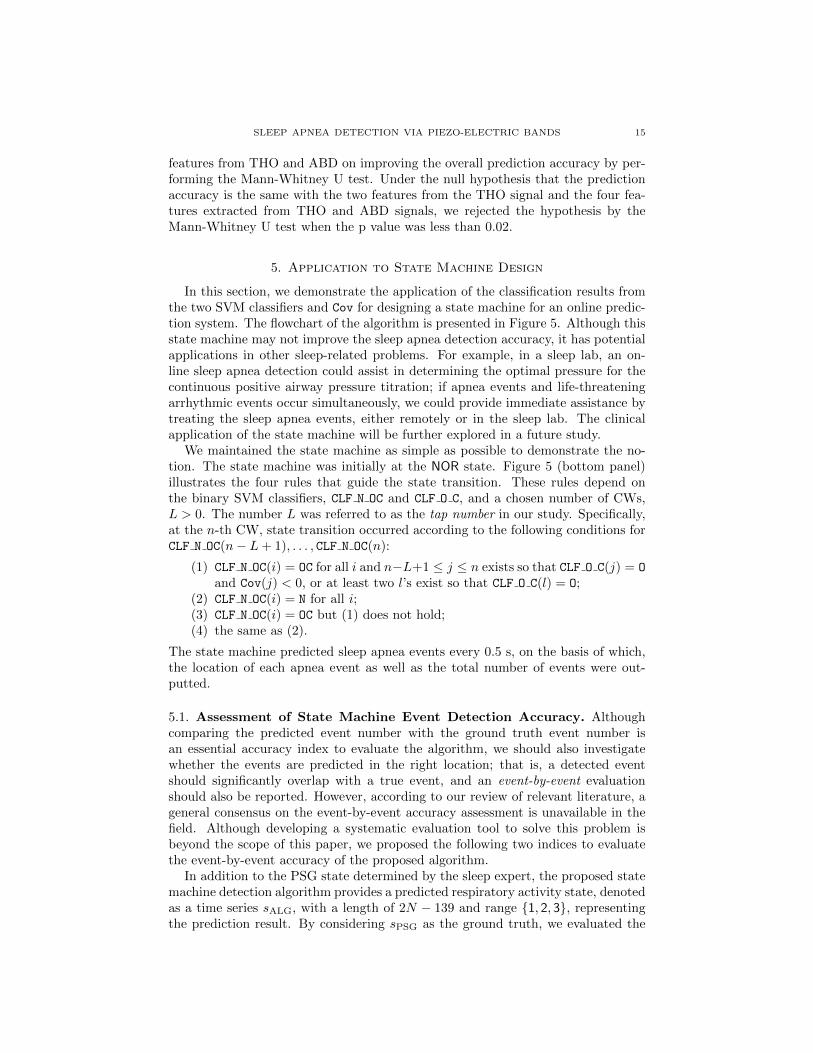
5. Application to State Machine Design
In this section, we demonstrate the application of the classification results fromthe two SVM classifiers and Cov for designing a state machine for an online predic-tion system. The flowchart of the algorithm is presented in Figure 5. Although thisstate machine may not improve the sleep apnea detection accuracy, it has potentialapplications in other sleep-related problems. For example, in a sleep lab, an on-line sleep apnea detection could assist in determining the optimal pressure for thecontinuous positive airway pressure titration; if apnea events and life-threateningarrhythmic events occur simultaneously, we could provide immediate assistance bytreating the sleep apnea events, either remotely or in the sleep lab. The clinicalapplication of the state machine will be further explored in a future study.
We maintained the state machine as simple as possible to demonstrate the no-tion. The state machine was initially at the NOR state. Figure 5 (bottom panel)illustrates the four rules that guide the state transition. These rules depend onthe binary SVM classifiers, CLF N OC and CLF O C, and a chosen number of CWs,L > 0. The number L was referred to as the tap number in our study. Specifically,at the n-th CW, state transition occurred according to the following conditions forCLF N OC(n− L+ 1), . . . , CLF N OC(n):
(1) CLF N OC(i) = OC for all i and n−L+1 ≤ j ≤ n exists so that CLF O C(j) = O
and Cov(j) < 0, or at least two l’s exist so that CLF O C(l) = O;(2) CLF N OC(i) = N for all i;(3) CLF N OC(i) = OC but (1) does not hold;(4) the same as (2).
The state machine predicted sleep apnea events every 0.5 s, on the basis of which,the location of each apnea event as well as the total number of events were out-putted.
5.1. Assessment of State Machine Event Detection Accuracy. Althoughcomparing the predicted event number with the ground truth event number isan essential accuracy index to evaluate the algorithm, we should also investigatewhether the events are predicted in the right location; that is, a detected eventshould significantly overlap with a true event, and an event-by-event evaluationshould also be reported. However, according to our review of relevant literature, ageneral consensus on the event-by-event accuracy assessment is unavailable in thefield. Although developing a systematic evaluation tool to solve this problem isbeyond the scope of this paper, we proposed the following two indices to evaluatethe event-by-event accuracy of the proposed algorithm.
In addition to the PSG state determined by the sleep expert, the proposed statemachine detection algorithm provides a predicted respiratory activity state, denotedas a time series sALG, with a length of 2N − 139 and range {1, 2, 3}, representingthe prediction result. By considering sPSG as the ground truth, we evaluated the

16 Y.-Y. LIN, H.-T. WU, C.-A. HSU, P.-C. HUANG, Y.-H. HUANG, AND Y.-L. LO
accuracy of sALG in event-by-event detection. We define the following quantities.First,
(9) S :=
∑2N−139i=1 δsPSG(i),sALG(i)
2N − 139,
where δ is Kronecker delta function. Note that the term in the numerator indicatesthe number of correct state estimates by the algorithm over all segments. Thisquantity measures the accuracy of the states, including NOR, OSA, and CSA,estimated by the designed state machine.
The second quantity measures the accuracy of the apnea event estimation. Anevent period represents a time interval over which the state is a fixed apnea type.If the respiratory activity state is OSA or CSA over an event period, we referredto the event an OSA event or CSA event, respectively. Suppose that nPSG,O OSAevents and nPSG,C CSA events and nALG,O OSA events and nALG,C CSA events areidentified by sleep experts and predicted by the proposed algorithm, respectively.Note that the AHI or AI index is not directly suitable to evaluate if the eventspredicted by the algorithm are accurate, since the temporal information of eventperiods is not taken into account in these indices. We thus need an index thatcould determine whether a detected event is really an event. To achieve this goal,we introduce the I index:
(10) I :=Pt +At
Pt +At + Pf +Af,
where Pt is the sum of the number of OSA events in sPSG that overlaps with an OSAevent in sALG and the number of CSA events in sPSG that overlaps with a CSA eventin sALG, At is the sum of the number of OSA events in sALG that overlaps withan OSA event in sPSG and the number of CSA events in sALG that overlaps with aCSA event in sPSG, Pf = nPSG,O + nPSG,O − Pt and Af = nALG,O + nALG,O −At.We could view this index as the “sensitivity” of the event detection algorithm.
5.2. Tuning the state machine. Note that the transition rules depend on theclassification results of CLF N OC and CLF O C on L consecutive CWs. Evidently, inaddition to the state machine structure, the tap number L affects the result. Tokeep the state machine simple in this study, we solely tuned the tap number. Weapplied various tap numbers, ranging from 6 to 20, on the whole study population,and the tap number was optimized by evaluating the indices I and S. Consequently,the tap number in the proposed state machine was fixed to L = 12.
5.3. State Machine Detection Performance. Figure 6 presents a segment ofnasal flow (CFlow) and the THO and ABD signals with the detection results andthe ground truth. At various time points, although a deviation between the onsetand termination of events determined by the sleep expert and using our algorithmwas observed, the events were efficiently captured. Note that this deviation partiallyoriginated from the existence of the group X for the subject. Specifically, duringthe period in the group X, at least one sudden jump from one respiratory statusto another one was observed, and this type of transition was not considered. Toquantify the results, an event-by-event detection accuracy and the event numberestimation accuracy indices were adopted.

SLEEP APNEA DETECTION VIA PIEZO-ELECTRIC BANDS 17
First, the S and I indices were reported. As previously stated, our algorithm didnot consider HYP in the classification; however, no subject with HYP was excluded(see Table 1). Thus, for an unbiased accuracy evaluation, we evaluated the accuracyunder two conditions: (HYP1), by considering HYP as NOR in the ground truth;(HYP2) by excluding the segments scored as HYP and evaluating accuracy indiceson the remaining segments. The statistics of the resultant indices, S and I, in 34subjects are summarized in Table 2. Because HYP was considered as NOR in thisstudy, we expected to obtain a higher accuracy under HYP2, and this expectationwas fulfilled in the result.
Table 2. Statistics summary of the accuracy indices in 34 subjects.
Index S Index I(HYP1) (HYP2) (HYP1) (HYP2)
95% quantile (%) 96.23 96.97 95.38 95.61Median (%) 81.93 84.08 66.84 82.61
5% quantile (%) 69.83 70.59 25.98 40.17Mean (%) 82.4 84.01 67.36 77.21
Standard Deviation (%) 8.89 9.06 22.06 19.01
In addition to the event-by-event accuracy indices, the detected event number iscrucial for screening the severity of the condition in a subject. Thus, the accurateAHI estimation is usually expected in the literature. However, because we didnot consider HYP in this study, we reported the estimated number of the apneaevents, which could be considered as an index parallel to AI. The accuracy of the
event number detection is defined by 100% ×(
1− |true number−estimated number|true number
).
The accuracy of the event number detection was 73.46 ± 18.26% under the HYP1condition and 84.42± 11.24% under the HYP2 condition.
6. Discussion
This study explored the possibility of not only identifying sleep apnea but alsodistinguishing OSA from CSA by carefully designing features and classifiers for asingle THO signal. Moreover, by including the features extracted from the ABDsignal, we could obtain a more favorable result. In addition to providing a mathe-matical model to quantify the intrinsic features within the respiratory signals andapplying SST to reduce the noise influence in an on-line fashion, we proposed suit-able features hidden in the THO and ABD signals to capture OSA and CSA. SVMwas applied to establish a classifier for the apnea events. The designed featuresand the SVM classifier were applied to design a state machine for a potential on-line apnea detection algorithm. Furthermore, two event-by-event accuracy indicesare proposed to further evaluate the performance of the proposed algorithm. Theuseful information hidden inside the THO or ABD signals leads to the possibilityof designing an easy-to-install, non-invasive, and non-intrusive level IV sleep ap-nea detection equipment (the AASM criteria) by combining THO and one morepotential sensor.
In this study, to mimic complicated real world problems, our exclusion criteria fordata collection were quite stringent. Certainly, because we only excluded subjectswith CSA and OSA signal qualities too low to be identified even by sleep experts,

18 Y.-Y. LIN, H.-T. WU, C.-A. HSU, P.-C. HUANG, Y.-H. HUANG, AND Y.-L. LO
several subjects in our database have only one recognizable THO or ABD movementsignal. Because we did not remove these cases, clearly, the results from the SVMclassifier were downgraded by these cases. In addition, it is well known that theSVM performance is affected when the sizes of the two groups under classificationare markedly distinct. Although this effect was corrected in the SVM algorithm, thenegative impact of the uneven distributions of CSA and OSA cannot be ignored.Under such conditions, however, we still obtained a satisfactory result from theSVM classifier after cross validation, which confirms the robustness and suitabilityof the proposed features extracted from the THO and ABD signals.
Compared with the SVM classification result, initially, the state machine resultsdo not appear to be more favorable than most of the reported results. We should,however, note that the evaluation standards for the state machine application aredifferent - the event-by-event accuracy indices are our main indices. In addition,the inter-observer event disagreement problem exists – the mean agreement rateamong various scorers, even in the normal subjects, is 76% with a range of 65-85%.A similar disagreement in apnea scoring was also reported in [48] among observers– the intraclass correlation coefficients were 0.73 for agreement on AHI and 0.71for hypopnea index. Therefore, obtaining an event-by-event accuracy higher than80% may not be meaningful. Thus, the state machine result obtained in our studyis satisfactory and the proposed algorithm has potential for screening in varioussleep apnea patients (OSA v.s. CSA) with various pathophysiological mechanisms(upper airway obstruction vs. ventilation control instability).
Our study has some limitations. In particular, the problem of the HYP eventsshould be discussed. In this study, we did not distinguish the hypopnea and non-hypopnea events in the NOR group because the proposed features could not ef-ficiently distinguish HYP (lower than 50% by the SVM classifier). Furthermore,the HYP events could downgrade the final analysis result. To further visualize theinfluence of the HYP events on the analysis, the number of HYP events versus theindex I is shown in Figure 7. With the significance level set as 0.05, the linearrelationship between the number of HYP events and index I was significant. To re-solve this limitation, we should design new features by considering the THO (or theABD) piezo-electric sensor, the distinguishable phenomenological and physiologi-cal characteristics of HYP, and their relationship. Another solution is combiningthe THO signal with one more channel, such as the oximeter, which provides theessential information for HYP diagnosis [8, 31]. The result will be reported in thefuture. Second, we did not design features to capture the transition periods, thatis, the events in group X in the training process, which limited the accuracy ofthe testing result. Precisely, because the information contained in the transitionperiods is a combination of two breathing patterns, combining a regression tech-nique might help to improve the result. Third, the low quality of the recordedTHO and/or ABD signals must be resolved by adopting a more accurate sensoror signal recording method. An alternative solution is incorporating the signalquality index (SQI) into the design. Although several SQIs are available for othersignals [49, 50], a suitable SQI for the THO and/or ABD signals is less explored.Fourth, although MSA could be practically considered as OSA, its dedicated physi-ological implication should not be ignored. Because MSA is a complex combinationof CSA and OSA, a more sophisticated algorithm with more dynamical features is
SLEEP APNEA DETECTION VIA PIEZO-ELECTRIC BANDS 19
required to distinguish MSA. Particularly, we could design features by consideringthe physiologically special breathing pattern structure during MSA.
6.1. Future works in progress. First, under suitable conditions, the current sim-ple state machine could be replaced with a more sophisticated classification modelsuch as the neural network [18]. Second, the inter-individual discrepancy must beresolved for the screening purpose. Third, on the basis of the preliminary studyreported in [36], an automatic awake-sleep status detection algorithm will be incor-porated into the algorithm for the screening purpose. Fourth, starting from 2012,the respiratory inductance plethysmography (RIP) sensor became a recommendedsensor for the sleep examination by AASM [31]. Since the RIP sensor depends onan inductive coil whose electromagnetic properties are related to the area enclosed,it may suffer less from the trapping artifact commonly seen in the piezoelectricsensor [45], and could provide another dimension of respiratory information [51].The proposed model and analysis tools might extract more information from theRIP signal and help extract information more accurately [52]. Because the aboveproblems are beyond the scope of this paper, a systematic study will be reportedin a future paper. Fifth, based on the advances in the chip design technique, wecould include various non-invasive sensors, such as the three-axis accelerometer andwireless radar sensor, in a portable device. These non-invasive and non-intrusivesensors not only provide more information for identifying sleep apnea and distin-guishing OSA, CSA, and HYP, but also greatly reduce the interference in the sleep,thereby increasing the reliability of overnight sleep testing. Based on the resultsdemonstrated in this paper, we could incorporate various signals to get a morefavorable prediction result.
7. Conclusion
This study extensively explored the capability of solely using the THO signaland combining THO and ABD signals to detect the OSA and CSA events throughwearable piezo-electric bands, which has been rarely investigated in previous stud-ies. The evaluation of the proposed algorithm yielded satisfying results by using thecross-subject validation procedure. Moreover, the results verified the competencyof the selected features in distinguishing between the OSA and CSA events. De-spite the limitations discussed in Section 6, this study laid the foundation for usingTHO and/or ABD signals in sleep apnea detection as well as presented optimisticpotential of applying the proposed algorithm to the clinical examinations for bothscreening and homecare purposes.
Acknowledgement
Hau-tieng Wu acknowledges the support of Sloan Research Fellowships, FR-2015-65363. This work was supported by the Ministry of Science and Technology(MOST), Taiwan, under grant number MOST 103-2220-E-007-009.
References
1. P. E. Peppard, T. Young, J. H. Barnet, M. Palta, E. W. Hagen, and K. M. Hla, “Increasedprevalence of sleep-disordered breathing in adults,” Am J Epidemiol., vol. 177, no. 9, pp.1006–1014, 2013.
2. P. Peppard, T. Young, M. Palta, and J. Skatrud, “Prospective study of the association betweensleep-disordered breathing and hypertension,” N. Engl. J. Med., vol. 342, pp. 3378–3384, 2000.

20 Y.-Y. LIN, H.-T. WU, C.-A. HSU, P.-C. HUANG, Y.-H. HUANG, AND Y.-L. LO
3. G. Hamilton, P. Solin, and M. Naughton, “Obstructive sleep apnea and cardiovascular dis-
ease,” Intern. Med. J., vol. 34, pp. 420–426, 2004.
4. C. Bassetti and M. Aldrich, “Sleep apnea in acute cerebrovascular diseases: final report on128 patients,” Sleep, vol. 22, pp. 217–223, 1999.
5. H. R. Colten and B. M. Altevogt, “Functional and economic impact of sleep loss and sleep-
related disorders,” in Sleep Disorders and Sleep Deprivation: An Unmet Public Health Prob-lem, H. R. Colten and B. M. Altevogt, Eds. The National Academies Press, 2006.
6. T. Young, L. Evans, L. Finn, and M. Palta, “Estimation of the clinically diagnosed portion
of sleep apnea syndrome in middle-aged men and women,” Sleep, vol. 20, pp. 705–706, 1997.7. E. Phillipson, “Sleep apnea – a major public health problem,” N. Engl. J. Med., vol. 328, pp.
1271–1273, 1993.
8. C. Iber, S. Ancoli-Isreal, A. Chesson Jr., and S. Quan, The AASM Manual for Scoring of Sleepand Associated Events-Rules: Terminology and Technical Specification. American Academy
of Sleep Medicine, 2007.9. F. R., M. R., C. M., and et al., “ASDA standards of practice: portable recording in the
assessment of obstructive sleep apnea,” Sleep, vol. 17, pp. 378–392, 1994.
10. H. Nakano, T. Tanigawa, T. Furukawa, and S. Nishima, “Automatic detection of sleep-disordered breathing from a single-channel airflow record,” Eur. Respir. J., vol. 29, no. 4,
pp. 728–736, Apr 2007.
11. J. Han, H. Shin, D. Jeong, and K. Park, “Detection of apneic events from single channel nasalairflow using 2nd derivative method,” Comput. Meth. Prog. Bio., vol. 91, no. 3, pp. 199–207,
Sep 2008.
12. R. Ragette, Y. Wang, G. Weinreich, and H. Teschler, “Diagnostic performance of single airflowchannel recording (apnealink) in home diagnosis of sleep apnea,” Sleep Breath, vol. 14, no. 2,
pp. 109–114, Jun 2010.
13. S. Rathnayake, I. Wood, U. Abeyratne, and C. Hukins, “Nonlinear features for single-channeldiagnosis of sleep-disordered breathing diseases,” IEEE Trans. Biomed. Eng., vol. 57, no. 8,
pp. 1973–1981, Aug 2010.14. B. Koley and D. Dey, “Real-time adaptive apnea and hypopnea event detection methodology
for portable sleep apnea monitoring devices,” IEEE Trans. Biomed. Eng., vol. 60, no. 12, pp.
3354–3363, Dec 2013.15. J. Jin and E. Sanchez-Sinencio, “A home sleep apnea screening device with time-domain
signal processing and autonomous scoring capability,” Biomedical Circuits and Systems, IEEE
Transactions on, vol. 9, no. 1, pp. 96–104, Feb 2015.16. R. Thomas, J. Mietus, C. Peng, G. Gilmartin, R. Daly, A. Goldberger, and D. Got-
tlieb, “Differentiating obstructive from central and complex sleep apnea using an automated
electrocardiogram-based method,” Sleep, vol. 30, no. 12, pp. 1756–1769, Dec 2007.17. A. Khandoker, M. Palaniswami, and C. Karmakar, “Support vector machines for automated
recognition of obstructive sleep apnea syndrome from ecg recordings,” IEEE Trans. Inf. Tech-
nol. B., vol. 13, no. 1, pp. 37–48, 2009.18. A. H. Khandoker, J. Gubbi, and M. Palaniswami, “Automated scoring of obstructive sleep
apnea and hypopnea events using short-term electrocardiogram recordings,” IEEE Trans. Inf.Technol. B., vol. 13, no. 6, pp. 1057–67, 2009.
19. M. Bsoul, H. Minn, and L. Tamil, “Apnea medassist: Real-time sleep apnea monitor using
single-lead ecg,” IEEE Trans. Inf. Technol. B., vol. 15, no. 3, pp. 416–427, May 2011.20. A. Burgos, A. Goni, A. Illarramendi, and J. Bermudez, “Real-time detection of apneas on a
pda,” IEEE Trans. Inf. Technol. B., vol. 14, no. 4, pp. 995–1002, July 2010.21. D. Alvarez, R. Hornero, J. Marcos, and F. del Campo, “Multivariate analysis of blood oxy-
gen saturation recordings in obstructive sleep apnea diagnosis,” IEEE Trans. Biomed. Eng.,
vol. 57, no. 12, pp. 2816–2824, Dec 2010.
22. H. Alshaer, M. Garcia, M. Radfar, G. Fernie, and T. Bradley, “Detection of upper airway nar-rowing via classification of lpc coefficients: Implications for obstructive sleep apnea diagnosis,”
in Acoustics, Speech and Signal Processing (ICASSP), 2011 IEEE International Conferenceon, May 2011, pp. 681–684.
23. L. Lee, J. Yu, Y. Lo, Y. Chen, D. Wang, C. Cho, Y. Ni, N. Chen, F. T.J., C. Huang, and
H. Li, “Energy types of snoring sounds in patients with obstructive sleep apnea syndrome: a
preliminary observation,” PLoS One, vol. 7, no. 12, p. e53481, 2012.

SLEEP APNEA DETECTION VIA PIEZO-ELECTRIC BANDS 21
24. B. Xie and H. Minn, “Real-time sleep apnea detection by classifier combination,” IEEE Trans.
Inf. Technol. B., vol. 16, no. 3, pp. 469–477, May 2012.
25. D. Morillo, J. Ojeda, L. Foix, and A. Jimenez, “An accelerometer-based device for sleep apneascreening,” IEEE Trans. Inf. Technol. B., vol. 14, no. 2, pp. 491–499, March 2010.
26. D. Alvarez-estevez and V. Moret-bonillo, “Computer-Assisted Diagnosis of the Sleep Apnea-
Hypopnea Syndrome : A Review,” Sleep disorders, vol. 2015, p. 237878, 2015.27. K. Nepal, E. Biegeleisen, and T. Ning, “Apnea detection and respiration rate estimation
through parametric modelling,” Proceedings of the IEEE Annual Northeast Bioengineering
Conference, NEBEC, vol. 2002-January, no. 4, pp. 277–278, 2002.28. P. Varady, S. Bongar, and Z. Benyo, “Detection of airway obstructions and sleep apnea by
analyzing the phase relation of respiration movement signals,” IEEE Trans. Instrum. Meas.,
vol. 52, no. 1, pp. 2–6, Feb 2003.29. H. Al-Angari and A. Sahakian, “Automated recognition of obstructive sleep apnea syndrome
using support vector machine classifier,” IEEE Trans. Inf. Technol. B., vol. 16, no. 3, pp.463–468, May 2012.
30. Y.-Y. Lin, Y.-L. Lo, P.-Y. Lai, S.-Y. Huang, C.-W. Wang, P.-C. Huang, and Y.-H. Huang,
“Sleep apnea event identification algorithm using thoracic-abdominal motion,” in Poster pre-sentation at SLEEP 2015, the 29th Annual Meeting of the Associated Professional Sleep
Societies, May 2015.
31. R. Berry, R. Budhiraja, D. Gottlieb, and et al., “Rules for scoring respiratory events in sleep:update of the 2007 AASM Manual for the Scoring of Sleep and Associated Events,” J Clin
Sleep Med, vol. 8, no. 5, pp. 597–619, 2012.
32. M. Folke, L. Cernerud, M. Ekstrom, and B. Hok, “Critical review of non-invasive respiratorymonitoring in medical care,” Medical & Biological Engineering & Computing, vol. 41, no. 4,
pp. 377–83, 2003.
33. B. Scholkopf and A. Smola, Learning with Kernels. MIT Press, 2002.34. American Academy of Sleep Medicine (AASM) Task Force, “Sleep related breathing disorders
in adults: Recommendations for syndrome definition and measurement techniques in clinicalresearch,” Sleep, vol. 22, pp. 667–689, 1999.
35. T. Lee-Chiong, Sleep Medicine: Essentials and Review. Oxford, 2008.
36. H.-T. Wu, R. Talmon, and Y.-L. Lo, “Assess sleep stage by modern signal processing tech-niques,” IEEE Trans. Biomed. Eng., vol. 62, no. 4, pp. 1159–1168, April 2015.
37. H.-T. Wu, “Instantaneous frequency and wave shape functions (I),” Appl. Comput. Harmon.
Anal., vol. 35, pp. 181–199, 2013.38. C.-Y. Lin, S. Li, and H.-T. Wu, “Wave-shape function analysis–when cepstrum meets time-
frequency analysis,” under revision, arXiv preprint arXiv:1605.01805, 2016.
39. I. Daubechies, J. Lu, and H.-T. Wu, “Synchrosqueezed Wavelet Transforms: an empiricalmode decomposition-like tool,” Appl. Comput. Harmon. Anal., pp. 243–261, 2011.
40. Y.-C. Chen, M.-Y. Cheng, and H.-T. Wu, “Nonparametric and adaptive modeling of dynamic
seasonality and trend with heteroscedastic and dependent errors,” J. Roy. Stat. Soc. B, vol. 76,pp. 651–682, 2014.
41. C. K. Chui, Y.-T. Lin, and H.-T. Wu, “Real-time dynamics acquisition from irregular sam-ples – with application to anesthesia evaluation,” Analysis and Applications, accepted for
publication, 2015.
42. A. Kumar, W. Hofman, and W. Burzelewski, “Analysis of sleep apnea,” 2005, uS Patent6,893,405. [Online]. Available: https://www.google.com/patents/US6893405
43. R. Coleman, H. Roffwarg, S. Kennedy, and et al, “Sleep-wake disorders based on a polysomno-graphic diagnosis: A national cooperative study,” JAMA, vol. 247, no. 7, pp. 997–1003, 1982.
44. F. B. Simmons, C. Guilleminault, and L. E. Miles, “The palatopharyngoplasty operation
for snoring and sleep apnea: An interim report,” Otolaryngology – Head and Neck Surgery,
vol. 92, no. 4, pp. 375–380, 1984.45. N. Butkov and T. Lee-Chiong, Fundamentals of Sleep Technology. Wolters Kluwer, 2007.
46. W. Randerath, B. Sanner, and V. Somers, Sleep Apnea: Current Diagnosis and Treatment.Karger, 2006.
47. R. Rifkin and A. Klautau, “In Defense of One-Vs-All Classification,” Journal of Machine
Learning Research, vol. 5, pp. 101–141, 2004.

22 Y.-Y. LIN, H.-T. WU, C.-A. HSU, P.-C. HUANG, Y.-H. HUANG, AND Y.-L. LO
48. P. Bridevaux, J. Fitting, J. Fellrath, and J. Aubert, “Inter-observer agreement on apnoea
hypopnoea index using portable monitoring of respiratory parameters,” Swiss Med. Wkly.,
vol. 3, no. 137, pp. 602–607, 2007.49. W. Karlen, K. Kobayashi, J. M. Ansermino, and G. A. Dumont, “Photoplethysmogram sig-
nal quality estimation using repeated Gaussian filters and cross-correlation,” Physiological
Measurement, vol. 33, no. 10, pp. 1617–1629, 2012.50. C. Orphanidou, T. Bonnici, P. Charlton, D. Clifton, D. Vallance, and L. Tarassenko, “Signal-
quality indices for the electrocardiogram and photoplethysmogram: Derivation and applica-
tions to wireless monitoring,” IEEE Journal of Biomedical and Health Informatics, vol. 19,no. 3, pp. 832–838, 2015.
51. P. Martinot-Lagarde, R. Sartene, M. Mathieu, and G. Durand, “What does inductance
plethysmography really measure?” Journal of Applied Physiology, vol. 64, no. 4, pp. 1749–1756, 1988.
52. A. de Groote, Y. Verbandt, M. Paiva, and P. Mathys, “Measurement of thoracoabdominalasynchrony: importance of sensor sensitivity to cross section deformations.” Journal of applied
physiology, vol. 88, no. 4, pp. 1295–302, 2000.
Department of Electrical engineering, National Tsing-Hua University, Taiwan.
E-mail address: [email protected]
Department of Mathematics, University of Toronto
E-mail address: [email protected]
Department of Electrical engineering, National Tsing-Hua University, Taiwan.
Department of Electrical engineering, National Tsing-Hua University, Taiwan.E-mail address: [email protected]
Department of Electrical engineering and Institute of Communications Engineering,National Tsing-Hua University, Taiwan
E-mail address: [email protected]
Department of Thoracic Medicine, Healthcare Center, Chang Gung Memorial Hos-pital, Chang Gung University, School of Medicine, Taipei, Taiwan
E-mail address: [email protected]

SLEEP APNEA DETECTION VIA PIEZO-ELECTRIC BANDS 23
ARtho(n) FRtho(n) ARabd(n) FRabd(n)
(n)
O/C
(n)
N/OC
OSAOSA event occurring
CSACSA event occurring
NOR
Normal breathing
(1)
(2)
(3)
(4)
Figure 5. Flowchart of the sleep apnea event identification algo-rithm. Four features (ARtho, FRtho, ARabd and FRabd) are extractedfrom each segment of the thoracic and abdominal signals shown onthe top panel. Here a.u. indicates arbitrary unit. The extractedfeatures are then fed into two binary SVM classifiers, CLF N OC andCLF O C, to train the SVM classifying model. The designed statemachine is illustrated in the bottom panel, which contains threestates, N, O, and C. The transition criteria, (1)-(4), are detailed insubsection 5.

24 Y.-Y. LIN, H.-T. WU, C.-A. HSU, P.-C. HUANG, Y.-H. HUANG, AND Y.-L. LO
220 221 222 223 224 225 226 227 228 229 230
ABD
THO
CFlow
TruthGround
MachineState
Time(min)
CSA
NOR
OSA
CSA
NOR
OSA
Figure 6. The event-by-event detection result obtained from theproposed on-line state machine algorithm. In the top and secondpanels, the sleep apnea events detected by the proposed algorithmand those determined by the sleep expert, respectively, are pre-sented to compare the performance. Here we consider the sleepapnea events determined by the sleep expert as the ground truth.The nasal flow signal (CFlow), thoracic (THO) and abdominal(ABD) movement signals are all presented in the below panels forcomparison. At various time points, although a deviation betweenlengths of events determined by the sleep expert and those deter-mined using our algorithm, the events could be efficiently capturedby using our algorithm.
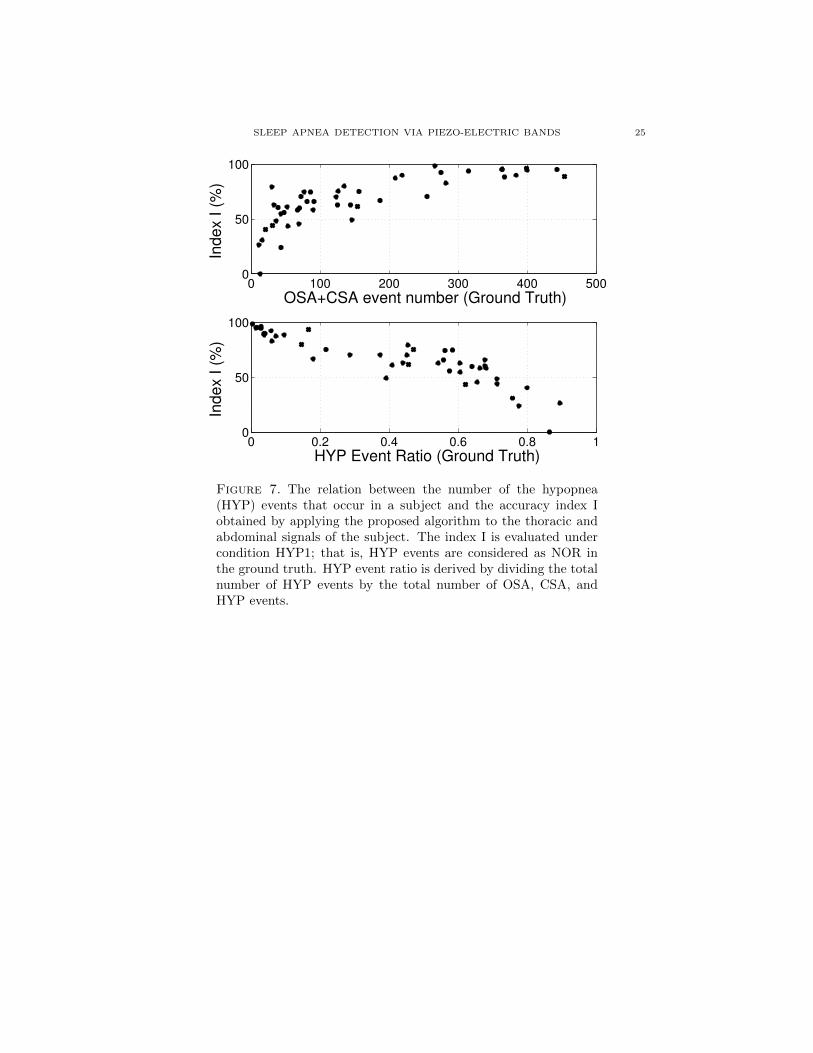
SLEEP APNEA DETECTION VIA PIEZO-ELECTRIC BANDS 25
0 100 200 300 400 5000
50
100
Ind
ex I
(%
)
OSA+CSA event number (Ground Truth)
0 0.2 0.4 0.6 0.8 10
50
100
Ind
ex I
(%
)
HYP Event Ratio (Ground Truth)
Figure 7. The relation between the number of the hypopnea(HYP) events that occur in a subject and the accuracy index Iobtained by applying the proposed algorithm to the thoracic andabdominal signals of the subject. The index I is evaluated undercondition HYP1; that is, HYP events are considered as NOR inthe ground truth. HYP event ratio is derived by dividing the totalnumber of HYP events by the total number of OSA, CSA, andHYP events.