slide 1 september 1999ucb the analysis of digital mammograms: spiculated tumor detection and normal...
TRANSCRIPT

Slide 1September 1999 UCB
The Analysis of Digital Mammograms:Spiculated Tumor Detection
and Normal Mammogram Characterization
Edward J. Delp
Purdue University School of Electrical and Computer Engineering
Video and Image Processing Laboratory (VIPER)West Lafayette, Indiana, USA
[email protected]://www.ece.purdue.edu/~ace

Slide 2September 1999 UCB
Outline
• Breast Cancer and Mammography
• Multiresolution Detection of Spiculated Lesions
• Normal Mammogram Analysis and Characterization
• Future Research

Slide 3September 1999 UCB
Research Team
Charles Babbs - Department of Basic Medical Sciences
Zygmunt Pizlo - Department of Psychological Sciences
Sheng Lui - School of Electrical and Computer Engineering
Valerie Jackson - IU Department of Radiology
Funding - NSF, NIH, and Purdue Cancer Center
http://www.ece.purdue.edu/~ace/mammo/mammo.html

Slide 4September 1999 UCB
Breast Cancer
• Second major cause of cancer death among women in the United States (after lung cancer)
• Leading cause of nonpreventable cancer death
• 1 in 8 women will develop breast cancer in her lifetime
• 1 in 30 women will die from breast cancer

Slide 5September 1999 UCB
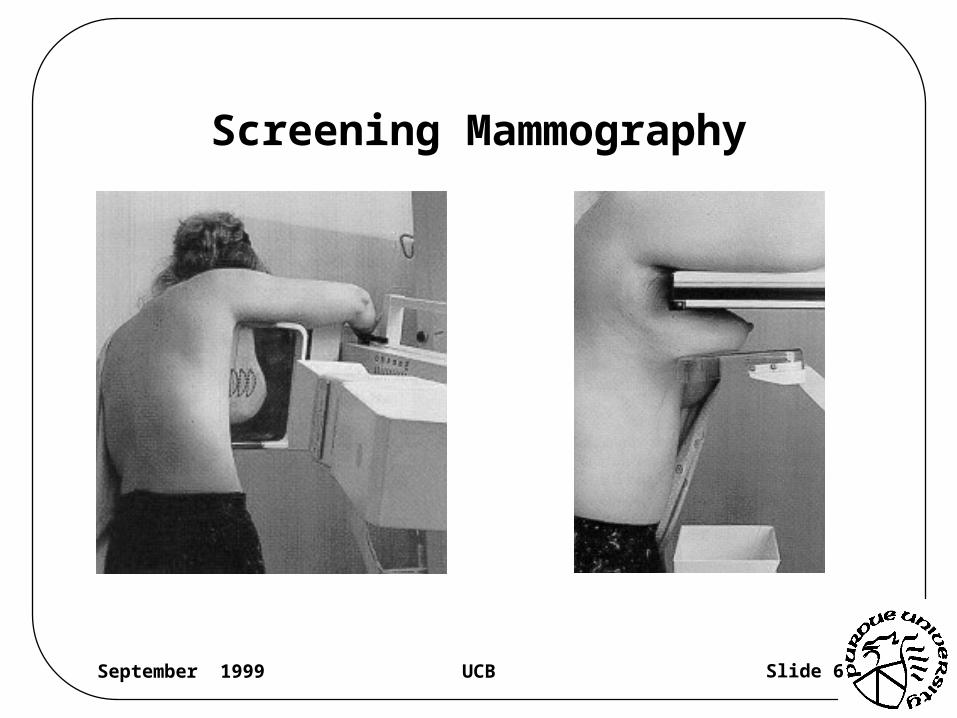
Mammography
• Mammograms are X-ray images of the breast
• Screening mammography is currently the best technique for reliable detection of early, non-palpable, potentially curable breast cancer
• Studies show that mammogram can reduce the overall mortality from breast cancer by up to 30%
Slide 6September 1999 UCB
Screening Mammography
Slide 7September 1999 UCB
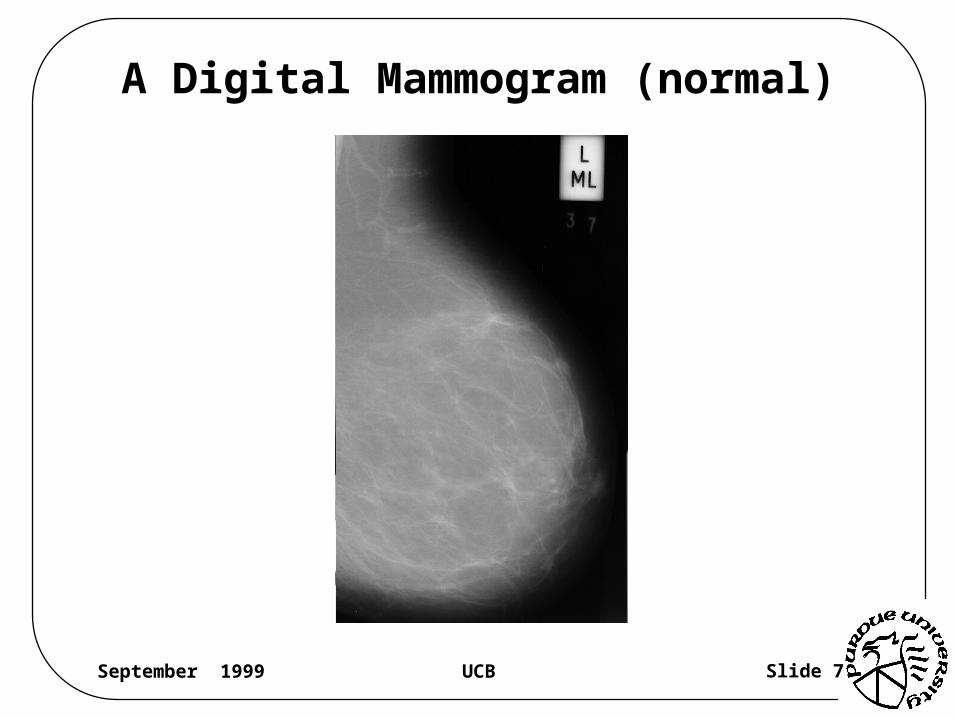
A Digital Mammogram (normal)
Slide 8September 1999 UCB
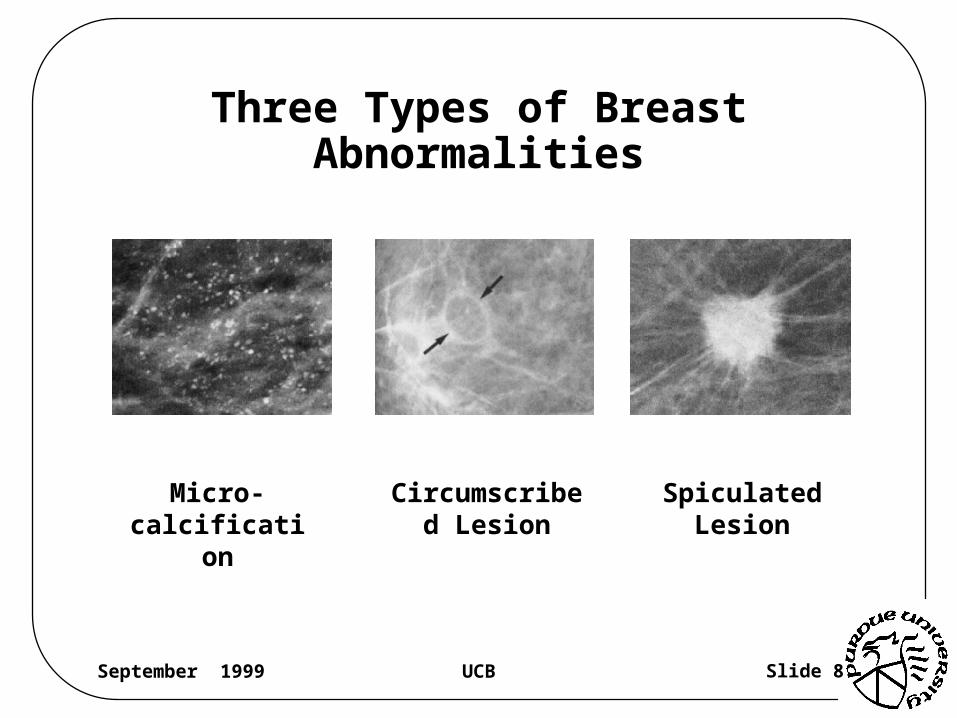
Three Types of Breast Abnormalities
Micro-calcification
Circumscribed Lesion
Spiculated Lesion
Slide 9September 1999 UCB
Problems in Screening Mammography
• Radiologists vary in their interpretation of the same mammogram
• False negative rate is 4 – 20% in current clinical mammography
• Only 15 – 34% of women who are sent for a biopsy actually have cancer

Slide 10September 1999 UCB
Current Research in Computer Aided Diagnosis (CAD)
• The goal is to increase diagnostic accuracy as well as the reproducibility of mammographic interpretation
• Most work aims at detecting one of the three abnormal structures
• Some have explored classifying breast lesions as benign or malignant
• The implementation of CAD systems in everyday clinical applications will change the practice of radiology
Slide 11September 1999 UCB
Multiresolution Detection of Spiculated Lesions in Digital Mammograms
• Spiculation or a stellate appearance in mammograms indicates with near certainty the presence of breast cancer
• Detection of spiculated lesions is very important in the characterization of breast cancer
Slide 12September 1999 UCB
Spiculated Lesions
• Spiculated lesions vary from a few millimeters to several centimeters in size
• Center masses of spiculated lesions are usually irregular with ill-defined borders
• Usually the larger the tumor center, the longer its spicules or “arms”

Slide 13September 1999 UCB
Difficulties
• Computer aided diagnosis of digital mammograms generally consists of feature extraction followed by classification
• It is very difficult to determine the neighborhood size that should be used to extract features which are local
• If the neighborhood is too large, small lesions may be missed
• If the neighborhood is too small, one may not be able to capture features of larger lesions

Slide 14September 1999 UCB
Appearance of A Spiculated Lesion at Multiple Resolutions

Slide 15September 1999 UCB
Block Diagram of Multiresolution Detection of Spiculated Lesions
Slide 16September 1999 UCB
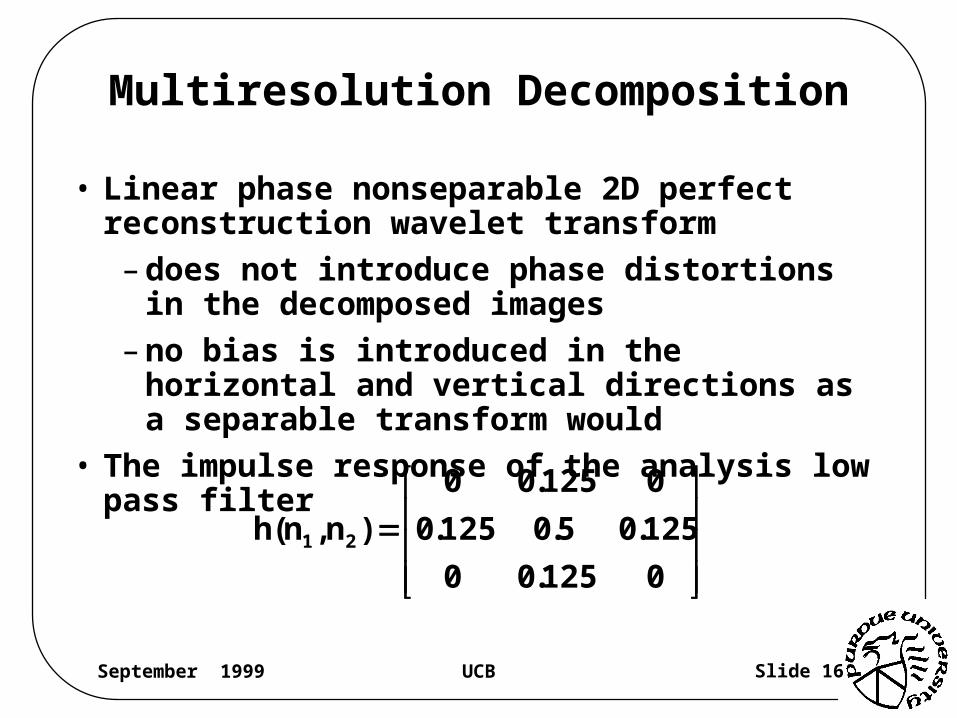
Multiresolution Decomposition
• Linear phase nonseparable 2D perfect reconstruction wavelet transform
– does not introduce phase distortions in the decomposed images
– no bias is introduced in the horizontal and vertical directions as a separable transform would
• The impulse response of the analysis low pass filter
0125.00
125.05.0125.0
0125.00
)n,n(h 21
Slide 17September 1999 UCB
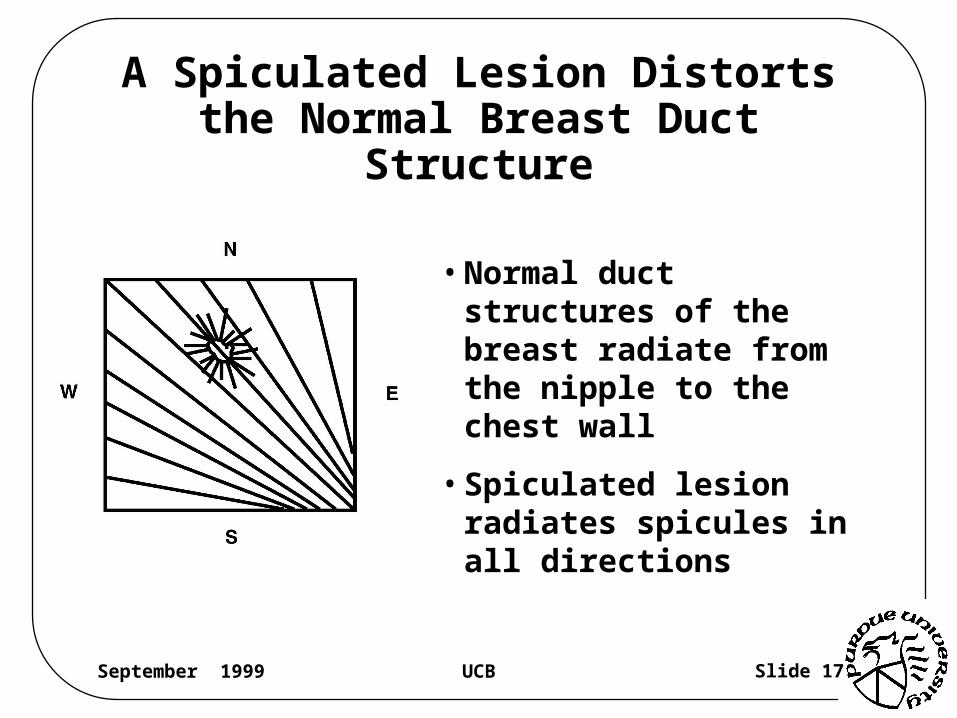
A Spiculated Lesion Distorts the Normal Breast Duct Structure
• Normal duct structures of the breast radiate from the nipple to the chest wall
• Spiculated lesion radiates spicules in all directions

Slide 18September 1999 UCB
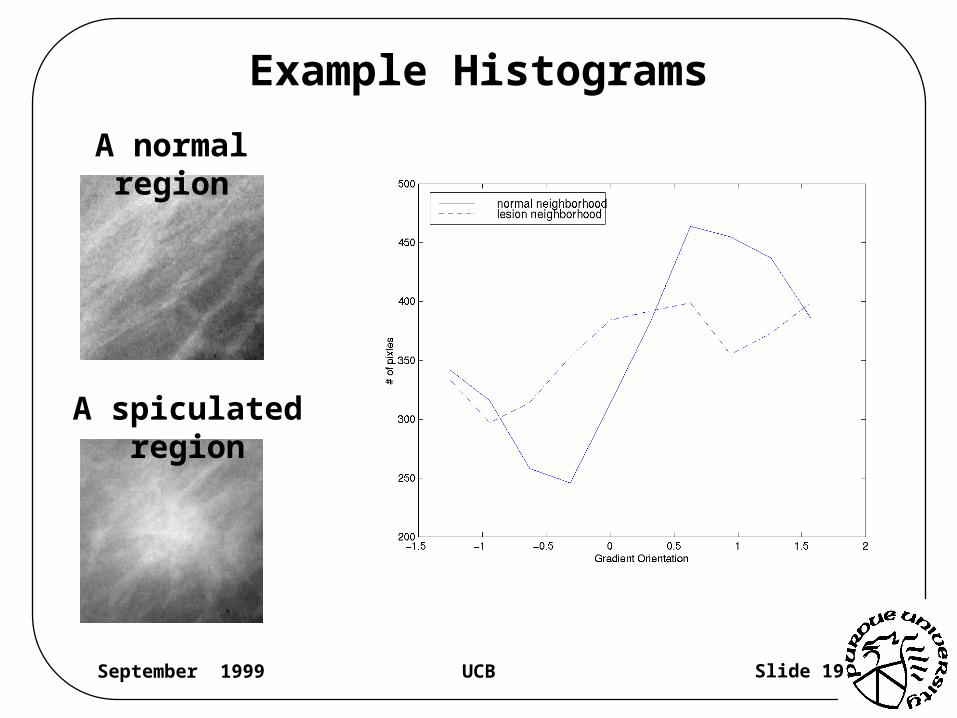
Gradient Orientation Histogram
• Has a peak at the ductal structure orientation near a normal pixel
• Flat near a lesion pixel
Slide 19September 1999 UCB
Example Histograms
A normal region
A spiculated region
Slide 20September 1999 UCB
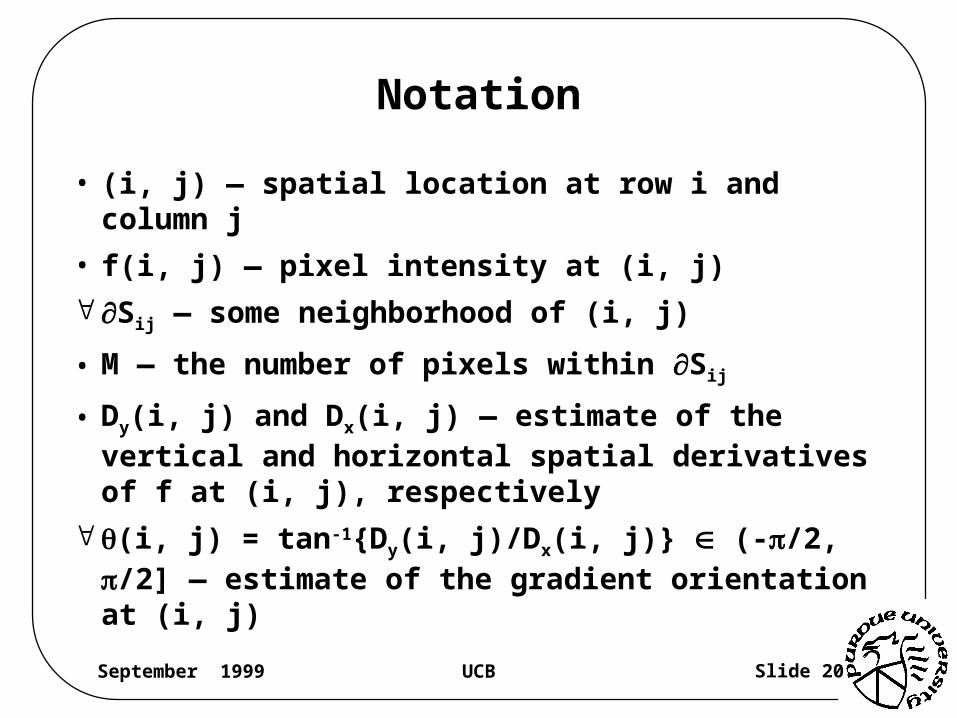
Notation
• (i, j) — spatial location at row i and column j
• f(i, j) — pixel intensity at (i, j)
Sij — some neighborhood of (i, j)
• M — the number of pixels within Sij
• Dy(i, j) and Dx(i, j) — estimate of the vertical and horizontal spatial derivatives of f at (i, j), respectively
(i, j) = tan-1{Dy(i, j)/Dx(i, j)} (-/2, /2] — estimate of the gradient orientation at (i, j)

Slide 21September 1999 UCB
Notation
• histij — histogram of within Sij using 256 bins
• histij(n) — # of pixels in Sij that have gradient
orientations , where n = 0, 1,
…, 255
• — average bin height of histij
255
0nij )n(hist
2561
)j,i(hist
256)1n(
2,
256n
2

Slide 22September 1999 UCB
Folded Gradient Orientation
• M+(i, j) and M-
(i, j) — number of positive and negative
gradient orientations within Sij, respectively
• and — average positive and negative
gradient orientations, respectively
•
— folded gradient orientation
)j,i( )j,i(
otherwise)j,i(
)j,i(M)j,i(M,2/)j,i()j,i(if)j,i(
)j,i(M)j,i(M,2/)j,i()j,i(if)j,i(
)j,i(

Slide 23September 1999 UCB
Why Folded Gradient Orientation?
So that is not sensitive to the nominal value of , but to the actual gradient orientation variances
)j,i(
• The gradient orientation distance between /2 and -/4 is the same as that between /2 and /4, however ([/2, -/4]) = 2.8 ([/2, /4]) = 0.3
• -/4 folds to 3/4, now
’([/2, -/4]) = ’([/2, /4]) = 0.3
Slide 24September 1999 UCB
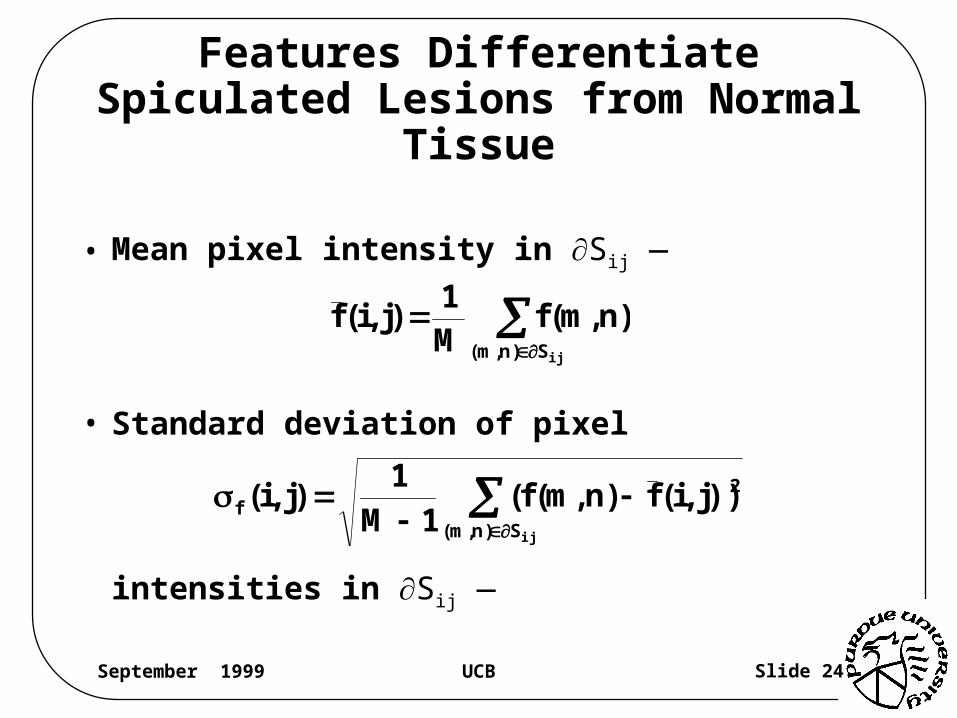
Features Differentiate Spiculated Lesions from Normal Tissue
ijS)n,m(
)n,m(fM1
)j,i(f
• Mean pixel intensity in Sij —
• Standard deviation of pixel intensities in Sij —
ijS)n,m(
2f ))j,i(f)n,m(f(
1M
1)j,i(

Slide 25September 1999 UCB
Features Differentiate Spiculated Lesions from Normal Tissue
• Standard deviation of gradient orientation histogram in Sij —
• Standard deviation of the folded gradient orientations in Sij —
255
0n
2ijijhist ))n(hist)n(hist(
255
1)j,i(
ijS)n,m(
2))j,i()n,m((1M
1)j,i(

Slide 26September 1999 UCB
Multiresolution Feature Analysis
• Choose a neighborhood that is small enough to capture the smallest possible spiculated lesion in the finest resolution
• Fix this neighborhood size for feature extraction at all resolutions
• Larger lesions will be detected at a coarser resolution
• Smaller lesions can be detected at a finer resolution
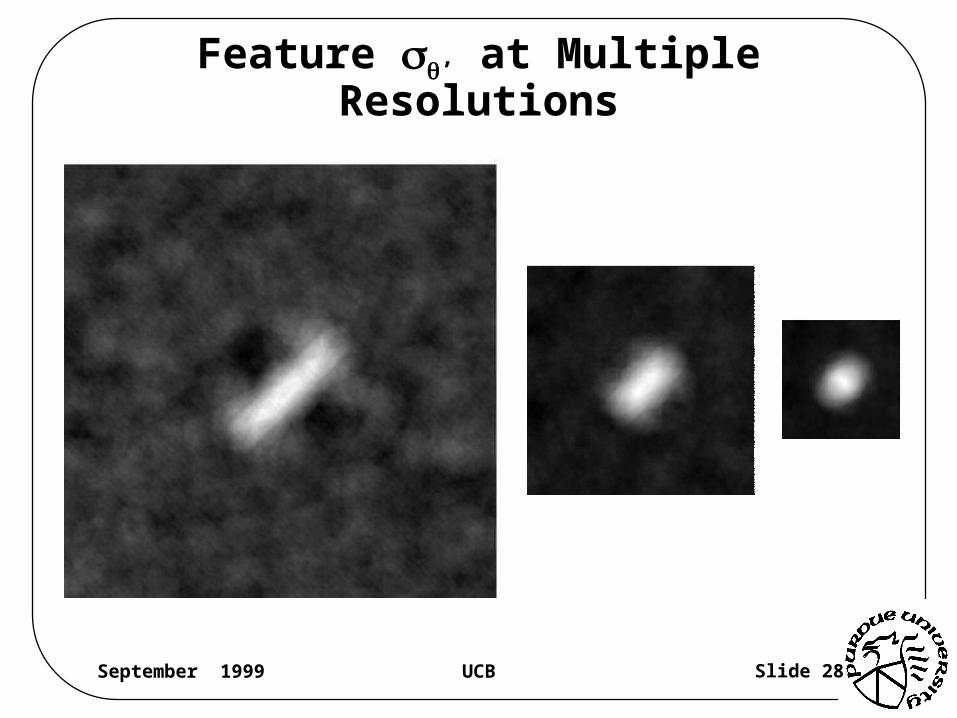
Slide 27September 1999 UCB
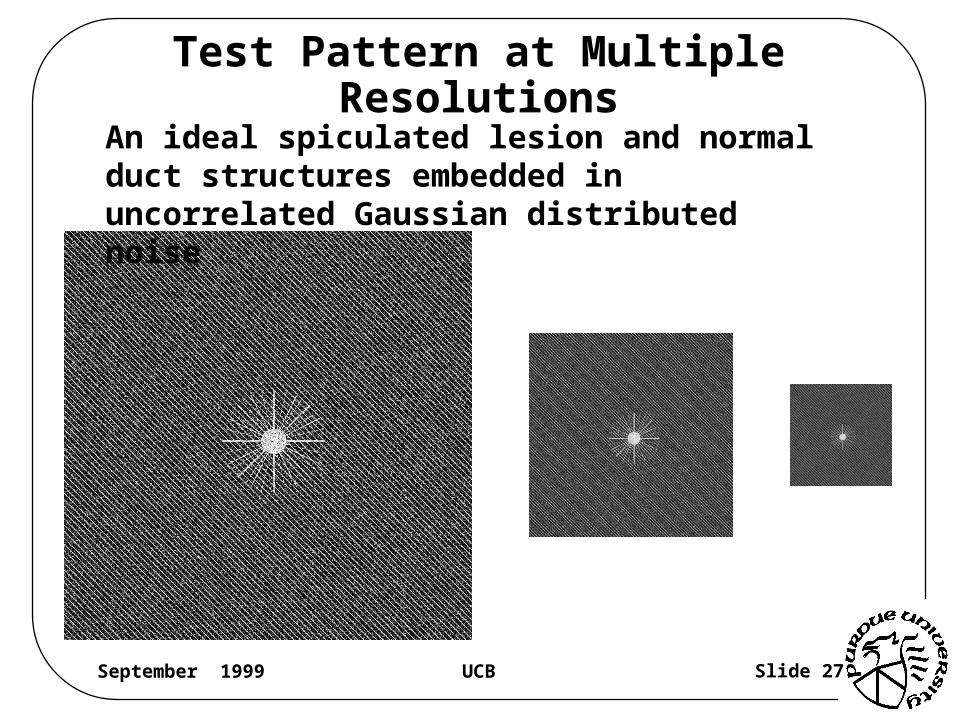
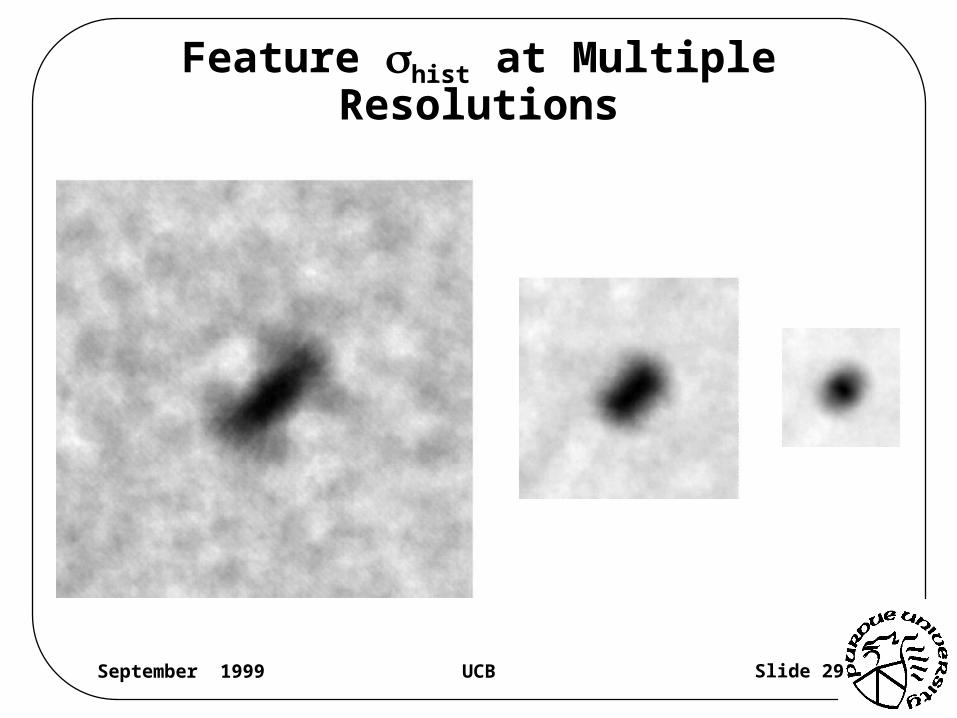
Test Pattern at Multiple Resolutions
An ideal spiculated lesion and normal duct structures embedded in uncorrelated Gaussian distributed noise
Slide 28September 1999 UCB
Feature ’ at Multiple Resolutions
Slide 29September 1999 UCB
Feature hist at Multiple Resolutions

Slide 30September 1999 UCB
Feature at Multiple Resolutionsf

Slide 31September 1999 UCB
Feature f at Multiple Resolutions

Slide 32September 1999 UCB
A Simple Binary Tree Classifier

Slide 33September 1999 UCB
Advantages ofTree-Structured Approach
• Robust with respect to outliers and misclassified points in the training set
• The classifier can be efficiently represented
• Once trained, classification is very fast
• Provides easily understood and interpreted information regarding the predictive structure of the data
• Classifier used is described in a paper by Gelfand, Ravishankar, and Delp (PAMI 1991)
Slide 34September 1999 UCB
Multiresolution Detection
• At each resolution, five features are used: the four features extracted at that resolution plus the feature hist extracted from the next coarser resolution
• Detection starts from the second coarsest resolution
• A positive detection at a coarser resolution eliminates the need for both feature extraction and detection at the corresponding pixel locations at all finer resolutions
• A negative result at a coarser resolution will be combined with those at finer resolutions via weighted sum
Slide 35September 1999 UCB
Database
• MIAS database provided by the Mammographic Image Analysis Society in the UK
• 50 resolution
• A total of 19 mammograms containing spiculated lesions
• Smallest lesion extends 3.6 mm in radius
• Largest lesion extends 35 mm in radius
Slide 36September 1999 UCB
Half/Half Training Methodology
• The 19 mammograms containing spiculated lesions together with another 19 normal mammograms are random split into two sets with approximately an equal number of lesion and normal mammograms in each set
• Each set was used separately as a training set to generate two BCTs
• A BCT trained by one set was used to classify mammograms in the other set, and vice versa
Slide 37September 1999 UCB
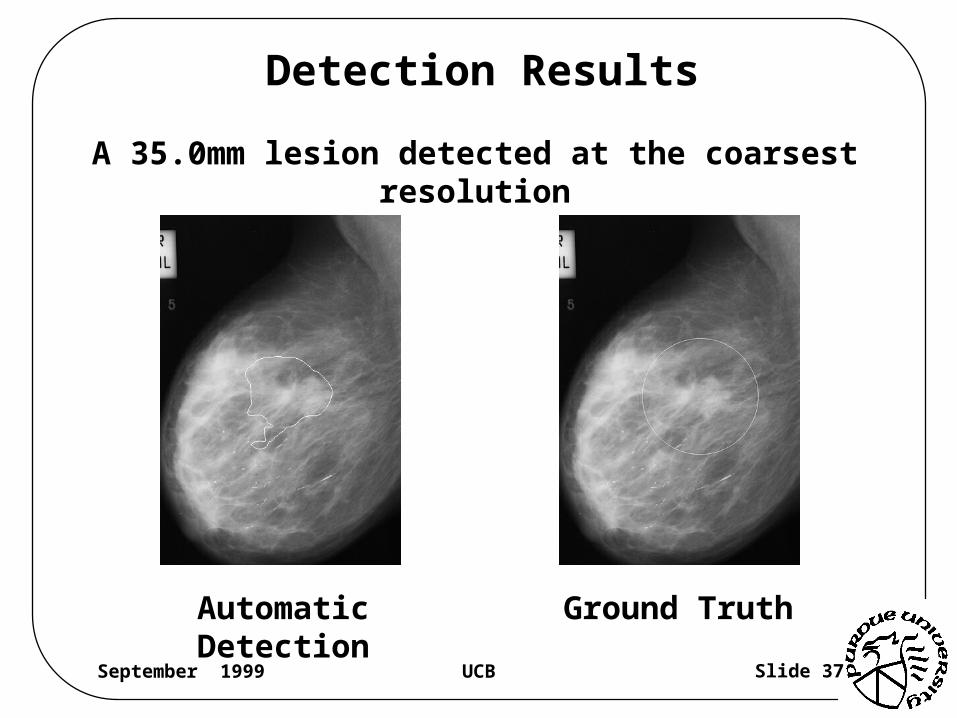
Detection Results
A 35.0mm lesion detected at the coarsest resolution
Automatic Detection Ground Truth
Slide 38September 1999 UCB
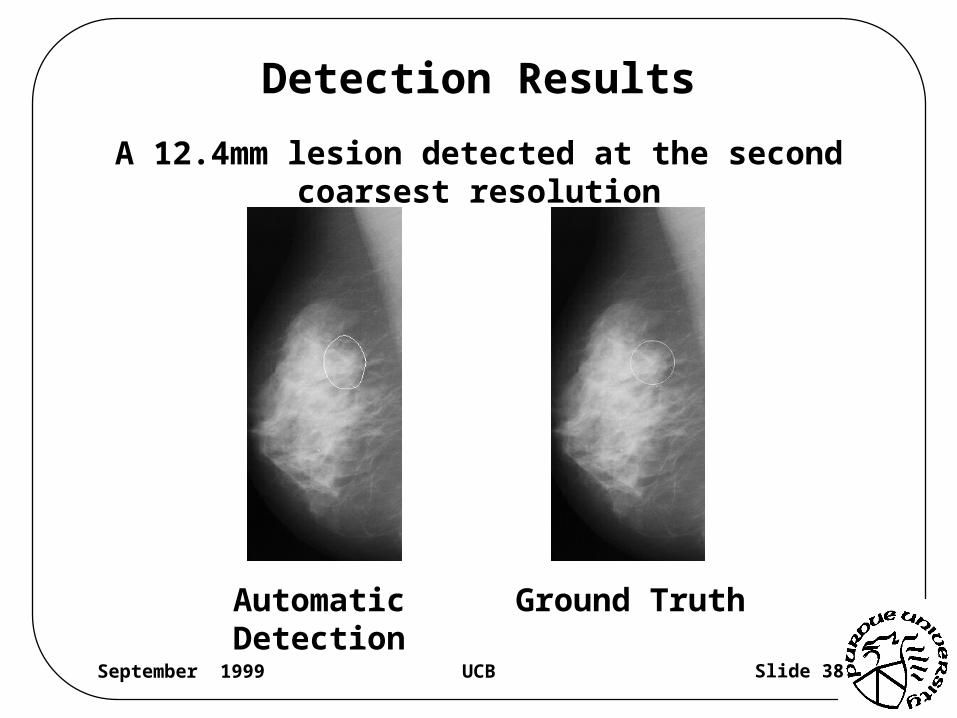
Detection Results
Automatic Detection Ground Truth
A 12.4mm lesion detected at the second coarsest resolution
Slide 39September 1999 UCB
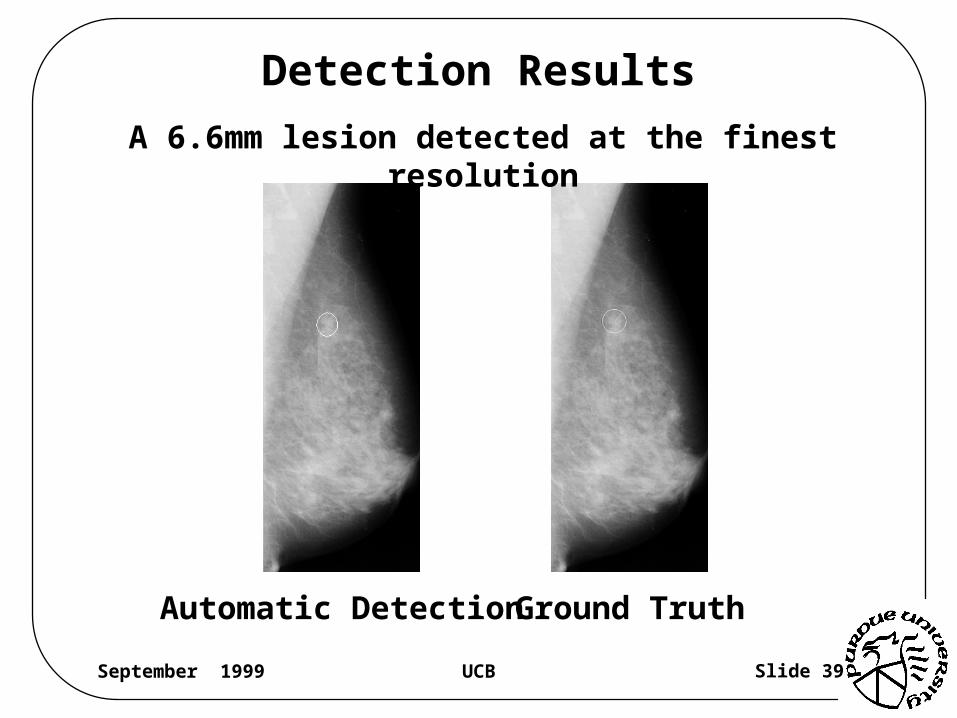
Detection Results
A 6.6mm lesion detected at the finest resolution
Automatic Detection Ground Truth
Slide 40September 1999 UCB
Summary
• Multiresolution detection eliminates the problem of choosing a neighborhood size a priori to capture features of lesions of varying sizes
• Using features across resolutions simultaneously helps capture spiculated lesions of sizes that exist between the resolutions
• Top-down approach requires less computation by starting with the least amount of data and propagating detection results to finer resolutions

Slide 41September 1999 UCB
Normal Mammograms Characterization
• Better understanding of normal mammograms can greatly help reduce the “misses” in cancer detection
• Little work has been done on characterizing normal mammograms
P(normal)normal)|P(imageP(cancer)cancer)|P(image
P(cancer)cancer)|P(imageimage)|P(cancer

Slide 42September 1999 UCB
Very Different Normal Mammograms
Density 1 Density 2 Density 3 Density 4

Slide 43September 1999 UCB
General Normal Characteristics
• Unequivocally normal areas have lower density than abnormal ones
– no spikes indicating microcalcifications
– no large bright areas indicating masses
• Normal areas have “quasi-parallel” linear markings

Slide 44September 1999 UCB
Normal Linear Markings
• Shadow of normal ducts and connective tissue elements
• Appear slightly curved
• Approximately linear over short segments
• Can be observed as straight line segments of dimensions 1 to 2 mm or greater in length and 0.1 to 1.0 mm in width
• Low contrast in very noisy background
Slide 45September 1999 UCB
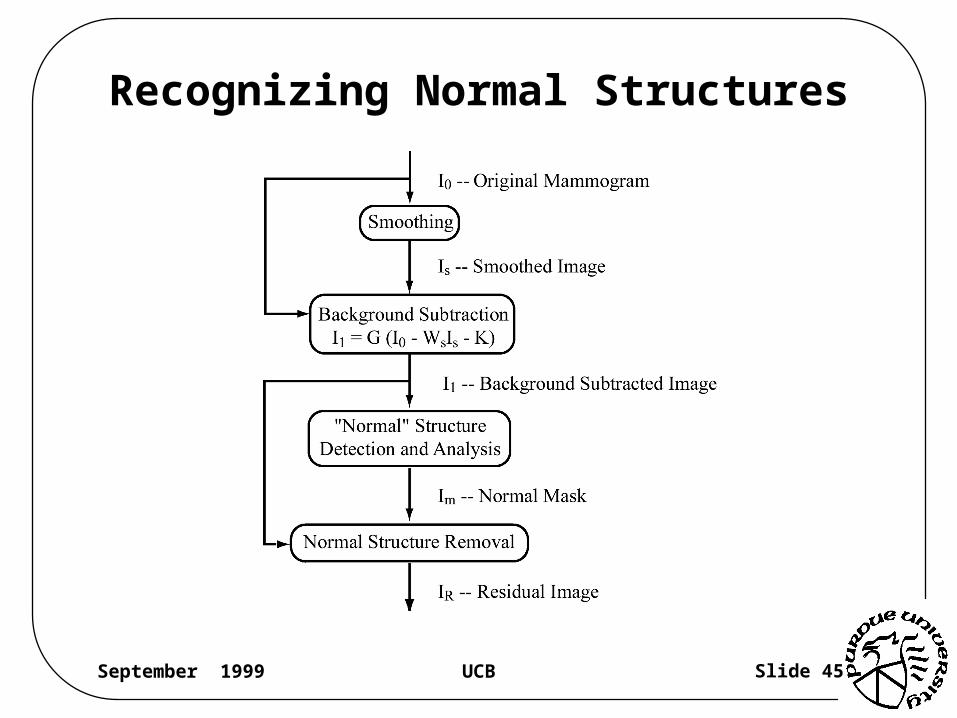
Recognizing Normal Structures
Slide 46September 1999 UCB
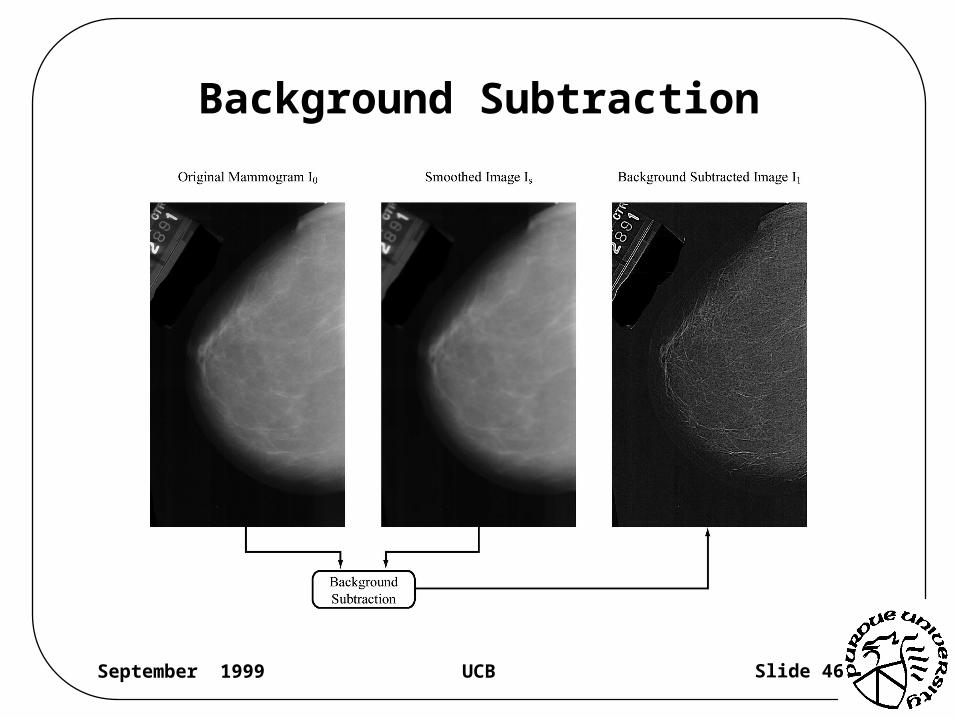
Background Subtraction

Slide 47September 1999 UCB
Problems in Extracting Linear Markings
• Edge detection based line detectors
– generate very dense edge maps due to small spatial extent of most local edge operators
– miss “thick” lines
• Hough transform based line detectors
– do not provide locations of lines
– not suitable for grayscale images

Slide 48September 1999 UCB
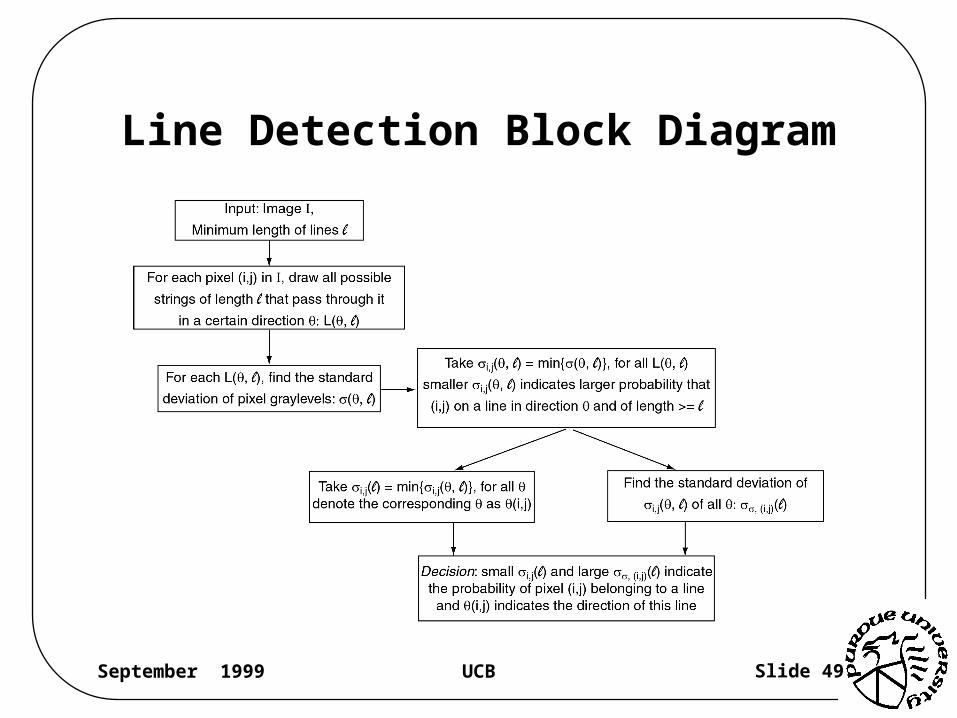
A New Model For Lines
• There exists a string of pixels with similar graylevels along a certain direction
• The surrounding pixels have different graylevels
• The length of a line is greater than its width
Slide 49September 1999 UCB
Line Detection Block Diagram

Slide 50September 1999 UCB
Advantages
Given minimum length l, our new line detector can detect
– lines of very different width, from single pixel wide up to l
– lines of any length that is greater than l
– lines with varying width, provided that the changes are “slower” than l
– curves, provided that over short segment, they can be approximated as lines of length greater than l
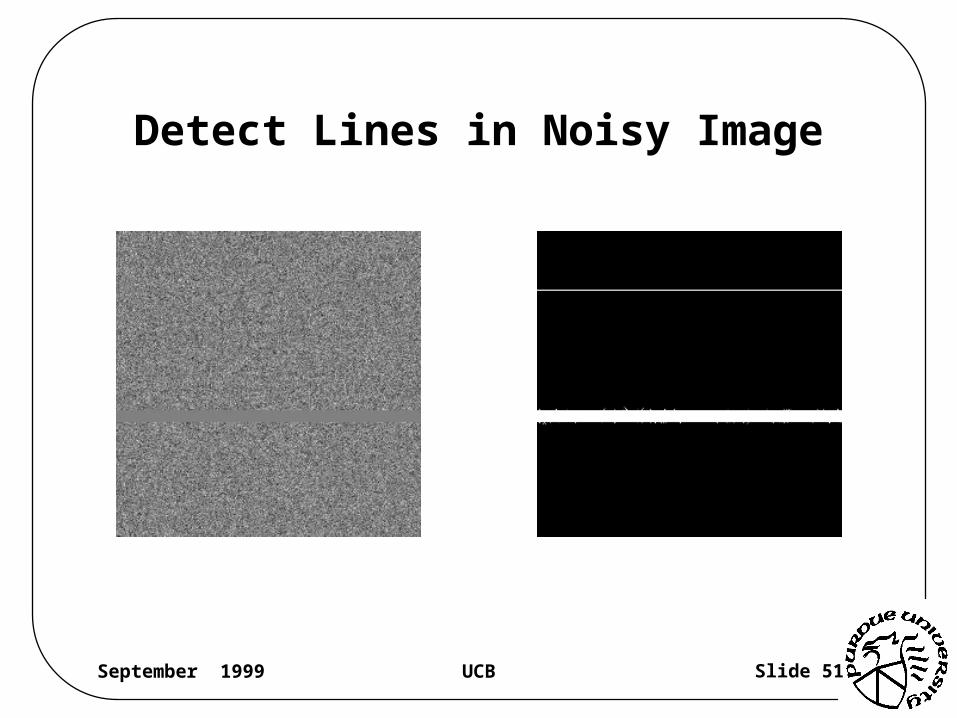
Slide 51September 1999 UCB
Detect Lines in Noisy Image

Slide 52September 1999 UCB
Detect Lines Narrower Than l
Test Image l = 5 l = 20

Slide 53September 1999 UCB
Normal Structure Removal

Slide 54September 1999 UCB
Database
• Digital Database for Screening Mammography (DDSM) provided by Massachusetts General Hospital, University of South Florida, and Sandia National Laboratories
• 42 / 50 • More than 650 cases available now
• Each case consists of 4 images: left and right MLO and CC views
• Have pixel level “ground truth” information

Slide 55September 1999 UCB
Residual Image of Circumscribed Lesions
Original Mammogram
Background Subtracted Image
Residual Image

Slide 56September 1999 UCB
Residual Image of Spiculated Lesion
Original Mammogram
Background Subtracted Image
Residual Image

Slide 57September 1999 UCB
Residual Image of Microcalcifications
Original Mammogram
Background Subtracted Image
Residual Image

Slide 58September 1999 UCB
Compare with Strickland’s Microcalcification Enhancement Algorithm
Original Mammogram
Strickland’s Enhanced Image
Residual Image

Slide 59September 1999 UCB
Compare with Strickland’s Microcalcification Enhancement Algorithm
Original Mammogram
Strickland’s Enhanced Image
Residual Image

Slide 60September 1999 UCB
Summary
• Normal mammogram characterization is fundamentally simpler — characteristics of normal tissue are relatively simpler than characteristics of tumors of various types, sizes, and stages of development
• Suppressing normal structures essentially enhances abnormal structures — facilitates the classification of abnormalities
Slide 61September 1999 UCB
Future Research
• Detect stellate patterns in the “Normal” mask before removal so that spiculation remains in the residual image
• Detect normal mammogram based on obtained residual images