slide 1 the ten most powerful principles for quality in
TRANSCRIPT

Slide 1
10 Powerful Principles. © www.gilb.com 2006
"The Ten Most Powerful Principles for Quality in [Software and] Software Organizations"
ABSTRACT: Software knows it has a problem. Solutions abound. But which solutions work? What
are the most fundamental underlying principles we can observe behind those successful solutions? Can these principles guide us to select successful solutions
and avoid time wasters? One hint: in Observing successful software organizations in the US, the dominant principle seems to be feedback and control.
Prague SQAM
September 6 2006 1030-1130
Version 1.21 : Feb 12 2001 Full detailed set of slides
By Tom Gilb, Result Planning Limited [email protected], www.Gilb.com

Slide 2
10 Powerful Principles. © www.gilb.com 2006
“Principle” is ... Webster’s New World™ College Dictionary (Third Edition) on PowerCD® prin•ci•ple (prinse pel) n. 1 the ultimate source, origin, or cause of something 2 a natural or original tendency, faculty, or endowment 3 a fundamental truth, law, doctrine, or motivating force, upon which others are based
[moral principles] 4 a) a rule of conduct, esp. of right conduct b) such rules collectively c) adherence to
them; integrity; uprightness [a man of principle]
5 an essential element, constituent, or quality, esp. one that produces a specific effect [the active principle of a medicine]
6 a) the scientific law that explains a natural action [the principle of cell division] b) the method of a thing's operation [the principle of a gasoline engine is internal combustion]
in principle theoretically or in essence on principle because of or according to a principle

Slide 3
10 Powerful Principles. © www.gilb.com 2006
1. Feedback • Rapid feedback allows rapid
correction. – Methods using rapid feedback succeed,
those without seem to fail. • Methods:
– Defect Prevention Process (CMM 5, Mays, IBM 1985)
– Inspection (Fagan, IBM 1975) * – Evolutionary Project Management (Mills,
IBM, Cleanroom, 1970) * – Statistical Process Control (SPC): Shewhart,
Deming, Juran (1920’s)
* reprints are in IBM Systems Journal, 2&3 1999
Dr. Juran (1904-)

Slide 4
10 Powerful Principles. © www.gilb.com 2006 4
Marie’s Learnability Curve
051015202530
Number of estimated remaining
majors defects
1st doc 2nd doc 3rd doc 4th doc 5th doc 6th doc 7th doc
The number of Document Inspections where she got useful feedback about quality and rules.
Feedback reduces INJECTION of engineering specification defects

Slide 5
10 Powerful Principles. © www.gilb.com 2006 5
Defect Prevention Experiences: (CMM5) Most defects can be prevented from getting in
there at all, e v e r! This works by daily feedback from development defects.
% of usual defects prevented
Years of continuous improvement effort
50%
70% 80% 90%
Mays & Jones (IBM) 1990
Mays 1993, User 1996 “72% in 2 years” <-TsG
1 2 3 4 5 6
Cleanroom levels: approach zero def. IBM MN 99.99%+ fixes:Key= “DPP”
North Carolina IBM Research Triangle Park Networking Laboratory

Slide 6
10 Powerful Principles. © www.gilb.com 2006 6
Prevention + Pre-test Detection ���is the most effective and efficient
• Prevention data based on state of the art prevention experiences (IBM RTP), Others (Space Shuttle IBM SJ 1-95) 95%+ (99.99% in Fixes)
• Cumulative Inspection detection data based on state of the art Inspection (in an environment where prevention is also being used, IBM MN, Sema UK, IBM UK)
\
50%
70% 80% 90%
<-Mays & Jones 50% prevented(IBM) 1990
<- Mays 1993, 70% prevented
1 2 3 4 5 6
“Prevented”
70% Detection by Inspection
95% cumulative detection by Inspection (state of the art limit)
Test
“Detected Cheaply”
100% Use

Slide 7
10 Powerful Principles. © www.gilb.com 2006 7
IBM MN & NC DPP Experience.���High quantity feedback leads to real change.
• 2162 DPP Actions implemented (~2,000 Software Engineers) – between Dec. 91 and May 1993 (30 months) <-Steve Kan
• RTP about 182 per year for 200 people. <-Robert Mays 1995 – 1822 suggested ten years (85-94) – 175 test related
• Research Triangle Park (NC, USA) 227 person org <- Mays slides – 130 actions (@ 0.5 work years – 34 causal analysis meetings @ 0.2 work years – 19 action team meetings @ 0.1work years – Kickoff meeting @ 0.1 work years – TOTAL costs 1% of org. resources
• total ROI (Return On Investment) DPP 10:1 to 13:1, • internal ROI 2:1 to 3:1 • Defect Rates at all stages 50% lower with DPP

Slide 8
10 Powerful Principles. © www.gilb.com 2006 8
Fault Density versus Checking Rate: Raytheon 95���Feedback on optimum rates leads to orders of
magnitude better performance
Why do you think they avoid using the optimum rate? Hint: “Our process mandates 100% inspection coverage”
KDSI/Hour
<-“Statistically preferred levels”
Action items
per KDSI 100 to 250
DSI/hour Each point is data for a single
inspection.
It shows the relation between checking speed and ability to find
defects(bugs).
Slowing down has dramatic productivity results.

Slide 9
10 Powerful Principles. © www.gilb.com 2006 9
Effectiveness a function of checking rate (Buck) Feedback on optimum rates enables bug finding effectiveness
60 95 125 160
Checking Ratein Lines per hour
10
20.4
13.8
7
0
5
10
15
20
25
Defectsfound
60 95 125 160
Checking Ratein Lines per hour
Bugs found
of 21 maximum
known
From Frank Buck IBM 1980

Slide 10
10 Powerful Principles. © www.gilb.com 2006
Evo ‘Learning’ model���Project feedback improves requirements and design and process!
System Requirements System
Design Evo Step 1
Evo Step 2
Evo Step n
Evo Step 1. Requirements 2. Step Design 3. Assemble 4. Deliver Step 5. Study Step

Slide 11
10 Powerful Principles. © www.gilb.com 2006
Evo shortens project by feedback at Microsoft
• “It appears that this incremental approach takes longer,
• but it almost never does, because it keeps you in close touch with where things really are”
• Brad Silverberg, Senior VP for Personal Systems Microsoft in CUSUMANO95 (‘Microsoft Secrets’), page 202

Slide 12
10 Powerful Principles. © www.gilb.com 2006
Wednesday Development Team Users
Monday ! System Test and ReleaseVersion N
! Decide What to Do for VersionN+1
! Design Version N+1Tuesday ! Develop Code ! Use Version N and Give
FeedbackWednesday ! Develop Code
! Meet with users to DiscussAction Taken RegardingFeedback From Version N-1
! Meet with developers to DiscussAction Taken RegardingFeedback From Version N–1
Thursday ! Complete Code
Friday ! Test and Build Version N+1! Analyze Feedback From Version
N and Decide What to Do Next
Customer feedback weekly! An example of a typical one-week Evo cycle at the HP
Manufacturing Test Division during a project. [MAY96, HP* Journal Aug 96] * one of my direct customers, TG
See also: MIT Sloan Management Review, Winter 2001, Alan MacCormack, (HBS Professor) “Product Development Practices That Work: How Internet Companies Build Software”, Pages 75-84, Reprint 4226

Slide 13
10 Powerful Principles. © www.gilb.com 2006
Direct Customer Input (MS)
• “Microsoft’s general philosophy has been to ….. focus on evolving features and whole products incrementally, with direct input from customers during the development process.” CUSUMANO95 , 13, Microsoft Secrets

Slide 14
10 Powerful Principles. © www.gilb.com 2006
Harlan Mills on Project Control:���2% deliveries feedback gives full project control!
• “Software Engineering began to emerge in FSD” (IBM Federal Systems Division, from 1996 a part of Lockheed Martin Marietta) “some ten years ago [about 1970] in a continuing evolution that is still underway.
– Ten years ago general management expected the worst from software projects – cost overruns, late deliveries, unreliable and incomplete software.
– Today [1980] , management has learned to expect on-time, within budget, deliveries of high-quality software.
• A Navy helicopter ship system, called LAMPS, provides a recent example. – LAMPS software was a four-year project of over 200 person-years of effort, – developing over three million, and integrating over seven million words of program and data for eight
different processors distributed between a helicopter and a ship, – in 45 incremental deliveries. – Every one of those deliveries was on time and under budget.
• A more extended example can be found in the NASA space program, – where in the past ten years, FSD has managed some 7,000 person-years of software development,
developing and integrating over a hundred million bytes of program and data for ground and space processors in over a dozen projects.
– “There were few late or overrun deliveries in that decade, and none at all in the past four years.” Harlan Mills [IBM Systems Journal No. 4, 1980, p. 415], Reprinted IBM SJ Vol. 38 1999, 289-295

Slide 15
10 Powerful Principles. © www.gilb.com 2006
User Feedback (JPL) • Evo “expects active feedback from the experience gained from one
incremental delivery to the requirements from the next. • As Evo periodically delivers to the users an increment of
capability, the users are able to provide understanding of how effectively that delivery is meeting their needs.
• As the users assess the impact of a delivery on their operations, the system developer is able to work with them to adjust the system requirements to better satisfy their operational needs.
• Evo lets that adjusted set of requirements be the basis for all subsequent incremental deliveries.
• This feedback process is formal and proactive. It is a key element in making Evo effective from a user’s perspective.”
• [SPUCK93] Jet Propulsion Labs

Slide 16
10 Powerful Principles. © www.gilb.com 2006
2. Critical Measurement
• If you do not focus on the few measures critical to your system, then it will fail.
• This principle is supported by the slide detail for several other principles here, so I will not comment in more detail just here. TG

Slide 17
10 Powerful Principles. © www.gilb.com 2006
3. Multiple Objectives • If you cannot control multiple
measures of quality and cost simultaneously, then your system will fail due to the ones you did not control.

Slide 18
10 Powerful Principles. © www.gilb.com 2006
Step #1PlanA:{Design-X,Function-Y}
Step#1Actual
Differe-nce. - isbad+ isgood
TotalStep 1
Step #2Plan B:{DesignZ,DesignF}
Step #2Actual
Step #2Differe-nce
TotalStep1+2
Step #3Nextstepplan
Reliabil-ity99%-99.9%
50%±50%
40% -10% 40% 30%±20%
20% -10% 60% 0%
Perform-ance11sec.-1sec.
80%±40%
40% -40 40 30%±50%
30% 0 70% 30%
Usability 30 min.-30 sec.
10%±20%
12% +2% 12% 20%±15%
5% -15% 17% 83%
CapitalCost 1 mill.
20%±1%
10% +10% 10% 5%±2%
10% -5% 20% 5%
Enginee-ringHours10,000
2%±1%
4% -2% 4% 10%±2.5%
3% +7% 7% 5%
Calend-ar Time
1 week 2weeks
-1week 2weeks
1 week 0.5weeks
+0.5wk
2.5weeks
1 week
Impact Table for Step Management: how to directly control many cost and quality objectives in small evolutionary project steps simultaneously

Slide 19
10 Powerful Principles. © www.gilb.com 2006
4. Evolution • You must evolve in small steps towards
your goals; large step failure kills the entire effort. – And early frequent result delivery is
politically and economically wise. – 2% of total is a small step, you can afford to
fail on
Slide 20
10 Powerful Principles. © www.gilb.com 2006
Tao Te Ching (500BC)
• That which remains quiet, is easy to handle. • That which is not yet developed is easy to manage. • That which is weak is easy to control. • That which is still small is easy to direct. • Deal with little troubles before they become big. • Attend to little problems before they get out of hand. • For the largest tree was once a sprout, • the tallest tower started with the first brick, • and the longest journey started with the first step.
– From Lao Tzu in Bahn, 1980 Penguin book

Slide 21
10 Powerful Principles. © www.gilb.com 2006
Value delivery early
© [email protected] 1999 5
OMAR Case delivery value vs Waterfall (1998)
1 2 3 4 5 6 7 8 9 10 11 12 13 14 15 16 17 18 19 20 21 22Project Month
Project FF Cumulative Delivered FunctionalityProject FF Benefit / CostOMAR Cumulative Delivered FunctionalityOMAR Benefit / Cost
Stuart Woodward: Evolutionary project Management
IEEE Computer Oct 1999, page 49-57 [email protected]

Slide 22
10 Powerful Principles. © www.gilb.com 2006 22
Cost Of Quality= COConformance+CONonconformance CONC= cost of ‘fix and check fix’.
COC=Appraisal + Prevention
Cost for doing it right
Cost for doing it wrong(ly)
1988 1989 1991 1990 1992 1993 1994 1995 0%
5%
10%
15%
20%
25%
30%
35%
40%
45%
50%
Project Cost = {Cost of Quality + Cost of Performance}. Cost of Performance={Planning, Documentation, Specification}.
Philip Crosby concepts
Cost of Quality versus Time: Raytheon 95���The 8 year evolution of rework reduction.

Slide 23
10 Powerful Principles. © www.gilb.com 2006
Multiple Levels of Microsoft Evo:���Ms does Evo daily!
Vital 3rd Vital 3rd
Office 2001 Level
6->10 Weeks 6->10 Weeks
Go to next Graphic
Slide 24
10 Powerful Principles. © www.gilb.com 2006
Early simple proof of concept (Ericsson): Ericsson used Evo to deliver a 15 month project
in 9 months to Japan • “Organic integration [Evo] is a way of getting rid of the myth [that
problems don’t exist] very early on. • You could say that organic integration demands of an organization
that it do the specifications, the system, the design and the verification for one first very small task very quickly.
• It also demands of the organization that it do this right in terms of delivering products correctly.
• If the organization cannot even manage its first simple task in the time agreed, it certainly should question the ability to manage more difficult tasks.
• This process of questioning is very healthy. It may for example prevent the delusions of grandeur so common in nearly all organizations”.
• [Ericsson94], page 26, Jack Järkvik, in the context of building mobile telephone base stations

Slide 25
10 Powerful Principles. © www.gilb.com 2006
5. Quality Control • Quality Control must be done as early as
possible, in planning, to reduce the delays from late defect finding. – Use numeric Exit from development
process • Like “Maximum 0.2 Majors/Page”
– Use Inspection sampling to keep costs down, and to permit early, before completion, action and learning.
August 1999

Slide 26
10 Powerful Principles. © www.gilb.com 2006
10 Top Advanced Inspection Principles
• Pr1. Prevention is more effective than Cure • Pr2. Avoidance is more efficient than removal • Pr3. Feedback teaches effectively • Pr4. Measurement gives facts to control the process • Pr5. Priority to the Profitable • Pr6. Forget perfection, you can’t afford it! • Pr7. Teach fishing, rather than ‘give fish’ • Pr8. Framework for Freedom beats bureaucracy • Pr9. Reality rules • Pr10. Facts beat intuition

Slide 27
10 Powerful Principles. © www.gilb.com 2006 27
The downstream alternative cost of quality ���at a Defence Electronics Factory ���
(all types of documents).
Source: Trevor Reeve, Case Study Chapter in “Software Inspection”
Philips MEL became “Thorn EMI”, then Racal, now Raytheon. Crawley UK.
Mean time to find and correct a Major after Inspection was 9.3 Hours. Number of
defects of the 1,000 sampled Majors
0 10 30 50 70 Estimated hours to find and correct
in test or in field. Range 1 to 80 hours
It cost about 1 hour to find and fix a Major using Inspection

Slide 28
10 Powerful Principles. © www.gilb.com 2006
Advanced Inspection Objectives • Central Objectives
– 1. Engineering Process Control – 2. Measuring Document Quality – 3. Reduce Project Time & Cost
• Secondary Objectives – 4. Identify and Remove Major Defects – 5. Reduce Service/Maintenance Costs
• NOT Objectives – Approve document ‘content’ – Remove minor defects – ‘Improve’ Quality

Slide 29
10 Powerful Principles. © www.gilb.com 2006 29
Larger set of Inspection Objectives 1. Time-to-Delivery 2. Measurement
•document quality •doc. process quality •inspection value/cost
3. Release “downstream” 4. Identify defects 5. Fix defects
avoid new defect injection 6. Improve process
product producers inspection itself
7. On-the-job training
8. Motivation 9. Help Author 10. Effectiveness (Quality) 11. Efficiency (Productivity) 12. Train Inspection team leader 13. Certify the leader 14. Motivate Managers 15. Reduce Maintenance Costs 16. Relieve Project Leader. 17.many others

Slide 30
10 Powerful Principles. © www.gilb.com 2006
6. Motivation
• The ‘best methods’ work only when people are motivated – ‘Drive out fear’ (Deming)

Slide 31
10 Powerful Principles. © www.gilb.com 2006
Motivation ‘is Everything!’ • People are ‘sensitive’ • Avoid all ‘threats’ • Give ‘positive’ motivators • Very many ‘details’
support this attitude • You will respect this, or
fail! • Do unto others, as you
would have them do with your work!

Slide 32
10 Powerful Principles. © www.gilb.com 2006
Positive Motivators ���in our Inspection version
• Group-work • Team • Freedom • Learning • Game • Experiments • Challenge • Numeric Feedback • Process Improvement • Positive Leadership • Sampling

Slide 33
10 Powerful Principles. © www.gilb.com 2006
Potentially Negative Motivators ���in bad Inspection practice
• Time Pressure • Result Pressure • Personal Attacks • Bureaucracy • Small-minded Leader • Personal-fault blaming • Process corruption • High volume/cleanup

Slide 34
10 Powerful Principles. © www.gilb.com 2006
Motivational Philosophy • Intelligent Inspection • Maximum Leverage • Process causes Defects • Trust people • Empower people • Allow experiment • Let results decide • Continuously improve
Slide 35
10 Powerful Principles. © www.gilb.com 2006
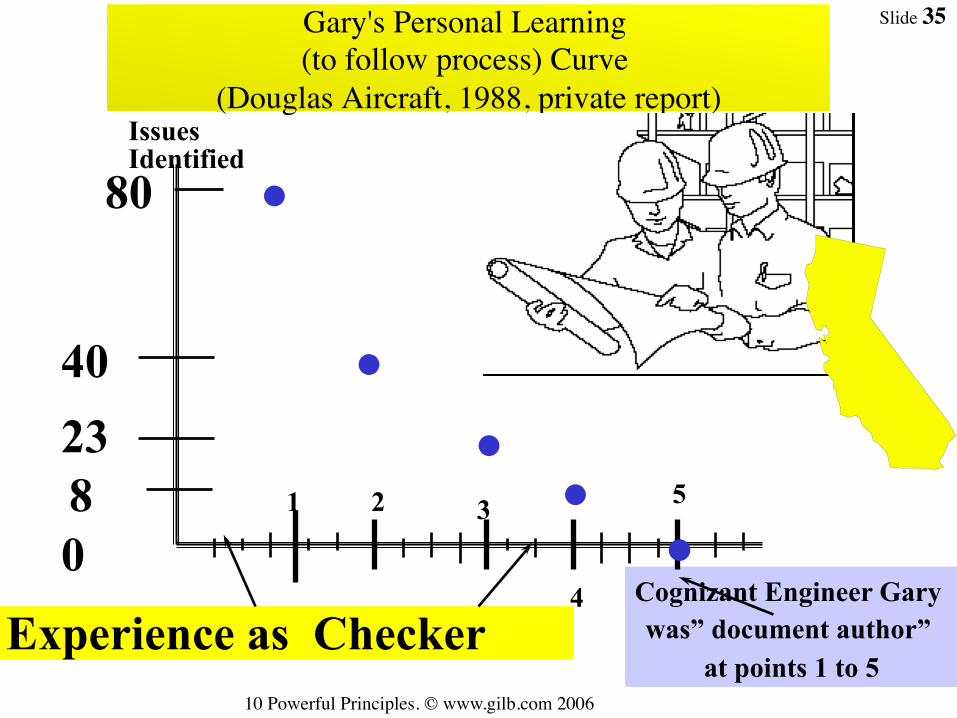
Gary's Personal Learning ���(to follow process) Curve ���
(Douglas Aircraft, 1988, private report)
4 Cognizant Engineer Gary was” document author”
at points 1 to 5 Experience as Checker
• 0 1 2 3 5
80
40 23 8
•
• • •
Issues Identified
•
Slide 36
10 Powerful Principles. © www.gilb.com 2006
THE BUSINESS IMPACT OF REACHING ���
CMU/SEI LEVEL 5 Roger G. Fordham���
Ex Managing Director������
“The Senate”, No. 33A, Ulsoor Road ���Bangalore-560 042, India���
Ph: +91-80-559-8866; Fx: +91-80-559-8843 Visited by Gilb March 2000���
Slides July 1996 Given Gilb by Fordham 1999
Motorola India Electronics Ltd.

Slide 37
10 Powerful Principles. © www.gilb.com 2006
MIEL ~ THE EXPERIMENT
GOAL
Org Structure Training
Reinforcement
Communication Rewards & Recognition
Continuous improvement
ORGANIZATIONAL VALUE SYSTEM & MANAGEMENT COMMITMENT
Motorola India Electronics Ltd.

Slide 38
10 Powerful Principles. © www.gilb.com 2006
CONCLUSION • Benefits of a well-controlled process in terms of
quality, productivity and cycle time are very apparent.
• Developing software across an ocean can be done in no other better way.
• Process maturity provides a sense of self-esteem for individuals.
• Process ownership has to lie with the decision makers.
• Complete commitment, cooperation & participation from all levels of management required.
Motorola India Electronics Ltd.
Slide 39
10 Powerful Principles. © www.gilb.com 2006
• Process maturity requires an open & mature culture.
• Fear of making / admitting failures should not exist, however all failures should provide lessons learnt & same mistakes should not be repeated.
• Involvement wears out resistance. • Empowerment is key to process maturity. It must
be tempered with explicit bounds on what employees can & cannot address.
• Long term cost benefit orientation will help in directing organizational change.
CONCLUSION(2) Motorola India Electronics Ltd.
Slide 40
10 Powerful Principles. © www.gilb.com 2006
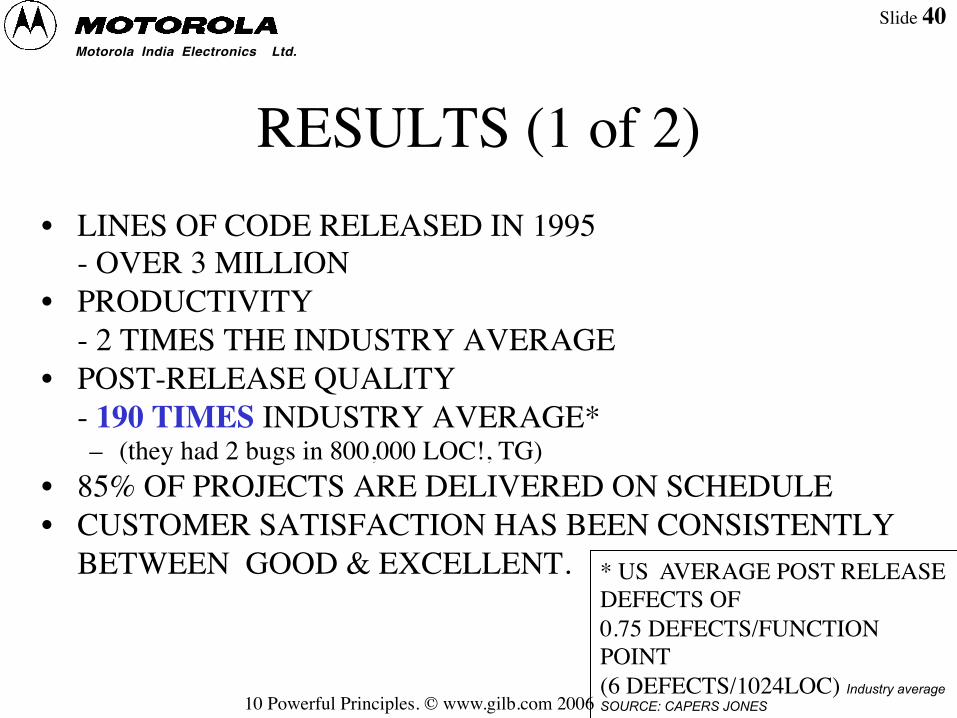
RESULTS (1 of 2) • LINES OF CODE RELEASED IN 1995 ���
- OVER 3 MILLION • PRODUCTIVITY ���
- 2 TIMES THE INDUSTRY AVERAGE • POST-RELEASE QUALITY ���
- 190 TIMES INDUSTRY AVERAGE* – (they had 2 bugs in 800,000 LOC!, TG)
• 85% OF PROJECTS ARE DELIVERED ON SCHEDULE • CUSTOMER SATISFACTION HAS BEEN CONSISTENTLY
BETWEEN GOOD & EXCELLENT.
Motorola India Electronics Ltd.
* US AVERAGE POST RELEASE DEFECTS OF ���0.75 DEFECTS/FUNCTION POINT ���(6 DEFECTS/1024LOC) Industry average SOURCE: CAPERS JONES

Slide 41
10 Powerful Principles. © www.gilb.com 2006
RESULTS (2) • BUILT BASELINES OF PRODUCTIVITY & DEFECT
DENSITY FOR ELEVEN CATEGORIES OF PROJECTS.
• HAVE ACHIEVED BETTER THAN 20% ACCURACY FOR DEFECT PROJECTIONS 50% OF THE TIME
• BUILT SUFFICIENT HISTORICAL DATA FOR A BETTER REFINEMENT OF THE REGRESSION MODEL.
• BUSINESS HAS GROWN 300% IN THE LAST 5 YEARS.

Slide 42
10 Powerful Principles. © www.gilb.com 2006
7. Process Improvement
• Eternal Process improvement is necessary as long as you are in competition – Paraphrasing Deming about PDSA cycle end.

Slide 43
10 Powerful Principles. © www.gilb.com 2006

Slide 44
10 Powerful Principles. © www.gilb.com 2006
Process Brainstorming The Road To Wisdom : Piet Hein
"The road to wisdom
is plain and simple to express,
to err, and err, and err again,
but,
less, and less, and less."
Piet Hein, (Danish Philosopher

Slide 45
10 Powerful Principles. © www.gilb.com 2006
Process Brainstorming The PB Process
• Team Stays together after ‘Logging’ – Same room – Same people – Maybe a break first – Same documents – Up to half an hour
• Shift mentality! – Not the project – The process, our organization – How we feel it can be improved
for us – So we are not ‘forced’ to make
mistakes
Quick Break from Logging
Leader Picks a real Sample Major Issue from Log, tells Team (1 min)
Team Brainstorms ‘Root Cause’ (1 min)
Team Brainstorms ‘Cause Cure’ (1 min)

Slide 46
10 Powerful Principles. © www.gilb.com 2006
The P.B. Log
• Brainstorming Rules: no criticism, flow ideas in • Getting ‘Grass Roots’ opinions, investigation
later
Item Issue Classify Root Causes ImprovementSuggestions
1 10 Oversight • Time pressure• no tools• no info
• optimum time• build tool• give info on PC
2 8 Education • trainees don’tknow• manual notupdated
• special meetingfor trainees• manual on Web
3 3 Commun-ication
• authors areunknown
• publish theiremail on doc. head
Process Brainstorming

Slide 47
10 Powerful Principles. © www.gilb.com 2006
Defect Prevention Process within ‘Inspection’
Inspection Process
Quality Assurance Database
Field Operation Fault Data
Product Testing & Fixing
Fault Data
Select Improvement Target (Pareto analysis)
Delegate Analysis and Design of Improvement to ‘Process Investigators’
Evaluate Effect of Trial Improvements on real project
Spread Improvements with your organization
PROCESS CHANGE MANAGEMENT TEAM
See ‘Software Inspection’ Chapters 7 and 17 for detail.
Process Brainstorming
PROCESS INVESTIGATORS

Slide 48
10 Powerful Principles. © www.gilb.com 2006
• Brainstormed suggestions – Are input to Process
Improvement Teams. – Are part of the inputs
• & cost of defect data • & frequency of defect.
– PB Insights are • Accurate • Decentralized • Real time • Socially acceptable • Proven (Mays) to work better
than centralized efforts (Fagan’s Method 1973)
Process Brainstorming The Process Brainstorming Aftermath
Item Issue Classify Root Causes ImprovementSuggestions
1 10 Oversight • Time pressure• no tools• no info
• optimum time• build tool• give info on PC
2 8 Education • trainees don’tknow• manual notupdated
• special meetingfor trainees• manual on Web
3 3 Commun-ication
• authors areunknown
• publish theiremail on doc. head
Quality Assurance Database

Slide 49
10 Powerful Principles. © www.gilb.com 2006
8. Persistence
• Years of persistence are necessary to change a culture.
• W. Edwards Deming – It takes 2-3 years to change a project, and a
generation to change a culture • Piet Hein (Denmark)
– Things Take Time (TTT)

Slide 50
10 Powerful Principles. © www.gilb.com 2006
���Secrets of Software Quality
Software Quality Week Craig Kaplan, Ph.D.
[email protected] I.Q. Company
http:\\www.iqco.com
1
Slide 51
10 Powerful Principles. © www.gilb.com 2006
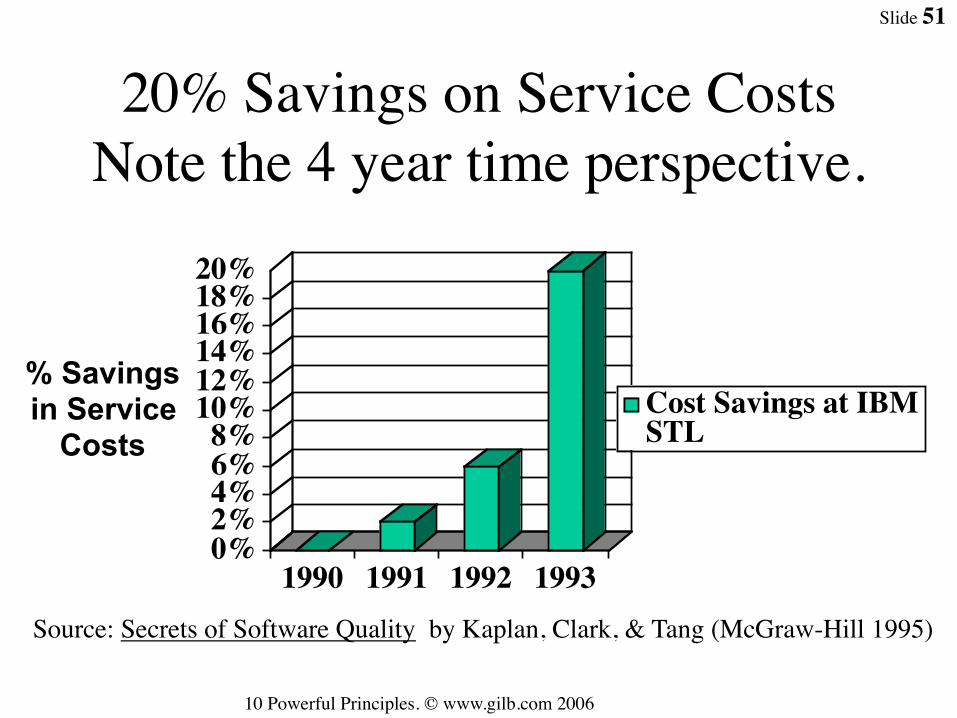
20% Savings on Service Costs ���Note the 4 year time perspective.
0%2%4%6%8%
10%12%14%16%18%20%
% Savings in Service
Costs
1990 1991 1992 1993
Cost Savings at IBMSTL
Source: Secrets of Software Quality by Kaplan, Clark, & Tang (McGraw-Hill 1995)

Slide 52
10 Powerful Principles. © www.gilb.com 2006
56% Increase in ���Revenue per Employee
0%
20%
40%
60%
80%
100%
120%
140%
160%
% 1989 Baseline
1989 1990 1991 1992
Revenue per Employee atIBM STL
Source: Secrets of Software Quality by Kaplan, Clark, & Tang (McGraw-Hill 1995)

Slide 53
10 Powerful Principles. © www.gilb.com 2006
14% Improvement in��� Customer Satisfaction
85%90%95%
100%105%110%115%
% of 1991 Baseline
1991 1992 1993
IBM STLCompetitors
Source: Secrets of Software Quality by Kaplan, Clark, & Tang (McGraw-Hill 1995)

Slide 54
10 Powerful Principles. © www.gilb.com 2006
46% Reduction in Field Defects
0%10%20%30%40%50%60%70%80%90%
100%
% of 1989 Baseline
1989 1991 1993
Defects at IBMSTL
Source: Secrets of Software Quality by Kaplan, Clark, & Tang (McGraw-Hill 1995)

Slide 55
10 Powerful Principles. © www.gilb.com 2006
Raytheon 95 Software Productivity 2.7X better. Note the 5 years to peak time perspective.
+
170%
Productivity
1988 1994

Slide 56
Wednesday, 12 February 14 10 Powerful Principles. © www.gilb.com 2006 56
Achieving Project Predictability: Raytheon 95:���This miracle took almost 2 years
140%
100%
1988 1994 1990
Cost At Completion / Budget %

Slide 57
10 Powerful Principles. © www.gilb.com 2006
Overall Product Quality: Raytheon 95���Defect Density Versus Time: 3 times better.���
This took about 4 years.
Source:http://www.sei.cmu.edu/products/publications/95.reports/95.tr.017.html
17 defects per 1000 source instructions

Slide 58
10 Powerful Principles. © www.gilb.com 2006
9. Multiple Impacts
• Any method you choose will have multiple quality and cost impacts, whether you like them or not! – We need to estimate all impacts on our
objectives – We need to reduce or accept negative impacts – We must avoid simplistic one-dimensional
arguments

Slide 59
10 Powerful Principles. © www.gilb.com 2006
Next-Step Candidate A:{Design-X, Function-Y}
Next-Step Candidate B:{Design Z, Design F}
Reliability 99%-99.9%
50% 100%
Performance 11sec.-1sec.
80% 30%
Usability 30 min.-30sec.
-10% 20%
Capital Cost 1 mill. 20% 5%Engineering Hours10,000
2% 10%
Performance/CapitalCost Ratio
80/20= 4.0 30/5= 6.0
Quality/Cost Ratio 120/22=5.46 150/15=10.00
Single next Step Comparison Table���Evaluating multiple impact to decide which step to deliver first.
For written details of Impact Estimation method: see Competitive Engineering, free at www.result-planning.org and available from Addison Wesley

Slide 60
10 Powerful Principles. © www.gilb.com 2006
Step Candidate A:{Design-X, Function-Y}
Step Candidate B:{Design Z, Design F}
Reliability99%-99.9%
50% ±50% 100% ±20%
Performance11sec.-1 sec.
80% ±40% 30% ±50%
Usability30 min.-30 sec.
-10% ±20% 20% ±15%
Capital Cost1 mill.
20% ±1% 5% ±2%
Engineering Hours10,000
2% ±1% 10% ±2.5%
Worst Case B/Cratio
(1 to 3)
(0+40-30)/(21+3) =0.42 (80-20+5)/(7+12.5) =3.33
Best Case B/Cratio
(100+120+10)/(19+1) = 11.5 (120+80+35)/(3+7.5)= 22.38
Risk Analysis for each Step���Which is ‘best’ when risk is considered, on multiple
qualities and costs?

Slide 61
10 Powerful Principles. © www.gilb.com 2006
Step Candidate A:{Design-X, Function-Y}
Step Candidate B:{Design Z, Design F}
Reliability 99%-99.9% 50% ±50% 100% ±20%Performance 11sec.-1sec.
80% ±40% 30% ±50%
Usability 30 min.-30sec.
-10% ±20% 20% ±15%
Capital Cost 1 mill. 20% ±1% 5% ±2%Engineering Hours10,000
2% ±1% 10% ±2.5%
Worst Case B/C ratio (0+40-30)/(21+3) =0.42 (80-20+5)/(7+12.5) =3.33
“Worst Worst” caseconsidering estimatecredibility factor
0.8 x 0.42= 0.33 0.2 x 3.33= 0.67
A’s Credibility=0.8
(High)
B’s Credibility=0.2
(Low)
Step Choice with ‘Credibility’���Evaluating multiple impacts with respect to experience spread and evidence credibility.

Slide 62
10 Powerful Principles. © www.gilb.com 2006
10. Results Orientation
• You must keep your focus on the essential results, and never fall victim to the means.
• “Perfection of means and confusion of ends seem to characterize our age” – Albert Einstein.

Slide 63
10 Powerful Principles. © www.gilb.com 2006 1
Software Engineering Productivity Study
l An example of setting objectives for process improvement
l For 1997 Multinational Electronics Company with 70% software labor development content in products
l Copyright Tom Gilb, [email protected], 1997-2000

Slide 64
10 Powerful Principles. © www.gilb.com 2006 4
Levels of objectives. – 1. Fundamental Objectives (above us) – 2. Generic Constraints (our given framework)
• Political Practical • Design Strategy Formulation Constraints • Quality of Organization Constraints • Cost/Time/Resource Constraints
– 3. Strategic Objectives (objectives at our level) – 4. Means Objectives: (supporting our objectives)

Slide 65
10 Powerful Principles. © www.gilb.com 2006 5
Strategic Objectives – Support the Fundamental Objectives
(Profit, survival) • Software Productivity: Lines of Code
Generation Ability • Lead-Time: • Predictability. • TTMP: Predictability of Time To Market: • Product Attributes: • Customer Satisfaction: • Profitability:

Slide 66
10 Powerful Principles. © www.gilb.com 2006 11
Predictability of Time To Market:���A sample strategic objective
• TTMP: Predictability of Time To Market: » Gist: From Ideas created to customers can use it. Our ability to meet agreed
specified customer and self-determined targets.
• Scale: % overrun of actual Project Time compared to planned Project Time
– Project Time: Defined: time from the date of Toll-Gate 0 passed, or other Defined Start Event,���to, the Planned- or Actually- delivered Date of All [Specified Requirements], and any set of agreed requirements.
– Specified Requirements: Defined: written approved Quality requirements for products with respect to Planned levels and qualifiers [when, where, conditions].���And, other requirements such as function, constraints and costs.
• Meter: Productivity Project or Process Owner will collect data from all projects, or make estimates and put them in the Productivity Database for reporting this number.
• Past [1994, A-package] < 50% to 100%> <- Palli K. guess.���[1994, B-package] 80% ?? <- Urban Fagerstedt and Palli K. guess
• Record [IBM Federal Systems Division, 1976-80] 0% ���<- RDM 9.0 quoting Harlan Mills in IBM SJ 4-80
• “all projects on time and under budget” • [Raytheon Defense Electronics, 1992-5] 0% <- RDE SEI Report 1995
Predictability. • Must [All future projects, from 1999] 5% or less <- discussion level TG • Plan [All future projects, from 1999] 0% or less <- discussion level TG

Slide 67
10 Powerful Principles. © www.gilb.com 2006 6
Means Objectives:
– Support the Strategic Objectives • Complaints: • Feature Production: • Rework Costs: • Installation Ability: • Service Costs: • Training Costs: • Specification Defectiveness: • Specification Quality: • Improvement ROI:

Slide 68
10 Powerful Principles. © www.gilb.com 2006 17
Complaints:���a sample ‘means’ objective
– Complaints: • "Customer complaint rate to us"
– Gist: • Means Goal: for Customer Satisfaction (Strategic).
– Scale: number of complaints per customer in [defined time into <operation>]
– Past [Syracuse Project , 1997] ?? <bad> <- ML – Plan [Long term, software component, in first 6
months in Operation] zero complaints <- R PROJECT 96 1.1 b
– "zero complaints on software features"

Slide 69
10 Powerful Principles. © www.gilb.com 2006 7
Strategies ���Intended to impact strategic objectives
– (means to achieve objectives) – Evo [Product development]:(serious) – DPP [Product Development Process]:
Defect Prevention Process. – Inspection? – Motivation.Stress-Management-AOL – Motivation.Carrot – DBS – Automated Code Generation – Requirement -Tracability – Competence Management – Delete-Unnecessary -Documents – Manager Reward:? – Team Ownership:? – Manager Ownership:?
• Training:? • Clear Common Objectives: • Application Engineering area: • Brainstormed List (not
evaluated or prioritized yet)? • Requirements Engineering: • Brainstormed Suggestions? • Engineering Planning: • Process Best Practices: (silly) • Brainstormed Suggestions? • Push Button Deployment: • Architecture Best Practices: • Stabilization: • World-wide Co-operation?
A mixture of silly and serious strategies! 2 examples given.
Slide 70
10 Powerful Principles. © www.gilb.com 2006
US Army Example: PERSINSCOM STRATEGIES !
OBJECTIVES
TechnologyInvestment
BusinessPractices
People Empow-erment
Principlesof IMAManagement
BusinessProcessRe-engineering
SUM
Customer Service?!0 Violation of agreement
50% 10% 5% 5% 5% 60% 185%
Availability90% ! 99.5% Up time
50% 5% 5-10% 0 0 200% 265%
Usability200 ! 60 Requests byUsers
50% 5-10% 5-10% 50% 0 10% 130%
Responsiveness70% ! ECP’s on time
50% 10% 90% 25% 5% 50% 180%
Productivity3:1 Return on Investment
45% 60% 10% 35% 100% 53% 303%
Morale72 ! 60 per mo. SickLeave
50% 5% 75% 45% 15% 61% 251%
Data Integrity88% ! 97% Data Error %
42% 10% 25% 5% 70% 25% 177%
Technology Adaptability75% Adapt Technology
5% 30% 5% 60% 0 60% 160%
Requirement Adaptability? ! 2.6% Adapt to Change
80% 20% 60% 75% 20% 5% 260%
Resource Adaptability2.1M ! ? ResourceChange
10% 80% 5% 50% 50% 75% 270%
Cost ReductionFADS ! 30% TotalFunding
50% 40% 10% 40% 50% 50% 240%
SUM IMPACT FOREACH SOLUTION
482% 280% 305% 390% 315% 649%
Money % of total budget 15% 4% 3% 4% 6% 4%Time % total workmonths/year
15% 15% 20% 10% 20% 18%
SUM RESOURCES 30 19 23 14 26 22BENEFIT/RESOURCES
RATIO16:1 14:7 13:3 27:9 12:1 29:5

Slide 71
10 Powerful Principles. © www.gilb.com 2006
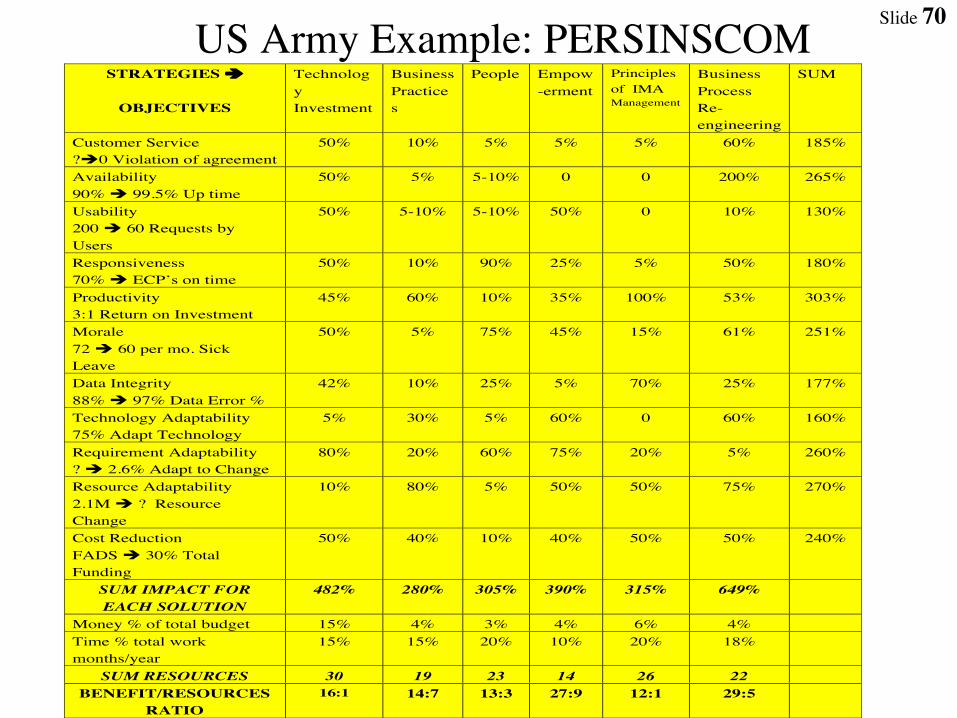
Sample of Objectives/Strategy definitions
Example of a real Impact Estimation table from a Pro-Bono Client (US DoD, US Army, PERSINSCOM).Thanks to the Task Force, LTC Dan Knight and Br. Gen. Jack Pallici for full support in using my methods.
Source: Draft, Personnel Enterprise, IMA End-State 95 Plan, Vision 21, 2 Dec. 1991. “Not procurement sensitive”.
Example of one of the Objectives:
Customer Service:Gist: Improve customer perception of quality of service provided.Scale: Violations of Customer Agreement per Month.Meter: Log of Violations.Past [1991] Unknown Number !State of PERSCOM Management ReviewRecord [NARDAC] 0 ? ! NARDAC Reports 1991Must : <better than Past, Unknown number> !CGPlan [1991, PERSINCOM] 0 “Go for the Record” ! Group SWAG
Technology Investment:Exploit investment in high return technology. Impacts: productivity, customer service and conserves resources.
An example of one of the strategies defined.
• Example of one of the Objectives: Customer Service: Gist: Improve customer perception of quality of service provided. Scale: Violations of Customer Agreement per Month. Meter: Log of Violations. Past [1991] Unknown Number çState of PERSCOM Management Review Record [NARDAC] 0 ? ç NARDAC Reports 1991 Must : <better than Past, Unknown number> çCG Plan [1991, PERSINCOM] 0 “Go for the Record” ç Group SWAG
Technology Investment: Exploit investment in high return technology. Impacts: productivity, customer service and conserves resources.
• An example of one of the strategies defined.
Slide 72
10 Powerful Principles. © www.gilb.com 2006
The summary principle Motivate people
towards real results by giving them numeric feedback
frequently and the ability to change anything
for success.

Slide 73
10 Powerful Principles. © www.gilb.com 2006
SOFTWARE POLICY • (suggestion, draft)
• Version
• OWNER:
• Editor: [email protected]. Detailed practical technical
background for this draft see www.Gilb.com and especially ‘Priority Management’ (116 pages manuscript).

Slide 74
10 Powerful Principles. © www.gilb.com 2006
Purpose:
• to define a powerful framework – for improving your organization’s ability – to improve their software organization’s
capability, – as defined in their quantified objectives.
• Constraint:
– this policy should never exceed one physical page, to keep it focussed.

Slide 75
10 Powerful Principles. © www.gilb.com 2006
.STAKEHOLDER VALUE: • For all software and systems engineering projects
– we will formally identify all critical stakeholders, internal and external.
– We will identify their critical and profitably-served requirements. – The requirements will be testable and, if variable,
• they will be quantified. – Delivering this defined value to these stakeholders
• will be the primary focus and measure • of all product development process activity.
• Rationale: to focus our efforts on critical needs, listen to ‘voice of stakeholders’.

Slide 76
10 Powerful Principles. © www.gilb.com 2006
.ENDS/MEANS CLARITY: • project requirements will focus on the real ‘stakeholder-
perceived value’ as the ‘requirements’. – They will NOT allow design or strategy to replace the real
stakeholder needs. – Requirements and design to meet those requirements will be
rigorously separated • in terms of project specification and work processes.
• Rationale: – extreme clarity of real needs, – never confusing this with technology with good intent. – Help engineers to focus efforts on serving and competing on the
market.

Slide 77
10 Powerful Principles. © www.gilb.com 2006
.NUMERIC CLARITY: • all notions of qualities (stakeholder values) and costs will
– in all contexts (requirements, design impacts, project progress, contracts with customers and suppliers)
– be expressed in terms of numeric levels on defined scales of measure, – and measured in practice with defined ‘Meters’. – If it varies, if you can say ‘improved’,
• then you must convert these ideas into numbers • on defined scales of measure, • which become the language of the project.
• Rationale: – we must have perfect clarity of the stakeholder-critical values, – and numeric definition is the ONLY acceptable way to do that. – This is necessary for multinational communication. – This saves time to market, human resource and will more effectively target our
stakeholder values. – It allows feedback and correction processes to operate.

Slide 78
10 Powerful Principles. © www.gilb.com 2006
.NUMERIC DEVELOPMENT PROGRESS:
• the primary instrument for tracking development progress will be – the numeric progress for defined stakeholder values (product and service
qualities) • towards defined and agreed targets, • with respect to time.
– A secondary set of measures will be with respect to the costs or resources planned.
• Rationale: – this management tracking concept is intended to allow projects to monitor
their own progress realistically, – using the same measures which any other level of managers would use to
judge them. – It is intended to be the main component for discussion and evaluation for any
meeting, review, milestone or judgement. – It should replace conventional milestone progress reporting.
Slide 79
10 Powerful Principles. © www.gilb.com 2006
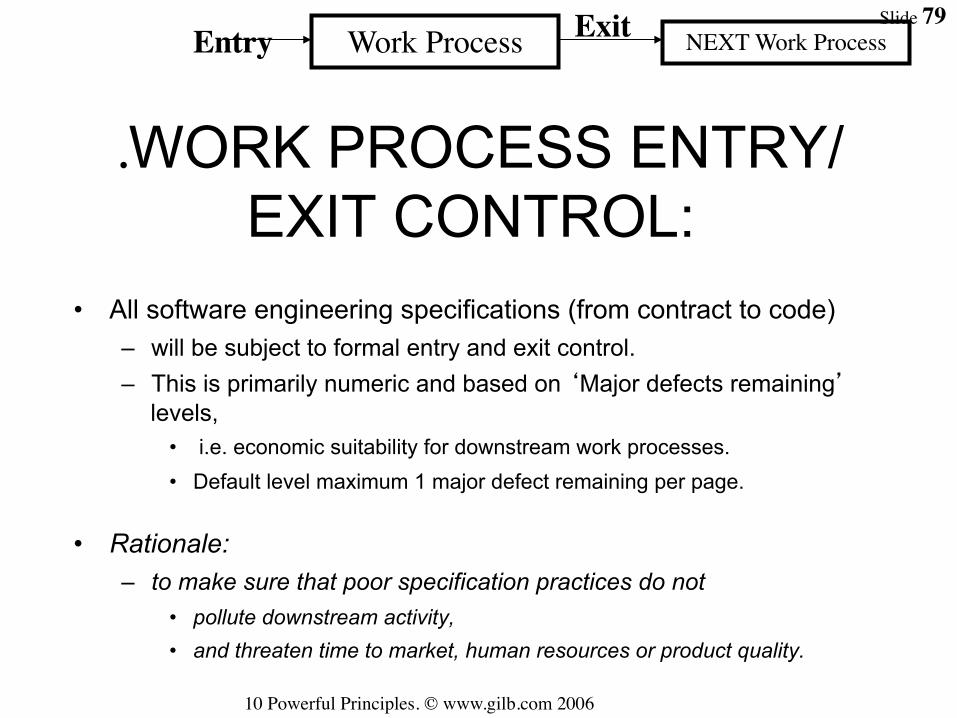
.WORK PROCESS ENTRY/EXIT CONTROL:
• All software engineering specifications (from contract to code) – will be subject to formal entry and exit control. – This is primarily numeric and based on ‘Major defects remaining’
levels, • i.e. economic suitability for downstream work processes. • Default level maximum 1 major defect remaining per page.
• Rationale: – to make sure that poor specification practices do not
• pollute downstream activity, • and threaten time to market, human resources or product quality.
Work Process NEXT Work Process Exit Entry

Slide 80
10 Powerful Principles. © www.gilb.com 2006
Thank you for inviting me here.���Happy to discuss with you the rest of the
conference and by email • By Tom Gilb, Result Planning Limited
• [email protected], www.Gilb.com