slm pcabsroadshowfinalforposting1
Post on 19-Oct-2014
569 views
DESCRIPTION
TRANSCRIPT

SLM Corporation
Private Credit ABS Investor Presentation
September 2008
September 2008 2
This Presentation contains forward-looking statements and information based on management’s current expectations as of the date of this presentation. Statements that are not historical facts, including statements about our beliefs or expectations and statements that assume or are dependent upon future events, are forward-looking statements. Forward-looking statements are subject to risks, uncertainties, assumptions and other factors that may cause actual results to be materially different from those reflected in such forward-looking statements. These factors include, among others, the occurrence of any event, change or other circumstances that could give rise to our ability to cost-effectively refinance asset-backed financing facilities, due February 2009, which closed in the first quarter of 2008 (collectively, the “2008 Asset-Backed Financing Facilities”), including any potential foreclosure on the student loans under those facilities following their termination; increased financing costs; limited liquidity; any adverse outcomes in any significant litigation to which we are a party; our derivative counterparties terminating their positions with the Company if permitted by their contracts and the Company substantially incurring additional costs to replace any terminated positions; changes in the terms of student loans and the educational credit marketplace (including changes resulting from new laws and regulations and from the implementation of applicable laws and regulations) which, among other things, may reduce the volume, average term and yields on student loans under the Federal Family Education Loan Program (“FFELP”), may result in loans being originated or refinanced under non-FFELP programs, or may affect the terms upon which banks and others agree to sell FFELP loans to the Company. The Company could also be affected by: changes in the demand for educational financing or in financing preferences of lenders, educational institutions, students and their families; incorrect estimates or assumptions by management in connection with the preparation of our consolidated financial statements; changes in the composition of our Managed FFELP and Private Education Loanportfolios; changes in the general interest rate environment and in the securitization markets for education loans, which may increase the costs or limit the availability of financings necessary to initiate, purchase or carry education loans; changes in projections of losses from loan defaults; changes in general economic conditions; changes in prepayment rates and credit spreads; and changes in the demand for debt management services and new laws or changes in existing laws that govern debt management services. All forward-looking statements contained in the Presentation are qualified by these cautionary statements and are made only as of the date this Presentation is filed. The Company does not undertake any obligation to update or revise these forward-looking statements to conform the statement to actual results orchanges in the Company’s expectations.
Forward-Looking Statements
September 2008 3
Non-GAAP Financial Measures - The following presentation includes non-GAAP performance measures. A presentation of the most comparable GAAP financial measures and a reconciliation of the non-GAAP performance measures to the most directly comparable GAAP financial measures are included in our most recent quarterly earnings release, quarterly report on Form 10-Q, and annual report on Form 10-K, which are available on our website at (http://www.salliemae.com/about/investors/stockholderinfo/earningsinfo) and (http://www.salliemae.com/about/investors/stockholderinfo/secfilings) and on the SEC’s website (http://www.sec.gov).
U.S. Government Guaranteed Student Loans – The following presentation contains references to U.S. Government guaranteed student loans. All such references are to loans made in compliance with the Federal Family Education Loan Program (“FFELP”), under Title IV of the Higher Education Act, to finance educational costs. As more fully described in our most recent quarterly earnings release, quarterly report on Form 10-Q, and annual report on Form 10-K, available on our website at (http://www.salliemae.com/about/investors/stockholderinfo/earningsinfo) and (http://www.salliemae.com/about/investors/stockholderinfo) and on the SEC’s website (http://www.sec.gov), the federal guarantee of FFELP loans is conditioned on loans being originated, disbursed and serviced in accordance with Department of Education regulations. In addition, unless a loan default results from the borrower’s death, disability or bankruptcy, the federal government guarantees only 97 percent of the principal balance (95 percent on loans disbursed after October 1, 2012) plus accrued interest and the holder of the loan generally must absorb the three percent (five percent after October 1, 2012) not guaranteed as a loss on the loan (“Risk Sharing”).
Additional Information - The following presentation contains certain information about the Company that management believes is important to investors, but should be read in conjunction with other material information about the Company, including, but not limited to, the operational, market and interest rate, political and regulatory, liquidity, credit, and refinancing risks that the Company faces. For a discussion of the risks described above as well as additional information about the Company you should refer to our most recent quarterly earnings release, quarterly report on Form 10-Q, and annual report on Form 10-K, available on our website at (http://www.salliemae.com/about/investors/stockholderinfo/earningsinfo) and (http://www.salliemae.com/about/investors/stockholderinfo/secfilings) and on the SEC’s website (http://www.sec.gov). For a discussion of the specific characteristics of any specific security, you should refer to the pricing supplement, prospectus supplement and/or prospectus applicable to that security.
Disclosures
September 2008 4
Page
II. SLM Private Credit Student Loan ABS 10
V Cumulative Loss Expectations 28
VI. Performance Drivers 33
Appendix
B. SLM Private Credit Trust Analytics 42
C. SLM Private Credit Managed Portfolio Performance 51
III. SLM Private Credit ABS Relative Value 15
VII. Reason to Invest in SLM Private Credit ABS 37
A. SLM Private Credit Trust Characteristics 40
I. Introduction and Overview 5
IV. SLM Private Credit Student Loan Program 21
D. SLM Corporation 60
Contents
September 2008 5
I. Introduction and Overview
September 2008 6
Introduction and Overview
• Leading originator, servicer and collector of student loans, with a 35% market share of all FFELP and private education loan servicing (1)
• More than 10 million customers, relationships with over 6,000 schools
• Profitable despite current credit environment
• Among largest issuers of ABS globally
• Strong, consistent loan performance
• Unprofitable programs eliminated and new loans repriced
• Credit underwriting and collection efforts intensified
• 12 SLM Private Credit ABS issues since 2002, totaling $18.6 billion, all performing well
• Attractive relative value to comparable ABS asset types
SLM Corporation
SLM Private Credit
(1) Based on Student Loan Servicing Alliance Servicing Survey for academic year 2007.
September 2008 7
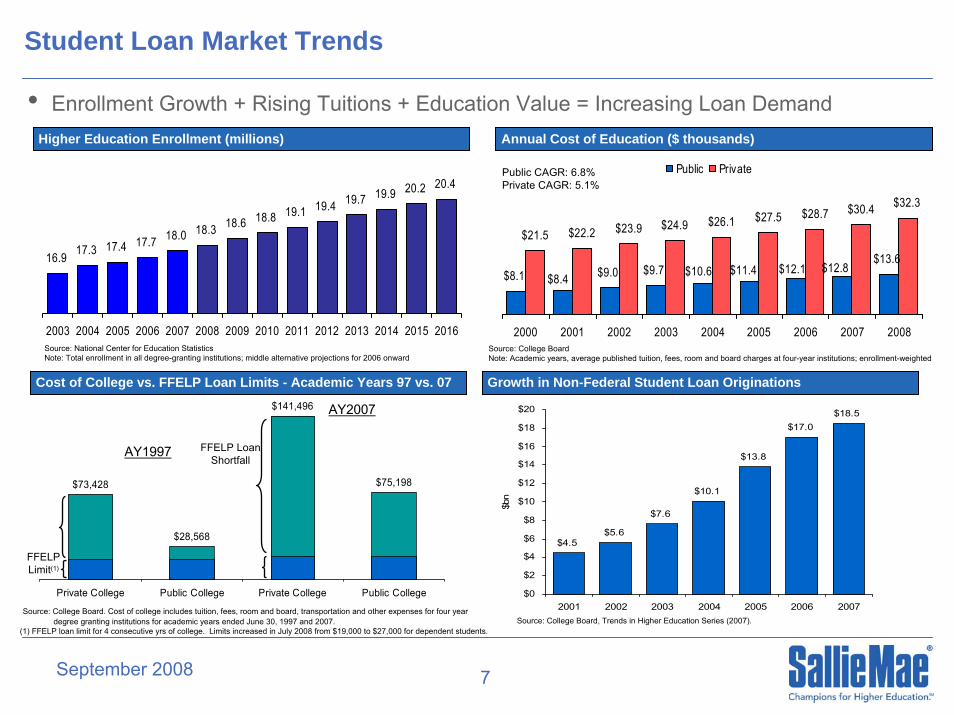
16.9 17.3 17.4 17.7 18.0 18.3 18.6 18.8 19.1 19.4 19.7 19.9 20.2 20.4
2003 2004 2005 2006 2007 2008 2009 2010 2011 2012 2013 2014 2015 2016
Higher Education Enrollment (millions)Higher Education Enrollment (millions)
Source: National Center for Education StatisticsNote: Total enrollment in all degree-granting institutions; middle alternative projections for 2006 onward
Annual Cost of Education ($ thousands)Annual Cost of Education ($ thousands)
Source: College BoardNote: Academic years, average published tuition, fees, room and board charges at four-year institutions; enrollment-weighted
$8.1 $9.0 $9.7$13.6
$21.5 $22.2 $23.9 $24.9 $26.1 $27.5 $28.7 $30.4 $32.3
$8.4$12.8$12.1$11.4$10.6
2000 2001 2002 2003 2004 2005 2006 2007 2008
Public PrivatePublic CAGR: 6.8% Private CAGR: 5.1%
• Enrollment Growth + Rising Tuitions + Education Value = Increasing Loan Demand
Student Loan Market Trends
$75,198$73,428
$28,568
$141,496
Private College Public College Private College Public College
Cost of College vs. FFELP Loan Limits - Academic Years 97 vs. 07Cost of College vs. FFELP Loan Limits - Academic Years 97 vs. 07
Source: College Board. Cost of college includes tuition, fees, room and board, transportation and other expenses for four yeardegree granting institutions for academic years ended June 30, 1997 and 2007.
(1) FFELP loan limit for 4 consecutive yrs of college. Limits increased in July 2008 from $19,000 to $27,000 for dependent students.
$4.5$5.6
$7.6
$10.1
$13.8
$17.0$18.5
$0
$2
$4
$6
$8
$10
$12
$14
$16
$18
$20
2001 2002 2003 2004 2005 2006 2007
$bn
FFELP Loan Shortfall
FFELPLimit(1)
Growth in Non-Federal Student Loan OriginationsGrowth in Non-Federal Student Loan Originations
AY1997
AY2007
Source: College Board, Trends in Higher Education Series (2007).
September 2008 8
Traditional vs Non-Traditional
• SLM’s Managed private education loan portfolio is segmented into two categories: Traditional and Non-Traditional
• Non-Traditional loans are loans primarily made to borrowers attending schools with unacceptably high default rates, or as exceptions to FICO-based underwriting criteria
• In 1Q 2008, SLM ceased originating new Non-Traditional loans
• Traditional loans are made to borrowers at schools with acceptable default rates, where either the borrower or co-borrower meets minimum FICO criteria
• As of August 31, 2008, 94% of pool collateral across all SLM Private Credit Trusts consisted of Traditional loans

September 2008 9
SLM Traditional Loan Net Charge-off Rates vs Credit Cards
3.6%
4.4%
5.0%5.2%4.5%
1.6%
2.9%
5.7%
4.3%
5.8%
1.7%
5.3%
6.5%
2.0%
6.7%
SLMTraditional*
AmericanExpress**
Bank ofAmerica***
Citibank JPMorgan
Q2'07 Q1'08 Q2'08
• SLM Traditional private credit loan net charge-off rates are well below those of top tier credit card originators
• SLM’s private credit loans have continued to outperform credit cards as consumer credit has weakened
* Net charge-offs as a percentage of average Managed private education loans in repayment, annualized.** U.S. Card Services, excluding write-offs of accrued interest and fees. Includes off-balance sheet securitized card member loans.*** US Consumer & Business Card.

September 2008 10
II. SLM Private Credit Student Loan ABS
September 2008 11
SLM Private Credit ABS Issue Characteristics
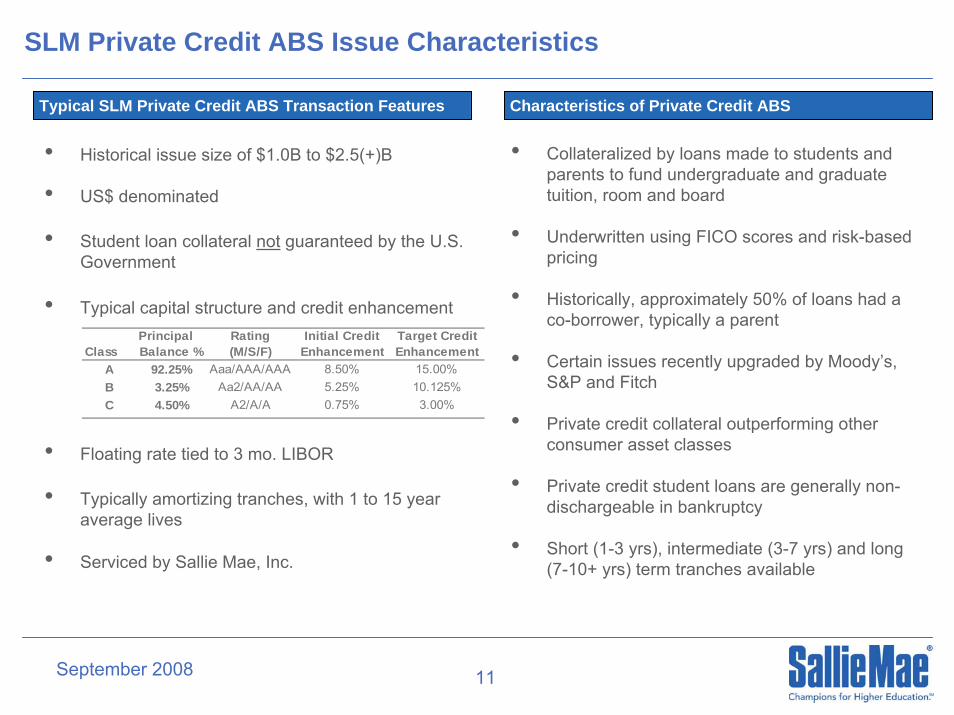
• Historical issue size of $1.0B to $2.5(+)B
• US$ denominated
• Student loan collateral not guaranteed by the U.S. Government
• Typical capital structure and credit enhancement
• Floating rate tied to 3 mo. LIBOR
• Typically amortizing tranches, with 1 to 15 year average lives
• Serviced by Sallie Mae, Inc.
Typical SLM Private Credit ABS Transaction FeaturesTypical SLM Private Credit ABS Transaction Features Characteristics of Private Credit ABSCharacteristics of Private Credit ABS
• Collateralized by loans made to students and parents to fund undergraduate and graduate tuition, room and board
• Underwritten using FICO scores and risk-based pricing
• Historically, approximately 50% of loans had a co-borrower, typically a parent
• Certain issues recently upgraded by Moody’s, S&P and Fitch
• Private credit collateral outperforming other consumer asset classes
• Private credit student loans are generally non-dischargeable in bankruptcy
• Short (1-3 yrs), intermediate (3-7 yrs) and long (7-10+ yrs) term tranches available
Principal Rating Initial Credit Target CreditClass Balance % (M/S/F) Enhancement Enhancement
A 92.25% Aaa/AAA/AAA 8.50% 15.00%B 3.25% Aa2/AA/AA 5.25% 10.125%C 4.50% A2/A/A 0.75% 3.00%

September 2008 12
Potential SLM Private Credit ABS Structural Changes
• Collateralized entirely by Traditional private credit loans• More credit and liquidity enhancement to reflect higher coupon on securities• No other major structural changes to SLM Private Credit Student Loan Trusts planned
SLM Private Credit
Student Loan Trust 2007-A Potential SLM Private Credit Transaction vs. SLM 2007-A
Initial Credit Enhancement (AAA) 8.5% Higher Target Enhancement (AAA) 15% Higher Target Overcollateralization 2% Higher Reserve Account 0.25% Equivalent or higher Cash Capitalization Account 11.1% Higher Realized Loss Test 15% year 1, 18% year 2, 20% year 3 Equivalent or tighter Trust Structure Discrete pool of assets and bonds Discrete pool of assets and bonds
September 2008 13
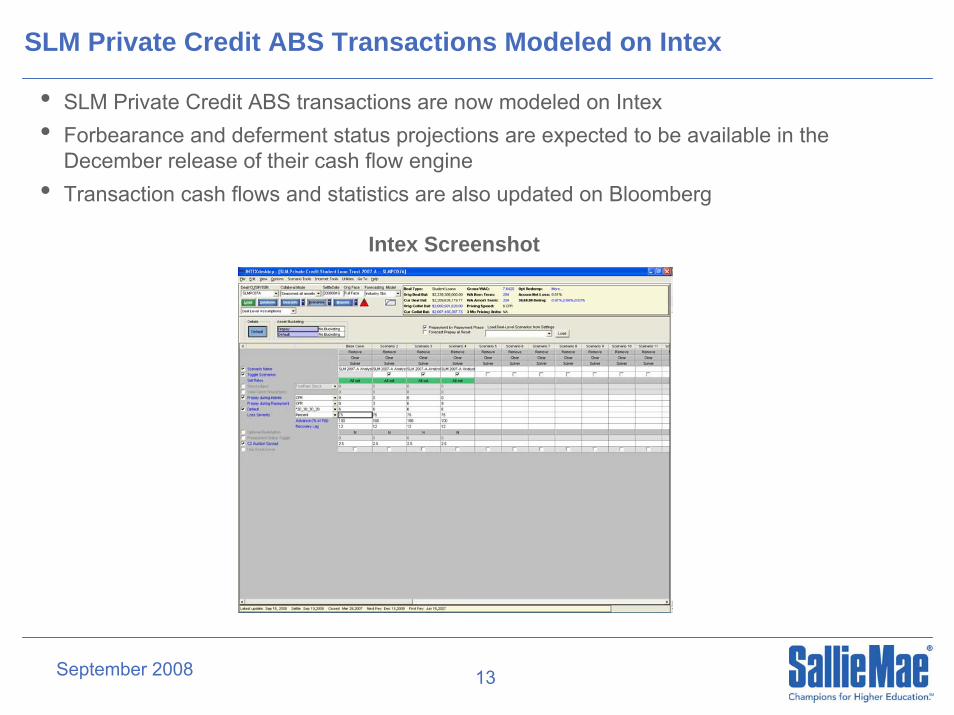
SLM Private Credit ABS Transactions Modeled on Intex
Intex Screenshot
• SLM Private Credit ABS transactions are now modeled on Intex• Forbearance and deferment status projections are expected to be available in the
December release of their cash flow engine• Transaction cash flows and statistics are also updated on Bloomberg

September 2008 14
Rating Actions on SLM Private Credit Student Loan ABS
• There have been a number of upgrades and no downgrades to Sallie Mae’s Private Credit ABS since the program’s inception in 2002
Moody’s(1) - March 2007 S&P - July 2008Fitch - September 2007
(1) On September 17, 2008, as a result of Lehman's bankruptcy and rating downgrade, Moody's placed all of the tranches from the SLM Student Loan Trust 2004-1 transaction on review for possible downgrade. Lehman Brothers Special Financing Inc. acted as interest rate swap provider for the class A-6 reset rate notes. The Lehman interest rate swap expires in January 2009 and is fully cash collateralized.
Deal Tranche Previous Rating
Current Rating Deal Tranche
PreviousRating
Current Rating Deal Tranche
Previous Rating
CurrentRating
2002-A B A1 Aa3 2002-A B A AA+ 2002-A B A AA 2002-A C Baa1 A3 2002-A C BBB A+ 2002-A C BBB A 2003-A B A1 Aa3 2003-A B A+ AA 2003-A C Baa1 A3 2003-A C BBB+ A 2003-B B A1 Aa3 2003-B B A+ AA 2003-B C Baa1 A3 2003-B C BBB+ A 2004-A B A1 Aa3 2003-C B A+ AA 2004-A C Baa1 A3 2003-C C BBB+ A 2004-B B A1 Aa3 2004-A B A+ AA 2004-B C Baa1 A3 2004-A C BBB+ A
2004-B B A+ AA 2004-B C BBB+ A
September 2008 15
III. SLM Private Credit ABS Relative Value
September 2008 16
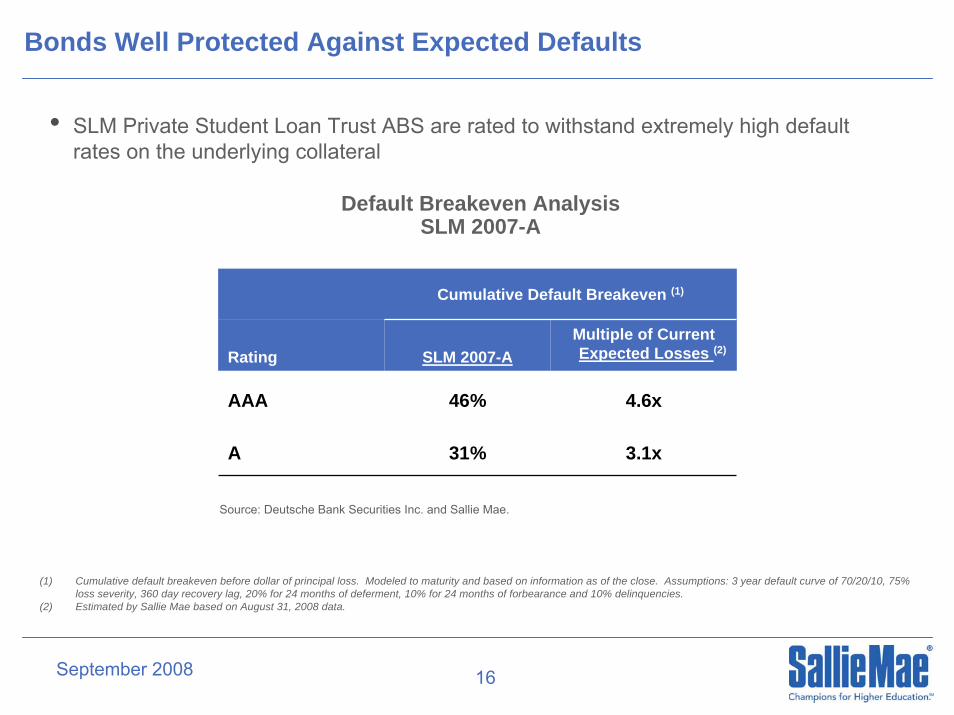
• SLM Private Student Loan Trust ABS are rated to withstand extremely high default rates on the underlying collateral
Bonds Well Protected Against Expected Defaults
(1) Cumulative default breakeven before dollar of principal loss. Modeled to maturity and based on information as of the close. Assumptions: 3 year default curve of 70/20/10, 75% loss severity, 360 day recovery lag, 20% for 24 months of deferment, 10% for 24 months of forbearance and 10% delinquencies.
(2) Estimated by Sallie Mae based on August 31, 2008 data.
Source: Deutsche Bank Securities Inc. and Sallie Mae.
Default Breakeven AnalysisSLM 2007-A
Cumulative Default Breakeven (1)
Rating SLM 2007-AMultiple of Current
xxExpected Losses (2)
AAA 46% 4.6x
A 31% 3.1x

September 2008 17
• Cash Capitalization Account protects SLM Private Credit ABS against significant average life extension
• Even with a doubling of deferment and forbearance, bonds in a representative SLM Private Credit ABS issue extend by less than one year
Bonds Well Protected Against Extension Risk
0% CPR 3% CPR 6% CPR 9% CPR
Class Expected
Avg Life (yrs) 2x Expected
(yrs) Expected
Avg Life (yrs) 2x Expected
(yrs) Expected
Avg Life (yrs) 2x Expected
(yrs) Expected
Avg Life (yrs) 2x Expected
(yrs)
A 12.4 13.5 10.8 11.8 9.6 10.5 8.6 9.4 B 15.0 15.8 13.5 14.3 12.0 12.9 10.7 11.5 C 14.3 15.1 12.5 13.4 10.9 11.8 9.5 10.4
(1) Modeled to call. Assumes no defaults and an expected case of 20% deferments for 24 months, 10% forbearance for 24 months and 10% delinquencies.
2007-A Extension AnalysisBased on Different Prepayment, Deferment and Forbearance Scenarios(1)
September 2008 18
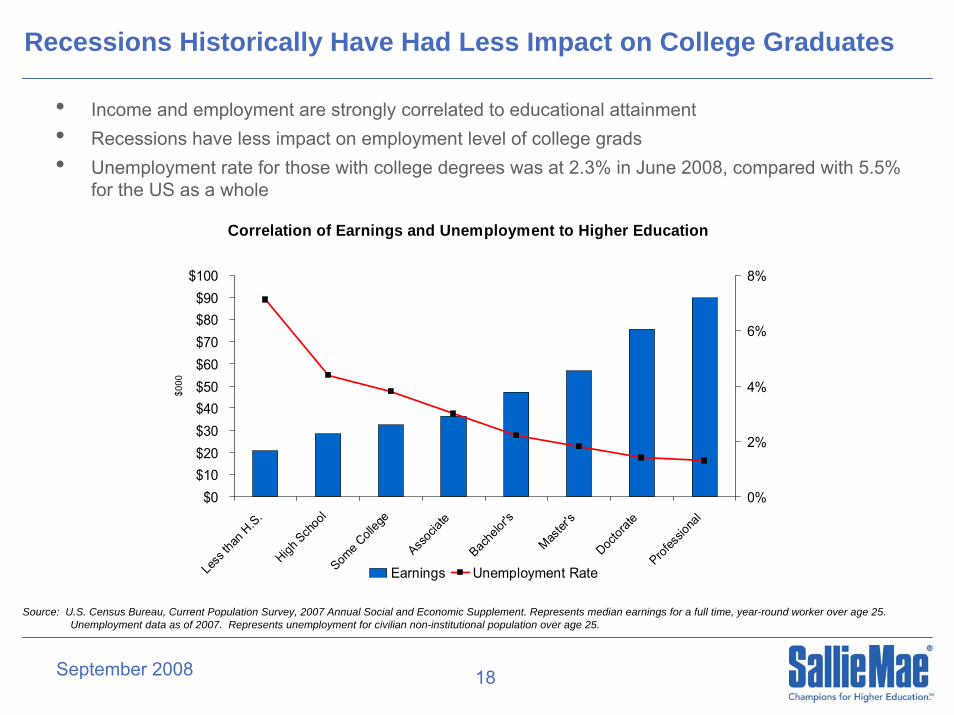
Recessions Historically Have Had Less Impact on College Graduates
• Income and employment are strongly correlated to educational attainment• Recessions have less impact on employment level of college grads• Unemployment rate for those with college degrees was at 2.3% in June 2008, compared with 5.5%
for the US as a whole
Correlation of Earnings and Unemployment to Higher Education
$0$10$20$30$40$50$60$70$80$90
$100
Less
than
H.S.
High Sch
ool
Some C
olleg
e
Assoc
iate
Bache
lor's
Master
's
Doctor
ate
Profes
siona
l
$000
0%
2%
4%
6%
8%
Earnings Unemployment Rate
Source: U.S. Census Bureau, Current Population Survey, 2007 Annual Social and Economic Supplement. Represents median earnings for a full time, year-round worker over age 25. Unemployment data as of 2007. Represents unemployment for civilian non-institutional population over age 25.

September 2008 19
2.7%
1.5% 1.4%
2.0%
1.3%1.5%
1.8%
3.0%
2.0%
1.4%
1.8%
3.0%
SLM Traditional* Bank of America** Citibank JPMorgan
Q2'07 Q1'08 Q2'08
SLM Traditional Loan 90+ Day Delinquencies vs Credit Cards
• 90+ day delinquencies on Traditional Loans continue to run lower than 90+ day delinquencies on prime credit card loans
* Delinquencies greater than 90 days as a percentage of managed private education loans in repayment.** US Consumer & Business Card. American Express 90+ day delinquencies not reported.
September 2008 20
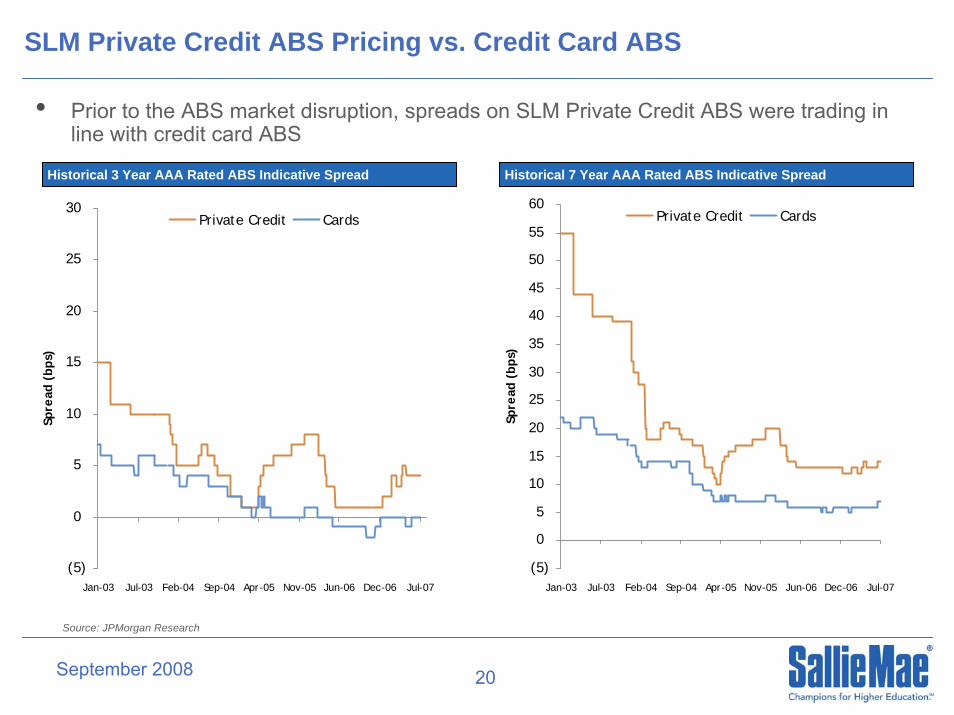
SLM Private Credit ABS Pricing vs. Credit Card ABS
• Prior to the ABS market disruption, spreads on SLM Private Credit ABS were trading in line with credit card ABS
Source: JPMorgan Research
(5)
0
5
10
15
20
25
30
Jan-03 Jul-03 Feb-04 Sep-04 Apr-05 Nov-05 Jun-06 Dec-06 Jul-07
Spre
ad (
bps)
Private Credit Cards
(5)
0
5
10
15
20
25
30
35
40
45
50
55
60
Jan-03 Jul-03 Feb-04 Sep-04 Apr-05 Nov-05 Jun-06 Dec-06 Jul-07
Spre
ad (
bps)
Private Credit Cards
Historical 3 Year AAA Rated ABS Indicative SpreadHistorical 3 Year AAA Rated ABS Indicative Spread Historical 7 Year AAA Rated ABS Indicative SpreadHistorical 7 Year AAA Rated ABS Indicative Spread
September 2008 21
IV. SLM Private Credit Student Loan Program

September 2008 22
Sallie Mae’s Private Credit Student Loan Characteristics (1)
• Made to undergraduate and graduate students
• Floating rate, indexed to either LIBOR or Prime, with risk-based pricing
• Repayment term varies from 15 to 20(+) years, depending on loan balance
• Payments typically deferred until six months after graduation
• Underwritten primarily based on FICO, school type and specific school of attendance
• > 70% of new loans are now being originated with a co-borrower(1), typically a parent, representing a second household for SLM to rely on to support repayment
• Generally non-dischargeable in bankruptcy
(1) Figure for new loans originated in July and August 2008.
September 2008 23
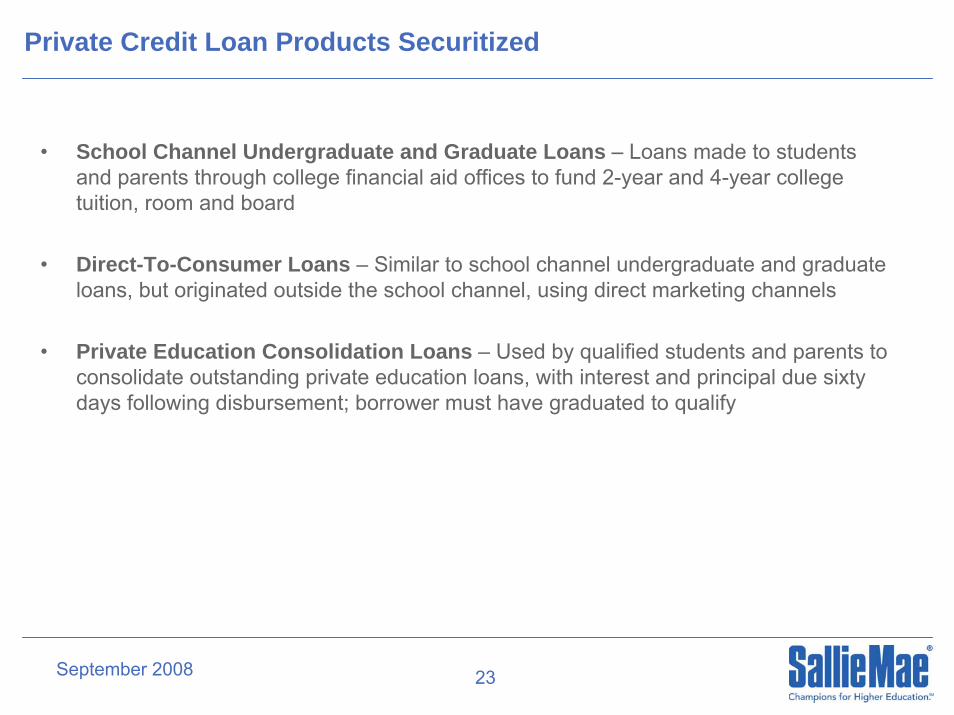
Private Credit Loan Products Securitized
• School Channel Undergraduate and Graduate Loans – Loans made to students and parents through college financial aid offices to fund 2-year and 4-year college tuition, room and board
• Direct-To-Consumer Loans – Similar to school channel undergraduate and graduate loans, but originated outside the school channel, using direct marketing channels
• Private Education Consolidation Loans – Used by qualified students and parents to consolidate outstanding private education loans, with interest and principal due sixty days following disbursement; borrower must have graduated to qualify
September 2008 24
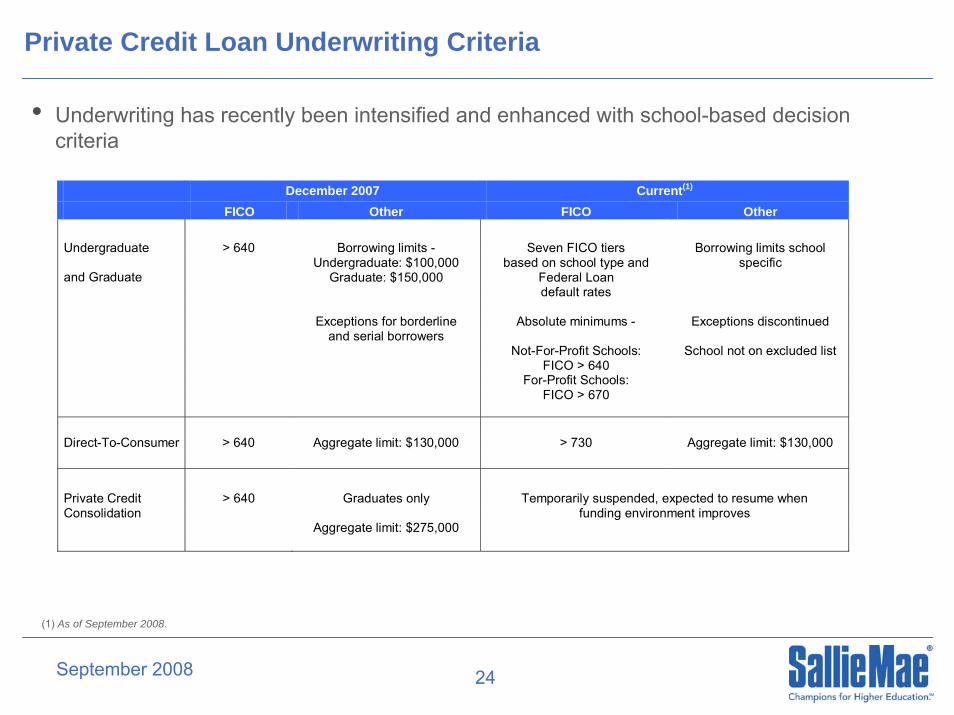
Private Credit Loan Underwriting Criteria
December 2007 Current(1) Xxxx FICO xxxx Other FICO Other Undergraduate > 640 Borrowing limits - Seven FICO tiers Borrowing limits school
and Graduate Undergraduate: $100,000
Graduate: $150,000 based on school type and
Federal Loan specific
default rates Exceptions for borderline Absolute minimums - Exceptions discontinued and serial borrowers Not-For-Profit Schools: School not on excluded list FICO > 640 For-Profit Schools: FICO > 670 Direct-To-Consumer > 640 Aggregate limit: $130,000 > 730 Aggregate limit: $130,000 Private Credit > 640 Graduates only Consolidation
Temporarily suspended, expected to resume when funding environment improves
Aggregate limit: $275,000
(1) As of September 2008.
• Underwriting has recently been intensified and enhanced with school-based decision criteria

September 2008 25
Private Credit Loan Collections
• Sallie Mae services and collects the loans in its Private Credit ABS Trusts
• Private credit collections are conducted by a stand-alone consumer credit collections unit, not the company’s FFELP collections operations
• Managed by individuals with prior experience managing collections operations for consumer loan assets
• Over the past eighteen months, private credit collections resources have been significantly increased and collections technology and practices enhanced
• Multi-variable analysis has enabled prioritization of collection efforts on higher risk borrowers
• Forbearance policy has been revamped, with eligibility and duration based on a risk-based decision tree model
September 2008 26
Forbearance
• A collections tool used to provide borrowers time to improve their ability to repay
– Between graduation and start of first job– Economic hardship
• Provides borrower with time to obtain employment and income to support their obligations
• Applied most frequently in the first two years of repayment
• Majority of loans are in forbearance for less than 12 months
• Granted for three month intervals, up to a maximum of 24 months
• Placing a loan in forbearance suspends payments, with interest capitalized to the loan balance
September 2008 27
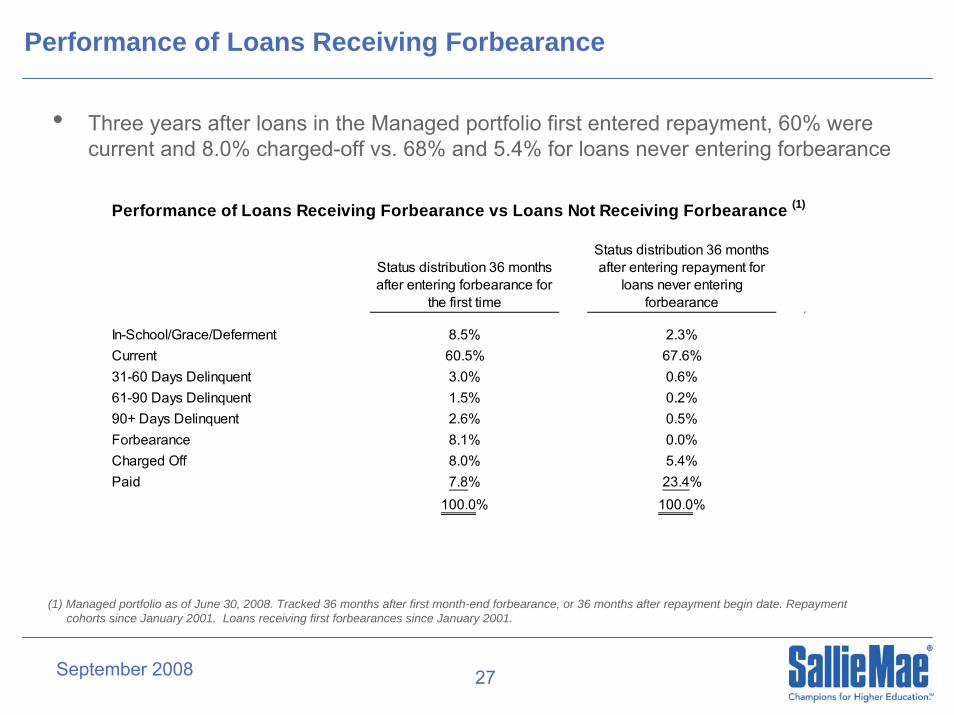
Performance of Loans Receiving Forbearance
Performance of Loans Receiving Forbearance vs Loans Not Receiving Forbearance (1)
Status distribution 36 months after entering forbearance for
the first time
Status distribution 36 months after entering repayment for
loans never entering forbearance
In-School/Grace/Deferment 8.5% 2.3%Current 60.5% 67.6%31-60 Days Delinquent 3.0% 0.6%61-90 Days Delinquent 1.5% 0.2%90+ Days Delinquent 2.6% 0.5%Forbearance 8.1% 0.0%Charged Off 8.0% 5.4%Paid 7.8% 23.4%
100.0% 100.0%
(1) Managed portfolio as of June 30, 2008. Tracked 36 months after first month-end forbearance, or 36 months after repayment begin date. Repayment cohorts since January 2001. Loans receiving first forbearances since January 2001.
• Three years after loans in the Managed portfolio first entered repayment, 60% were current and 8.0% charged-off vs. 68% and 5.4% for loans never entering forbearance

September 2008 28
V. Cumulative Loss Expectations

29
Expected Loss Emergence Timing
2%
12%
24%18%
14%9% 7% 4% 3% 2% 2% 1% 1% 1% 1%
38%
55%
69%
78%85%
89% 92% 94% 96% 97% 98% 99% 100%
2%
14%
0.0%
10.0%
20.0%
30.0%
40.0%
50.0%
60.0%
70.0%
80.0%
90.0%
100.0%
1 2 3 4 5 6 7 8 9 10 11 12 13 14 15Years in Repayment
Perc
ent o
f Tot
al D
efau
lts
Defaults Per Repayment Year Cumulative Default
• Defaults in SLM Private Credit ABS Trusts increase as loans first enter repayment, then diminish steadily over time
SLM Private Credit Default Emergence Profile

30
SLM Private Credit Gross Defaults: Actual-To-Date vs. Current Lifetime Expectations
For SLM Private Credit Student Loan Trusts issued prior to 2005-B, the servicer has the option, but not the obligation, to repurchase loans that (i) become 180+ days delinquent and/or (ii) have a borrower who filed for bankruptcy or died . To date, the servicer has exercised this repurchase option and actual charge-offs in these trusts equals zero. For the purposes of comparison across all deals, this chart reflects trust charge-offs for SLM Private Credit Student Loan Trusts issued prior to 2005-B as if the servicer had not exercised its repurchase option.
(1) Charge-offs per the servicer’s portfolio definition which is generally 212+ days delinquent. Includes loans for which a borrower has filed bankruptcy which have subsequently become 212+ days delinquent. Loans that were transferred to a co-borrower’s account due to bankruptcy or death and subsequently charged off are not included.
(2) Charge-offs due to a borrower’s bankruptcy filing for which the loan is now current or paid off. Loans that were transferred to a co-borrower’s account due to bankruptcy or death and are now paid off or current are not included.
(3) For loans not transferred to a co-borrowers account, charge-offs due to a borrower’s bankruptcy filing or death for which the loan is not current or paid off but has not become 212+ days delinquent. These loans can be in various statuses including: bankruptcy stay, deferment, forbearance or delinquency. All loans that were transferred to a co-borrower’s account due to bankruptcy or death are included.
(4) Charge-offs per the servicer’s portfolio definition explained in footnote (1).
Actual-to-Date Cumulative Gross Defaults and Current Lifetime Expectations,including Bankruptcy Information
All Trust Loans
1.32%0.86% 1.02% 1.16%
4.81%4.37% 4.35% 4.63% 4.86%
3.02% 3.11%
1.81%1.27% 1.50% 1.67%
0.62%
4.12%3.69% 3.67%
2.49%2.39%
3.96%3.94%
0.28%
6.0%6.5%
7.3% 7.5%8.3%
7.9%
9.6%
8.4% 8.7%9.4%
11.7%
10.0%
0.0%
2.0%
4.0%
6.0%
8.0%
10.0%
12.0%
14.0%
2002-A 2003-A 2003-B 2003-C 2004-A 2004-B 2005-A 2005-B 2006-A 2006-B 2006-C 2007-A
Perc
ent o
f Orig
inal
Poo
l Bal
ance
Charge-off - 212+ days delinquent (1) Bankruptcy or death - now current or paid off (2) Bankruptcy or death - other (3) Current Lifetime Expected Loss (4)
31
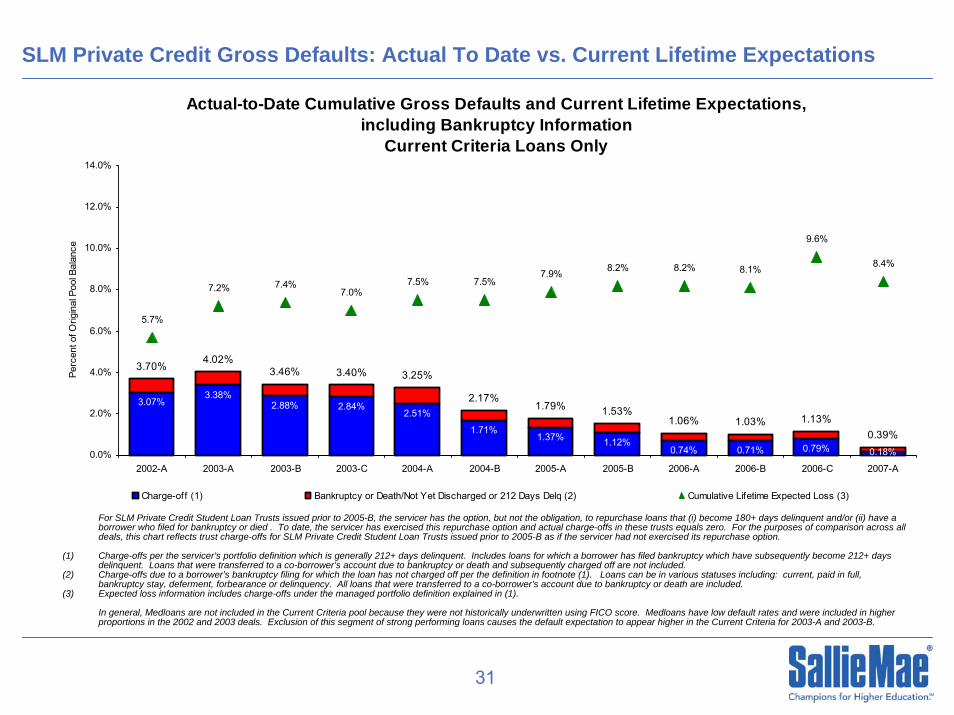
SLM Private Credit Gross Defaults: Actual To Date vs. Current Lifetime Expectations
Actual-to-Date Cumulative Gross Defaults and Current Lifetime Expectations,including Bankruptcy Information
Current Criteria Loans Only
1.12%0.74% 0.71% 0.79%
3.70%4.02%
3.46% 3.40% 3.25%
2.17%1.79% 1.53%
1.06% 1.03% 1.13%0.39%0.18%
2.84%2.51%
1.71%1.37%
2.88%3.38%
3.07%
5.7%
7.2% 7.4%7.0%
7.5% 7.5%7.9% 8.2% 8.2% 8.1%
9.6%
8.4%
0.0%
2.0%
4.0%
6.0%
8.0%
10.0%
12.0%
14.0%
2002-A 2003-A 2003-B 2003-C 2004-A 2004-B 2005-A 2005-B 2006-A 2006-B 2006-C 2007-A
Perc
ent o
f Orig
inal
Poo
l Bal
ance
Charge-off (1) Bankruptcy or Death/Not Yet Discharged or 212 Days Delq (2) Cumulative Lifetime Expected Loss (3)
For SLM Private Credit Student Loan Trusts issued prior to 2005-B, the servicer has the option, but not the obligation, to repurchase loans that (i) become 180+ days delinquent and/or (ii) have a borrower who filed for bankruptcy or died . To date, the servicer has exercised this repurchase option and actual charge-offs in these trusts equals zero. For the purposes of comparison across all deals, this chart reflects trust charge-offs for SLM Private Credit Student Loan Trusts issued prior to 2005-B as if the servicer had not exercised its repurchase option.
(1) Charge-offs per the servicer’s portfolio definition which is generally 212+ days delinquent. Includes loans for which a borrower has filed bankruptcy which have subsequently become 212+ days delinquent. Loans that were transferred to a co-borrower’s account due to bankruptcy or death and subsequently charged off are not included.
(2) Charge-offs due to a borrower’s bankruptcy filing for which the loan has not charged off per the definition in footnote (1). Loans can be in various statuses including: current, paid in full, bankruptcy stay, deferment, forbearance or delinquency. All loans that were transferred to a co-borrower’s account due to bankruptcy or death are included.
(3) Expected loss information includes charge-offs under the managed portfolio definition explained in (1).
In general, Medloans are not included in the Current Criteria pool because they were not historically underwritten using FICO score. Medloans have low default rates and were included in higher proportions in the 2002 and 2003 deals. Exclusion of this segment of strong performing loans causes the default expectation to appear higher in the Current Criteria for 2003-A and 2003-B.
32
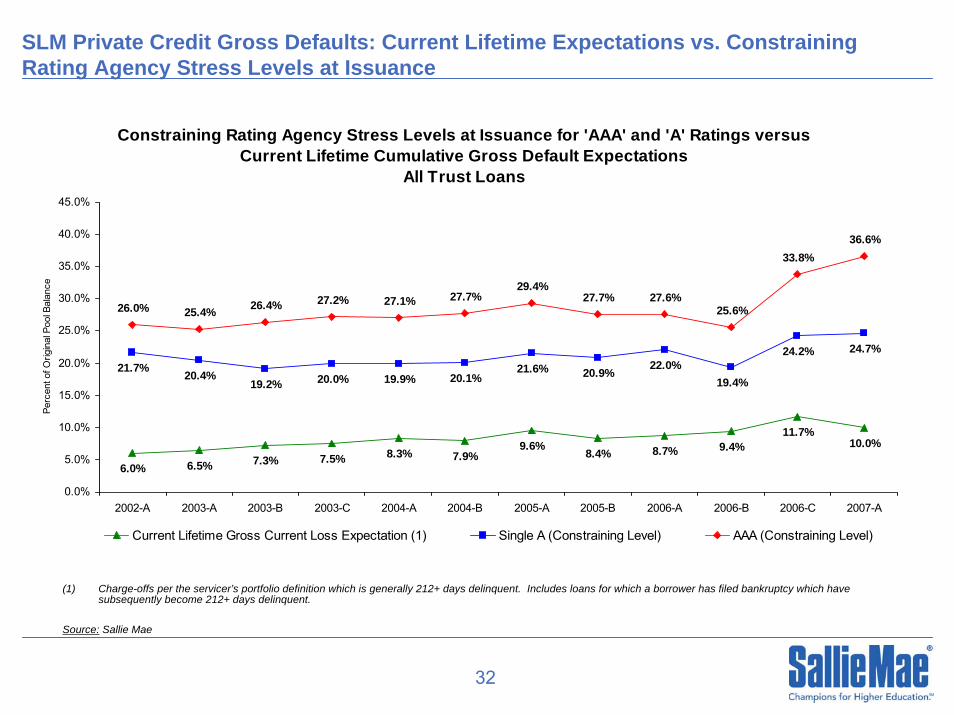
SLM Private Credit Gross Defaults: Current Lifetime Expectations vs. Constraining Rating Agency Stress Levels at Issuance
Constraining Rating Agency Stress Levels at Issuance for 'AAA' and 'A' Ratings versusCurrent Lifetime Cumulative Gross Default Expectations
All Trust Loans
6.0% 6.5% 7.3% 7.5% 8.3% 7.9%9.6% 8.4% 8.7% 9.4%
11.7%10.0%
21.7% 20.4%19.2% 20.0% 19.9% 20.1%
21.6% 20.9%22.0%
19.4%
24.2% 24.7%
26.0% 25.4% 26.4% 27.2% 27.1% 27.7%29.4%
27.7% 27.6%25.6%
33.8%36.6%
0.0%
5.0%
10.0%
15.0%
20.0%
25.0%
30.0%
35.0%
40.0%
45.0%
2002-A 2003-A 2003-B 2003-C 2004-A 2004-B 2005-A 2005-B 2006-A 2006-B 2006-C 2007-A
Perc
ent o
f Orig
inal
Poo
l Bal
ance
Current Lifetime Gross Current Loss Expectation (1) Single A (Constraining Level) AAA (Constraining Level)
Source: Sallie Mae
(1) Charge-offs per the servicer’s portfolio definition which is generally 212+ days delinquent. Includes loans for which a borrower has filed bankruptcy which have subsequently become 212+ days delinquent.
September 2008 33
VI. Performance Drivers

September 2008 34
SLM Private Credit Performance Drivers
• Among the multiple variables that impact the performance of private credit loans, a combination of the following has the greatest impact
– FICO score of Borrower or Co-Borrower(1)
– Presence of a Co-Borrower
– School attended:• Likelihood the borrower completes their education and graduates
from school• Likelihood the borrower obtains employment• Likelihood the borrower earns a stable and sufficient income stream
to service their loan
(1) If there is a co-borrower, FICO score represents higher of borrower and co-borrower score.

September 2008 35
Performance Data Segmentation
• Unless otherwise noted, historical data provided in this section has been segmented into two categories reflecting SLM’s current underwriting and pool selection criteria
Loans MeetingCurrent Selection Criteria
Not-For-Profit Schools, FICO ≥ 640For-Profit Schools, FICO ≥ 670
School Not Excluded List
Loans Not MeetingCurrent Selection Criteria
Not-For-Profit Schools, FICO < 640For-Profit Schools, FICO < 670
Excluded Schools
• Loans originated without a FICO score are not included in the data
September 2008 36
SLM Private Credit Performance Drivers: Original FICO
0%
3%
5%
8%
10%
13%
15%
640-669 670-699 700-729 730-759 760-850Cum
ulat
ive
Gro
ss D
efau
lt R
ate
(% o
f rep
aym
ent p
rinci
pal)
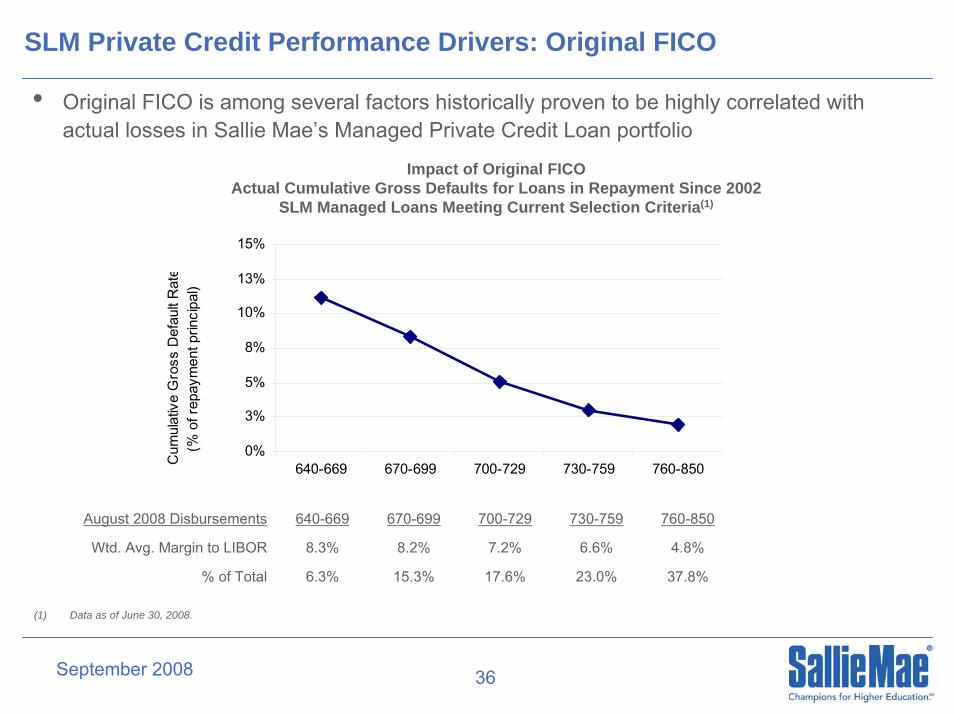
• Original FICO is among several factors historically proven to be highly correlated with actual losses in Sallie Mae’s Managed Private Credit Loan portfolio
Impact of Original FICO Actual Cumulative Gross Defaults for Loans in Repayment Since 2002
SLM Managed Loans Meeting Current Selection Criteria(1)
(1) Data as of June 30, 2008.
August 2008 Disbursements 640-669 670-699 700-729 730-759 760-850
Wtd. Avg. Margin to LIBOR 8.3% 8.2% 7.2% 6.6% 4.8%
% of Total 6.3% 15.3% 17.6% 23.0% 37.8%
September 2008 37
VII. Reasons to Invest inSLM Private Credit ABS
September 2008 38
Reasons to Invest in SLM Private Credit ABS
• SLM is the market leader in private education loans
• SLM originates, services and collects all of its private credit loans
• SLM Private Credit ABS are well-protected, with 2007-A able to withstand 46% cumulative losses, or 4.6x current expected losses at a triple-A level
• High quality portfolio, with high average FICO and strong historical performance
• Loans to college graduates perform better than loans made to non-college graduates with similar credit profiles
• Positive industry dynamics
• Extremely attractive relative value compared to other consumer asset types
September 2008 39
Contact Information
Ken FischbachSenior Vice President, Corporate FinanceSallie Mae, Inc.12061 Bluemont WayReston, VA [email protected]
Leo SublerVice President, Corporate FinanceSallie Mae, Inc.12061 Bluemont WayReston, VA [email protected]

September 2008 40
Appendix A: SLM Private Credit ABSTrust Characteristics
September 2008 41
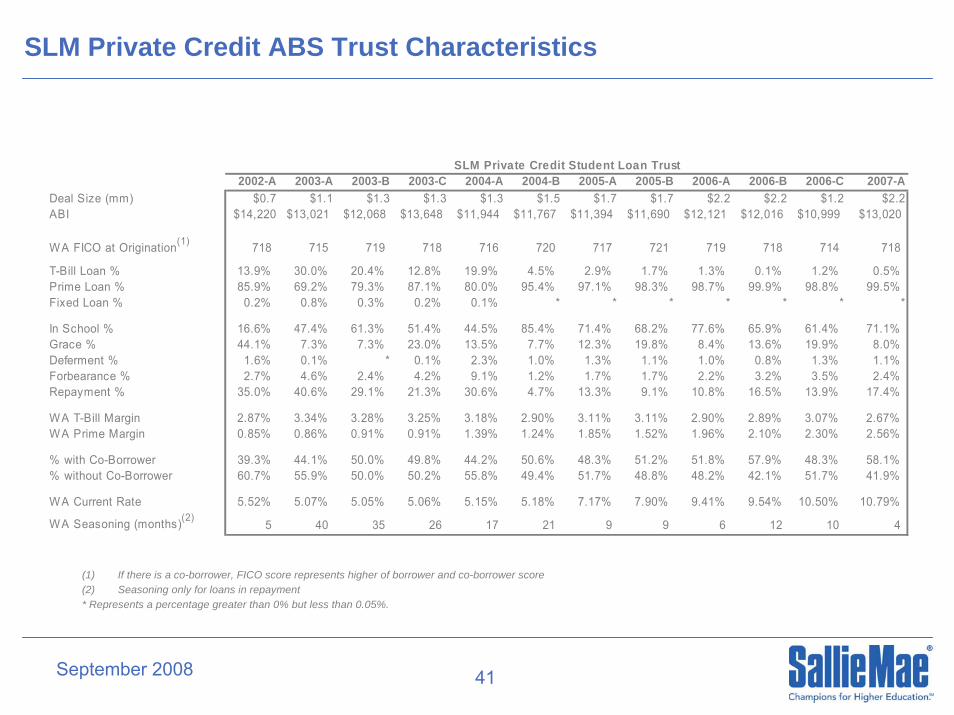
SLM Private Credit ABS Trust Characteristics
SLM Private Credit Student Loan Trust2002-A 2003-A 2003-B 2003-C 2004-A 2004-B 2005-A 2005-B 2006-A 2006-B 2006-C 2007-A
Deal Size (mm) $0.7 $1.1 $1.3 $1.3 $1.3 $1.5 $1.7 $1.7 $2.2 $2.2 $1.2 $2.2ABI $14,220 $13,021 $12,068 $13,648 $11,944 $11,767 $11,394 $11,690 $12,121 $12,016 $10,999 $13,020
WA FICO at Origination(1) 718 715 719 718 716 720 717 721 719 718 714 718
T-Bill Loan % 13.9% 30.0% 20.4% 12.8% 19.9% 4.5% 2.9% 1.7% 1.3% 0.1% 1.2% 0.5%Prime Loan % 85.9% 69.2% 79.3% 87.1% 80.0% 95.4% 97.1% 98.3% 98.7% 99.9% 98.8% 99.5%Fixed Loan % 0.2% 0.8% 0.3% 0.2% 0.1% * * * * * * *
In School % 16.6% 47.4% 61.3% 51.4% 44.5% 85.4% 71.4% 68.2% 77.6% 65.9% 61.4% 71.1%Grace % 44.1% 7.3% 7.3% 23.0% 13.5% 7.7% 12.3% 19.8% 8.4% 13.6% 19.9% 8.0%Deferment % 1.6% 0.1% * 0.1% 2.3% 1.0% 1.3% 1.1% 1.0% 0.8% 1.3% 1.1%Forbearance % 2.7% 4.6% 2.4% 4.2% 9.1% 1.2% 1.7% 1.7% 2.2% 3.2% 3.5% 2.4%Repayment % 35.0% 40.6% 29.1% 21.3% 30.6% 4.7% 13.3% 9.1% 10.8% 16.5% 13.9% 17.4%
WA T-Bill Margin 2.87% 3.34% 3.28% 3.25% 3.18% 2.90% 3.11% 3.11% 2.90% 2.89% 3.07% 2.67%WA Prime Margin 0.85% 0.86% 0.91% 0.91% 1.39% 1.24% 1.85% 1.52% 1.96% 2.10% 2.30% 2.56%
% with Co-Borrower 39.3% 44.1% 50.0% 49.8% 44.2% 50.6% 48.3% 51.2% 51.8% 57.9% 48.3% 58.1%% without Co-Borrower 60.7% 55.9% 50.0% 50.2% 55.8% 49.4% 51.7% 48.8% 48.2% 42.1% 51.7% 41.9%
WA Current Rate 5.52% 5.07% 5.05% 5.06% 5.15% 5.18% 7.17% 7.90% 9.41% 9.54% 10.50% 10.79%
WA Seasoning (months)(2)5 40 35 26 17 21 9 9 6 12 10 4
(1) If there is a co-borrower, FICO score represents higher of borrower and co-borrower score(2) Seasoning only for loans in repayment* Represents a percentage greater than 0% but less than 0.05%.
September 2008 42
Appendix B: SLM Private Credit ABSTrust Analytics
September 2008 43
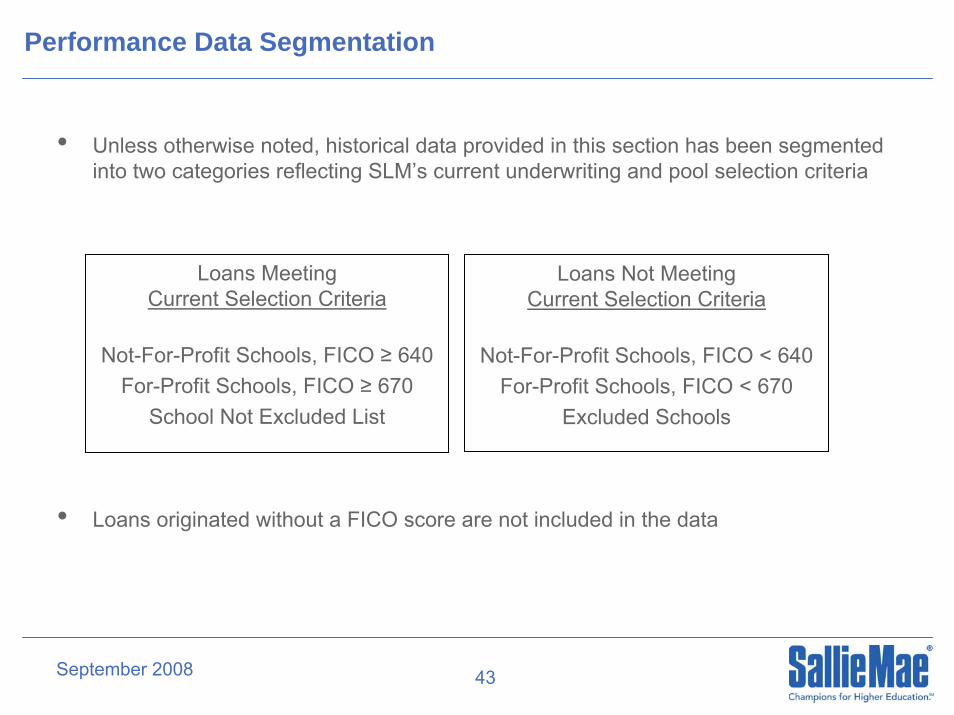
Performance Data Segmentation
• Unless otherwise noted, historical data provided in this section has been segmented into two categories reflecting SLM’s current underwriting and pool selection criteria
Loans MeetingCurrent Selection Criteria
Not-For-Profit Schools, FICO ≥ 640For-Profit Schools, FICO ≥ 670
School Not Excluded List
Loans Not MeetingCurrent Selection Criteria
Not-For-Profit Schools, FICO < 640For-Profit Schools, FICO < 670
Excluded Schools
• Loans originated without a FICO score are not included in the data
September 2008 44
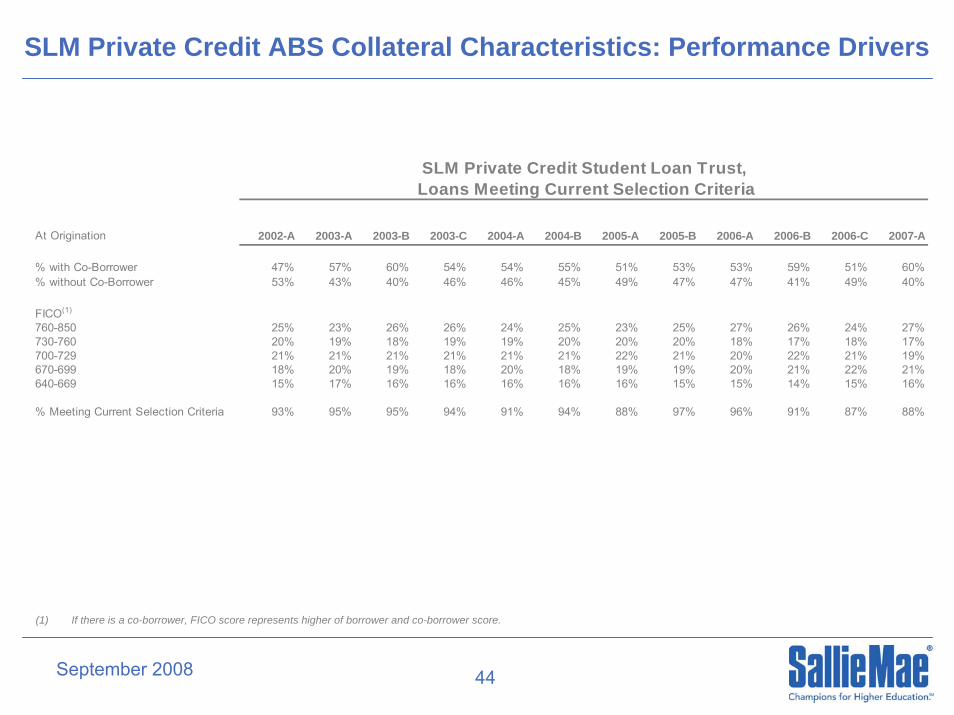
SLM Private Credit ABS Collateral Characteristics: Performance Drivers
(1) If there is a co-borrower, FICO score represents higher of borrower and co-borrower score.
Loans Meeting Current Selection Criteria
At Origination 2002-A 2003-A 2003-B 2003-C 2004-A 2004-B 2005-A 2005-B 2006-A 2006-B 2006-C 2007-A
% with Co-Borrower 47% 57% 60% 54% 54% 55% 51% 53% 53% 59% 51% 60%% without Co-Borrower 53% 43% 40% 46% 46% 45% 49% 47% 47% 41% 49% 40%
FICO(1)
760-850 25% 23% 26% 26% 24% 25% 23% 25% 27% 26% 24% 27%730-760 20% 19% 18% 19% 19% 20% 20% 20% 18% 17% 18% 17%700-729 21% 21% 21% 21% 21% 21% 22% 21% 20% 22% 21% 19%670-699 18% 20% 19% 18% 20% 18% 19% 19% 20% 21% 22% 21%640-669 15% 17% 16% 16% 16% 16% 16% 15% 15% 14% 15% 16%
% Meeting Current Selection Criteria 93% 95% 95% 94% 91% 94% 88% 97% 96% 91% 87% 88%
SLM Private Credit Student Loan Trust,
45
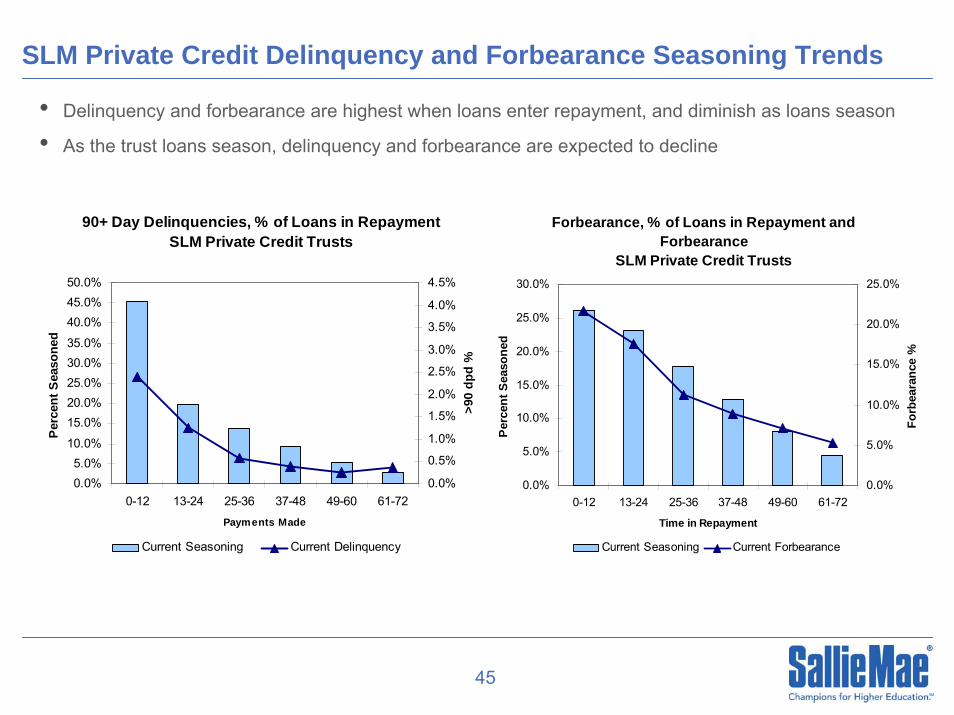
SLM Private Credit Delinquency and Forbearance Seasoning Trends
90+ Day Delinquencies, % of Loans in RepaymentSLM Private Credit Trusts
0.0%5.0%
10.0%
15.0%20.0%25.0%30.0%35.0%
40.0%45.0%50.0%
0-12 13-24 25-36 37-48 49-60 61-72Payments Made
Per
cent
Sea
sone
d
0.0%
0.5%
1.0%
1.5%
2.0%
2.5%
3.0%
3.5%
4.0%
4.5%
>90
dpd
%
Current Seasoning Current Delinquency
Forbearance, % of Loans in Repayment and Forbearance
SLM Private Credit Trusts
0.0%
5.0%
10.0%
15.0%
20.0%
25.0%
30.0%
0-12 13-24 25-36 37-48 49-60 61-72
Time in Repayment
Per
cent
Sea
sone
d0.0%
5.0%
10.0%
15.0%
20.0%
25.0%
Forb
eara
nce
%
Current Seasoning Current Forbearance
• Delinquency and forbearance are highest when loans enter repayment, and diminish as loans season
• As the trust loans season, delinquency and forbearance are expected to decline
September 2008 46
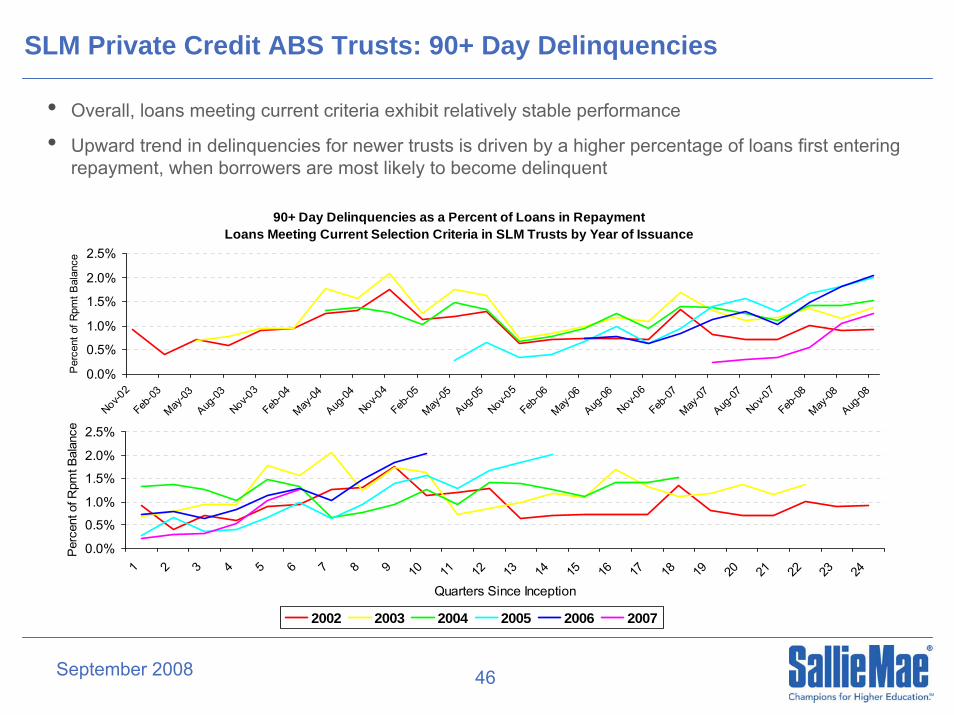
SLM Private Credit ABS Trusts: 90+ Day Delinquencies
• Overall, loans meeting current criteria exhibit relatively stable performance
• Upward trend in delinquencies for newer trusts is driven by a higher percentage of loans first entering repayment, when borrowers are most likely to become delinquent
90+ Day Delinquencies as a Percent of Loans in RepaymentLoans Meeting Current Selection Criteria in SLM Trusts by Year of Issuance
0.0%
0.5%
1.0%
1.5%
2.0%
2.5%
Nov-02
Feb-03
May-03
Aug-03
Nov-03
Feb-04
May-04
Aug-04
Nov-04
Feb-05
May-05
Aug-05
Nov-05
Feb-06
May-06
Aug-06
Nov-06
Feb-07
May-07
Aug-07
Nov-07
Feb-08
May-08
Aug-08
Per
cent
of R
pmt B
alan
ce
0.0%
0.5%
1.0%
1.5%
2.0%
2.5%
1 2 3 4 5 6 7 8 9 10 11 12 13 14 15 16 17 18 19 20 21 22 23 24
Quarters Since Inception
Per
cent
of R
pmt B
alan
ce
2002 2003 2004 2005 2006 2007
September 2008 47
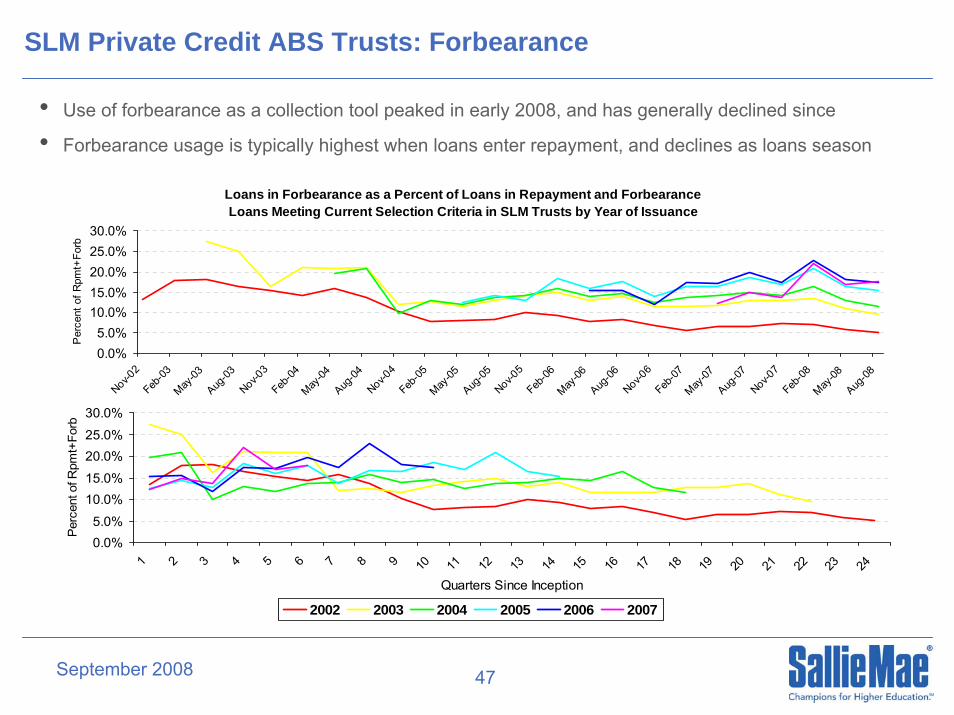
SLM Private Credit ABS Trusts: Forbearance
Loans in Forbearance as a Percent of Loans in Repayment and ForbearanceLoans Meeting Current Selection Criteria in SLM Trusts by Year of Issuance
0.0%5.0%
10.0%15.0%20.0%25.0%30.0%
Nov-02
Feb-03
May-03
Aug-03
Nov-03
Feb-04
May-04
Aug-04
Nov-04
Feb-05
May-05
Aug-05
Nov-05
Feb-06
May-06
Aug-06
Nov-06
Feb-07
May-07
Aug-07
Nov-07
Feb-08
May-08
Aug-08
Per
cent
of R
pmt+
Forb
0.0%5.0%
10.0%15.0%
20.0%25.0%
30.0%
1 2 3 4 5 6 7 8 9 10 11 12 13 14 15 16 17 18 19 20 21 22 23 24
Quarters Since Inception
Perc
ent o
f Rpm
t+Fo
rb
2002 2003 2004 2005 2006 2007
• Use of forbearance as a collection tool peaked in early 2008, and has generally declined since
• Forbearance usage is typically highest when loans enter repayment, and declines as loans season
September 2008 48
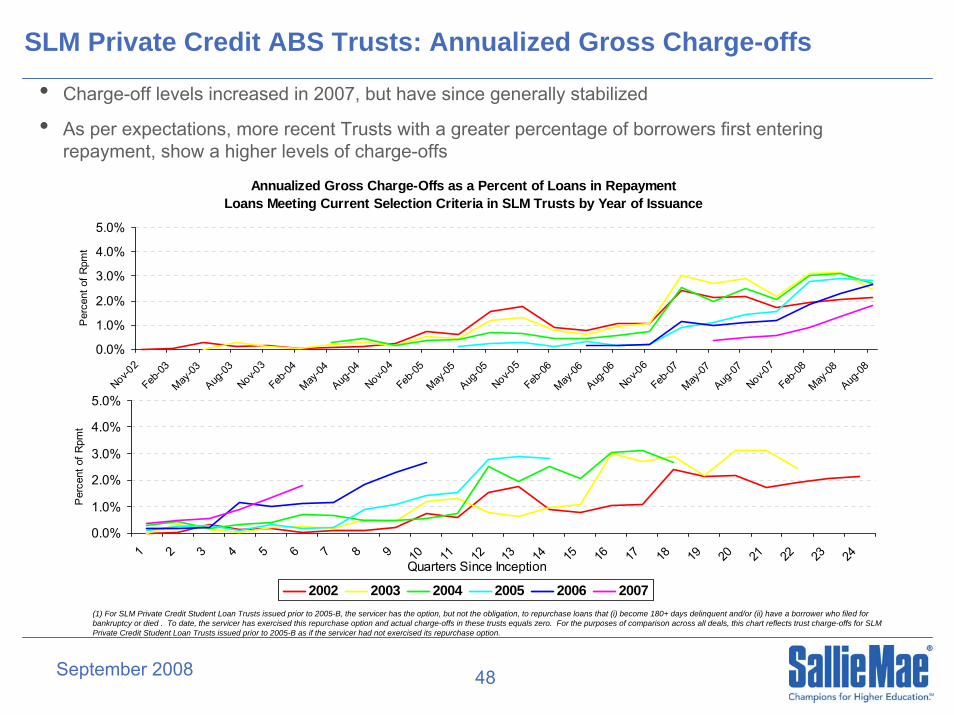
SLM Private Credit ABS Trusts: Annualized Gross Charge-offs
Annualized Gross Charge-Offs as a Percent of Loans in RepaymentLoans Meeting Current Selection Criteria in SLM Trusts by Year of Issuance
0.0%
1.0%
2.0%
3.0%
4.0%
5.0%
Nov-02
Feb-03
May-03
Aug-03
Nov-03
Feb-04
May-04
Aug-04
Nov-04
Feb-05
May-05
Aug-05
Nov-05
Feb-06
May-06
Aug-06
Nov-06
Feb-07
May-07
Aug-07
Nov-07
Feb-08
May-08
Aug-08
Per
cent
of R
pmt
0.0%
1.0%
2.0%
3.0%
4.0%
5.0%
1 2 3 4 5 6 7 8 9 10 11 12 13 14 15 16 17 18 19 20 21 22 23 24
Quarters Since Inception
Per
cent
of R
pmt
2002 2003 2004 2005 2006 2007(1) For SLM Private Credit Student Loan Trusts issued prior to 2005-B, the servicer has the option, but not the obligation, to repurchase loans that (i) become 180+ days delinquent and/or (ii) have a borrower who filed for bankruptcy or died . To date, the servicer has exercised this repurchase option and actual charge-offs in these trusts equals zero. For the purposes of comparison across all deals, this chart reflects trust charge-offs for SLM Private Credit Student Loan Trusts issued prior to 2005-B as if the servicer had not exercised its repurchase option.
• Charge-off levels increased in 2007, but have since generally stabilized
• As per expectations, more recent Trusts with a greater percentage of borrowers first entering repayment, show a higher levels of charge-offs
September 2008 49
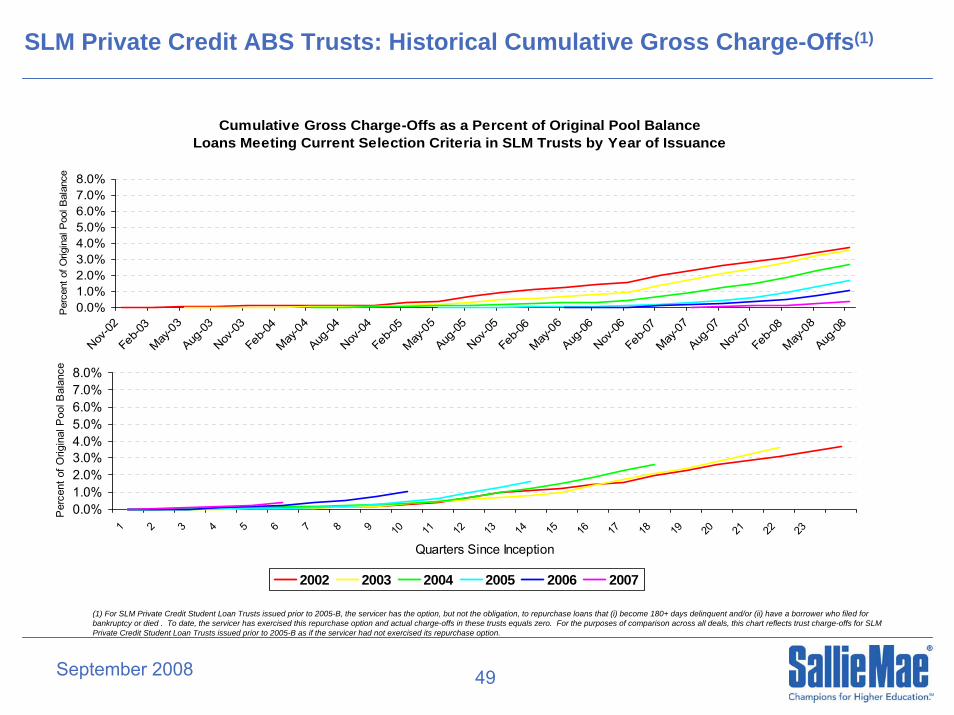
SLM Private Credit ABS Trusts: Historical Cumulative Gross Charge-Offs(1)
0.0%1.0%2.0%3.0%4.0%5.0%6.0%7.0%8.0%
1 2 3 4 5 6 7 8 9 10 11 12 13 14 15 16 17 18 19 20 21 22 23
Quarters Since Inception
Per
cent
of O
rigin
al P
ool B
alan
ce
2002 2003 2004 2005 2006 2007
Cumulative Gross Charge-Offs as a Percent of Original Pool BalanceLoans Meeting Current Selection Criteria in SLM Trusts by Year of Issuance
0.0%1.0%2.0%3.0%4.0%5.0%6.0%7.0%8.0%
Nov-02
Feb-0
3May
-03
Aug-03
Nov-03
Feb-0
4May
-04
Aug-04
Nov-04
Feb-0
5May
-05
Aug-05
Nov-05
Feb-0
6May
-06
Aug-06
Nov-06
Feb-0
7May
-07
Aug-07
Nov-07
Feb-0
8May
-08
Aug-08
Per
cent
of O
rigin
al P
ool B
alan
ce
(1) For SLM Private Credit Student Loan Trusts issued prior to 2005-B, the servicer has the option, but not the obligation, to repurchase loans that (i) become 180+ days delinquent and/or (ii) have a borrower who filed for bankruptcy or died . To date, the servicer has exercised this repurchase option and actual charge-offs in these trusts equals zero. For the purposes of comparison across all deals, this chart reflects trust charge-offs for SLM Private Credit Student Loan Trusts issued prior to 2005-B as if the servicer had not exercised its repurchase option.
September 2008 50
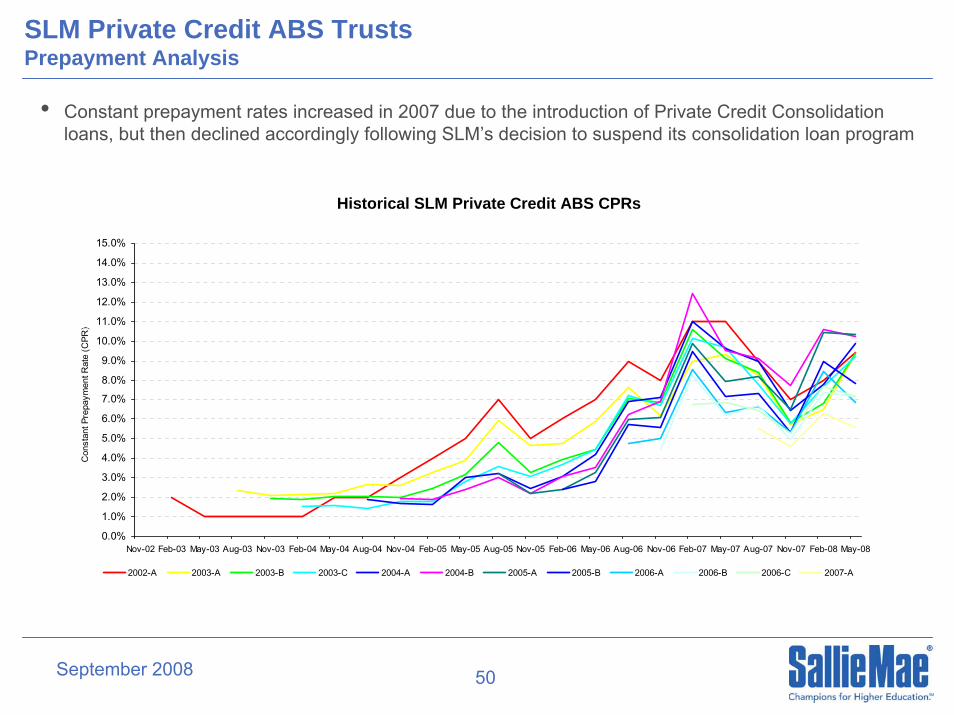
SLM Private Credit ABS TrustsPrepayment Analysis
Historical SLM Private Credit ABS CPRs
• Constant prepayment rates increased in 2007 due to the introduction of Private Credit Consolidation loans, but then declined accordingly following SLM’s decision to suspend its consolidation loan program
0.0%
1.0%
2.0%
3.0%
4.0%
5.0%
6.0%
7.0%
8.0%
9.0%
10.0%
11.0%
12.0%
13.0%
14.0%
15.0%
Nov-02 Feb-03 May-03 Aug-03 Nov-03 Feb-04 May-04 Aug-04 Nov-04 Feb-05 May-05 Aug-05 Nov-05 Feb-06 May-06 Aug-06 Nov-06 Feb-07 May-07 Aug-07 Nov-07 Feb-08 May-08
Con
stan
t Pre
paym
ent R
ate
(CPR
) ght
2002-A 2003-A 2003-B 2003-C 2004-A 2004-B 2005-A 2005-B 2006-A 2006-B 2006-C 2007-A
September 2008 51
Appendix C: SLM Private CreditManaged Portfolio Performance

52
SLM Private Credit Performance Data MethodologyLoans Meeting Current Selection Criteria
Methodology –
• Performance metrics are expressed relative to the balance of loans entering repayment (including capitalized interest from the school period)
• Performance is captured at the end of each quarter or year shown in the data; intra-month delinquencies and retroactive forbearances are not reflected
• Repayment cohorts are based on calendar years
• Timing of delinquency, forbearance, and default is based on the elapsed calendar time between the beginning of repayment and the period shown
• For the last period shown in each cohort, not all the underlying monthly cohorts have completed that full twelve month interval since they entered repayment. Partial periods are shown to provide the maximum amount of current information
53
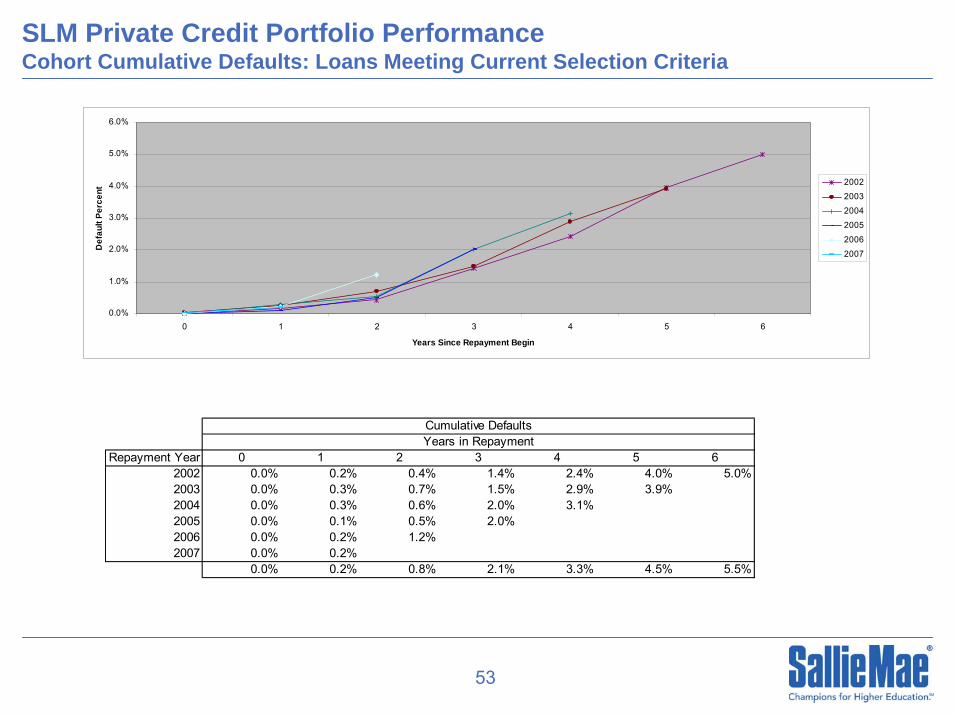
SLM Private Credit Portfolio PerformanceCohort Cumulative Defaults: Loans Meeting Current Selection Criteria
0.0%
1.0%
2.0%
3.0%
4.0%
5.0%
6.0%
0 1 2 3 4 5 6
Years Since Repayment Begin
Def
ault
Perc
ent 2002
2003
2004
2005
2006
2007
Repayment Year 0 1 2 3 4 5 62002 0.0% 0.2% 0.4% 1.4% 2.4% 4.0% 5.0%2003 0.0% 0.3% 0.7% 1.5% 2.9% 3.9%2004 0.0% 0.3% 0.6% 2.0% 3.1%2005 0.0% 0.1% 0.5% 2.0%2006 0.0% 0.2% 1.2%2007 0.0% 0.2%
0.0% 0.2% 0.8% 2.1% 3.3% 4.5% 5.5%
Cumulative DefaultsYears in Repayment
54
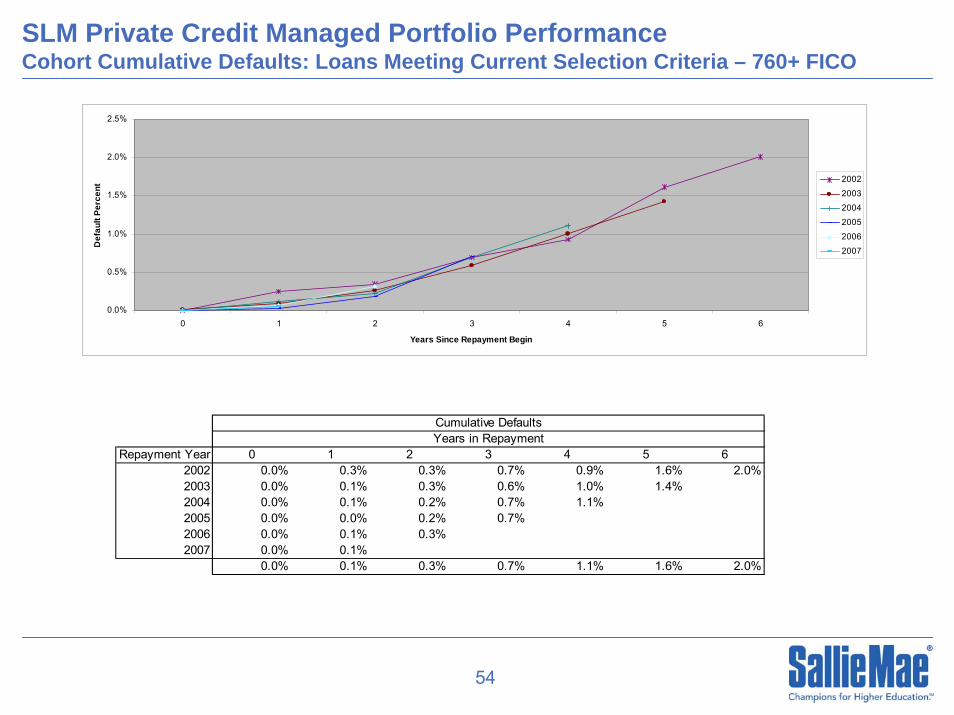
SLM Private Credit Managed Portfolio Performance Cohort Cumulative Defaults: Loans Meeting Current Selection Criteria – 760+ FICO
0.0%
0.5%
1.0%
1.5%
2.0%
2.5%
0 1 2 3 4 5 6
Years Since Repayment Begin
Def
ault
Perc
ent 2002
2003
2004
2005
2006
2007
Repayment Year 0 1 2 3 4 5 62002 0.0% 0.3% 0.3% 0.7% 0.9% 1.6% 2.0%2003 0.0% 0.1% 0.3% 0.6% 1.0% 1.4%2004 0.0% 0.1% 0.2% 0.7% 1.1%2005 0.0% 0.0% 0.2% 0.7%2006 0.0% 0.1% 0.3%2007 0.0% 0.1%
0.0% 0.1% 0.3% 0.7% 1.1% 1.6% 2.0%
Cumulative DefaultsYears in Repayment
55
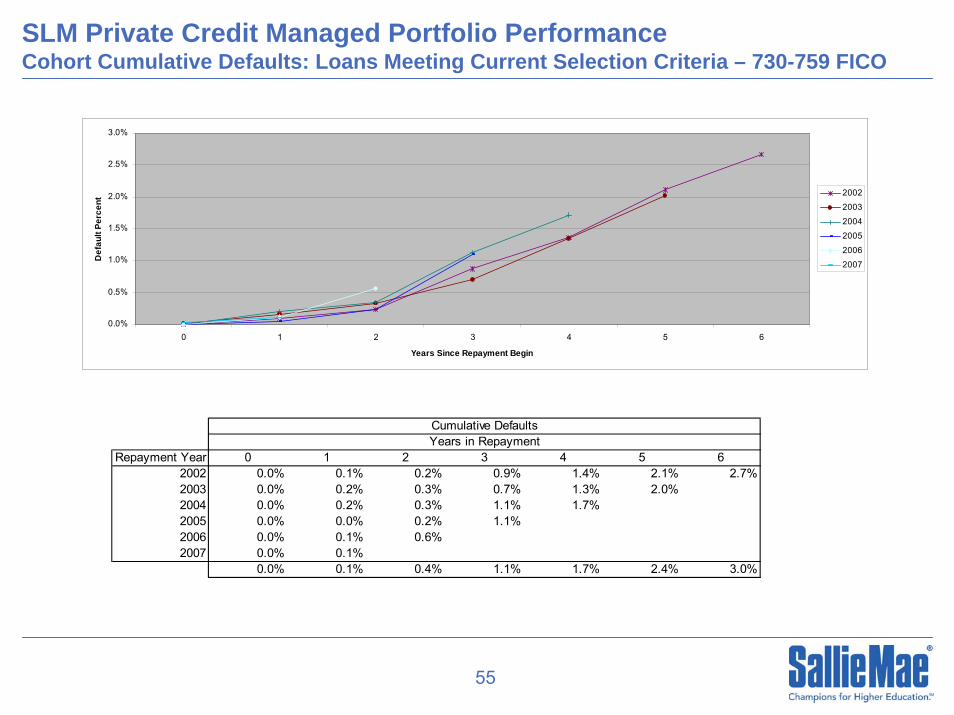
SLM Private Credit Managed Portfolio PerformanceCohort Cumulative Defaults: Loans Meeting Current Selection Criteria – 730-759 FICO
0.0%
0.5%
1.0%
1.5%
2.0%
2.5%
3.0%
0 1 2 3 4 5 6
Years Since Repayment Begin
Def
ault
Perc
ent 2002
2003
2004
2005
2006
2007
Repayment Year 0 1 2 3 4 5 62002 0.0% 0.1% 0.2% 0.9% 1.4% 2.1% 2.7%2003 0.0% 0.2% 0.3% 0.7% 1.3% 2.0%2004 0.0% 0.2% 0.3% 1.1% 1.7%2005 0.0% 0.0% 0.2% 1.1%2006 0.0% 0.1% 0.6%2007 0.0% 0.1%
0.0% 0.1% 0.4% 1.1% 1.7% 2.4% 3.0%
Cumulative DefaultsYears in Repayment
56
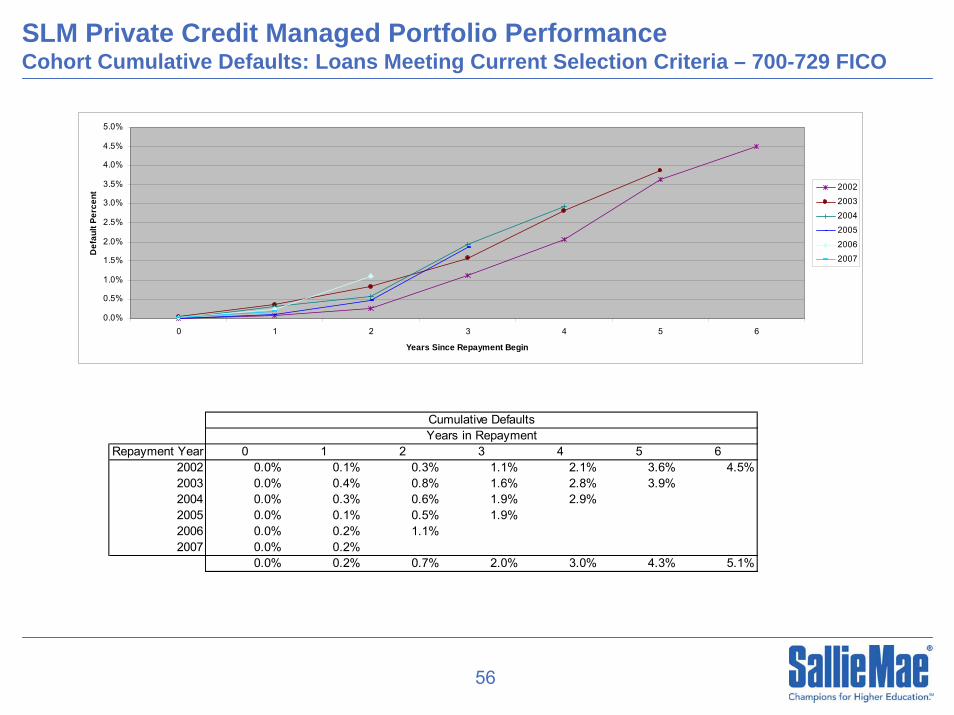
SLM Private Credit Managed Portfolio Performance Cohort Cumulative Defaults: Loans Meeting Current Selection Criteria – 700-729 FICO
0.0%
0.5%
1.0%
1.5%
2.0%
2.5%
3.0%
3.5%
4.0%
4.5%
5.0%
0 1 2 3 4 5 6
Years Since Repayment Begin
Def
ault
Perc
ent 2002
2003
2004
2005
2006
2007
Repayment Year 0 1 2 3 4 5 62002 0.0% 0.1% 0.3% 1.1% 2.1% 3.6% 4.5%2003 0.0% 0.4% 0.8% 1.6% 2.8% 3.9%2004 0.0% 0.3% 0.6% 1.9% 2.9%2005 0.0% 0.1% 0.5% 1.9%2006 0.0% 0.2% 1.1%2007 0.0% 0.2%
0.0% 0.2% 0.7% 2.0% 3.0% 4.3% 5.1%
Cumulative DefaultsYears in Repayment
57
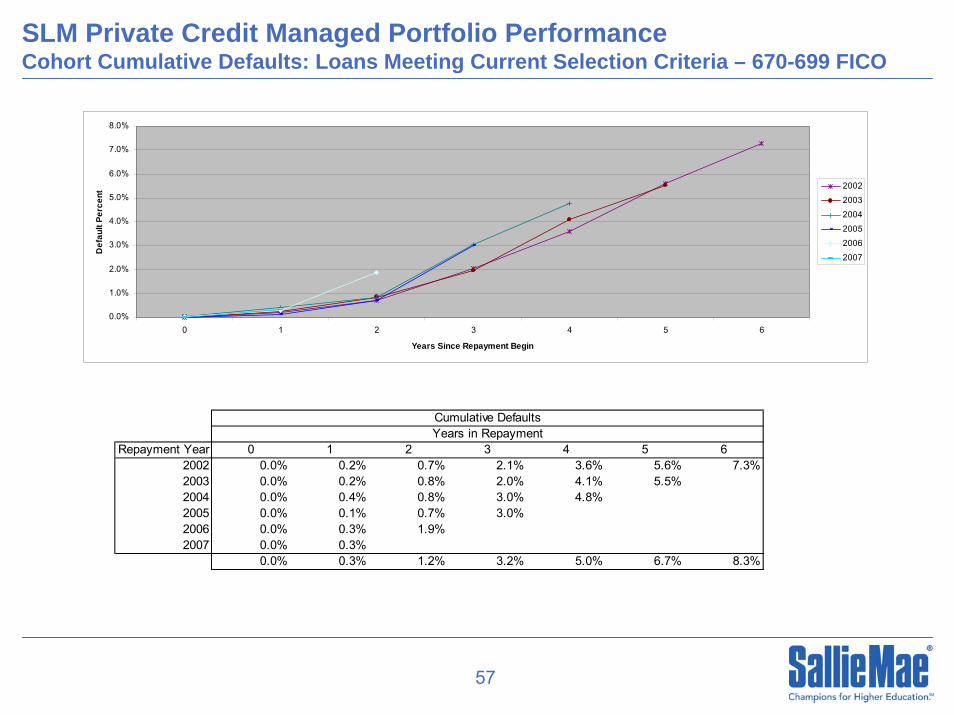
SLM Private Credit Managed Portfolio Performance Cohort Cumulative Defaults: Loans Meeting Current Selection Criteria – 670-699 FICO
0.0%
1.0%
2.0%
3.0%
4.0%
5.0%
6.0%
7.0%
8.0%
0 1 2 3 4 5 6
Years Since Repayment Begin
Def
ault
Perc
ent 2002
2003
2004
20052006
2007
Repayment Year 0 1 2 3 4 5 62002 0.0% 0.2% 0.7% 2.1% 3.6% 5.6% 7.3%2003 0.0% 0.2% 0.8% 2.0% 4.1% 5.5%2004 0.0% 0.4% 0.8% 3.0% 4.8%2005 0.0% 0.1% 0.7% 3.0%2006 0.0% 0.3% 1.9%2007 0.0% 0.3%
0.0% 0.3% 1.2% 3.2% 5.0% 6.7% 8.3%
Cumulative DefaultsYears in Repayment

58
SLM Private Credit Managed Portfolio PerformanceCohort Cumulative Defaults: Loans Meeting Current Selection Criteria – 640-669 FICO
0.0%
2.0%
4.0%
6.0%
8.0%
10.0%
12.0%
0 1 2 3 4 5 6
Years Since Repayment Begin
Def
ault
Perc
ent 2002
2003
2004
2005
2006
2007
Repayment Year 0 1 2 3 4 5 62002 0.0% 0.2% 0.7% 2.8% 5.0% 8.2% 10.2%2003 0.0% 0.5% 1.4% 3.1% 6.1% 8.0%2004 0.0% 0.5% 1.0% 4.0% 6.3%2005 0.0% 0.2% 1.0% 3.9%2006 0.0% 0.6% 2.8%2007 0.0% 0.5%
0.0% 0.4% 1.7% 4.4% 6.9% 9.2% 11.2%
Cumulative DefaultsYears in Repayment

September 2008 59
SLM Private Credit Managed Portfolio Performance (All Loans)Cumulative Cohort Recovery Rates
RECOVERIES MADE THROUGH DECEMBER 31, 2006PAYMENT RECOVERIES ONLY
YEARPAID 1 2 3 4 5 6 7 8 9 10 11 12 13 14 15 16 17 18 191988 0.4% 2.1% 4.5% 10.8% 18.1% 20.3% 23.5% 23.5% 23.5% 23.5% 23.5% 23.5% 23.5% 23.5% 23.5% 23.5% 23.5% 23.5% 23.5%1989 0.5% 3.8% 9.9% 11.0% 15.0% 16.3% 16.7% 16.8% 17.0% 17.1% 17.1% 17.1% 17.1% 17.3% 17.5% 18.0% 18.3% 18.3% 18.3%1990 0.3% 2.7% 5.0% 8.2% 11.2% 13.9% 16.7% 19.5% 22.0% 23.8% 27.5% 31.2% 33.1% 33.8% 35.6% 36.0% 36.9%1991 1.3% 5.5% 9.7% 12.7% 15.5% 17.2% 18.2% 20.5% 21.4% 22.2% 23.2% 25.2% 26.5% 28.4% 29.5% 29.8% 29.8%1992 1.7% 5.0% 6.9% 8.9% 10.4% 12.0% 13.7% 14.9% 16.8% 18.2% 20.2% 21.7% 23.0% 23.6% 23.7% 23.7%1993 2.5% 4.6% 6.6% 9.4% 11.1% 12.9% 14.7% 16.8% 18.5% 20.6% 23.3% 25.1% 26.3% 26.8% 26.8%1994 1.2% 4.2% 6.5% 8.9% 11.3% 13.1% 15.7% 17.3% 19.2% 21.1% 23.3% 25.0% 25.3% 25.3%1995 0.5% 2.4% 4.3% 6.1% 7.7% 9.6% 11.2% 12.6% 14.7% 16.9% 18.9% 19.4% 19.5%1996 1.4% 3.3% 4.9% 6.3% 8.0% 10.1% 12.8% 15.1% 18.8% 21.1% 22.5% 22.5%1997 1.6% 3.7% 5.7% 7.3% 9.0% 11.5% 14.5% 16.6% 18.3% 19.4% 19.5% 1998 1.6% 3.7% 5.8% 8.4% 10.6% 12.8% 14.6% 17.0% 17.8% 17.8% 1999 1.7% 4.1% 6.0% 8.3% 12.0% 14.6% 17.9% 18.7% 18.7% 2000 1.9% 5.4% 7.6% 10.8% 13.7% 15.4% 16.8% 17.0% 2001 1.0% 2.7% 5.1% 7.4% 10.0% 10.8% 10.9%2002 1.6% 3.2% 5.4% 7.1% 8.2% 8.2%2003 1.3% 4.1% 5.9% 7.2% 7.2%2004 1.1% 2.8% 3.8% 4.0%
RECOVERIES MADE BY YEAR AFTER CLAIM PAID
• Recovery data is based substantially on experience under HICA, a captive insurance subsidiary of SLM that collected and recovered defaulted loans until 2004, when HICA was dissolved and SLM began managing recoveries in-house
• Current expectations are that recovery efforts conducted by SLM will ultimately collect more than HICA, and that the timing of collections will be more front-loaded
Chargeoff $ 1 2 32005 93,241,266$ 3.2% 7.9% 12.5%2006 101,542,402$ 4.0% 7.4%2007 303,165,171$ 2.4%
ASSET PERFORMANCE GROUPP&I Recoveries through 6/30/2008

September 2008 60
Appendix D: SLM Corporation Update
September 2008 61
Sallie Mae Update
• DOE funding authority – extended through academic year 09/10 – assures profitability on new Stafford/PLUS loans, and eliminates funding need for this asset
• Term FFELP ABS market continues to provide funding, with $5.1B raised in August and $18.5B YTD
• ABCP program reduced by $6.3B, with outstandings to be reduced further by year end
• Access to unsecured debt markets re-established in June with a $2.5B issue
• Earnings, liquidity and portfolio performance remain strong in the current environment
• Private loan portfolio continues to perform well, with further enhancements to product design, underwriting and collections practices underway
• Access to deposit growth through Sallie Mae Bank begins November 2008
September 2008 6262
Traditional vs. Non-Traditional Private Loan Performance
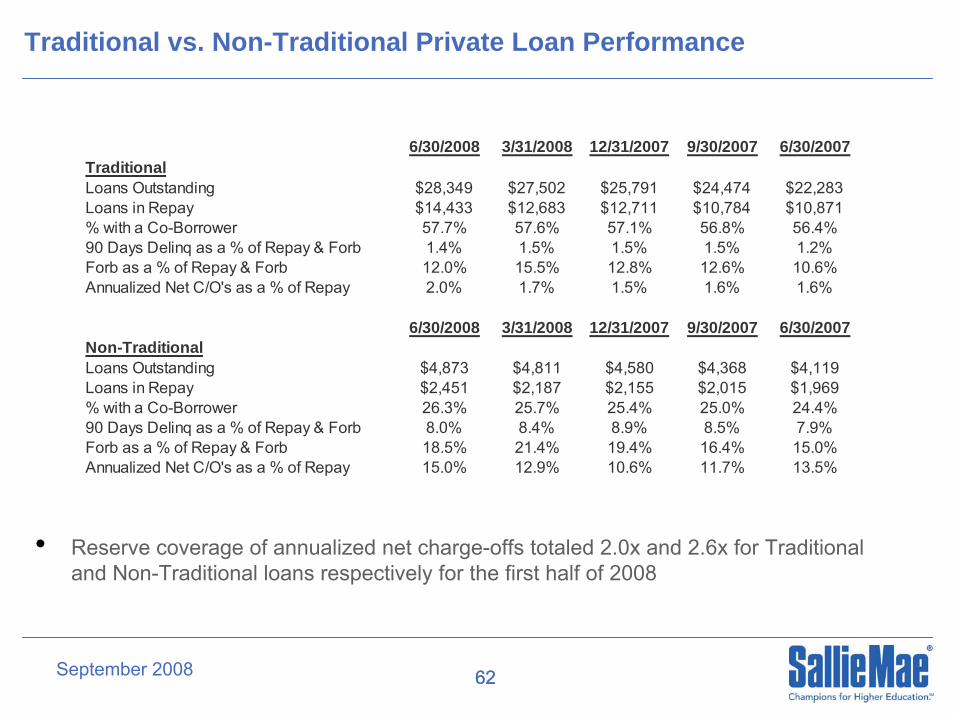
6/30/2008 3/31/2008 12/31/2007 9/30/2007 6/30/2007TraditionalLoans Outstanding $28,349 $27,502 $25,791 $24,474 $22,283Loans in Repay $14,433 $12,683 $12,711 $10,784 $10,871% with a Co-Borrower 57.7% 57.6% 57.1% 56.8% 56.4%90 Days Delinq as a % of Repay & Forb 1.4% 1.5% 1.5% 1.5% 1.2%Forb as a % of Repay & Forb 12.0% 15.5% 12.8% 12.6% 10.6%Annualized Net C/O's as a % of Repay 2.0% 1.7% 1.5% 1.6% 1.6%
6/30/2008 3/31/2008 12/31/2007 9/30/2007 6/30/2007Non-TraditionalLoans Outstanding $4,873 $4,811 $4,580 $4,368 $4,119Loans in Repay $2,451 $2,187 $2,155 $2,015 $1,969% with a Co-Borrower 26.3% 25.7% 25.4% 25.0% 24.4%90 Days Delinq as a % of Repay & Forb 8.0% 8.4% 8.9% 8.5% 7.9%Forb as a % of Repay & Forb 18.5% 21.4% 19.4% 16.4% 15.0%Annualized Net C/O's as a % of Repay 15.0% 12.9% 10.6% 11.7% 13.5%
• Reserve coverage of annualized net charge-offs totaled 2.0x and 2.6x for Traditional and Non-Traditional loans respectively for the first half of 2008

September 2008 63
1H 2008, 2007 and Full Year 2007, 2006 Earnings Summary
($ millions)1H
20081H
2007Full Year
2007Full Year
2006
$344
$8.4
$3.4
$140.8
$31.1
$171.9
18%
1.56%
$374
3.6%
$514
$678
$5,535
$440
2.1%
$8.1
$1,253
$16.0
$7.4
$119.5
$22.6
$142.1
16%
1.84%
$303
1.62%
$1,100
$1,253
$4,360
$3.5
$128.1
$25.1
$153.2
16%
1.72%
$445
3.4%
$583
$715
$5,348
1.8%
“Core Earnings” Net Income (1)
2.3%
$560
Stafford/PLUS Originations ($B) $17.3
Private Education Loan Originations ($B) $7.9
Managed FFELP Loans Outstanding ($B) $135.3
Managed Pvt Ed Loans Outstanding ($B) $28.3
Mgd Pvt Ed Loan % of Total Mgd Student Loans 17%
“Core Earnings” Loan Loss Provision $1,395
Managed Student Loan Portfolio ($B) $163.6
“Core Earnings” Private Loan NCOs as a % of Repay 3.07%
“Core Earnings” Fee and Other Income $1,173
Tangible Capital Ratio 2.0%
“Core Earnings” Operating Expenses $1,417
GAAP Stockholders’ Equity $5,224
“Core Earnings” Net Student Loan Spread (2) 1.67%
(1) GAAP Net Income for 1H 2008 was $162 million compared to GAAP Net Income of $1,082 million in 1H 2007. GAAP Net Loss for 2007 was $896 million compared to GAAP Net Income of $1,157 million in 2006.
(2) “Core Earnings” Net Student Loan Spread for 1H 2008 is before the impact of 2008 Asset-Backed Financing Facilities fees.
September 2008 64
“Core Earnings” Presentation
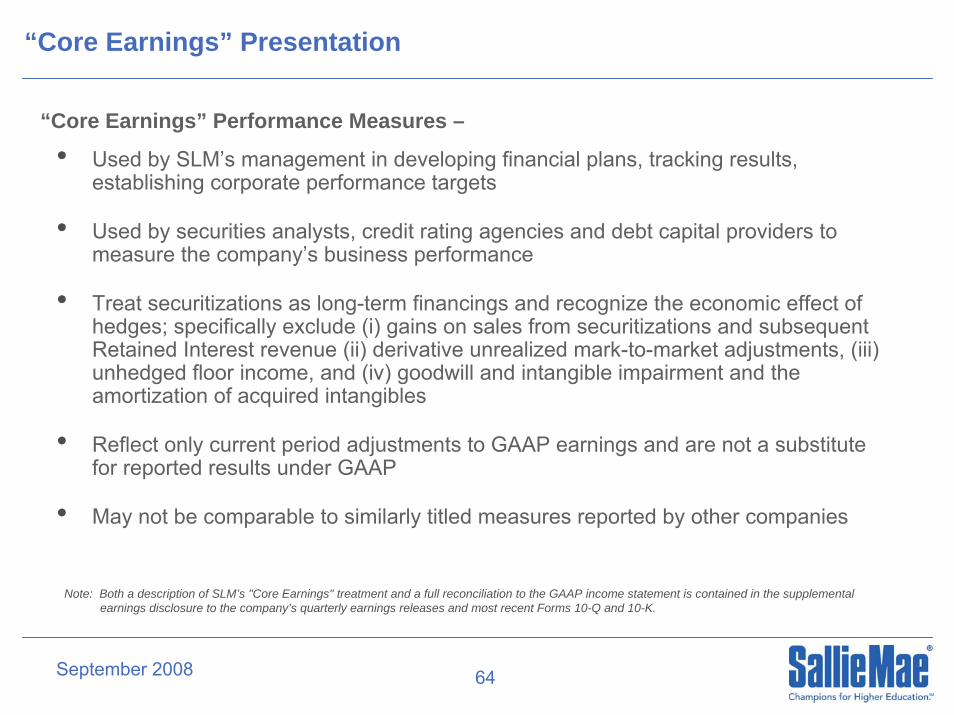
• Used by SLM’s management in developing financial plans, tracking results, establishing corporate performance targets
• Used by securities analysts, credit rating agencies and debt capital providers to measure the company’s business performance
• Treat securitizations as long-term financings and recognize the economic effect of hedges; specifically exclude (i) gains on sales from securitizations and subsequent Retained Interest revenue (ii) derivative unrealized mark-to-market adjustments, (iii) unhedged floor income, and (iv) goodwill and intangible impairment and the amortization of acquired intangibles
• Reflect only current period adjustments to GAAP earnings and are not a substitute for reported results under GAAP
• May not be comparable to similarly titled measures reported by other companies
Note: Both a description of SLM’s "Core Earnings" treatment and a full reconciliation to the GAAP income statement is contained in the supplemental earnings disclosure to the company’s quarterly earnings releases and most recent Forms 10-Q and 10-K.
“Core Earnings” Performance Measures –
September 2008 65
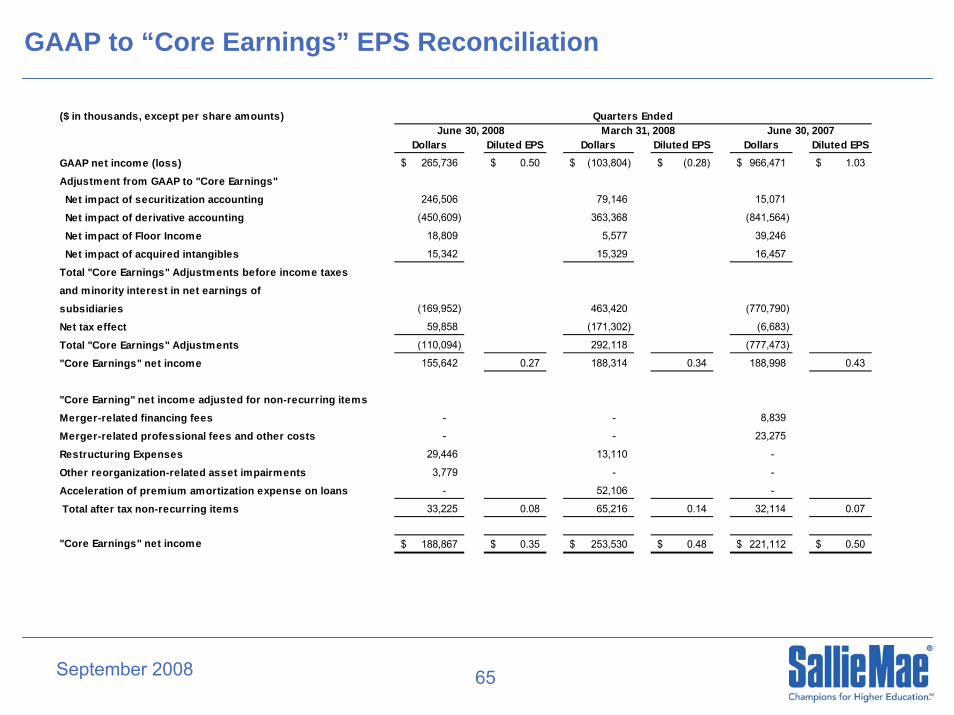
GAAP to “Core Earnings” EPS Reconciliation
($ in thousands, except per share amounts) Quarters EndedJune 30, 2008 March 31, 2008 June 30, 2007
Dollars Diluted EPS Dollars Diluted EPS Dollars Diluted EPSGAAP net income (loss) 265,736$ 0.50$ (103,804)$ (0.28)$ 966,471$ 1.03$
Adjustment from GAAP to "Core Earnings" Net impact of securitization accounting 246,506 79,146 15,071
Net impact of derivative accounting (450,609) 363,368 (841,564)
Net impact of Floor Income 18,809 5,577 39,246
Net impact of acquired intangibles 15,342 15,329 16,457
Total "Core Earnings" Adjustments before income taxesand minority interest in net earnings ofsubsidiaries (169,952) 463,420 (770,790)
Net tax effect 59,858 (171,302) (6,683)
Total "Core Earnings" Adjustments (110,094) 292,118 (777,473)
"Core Earnings" net income 155,642 0.27 188,314 0.34 188,998 0.43
"Core Earning" net income adjusted for non-recurring itemsMerger-related financing fees - - 8,839
Merger-related professional fees and other costs - - 23,275
Restructuring Expenses 29,446 13,110 -
Other reorganization-related asset impairments 3,779 - -
Acceleration of premium amortization expense on loans - 52,106 -
Total after tax non-recurring items 33,225 0.08 65,216 0.14 32,114 0.07
"Core Earnings" net income 188,867$ 0.35$ 253,530$ 0.48$ 221,112$ 0.50$