small area plan for neighborhood area 1
TRANSCRIPT

1
SMALL AREA PLAN FOR NEIGHBORHOOD AREA 1
6 AUGUST 2020

2
Acknowledgements
City of Fredericksburg City CouncilMary Katherine Greenlaw, MayorCharlie L. Frye, Jr., Vice Mayor
Kerry P. DevineTimothy P. Duffy
William C. Withers, Jr.Jason N. Graham Matthew J. Kelly
City of Fredericksburg Planning Commission Rene Rodriguez, Chair
Steven Slominski, Vice-ChairDavid DurhamKenneth Gantt Chris Hornung
Thomas O'Toole James M. Pates
City of Fredericksburg StaffTimothy Baroody, City ManagerKathleen Dooley, City Attorney
Charles Johnston, Director of Community Planning & BuildingMike Craig, Senior Planner
Susanna Finn, Community Development Planner Kate Schwartz, Historic Resources Planner

3
Introduction ------------------------------------------- p. 4
Process Summary ----------------------------------- p. 6
Existing Market Conditions ----------------------- p. 10
Transect p. 16
Transect Map p. 18
Regulating Plan p. 30
North End p. 32Central Area p. 40South End p. 42
Enhanced Mobility Plan ---------------------------- p. 52
Development Evaluation Criteria --------------- p. 62
Appendix
Market Assessment Transportation Fact Book
CONTENTS

4
INTRODUCTION
951
3
Neighborhood Area 1 Area 1 Central Park/Celebrate Virginia is located in Fredericksburg's northwestern-most corner. Annexed by the city in 1984, this planning area is located entirely west of I-95. One small part of Area 1 is located south of the Fredericksburg I-95 interchange with US Route 3 (Plank Road). The remaining 1,200 acres lie north of Route 3.
One of the largest planning areas in the city, Neighborhood 1 is bordered on the north and west by the scenic and cherished Rappahannock River, on the south and west by Spotsylvania County, and on the east entirely by I-95. Area 1 is accessed from the east by Fall Hill Avenue, Cowan Boulevard and US Route 3. Carl D. Silver Parkway provides the primary southern access point from Plank Road. Central Park Boulevard also intersects with Plank Road.
5
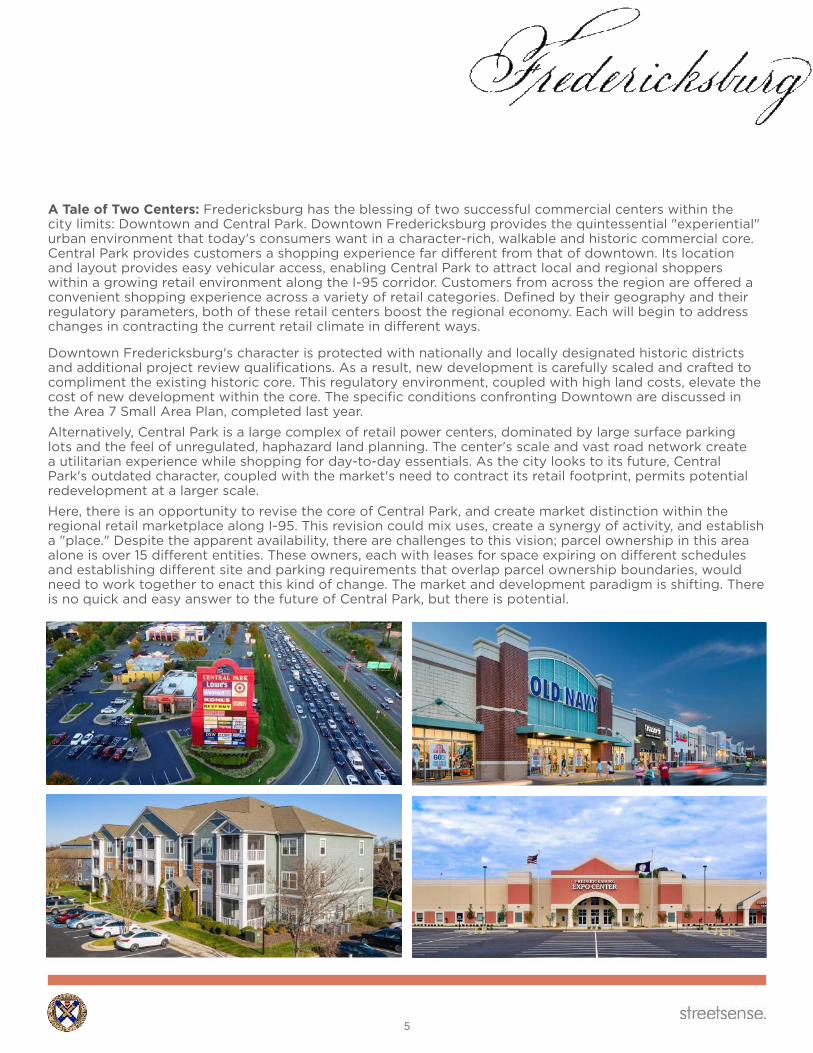
A Tale of Two Centers: Fredericksburg has the blessing of two successful commercial centers within the city limits: Downtown and Central Park. Downtown Fredericksburg provides the quintessential "experiential" urban environment that today's consumers want in a character-rich, walkable and historic commercial core. Central Park provides customers a shopping experience far different from that of downtown. Its location and layout provides easy vehicular access, enabling Central Park to attract local and regional shoppers within a growing retail environment along the I-95 corridor. Customers from across the region are offered a convenient shopping experience across a variety of retail categories. Defined by their geography and their regulatory parameters, both of these retail centers boost the regional economy. Each will begin to address changes in contracting the current retail climate in different ways.
Downtown Fredericksburg's character is protected with nationally and locally designated historic districts and additional project review qualifications. As a result, new development is carefully scaled and crafted to compliment the existing historic core. This regulatory environment, coupled with high land costs, elevate the cost of new development within the core. The specific conditions confronting Downtown are discussed in the Area 7 Small Area Plan, completed last year.
Alternatively, Central Park is a large complex of retail power centers, dominated by large surface parking lots and the feel of unregulated, haphazard land planning. The center's scale and vast road network create a utilitarian experience while shopping for day-to-day essentials. As the city looks to its future, Central Park's outdated character, coupled with the market's need to contract its retail footprint, permits potential redevelopment at a larger scale.
Here, there is an opportunity to revise the core of Central Park, and create market distinction within the regional retail marketplace along I-95. This revision could mix uses, create a synergy of activity, and establish a "place." Despite the apparent availability, there are challenges to this vision; parcel ownership in this area alone is over 15 different entities. These owners, each with leases for space expiring on different schedules and establishing different site and parking requirements that overlap parcel ownership boundaries, would need to work together to enact this kind of change. The market and development paradigm is shifting. There is no quick and easy answer to the future of Central Park, but there is potential.

6
The Area 1 planning process utilized strategies from the efforts completed for Areas 3, 6 and 7. Public outreach was an important part of this process and took two distinct directions for this effort, and intensive on-site workshop known as a charrette, as well as an online survey, both open to the public and widely advertised. This strategy combined local, public, on-site work with an intensive strategy structure between Streetsense, City planning staff, and government officials. The charrette (multi-day design workshop) was a public opportunity to address the area's issues, opportunities and concerns.
Neighborhood Charrette Community members, residents, and other stakeholders were invited to participate during a four-day design workshop held on-site within
a temporarily available storefront. The workshop kicked off with an informational meeting to share the goals and initial insights for Area 1. The public was invited to participate in this meeting and during open house hours throughout the workshop. Public input helps to shape the goals of the study, including suggestions on process, site access and overall livability.
The design team met with project stakeholders (property owners, their representatives, and their tenants) to gather their unique perspective regarding Area 1's challenges and potential for future growth. Initial thoughts were presented to the general public, and during work sessions with City Council and Planning Commission. Additionally these finding were shared with business owners and residents who came to the open houses. These meetings, combined with the results of the online survey and conversations with planning staff, provided project foundation and direction. These elements were shared in the final presentation, held on the final evening of the charrette. These results were graphically displayed and discussed at that meeting and attendees were asked to share their responses and reactions within the event.
Online Planning Survey Through an interactive process, the team solicited and gathered input to understand how the neighborhood views itself. Questions and responses allowed team members to understand planning issues that face their neighborhood – access and mobility, future development, open and public space, land use and community facilities, and environmental considerations.
Though Area 1 has few permanent residents and none of them responded to the survey, the survey responses received moved the project forward. Much of the city - and much of the region - shop or interact within some portion of Central Park and the rest of Area 1, and many of these non-residents offered valuable opinions.
Public Workshop
Small Area Planning: Area 1 - Process Summary

7
Summary Diagram The diagram at the left illustrates the culmination of the place mat input exercise, conversations at the charrette, and the results of the online survey. It attempts to summarize the multiple respondents' perception of Neighborhood Area 1.
Workshops with Planning Staff During the course of this effort, there were ongoing and frequent communications between the team and City Planning Staff. In addition to the public, on-site charrette, the team met for a series of work sessions at Streetsense offices in Bethesda, MD. These highly collaborative strategy sessions were extremely successful, providing content, input and feedback throughout the effort.
Work Sessions Mayor and City Council and Planning Commission The Team provided updates to Fredericksburg’s City Council, and the Planning Commission in order to present vision, goals and progress throughout the effort. These check-ins were focused on ensuring that City leadership could provide support for the effort and help redirect focus, as necessary. The City Council and Planning Commission were invited to special sessions during the charrette and kept appraised of progress by our team and city planning staff. Public Workshop Summary Diagram; Area 1

8
Development Character Zones within Area One
1: Retrofitting Suburbia by Ellen Dunham and June Willamson2: The Smart Growth Manual by Andres Duany, Jeff Speck and Mike Lydon
PUBLIC CHARRETTE PROCESS: Distilling the VisionOver the course of the project outreach and concept development, two seemingly distinct courses of action became one solidified plan.
First: to preserve, protect and ENHANCE the natural resource and splendor of the undisturbed slopes and banks along the Rappahannock River within Area 1.
Second: an identified approach to "retrofit" a 25 year old Central Park by using the RE strategies: RE-green, RE-develop, and RE-populate. These RE themes are introduced in a book "Retrofitting Suburbia"¹ as tools to guide the redevelopment of suburban areas toward more walkable, urban environments.
Throughout this effort, these RE strategies are employed and discussed at various scales, but as they are primarily tools to consider when looking specifically at already developed places, their application is limited. Their goals: RE-greening, RE-developing, and RE-populating are the essence of this effort, and the future of Area 1 lies in these strategies. It must also be said that realizing these strategies are largely dependent upon the private sector and the market forces they respond to.
After consideration of the base retrofitting elements, these strategies were combined with strategies from "The Smart Growth Manual"² to identify the final strategic course to develop the small area plan. Hence, the final charrette vision was built with a series of diagram elements portraying both sets of the ideas within.
The amalgamation of these two distinct-but-equal efforts culminated in the series of maps produced during the charrette. These maps are not the final product of the effort, but were the primary mechanism for defining the vision story for Area 1.
Key Charrette Process Elements and ChallengesInstead of looking at each potential development individually, the entire neighborhood area was evaluated for its successes and missteps. A series of recommendations were made based upon the current condition.
• Area 1 is one of two primary commercial areas in the city: Central Park provides regional, convenient shopping experience, where downtown Fredericksburg mingles shopping, eating and wandering with history.
• Area 1 contains some of the largest undeveloped parcels in the city.
• Consider a wholistic view: the market, the natural environment, and the current established patterns within all of Area 1, before suggesting the future "density construct."
• Though charrette participants expressed a desire for mixed-use with considerable density across redevelopment and new development in Area 1.
• Currently, the Fredericksburg market does not support that level of development.
• Recognizing the desire of city residents and regional residents to improve all aspects of walkability within the whole area - and Central Park specifically -
• Knowing that, mission is to identify where to prioritize development and redevelopment and suggest what form it may take.
• These diagrams illustrate where potential development density is best located: where it has the highest potential for success.

9
Applying the priorities to map the overall goals for Area 1 is a process of overlaying physical space data in a process called greenprinting. There are two steps: the first involving defining the open space, and then mapping that definition; and then establishing the pattern of development density.
FIRST PRIORITY : OPEN SPACEFirst: identify the environmentally sensitive and (already) protected land areas: slopes greater than 25%; conservation easements; SWM ponds; city-owned parcels, etc. This step is focussed on recognizing the value of natural environment and landform as a foundation for determining the appropriate geography of growth. With the potential for development pressure, is important to prioritize and consider sensitive open space areas first, to ensure its inclusion into the final document. The resulting map is known as the "greenprint."
Second : define and identify areas that connect protected areas to each other to create a logical boundary for open space. Together with this open space expansion, identify and map linkages, connections and access points. All of these elements are mapped to clarify for future approvals to strengthen natural connections and recognize that these areas are more valuable when continuous.
SECOND PRIORITY : DEVELOPMENT DENSITYWith critical open space areas defined, discuss and identify the current character of development and transportation framework, the market potential, and the character of the landscape as a whole. Based upon these considerations, refine and then define three clear, but inter-connected character areas within Area 1.
Third: Assign appropriate levels of development density as appropriate for each of the three zones, characterize the intentions for growth (the nature of its use or mix of uses), and pattern additions or adjustments that might facilitate ease of access for all.
The southern district at Rt 3 and I-95 interchange should be developed as the MOST dense. This area is most appropriate for new development and re-development. The middle zone is LESS dense than the southern section and provides a sort of transition, loosely between Cowan and Fall Hill. The northern area, along the Rappahannock River and north of Fall Hill should be the LEAST dense of the three areas.
As a visual tool, the team did illustrate what one of these areas, the southern, most-dense, most-diverse zone might look like (called the "Demonstration Plan" and included toward the rear of this document). This image will provide an illustrative context for some of the ideas presented and discussed within the charrette.
OPEN SPACE
DEVELOPMENT DENSITY

NEIGHBORHOOD AREA 1
EXISTING MARKET CONDITIONS
10
Area 1 (inclusive of Celebrate Virginia and Central Park), is home to all four real estate asset classes examined in the 2018 Citywide Market Analysis. The purpose of this document is to identify the amount of market appropriate development that is specifically generated within Area 1 for the residential, office, retail, and hospitality real estate uses.
PLEASE NOTE: An individual developer, development company, development team, institution, or non-profit’s willingness to build a project is not an indicator of market potential. Instead, this document is intended to offer guidance to the City of Fredericksburg regarding the real estate capacity of it’s neighborhoods – independently and collectively – to support the City’s overall
economic health (lower vacancies, sustainable rents, sales prices commensurate with income levels and projected increases, competitive rates relative to surrounding jurisdictions).
It is also important to note that land costs do not determine the market, nor necessary uses or amounts of development that are appropriate for a parcel of property. Rather, the market, government restrictions, and current lending practices do. Ideally, this should inform the land valuation of a particular parcel.
Residential The Citywide 2018 Market Analysis assesses both the for-sale product and rental units that are supported by the market. The major findings for the city are as follows, in each respective use:
The for-sale product will have to respond to approximately 619 new household formations over the next ten years (from 2018), assuming that rates of homeownership remain consistent. Approximately 563 additional homes under construction or approved will absorb some of this demand from the projected additional household formations. Many of the sales from the full calendar year (2017) preceding the market analysis study were existing homes rather than new construction. Considering the vacancy of single-family units, the number of homes on the market, and new units in the development pipeline, minimal short-term new development

11
EXISTING MARKET CONDITIONS
of for-sale units is recommended. New units may be able to successfully capture demand, but significant development in the next ten years will create conditions of oversupply and amplify conditions that burden existing homeowners.
Since 2013, asking rents in Fredericksburg’s multifamily apartment buildings have increased year-over-year. It is worth noting that of suburban Virginia’s 14 submarkets, Fredericksburg has the lowest average asking rents. Between 2018 and 2028, approximately 106 rental households will form annually, assuming that levels of home ownership and renters remain constant. Between 2018 and 2020, 720 apartment rental units were slated to come online. The rental units under construction at the time of study (this assessment has not considered any proposed units without permits) were expected to absorb Fredericksburg’s available demand for the next five years (to 2023). By 2028, the market will have demand for a total of approximately 461 additional rental units.
Area 1 Residential Site ConditionsThe potential for Area 1 to capture residential demand is a factor of its visibility, accessibility, and adjacencies that favor development or hinder potential. Within the sub market, momentum in multifamily development indicates that the access to major regional roadways (Interstate 95) is conducive for residential development. Other reasons to consider residential development in Area 1 include the large parcels of available land for development and the adjacencies to retail opportunities.
While development is possible in Area 1, city-wide demand is limited. Relieving city-wide residential development pressures in Area 1 lessens development pressure in more complicated residential redevelopment, such as infill and renovations within more traditional neighborhoods and historic districts.

NEIGHBORHOOD AREA 1
EXISTING MARKET CONDITIONS
12
Retail Under current market conditions, almost 2.5 million square feet of retail space is supported for the City of Fredericksburg by spending from local and regional customers. Area 1 has approximately 2.2 million square feet of retail-appropriate space and an estimated overhang of approximately 1.4 million square feet, contributing to a city-wide vacancy rate of the city of approximately 10% (as of 2018).
The 2018 study concluded that Area 1 can support 312,000 square feet of Neighborhood Goods and Services retail, 36,000 square feet of Food and Beverage, and 502,000 square feet of retail in the General Merchandise, Apparel, Furnishings, and Other category, for a total of 840,000 square feet under healthy economic conditions (sustainable retail sales per square foot).
Area 1 Retail Site Conditions
Central Park, where the largest concentration of the Area’s retail is located, has limited visibility from Interstate roadways. This retail is organized as super-regional, suburban, big box anchored shopping centers. Future designs in the land use plan should consider the co-tenanting and merchandizing mixes that support a clustered strategy. This plan must still be appropriate for a suburban market with vehicular-oriented customer base; however, a retail strategy should significantly differ from the offerings and environment at Potomac Mills or Spotsylvania Town Centre. Hotel, residential, and offices uses would allow Area 1 retail to build an adjacent customer base with a regular and reliable source of demand.
Recommended Area 1 Retail Programming An evolution of this shopping center that responds to the increasing competitiveness of traditional shopping centers north and south by highlighting points of market distinction can bring Area 1 into an equilibrium that supports the overall vision of the city as a place to live, work, visit, and play.

13
EXISTING MARKET CONDITIONS
Hospitality Occupancy levels above 65% typically indicate a healthy hotel market. At the time of the market study in 2018, hotel occupancy rates in Fredericksburg had recently reached 65%. A historical assessment of occupancy rates suggests that the market is stabilizing as the occupancy rate continue to rise, though Fredericksburg’s occupancy rate remained 8% less than the national average.
Area 1 Hospitality Site Conditions
Area 1 is well-positioned to capture hospitality demand based on the accessibility from the regional roadways. Travelers arriving by vehicle are the predominant visitor to the region, and regardless of whether they will arrive for leisure or business purposes (considering the new Stadium), they will require convenient accommodations. Additionally, projects intended to replace existing, aged hospitality offerings in the submarket would increase the demand opportunity for new product in Area 1, especially by 2024.
Recommended Area 1 Hospitality Programming Area 1 can capture replacement demand for hotel redevelopment and, following market stabilization of the hospitality industry, can accommodate approximately 200 additional hotel rooms without oversupplying the market.

NEIGHBORHOOD AREA 1
EXISTING MARKET CONDITIONS
14
Office The city’s recovering office market is limited by Fredericksburg vacancy rates, competitive clusters in neighboring jurisdictions, and the slow growth of office-generating employment industries; however, modest new office development may continue as the market absorbs, demolishes, and re-purposes the existing office inventory.
New, market-supportable demand for traditional office in the City was projected to stabilize in the next five years from the time of the study (2018-2023). The market assessment found that in Area 1, the office vacancy rate of 40% far surpassed the overall submarket’s vacancy rate. This percentage is indicative of the few available opportunities. Build-to-Suit office development may be favorable.
Site Conditions Private companies and corporations in search of an office location will outline specific criteria related to their site selection process; however, visibility and access to a major interstate is typically a high-priority consideration for most companies, especially in an urban/suburban market such as a Fredericksburg. Fredericksburg’s location along Interstate-95 is an advantage, further amplified by the Atlantic Gateway infrastructure project that will extend Express Lanes to Fredericksburg and add I-95 capacity across the Rappahannock River.
The Area is also able to actualize demand through development with few added development obstacles; such as parcel size and regulation. Fewer regulatory obstacles contribute to Area 1’s competitive advantage. Larger parcels, and river proximity also bring attention to potential development here.
However, limited access points to Interstate-95 and the remainder of the city, expansive parking fields, obscured retail facades, limited entryway visibility from highway and surrounding roadways, and “hidden” office clusters may increase the number of challenges for potential office development. As the real estate landscape becomes increasingly competitive, it is imperative to leverage these points of market distinction and competitive advantage while diffusing or mitigating any site conditions that may hinder development potential.
Recommended Programming In the next five years, Area 1 may capture additional Build-to-Suit or replacement demand.
It is not entirely certain how COVID-19 will impact land use or demand yet in the long run, but it increases the risk of real estate development for private sector players.

15

NEIGHBORHOOD AREA 1
TRANSECT MAP
16
The Transect Map and Regulating Plan are the core of the Small Area Plan for Area 1 and are the primary strategic and tactical tools created to guide new development, redevelopment and revitalization within Area 1. They reflect the desired modifications identified through discussions with stakeholders and the City to provide more specific guidance for Area 1’s evolution toward a more livable and sustainable place in the city.
The Transect Map (its origin is described on the following page) and is a demonstration of Area 1, divided into zones identified by their character, scale, and intensity of development. This reflection is simultaneously descriptive and prescriptive and particular to Fredericksburg.
A map of the Transect, and more detailed descriptions each zones' characteristics are shared on the following pages.
Regulating Plan The Regulating Plan is a map illustrating opportunity sites where improvements or modifications should be undertaken to improve the livability in each neighborhood. The Regulating Plan considers each Small Area as a whole, and helps the City officials and residents understand the physical locations and relationships of the needed considerations. The Regulating Plan evolves through investigation of the Area's sites and opportunities noted on the Regulating Plan are further described with the additional topical pages following the Regulating Plan, including:
Enhanced Mobility Access and mobility, in the form of traffic and congestion, different modes of mobility and their relative safety, and connectivity improvements are vital to neighborhood sustainability and livability. The most common and consistent complaints raised by residents and officials are that Area 1 is fully bisected by a major thoroughfare (Carl D. Silver Boulevard), lacks an intuitive street network, and is hostile to pedestrians. The Regulating Plan provides a concise range of recommendations to consider as goals to create a better situation for these roadways.
Improved Open Space Re-greening opportunities throughout include prioritizing nature as an attraction and maximizing the partially utilized open spaces to their fuller potential, starting with easy steps and growing the ideas from there. Options include: enlarging the protected buffer along the Rappahannock River; extending and adding to the existing trail network; and reclaiming, showcasing currently existing invisible within the developed areas, and consolidating open spaces within developed areas.
Retail Concentration An illustrative mechanism was created to suggest a vision for a redevelopment, an infill opportunity or a wholesale upgrade of the current condition. These illustrations suggests potential for mixing uses within Area 1, and creating an element of market distinction within the I-95 corridor of shopping opportunities. Area 1 has the strength of location and site recognition contributing to its retail and commercial potential.
Environmental Facilities Each Small Area Plan also considers the Environment – specifically around the subject of storm water. Opportunities exist, through combined efforts of revitalization, infrastructure improvement, and site redevelopment to create a healthier City. Included in the Regulating Plan are recommendations that reduce impervious surfaces, achieve storm water goals of quantity and quality, protect and enhance open spaces, and upgrade ageing infrastructure. Maps and high level recommendations are included in each Regulating Plan.

17
T-3
T-4
T-5
T-1
TRANSECT ZONES IN NEIGHBORHOOD 1
T-2
T-5C
WHAT IS THE TRANSECT? The diagram above denotes the Transect, an organizing framework used by planners to demonstrate the character of our physical environment. It is based upon the original organizing tool used by biologists to explain the natural biological phenomenon of habitat formation. Within the context of human settlement, the Transect is a framework that identifies a range of habitats, from the most natural to the most urban. Its continuum, when subdivided, lends itself to the creation of zoning categories.
These categories include standards that encourage diversity similar to that of organically evolved settlements. The standards overlap (they are parametric), reflecting the successional ecotones of natural and human communities. This Transect integrates environmental and zoning methodologies, enabling environmentalists to assess the design of social habitats from their perspective and likewise, urbanists to support the viability of natural ones. The Transect zones help to codify similarities in the built environment and direct more seamless transitions from one zone to another.
The chart above indicates how the Transect is calibrated specifically to Fredericksburg's Neighborhood Area 1.
SD
T-5max
Urban Transect Calibrated to Fredericksburg, Virginia

NEIGHBORHOOD AREA 1
TRANSECT MAP
18
T-5max
T-3
T-4
T-5c
T-2
KEY
T-1
SD
Civic
Bra
gg
Rd
Cowan Blvd
Fall Hill A
ve
Bra
gg
Rd
Route 3
Cowan Blvd
Carl D. S
ilver P
kwy
Carl D. S
ilver P
kwy

19
Transect Map for Neighborhood Area 1The Transect Map illustrates current settlement and commerce patterns, and directs the character and intensity of new development, infill development or redevelopment within Neighborhood Area 1. The Transect Map for Neighborhood Area 1 was developed after studying the existing and potential future built environment.
The Small Area Plan for Area 1 consists of seven hierarchical Transect Zones and a Special District:
T-1 contains preserved spaces or planned open space.
T-2 contains sparsely settled single family detached homes in woodlands and natural areas.
T-3 contains vacant land, and stable, mostly built, low- to medium-density residential neighborhoods to the north.
T-4 includes properties where higher intensity, residential development and/or mixed use developments provide a transition between purely residential zones and purely commercial zones or along busy arterials throughout Area 1.
T-5c includes properties in the southern zone with vehicular access from I-95, Rte 3 and Cowan Boulevard where convenience-dependent retail development is most appropriate and encouraged.
T-5max includes properties in the southern zone where increased density is encouraged. Densely developed blocks with little or no setbacks, continuously busy sidewalks , and opportunities for concentrated retail mixed with commercial and multi-family housing.
Special District contains primarily large-scaled entertainment venues for gatherings with overflow capacity and supporting uses.
On the following pages, each zone within the Transect is identified by its specific traits of general urban Character, Building Types, Frontages, Commercial Activity, Pedestrian Activity, Building Height, and type of Public Space, as well as the most appropriate Uses within each Transect Zone. These are the elements that are most responsible for the delivery of neighborhood character and move beyond the assumption that meeting the quantitative requirements of land use and zoning are enough to deliver a healthy human environment.

20
T-5c Core-Corridor Zone consists of higher density mixed uses to accommodate retail, offices, attached and multifamily housing, as well as typically auto-oriented commercial uses. Access and visibility are paramount to tenant success, but careful consideration must also be paid to the pedestrian environment.Blocks reflect an urban character with regular street trees and plazas.
Transect Zones - by Building Type Matrix
TRANSECT ZONES
In an effort to better explain the Transect and how it is used; the Transect Tool below diagrams how the Transect is applied to residential housing types:
T-5max Urban District consists of a high density of vertically integrated of uses to accommodate retail, office, and multifamily housing. Emphasis in this transect is on defining the public realm with building facades. Blocks should provide shared parking opportunities. Streets provide multimodal access.
T-4 General-Urban Zone consists of medium density in a vertical and horizontal mix of uses. May consist ofa wide range of building types: detached, semi-detached, and attached houses, small apartment buildings, as well as mixed use buildings and commercial structures. Setbacks and landscaping are variable. A tighter network of streets with curbs and sidewalks define medium-sized blocks.
The generalized Zone definitions below describe the elements typical urban character, calibrated to the particular conditions of Fredericksburg Neighborhoods 1: settlement pattern and density, residential makeup (form and type), thoroughfare types, and forms of open spaces. Civic Zones and T-1 (Natural) Zones are not included in this table, as they do not permit residential use.
T-2 Rural Zone consists of woodlands. Single family detached homes are sparsely settled in woodlands and natural areas.
T-3 Sub-Urban Zone consists of primarily low-to-medium-density residential areas with minimal mixed-density residential, and minimal commercial such as corner stores or live/work homes. Planting is a combination of regular and naturalistic. Setbacks are moderate and regular. Blocks are regular shaped. Most streets have curbs and sidewalks.

21
you shoul
Single-Family Detached
Cluster Home Mixed-Use Building
Commercial Building
Single-Family Attached
Apartment Building

22
This Civic Zone consists of public space and civic structures. The Civic Zone designation is focused on recognizing sites that include public institutions. Large scale changes are not intended or encouraged Limited future infill and reconstruction is allowed, but only in like kind. Improvements are focused on enhancing connectivity to other zones only.
CHARACTER Civic institutions of varying scales and building types
BUILDING TYPE Civic
FRONTAGE Park
COMMERCIAL ACTIVITY None
PEDESTRIAN ACTIVITY Moderate
BUILDING HEIGHT 1 -3 story maximum
PUBLIC SPACE Schoolyards, Parks and Squares
USE Civic use only; public activities
Civic Transect Zone
CivicB
rag
g R
d
Cowan Blvd
Fall Hill A
ve
Bra
gg
Rd
Route 3
Cowan Blvd
Carl D. S
ilver P
kwy
Carl D. S
ilver P
kwy
23
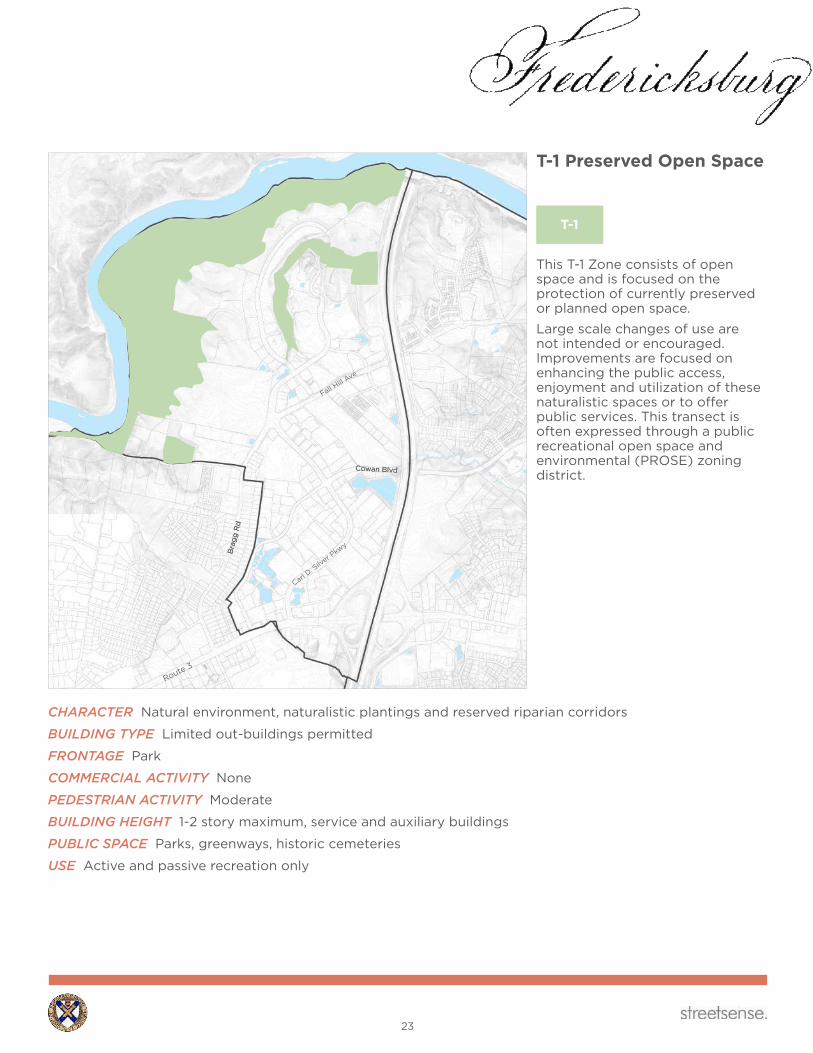
This T-1 Zone consists of open space and is focused on the protection of currently preserved or planned open space.
Large scale changes of use are not intended or encouraged. Improvements are focused on enhancing the public access, enjoyment and utilization of these naturalistic spaces or to offer public services. This transect is often expressed through a public recreational open space and environmental (PROSE) zoning district.
CHARACTER Natural environment, naturalistic plantings and reserved riparian corridors
BUILDING TYPE Limited out-buildings permitted
FRONTAGE Park
COMMERCIAL ACTIVITY None
PEDESTRIAN ACTIVITY Moderate
BUILDING HEIGHT 1-2 story maximum, service and auxiliary buildings
PUBLIC SPACE Parks, greenways, historic cemeteries
USE Active and passive recreation only
T-1 Preserved Open Space
T-1B
rag
g R
d
Cowan Blvd
Fall Hill A
ve
Bra
gg
Rd
Route 3
Cowan Blvd
Carl D. S
ilver P
kwy
Carl D. S
ilver P
kwy

NEIGHBORHOOD AREA 1
TRANSECT MAP
24
Rural Zone consists of woodlands. Single family detached homes are sparsely settled in woodlands and natural areas. The balance of the land shall be left in its natural state with limited clearing for lawns. Additional planting shall consist of native species requiring minimal irrigation, fertilization and maintenance. Buildings that cannot be connected to public utilities should only be permitted by special approval.
T-2 Sub-Urban Transect Zone
T-2
CHARACTER Sparsely settled single family detached homes on large lots in woodland and natural areas
BUILDING TYPE Single-family detached
FRONTAGE Vary
COMMERCIAL ACTIVITY None
PEDESTRIAN ACTIVITY Low
BUILDING HEIGHT 1 - 2 story maximum
PUBLIC SPACE Woodland, Natural Areas and Trails
USE Residential
Bra
gg
Rd
Cowan Blvd
Fall Hill A
ve
Bra
gg
Rd
Route 3
Cowan Blvd
Carl D. S
ilver P
kwy
Carl D. S
ilver P
kwy
25
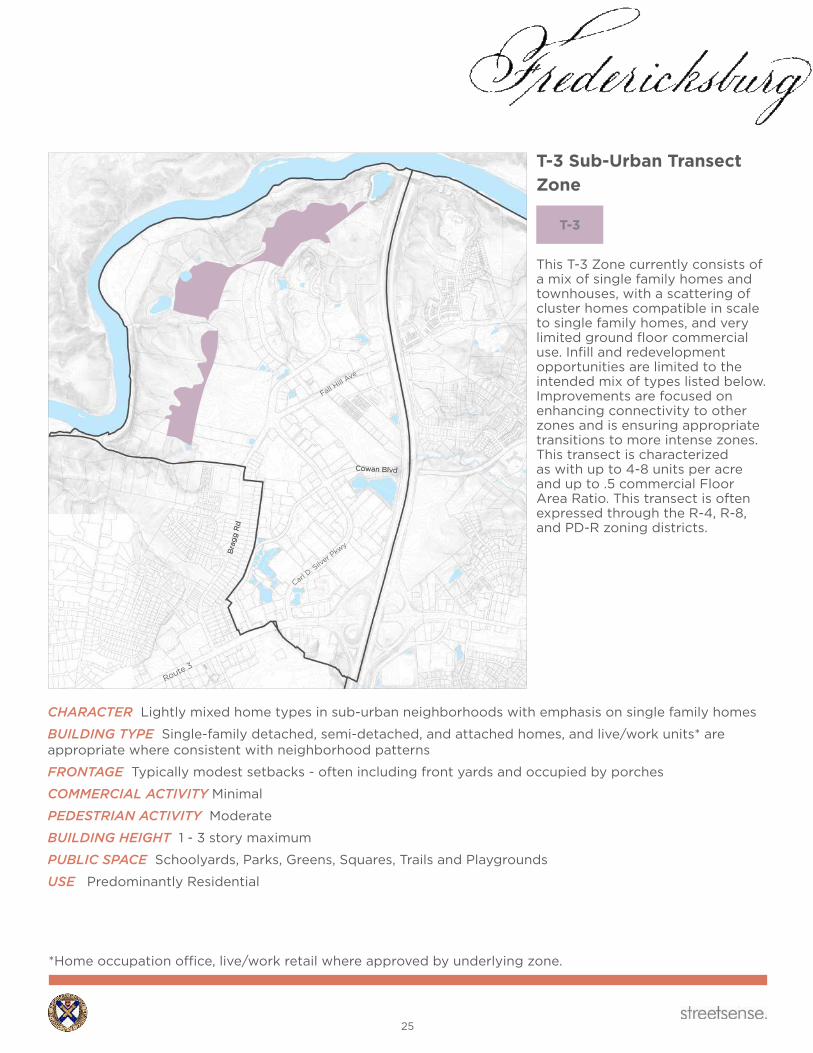
This T-3 Zone currently consists of a mix of single family homes and townhouses, with a scattering of cluster homes compatible in scale to single family homes, and very limited ground floor commercial use. Infill and redevelopment opportunities are limited to the intended mix of types listed below. Improvements are focused on enhancing connectivity to other zones and is ensuring appropriate transitions to more intense zones. This transect is characterized as with up to 4-8 units per acre and up to .5 commercial Floor Area Ratio. This transect is often expressed through the R-4, R-8, and PD-R zoning districts.
T-3 Sub-Urban Transect Zone
T-3
*Home occupation office, live/work retail where approved by underlying zone.
CHARACTER Lightly mixed home types in sub-urban neighborhoods with emphasis on single family homes
BUILDING TYPE Single-family detached, semi-detached, and attached homes, and live/work units* are appropriate where consistent with neighborhood patterns
FRONTAGE Typically modest setbacks - often including front yards and occupied by porches
COMMERCIAL ACTIVITY Minimal
PEDESTRIAN ACTIVITY Moderate
BUILDING HEIGHT 1 - 3 story maximum
PUBLIC SPACE Schoolyards, Parks, Greens, Squares, Trails and Playgrounds
USE Predominantly Residential
Bra
gg
Rd
Cowan Blvd
Fall Hill A
ve
Bra
gg
Rd
Route 3
Cowan Blvd
Carl D. S
ilver P
kwy
Carl D. S
ilver P
kwy

NEIGHBORHOOD AREA 1
TRANSECT MAP
26
T-4 zones exist with a horizontal mix of uses ranging from commercial property types, to attached and multi-family residential buildings. Mixed use developments are also appropriate in this zone. Improvements are focused on encouraging development, infill, and redevelopment in a sustainable, integrated, and walkable pattern. This transect is characterized as up to 8-16 units per acre with a commercial Floor Area Ratio of up to .5 to 1.0. This transect is often expressed through the R-8, R-12, PD-R, CT, CH, and PD-MU zoning districts.
T-4 General-Urban Transect Zone
T-4
CHARACTER Generous mix of uses at the ground level, mostly residential above and adjacent in an urban form
BUILDING TYPE Commercial buildings, attached and multifamily residential buildings, and multi-story mixed-use buildings permitted
FRONTAGE No setbacks required - buildings should shape public realm
COMMERCIAL ACTIVITY Medium to High
PEDESTRIAN ACTIVITY Medium to High
BUILDING HEIGHT 1-3 stories with 4 stories appropriate under special review; with taller buildings transitioning to lower buildings at borders of the T-3 zone. Buildings immediately adjacent to T-3e zones should be of a compatible height to existing neighborhood structures.
PUBLIC SPACE Streets, Squares, Greens, and Plazas
USE Mixed Commercial and Residential
Bra
gg
Rd
Cowan Blvd
Fall Hill A
ve
Bra
gg
Rd
Route 3
Cowan Blvd
Carl D. S
ilver P
kwy
Carl D. S
ilver P
kwy
27
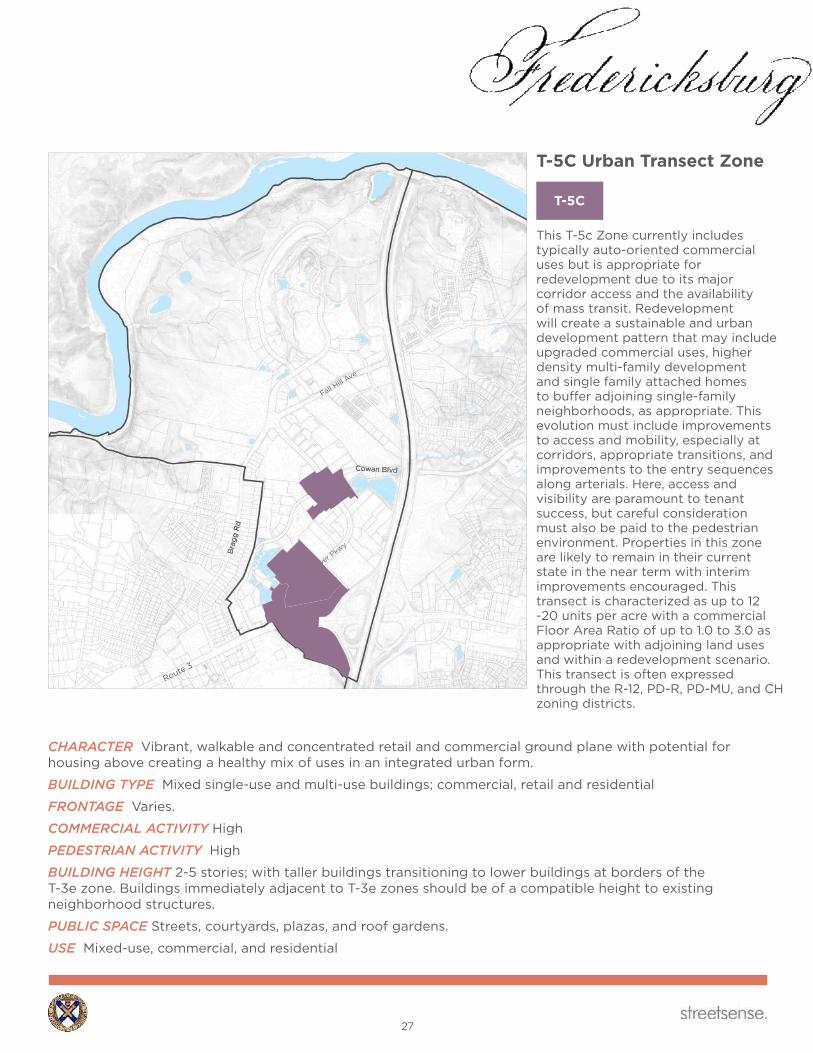
CHARACTER Vibrant, walkable and concentrated retail and commercial ground plane with potential for housing above creating a healthy mix of uses in an integrated urban form.
BUILDING TYPE Mixed single-use and multi-use buildings; commercial, retail and residential
FRONTAGE Varies.
COMMERCIAL ACTIVITY High
PEDESTRIAN ACTIVITY High
BUILDING HEIGHT 2-5 stories; with taller buildings transitioning to lower buildings at borders of the T-3e zone. Buildings immediately adjacent to T-3e zones should be of a compatible height to existing neighborhood structures.
PUBLIC SPACE Streets, courtyards, plazas, and roof gardens.
USE Mixed-use, commercial, and residential
T-5C Urban Transect Zone
T-5C
This T-5c Zone currently includes typically auto-oriented commercial uses but is appropriate for redevelopment due to its major corridor access and the availability of mass transit. Redevelopment will create a sustainable and urban development pattern that may include upgraded commercial uses, higher density multi-family development and single family attached homes to buffer adjoining single-family neighborhoods, as appropriate. This evolution must include improvements to access and mobility, especially at corridors, appropriate transitions, and improvements to the entry sequences along arterials. Here, access and visibility are paramount to tenant success, but careful consideration must also be paid to the pedestrian environment. Properties in this zone are likely to remain in their current state in the near term with interim improvements encouraged. This transect is characterized as up to 12 -20 units per acre with a commercial Floor Area Ratio of up to 1.0 to 3.0 as appropriate with adjoining land uses and within a redevelopment scenario. This transect is often expressed through the R-12, PD-R, PD-MU, and CH zoning districts.
Bra
gg
Rd
Cowan Blvd
Fall Hill A
ve
Bra
gg
Rd
Route 3
Cowan Blvd
Carl D. S
ilver P
kwy
Carl D. S
ilver P
kwy

NEIGHBORHOOD AREA 1
TRANSECT MAP
28
T-5max Urban Transect Zone
T-5max
CHARACTER A balanced, high-density, vertically mixed urban environment with improved transit options and complete pedestrian infrastructure and occupiable open spaces.
BUILDING TYPE Mixed single-use and multi-use buildings; commercial, and retail. Residential uses should be prioritized in vertically mixed-use buildings.
FRONTAGE Minimal setbacks with wide sidewalks and canopy street trees, abundance of entryways fronting onto the street/sidewalks.
COMMERCIAL ACTIVITY High
PEDESTRIAN ACTIVITY High
BUILDING HEIGHT 4 - 8 stories
PUBLIC SPACE Streets, courtyards, plazas, squares, and roof gardens
USE Mixed-use, but predominately commercial on the ground floor
The T-5max Zone identifies Fredericksburg's regional commercial district, located near the intersection of Interstate 95 and US Route 3, which are the City's most traveled roadways.
Concentrated development must be accompanied by transportation options that reduce the vehicular volume within the district. Public transit combined with an integrated pedestrian and cycling network with open space providing points of focus throughout.
Building frontage compliments and enhances streetscapes with minimal setbacks with wide sidewalks with street trees planted for shade.
Density expectations for residential, commercial, and mixed-use development will be determined by proposed development plans. The Transect is expressed through the PD-C and PD-MU zoning districts. New planned districts should be constructed of the elements that have been established in the City's Form Based Codes.
Bra
gg
Rd
Cowan Blvd
Fall Hill A
ve
Bra
gg
Rd
Route 3
Cowan Blvd
Carl D. S
ilver P
kwy
Carl D. S
ilver P
kwy

29
CHARACTER Large open air or interim venues for gatherings with overflow capacity
BUILDING TYPE Entertainment Venues and supportive uses
FRONTAGE No Setbacks
COMMERCIAL ACTIVITY Moderate
PEDESTRIAN ACTIVITY Moderate
BUILDING HEIGHT Variable
PUBLIC SPACE Streets, plazas, squares and roof gardens
USE Predominantly commercial entertainment, tourism, and recreational activities
S-D Special District
SD
Special District consists of areas with buildings that by their function, disposition,or configuration cannot conform to one of the six normative transect zones. It is designated to meet community needs whenever the uses are not applicable in the transect zones. In this area, large-scaled entertainment venues and associated visitor facilities: hotels, visitor centers, and restaurants are considered. Buildings and spaces for assembly shall be sited within close proximity to each other - as an integrated whole, rather than sparse across the area and separated by large parking fields. Parking requirements should be minimized and shared wherever possible.
Bra
gg
Rd
Cowan Blvd
Fall Hill A
ve
Bra
gg
Rd
Route 3
Cowan Blvd
Carl D. S
ilver P
kwy
Carl D. S
ilver P
kwy
30
NEIGHBORHOOD AREA 1
REGULATING PLAN
KEY
Potential Gateway
Required Pump Station
Existing Trail
Proposed Trail
Intersection Improvement
Riverfront HUB
Lake Area Enhancements
Existing Roads
Road Extension
Upgrade Drive Aisles to Roadways
Future I-95 Interchange
Possible On/Off-Ramp

31
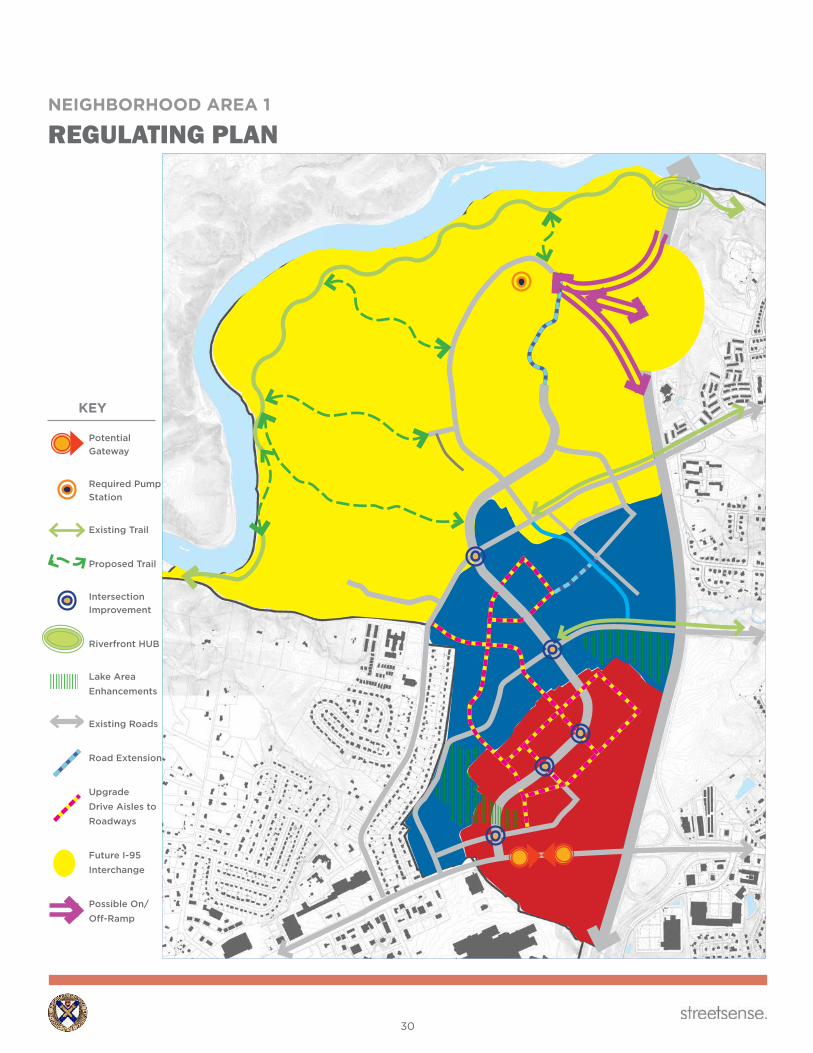
Neighborhood Area 1 Regulating Plan For the purposes of clarity, Neighborhood Area 1 has been divided 1 into three clarified character areas, identified with three zones - North End, Central Area and South End. Each zone's general character is described, and specific challenges are identified.
Recommended solutions and considerations for their future adaptation to improve each zone are included on the following pages, specific to their zone: North; Central; and South. These changes include open space, land use and mobility improvements.
North End in its current state, is largely undeveloped, with additional multifamily residential and a new baseball stadium under construction, some existing commercial uses, including a large, regional grocer, Expo center, and hotels. This north end also consists open space along nearly two and a half miles of the Rappahannock River frontage, currently used for hiking and mountain biking trails. Most of this frontage is permanently preserved.
Central Area primarily consisting of retail and auto-centric commercial uses, such as gas stations and drive thru facilities. Recent additions to the area include car dealerships, and multifamily and attached housing between Cowan and Fall Hill Avenue, bringing a larger number of residents to the neighborhood and completing an emerging grid of public and private streets. This area is dominated by suburban strip-center retail with significant land area covered in surface parking lots. The area lacks organizational clarity, compounded by a single, large road running through it rather than a hierarchical circulation network. Sidewalks are present in some places, but the area is dominated with vehicular accommodation.
South End currently consisting of retail space, mainly made up of big and medium-box retail anchors within a suburban strip-center configuration with significant land area covered in surface parking lots. The area lacks organizational clarity, compounded by a single, large road running through it rather than a hierarchical circulation network. Scattered stormwater management ponds and environmental preserve areas are embedded within parking areas and behind the large retail stores.
NORTH
CENTRAL
SOUTH

32
NEIGHBORHOOD AREA 1
REGULATING PLAN : NORTH END
KEY
Potential Gateway
Required Pump Station
Existing Trail
Proposed Trail
Intersection Improvement
Riverfront HUB
Lake Area Enhancements
Existing Roads
Road Extension
Upgrade Drive Aisles to Roadways
Future I-95 Interchange
Possible On/Off-Ramp
NORTH
CENTRAL
SOUTH

33
GENERAL CHARACTEROnce part of a master plan known as "Celebrate Virginia," the vision for North End of Area 1 was approved as a tourism 'outpost' for Fredericksburg. Today the area is home to a regional expo center, an outdoor concert venue, a Wegman's grocery and few hotels, as well as some multifamily apartments and other smaller commercial uses. This is also the site of the new Fredericksburg National's baseball stadium.
The remainder of the Celebrate Virginia property is undeveloped, including land adjacent to nearly two and a half miles of Rappahannock River frontage, currently used for hiking and mountain biking trails. Most of the property bordering the river is owned by the city or protected by conservation easements. Local trails advocates have been building hiking and mountain biking trails throughout this area and are interested in continuing their efforts as well as promoting the trails to others throughout the City.
THE CHALLENGES The riverfront and its adjacent open spaces are hidden treasures within Area 1 with limited public access or acknowledgement. Likewise, mature waterways and beautiful lakes as part of the storm water system are hidden and neglected instead of embraced for their potential. Existing hiking and biking trails along the waterfront do not connect directly into the Area 1 thoroughfare network.
THE SOLUTIONS • A fully connected trail system could benefit multiple modes of transport. There is an opportunity to
enhance the Fredericksburg Quarry and program it to encourage public use and natural exploration/interaction along the northern edge of Area 1.
• Promote awareness of the riverfront as an important asset of the city, improve access while protecting the history and heritage through responsible partnerships, and provide additional opportunities for recreation along riverfront.
• Feasibility of future I-95 interchange or exit ramps
• Extension of Carl D. Silver Parkway to connect to Gordon W. Shelton Boulevard
• Pedestrian and bicycle connections to provide access to trails along the river
• Multi-modal inter-connectivity between parcels as development occursMO
BIL
ITY
SPE
CIF
IC

34
NEIGHBORHOOD AREA 1
REGULATING PLAN : NORTH END
OVERLOOK/BOARDWALK/BOAT LUNCH/SHELTERS
PARKINGFREDERICKSBURG QUARRY
FREDERICKSBURG EXPO AND CONFERENCE CENTER
BASEBFIELD
VIRGINIA WELCOME CENTER
PARKING
FALL HILL AVENUE
NORTH END OPEN SPACE STRATEGY

35
BALL DS
COMMUNITY BUILDING OUTSIDEThe riverfront open space in Area 1 is an as-yet unrealized opportunity to complete the link from the reservoir to City Dock Park within Fredericksburg. This area could be the keystone in the arc of active trail within the city. Considerable adjacency to the Rappahannock River and the open spaces and trails systems along its length provides for a physical connection, a stronger community identity, and a place to celebrate a whole host of city events despite the steep slopes between the river and the developable land above. The I-95 bridge construction project has offered Fredericksburg an incredible and valuable addition of an access road to the area from Wicklow Drive and Quarry Road, and a cleared and reinforced area that will transition into a hub of activity along this frontage. It is uniquely positioned to provide connections to a variety of natural resources found nowhere else in the region.
Areas along the Rappahannook River can be enhanced with targeted improvements that upgrade existing open spaces, and provide greater access and use to the existing natural and scenic resources of the City. Proposed updates should support a stronger connection to natural water systems, embrace the historic events of this area, and concentrate improvements among open spaces where functions can be shared, and compliment those amenities already in place.
The open space is large and flexible enough to provide gathering spaces for small informal groups to hosting large community events. And it is a place to celebrate the site’s historical significance, cultural importance, unique flora and fauna. The conceptual design themes are: CONNECT + COMMUNITY + CELEBRATE. These themes provide a structural foundation to embrace and integrate major programming elements.
Programming Open space along the river is a generator for a range of major programs including – Science & Education, Art & History, Fitness & Play, Nature, Community & Culture. Each of these programs will provide unique opportunities to draw in users of all ages and cultures. These major program themes are to provide a guide in the decision making process. The precedent images are to inspire what the possibilities that can be found on site. They will help inform the community about the enormous potential this site has within the open spaces currently available.

36
NEIGHBORHOOD AREA 1
REGULATING PLAN : NORTH END
WATERFRONT ACCESS HUBThe value of the riverfront and the open space opportunities within Area 1 were discussed at length leading up to, and during the project design charrette. Also during subsequent work sessions with city staff, where similar to discussions regarding downtown, Fredericksburg's waterfront along the Rappahannock River presents significant value to the City as a whole. Consideration for this waterfront is a main part of the open space opportunities that are present within the small area plan for Area 1.
Access to the riverfront is the priority. The riverfront is an invaluable resource with an enormous potential to bring the citizens together along a common spine. The riverfront in Area 1 is rich with history and immeasurable natural beauty, but remains an undiscoverable asset.
Additional to the waterfront possibilities, open space improvements to consider in Area 1 are multi-faceted. From the small improvements of improving the streetscapes and planting trees where possible, to the potential re-use of the space between and around lakes and ponds within Central Park, and area-wide considerations to connect all of these elements along trails that provide potential links throughout. Ideally, these connective bodies will support multiple modes of transport: trails, parkways, greenways, and bikeways. At this scale, integrating transport modes with open space connections can affect real change.
Area-wide mapping of open space elements establishes a framework of open space potential to establish a goal. This mapping technique is called a "greenprint" like a "footprint" map that may indicate locations of the built environment.
Next, connective pathways are identified and tested for plausibility. Once these links are conceptually located, elements within the framework are tested for potential.
Connections throughout Area 1 would provide multiple opportunities to access public open spaces, and provide open space experiences on their own. Extensive hiking and mountain biking trails exist along the waters edge and within the river's natural buffer, but there is insufficient physical access to these trails and limited public attention to the area.
NORTH END OPEN SPACE STRATEGY

37
By reclaiming the staging area for the I-95 bridge repairs, Fredericksburg can establish a trail-head HUB for riverfront access. Access to the HUB will come from Sunshine Ballpark (located within Area 2) and proceed down the staging access road to an area beneath the bridge itself.
The clearing below the I-95 bridge, created from the bridge construction project, will provide the HUB, with area for parking, immediate access to the extensive waterfront trail network, both walking and biking trails, heading west toward Spotsylvania County and Motts Run Reservoir, and east toward downtown. This HUB is adjacent to the Fredericksburg Quarry, and together, these elements create an atmosphere that could become a the a community icon, with the potential for all kinds of activities that could be staged in or from this location.
Direct river access is also possible here. Also, there is a real opportunity to build a pedestrian crossing beneath the existing I-95 bridge supports, similar to Richmond's Belle Isle bridge, (pictured at left) to connect to Stafford County's burgeoning trail system.
QUARRY
RAPPAHANNOCK RIVER
waterfront HUB
NORTH END OPEN SPACE STRATEGY

38
NEIGHBORHOOD AREA 1
REGULATING PLAN : NORTH END
NATURE
SCIENCE and EDUCATION
COMMUNITY and CULTURE
NORTH END OPEN SPACE STRATEGY
39
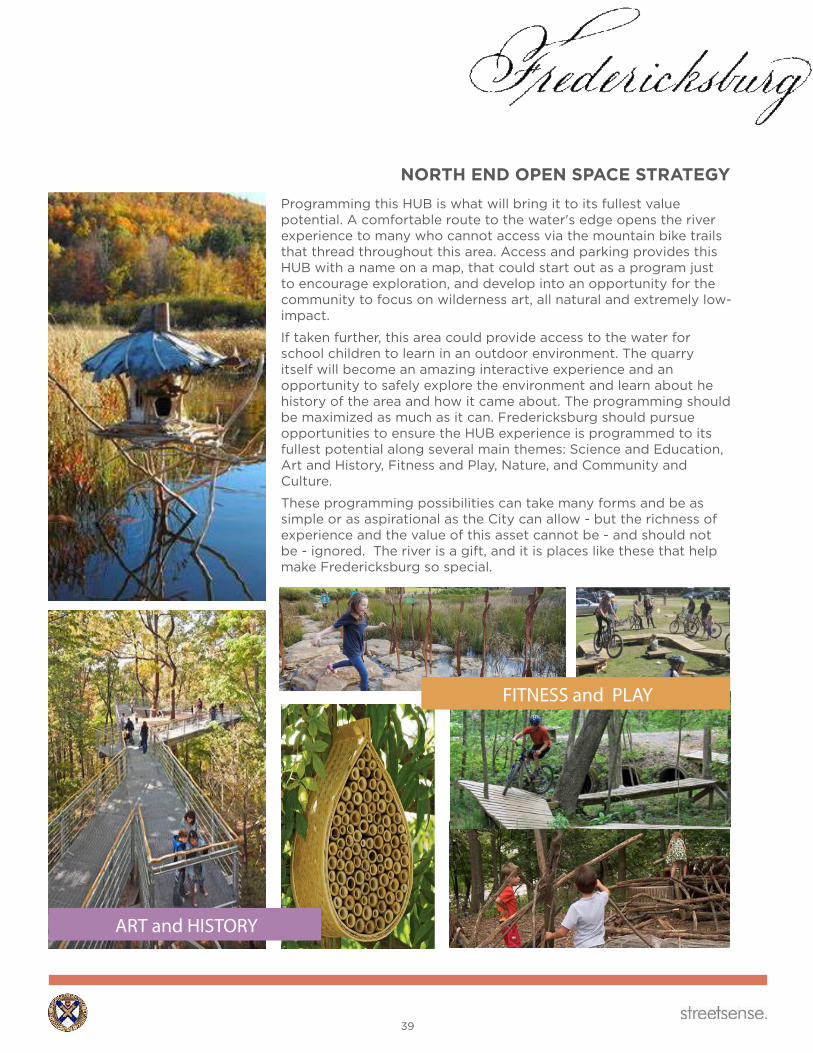
Programming this HUB is what will bring it to its fullest value potential. A comfortable route to the water's edge opens the river experience to many who cannot access via the mountain bike trails that thread throughout this area. Access and parking provides this HUB with a name on a map, that could start out as a program just to encourage exploration, and develop into an opportunity for the community to focus on wilderness art, all natural and extremely low-impact.
If taken further, this area could provide access to the water for school children to learn in an outdoor environment. The quarry itself will become an amazing interactive experience and an opportunity to safely explore the environment and learn about he history of the area and how it came about. The programming should be maximized as much as it can. Fredericksburg should pursue opportunities to ensure the HUB experience is programmed to its fullest potential along several main themes: Science and Education, Art and History, Fitness and Play, Nature, and Community and Culture.
These programming possibilities can take many forms and be as simple or as aspirational as the City can allow - but the richness of experience and the value of this asset cannot be - and should not be - ignored. The river is a gift, and it is places like these that help make Fredericksburg so special.
FITNESS and PLAY
ART and HISTORY
NORTH END OPEN SPACE STRATEGY

NEIGHBORHOOD AREA 1
REGULATING PLAN : CENTRAL AREA
40
KEY
Potential Gateway
Required Pump Station
Existing Trail
Proposed Trail
Intersection Improvement
Riverfront HUB
Lake Area Enhancements
Existing Roads
Road Extension
Upgrade Drive Aisles to Roadways
Future I-95 Interchange
Possible On/Off-Ramp
NORTH
CENTRAL
SOUTH

41
GENERAL CHARACTERCentral Area consists primarily of retail and auto-centric commercial uses, such as gas stations and drive thru facilities. Recent additions to the area include car dealerships, and multifamily and attached housing between Cowan and Fall Hill Avenue, bringing a larger number of residents to the neighborhood and completing an emerging grid of public and private streets. This area is dominated by suburban strip-center retail with significant land area covered in surface parking lots. The area lacks organizational clarity, compounded by a single, large road running through it rather than a hierarchical circulation network. Sidewalks are present in some places,
THE CHALLENGES A single six-lane arterial roadway Carl D. Silver Parkway functions as the primary access to all sites for all visitors. As such, the corridor funnels the majority of the traffic, concentrates traffic congestion into one area, and is a major divider throughout the neighborhood. The nature of Central Park's auto-centric layout, its fragmented traffic pattern and congestion, and the lack of additional opportunities for mobility throughout the site. The area is efficient for cars, but not set up to accommodate pedestrians, cyclists or efficient modes of public transport.
THE SOLUTIONS • Complete the street grid so that new growth is built in an appropriate scale with a walkable network of
streets
• A fully connected trail system could benefit multiple modes of transport.
• Build out of transportation network with integrated grid system
• Upgrade of existing drive aisle to function as multimodal travel ways
• Enhance pedestrian facilities at internal intersectionsMO
BIL
ITY
SPE
CIF
IC

NEIGHBORHOOD AREA 1
REGULATING PLAN : SOUTH END
42
KEY
Potential Gateway
Required Pump Station
Existing Trail
Proposed Trail
Intersection Improvement
Riverfront HUB
Lake Area Enhancements
Existing Roads
Road Extension
Upgrade Drive Aisles to Roadways
Future I-95 Interchange
Possible On/Off-Ramp
NORTH
CENTRAL
SOUTH

43
GENERAL CHARACTERCurrently consisting of retail space, mainly made up of big and medium-box retail anchors within a suburban strip-center configuration with significant land area covered in surface parking lots. The area lacks organizational clarity, compounded by a single, large road running through it rather than a hierarchical circulation network. Scattered stormwater management ponds and environmental preserve areas are embedded within parking areas and behind the large retail stores.
THE CHALLENGES Other than the ease of access that the current layout provides, Central Park has little to distinguish it among other regional shopping opportunities along I-95. The large-format layout of Central Park is especially challenging, as customers visiting multiple stores need to drive their car from each stop to the next, often by exiting out onto the main parkway again. Visitors share tales of being lost in the area, unsure which way to go or which store offering to access first.
THE SOLUTIONS • Increase access through interconnected traffic routes within Central Park by building new roads and
upgrading existing infrastructure to navigable roadways; and increasing alternative (pedestrian, bicycle, public transit) transportation options throughout Area 1.
• Provide a vision for possible reconfiguration retail offerings into a distinctive and concentrated, newly-viable retail center with a walkable scale and a comfortable character.
• Evolve the Demonstration Plan into a walkable place by concentrating the retail development and enabling the redevelopment of underutilized sites.
• Maximize the impact of the extraordinary open space offerings through a series of interventions to improve access, raising the profile of existing, but nearly invisible elements, linking spaces through improved trails, and programming these spaces to elevate their value and role within the neighborhood.
• Upgrade of existing drive aisle to function as multimodal travel ways
• Enhance pedestrian facilities at internal intersections
• Utilize curb lanes of Carl D. Silver Parkway as bus lanes (in the short-term) and peak bus lanes and off-peak parking (in the long-term).M
OB
ILIT
YSP
EC
IFIC

NEIGHBORHOOD AREA 1
REGULATING PLAN : SOUTH END
44
CONVERSION TO STREET
Two 10' travel lanes
Two 5' sidewalks
30'
5'5' 10' 10'
SHOPPING CENTER ACCESS DRIVE
SHOPPING CENTER ACCESS DRIVE Many existing driveways within Central Park are wide enough to become proper streets. These new streets expand the infrastructure with a secondary road framework to divert traffic from a single, central arterial road.
EXISTING CONDITION
30' drive lane

45
CONVERSION TO STREET
two 12’ travel lanes
one 8' parking lane
SHOPPING CENTER DRIVEWAY
AND FIRE LANE
32'16'
8'12'12'16'
SHOPPING CENTER DRIVEWAY AND FIRE LANE Drive aisles adjacent to store facades may be converted to street. These new streets expand the infrastructure with a secondary road framework to divert traffic from a single, central aterial road.
EXISTING CONDITION
32' drive lane

NEIGHBORHOOD AREA 1
REGULATING PLAN : SOUTH END
46
DEMONSTRATION PLAN
Open Space In the demonstration plan (shown on the opposite page) the aggregation of the storm water management ponds, together with the reduction of retail amongst them, creates a contiguous and programmable open space - perhaps renamed "Central Park." This larger and inviting open space will draw outdoor enthusiasts for enjoyment - as well as a pleasant gateway entry and respite for shoppers, soon flocking to the area to secure their treasures.
Parking Configuration A parking garage is incorporated into this plan. A clustered retail environment offers an opportunity to "park once" and visit multiple retailers within a walkable environment. The "park once" scenario can also be accommodated within a surface parking lot. Structured parking can offer more spaces within a smaller area, and reduces the overall coverage of surface parking. This solution can free up more ground area to improve the open space system, and provide pedestrian connections throughout the convenient parking areas. The demonstration plan (opposite) utilizes both types of parking.
As this retail concentration plan is realized, consider putting Carl D Silver Boulevard on a "Road Diet" through the central redevelopment district (suggested methods are shown on a following page). This action will: tame the thoroughfare nature of the road - through the re-envisioned walkable zone; provide additional up-close, on-street parking; and create additional draw for the retail tenants.
Form and Character Central Park functions as a regional shopping destination for city and county residents, as has been a highly successful marketplace, due to its location along I-95 and its many retail offerings. Containing national retailers such as Target, Walmart, Lowe's, etc, the area is arranged with multiple big-box anchored strip centers adjacent to and along a single six-lane arterial roadway: Carl D. Silver Parkway. Additionally, these big-box centers are positioned around the perimeter of large parking areas occurring between the store facades and Carl D. Silver Parkway. As the single, large roadway throughout, Carl D. Silver Parkway corridor funnels all the traffic through Area 1, and is a major divider.
If Central Park were to collectively concentrate their retail offering to match the contracting market down to +/-400,000 square feet, it could create multiple opportunities: to right-size retail offerings to match today’s market; to repurpose remaining land area; to introduce additional uses into the mix; to create a contiguous and programmable open space area; and to upgrade the placemaking aspects of Central Park to encourage pedestrian activity and elevate the “experience” within the center.
The Potential The future of retail is becoming more and more difficult to predict. A variety of qualitative and qualitative aspects will change over the next 5 to 10 years – and into the future. One thing is for sure, retail square footage will diminish and retail success will become more dependent on things other than automobile convenience. This combination of changes requires that the City of Fredericksburg think about ways that Central Park can evolve into a more sustainable and mixed-use part of the City, while continuing to support shopping access and convenience for its citizens.
The Plan for Area 1 , and the demonstration effort that was prepared during the charrette are based on an evolutionary approach. Proposing future plans requires a clear way to implement them – and this demonstration was intended to capture the possibility of short-, middle-, and long-term opportunities for the study area.
The demonstration exercise illustrates how Central Park can continue to offer residents shopping convenience, a place that accommodates larger-format and national tenant types that downtown cannot (quick service restaurants, large format shopping outlets, e.g.). This demonstration illustrates a way to transition from completely car-oriented shopping center to a more urban and sustainable format utilizing existing infrastructure, improving walkability, allowing high-performing tenant spaces to continue to serve their customers and providing a “bridge” from today into the future for Central Park.

47
DEMONSTRATION PLAN ONLY
KEY
Retail Buildings
Roadways
Open Space
Existing Ponds

NEIGHBORHOOD AREA 1
REGULATING PLAN : SOUTH END
48
Current Property Line Diagram
Planned Retail Area: ±400,000 sf
Parking Provided: ±1,950 spaces
Surface Parking: 1,480 spaces
Garage Parking 250 spaces
On-Street Parking 220 spaces
Potential Residential Units: ±2,142 units
Lot A: 18.62 acres @ 20 du per acre= 372 unitsLot B: 6.86 acres @ 20 du per acre= 137 unitsLot C: 29.08 acres @ 20 du per acre= 582 unitsLot D: 11.08 acres @ 20 du per acre= 236 unitsLot E: 11.95 acres @ 20 du per acre= 239 unitsLot F: 9.18 acres @ 20 du per acre= 184 unitsLot G: 19.59 acres @ 20 du per acre= 392 units
Potential Open Space Area: ±40.82 acres
Demonstration Plan Land Use Data:
Aerial Retail Structure Diagram

49
Lot H±800 spaces
Lot A±18.62 acres
Lot B±6.86 acres
Lot G±119.59 acres
Lot E±11.95 acres
9 K sf
120 K sf
18 K sf
18 K sf
217 K sf
Lot I±400 spaces
Lot J±280 spaces
Lot C±29.08 acres
18 K sf
Lot D±11.80 acres
Lot F±9.18 acres
CENTRAL
SOUTH
DEMONSTRATION PLAN ONLY

NEIGHBORHOOD AREA 1
REGULATING PLAN : SOUTH END
50
10'10'25' 15'10' 10'10' 10' 10' 10' 10' 5' 10'
Existing
10'10'25' 15'10' 10'10' 10' 10' 10' 10' 5' 10'
P P
OPTION 1 : Converted 10' Travel lane to 10' parking on each side
This option provides more street parking along the Carl D. Silver parkway which can be beneficial for retailers and customers.
10'8'25' 15'10' 10'10' 10' 10' 8' 2' 10' 5' 10'
P P2'
OPTION 2 : Converted 10' Travel lane to 8' parking lane & 2' curb extension on each side
This option serves same purpose as the option 1 but it would cost more to relocate the curb.
10'7' 7'25' 15'10' 10'10' 10' 10' 10' 5' 10'
BB
3' 3'
OPTION 3 : Converted 10' Travel lane to 7' bike lane & 3' buffer on each side
This option provides multi-modal use for Carl D. Silver Parkway which is beneficial for residents, retailers and costumers. Accommodating different transportation modes such as biking and walking help alleviate the vehicle trips in the area, thus reducing traffic.

51
POSSIBLE ROAD DIETThe opportunity to create a central "square" within Central Park poses a great challenge to the city of Fredericksburg. Central Park is owned by multiple entities and those entities - in turn - are leased to multiple tenants. This potentially creates a logistical challenge that may delay the manifestation of this idea for years. However, if the vision is to be realized, the Carl D. Silver Parkway must be tamed throughout the central Square. To do that, Carl D. Silver Parkway would need to begin a "road diet."
A “road diet” is roadway reconfiguration that involves narrowing or eliminating travel lanes to calm traffic and increase safety of all roadway users. A Federal Highway Administration (FHWA) policy brief states that a single road diet project can provide safety, operational, and multi-modal benefits. Road diets can raise property values, make shared spaces more livable, enhance economic activity in a central business district, and contribute to a community-focused, complete streets environment.
Carl D. Silver Parkway is one of the major primary roads within Central Park. Carl D. Silver Parkway consists of six lanes and serves as main roadway for cars. The character of this roadway is suburban and crossing it creates a negative experience for pedestrians. The road must be tamed in order to plan for a walkable retail concentration within Central Park. Three options for that diet are illustrated at the right. They are shown in progression from lower to higher cost.
Implementation Strategy: Under the existing land-use conditions, the feasibility of undertaking changes to Carl D. Silver Parkway would be limited in terms of potential impact due to the minimal land-use fronting the roadway and lack of density. As such, the feasibility of roadway changes would be based upon the following timelines:
Short-term under existing conditions:• Utilize the curb lanes of Carl D. Silver Parkway as bus lanes. Existing FRED
services travel along the roadway from Fall Hill Avenue to Cowan Boulevard and the creation of bus only lanes would enable better schedule adherence.
• Use of bus only lanes for bicyclists.
• Implement new multi-modal connections as new parcels are development within Area 1.
Long-Term under future conditions (assumed increase in density, minimal building setback with active street frontage)
• Utilization of curb lanes of Carl D. Silver Boulevard as peak period bus lanes.
• Utilization of curb lanes of Carl D. Silver Boulevard as off-peak period parking lanes.
• Removal of curb lane to enable installation of complete sidewalk network and buffered bike lanes.
• Implement new multimodal connections as new parcels are development within Area 1.
DEMONSTRATION PLAN ONLY

NEIGHBORHOOD AREA 1
ENHANCED MOBILITY
52
Fredericksburg, specially Area 1, is a car-oriented city: The City's development density and separation of land uses make walking, bicycling, and using transit difficult or impractical in many cases. As such, most residents commute via automobile. The City does have a walkable historic core, and because only one sixth of daily trips are for commute purposes, Fredericksburg has the potential to become a less car-oriented city.
In recent years, the City has taken many steps to make alternative modes of transportation more attractive including significant investment in the shared-use trail system, pedestrian infrastructure improvements, and continued participation in the FRED transit service. Current planning efforts are focusing on the redevelopment of the low-density suburban areas of the City such as Planning Area 1 – Celebrate Virginia/Central Park and the promotion of vibrant mixed-use corridors that are economically and environmentally sustainable.
Existing Central Park Street Network Conditions
Functional ClassificationFunctional classification groups streets and roadways into the roles they are expected to play within the motorized transportation network.
The outer areas of Fredericksburg are transacted by several major roadways including I-95, Highway 1, and Highway 3. These roadways transport high volumes of traffic into, and around, Fredericksburg while several minor roadways pass through the center of the city.
Area 1 including Carl D. Silver Parkway (south of Fall Hill Avenue), Fall Hill Avenue and Cowan Boulevard/Central Park Boulevard are classified as Major Collector’s with Carl D. Silver Parkway north of Fall Hill Avenue classified as a Minor Collector.
Figure 1. Roadway Classification

53
Roadway VolumesTraffic volumes in Fredericksburg are significantly higher along I-95 and arterials in the outer areas of the city than on the arterials and collectors in the city's downtown. By far the highest traffic volumes occur on I-95, which carries north-south interstate traffic, and on Highway 3, which transports east west traffic through the city.
Within Area 1 traffic volumes along Cowan Boulevard and Fall Hill Avenue average over 17,000 daily. Recent traffic counts in December, 2019 along Carl D. Silver Parkway show that average traffic volumes are approximately 26,000 vehicles daily. These roads are four lanes in width within the City with the exception of Carl D. Silver Parkway which is a six-lane roadway.
Typical planning level daily capacity volumes for 4-lane and 6-lane roadways (with left-turn lanes) are 36,000 vehicles and 55,000 vehicles respectively. The current daily volumes within Area 1 along Cowan Blvd, Fall Hill Ave and Carl D. Silver Parkway are well within the current capacity of the existing roadways at approximately 50% of the available capacity. As such, with the current roadway configuration Area 1 could accommodate higher land-use density without the need for additional roadway capacity.
Figure 2. Roadway Average Daily Traffic Volumes
Street Network Best Practices
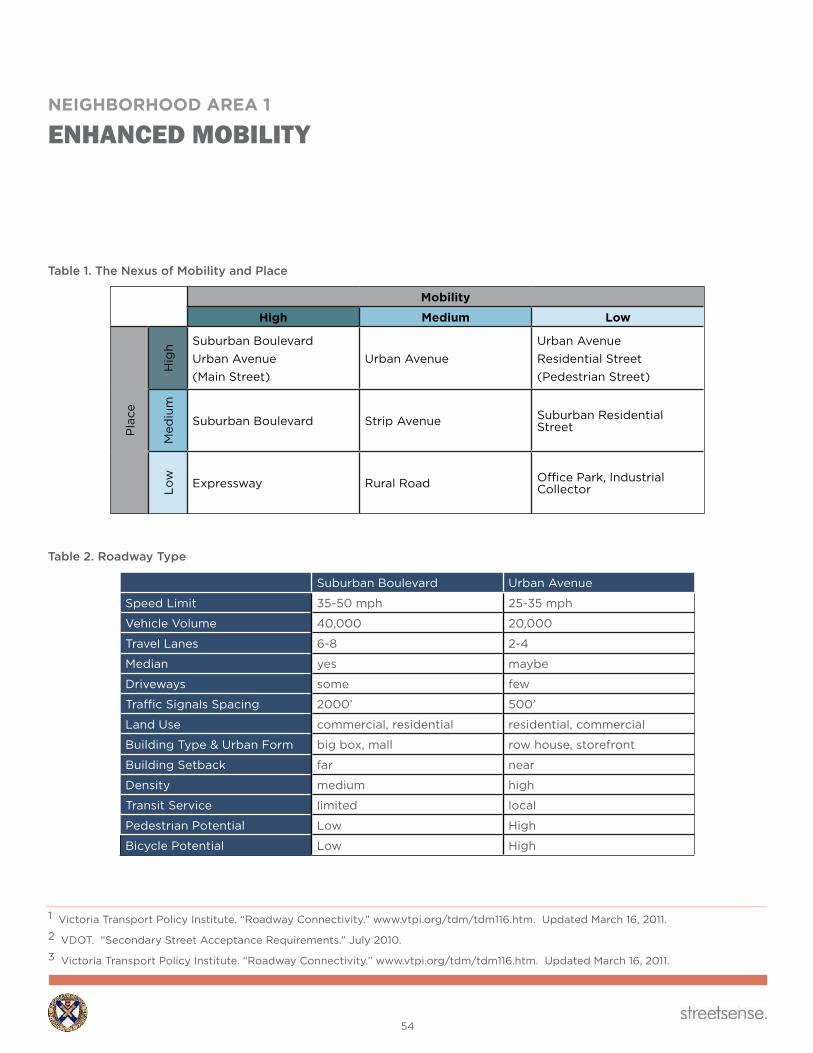
Nexus of Mobility and PlaceA street’s functions comprise not just its traffic or land use, but also its role in the mobility network and as a community place. A suburban residential street, for example, has low mobility as it is not a through street and does not lead to major destinations; however, as a play street this type has medium placemaking potential for those who live there. In comparison, an urban avenue such as Princess Anne Street has opportunities for both placemaking potential and for mobility purposes encouraging pedestrian and bicycle modes.
Within Area 1, the predominant roadway type is Suburban Boulevard which under the existing conditions has a defined mobility role of moving vehicles to commercial land-uses and a subsequent lack of sense of place.
NEIGHBORHOOD AREA 1
ENHANCED MOBILITY
54
Table 1. The Nexus of Mobility and Place
Mobility
High Medium Low
Pla
ce
Hig
h Suburban BoulevardUrban Avenue(Main Street)
Urban AvenueUrban AvenueResidential Street(Pedestrian Street)
Med
ium
Suburban Boulevard Strip Avenue Suburban Residential Street
Low Expressway Rural Road Office Park, Industrial
Collector
Table 2. Roadway Type
Suburban Boulevard Urban Avenue
Speed Limit 35-50 mph 25-35 mph
Vehicle Volume 40,000 20,000
Travel Lanes 6-8 2-4
Median yes maybe
Driveways some few
Traffic Signals Spacing 2000’ 500’
Land Use commercial, residential residential, commercial
Building Type & Urban Form big box, mall row house, storefront
Building Setback far near
Density medium high
Transit Service limited local
Pedestrian Potential Low High
Bicycle Potential Low High
1 Victoria Transport Policy Institute. “Roadway Connectivity.” www.vtpi.org/tdm/tdm116.htm. Updated March 16, 2011.
2 VDOT. “Secondary Street Acceptance Requirements.” July 2010.
3 Victoria Transport Policy Institute. “Roadway Connectivity.” www.vtpi.org/tdm/tdm116.htm. Updated March 16, 2011.

55
Importance of Street ConnectivityConnectivity refers to the density of connections in path or road networks and the directness of links. Well-connected street networks have short links, many intersections, and minimal dead-ends or cul-de-sacs. High connectivity creates a more accessible and resilient transportation network, because people can take more direct routes between destinations, and people have more route options.
Connectivity can be measured in several different ways:
• Connectivity Index: Ratio of roadway links to nodes. A four-square grid, for example, has a connectivity index of 1.33 (12 links divided by 9 nodes – see Figure 3). A nine-square scores 1.5; the higher the value, the better the connectivity. A score of 1.4 is the minimum needed for a walkable community.1 In compact urban areas, a 1.6 index or above should be provided.2 The following definitions are used in calculating Connectivity Index:
• Segment/Link: a roadway or alley open to general public auto traffic; a street section between intersections and termini
• Node/Intersection: a junction with three or more segments; the terminus of a street segment, such as a cul-de-sac
• Intersection Density: Number of intersections per square mile; the higher the number, the better the connectivity
• Accessibility Index: Divide the direct travel distance by the actual travel distance. In an unconnected network with dead ends and long blocks, people travel farther to reach destinations, meaning a higher index. An index of 1.0 is the best rating, meaning there are direct paths. An average value of 1.5 is acceptable.3
Figure 3. Connectivity Index

NEIGHBORHOOD AREA 1
ENHANCED MOBILITY
56
The example in Figure 4 shows two street grids from the City of Fredericksburg. Both are at the same scale. The example of the right (Area 7 - Downtown) is a well-connected grid meaning that the urban-style road network gets a high score. The example on the left (Area 1 – Central Park) has a lower connectivity. The density of intersections shows that the more urban area of the City has four times as many intersections as the suburban example, meaning blocks are short and walking is interesting. Of particularly note in the example of Area 1, is the lack of dual sidewalks along many roadways such as Carl D. Silver Parkway and Central Park Boulevard, which further decreases the actual “available” physical connectivity.
One way to encourage connections is to require “stub outs” with new developments. A stub out is a road segment constructed to connect a development in the future and is built abutting the neighboring property line. Many municipalities, including Portland, OR, Boulder, CO, and Raleigh, NC, require stub-outs and disallow cul-de-sacs as part of their street standards.
The combination of high street connectivity and high intersection density means that the network requires short blocks and standards for dimensions between roads and crossings. Guidelines for street spacing include:
• Average intersection spacing 200-400 feet
• Maximum intersection spacing 600 feet
• Maximum spacing for arterial streets 1,000 feet
• Maximum spacing between pedestrian/bicycle connections 350 feet
• Maximum block size 5-12 acres
4 Victoria Transport Policy Institute. “Roadway Connectivity.” www.vtpi.org/tdm/tdm116.htm. Updated March 16, 2011. 5 Butler K, Handy S, Paterson R. Planning for street connectivity: getting from here to there. Chicago, IL: American Planning Association Planning Advisory Service, 2003.6 Trowbridge MJ, Gurka MJ, O’Connor RE. Urban sprawl and delayed ambulance arrival in the U.S. Am J Prev Med 2009;37(5):428-432.7 Ewing R, Pendall R, Chen D. Measuring sprawl and its transportation impacts. Travel Demand Land Use 2003; (1831):175-83.
8 Weiss E. In Va., vision of suburbia at a crossroads: targeting cul-de-sacs, rules now require through streets in subdivisions. Washington Post 2009, Mar 22:A01.9 General Assembly of Virginia. Requirements for taking new streets into state secondary highway system. Virginia Acts of Assembly, 2007; Chap. 382 (Sect. 33.1-70.3).
Figure 4. City of Fredericksburg Connectivity

57
The Benefits of Street ConnectivityIncreasing connectivity has been shown to improve congestion, as it reduces travel times because routes become more direct. The Land Use, Transportation, Air Quality, and Health research project sponsored by the Puget Sound Regional Council found that household Vehicle Miles Traveled (VMT) declined by 0.5 percent after a 10 percent increase in intersections per square mile, all else held constant.4 Note that making connections does not necessarily involve road building. A neighborhood can have low permeability for cars but high permeability for people on foot or on a bicycle. Extended dead end or cul-de-sac streets with trails that connect subdivisions and parcels, improves non-motorized connectivity.
Many cul-de-sac style neighborhoods have been built under the pretense of low traffic volumes and speeds; however, connected neighborhood streets can have these same characteristics if designed with short blocks, “T” intersections, narrower widths, and other traffic calming features. In fact, well-connected neighborhoods have important benefits, such as improved EMS response time, lower vehicles miles of travel, and less congestion.
How streets function in a connected network has a great impact on EMS response times. In November 2000, the City of Raleigh, North Carolina undertook a study to understand how various area developments and associated street networks influenced Fire and Emergency Response times. In all cases, the analysis showed far greater service efficiencies for those older neighborhoods with greater street connectivity. The location of the fire station itself was also examined. The study found that a fire station in the most interconnected neighborhood could provide service to more than three times as many commercial and residential units as the least connected neighborhood.5
Research has shown an association between urban sprawl and increased EMS response time as well as a higher probability of delayed ambulance arrival following motor-vehicle crashes in the U.S.6 The probability of a delayed ambulance arrival is nearly twice as high in counties with prominent features of sprawl, such as low-density construction, limited street connectivity, and segregation of residential development from civic and commercial districts compared with counties exhibiting smart-growth characteristics.7
The public health benefits of increased street network connectivity, including emergency response, are becoming increasingly well recognized. Certain states, including Virginia,8 are beginning to mandate reductions in cul-de-sacs and limited-access neighborhoods through transportation and land-use legislation.9 The growing trend away from segregated enclaves of residential and commercial developments to infill programs to create stronger primary and secondary street networks promotes walking, fewer trips by private automobiles (and in turn less congestion).
The example in Figure 5 takes a typical street network and shows how to improve its connectivity. First, pedestrian connections (in green) are added within the local areas off the main roads. Then full streets are added (blue), improving the connectivity index from 1.12 at the start to 1.4 – a more walkable and mobile community.
Figure 5 Example of Connectivity
Benefits

NEIGHBORHOOD AREA 1
ENHANCED MOBILITY
58
Proposed Central Place Street Network
ConnectionsThroughout the Area 1 Small Area Plan charrette in October 2019, there was a consistent theme of the need for enhanced connectivity within the Central Park study area. The enhanced connectivity would open the opportunities within Central Park to diversify the land-use offerings and provide a balanced mixed-use environment. The proposed connections are shown in Figure 6 below with gray highlighting existing conditions, purple as 1st priority connections and blue as 2nd priority connections.
Beginning in 2007, the FAMPO and the Virginia Department of Transportation (VDOT) evaluated the possibility of constructing a new access point or interchange with I-95 in the City of Fredericksburg between the Rappahannock River and VA 3 (Route 3). In October 2010, the Alternatives Analysis was completed and determined that the preferred alternative included a new, full interchange with I-95 (providing access to the west only) between the rest area and the Rappahannock River. However, completion of the Alternatives Analysis is only the first step of the planning process with the full environmental compliance process yet to be started which would then, if approved, lead to design, funding and construction. For the purposes of the report, it is currently assumed that a new I-95 connection would be implemented over the long term due to the extensive federal environmental planning still to be undertaken.
Multimodal Facilities Within Fredericksburg, the downtown and inner areas have complete, or nearly complete, sidewalk coverage. Sidewalk coverage is incomplete in the city's outer areas and is particularly lacking in and around the Area 1 - Central Park retail cluster as shown in Figure 7.
Existing
Proposed-Priority 1
Proposed- Priority 2
NORTH
CENTRAL
SOUTH
Figure 6. Proposed Central Park Connections

59
Figure 7. Existing Non-motorized Network
Fredericksburg lacks on-street bike lanes and cycle tracks, but does have several shared use trails including the Rappahannock River Heritage Trail, the Smith Run Trail, and the Virginia Central Railway Trail, which connect some areas of the city's west and north to the edge of the downtown area.
With the proposed Central Park connections, incorporation of enhanced non-motorized facilities is a critical component of a future mixed-use environment. The proposed roadways as shown in Figure 6 would be designed to incorporate multimodal amenities including sidewalks, bicycle lanes and/or shared use paths. Additionally, with enhanced connectivity within the roadway system and the available capacity along Carl D. Silver Parkway, there are opportunities to investigate changes to the Parkway in the form of bicycle lanes, bus lanes and on-street parking.

NEIGHBORHOOD AREA 1
ENHANCED MOBILITY
60
Transit NetworkAs current and future planning efforts focus on the redevelopment of low density suburban areas of the City and promote vibrant mixed-use corridors that are economically and environmentally sustainable, transit services become a key element to complete a true multi-modal transportation network. Improving transit frequency (i.e., 15 minutes during peak periods and 30 minutes off-peak), lengthening service span (earlier in the morning and later at night), publicizing system information, and ensuring service reliability help to remove barriers to transit use and lead to increased ridership.
Currently FRED Transit operates within Area 1 to Central Place, but service ends at 8:30pm and operates a limited service on weekends. The limited span of services doesn’t facilitate use of the system by those employed within Area 1 where many businesses are open beyond the closure of the transit system on both weekdays and weekends.
Figure 8. Existing Transit System Map

61
ImplementationThis Small Area Plan suggests a strategy to upgrade and amend the street network within all of Neighborhood Area 1. This Plan identifies the existing, limited road network and suggests a strategy to improve that network by adding roads and rebuilding others into a more complete network of mobility.
• New roads are added where additional development warrants
• Roadway connections are completed where indicated
• Drive aisles within strip centers are upgraded to navigable roadways to provide route options
• Sidewalks are integrated into each new section of road
• Bike lanes are considered along or within existing roadways
• Greenway bike paths are included in all future land use and site plan approvals
`

NEIGHBORHOOD AREA 1
EVALUATION CRITERIA
62
Evaluation Criteria for Neighborhood Area 1Access + Mobility:• Complete a network of appropriately scaled/sized thoroughfares that distribute traffic across the area,
and increase modal balance
• Increase mobility options, interconnected network specifically for pedestrians and cyclists.
• Complete multiple points of connection to existing bike paths and trails to and along the river and within the three zones.
• Improve public transportation through frequent buses at easily identifiable and accessible locations.
• Provide additional through-road connections to Fall Hill Avenue, Cowan, and Carl D. Silver Parkway.
North End: Improve and create access to open spaces and trails along Rappahannock Riverfront
Central and South End: Connect sidewalks through parking lots to increase pedestrian mobility
South End: Consider a Carl D. Silver Parkway road diet within designated pedestrian priority zone or central square
Public + Open Space: • Provide and promote public access programming to leverage the area's natural assets.
• Develop re-greening strategy to reconnect waterways to improve the blue network's quality and quantity.
• Improve and expand view corridors and access points to Rappahannock river
• Enhance and extend the trail network along the river and within the Neighborhood Area 1
• Provide for continuous maintenance of open spaces
• Shade trees along the sidewalks provide comfortable environment for pedestrian
North End: Program quarry area to provide public access into waterfront trails.
Central Area: • Strengthen connections between the native open spaces in the North End and the destinations
within the South End.
• Increase access and open space surrounding existing ponds
South End: • Consolidate ponds and preserved open spaces into a cohesive/usable and programmable whole
• Provide occasional relief from the urban condition

63
Function + Land Use:• Leverage the synergy of uses to strengthen district identity; cluster commercial areas, residential
areas, and entertainment areas, etc.
• Commercial development should be located along major roadways
North End: • Growth intended, with residential development as a predominant use
• Consider unique uses for entertainment, cultural events and the like within a special district to reinforce sport venue and conference center.
• Provide significant natural features; rivers/slope/drainage ways/quarry as public parks with enhanced/easy access.
• Considerable and historically/culturally significant waterfront
Central Area: • Infill with residential and re-use retail as other commercial spaces.
• Residential, retail and office as balance uses
South End:• Growth intended, with retail as predominant use
Form + Character:• Promote a rational mixing of uses
• Create a cohesive built edge and building form along Carl D. Silver Parkway
• Designing building forms respectful of surrounding built and natural context. To enhance pedestrian experience, building fonts should engage the streets and sidewalks
• Buildings should be sited to shape public spaces, respect existing context, reflect their natural setting or all of the above.
• Open space should provide purposeful respite from the built environment.
North End: • Low to medium density development that is flexible to respond to topography.
Central: • Horizontal or vertical mixed use
• Medium to high density development, with auto-centric options permitted along Cowan and Fall Hill Avenue.
• Create shared parking plan to allow reduction of paved surfaces.
South End: • Relatively high density development, retail dominant.
• Vertical mixed use is encouraged
• Visible and easy access parking should be at a human scale and pleasant environments
• Consider a structured parking plan