small states economic review and basic statistics volume 17
TRANSCRIPT


Small States: Economic Review and Basic Statistics, Volume 17

Commonwealth SecretariatMarlborough HousePall MallLondon SW1Y 5HXUnited Kingdom
© Commonwealth Secretariat 2014
All rights reserved. No part of this publication may be reproduced, stored in a retrieval system, or transmitted in any form or by any means, electronic or mechanical, including photocopying, recording or otherwise without the permission of the publisher.
Published by the Commonwealth SecretariatEdited by editors4change LimitedTypeset by Techset CompositionCover design by Tattershall Hammarling & SilkPrinted by Charlesworth Press
Views and opinions expressed in this publication are the responsibility of the authors and should in no way be attributed to the institutions to which they are affiliated or to the Commonwealth Secretariat.
Wherever possible, the Commonwealth Secretariat uses paper sourced from sustainable forests or from sources that minimise a destructive impact on the environment.
Copies of this publication may be obtained from
Publications SectionCommonwealth SecretariatMarlborough HousePall MallLondon SW1Y 5HXUnited KingdomTel: +44 (0)20 7747 6534Fax: +44 (0)20 7839 9081Email: [email protected]: www.thecommonwealth.org/publications
A catalogue record for this publication is available from the British Library.
ISBN (paperback): 978-1-84929-125-5ISBN (e-book): 978-1-84859-915-4

Foreword
This is the seventeenth issue of this annual publication, which was previously published under the title Basic Statistical Data on Selected Countries (with populations of less than 5 million). This issue focuses on data and statistical challenges and is intended as an essential reference for key stakeholders and policy-makers in small states and for their development partners. It also provides a useful resource for analysts from research and academic institutions in the broad areas of social, economic and environment policies.
As in the previous editions, the publication is in two parts. Part I provides analysis on the latest economic trends in small states and includes a research article on small states. The analysis focuses on the economic environment, the external performance and the key development issues facing policy-makers in small states. The main article, by Ryan Straughn, focuses on data and statistical challenges in small states. It investigates and documents the dynamics of data and statistical challenges in small states and identifies ways and options for addressing these challenges.
Part II of this publication contains statistical tables covering all small states, as well as a selection of countries that at the end of 2011 had populations of five million or fewer. The inclusion of countries with populations above the small states’ population threshold of 1.5 million is for comparison purposes only. Tables in this volume have been edited and reformatted to ensure consistency in the variables. These tables contain indicators on social, economic, environmental and demographic indicators.
The countries are grouped into three categories on the basis of their 2012 per capita gross national income (GNI). The three categories are: a) low-income countries with per capita income of US$1,025 and below; b) middle-income countries with per capita income of between US$1,026 and $12,475; and c) high-income countries with per capita income of US$12,476 or more.
The publication has been prepared by Economic Adviser, Denny Lewis-Bynoe, Economic Officer, Wonderful Hope Khonje, and Research Officers Heather Cover-Kus, Aimé Sindayigaya and Best Ojighoro, all from the Economic Affairs Division of the Commonwealth Secretariat. Reviews were conducted at various stages by Travis Mitchell and Joel Burman. Janet Strachan, Adviser and Head of Section, provided the overall supervision and guidance.
Cyrus RustomjeeDirector, Economic Affairs DivisionCommonwealth Secretariat
iii

What Are Small States?
The Commonwealth defines small states as sovereign states with a population size of 1.5 million people or fewer.1 Using this standard, 44 countries are small. These countries are:
Country 2012 Population (’000)
Population rank 1 = smallest
Antigua and Barbudaa 89 10Bahamas, Thea 372 24Bahrain 1,318 42Barbadosa 283 20Belizea 324 22Bhutan 742 34Brunei Darussalama 412 25Cape Verde 494 27Comoros 718 32Cook Islands 11 4Cyprusa b 1,129 38Djibouti 860 36Dominicaa 72 8Equatorial Guinea 736 33Estonia 1,339 44Fijia 875 37Grenadaa 105 13Guyanaa 795 35Icelandb 320 21Kiribatia 101 11Luxembourgb 531 28Maldivesa 338 23Maltaa b 418 26Marshall Islands 53 6Mauritiusa 1,291 41Micronesia, Federated States of 103 12Montenegro 621 31Naurua 9 2Niue 1 1Palau 21 5Samoaa 189 18São Tomé and Principe 188 17Seychellesa 88 9Solomon Islandsa 550 30St Kitts and Nevisa 54 7
(continued)
iv
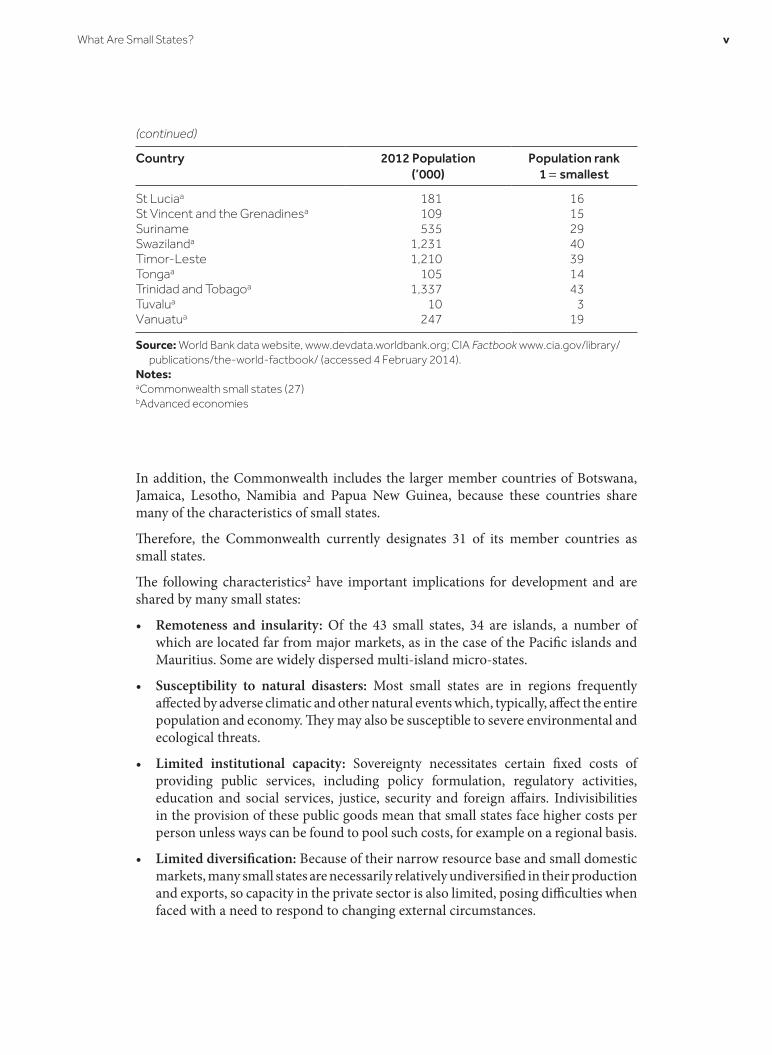
In addition, the Commonwealth includes the larger member countries of Botswana, Jamaica, Lesotho, Namibia and Papua New Guinea, because these countries share many of the characteristics of small states.
Therefore, the Commonwealth currently designates 31 of its member countries as small states.
The following characteristics2 have important implications for development and are shared by many small states:
• Remoteness and insularity: Of the 43 small states, 34 are islands, a number of which are located far from major markets, as in the case of the Pacific islands and Mauritius. Some are widely dispersed multi-island micro-states.
• Susceptibility to natural disasters: Most small states are in regions frequently affected by adverse climatic and other natural events which, typically, affect the entire population and economy. They may also be susceptible to severe environmental and ecological threats.
• Limited institutional capacity: Sovereignty necessitates certain fixed costs of providing public services, including policy formulation, regulatory activities, education and social services, justice, security and foreign affairs. Indivisibilities in the provision of these public goods mean that small states face higher costs per person unless ways can be found to pool such costs, for example on a regional basis.
• Limited diversification: Because of their narrow resource base and small domestic markets, many small states are necessarily relatively undiversified in their production and exports, so capacity in the private sector is also limited, posing difficulties when faced with a need to respond to changing external circumstances.
Country 2012 Population (’000)
Population rank 1 = smallest
St Luciaa 181 16St Vincent and the Grenadinesa 109 15Suriname 535 29Swazilanda 1,231 40Timor-Leste 1,210 39Tongaa 105 14Trinidad and Tobagoa 1,337 43Tuvalua 10 3Vanuatua 247 19
Source: World Bank data website, www.devdata.worldbank.org; CIA Factbook www.cia.gov/library/publications/the-world-factbook/ (accessed 4 February 2014).
Notes: aCommonwealth small states (27)bAdvanced economies
(continued)
What Are Small States? v

• Openness: Small economies tend to rely heavily on external trade and foreign investment to overcome their inherent scale and resource limitations. While this can prove beneficial in exposing them to outside competition and ideas, it leaves them vulnerable to external economic and environmental shocks, especially where the domestic economy is undiversified.
• Access to external capital: Access to global capital markets is important for small states, and is one way to compensate for adverse shocks and income volatility, but the evidence is that private markets tend to see small states as more risky than larger states, so that spreads are higher and market access more difficult.
• Poverty: There is some evidence that poverty levels are higher and income distribution more uneven in smaller than in larger states.
These characteristics result in small states being extremely vulnerable. This vulnerability is manifested by high levels of fluctuations in gross domestic product (GDP), input costs and export earnings.
The main text of this publication, Small States Economic Review and Basic Statistics, covers recent economic developments in the 31 small states of the Commonwealth.
Where data are available, the coverage of the 65 statistical tables includes development indicators for Commonwealth and other small states, as well as for developed and developing countries with populations of less than five million.
Notes 1 Charles, E (1997), A Future for Small States: Overcoming Vulnerability, Commonwealth Secretariat,
London. 2 Small States: Meeting Challenges in the Global Economy, report of the Commonwealth Secretariat/
World Bank Joint Task Force on Small States 2000.
vi Small States: Economic Review and Basic Statistics

Contents
Foreword iii
What Are Small States? iv
Abbreviations and acronyms xi
Part I. Recent Economic Trends in Commonwealth Small States 1
1. Recent Economic Trends in Commonwealth Small States 11.1 Introduction 11.2 Small states economic review 21.3 Prospects for small states’ GDP growth in 2014 and beyond 41.4 Inflation and the consumer prices index 41.5 Unemployment 41.6 International trade 51.7 Development aid 61.8 Remittances 71.9 International reserves 71.10 Foreign direct investment 71.11 Ease of doing business 81.12 Small states’ global competitiveness 81.13 Human development indicators 91.14 Regional and country analyses 10
1.14.1 African small state economies: a snapshot 101.14.2 Summary of developments, outlook and policy priorities in
African small states 101.14.3 Asia-Pacific small state economies: a snapshot 121.14.4 Summary of developments, outlook and policy priorities
for Asian-Pacific small states 131.14.5 Caribbean small state economies: a snapshot 161.14.6 Summary of developments, outlook and policy priorities
for Caribbean small states 161.14.7 European small state economies: a snapshot 191.14.8 Summary of developments, outlook and policy priorities
for European small states 191.15 Conclusion 21References 22
vii

2. The Role of Data and Statistics for Policy-making in Small States 23Ryan Straughn 2.1 Summary 232.2 Introduction 242.3 Literature review 262.4 The dynamics of data challenges in small states 27
2.4.1 Basic data and statistical needs 282.4.2 Millennium Development Goals data gaps 292.4.3 Survey results 312.4.4 Challenges 402.4.5 Priority areas 42
2.5 Addressing data challenges in small states 432.5.1 Adapting NSDS approach to small countries 442.5.2 Improving data and statistical capacity in priority areas 452.5.3 Operational IT 46
2.6 Conclusion 47Acknowledgements 47References 48Appendix 2.1 Data gaps from the survey results 49Appendix 2.2 World Development Indicators data gaps 54
Part II. Social and Economic Data on Small States 66Basic statistics 66Technical notes for tables 66
Economic indicators Table 1. Gross national income (GNI) at market prices 76Table 2. Gross domestic product (GDP) 79Table 3. Sectoral distribution of gross domestic product (% total of GDP) 82Table 4. Growth of production (annual average %) 84Table 5. GDP components (% of total) 86Table 6. Prices (% change) 89Table 7. Exports, imports and trade balance 91Table 8. Destination of merchandise exports (% of total exports) 93Table 9. Destination of merchandise exports to selected regions
(% share of world exports) 95Table 10. Main sources of merchandise imports (% of total imports) 97Table 11. Composition of merchandise exports (% of total exports) 99Table 12. Merchandise imports by selected regions (% share of world imports) 101Table 13. Merchandise trade with Commonwealth countries 103Table 14. Export characteristics 105Table 15. Selected indicators of openness and instability 107Table 16. Migration and remittances 109Table 17. Fish production 111Table 18. Energy production, consumption and trade 113
viii Small States: Economic Review and Basic Statistics

Table 19. Energy consumption and carbon emissions 115Table 20. Tourist arrivals and earnings 118Table 21. International reserves 120Table 22. External debt: selected categories 122Table 23. Total net transfers on external debt 124Table 24. Principal indicators of debt 126Table 25. Composition of debt 127Table 26. Foreign direct investment (FDI) inflows 128Table 27. Total net financial flows from all sources (US$ millions) 130Table 28. Net financial flows by major categories (US$ million) 131Table 29. Official Development Assistance commitments and disbursements 133Table 30. Aid dependency 136Table 31. Average exchange rates 140Table 32. Money supply and nominal interest rates 142Table 33. Doing business 144Table 34. Selected private sector indicators 148
Social and demographic indicators Table 35. Selected size indicators 150Table 36. Population indicators 153Table 37. Distribution of labour force (% of total employment) 155Table 38. Labour force participation 156Table 39. Urban and rural population (%) 160Table 40. Land use 162Table 41. Population distribution by age, actual and projected (%) 164Table 42. Selected demographic indicators 166Table 43. Life expectancy at birth (years) 168Table 44. Adult literacy rates (%) 170Table 45. Primary education level enrolment ratio (%) 172Table 46. Secondary education enrolment level ratio (% gross) 174Table 47. Tertiary education level enrolment ratio (%) 176Table 48. Primary education gender ratio 178Table 49. Selected characteristics of female population 180Table 50. Total government expenditure by main components (%) 182
Other development indicators Table 51. Access to improved water sources (% of population) 184Table 52. Access to improved sanitation (% of population) 186Table 53. Human Development Index (HDI) 188Table 54. Selected characteristics of gender equality 190Table 55. Selected poverty indicators 192Table 56. Births delivered by skilled health personnel and maternal mortality 195Table 57. Universal access to reproductive health 197Table 58. Children’s health 199Table 59. Under-five mortality rate per 1,000 births 201Table 60. Summary statistics on HIV/AIDS 203
Contents ix

Table 61. Summary statistics on tuberculosis (TB) 205Table 62. Environment 207Table 63. Main indicators of internet communications 210Table 64. Main indicators of telephone communications 212Table 65. Transport 214
x Small States: Economic Review and Basic Statistics

Abbreviations and acronyms
ABSD Antigua and Barbuda Statistical DivisionADB Asian Development BankBDS Bahamas Department of StatisticsBSS Barbados Statistical ServiceCARTAC Caribbean Technical Assistance CentreCPA country programmable aidCPI consumer prices indexCSO central statistical officeCSS Commonwealth small statesCYSTAT Statistical Service of CyprusDAC Development Assistance Committee (of the OECD)ECCU Eastern Caribbean Currency UnionEU European UnionFDI foreign direct investmentG20 Group of TwentyGCF gross capital formationGDP gross domestic productGNI gross national incomeHDI Human Development IndexHIV Human Immunodeficiency VirusIMF International Monetary FundICT information and communications technologyIDA International Development AssociationILO International Labour OrganizationIT information technologyIUCN International Union for Conservation of NatureMDG Millennium Development GoalNBS Nauru Bureau of StatisticsNGO non-governmental organisationNSDS national strategy for the development of statisticsNSA Namibia Statistics AgencyNSB National Statistics Bureau (Seychelles)NSO national statistics officeNSS national statistical systemODA official development assistanceOECD Organisation for Economic Co-operation and DevelopmentOECS Organization of Eastern Caribbean StatesPIOJ Planning Institute of Jamaica
xi

PPP purchasing power parityRSDS regional strategy for the development of statisticsRTAC Regional Technical Assistance CentreSACU South African Customs UnionSBS Samoa Bureau of StatisticsSIDS small island developing statesSITC Standard International Trade ClassificationUN United NationsUNESCO United Nations Educational, Scientific and Cultural OrganizationUNICEF United Nations Children’s FundUNSD United Nations Statistical DepartmentWDI World Development IndicatorWHO World Health OrganizationWTO World Trade Organization
xii Small States: Economic Review and Basic Statistics

Part I. recent economIc trends In commonwealth small states
Chapter 1
Recent Economic Trends in Commonwealth Small States
1.1 Introduction
Although recovery began to sprout in 2010, the growth trajectory for the world economy in 2013–2014 remains cautious, with an expected average of 3.75 per cent (IMF 2013a). This conservative forecast arises partly because of the differing growth prospects for advanced economies and emerging and developing economies. Despite the fact that emerging and developing economies are faring relatively well, with a forecast of 5.3 and 5.7 per cent in 2013 and 2014 respectively (ibid.), the sluggish growth projected for advanced economies is a drag on world economic growth. The US is forecast to grow at a modest 1.9 per cent in 2013 and 3 per cent in 2014, while the EU faces a dampened growth prospect of −0.3 per cent in 2013 and 1.1 per cent in 2014. The emergence of new political and financial risks, coupled with the continuing inability of banks to lend, have further constrained the availability of credit to households and companies in advanced economies. Poor profitability and low capital flows for banks, as well as a lack of demand by households, could signal a bleaker and less steady recovery. However, if policy-makers deliver on
their economic policy commitments, real GDP growth in advanced economies might reach, on average, 2 per cent in 2013 and 2.25 per cent in 2014, up from the current projection of 1.25 per cent for this year (ibid). Real gross domestic product (GDP) growth for 2011 to 2014 is shown in Figure 1.1.
Against this backdrop of world economic performance, this chapter examines how small states have fared. It analyses the growth (Section 1.3), inflation (Section 1.4) and unemployment (Section 1.5) outlooks for small states in the context of the prospects for the world economy. It then reviews the international trade prospects (Section 1.6) for small states in a world economy facing uncertainties and weak recovery, and what this means for their abilities to garner development aid (Section 1.7) and effective foreign direct investments (Section 1.10) in the difficult economic environment in advanced economies. The persistence of these uncertain conditions in advanced economies might have serious economic implications for small states’ remittances (Section 1.8) and international reserves (Section 1.9). Small states’ 2013 rankings for ‘ease of doing business’ (Section 1.11),
Figure 1.1 Real GDP growth: world, advanced economies, and emerging and developing economies (2001–2014)
-6
-4
-2
0
2
4
6
8
10
2001 2002 2003 2004 2005 2006 2007 2008 2009 2010 2011 2012 2013 2014Rea
l GD
P gr
owth
(%)
Year
World Advanced economies Emerging market and developing economies
Source: IMF (2013b)
1

competitiveness (Section 1.12) and human development index (Section 1.13) are also analysed in relation to their overall economic performance. The report concludes with an analysis of regional and individual country performance.
1.2 Small states economic review
The average real GDP growth rates in small states approximated 2.9 per cent from 2001 to 2012, underscored by peaks in GDP growth of 4.7 per cent in 2003 and 5.8 per cent in 2006, which were offset by a significant fall in output to 1.2 per cent in 2005 and −1.2 per cent in 2009 due to the global recession, as shown in Figure 1.2.1
This global crisis, which started in 2007 in advanced economies, dampened the growth progress made by a
number of small states. Prior to 2007, the annual average growth rate of the small states group registered 5.8 per cent – more than twice the post-crisis 2012 figure of 2.4 per cent. The new growth trajectory is expected to continue into 2013–2014, well below the high rates accomplished in 2006–2008. This moderate forecast is projected for each of the small state regions (see Figure 1.3).
Asian small states experienced the highest average growth rates before the recession, with 12 per cent growth in 2006. However, they were also hit hard by the global economic crisis, with these economies shrinking by an average of 2.1 per cent in 2009. After rebounding strongly in 2010, Asian small states have continued to grow, but at a slower pace. Small states in the Pacific maintained a relatively stable growth rate of 2 to 3 per cent between 2001 and 2008, followed
Figure 1.2 Average GDP growth (%) for small states annually and average over time (2001–2012)
-2.0%
-1.0%
0.0%
1.0%
2.0%
3.0%
4.0%
5.0%
6.0%
7.0%
2001 2002 2003 2004 2005 2006 2007 2008 2009 2010 2011 2012
Ave
rage
GD
P gr
owth
(%)
Small state average per year 2001–2012 average
Figure 1.3 Average real GDP growth for small states (%) per region (2001–2012)
-6.0%
-4.0%
-2.0%
0.0%
2.0%
4.0%
6.0%
8.0%
10.0%
12.0%
14.0%
2001 2002 2003 2004 2005 2006 2007 2008 2009 2010 2011 2012Ave
rage
GD
P gr
owth
(%)
Africa Asia Caribbean Pacific LDCs SIDS
Source: World Bank (2013a)
2 Small States: Economic Review and Basic Statistics

by a decline to 0.4 per cent in 2009. Similarly, small African states experienced relatively steady growth between 2001 and 2007, moving from 2.7 per cent to 6 per cent respectively, before falling to 0.7 per cent in 2009. Following their relatively strong recovery in 2010, African small states have managed to achieve growth rates of around 3 to 4 per cent in 2011 and 2012, somewhat below the peak in the pre-crisis period. Caribbean states have had the most difficulty. The average growth rate of this region was 6.3 per cent in 2006, and fell to −3.5 per cent in 2009; it has not moved above 1 per cent in the subsequent years.
The mediocre performance of small economies is largely the result of their economic structure. Among small states economic production is heavily concentrated on a few activities (tourism, agriculture, fisheries and off-shore financial services), of which tourism is the main industry. As a consequence, these economies are heavily exposed to shocks affecting these sectors. Falling demand for their main exports arising from the economic recession in key trading partners’ economies
has therefore been the main transmission mechanism through which they have underperformed.
Additionally, the consequent fall in both household consumption spending and government final expenditure has also negatively impacted GDP growth. Growth in consumption expenditure fell from 11.2 per cent in 2007 to 2 per cent in 2009. After rising to 4.6 per cent in 2010, household spending again dipped to 1.8 per cent in both 2011 and 2012 (see Figure 1.4).2
Disaggregating household expenditure by regions, the Caribbean was the hardest hit (see Figure 1.5). In the Caribbean, a previously robust consumption expenditure growth of 25 per cent in 2007 fell below zero in 2009 and has registered a rate of −1 per cent each year since. Conversely, African and Asian small states both held steadily to their pre-recession levels of consumption expenditure growth and in 2012, these countries’ growth in household expenditure were at approximately 2 per cent and 5 per cent respectively. These regional differences in spending
Figure 1.4 Annual growth in household consumption in small states (2000–2012)
-2.0%
0.0%
2.0%
4.0%
6.0%
8.0%
10.0%
12.0%
2000 2001 2002 2003 2004 2005 2006 2007 2008 2009 2010 2011 2012
Ann
ual %
gro
wth
in c
onsu
mpt
ion
expe
ndit
ure
Small state average per year 2000–2012 average
Figure 1.5 Annual growth in household consumption in small states by region (2000–2012)
-15.0%
-10.0%
-5.0%
0.0%
5.0%
10.0%
15.0%
20.0%
25.0%
30.0%
2000 2001 2002 2003 2004 2005 2006 2007 2008 2009 2010 2011 2012
Ann
ual %
gro
wth
in c
onsu
mpt
ion
expe
ndit
ure
Africa Asia Caribbean
Recent Economic Trends in Commonwealth Small States 3

patterns reflect the real GDP performance levels, as described above.
In addition to consumption spending, government expenditure growth in small states dipped in 2009 and 2011 (see Figure 1.6).3 The performance in consumption spending and government final expenditures seen in the African and Asian small states was reflected in the robust real GDP growth performance. In contrast, the Caribbean small states registered notably low consumption spending and government expenditure and weak GDP growth.
1.3 Prospects for small states' GDP growth in 2014 and beyond
With the world economy recovering, growth is expected in small economies. Small states’ overall GDP is expected to reach a height of 5.1 per cent in 2014 and 5.7 per cent in 2015. These projections are significantly above the world forecast. However, this aggregate picture hides considerable regional disparities, with African and Asian small states fuelling the improved outlook. These small states are at risk of overheating (World Bank 2013b). At the same time, Caribbean small states are below pre-crisis growth while the Pacific small states are making a steady recovery.
1.4 Inflation and the consumer prices index
Global price inflation fell from 3.75 per cent in 2012 to 3.25 per cent in 2013 (IMF 2013a), a trend that is expected to persist into 2014 due to a projected fall in food and fuel prices (Beidas-Strom et al. 2013).
Risks to the inflation forecasts include quantitative easing in Japan, asset price bubbles and excess leveraging
in fast-growing East Asian economies, and the potential increases in commodity prices fuelled by increased demand. In advanced economies, inflation is expected to decline from 2 per cent to 1.75 per cent during 2013 to 2015. In emerging and developing economies, the forecast is for a deceleration in inflation rates spurred on by falling food and fuel prices. There are, however, threats to this prospect from oil-exporting transitioning Middle Eastern and North African (MENA) economies. Although developing economies have experienced increased oil prices due to unexpected shocks, overall decelerating inflation is expected.
The same trend of low inflation is expected in small states economies, following the trend shown in Figures 1.7 and 1.8.4
Across all small states, inflation, as measured by average consumer prices index (CPI), has decelerated from its 2008 peak of 10 per cent to 4 per cent in 2012–2013. This downward trend is expected to persist into 2015, commensurate with global inflation trends (see Figures 1.7 and 1.8). It is evident from Figure 1.8 that African small states benefited more from a sharp deceleration of inflation moving from double digits in 2008–2009 to single digits in 2010–2012. Caribbean, Asian and Pacific small states exhibited similar patterns to their African counterparts, as inflation fell between 2008 and 2012. This trend, while expected to continue for Asian, Caribbean and Pacific small states, is likely to be different for states in Africa, where it is expected to be sticky upwards as increased demand puts upward pressure on commodities prices.
1.5 Unemployment
Unemployment in small states remained in double digits in 2011. The improved growth prospects post-2009 seemed not to have translated into a reduction in
Figure 1.6 Government expenditure growth rate by region and aggregate average for small states (2000–2012)
-2%
0%
2%
4%
6%
8%
10%
12%
-10%
-5%
0%
5%
10%
15%
20%
25%
2000 2001 2002 2003 2004 2005 2006 2007 2008 2009 2010 2011 2012
regi
onal
ave
rage
(%)
Gov
ernm
ent
fina
l exp
endi
ture
gro
wth
(%
)
YEAR
Africa Asia Caribbean LDCs Annual regional average 13 year regional average
4 Small States: Economic Review and Basic Statistics

unemployment rates. In 2011, the unemployment rate was 11.5 per cent,5 2.4 percentage points higher than the 2007 level of 9.1 per cent (see the green line on Figure 1.9). High unemployment and a migrating skilled workforce are major concerns for small states seeking to accelerate growth, requiring the necessary skills to facilitate research and development among their fledgling industries. Developing a skilled workforce and reducing unemployment are key policy priorities (OECD 2013a).
1.6 International trade
Since 1980, international trade has been growing by an average of 7 per cent per year, and at the end of 2011 its value stood at US$18 trillion. Reductions in tariffs and trade barriers have led to a doubling of world trade, with developing countries accounting for the bulk of this increase. Over the last decade, developing economies have increased their share of world exports. Furthermore, the ‘South–South’ share in world trade has risen substantially. While there has been a modest increase in the North–South share of world trade, the ‘North–North’ share has fallen since 1990.
In 2012, developing economies’ exports grew by 3.5 per cent, while imports increased by a higher 4.3 per cent. Africa represented the fastest growing region, with a 6.1 per cent growth in exports volumes. Africa also led in real imports expansion, with double-digit growth of 11.3 per cent. Asia’s imports grew 3.7 per cent. Slower growth in world trade was projected for 2012 and a sluggish performance was expected in 2013. This slower growth rate is a result of the continued and renewed uncertainty in the euro, falling trade within the EU, significant downside risk in the EU and divergent prospects for US and EU trade. These factors have led to reduced export volumes from the EU, which add significant weight to world trade volume totals, therefore causing uncertainty in forecast projections in world trade volumes (OECD 2013a).
Among small states, Belize recorded the highest relative increase in trade (both imports and exports) between 2009 and 2011.6 Over the same period, exports fell slightly in Solomon Islands, Antigua and Barbuda, and St Vincent and the Grenadines. Imports also dropped in the latter two countries.7
Figure 1.7 Aggregate consumer price inflation annual change for small states (1999–2012)
0.0%
2.0%
4.0%
6.0%
8.0%
10.0%
12.0%
1999 2000 2001 2002 2003 2004 2005 2006 2007 2008 2009 2010 2011 2012
CPI
infl
atio
n (%
)
Figure 1.8 Inflation, consumer prices index (CPI) change in small states by region (1999–2012)
-4.0%
-2.0%
0.0%
2.0%
4.0%
6.0%
8.0%
10.0%
12.0%
14.0%
16.0%
1999 2000 2001 2002 2003 2004 2005 2006 2007 2008 2009 2010 2011 2012Ann
ual C
PI in
flat
ion
% c
hang
e
Africa Asia Caribbean Pacific
Recent Economic Trends in Commonwealth Small States 5

1.7 Development aid
The Organisation of Economic Co-operation and Development (OECD) recently completed its sixth comprehensive Development Assistance Committee (DAC) survey on donors’ spending plans. This information tracks future aid receipts by developing countries using country programmable aid (CPA) as an overall predictor of future official development assistance (ODA)8 (although some discrepancies may arise from multi-year planning and unforeseen delays in aid programme implementation). The survey forecasts an overall decline in development assistance in 2012–13. The CPA estimate for 2012–13 was US$92.9 billion, a 1 per cent decline from its 2011 level. However, this decline is expected to be offset by the 36 per cent increase in non-DAC donations totalling US$1 billion. These non-DAC donors are a diverse group of non-traditional donors.9 Development aid will be further enhanced by soft loans from the International Development Association (IDA) and the International Fund for Agricultural Development (IFAD).
As Figure 1.11 indicates, aid disbursements to small states have on average increased from US$55 million
in 2006 to US$115 million in 2011. This figure is in line with the increase forecast for 2013 and 2014. Similarly, average aid commitments10 have mirrored the upward trend in aid disbursement, which rose from an average of US$76 million in 2006 to US$133 million in 2012. Promised increases from larger bilateral donors have put disbursement on an upward trajectory (OECD 2013b).
However, global CPA is projected to stall in the years 2014–2016 as a result of the uncertainties in the world economy (ibid). However, the OECD’s Outlook on Aid Survey expects a slight increase in development aid for countries pursuing the Millennium Development Goal (MDG) gaps and those with high poverty levels (ibid). This expected increase shows the international community’s commitment in transitioning to the post-2015 era by directing resources to areas where they are most needed (United Nations 2013).
Further statistics on ODA disbursements and commitments and on aid dependency in individual small states can be found in Tables 29 and 30 in Part II of this publication.
Figure 1.9 Unemployment in small states (2000–2011)
0
2
4
6
8
10
12
14
2000 2001 2002 2003 2004 2005 2006 2007 2008 2009 2010 2011
Une
mpl
oym
ent
(%)
Figure 1.10 Annual % change in world trade volumes (exports and imports) across regions (2008–2013)
40 20
15
10
5
0
–5
–10
–15
30
20
10
0
Expo
rts
and
impo
rts
volu
me
(%) c
hang
e
Ave
rage
200
8-20
13, w
orld
mer
ch. t
rade
vol
(%) c
hang
e
–10
–20
–302008 2009
Developed economies Developing economies and CIS EU
China
Africa
AsiaJapan
Average 2008–2013
US
World merchandise trade volumes
2010 2011 2012 2013 2008 2009 2010 2011 2012 2013
6 Small States: Economic Review and Basic Statistics

1.8 Remittances
In 2013, remittances to developing countries were expected to reach US$414 billion, an increase of about 6.3 per cent, and to continue this upward trend into 2017 (World Bank 2013c).
Small states are expected to benefit from this increase in remittances (see Figure 1.12 and Table 16 in Part II). Overall, average remittances to small states have risen from US$328 million in 2002 to US$525 million in 2012, and are projected to rise further in the following years. In nominal terms, Caribbean small states have received more than their African, Asian and Pacific counterparts. In the Caribbean, average remittances increased from US$155 million in 2002 to US$276 million in 2012. In African small states, the figure rose from US$126 million in 2002 to US$176 million in 2012. Over the same period, remittances to Pacific small states grew from US$26 million to US$66 million (see Figure 1.12).
However, remittances as a share of GDP are, on average, smaller in Caribbean and African small states than they are in Asia-Pacific states (see Figure 1.13). Furthermore, the remittances share of GDP has been falling for Caribbean small states over the past five
years. In addition, while the value of remittances to Asia-Pacific countries is relatively small, it represents more than 6 per cent of GDP, but has been on a downward trend since 2009. With regard to African small states, their flow of remittances relative to GDP rose significantly in 2012.
1.9 International reserves
The total international reserves of small states fell by 0.4 per cent in 2012, following growth of 9.2 per cent in 2009. The decline in reserves growth is attributed to the recession, as some small states faced declining demand for their main exports (Dominguez 2012). These figures are forecast to increase between 2013 and 2016 in line with the continued pick-up in global economic activity. See Figure 1.14.
1.10 Foreign direct investment
The challenges in the global economy also affected the level of foreign direct investment (FDI) in some small states (see Figure 1.15). FDI inflows to Caribbean small states declined steadily during the economic crisis, falling by about 65 per cent from a 2008 peak value
Figure 1.12 Remittances to small states by region (2002–2012)
0
50
100
150
200
250
300
2002 2003 2004 2005 2006 2007 2008 2009 2010 2011 2012
US
$ m
illio
n
Africa Asia Caribbean Pacific
Figure 1.11 ODA disbursements and commitments in small states (2006–2011)
55
68
97 96108
115
76
105
139
121
144133
0
20
40
60
80
100
120
140
160
2006 2007 2008 2009 2010 2011
OD
A d
isbu
rsem
ents
and
com
mit
men
ts
(US
$ m
illio
ns)
Disbursements Commitments
Recent Economic Trends in Commonwealth Small States 7

of US$558 million to US$198 million in 2011. Pacific small states also recorded poor FDI inflows during the same period, falling from US$72 million in 2008 to just US$18 million in 2011. The upward trend in FDI inflows into Pacific small states, which appeared before the recession, has been replaced by a downward trend. However, the trend in FDI flows has been different for African and Asian small states, which maintained an upward trend – reaching post-crisis levels of US$256 million and US$745 million, respectively.
Across small states the average ratio of FDI as a percentage of gross capital formation fell during the recession. However, an upward trend is now emerging. FDI was 35 per cent of gross capital formation pre-crisis and now stands at 21 per cent.11 Table 26 in Part II of this publication provides information on FDI inflows at a country level.
1.11 Ease of doing business
Some small states showed improvements in their business environments, according to the 2013 ‘ease of doing business’ ranking.12 Cyprus, Brunei Darussalam,
Fiji, Jamaica and Mauritius all gained increases in the ranking, with Mauritius maintaining the top rank among Commonwealth small states at 19, up from its previous rank at 23. However, other small states faltered. Most notably, Antigua and Barbuda, Solomon Islands and Grenada have all fallen in the business ranking. Despite having the lowest rank among Commonwealth small states at 136, Lesotho has shown improvement against its 2012 rank of 143.
A closer look at the ten indicators which make up the ‘ease of doing business’ index revealed that small states tend to rank lower in the areas of access to credit and contract enforcement, but higher in construction permit issuance and access to electricity (see Table 33 in Part II of this publication).
1.12 Small states' global competitivenessSome developing economies and small states have recorded increases in their rankings in the World Economic Forum’s Report on Global Competitiveness
Figure 1.14 Total reserves in small states (2005–2012)
937
1,166
1,386
1,141
1,301 1,338
1,467 1,462
0
200
400
600
800
1,000
1,200
1,400
1,600
2005 2006 2007 2008 2009 2010 2011 2012
Tot
aL re
serv
e 20
05–2
012
aver
age
(US
$ m
illio
n)
Figure 1.13 Remittances as a share of GDP in small states by region (2009–2012)
0
1
2
3
4
5
6
7
8
9
2009 2010 2011 2012
Rem
itta
nces
as
% o
f GD
P
Caribbean Africa Asia-Pacific
8 Small States: Economic Review and Basic Statistics

2013–2014 (World Economic Forum 2013). Thirteen small states were included in the survey, and nine of these were ranked below 100 for the overall index. Economies in the index are classified into three stages. Stage 1 represents factor-driven economies. Here, countries are trying to forge a competitive edge by improving the health and education sectors, developing their key institutions and infrastructure, and achieving macroeconomic stability. Lesotho falls into this category. In stage 2, countries are efficiency driven and depend on the key factors of higher education and training, goods and labour markets efficiency, financial market sophistication, technological readiness and market size to improve competitiveness. Mauritius, Namibia and Swaziland are in this category. Innovating economies fall under stage 3. Among Commonwealth small states, Cyprus and Malta are classified under this stage, while Trinidad and Tobago and Barbados are thought to be transitioning to this stage. Countries in stage 3 rely on innovation and business sophistication to forge a competitive edge for their economies. Among small states, Brunei Darussalam remains the most competitive improving and Swaziland has the lowest
ranking. Improvements were recorded by Barbados, Mauritius, Namibia and Seychelles (see Table 1.1) (World Economic Forum 2013).
1.13 Human development indicators
The Human Development Index (HDI) is a composite statistic of life expectancy, education and income indices used to rank the 187 countries listed in the report as having very high, high, medium or low human development according to their quartile in the HDI distribution. As Table 1.2 shows, five small states are ranked in the ‘very high’ category – with Seychelles moving from high to very high. Ten small states are now in the ‘high’ category, while eleven small states are in the ‘medium’ category (as Tonga and Belize have regressed). The ‘low’ category remained unaltered.
Despite the generally good HDI scores, small states are still highly vulnerable economically and socially. The evidence of small states’ success in capitalising on their positives often belies the extent of effort required to achieve their development goals and the ease with which their development gains can be eroded. Indeed, small states have been slow to recover from the global recession
Figure 1.15 FDI inflows to small states by region and FDI inflows as a percentage of gross capital formation (2003–2011)
FDI i
nflow
s (U
S$
mill
ions
)(a
nnua
l ave
rage
)
1400
1200
1000
800
600
400
200
02003
Africa Asia Caribbean Oceania (Pacific) FDI as % of gross capital formation
2004 2005 2006 2007 2008 2009 2010 20110% FD
I as
% o
f gro
ss c
apit
al fo
rmat
ion
5%
10%
15%
20%
25%
30%
35%
Table 1.1 Components of the global competitiveness index (2013–2014)
Country name Overall index ranking
Basic requirements ranking
Efficiency enhancers ranking
Innovation factors ranking
Botswana 74 66 93 106Guyana 102 107 103 56Jamaica 94 111 79 75Lesotho 123 119 132 135Mauritius 45 42 61 57Namibia 90 85 99 102Seychelles 80 52 95 62Swaziland 124 114 123 110Barbados 47 35 43 48Brunei Darussalam 26 18 65 54Cyprus 58 51 49 50Malta 51 40 47 49Trinidad and Tobago 92 60 82 92
Recent Economic Trends in Commonwealth Small States 9

of 2008 and still face relatively high unemployment rates. High per capita income in small states is often taken as evidence of their progress, but masks the lack of progress in many other areas crucial for the achievement of resilience and sustainable development. The recent Commonwealth-commissioned study, The Big Divide: A Ten Year Report of Small Island Developing States and Millennium Development Goals (Roberts and Ibitoye 2012), illustrates small states’ limited achievement of the Millennium Development Goals (MDGs) to date and highlights aspects of the MDG framework, and the institutional and governance frameworks which underpin it, that are not well attuned to the interests of small states.
1.14 Regional and country analyses
1.14.1 African small state economies: a snapshot
See Figures 1.16 and 1.17 for a snapshot of African small state economies.
1.14.2 Summary of developments, outlook and policy priorities in African small states
The robust projection of real GDP growth among African small states will be spurred on mainly by strong demand, private consumption and investment growth, and increased export activities. Average real GDP growth was 3.1 per cent in 2011 and 3.7 per cent in 2012. The brief interruption to growth in 2009 was mainly due to civil conflicts in some countries and a reduction in oil supply and exports. These economic impediments are expected to give way in 2014–2015, to make for a more nuanced increment in real GDP growth in this region. Thus it was projected that growth would reach 5.5 per cent in 2013. Furthermore, improved investment in infrastructural projects and the strengthening of productive capacity, coupled with a robust showing in consumption, will put upward pressure on real GDP growth. Consequently, real GDP
growth is projected to reach 6 per cent in 2014. Both low- and middle-income countries in the region will see improvements in economic activities. There is expected to be some deterioration in the current account of some low-income countries, but investments will boost demand in the medium term to make possible improvements to the current accounts position.13 A projected improvement is also in the cards for inflation, which was 10 per cent in 2011. It was expected to fall to 8 per cent in 2012 and the downward trend was forecast to continue in the following years. This improvement in regional inflation will be helped by the fall in food and fuel prices in the eastern region as monetary policy tightens. Although temporary ‘headwinds’ from regions embarking on energy subsidy reforms will see some upwardly sticky prices, inflation was expected to reach 7 per cent by the end of 2013. The main risks to the economies in this region are those stemming from the external environment, more so political and domestic security risks. The IMF reckons policy-makers should strive to make growth more inclusive by promoting reform in economic diversification, employment, financial sectors and infrastructural gaps (IMF 2013a). Countries undertaking price and fuel regulations should also take note of the budgetary consequences, as shocks to these commodities are vivid possibilities (ibid).
Botswana
In Botswana recovery from the recession had gathered pace since 2010, but has since slowed due to the fall in global diamond demand. As a result, mining activities declined and the growth of real GDP slowed to 6.1 per cent in 2011 and to 3.7 per cent in 2012/2013 (Part II, Table 2). This deceleration in real activities was expected to continue into the first quarter of 2014. Inflation is expected to decline as a result of this slowdown in real GDP, albeit real GDP will remain at 4 per cent until 2014 quarter one. Inflation is within the Bank of Botswana’s (BOB) target range of 3–6 per cent, falling from 8.5 per cent in 2011 to 3 per cent in May 2013. This movement is
Table 1.2 Human development trends in small states (2012–2013)
Very high HDI High HDI Medium HDI Low HDI
Brunei Darussalam (30) The Bahamas (49) Tonga (95) Solomon Islands (143)Cyprus (31) Grenada (63) Belize (96) Papua New Guinea (156)Malta (32) Antigua and Barbuda (67) Samoa (96) Lesotho (158)Barbados (38) Trinidad and Tobago (67) Fiji (96)Seychelles (46) Dominica (72) Maldives (104)
St Kitts and Nevis (72) Guyana (118)Mauritius (80) Botswana (119)St Vincent and the Grenadines (83) Kiribati (121)Jamaica (85) Vanuatu (124)St Lucia (88) Namibia (128)
Swaziland (141)
10 Small States: Economic Review and Basic Statistics

consistent with the medium-term objective of the BOB. The IMF reckons that the ‘prudent macroeconomic management’ of the Botswana government has strengthened its fiscal position. For the first time since 2008/2009, the budget was in a strong balanced position as at fiscal year 2012/2013, helped in part by an accommodative monetary policy. In an attempt to support expectations of robust non-mining growth in the first quarter of 2014, the government has designed a ‘pro-growth’ budget geared towards ‘consolidating a weak economic environment by reining in spending, committing to growth-promoting capital projects and rebuilding capital buffers by improving the quality of spending’. The government has also committed to simplifying the tax system, which should lead to more cost-effective tax administration and improved tax compliance in Botswana. With regard to the banking system, it is well capitalised and profitable. There is a low number of non-performing loans. This follows from the government’s commitment to financial stability, which is centred on the moderation of household unsecured borrowing. These commitments, together with the implementation of the 10th National Development Plan (NDP10), are expected to create a well-diversified private sector and lead to economic productivity as well as enhanced competitiveness. Botswana recognises that for this development agenda to succeed, the necessary institutions must be put in place to develop and improve
the skills of the general labour force and to expand the knowledge-base sector. The liberalisation of the services sector and reducing the regulatory burden are regarded as requirements to help foster growth measures.
Lesotho
Output growth in Lesotho showed moderately decreased progress in 2011 and 2012, after a major rebound in 2010. Nonetheless, there is optimism that growth in Lesotho will reach an average of 4 per cent in the years 2013 to 2015. This growth is expected to be driven by a robust recovery in agricultural production and increased activities in diamond mining. There was a dip in inflation to 4.6 per cent in June 2013, in line with the fall in international commodity prices. On account of the anticipated increase in export demand, Lesotho’s international reserves and fiscal positions are expected to improve – augmented especially by the boost to revenue collection from the South African Custom Union (SACU). International reserves were projected to reach a gross of US$1 billion in 2013, which is equivalent to four and a quarter months of imports and represents an increase on its 2012 level of three and a half months of imports. There are, however, a number of downside risks to these economic projections. The revenue from SACU depends largely on the shape of the global economy, the global external demand for and the international market price of key exports like diamonds and textiles.
Figure 1.17 CPI inflation in African small states (2003–2012)
25
30
35
40
20
15
CPI
infl
atio
n (%
)
0
5
10
–52003
Botswana
Seychelles
The Gambia
Swaziland
Lesotho Mauritius
Small states averageNamibia
2004 2005 2006 2007 2008 2009 2010 2011 2012
12
10
8
6
4
2
0
Sm
all s
tate
s av
erag
e C
PI in
flat
ion
(%)
Figure 1.16 Real GDP growth (%): African small states (2003–2012)
15
10
5
Rea
l GD
P gr
owth
(%)
0
–5
–10
2003
Botswana
Seychelles
The Gambia
Swaziland
Lesotho Mauritius
Africa average
Namibia10 year average
2004 2005 2006 2007 2008 2009 2010 2011 2012
7
6
5
4
10 y
ear a
vera
ge (%
)
3
2
1
0
Recent Economic Trends in Commonwealth Small States 11

Additionally, textile exports face downside risks from the expiration of the Africa Growth and Opportunity Act (AGOA) in 2015. It is hoped that non-AGOA exports will increase to counter the proposal. Overall, the economy is expected to benefit from the implementation of policy measures currently fostered under the umbrella of the IMF Extended Credit Facility (ECF). These policies are expected to complement domestic fiscal policy geared towards ameliorating exogenous shocks, enhance the visions set out by the National Strategic Development Plan (NSDP) and bring improvements in fiscal and public financial management.
Mauritius
Similar to Lesotho, Mauritius did not perform as well in 2011 and 2012, but the IMF projected 3.5 per cent growth in 2013 due to prudent economic management. This progress is likely to be driven by increased activities in fishing, financial services and information and communications technology (ICT), fostered by a rise in public investment projects. Inflation fell to 4 per cent in 2013, but there continues to be upward pressure on prices linked to the demand to increase public sector wages and an upward trend in administrative price adjustments. If realised, inflation in 2013 was expected to peak at 5.7 per cent and then decline thereafter. Mauritius’ banking sector has brought a welcome security to the financial system, though price and rental growth in the real estate sector should be closely monitored to ensure that the progress made by the banking sector is not jeopardised. The Economic Intelligence Unit (EIU) reckons that as economic growth in Europe picks up, Mauritius’s GDP growth will quicken to 3.7 per cent in 2014. The pace of expansion will then accelerate to an average of 4.3 per cent in 2015–2018 as global growth continues its upward trend.
Namibia
The Namibian economy was lauded for its prudent economic management before the recession, which enabled it to amass a sufficient fiscal surplus. The advent of the recession and its subsequent prolonged and anaemic recovery prompted the government to embark on an expansionary stimulus policy to cushion the impact of the prolonged downturn. Thus, government finances are in worse health than the pre-crisis level. The fiscal deficit was 9 per cent of GDP in 2012 and is projected to fall to 4.4 per cent of GDP in 2013/2014. However, the government is committed to fiscal expansion via its Medium-Term Expenditure Framework (MTEF), which will further strengthen the recovering economy by channelling government spending to foster economic expansion and economic growth. Public debt is projected to reach 27.8 per cent in 2015 and 30.7 per cent in 2016. On a positive note, these figures are
sustainable at just below the 35 per cent debt-to-GDP threshold. A moderation of real GDP growth from 5.0 per cent in 2012 (Part II, Table 2) to 4.2 per cent in 2013 is expected as diamond prices further deteriorate. Other major downside risks are due to elevated uncertainties emanating from the global economy, a possible fall in revenues from the South African Customs Union (SACU) and weather-related shocks.
Seychelles
The tourism sector has performed remarkably well and, since the global recession, it is currently the main engine of growth for the Seychelles economy. Growth held at 2.9 per cent in 2012 as the country successfully attracted non-European arrivals to mitigate the slump in the European market. It is expected that growth will hold steadily at this level until 2014/2015 – some way short of the 5 per cent projected in 2011. The fall in FDI and the impact of rising food and fuel prices affected macroeconomic fundamentals and detracted from the expected growth forecast. The current account deficit is expected to improve slightly in 2014–2015 to an average of 0.8 per cent of GDP, supported by growth in tourism and lower import prices. Tourism grew by 8 per cent in 2012 and is expected to improve as further non-traditional markets are explored. The inflation level peaked at 7.1 per cent in 2012, fuelled mainly by domestic and international developments due to exchange-rate instability that prompted a depreciation in the rupee. Inflation, however, has now abated due to fiscal tightening. The government has committed to reducing debt to 50 per cent of GDP by 2018.
Swaziland
Despite increased windfall revenue from the South African Custom Union (SACU) in 2012 and a 0.2 per cent projected growth for 2012, Swaziland’s economic performance was relatively moderate. The 2012 official estimate indicates contraction in real GDP of −1.5 per cent (Part II, Table 2), attributed to the delayed impact of the fiscal crisis, structural bottlenecks and subdued global recovery. Real GDP growth was forecast to reach 0.7 per cent in 2013, then 1.8 per cent in 2014/2015. These forecasts are, however, constrained by weak competitiveness in Swaziland’s manufacturing sector. Inflation remained in single digits, despite upward pressure on food and fuel prices, notching up 6.1 per cent in 2011, then to 9.4 per cent in 2012 (Part II, Table 6) and 6 per cent in 2013. Inflation in 2014 is expected to fall to 5.3 per cent.
1.14.3 Asia-Pacific small state economies: a snapshot
See Figures 1.18, 1.19 and 1.20 for a snapshot of Asia-Pacific small state economies. There are improved economic prospects in Asian small states, as the risk in
12 Small States: Economic Review and Basic Statistics

Western economies dissipates and growth is sprouting in some advanced economies. Growth in Asia was expected to average 5.75 per cent at the end of 2013. This increase is expected to be supported by the easing of financial conditions, especially the rapid credit growth in China and the general rebound of credit in the region. An increase in demand from China and a stimulus package in Japan will further boost growth in the Asia-Pacific area. Stability in global food and commodity prices is expected to keep inflation stable at its 2012 level or within central banks’ target zones (IMF 2013c). However, the Asian Development Bank (ADB) argues that the Asia-Pacific area growth rate has lost steam, owing to the fall to 6 per cent in 2013 from a projected 6.6 per cent in 2012. ADB now forecasts that GDP growth within the Asia-Pacific area will increase by 6.2 per cent, 0.5 per cent below that originally predicted.
1.14.4 Summary of developments, outlook and policy priorities for Asia-Pacific small states
Brunei Darussalam
Two-thirds of nominal GDP in the Brunei Darussalam economy is made up of oil and gas production. These products represent 98 per cent of exports and 93 per cent of government revenue. Thus, the government has been able to fund welfare, social benefits and public
sector jobs for citizens. The government is a key player in the economy. It employs 56 per cent of the workforce, while contracts to private enterprises in the non-energy sector are also dominated by government. The lack of major contracts to refurbish key infrastructure in the oil and gas industry led to a decline in real GDP growth of 2.2 per cent in 2012 (Part II, Table 2) as energy sector output fell by 3.2 per cent. This fall was, however, mitigated by 5.1 per cent growth in the non-energy sector. Though there are major risks from volatility in petroleum revenues, the surplus account should enable the government to mitigate any fall in revenues due to oil price shocks and maintain sustainable growth and employment levels. The long-term strategy remains to diversify the economy away from the energy sector and boost non-energy output and employment.
Fiji
The Fijian economy benefited from strong consump-tion and investment, as tourism and public infrastructure investments registered impressive figures despite the adverse effects of three natural disasters in 2012. Investment was forecast at 25 per cent of GDP in 2013, up from its 2012 figure of 18 per cent of GDP. The growth of real GDP was 2.2 per cent in 2012 (Part II, Table 2) and was expected to be 3 per cent in 2013. In 2014, real GDP growth is forecast at 2.3 per cent on account of strong consumption spending linked
Figure 1.18 Real GDP growth (%): Asia-Pacific small states (2004–2012)
0 1 2 3 4 5 6 7 8 9 10-15
-10
-5
0
5
10
15
20
25
2004 2005 2006 2007 2008 2009 2010 2011 2012
Rea
l GD
P gr
owth
(%)
Brunei Darussalam Maldives Kiribati Papua New Guinea Solomon Islands Samoa
Tonga Tuvalu Vanuatu Fiji Asia-Pacific average 9 year average
Figure 1.19 CPI inflation in Asia-Pacific small states (1999–2012)
0.0
2.0
4.0
6.0
8.0
10.0
12.0
-5.0
0.0
5.0
10.0
15.0
20.0
1999 2000 2001 2002 2003 2004 2005 2006 2007 2008 2009 2010 2011 2012
Sm
all s
tate
s av
erag
e C
PI in
flat
ion
(%)
CPI
infl
atio
n (%
)
Years
Maldives Small states averageBrunei Darussalam
Recent Economic Trends in Commonwealth Small States 13

to a reduction in the income tax rate and a boost in infrastructural spending of about $225 million, which will be centred on building new transport infrastructure to further enhance the 2015/2016 growth prospects. The inflation rate was expected to be 4.3 per cent in 2013 and then 4 per cent in 2014/2015. Given the muted inflationary expectations, the IMF advises that the current accommodative monetary stance is the appropriate policy measure, and the government’s anticipated move towards a more flexible exchange rate regime should better withstand shocks. There have been accelerated structural reforms in the sugarcane sector, the civil service, pensions and public enterprises; the major policy issues are fostering sustainable growth, reducing poverty and increasing resilience to shocks.
Kiribati
Real GDP growth in Kiribati was 2.5 per cent in 2012 compared to 1.8 per cent and 1.4 per cent in 2011 and 2010 respectively (Part II, Table 2). Real output is projected to be 2.9 per cent in 2014, and 2.4 per cent in 2015. The predicted improvements are due to increased investment activities in construction, particularly the airport and seaport construction projects. The above-average increase in licensing revenue in 2012 is expected to decline in 2014–2015, in conjunction with the fall in remittances from seamen as a result of the decline in global shipping activities. The current account deficit was 31 per cent of GDP in 2012 and was expected to be 41 per cent of GDP in 2013 and 36.1 per cent of GDP in 2014. The end of year inflation rate, which was −2.9 per cent in 2012 owing to lower rice and staples prices, was projected to rise to 2.5 per cent in both 2013 and 2014. The fiscal deficit was expected to be 18 per cent of GDP in 2013 and 20 per cent of GDP in 2014. Ongoing reforms will be centred on the tax system, public financial management, state-owned enterprises and the private sector.
Maldives
In 2012, there was a major deceleration in tourist activities – the main engine of growth in the Maldivian economy, accounting for around 30 per cent of GDP and about 60 per cent of foreign currency earnings. Tourism activities slumped to 2.6 per cent in 2012 from a high of 17.6 per cent in 2011. This decline was attributed to a weakening of the European tourism market share to 54 per cent from a previous five-year average share of 70 per cent. As a result, real GDP growth slowed from 7 per cent in 2011 to just 3.4 per cent in 2012 (Part II, Table 2). Other sectors of the economy – wholesale trade, transportation and communications – also performed poorly. Real GDP growth was projected to reach 4.3 per cent in 2013 and then rise to 5.5 per cent in 2014/2015. This increase in the economic outlook is tied to an expected doubling of the Maldives’ share of the Asian market to 38 per cent. Inflation is forecast to be high, but expected to stay within single digits at 9.3 per cent in 2013 and at 8.5 per cent in 2014. The current account balance was projected to be −27.8 per cent of GDP in 2013 and −22 per cent GDP in 2014/2015. One major policy concern is the strengthening of government finances, as debt is set to reach 80 per cent of GDP in 2013/2014. Adopting realistic and prudent budget management will be central in this regard.
Nauru
Although increased activities in phosphate production and exports, which peaked in 2012 at a high of 519,000 tonnes, helped GDP reach a growth rate of 4.9 per cent in 2012, the main impetus of growth in Nauru’s economy will be infrastructural development. The Regional Processing Centre (RPC) for asylum seekers reopening in 2012 was projected to boost economic growth by more than 8 per cent in 2013 and 2014 through its impact on construction, hotels
Figure 1.20 Current account balance in Asia-Pacific small states (2005–2012)
-40
-30
-20
-10
0
10
20
30
40
50
2005 2006 2007 2008 2009 2010 2011 2012
Cur
rent
acc
ount
bal
ance
(%) o
f GD
P
Brunei Darussalam Fiji Maldives Papua New Guinea Solomon Islands
Samoa Tonga Vanuatu Small states average
14 Small States: Economic Review and Basic Statistics

and accommodation, restaurants, retail trade and government finances. The RPC expansion is likely to boost employment for Nauruan workers – employment was expected to increase from 200 in 2011 to 10,086 in 2012/2013. This increase in employment should in turn boost consumption expenditure and hence growth. GDP growth is expected to reach a high of 8 per cent by the end of 2014. Inflation was forecast to be 0.5 per cent in 2013 and 2.5 per cent in 2014.
Papua New Guinea
Papua New Guinea, with a real GDP growth of 8 per cent in 2012 (Part II, Table 2), remains the biggest and fastest developing economy in the Pacific region. The key driver of growth since 2011/2012 has been construction projects related to liquefied natural gas, which contributed about 4.5 per cent of total GDP growth for 2012. Two per cent was added by transport, finance and trade due to the increased demand spurred by increases in activities generated by liquefied natural gas construction projects. As construction projects slowed down in 2013, real GDP growth was expected to be 5.5 per cent and to average 6 per cent in 2014. Output growth is expected to be hampered further by declining activities in the fisheries, forestry and agricultural sectors. It was predicted that inflation would be 6.5 per cent in 2013 and 7.5 per cent in 2014/2015. Future growth is expected to be led by increased activities in the mineral sector, which is projected to expand by 13 per cent at the end of 2015 as various production bottlenecks clear in the gold and copper mines. Reductions in petroleum production are to be offset by growth in mineral outputs of about 60 per cent. According to the Asian Development Bank (ADB), the current account balance would be −15.1 per cent of GDP in 2013 and then −8.4 per cent of GDP in 2014.
Samoa
The cyclone disaster that occurred in December 2012 in Samoa was expected to slow GDP growth to 1 per cent by the end of 2013. In 2014, growth is projected to recover and reach about 3 per cent, stabilising at around 2.5 per cent in the ensuing period. As a result of drought conditions, inflation rose to 11.4 per cent in 2011, but stabilised to an average of 2 per cent in 2012 (Part II, Table 6). This normalisation is largely the result of stabilisation in food prices. The effect of drought and forecast decline in commodity prices is expected to lead to inflation at 1.5 per cent in 2013/2014. The government has put its fiscal consolidation on hold to set a supplementary budget for post-cyclone recovery and reconstruction projects, which have taken expenditure up to an additional 0.8 per cent of GDP. Further rehabilitation work using donor funds is expected to cost in the neighbourhood of 2.4 per cent of GDP.
Solomon Islands
GDP growth in Solomon Islands dropped to 3.9 per cent in 2012, subsequent to more remarkable performances of 7 per cent and 9 per cent in 2010 and 2011 respectively (Part II, Table 2). The 2012 growth rate was helped in part by increased mining activities and from the Festival of Pacific Art. Growth in 2013 was expected to moderate to between 3.5 per cent and 4 per cent as uncertainties in forestry adversely feed into depletions of logging stocks. Economic growth in 2014 and beyond is anticipated to be driven by the mineral and service sectors. The growth moderation that started in 2012 has helped to temper inflation, which stood at 2.6 per cent (Part II, Table 6) at the end of this period. The inflation rate is forecast to rise to 6 per cent in the ‘near-term’ and to stabilise at 4.5–5 per cent in the medium term. The lack of a well-diversified economy means that the potential impact of external shocks – from natural disasters, increases in food and oil prices, and a slowdown in trading activities with major partners – remain a considerable risk. Gross international reserves are at an all-time high at US$500 million, with government debt at 17.5 per cent of GDP. According to the IMF, the key policy initiative in the medium to long term is for a sustained effort committed to a broader-based and inclusive growth initiative to counter and mitigate the effects of shocks.
Tonga
Economic growth in Tonga is expected to recover in 2013–2014 and peak at about 1.5 per cent after the slowdown of 0.8 per cent 2011/2012. This projected improvement is underpinned by an increase in tourism revenues and remittances. There was inflation of 6.3 per cent in 2011, but price growth decelerated to 1.2 per cent in 2012 (Part II, Table 6) and then further to 0.5 per cent in 2013, on grounds of lower food and fuel prices. Inflation is projected to strengthen to 5.5 per cent in 2014/2015. The overall 2013 budget initiative aimed to eliminate the budget deficit, which declined to within 2.5 per cent of GDP in 2012/2013 from a high of 7.6 per cent of GDP in 2011/2012. The current policy mix of fiscal consolidation and monetary accommodation appears to be reaping success for deficit reduction. The main policy issue in Tonga is deregulation of the judiciary, and policy co-ordination is expected to help with the planned boost in investors’ confidence and strengthen growth prospects. Tonga also recognises the need for reform of business licensing to encourage foreign investment.
Tuvalu
Real GDP was projected to grow at a rate of about 1.3 per cent by the end of 2013 and to reach 1.5 per cent
Recent Economic Trends in Commonwealth Small States 15

in 2014. The growth forecast is expected to be spurred by the Tuvalu airport construction project on the one hand and by increased activities in the retail sector on the other. There are, however, risks to these expectations. Remittances, which provide a substantial source of income for families in Tuvalu, have fallen dramatically from a height of US$1.2 million in 2001 to just US$0.3 million in 2012, and are projected to decline even further. Moreover, shipping contracts, another important source of revenue, also declined. Inflation was expected to stabilise at 2 per cent at the end of 2013. The ADB estimated that the current account, as a percentage of GDP, would level off at −3.3 per cent in 2013.
Vanuatu
There was increased public investment in the tourism sector, the key driver of growth in 2012, as the number of tourist arrivals rose above expectations in Vanuatu. GDP growth increased to 2.3 per cent in 2012, up from the previous 1.4 per cent registered in 2011 (Part II, Table 2). Higher tourist arrivals, coupled with public investment and the commencement of delayed construction projects – to be further boosted by a projected increase in agricultural activities – were noted as key factors for the 2013 growth rate. Vanuatu expected GDP growth of 3.2 per cent in 2013 and 3.4 per cent in 2014/2015. Both inflation and the current account balance as a percentage of GDP are likely to stabilise at 2.5 per cent and −10 per cent respectively between 2013 and 2014. There is real effort on the part of government to control spending, which means that the fiscal deficit could fall to 1.5 per cent of GDP in 2012/2013, 1.7 per cent in 2013/2014 and 1.8 per cent in 2014/2015. Public debt was expected to be at 21.6 per cent of GDP in 2012/2013 and 22.4 per cent of GDP in 2013/2014. The current budget target is for zero net domestic financing and net repayment of external debt. In light of this, the general view is for the balance of payments to remain in surplus. The government’s push for structural reform could boost private investment and growth, despite the risk emanating from an unrealised increase in tourism arrivals and receipts.
1.14.5 Caribbean small state economies: a snapshot
See Figures 1.21, 1.22 and 1.23 for a snapshot of Caribbean small state economies.
1.14.6 Summary of developments, outlook and policy priorities for Caribbean small states14
Although economic recovery has begun in the majority of the tourism-dependent Caribbean small states, real
GDP growth has remained low and subdued. This lacklustre growth is mainly due to the slowing of economic activities in advanced economies. The overall sluggishness in Caribbean small states economies – characteristically reflective of large output gaps and weakened demand – has helped to slow inflation in the region. However, the current account deficits of most tourism-dependent Caribbean small states have widened. The economic outlook for these countries is a modest, yet sluggish, return to growth. Real output was projected to reach 1.25 per cent in 2013, stifled in part by weak competitiveness and high debt. Key policy issues are centred on fiscal restructuring to reduce high debt levels and external account imbalances, coupled with civil service reforms. Deteriorating asset quality, inadequate provisions, low profitability, contagion and associated fiscal costs risk the viability of the financial system in the Eastern Caribbean Currency Union (ECCU). On the other hand, real GDP growth is projected to reach 3.5–4 per cent for commodity-dependent small states in 2013–2014.
Antigua and Barbuda
There are marked improvements in tourism and construction, key sectors of the Antiguan economy. These improvements, coupled with a shrewd fiscal and debt-restructuring programme, have enabled the fiscal deficit to drop to 1 per cent of GDP from 18 per cent of GDP in 2009. The debt-to-GDP ratio is also on a downward trend, moving from a high value of 102.5 per cent of GDP in 2009 to 89 per cent of GDP in 2012/2013. The steady pace of real GDP recovery, which began during 2012–2013, is expected to gather pace and hinges heavily on the performance of the external economy. If expectations are reasonable, GDP growth should return to its historical trend of between 3 per cent and 3.5 per cent. The current account balance was expected to be −11.4 per cent of GDP in 2012, but is projected to reach –16.2 per cent of GDP in 2017.
The Bahamas
The Bahamian economy continues to improve, with impetus from increased tourist arrivals and the commencement of investment projects that were energised by a US$3.5 billion Baha Mar private project. These developments, in conjunction with an increase in public funding for airport and roadwork modernisation, supported GDP growth of 1.8 per cent in 2012 (Part II, Table 2). Growth was forecast to rise to 2.7 per cent in 2013 and to 2.8 per cent in 2014. The recent rise in oil and food prices, which resulted in inflation of 3.5 per cent in 2011/2012, was expected to abate to 2.3 per cent by the end of 2013. The fiscal deficit is projected to
16 Small States: Economic Review and Basic Statistics

average 2.5 per cent by 2015, and thus debt is likely to reach approximately 76 per cent of GDP by 2015/2016. In the medium to long term, bringing forward key tourism projects and energy, transportation and communication infrastructure upgrades, as well as modernisation projects, are expected to boost growth. The key policy commitment for The Bahamas going forward into 2015/16 is to place debt on a ‘downward trajectory’, with the aim of reducing debt to its 2012 levels. Moreover, the government has committed to saving a further 3 per cent of GDP by a combination of consumption taxes, increased savings and reductions in transfers to public corporations through using
well-devised public–private partnership arrangements. The weakened fiscal position, rising debt-service costs, lacklustre employment growth and rising crime represent the government’s main policy challenges.
Barbados
Real GDP growth in Barbados was a modest 0.5 per cent in 2013, following a dip to 0 per cent in 2012 from the positive 0.3 per cent output reached in 2010 (Part II, Table 2). The economy is expected to grow to 1 per cent in 2014, and average around 3.1 per cent between 2015 and 2017. This projection is underpinned by key private and public sector projects: 619 million Barbados
Figure 1.21 Real GDP growth (%): Caribbean small states (2005–2012)
0 1 2 3 4 5 6 7 8 9
-15.0
-10.0
-5.0
0.0
5.0
10.0
15.0
20.0
2005 2006 2007 2008 2009 2010 2011 2012
8.0
6.0
4.0
2.0
0.0
–2.0
–4.0Ave
rage
real
GD
P gr
owth
(%)
Antigua and Barbuda The Bahamas Barbados Belize
Dominica Grenada Guyana Jamaica
St Kitts and Nevis St Lucia St Vincent andthe Grenadines
Trinidad and Tobago
Caribbean average
8 year average
Figure 1.23 Current account balance in Caribbean small states (2005–2012)
-40
-30
-20
-10
0
10
20
30
40
2005 2006 2007 2008 2009 2010 2011 2012
Cur
rent
acc
ount
bal
ance
(%) o
f GD
P
Antigua and Barbuda The Bahamas Barbados Belize
Dominica Grenada Guyana Jamaica
St Kitts and Nevis St Lucia St Vincent and the Grenadines Trinidad and Tobago
Small states average
Figure 1.22 CPI inflation in Caribbean small states (2004–2012)
25
20
15
10
CPI
infl
atio
n (%
)
Sm
all s
tate
s av
erag
e C
PI in
flat
ion
(%)
5
0
–5
2004 2005
Antigua and Barbuda
Grenada
St Vincent and the Grebadines
The Bahamas
Guyana
Trinidad and Tobago
Barbados
JamaicaSmall states average
Belize
St Kitts and Nevis
Dominica
St Lucia
2006 2007 2008 2009 2010 2011 2012
10
12
8
6
4
2
0
Recent Economic Trends in Commonwealth Small States 17

dollars (Bds$) has been earmarked for public projects like the cruise pier and land reclamation project, pier-head marina, the constitutional river project and the church village projects. These will be further supported by a Bds$1,153 million budgeted for the Four Seasons, Port Ferdinand, Platinum Bay and the Sandridge Beach projects. Weakening of demand, large output gaps and falling food and fuel prices are expected to keep inflation low; the projection was for deflation at 0.3 per cent at year-end 2013, rising to 0.7 per cent in 2014 (Part II, Table 6).
Belize
A fall in commodity prices is expected to see average inflation (measured by the GDP deflator) of 1 per cent from the period 2011 (Part II, Table 6) to 2013/14. The inflation rate is expected to remain low, despite the high level of liquidity in the banking sector, as a result of subdued pressure on commodity prices. Belize’s external current account deficit widened to about 1.7 per cent of GDP, up from 1.1 per cent of GDP in 2011, due to a steep drop in oil exports and higher imports of fuel and electricity. Notwithstanding this deterioration, international reserve coverage is estimated at 3.4 months of imports (up from 3 months in 2011), thanks in part to strong FDI inflows from the sugar sector. Despite the significant progress made with ‘cash-flow relief ’, the debt-to-GDP level is expected to remain high and could pose a major threat to growth forecasts; this is a major concern, as debt resulting from ‘mid-valuation’ of the two public utilities could cause financial shortfall in 2016 as a consequence of the compensations paid to shareholders. This in turn could take debt to above 6.5 per cent of GDP in 2016/17 and then 7 per cent thereafter. The key policy issue in Belize will be the amortisation process of the 2038 bond amid the projected 1 per cent GDP rise in debt servicing – this holds significant refinancing challenges for the government.
Dominica
A slowdown in construction activity and a 15 per cent reduction in banana production due to banana leaf disease, as well as a projected slowdown in tourist activities, was projected to slow real GDP growth in Dominica from −1.5 per cent in 2012 to 1.3 per cent by year-end 2013 (Part II, Table 2). The inflation rate averaged 3.25 per cent in 2012, but as food and fuel prices weaken, inflation is expected to remain at a moderate rate of 1.2 to 2.5 per cent over the medium to long term. The current account deficit of 13 per cent of GDP is predicted to be 13 per cent to 15 per cent in 2014–2016; however, FDI and grants should help to finance external borrowing. The positive feedback
from the possibility of geothermal exploration means this avenue should be keenly explored.
Grenada
The Grenadian economy experienced a 6.7 per cent decline in GDP in 2009, followed by a 0.4 per cent output retraction in 2010. The growth situation improved in 2011 and 2012 to 1 per cent and 1.18 per cent respectively. Real GDP was expected to continue on this positive and upward trend in 2013 and afterwards. These forecasts are buoyed by expectations of further recovery in the tourism sector and an improvement in the agriculture sector. Revenue shortfalls caused by an extension of tax-break and exemption policies by the government are expected to widen the current account deficit to 25 per cent of GDP in the period 2013–2014. The IMF argues that the economy could benefit substantially from the ongoing financial sector reform to address weakening credit portfolios, low profitability and the rising levels of non-performing loans.
Jamaica
There was a negative real GDP growth of 0.7 per cent in 2012/2013, as a result of the more than expected weakening in the agriculture, mining and construction sectors. Tourist arrivals – a key driver of growth in Jamaica – improved, but there was a 5 per cent decline in tourism revenue. The fiscal consolidation programme, together with an expected increase in the tourism, construction, agriculture and mining sectors, should allow for an increase in 2013/2014 GDP growth of about 0.8 per cent. Growth is expected to reach 1.8 per cent in 2014/2015 and average 2.5 per cent thereafter. However, there has been a continuous weakening of aggregate demand, while the inflation rate is expected to increase to about 10.5 per cent in 2013/2014, spurred mainly by the depreciation of the exchange rate and increases in prices of utilities and public transport fees. The medium- to long-term inflation projection is 8.8 per cent. High inflation and weak employment growth are likely to dampen private sector consumption as disposable income falls – the official unemployment rate, which was 14.4 per cent in 2012, rose to 16.6 per cent in April 2013. An increase in non-fuel imports, despite larger than expected non-traditional exports, led to a current account deficit of −12.4 per cent of GDP in 2012/2013, which is expected to decrease to −10.8 per cent of GDP in 2013/2014. The key policy priorities for Jamaica are tackling weak domestic demand, a heavy debt burden (125 per cent of GDP), a large current account deficit (12.8 per cent of GDP in 2012) and a high unemployment rate, which could limit growth in 2014–2015 to less than 2 per cent annually.
18 Small States: Economic Review and Basic Statistics

St Kitts and Nevis
Economic activities in St Kitts and Nevis, as represented by real GDP, declined by 1.3 per cent in the fiscal year 2012, a result mainly attributed to the decline in real activities in the tourism and construction sectors. Driven by further increases in tourism and construction, real GDP growth was expected to recover to 2.4 per cent by the end of 2013 and to further increase thereafter. Inflation’s downward trend suggested that the 2013 output level would be below the 2012 level of about 1.4 per cent. The major policy focus for St Kitts and Nevis was for fiscal consolidation of about 2.5 per cent of GDP to be achieved by the year-end 2013 – this was expected to be bolstered by an increased uptake in tax revenue.15
St Lucia
St Lucia’s economy avoided contraction for most of the world’s economic recession, and as such it is now the best performing economy in the Eastern Caribbean Currency Union (ECCU). This is despite its experiencing domestic supply shocks, weakened demand for tourism, natural disasters and a major outbreak of banana leaf disease, which led to a slowdown of 0.4 per cent in GDP in 2012 (from a previous 1.4 per cent in 2011). Real GDP growth was expected to regain lost momentum by the end of 2013 and rise to about 1.1 per cent. The inflation rate of 2.8 per cent in 2011 jumped to 4.2 per cent in 2012 (Part II, Table 6) due to the introduction of a value added tax. The government’s overall fiscal deficit widened to 12 per cent of GDP, and public debt reached 78 per cent of GDP at the end of 2013. Though the financial system was able to withstand adverse shocks from the financial crisis, the build-up of the pre-crisis credit boom, the largest in the ECCU, has left financial institutions with asset quality problems. The IMF reckons that this is due to the doubling of non-performing loans, as banks in St Lucia are finding it difficult to foreclose on collaterals as a consequence of tedious procedures. The key policy issues to tackle are the building up of vulnerabilities in the fiscal, financial and external sectors in face of a weak global environment and potential external shocks.16
St Vincent and the Grenadines
Real GDP growth in the St Vincent and the Grenadines economy was relatively moderate due to a decline and lack of momentum in the tourism and manufacturing sectors. The real GDP growth rate was hence 1.5 per cent in 2011/2012 (Part II, Table 2). The expected decline in food and fuel prices over the medium to long term should keep inflation pressures low and the balance of payments stable. Though tax-uptakes were lower than expected, planned reductions in
government capital spending are expected to improve the government’s fiscal position. Structural reforms aimed at promoting growth will centre on a vigorous implementation of easing credit, enhancing labour productivities and skills, reducing energy costs and infrastructural improvements. This will be coupled with increased financial regulation to safeguard the financial sector and to boost growth.17
Trinidad and Tobago
Maintenance problems in the energy sector, coupled with crippling industrial disputes in the non-energy sector, contributed to a slower expansion of real GDP to 1.2 per cent in 2012. With both the energy and non-energy sectors expected to recover from these drawbacks, a growth rate of 1.6 per cent was predicted by the year-end 2013 in Trinidad and Tobago. Inflation, excluding food prices, remained moderate at 3.1 per cent in 2012 and fell to 2.2 per cent in March 2013, while unemployment remained at 5 per cent. The decline in energy revenue of about 1.7 per cent of GDP led to a worsening of the current account deficit (of −1.1 per cent of GDP), which was projected to be −2.5 per cent of GDP in 2013. The main policy initiative in Trinidad and Tobago is for tax reform to raise revenue to 3.2 per cent of GDP over the next five years. The IMF recommends that tax reform should include the rationalisation and simplification of VAT exemptions without any increase in rate, phased-in property taxes, and the modernisation of personal and corporate income taxes by revision and simplification.
1.14.7 European small state economies: a snapshot
See Figures 1.24, 1.25 and 1.26 for a snapshot of European small state economies.
1.14.8 Summary of developments, outlook and policy priorities for European small states
The Eurozone economy is tentatively edging towards recovery. However, the high cost of private sector borrowing – especially for small-scale enterprises – the dearth of credit flow as a result of ailing banks, high debt and resounding uncertainties in economic activities have all contributed to a postponement in household spending. This lack of spending is stifling potential economic growth. Real GDP growth in the Euro-area was expected to contract by 0.6 per cent during 2013, only to modestly increase by 0.9 per cent in 2014. Consequently, unemployment, especially youth unemployment, is at record high and inflation is expected to remain relatively subdued (IMF 2013d). The limited room for policy manoeuvre means that debt ratios will
Recent Economic Trends in Commonwealth Small States 19

remain elevated. There is also the high possibility that external shocks could severely harm growth, as there is peripheral risk of stagnation. The general view is that to improve growth in the Eurozone countries should move towards encouraging cross-border competition, instilling labour market reforms which will ease rigidities and increase participation, and establishing flexible bargaining arrangements.
Cyprus
Overall GDP declined by 2.4 per cent at the end of 2012 in Cyprus, and was projected to fall further by 6.2 per cent in 2013 and 3.2 per cent in 2014. At 17.3 per cent, the unemployment rate in Cyprus, which was 11.7 per cent in 2012, is the highest in the Eurozone. Unemployment is projected to be 19.5 per cent by 2014. In the short run output is expected to contract, spurred by an expected contraction in domestic demand and a sharp decline in the financial services and construction sectors. The current account deficit was projected to be 2 per cent and 0.6 per cent of GDP in 2013 and 2014 respectively. Debt
is predicted to rise to a peak of 126 per cent of GDP in 2015. According to the IMF, building Cyprus’ resilience to external shocks and recapitalisation of the banking and credit sectors are policy priorities. The main issue for the government will be tackling the social and economic consequences of the economic crisis that erupted in March 2013, when the conditions of the bailout from the EU and the IMF triggered a dramatic two-week bank closure and the imposition of capital controls.
Malta
The Maltese economy is one of few in the Euro-area that suffered only a small decline in both GDP growth and unemployment. Additionally, none of its banks were insolvent nor did they seek liquidity assistance. Hence this economy occupies the enviable position of having stable real GDP growth of 1 per cent (Part II, Table 2), which is better than the Eurozone average. The Maltese economy was expected to grow by 1.5 per cent by the end of 2013 and by 1.8 per cent in 2014 – the highest rise forecast for the Eurozone. The inflation rate dipped
Figure 1.24 Real GDP growth (%): European small states (2002–2012)
-3.0
-2.0
-1.0
0.0
1.0
2.0
3.0
4.0
5.0
6.0
-4.0
-3.0
-2.0
-1.0
0.0
1.0
2.0
3.0
4.0
5.0
6.0
2002 2003 2004 2005 2006 2007 2008 2009 2010 2011 2012
EU 1
1 ye
ar a
vera
ge (%
)
Rea
l GD
P gr
owth
(%)
Cyprus Malta EU average 11 year average
Figure 1.25 CPI inflation in European small states (2002–2012)
0.0
0.5
1.0
1.5
2.0
2.5
3.0
3.5
4.0
4.5
5.0
2002 2003 2004 2005 2006 2007 2008 2009 2010 2011 2012
CPI
infl
atio
n
Cyprus Malta EU average
20 Small States: Economic Review and Basic Statistics

by 0.8 per cent to 2.4 per cent in 2013 and is estimated to average 2 per cent in 2014. Though imports will increase, the current account is expected to be in surplus. The projection for year-end 2013 was 0.5 per cent of GDP, and in 2014/2015 the current account is expected to average 0.8 per cent of GDP. Debt widened to 72 per cent of GDP, but negotiations are ongoing to reopen the Excessive Deficit Procedure (EDP) and achieve durable correction to the debt target for 2014. The projection is for debt to average 73 per cent of GDP in the run up to 2015. The IMF estimates that in the medium to long term there will be robust export service growth, with improved private sector consumption and confidence – which in turn will boost growth and keep the current account positive, despite an expected rise in imports. The key policy objective is to shore up the resilience of Maltese banks and ensure financial stability.
1.15 Conclusion
There is expected to be a furcation in world economic growth in 2013/2014, as advanced economies (the EU and US) face the dichotomy of moderate growth in the US and floundering growth in the EU. The EU’s contribution to the world’s growth figure is therefore expected to be a drag on the entire growth rate in the world economy. Both the EU and US are expected to grow below the world average rate, with the EU struggling to register positive growth. On the other hand, small states’ average growth is expected to be close to the projected world average, albeit slightly lower, as developing economies are expected to lead the growth recovery. This is especially true for the African region (and African small states), which currently runs the risk of overheating with more than expected growth forecast. The Caribbean region – and indeed other regions dependent on tourism – will grow less than expected as lower tourist arrivals from the EU dampen demand and tourist revenues, and hence slacken growth in these
small states. The choppiness in the world growth rate, exacerbated by the growth bifurcation in advanced economies – in the face of dampened demand, falling oil and food prices, and the slowdown in both private investment and public consumption – will lead inflation to abate in most regions.
The pattern of growth, in the world and regional economies, mirrors the trend in international trade. The diminishing share in exports and imports of advanced economies has given way to a healthy increase in the ‘South–South’ share of trade. The African region is turning out to be the star billing, with a much more robust improvement in macroeconomic statistics than the others. The improved performance of small states, subsumed under the progress of developing economies, is further strengthened by ensuring the fruitful culmination of the Millennium Development Goals. These improvements indicate the pre-eminence given to the push for increases in ODA disbursements and commitments to developing economies and small states in particular – an upward trend that is expected to continue.
The major worry for small states, economies is the prevalent high unemployment rate and the lack of statistical wherewithal to fully comprehend and analyse the extent of its debilitating effects. Statistics need to be improved significantly. Small states’ economies would benefit even more from the welcome forecast that remittances will slightly pass the epic half a trillion dollar mark by the turn of 2017 if their full benefits could be harnessed and incorporated into viable economic policies. The automatic stabilising effect of remittances could bring a welcome degree of calm to the high volatility of small states’ persistent business cycles – open economies buffeted by external shocks, unstable exchange rates regimes, ailing deficits and uninspiring welfare conditions could benefit from the cleansing that accompanies remittances. These could set the stage for achieving loftier goals in small state economies
Figure 1.26 Current account balance (% of GDP): European small states (2005–2012)
-18.0
-16.0
-14.0
-12.0
-10.0
-8.0
-6.0
-4.0
-2.0
0.0
2.0
2005 2006 2007 2008 2009 2010 2011 2012
Cur
rent
acc
ount
(% o
f GD
P)
Cyprus Malta EU average
Recent Economic Trends in Commonwealth Small States 21

– to move even further up the ‘ease of doing business’ table, attract more FDI inflows and further improve the human development and life expectancy indicators for their citizens in a twenty-first century world that’s getting more complex, riskier and more turbulent in all its economic, social and political ramifications.
Notes 1 See Table 2 in Part II for GDP growth at a country level. 2 See also Table 5 in Part II. 3 See also Table 5 in Part II for country-level data. 4 See also Table 6 in Part II. 5 The 2011 figure is a prediction, as there is generally not
enough data across small states on unemployment to give a comprehensive picture of the long-term forecast.
6 See Table 7 in Part II for statistics on exports, imports and trade balances.
7 See Tables 8–14 in Part II for country-level data on trade statistics. 8 This is defined as money that has left the donor countries; the
placement of resources at the disposal of the recipient country or agency – especially as indicated on the Development Assistance Committee (DAC) database.
9 This group includes countries that have previously been recipients of aid (such as Poland) and those that still are (such as Nigeria); countries that respond to disasters domestically; those that host a growing number of refugees; as well as countries that have been contributing to and supporting international development programmes and systems for a number of decades (Smith 2011).
10 A firm written obligation, backed by an appropriation, to provide resources of a specified amount, under specified conditions for a specified purpose for the benefit of the recipient country or a multilateral organisation – the whole value is recorded on the OECD Creditor Reporting System (CRS).
11 See Table 33 in Part II of this publication.12 This is a ranking of economies from 1 to 189 according to
the conduciveness of their regulatory business environment; a high ranking in the ease of doing business table implies that the regulatory environment is more conducive for the starting up and operation of local firms. Also referred to as the World Bank’s Doing Business report.
13 IMF 2013g, 20; also refer to the graphs in the economic snapshot for the Africa region above.
14 IMF 2013f. See graphs on economic snap shot of the Caribbean, above; also refer to the analyses in sections 1.1–1.12.
15 IMF Country Report: Press Release No 13/176.16 IMF Country Report: Article IV consultation press release
information No 13/27.17 IMF Country Report: Article IV consultation press release
information No 12/41.
References
Beidas-Strom, S, M Rousset and S Streifel (2013), Commodity and Market Review from World Economic Outlook, April 2013, IMF, Washington, DC.
Charles, E (1997), A Future for Small States: Overcoming Vulnerability, Commonwealth Secretariat, London.
Dominguez, KM (2012), ‘Foreign reserve management during the global financial crisis’, Journal of
International Money and Finance, Vol 31 No 8, 2017–2037.
International Monetary Fund (IMF) (2013a), World Economic Outlook: Hopes, Realities and Risks, April 2013, IMF, Washington, DC.
IMF (2013b), World Economic Outlook Database, available at: www.imf.org/external/pubs/ft/weo/ 2013/02/weodata/index.aspx (accessed 30 October 2013).
IMF (2013c), Regional Outlook 2013, IMF, Washington, DC.
IMF (2013d), Euro Area Policy Report No. 13/275, IMF, Washington, DC.
Organisation for Economic Co-operation and Development (OECD) (2013a), Africa Economic Outlook: Structural Transformation and Natural Resources, OECD, Paris, available at: www.o e c d - i l i b r a r y. o r g / d e v e l o p m e nt / afr ican-economic-outlook-2013/structural-transformation-and-natural-resources-in-africa_aeo-2013-8-en (accessed 20 March 2014).
OECD (2013b), Outlook on Aid, Survey on Donors Forward Spending Plans, OECD, Paris.
Roberts, John L and Ibukunoluwa Ibitoye (2012), The Big Divide: A Ten Year Report of Small Island Developing States and Millennium Development Goals, Commonwealth Secretariat, London.
Smith, K (2011), Non-DAC Donors and Humanitarian Aid; Shifting structures, changing trends, Global Humanitarian Assistance, Somerset, UK, July.
United Nations (2013), MDG Gap Task Force Report: The Challenge we Face, United Nations, New York.
World Bank (2013a), World Development Indicators, available at http://data.worldbank.org/data-catalog/world-development-indicators (accessed October 2013).
World Bank (2013b), Doing Business 2013, World Bank, Washington, DC, available at: www.doingbusiness.org (accessed 20 March 2014).
World Bank (2013c), Countries remittances, available at: www.worldbank.org/en/news/press- release/2013/10/02/developing-countries-remittances-2013-world-bank (accessed 20 March 2014).
World Economic Forum (2013), The Global Competitiveness Report 2013–2014: Full Data Edition, World Economic Forum, Geneva, available at: www3.weforum.org/docs/WEF_GlobalCompetitivenessReport_2013-14.pdf (accessed 20 March 2014).
World Trade Organization (2013), World Trade Report 2013 – Factors Shaping the Future of World Trade, WTO, Geneva.
22 Small States: Economic Review and Basic Statistics

Chapter 2
The Role of Data and Statistics for Policy-making in Small States
Ryan Straughn
2.1 Summary
There is great demand for better, more diversified and detailed statistical data and information, now more than ever before. This has been triggered in part by the need to monitor progress towards the MDGs. It has also been triggered by the new emphasis on monitoring implementation and evaluating results. Statistical data and information are needed to demonstrate progress against targets, and also to plan and monitor the implementation and success of policies developed to achieve the targets. Indeed, it is fully accepted that the effectiveness of policies and the efficiency of operations of governments and businesses depend on access to timely and reliable data and information.
The Commonwealth Secretariat hosted the Second Global Biennial Conference on Small States at Marlborough House, London in September 2012. The agenda for this meeting focused on practical policy options related to growth and resilience in small states, including: green growth approaches in small states; tourism development and local economy linkages; migration and development; and enhancing regional integration. In the ensuing discussions, it was widely acknowledged that the lack of data was a critical constraint to the advancement of policies in small states on growth and development. It hinders the efforts of these countries and the international community to formulate and implement sound and informed policies for sustainable growth and development. The meeting learned that these data gaps require urgent action and attention by the international community if meaningful progress is to be achieved in planning and policy formulation.
It was in response to this development that the World Bank and the Commonwealth Secretariat organised a scoping meeting of main actors in two pilot areas (tourism and remittances) in Barbados in December 2012. This meeting examined options for strengthening data support for inclusive growth policies in the Caribbean region. In 2012, the Commonwealth also
launched a publication entitled: The Big Divide: A Ten Year Report of Small Island Developing States and the Millennium Development Goals (Roberts and Ibitoye 2012). This publication further illuminated the depth and breadth of data gaps in small states in comparison with other developing and developed countries in relation to the MDGs.
It was against this background that the present study was commissioned. It seeks to: 1) investigate and document the dynamics of data and statistical challenges in small states; and 2) identify some of the ways of addressing data and statistical shortages in small states.
A review of the available strategic plans for data and statistical development in small states was undertaken in order to assess where countries are in relation to improving their statistical systems, and to get a better understanding of some of the challenges they face in doing so. The review found a number of issues that are quite common across the small states, including outdated legal frameworks, inadequate institutional capacity, lack of statistical advocacy and co-ordination, and generally the low public profile of statistics. The methodology used to assess the existence and magnitude of data gaps was a combined evaluation of: 1) the United Nations Millennium Development Goals Country Snapshots; 2) World Development Indicators (WDIs) published by the World Bank; and 3) a survey of statistical offices across the Commonwealth small states (CSS).
The analysis indicates that small states are faced with significant data gaps and challenges, in particular with respect to social and environmental indicators. Gaps do exist in all countries assessed, with the Asia-Pacific group having the largest estimated data gaps of the four regions (Africa, Asia-Pacific, Caribbean and other regions). The recommendations include the early adoption of rapidly evolving IT tools, while better organisation of resources across the national statistical system (NSS) – if properly implemented – should significantly reduce reported and estimated data gaps.
23

Other issues related to institutional strengthening, technical skills and training are also addressed.
2.2 Introduction
The Commonwealth defines small states as those with a population of less than 1.5 million people that are located in Africa, the Caribbean, Asia-Pacific and other regions.1 Table 2.1 shows the Commonwealth small states by region. They have varying geographic characteristics, with some being completely landlocked (Lesotho), while most are islands. Some are geographically distant from major regional centres of development (Kiribati), while others are closely connected (The Bahamas). Some have valuable natural resources such as oil (Trinidad and Tobago) and diamonds (Botswana), while others have few such resources (Barbados).
Commonwealth and other small states face a unique set of development challenges posed by their small size and commensurate narrow production and export bases, as well as their susceptibility to climate change impacts. These characteristics shape their sustainable development concerns, which focus on building resilience to adverse economic and climate-related shocks.
The characteristics include the following:
Limited diversification possibilities and narrow range of products: The small size of the country (including population) limits the capability of small states to fully exploit economies of scale and price-bargaining power, rendering them powerless to alter some of their key economic outcomes. Among small states economic production is heavily concentrated on a few activities, and as a consequence their economies are heavily exposed to developments within these sectors or affecting these sectors.
Dependence on strategic imports: This concentrated production structure usually implies that small
states tend to be very open – in order to purchase items not produced locally. Given the size of these economies, there is often limited capacity to harness their natural resources; as a result manufacturing industries tend to be limited. Therefore, there is greater dependence on strategic imports, particularly for energy and food, in small states when compared to other groups of countries. As a result, small economies are highly dependent on conditions in the rest of the world. These economies are also heavily exposed to commodity price volatility, in particular energy prices, which directly impacts on their economic performance.
Limited institutional capacity: Sovereignty necessitates certain fixed costs of providing public services, including policy formulation, regulatory activities, education and social services, justice, security and foreign affairs. Indivisibilities in the provision of these public goods mean that small states face higher costs per person. In addition, exposure to natural disasters has a disproportionate impact on small states’ administrative costs.
Remoteness and isolation: Small states are heavily dependent on trade for economic development and social progress. Their remoteness from major markets, in terms of both imports and exports, implies that for many small states, particularly small island developing states (SIDS), high transport costs is a barrier when it comes to trade.
Low competitiveness: Not surprisingly given the aforementioned, small states are often uncompetitive. Their small domestic markets, limited domestic natural and human resources, and remoteness constrain the growth of competitiveness and their attractiveness as hosts for foreign direct investment (FDI).
Susceptibility to natural disasters and environmental change: The unique natural beauty and geographical location on which many small states hinge their
Table 2.1 Commonwealth small states
Africa Asia-Pacific Caribbean Mediterranean
Botswana Brunei Darussalam Antigua and Barbuda CyprusLesotho Fiji The Bahamas MaltaMauritius Kiribati BarbadosNamibia Maldives BelizeSeychelles Nauru DominicaSwaziland Papua New Guinea Grenada
Samoa GuyanaSolomon Islands JamaicaTonga St Kitts and NevisTuvalu St LuciaVanuatu St Vincent and the Grenadines
Trinidad and Tobago
24 Small States: Economic Review and Basic Statistics

growth and development prospects also present peculiar challenges. These regions are often highly susceptible to natural disasters, such as volcanic eruptions, hurricanes and tsunamis. Furthermore, small states, especially SIDS, face heightened threats posed by global climate change and, although not directly responsible, share in the consequences. While proneness to natural disasters is a characteristic of larger territories as well, the impact is more devastating on small states. A greater proportion of land and activity in small states can be affected by climate change – in particular a rise in sea level – than in larger territories. Limited assimilative and carrying capacity lead to problems associated with waste management, water storage and other factors affected by small territorial size.
High debt burdens: High debt burdens are an added complication for small states. While self-inflicted weaknesses such as lack of fiscal discipline and inadequacies in debt management practices have been singled out as contributors to the debt problem, exposure to external economic shocks and natural disasters have also been identified as significant contributors. The high debt burden of small states is hampering growth prospects; it exacerbates vulnerability to external shocks and negatively affects domestic policy efforts, as well as the international community’s attempts to help build resilience. Additionally, economic output has been further negatively affected by fiscal restraint, threatening the achievement of national development objectives, including improvements in human development.
Limited access to financial resources: Many small states have been ‘graduated’ from concessional financing because, on the measurement of per capita income, they are rated as middle-income countries. At the same time access to global capital markets, while more important for small states, is now more difficult. There is evidence that private markets tend to see small states as more risky than larger states, so that spreads are higher and market access more difficult. The result of this has been extremely high debt and debt-financing costs. Indeed, adequate levels of non-concessional resources have been limited given their small quotas in multilateral organisations, also a function of the small size of these states.
Eroded social gains: A highly educated and skilled workforce is a key element in advancing socioeconomic development, as it can adapt easily to changing technological demands. In recognition of this, most small states have allocated a significant proportion of their national budget towards social expenditure and have consequently made some
strides in social progress, evidenced in their improved position in the Human Development Index, although not mirrored in their achievement of the MDGs. The aforementioned challenges make it difficult for these countries to sustain the high investment in social development.
At the same time, frequent and prolonged exposure to adverse events is eroding social gains. There is a lack of technical skills and institutional arrangements to manage such shocks. This limited capacity not only constrains internal development, but also the ability of small states to meaningfully and effectively track, participate in and engage with the international community on many of the key issues that impact them. Consequently, many of the international rules, regulations and mechanisms that they are required to adhere to are not designed to take account of their peculiar characteristics and often exacerbate these challenges.
Improving data and intelligence to better inform decision-making and implement sound and informed policies for sustainable growth and development is therefore critical to small states and the international community. The shortage of institutional and human capacity is a key constraint and efforts are needed to explore practical ways to enable small states to fill these gaps.
This review shows that national statistical organisations are increasingly undertaking major reforms aimed at meeting the growing demands from statistical users at the national and international levels, while often operating under severe budgetary constraints. Globally, statistical reform has commonly lagged behind other public sector reforms, yet the demand for timely, good-quality statistical data has never been greater. It is against this backdrop that the Commonwealth Secretariat has embarked on this initiative to assess the current data challenges plaguing its smallest member states, and to explore areas requiring urgent attention.
To be effective, any statistical modernisation effort must first critically examine the NSS to identify potential areas for enhancement. To this end, the present study reviews the key challenges facing the broader statistical system across the CSS.
The rest of the chapter is organised as follows: Section 2.3 provides a brief review of the existing body of knowledge on statistics and data challenges in small states; Section 2.4 examines the dynamics of data challenges in small states, drawing on the results of a survey of central statistical offices (CSOs) and key institutions in CSS; Section 2.5 outlines some ways
The Role of Data and Statistics for Policy-making in Small States 25

employed by CSS and other small states to address the data challenges of small states; and Section 2.6 summarises the main arguments of the research.
2.3 Literature review
Much of the literature on evidence-based policy-making is derived mainly from developed countries. Further, when one examines the issue of data challenges in particular, there is literature associated with storing large amounts of existing data and in more recent times the integration of large databases in order to create ‘big data’2 analytics for what would effectively be policy-making and policy-evaluation almost in real time. However, there is a dearth of literature on evidence-based policy-making for developing countries, and in particular for small states where resource scarcity is far more acute. Nevertheless, there is much in the literature that developing countries, including small states, can glean from the experiences of their more developed counterparts. Additional insights can be garnered from a review of available strategic plans for CSS.
The experiences of more developed countries are similar to CSS, with reported incidents of relatively high turnover of trained personnel and a shortage of suitably qualified staff. These challenges are more acute in small states, where the pool of candidates is smaller and the competing demands greater. Banks (2009), in reviewing some of the key issues and challenges in pursuing an evidence-based approach to public policy in Australia, highlights the importance of capability and expertise. Banks notes the decline in the numbers of persons skilled in quantitative methods and other analysis skills within the public service at the very time when it has been called upon to provide an evidence-based approach that relies on such skills. He attributes this budgetary measure over a long period of time with research emerging as a more dispensable function when governments and bureaucracies are cut back. He further acknowledges the increased ‘poaching’ of research staff within the public sector, resulting in a relatively high turnover of trained personnel.
In reviewing some of the general data challenges facing the Caribbean, Busby (2003) points to some of the obstacles to data availability that include the following: lack of financial resources, lack of qualified personnel, lack of institutional capacity, lack of co-ordination between departments and low priority on the political agenda. Most of the obstacles derive from a lack of integration in looking at the data requirements and finding solutions to their provision. The realisation that data collection is expensive
should lead to a common concern across ministries for the most efficient and effective means of mapping data collection to data needs. He further points out the data poverty problem cannot be corrected by a series of successive marginal changes in peripheral policies. SIDS should first confront their attributes of smallness and limited trained human resources and derive paradigms to change the variables that can be changed.
Busby also highlights the emergence of central banks as major producers of statistics in the Caribbean. He cites the resource endowment of the region’s central banks as the reason for the creation and maintenance of vibrant statistical and research units that analyse the methodologies used in the compilation of the key economic indicators and ensure that the best quality indicators are used (Busby 2002). The imperative to produce key statistics juxtaposed to the weak nature of many of the statistical offices has forced the central banks to engage in activities that, under other circumstances, would have been done by the statistical office. In some countries, the Balance of Payments account is produced by the central bank, as is the case in Barbados and countries in the Organisation of Eastern Caribbean States (OECS).
The key recommendations emerging from these reviews are the need to improve processes and institutions within governments and training and retraining of staff.
Examination of the available strategic plans for statistical development among the CSS shows in general that data-producing institutions are weak and under-resourced. In their present form, they are unable to meet user requirements for statistical data and information.
The following are often identified as some of the main challenges facing official statistics and CSOs in CSS:
Low profile of statistics in government: Statistics has consistently had a low status in governments across CSS; this challenge is highlighted in the following examples taken from the various regions. In Swaziland, the strategic plan states that in spite of its acknowledged importance to national development, statistics has consistently had a low status in government, as evidenced by the low status of the director of the CSO in the civil service. In general, the status of the director of the statistics office is low relative to other heads of department in government (Central Statistical Office Swaziland 2003). A recently concluded diagnostic of the statistical system in Barbados also cites the very low profile of the Barbados Statistical Service, both within and outside the Government of Barbados, together with a lack of awareness of the work
26 Small States: Economic Review and Basic Statistics

it does and the output it provides (Barbados Statistical Service 2013). The newly formed Namibia Statistics Agency (NSA) and the national statistics system (NSS) faces a similar challenge and cites ‘the NSS is not widely known’ as a threat in a SWOT analysis to execution of the strategic plan. (Namibia Statistics Agency 2012) It also goes on to state, ‘Statistics are perceived to be of low value’. The above are indicative of the situation across most CSS, signalling the need for greater advocacy/outreach and resources.
Lack of a vision and mission: A clear vision and mission are essential for efficient and effectual management of the CSO in particular and the NSS in general, and hence for improved provision of official statistics. The absence of a clear vision and mission for many CSOs in CSS has engendered a lack of unity of direction and purpose, as well as a lack of synergy in statistical production.
Inadequate statistical advocacy: There has been inadequate statistical advocacy to: 1) promote ‘statistical thinking’ in society and to put statistics on the national agenda; 2) demonstrate to government, politicians and legislators, and other users the importance of statistics; 3) promote a culture of evidence-based policy formulation and decision-making; and 4) mobilise and utilise national and international resources for statistical capacity development in the countries. A review of the strategic plans points to the fact that CSOs have not done enough to advocate for statistics, attributable in part to lack of capacity on the part of CSO staff to carry out advocacy, as well as lack of good advocacy tools and materials. For example, in Samoa the Statistics Advisory Board is generally supposed to assist with providing statistical advocacy, but had not been functioning for some time.
Inadequate consultation between data users and producers: Inadequate consultation has made it difficult for data producers to continuously assess emerging data needs and to revise data collection instruments, such as survey questionnaires, in order to meet those needs. Many of the strategic plans reviewed have sought to address how to reposition users of official statistics away from the periphery of the data production process to the centre of the process, so that they can play proactive upstream roles in the development of national statistics.
Outdated legal framework: Statistical operations in most countries are underpinned by outdated legislation from the 1960s–1980s, which no longer provides a legal basis for the provision of official statistics to underpin policy, administrative and economic changes that have taken place in the countries since their passage. In particular, several
of the existing acts do not adequately provide for the professional independence of the CSO, or for equal and simultaneous access to statistical data and information. Twenty out of 32 (62.5%) of CSS currently have legislation that was promulgated prior to 1993 and has not been updated. These acts need to be reviewed and updated to ensure that they are appropriate for the current status of the statistics bureau, for available technology, and that they enable the co-ordination, co-operation, and communication between statistical producers necessary for the operation of a comprehensive statistics system.
Inadequate institutional capacity: An explanation that is consistently given for the poor performance of CSOs, line ministries and other data producers is that there is inadequate human capacity (understaffing and/or limited technical skills and competences) and inadequate material and financial resources for data collection, processing and analysis. These inadequacies make it difficult to meet user requirements, and compromise data quality and timeliness. In some cases, understaffing is a result of budgetary cuts as governments face tight fiscal conditions as cited in The Caribbean Technical Assistance Centre (CARTAC) report (PrudHomme 2013).
The internal organisation of CSOs and other staffing issues have also been identified. The organisation structure for some CSOs was found to be inappropriate, with limited capacity for developing an effective management style based on accountable decision-making, priority and timeframe setting, as well as leadership. These factors contribute to staff frustration and high staff turnover.
Inadequate co-ordination: In most CSS, statistical production is largely fragmented and unco-ordinated. Without good co-ordination, data production cannot achieve synergy or cost-effectiveness, which are particularly important given small states’ significant resource constraints. A review of the strategic plans points to a lack of co-ordination on standards, classifications, statistical techniques and methodologies used by the producers of data, resulting in some duplication and inconsistencies arising among datasets. For most CSS, there is no formal system of co-ordination or co-operation and a strong reliance on informal networks for co-ordination, which has both positive and negative impacts.
2.4 The dynamics of data challenges in small states
The increased demand for statistics has exposed the weaknesses in the NSS, a dearth of data for policy as well as social and economic indicators, and the
The Role of Data and Statistics for Policy-making in Small States 27

inadequacy of existing data. In some African countries, for example, the state of statistics is typical of the ‘vicious cycle’ of statistical under-development. In these small countries, inadequate resources constrain the quantity and undermine the quality of statistics, while the poor quality of statistics leads to lower demand and hence fewer resources and an inability to build and maintain capacity.
In examining the challenges facing CSS, similar issues were encountered and identified by stakeholders within the various NSSs, with some variation across the four distinct geographic regions under consideration. In some instances, there is no formal arrangement between the CSO and other statistical producers that would constitute an NSS, which in itself poses a challenge for the effective deployment of resources to ensure data and information challenges are minimised.
In general, member countries have all been well-served by their respective statistical offices in producing good economic indicators, but there are some areas where they are struggling – namely, social, environment and political indicators. Apart from the challenges of valuation impacts and disentangling the effects of simultaneous influences, countries are often faced with more basic data deficiencies. These are typical for social and environmental data, where there is heavy reliance on administrative collections – or indeed, as in quite a number of cases, there may be no collections at all. However, data deficiencies exist for some economic data.
In all of the member countries, statistics resources are generally deployed to cover broad economic aggregates ranging from national accounts, including gross domestic product and gross capital formation, to labour market statistics that include the size of the labour force and unemployment data. Many of the CSS do not have a published calendar of statistics, and so it is difficult to ascertain the availability of data series within each broad economic aggregate. Further, most statistical offices have websites where statistical information is available, but they are not all well organised and data results are not easily accessed. In some instances a painstaking effort was required, involving browsing several PDF reports, in order to compile data series. However, this lack of accessibility to the public does not necessarily mean the data and information are not available to policy-makers. In some cases data are available but unpublished for reasons that are not stated.
A ‘data gap’ is any missing data that impairs a researcher’s ability to meet his/her project goals.
The types of data gaps are informational, temporal, spatial and data quality. In science, this is the inability to obtain certain information crucial to a scientific study or experiment. Data gaps can be created in a number of ways. The data might not exist, might not be accessible, might not be complete or might not have been evaluated and studied adequately. In small states, there are myriad issues that influence the ‘public availability’ of data. In the context of identification of data gaps and their influence on policy-making, a credible assessment cannot be solely based on published information. To that end, the engagement of statistical professionals is critical in order to truly know where the gaps lie.
2.4.1 Basic data and statistical needs
This section provides a summary of the basic data and statistics needs that would be an ideal minimum for effective planning and policy formulation. While not exhaustive by any means, it is intended to provide a sense of the range of data and information requirements to adequately cover activities under the broad aggregates: economic, socio-demographic (health, education, etc.) and environmental.
Broad economic aggregates should include the production of statistics in the following areas: output measures and national accounts; price collection and measurement; labour forces statistics; household income surveys; private enterprise data; public finance; monetary and financial statistics; trade and balance of payments (Powers 1992). Each of these activities often require skills not always available in CSS since the level of detail involved in the production and analytical process in each of these areas is highly specialised and intense. The data derived from these activity are used to monitor and evaluate the effectiveness of implemented policies and reforms as well as the creation of new policy initiatives.
Socio-demographic aggregates include education, health, nutrition, etc. However, here the focus is primarily on education and health since these sectors receive a significant proportion of the national budgets. Education management information systems (EMIS) routinely collect information on schools as part of their regular operations. Such data include location of schools, conditions of school facilities, number of grades offered, number of students by sex and age, number of repeaters, number of teachers by sex and qualification. More sophisticated systems collect data on retention and completion rates, measures of achievement, and the number of children out of school; and examine statistics in terms of gender, ethnicity and income. EMIS are designed to collect and analyse data on the educational
28 Small States: Economic Review and Basic Statistics

systems to improve planning, resource allocation, monitoring, policy formulation and decision-making (UNESCO 2010).
Effective health management information systems require data from difference sources which are used for multiple purposes at different levels of the health care system. Individual-level data about the patient’s profile, health care needs and treatment serve as the basis for clinical decision-making. Health facility-level data, both from aggregated facility-level records and from administrative sources such as drug procurement records, enable health care managers to determine resource needs, guide purchasing decisions for drugs, equipment and supplies, and develop community outreach. Population-level data are essential for public health decision-making and generate information not only about those who use the services but also, crucially, about those who do not use them. Public health surveillance brings together information from both facilities and communities with a focus mainly on defining problems and providing a timely basis for action (World Health Organization 2008).
Environment data along with economic and socio-demographic data are the three major branches in most national statistical systems. The environment is the newest of the three subjects, but it has quickly become a sprawling field of loosely related topics and no single publication can effectively address all aspects. Environmental aggregates should include the production of statistics in the following components: flora, fauna, atmosphere, water, land/soil, and human settlements.3 The social and economic activity under each component would be monitored to determine the environmental impact and to formulate appropriate responses.
Flora data, for example, should cover agriculture and livestock production (including land clearing, irrigation, grazing, harvesting, use of fertilizers and pesticides), forestry and logging, competing land use (settlements, agriculture, forestry, mining, recreation, etc.), and emissions hazardous to flora. These data would be used to track the proliferation, depletion, extinction of species, depletion/growth of forest and woodlands, impact of pollution on vegetation cover (e.g. acidic precipitation), impact on land/soil (desertification and erosion due to removal of vegetation cover, biochemical in soils) and changes in water regime from deforestation and removal of vegetation (Asian Development Bank 2002).
The challenges posed by environment statistics are generally greater than for most other types of statistics
since the CSO must rely heavily on other agencies to collect and supply the bulk of primary data. Such a high degree of interdependence between different government bodies demands close co-operation and collaboration, some thing that already proves problematic for more established data.
The basic statistics needs outlined above (which are not exhaustive) underscore the major challenge facing small states, since the level of specialisation and expertise are not available in the quantum required to deliver on all aspects of even one of the areas indicated. Thus, national statistical offices operating under less than well-defined arrangements with other data producers struggle to keep pace with the increasing demand for timely and high quality data and statistics.
2.4.2 Millennium Development Goals data gaps
This section presents the data gaps that appear in the MDG Country Progress Snapshot, updated in December 2012 by the UN Statistical Department (UNSD). The MDG Country Progress Snapshot provides an overview of the progress towards the Millennium Development Goals achieved at the country level since 1990. The snapshot is intended mainly to provide the international community with easy access to the information, and is not meant to replace in any way the country profiles produced at the national level in several countries. It is also meant to reflect the contribution of country-level progress to the global and regional trends on progress towards the MDGs. The data used in the snapshot are from the MDGs global database.4 Discrepancies between global and national figures are due to, among others, different methodology and definitions or different choice of data sources. At the global level, the monitoring of the progress aims to ensure better comparability of data among countries.
Table 2.2 tracks the progress of the Commonwealth small states in achieving a selection of MDGs. It also shows where data gaps exist in assessing these key indicators. For example, only Lesotho and Namibia in Africa, as well as Belize and Jamaica in the Caribbean, had data available for all 17 indicators in the snapshot, while no country in the Asia-Pacific or Mediterranean regions had data for all the indicators. This is a very low data representation, since only one in every eight countries’ progress towards achieving the MDGs could be fully assessed. Lesotho and Namibia both were early achievers for net enrolment ratio in primary education (enrolees per 100 children), while Lesotho was also an early achiever
The Role of Data and Statistics for Policy-making in Small States 29

for the share of women in waged employment in the non-agricultural sector (%) and Namibia for HIV incidence rate (number of new HIV infections per year per 100 people aged 15–49).
Swaziland in Africa and Guyana in the Caribbean both had the smallest number of data gaps, with only one indicator missing from the review. In contrast, Brunei Darussalam in the Asia-Pacific group of countries exhibited the largest data gap with nine missing indicators (out of 17), followed by Nauru also in the Asia-Pacific and St Vincent and the Grenadines in
the Caribbean with eight missing indicators. Seychelles in Africa, Tonga in Asia-Pacific and St Kitts and Nevis in the Caribbean all had seven indicators with missing data.
As a grouping, the African small states in the Commonwealth have the smallest relative data gap5 when compared to the rest of the regions, with only approximately 13 per cent of its data missing. The Asia-Pacific has the highest relative data gap of 32 per cent, followed by the Mediterranean (29%) and the Caribbean (24%). The Bahamas and Barbados
Table 2.2 Commonwealth small states on and off track for the MDGs
30 Small States: Economic Review and Basic Statistics

are ‘early achievers’ for eight indicators, while Belize has the highest number (eight) of ‘on track’ markers. Lesotho is the country exhibiting the slowest progress, with eleven ‘slow’ markers while Guyana and Jamaica both have six markers for ‘regressing/no progress’.
The indicator with the highest data gaps is the HIV incidence rate (number of new HIV infections per year per 100 people aged 15–49), with 25 of the 32 countries (78%) not having this data available. This is followed closely by the proportion of the population living below $1.25 (purchasing power parity [PPP]) per day (%) with 23 countries (72%) missing data. The indicator of the proportion of urban population living in slums (%) also had 23 countries with missing data.
In contrast, there were five (5) indicators that had no data gaps: 1) net enrolment ratio in primary education (enrolees per 100 children), 2) under-five mortality rate (deaths of children per 1,000 births), 3) incidence rate and death rate associated with tuberculosis, 4) proportion of land area covered by forest (%), and 5) internet users per 100 inhabitants.
All of the countries – with the exception of Papua New Guinea which showed slow progress – were early achievers for the indicator net enrolment ratio in primary education (enrolees per 100 children) – shown as ‘Gender primary’ in Table 2.2. Twenty countries were early achievers for the proportion of population using an improved drinking water source (%) shown as ‘Safe drinking water’. Under-five mortality rate (deaths of children per 1,000 births) shows the most progress, with the highest number of ‘On track’ ratings, while slow progress is most evident in the ‘Internet users’ and proportion of seats held by women in national parliament (single or lower house only, %) shown as ‘Women in Parliament’. Proportion of land area covered by forest (%) has the most markers for ‘regressing/no progress’ with 21 countries reporting little or no progress in reversing the loss of forests. It is worth noting that most of these countries reported having approximately the same size of land area covered by forest in 2010 as in 1990.
The 2012 MDG snapshot represents only a small number of indicators used to monitor each country’s progress towards achieving the MDGs by 2015.6 A simple examination of the total number of indicators with data reveals that there are significant data gaps across the Commonwealth small states in general. The last column of Table 2.2 shows the percentage of MDG indicators with data present for the year 2010. The country with the most data available is Swaziland (58%), which is 100 out of 171 indicators, while
Nauru has the least data available, only 21 per cent or 36 indicators. Commonwealth Africa had four of in the top 10 countries with data available (Mauritius #4 with 50 per cent [86],7 Lesotho #7 with 47 per cent [80] and Namibia #10 with 44 per cent [75]). Malta and Cyprus in the Mediterranean were both in the top 10 countries ranked #5 with 49 per cent [84] and #9 with 44 per cent [76] respectively. Data availability for countries in the Caribbean was mixed, as the group had three top 10 countries (Jamaica ranked #3 with 52 per cent [89], Guyana ranked #5 with 49 per cent [84] and Belize ranked #8 with 46 per cent [78]). The Caribbean also had four countries in the bottom 10, as St Kitts and Nevis and St Vincent and the Grenadines both ranked #24 and Dominica and Grenada ranked #26 and #28 respectively. Lastly, the Asia-Pacific region had the largest data gaps in the UN MDG database, with five countries in the bottom 10. The highest ranked country was Papua New Guinea at #12, with 40 per cent or 69 indicators with data available.
As a comparator the proportion of indicators in the MDG database for countries in the EU, G20 and Latin America are provided (see Table 2.3). On average these groupings have 53 per cent [91], 50 per cent [85] and 50 per cent [85] respectively of the indicators present in the database compared to 38 per cent [65] of the indicators on average for the CSS. Jamaica and Swaziland from the CSS ranked favourably with larger countries from within these groupings.
In summary, though the data gaps were relatively large across all Commonwealth regions for 2010, the countries in the Asia-Pacific and the Caribbean in particular need to focus their efforts in order to significantly close some of these gaps. While there are some indicators that are not relevant to some countries, the existence of data gaps across a wide range in indicators makes it difficult to assess the level of progress CSS have made in achieving the MDGs.
2.4.3 Survey results
This section reports summary results from statistical agencies that responded to a survey assessing data gaps and challenges. Respondents were asked to indicate the relative proportion of data that are currently missing from some broad economic and social aggregates, and to provide an assessment of the three priority areas where statistical intervention is most needed in order to enhance the policy-making framework. The full survey instrument can be found in Appendix 2.2.
The Role of Data and Statistics for Policy-making in Small States 31

Of the 31 countries surveyed, 15 statistical offices responded – giving a nearly 50 per cent response rate. Seven of the countries were from the Caribbean (58% response rate), four were from Asia-Pacific (36%), two from Africa (29%) and the other two from the Mediterranean (100% response). The gap analysis is reported first by country and then a summary of the broad aggregates is presented. Broad economic aggregates include data for national accounts, prices, trade, public finances, balance of payments, monetary statistics and the labour market, while broad social and other aggregates include data for health, education, population and demography, crime, environment, information and communications technology (ICT), nutrition and gender.
Figure 2.1 shows the estimated data gaps across the broad economic and social aggregates as reported by the Antigua and Barbuda Statistical Division (ABSD). Data gaps have been reported for all aggregates and are relatively high, particularly for the social and other aggregates. The broad economic aggregates have a lower data gap on average (39%), despite the labour market aggregate having the highest data gap at 80 per cent compared to the broad social and other aggregates, which have an estimated data gap of 56 per cent. Since the ABSD has not historically conducted labour force surveys, this represents a structural data gap. In fact, the
development of labour statistics was identified as the top priority area for future statistics development on the island. National accounts and balance of payments aggregates were reported as having the lowest data gaps at 20 per cent. Under the broad social and other aggregates, crime and nutrition statistics were reported as having the largest data gaps at 70 per cent.
The ABSD identified the following as the top three priority areas for where data gaps exist in Antigua and Barbuda: 1) labour statistics, 2) poverty, inequality and living standards, and 3) trade in services. Some of the
Table 2.3 MDG indicators for EU, G20 and Latin America (LATAM) countries (%)
European Uniona G20 Latin America
Austria 54 Argentina 42 Argentina 42Belgium 57 Australia 53 Bolivia 42Bulgaria 54 Brazil 39 Brazil 39Croatia 51 Canada 50 Chile 51Czech Republic 49 China 39 Colombia 63Denmark 56 France 52 Costa Rica 56Estonia 50 Germany 53 Cuba 46Finland 57 India 50 Dominican Republic 58France 52 Indonesia 51 Ecuador 53Germany 53 Italy 53 El Salvador 53Greece 53 Japan 54 Guatemala 43Hungary 47 Korea 56 Haiti 42Ireland 53 Mexico 64 Honduras 53Italy 53 Russia 48 Mexico 64Latvia 53 Saudi Arabia 35 Nicaragua 46Lithuania 51 South Africa 50 Panama 61Luxembourg 53 Turkey 61 Paraguay 54Netherlands 52 United Kingdom 53 Peru 56Poland 49 United States 57 Puerto Rico 30Portugal 52 Uruguay 51Romania 53 Venezuela 52Slovakia 49Slovenia 50Spain 59Sweden 56United Kingdom 53
aEU excludes Cyprus and Malta.
Figure 2.1 Antigua and Barbuda – survey data gap results
0%10%20%30%40%50%60%70%80%90%
National accounts
Prices
Trade
Public finances
Balance of paym
ents
Monetary statistics
Labour mark
et
Health
Education
Population and demogra
phy
Crime
Environm
entIC
T
Nutrition
Gender
32 Small States: Economic Review and Basic Statistics

challenges identified in sharing information with other departments of government were: 1) lack of openness to sharing information, 2) no proper organisational guidelines on sharing, 3) the bureaucratic procedures involved in sharing information/knowledge, and 4) no proper IT platform to share.
The ABSD also identified: 1) the recruitment of suitably qualified persons, 2) depth of analysis, and 3) speed of analysis and processing, as the top three most significant challenges facing the agency when it comes to managing large amounts of data. It also indicated a weak data culture on the island, as evidenced by the low response rates to business surveys and other statistical activities, as another challenge that needed to be overcome. Further, at the moment the ABSD is only capturing data; there are no strategic decisions being made with the data nor is it measuring the volume of data being collected. The ABSD is not discussing ‘big data’, but indicated that it could help the agency with: 1) identifying issues within the delivery infrastructure and assisting future project needs, 2) speeding up the time it takes to make data analysis available to decision-makers, and 3) improving the speed and accuracy of decisions.
The ABSD identified the need to be adequately resourced, with trained statistical staff to perform its legal mandate. More specifically, it needs to develop capacity in demography, economic statistics (national accounts and balance of payments), data processing, data validation and data consistency to achieve its objectives. It also identified the need for training in statistical software (such as SPSS, Stata, Teleform), along with the development of data systems that are compatible with data providers and data sources.
As shown in Figure 2.2, The Bahamas Department of Statistics (BDS) reported data gaps for five of the broad aggregates of which the environment, information and communications technology, and nutrition each register at 50 per cent, while the economic aggregates
of national income and prices lie at 20 per cent. In general, The Bahamas has comparatively low reported data gaps, with only an approximate data gap of 6 per cent in the broad economic aggregates and 19 per cent in the broad social and other aggregates.
The BDS identified its top three priority areas for closure of data gaps to be: 1) household expenditures, 2) business transactions, and 3) environment. One of the challenges it encounters when sharing information with other departments is that there are no proper organisational guidelines on sharing, while the bureaucratic procedure involved in sharing information/knowledge is onerous. The Bahamas indicated that it is learning about ‘big data’. It is presently training IT professionals to manage and analyse ‘big data’, and estimates that its agency will be in a position to take full advantage of ‘big data’ frameworks in 3–5 years.
Figure 2.3 shows the data gaps as reported by the Barbados Statistical Service (BSS). Statistics on criminal behaviour have the highest estimated gap at 40 per cent, which is then followed by health, environment, nutrition and gender, all at an estimated 20 per cent. In general, Barbados has the lowest reported data gaps, with 4 per cent for broad economics aggregates and 18 per cent for broad social and other aggregates. The BSS further identified: 1) environmental statistics, e.g. biodiversity of plants and animals, 2) social statistics, e.g. income status of the population, and 3) international business statistics, e.g. revenue generated by international business companies, as the top three priority areas where data and information gaps exist in the country. The capture of large amounts of data, storage capacity and search/retrieval were also highlighted as some of the most significant challenges facing the Barbados agency in relation to managing large amounts of data. The BSS is now learning about ‘big data’, which it indicated would help in the following areas: 1) improving the speed and accuracy of decisions, 2) better understanding of interactions
Figure 2.3 Barbados – survey data gap results
0%5%
10%15%20%25%30%35%40%45%
National accounts
Prices
Trade
Public finances
Balance of paym
ents
Monetary statistics
Labour mark
et
Health
Education
Population and demogra
phy
Crime
Environm
entIC
T
Nutrition
Gender
Figure 2.2 The Bahamas – survey data gap results
0%
10%
20%
30%
40%
50%
60%
National accounts
Prices
Trade
Public finances
Balance of paym
ents
Monetary statistics
Labour mark
et
Health
Education
Population and demogra
phy
Crime
Environm
entIC
T
Nutrition
Gender
The Role of Data and Statistics for Policy-making in Small States 33

and the meaning of data trends, and 3) speeding up data timeliness for decision-makers.
The BSS identified the need for more technically trained staff, which would allow the agency to fully execute its mandate. More specifically, the agency requires IT staff to manage and maintain the IT infrastructure and human resources (HR) staff to co-ordinate training and HR allocations. It would also benefit from the establishment of a data warehouse, with the appropriate IT security for the NSS to connect with other statistics-producing units for sharing data.
For Cyprus (Figure 2.4), the Statistical Service of Cyprus (CYSTAT) reported data gaps in 12 of the 15 broad aggregates – ranging in size from a 10 per cent data gap in environmental statistics to 50 per cent in nutrition. In general, Cyprus has relatively low reported data gaps on average, with approximately 7 per cent and 24 per cent for the broad economic and social aggregates respectively. Its top three priority areas for statistical improvement were reported as: 1) administrative data inadequacies, 2) migration movements, and 3) supply and use tables. Data capture, distribution and sharing, and speed of analysis/processing were reported as the most significant challenges facing the agency when it comes to managing large amounts of data. Other challenges that contribute to the existence of data gaps in Cyprus – particularly in sharing information with other departments – are an environment that lacks openness to sharing, a high number of bureaucratic procedures being involved in sharing information/knowledge, and the lack of an IT platform for sharing. Poor information systems were highlighted as the biggest barrier to storing information received by CYSTAT more efficiently and effectively.
CYSTAT indicated that ‘big data’ could help the agency in the following ways: 1) identifying issues within the delivery infrastructure and assisting in projecting future needs, 2) better understanding of interactions and attributing meaning to data trends, and 3) improving overall agency
efficiency. However, it also indicated that the agency was not discussing the use of a ‘big data’ framework at this time. Lastly, CYSTAT cited the significant shortage of statisticians and IT specialists, which currently hampers it from fully executing its mandate.
The CSO in Grenada reported having data gaps in all but two of the broad social and economic aggregates, as shown in Figure 2.5. The reported data gaps range from 5 per cent in education statistics and population and demography to 90 per cent gaps in environmental and nutrition statistics, followed closely by the 75 per cent gaps in labour market statistics. In general, Grenada has relatively high data gaps among the CSS, with an approximate 24 per cent and 41 per cent data gap reported for the broad economic and social aggregates respectively. The top three priority areas for statistical improvement were: 1) household survey data for poverty and labour market indicators, 2) environmental statistics, and 3) literacy and numeracy statistics. The main challenges in sharing information with other departments were identified as the absence of proper organisational guidelines on sharing, the bureaucratic procedures involved in sharing information/knowledge and the absence of a proper IT platform to share the information.
The CSO indicated that it would need the following additional resources to fully execute its mandate: 1) an adequate human resource framework with the right competencies – for example, skills in sampling and estimation, demography, national accounting, geographic information system (GIS) mapping, data processing, IT and computer programming; 2) a larger work space; 3) computer hardware and software, including servers, desktop computers, tablets for administering mobile surveys, statistical and database software, anti-virus and firewall software, a website for dissemination of data, and external storage infrastructure; and 4) more financial resources allocated to conduct frequent household surveys.
The Planning Institute of Jamaica (PIOJ) reported significant data gaps in 10 of the 15 broad aggregates
Figure 2.4 Cyprus – survey data gap results
0%
10%
20%
30%
40%
50%
60%
National accounts
Prices
Trade
Public finances
Balance of paym
ents
Monetary statistics
Labour mark
et
Health
Education
Population and demogra
phy
Crime
Environm
entIC
T
Nutrition
Gender
Figure 2.5 Grenada – survey data gap results
0%10%20%30%40%50%60%70%80%90%
100%
National accounts
Prices
Trade
Public finances
Balance of paym
ents
Monetary statistics
Labour mark
et
Health
Education
Population and demogra
phy
Crime
Environm
entIC
T
Nutrition
Gender
34 Small States: Economic Review and Basic Statistics

ranging from 10 per cent in trade, the labour market, health, and population and demography, to 40 per cent in ICT and gender statistics. From Figure 2.6 it is clear that the broad economic aggregates have a lower reported data gap (3% on average) than the broad social and other aggregates, which are estimated at 26 per cent on average. The PIOJ identified: 1) crime, 2) ICT, and 3) education statistics as the top three priority areas where data and information gaps exist in Jamaica.
The PIOJ also identified the recruitment of talent, speed of analysis and processing, and search and retrieval as the most significant challenges facing the agency with regard to managing large amounts of data. Other challenges highlighted as contributing to the existence of data gaps in Jamaica were the absence of an information sharing culture, absence of proper organisational guidelines on sharing, a lack of awareness of clients’ knowledge needs, and the perception of a lack of urgency in sharing information. Organisational policy and directives were identified as being the biggest barriers to storing information received more efficiently and effectively.
The PIOJ indicated that the use of ‘big data’ would help the agency in the following areas: 1) greater understanding of citizen needs and how to meet them, 2) improving the speed and accuracy of decisions, and 3) defining clearer goals and improved resource spending. It is currently designing a ‘big data’ plan or proof of concept, and has already taken steps to: 1) educate senior management on the benefits, 2) improve the security of stored data, 3) and train IT professionals to manage and analyse ‘big data’. With these in place, PIOJ is poised to take full advantage of ‘big data’ analytics within 1–2 years.
The NSO in Kiribati (Figure 2.7) reported very high data gaps, particularly in the broad social and economic aggregates – with no coverage in environmental, ICT or nutrition statistics. Kiribati uses the Australian dollar as its currency and as such has no official central bank
to conduct monetary surveys. The education aggregate has the lowest reported data gaps at 40 per cent. As a result, the average reported data gap for the broad social and other aggregates is approximately 67 per cent, the highest for the CSS in this category, compared to an estimated 21 per cent data gap for the broad economic aggregates.
The NSO identified: 1) environmental statistics, 2) data from private sector and non-governmental agencies, and 3) business statistics as the top three priority areas where data and information gaps exist in Kiribati. Storage capacity, distribution and sharing, search and retrieval, speed of analysis/processing, recruitment of talent and data capture were all cited as the most significant challenges facing the agency in managing large amounts of data. Some of the challenges with sharing information with other departments include: a lack of openness to sharing information, lack of trust, absence of proper organisational guidelines on sharing, and the absence of a proper IT platform to share.
The NSO is at the moment not discussing ‘big data’, but stated that its adoption would help the agency in the following ways: 1) enhanced understanding and analysis of data trends, 2) reducing the time it takes to make data analysis available to decision-makers, and 3) improving the speed and accuracy of decisions.
The NSO in Malta reported having current data gaps for some of the broad social and other aggregates, ranging from 10 per cent in health and education statistics to 100 per cent for nutrition statistics – as shown in Figure 2.8. Its reported estimate of 0 per cent for the broad economic aggregates was the best for the CSS, along with Trinidad and Tobago similarly reporting no gap. Malta’s reported data gap for the broad social and other aggregates was estimated to be 26 per cent on average. Though no gap was reported for the broad economic aggregates, the development of service price indices and tourism satellite accounts were identified as the top two data priorities, with the development of
Figure 2.7 Kiribati – survey data gap results
0%10%20%30%40%50%60%70%80%90%
100%
National accounts
Prices
Trade
Public finances
Balance of paym
ents
Monetary statistics
Labour mark
et
Health
Education
Population and demogra
phy
Crime
Environm
entIC
T
Nutrition
Gender
Figure 2.6 Jamaica – survey data gap results
0%5%
10%15%20%25%30%35%40%45%
National accounts
Prices
Trade
Public finances
Balance of paym
ents
Monetary statistics
Labour mark
et
Health
Education
Population and demogra
phy
Crime
Environm
entIC
T
Nutrition
Gender
The Role of Data and Statistics for Policy-making in Small States 35

a system of health accounts rounding out the top three priority areas where data and information gaps exist.
The Malta NSO also identified the divergence between data provided and NSO requirements, storage capacity, and speed of analysis/processing as the most significant challenges facing the agency when it comes to managing large amounts of data. Other challenges that contribute to the existence of data gaps in Malta, particularly in sharing information with people from other departments, are the bureaucratic procedures involved in sharing information/knowledge and the absence of a proper IT platform to share. Poor information systems and processes were highlighted as the biggest barrier to storing information received more efficiently and effectively.
The NSO is learning about ‘big data’ and is currently training IT professionals to manage and analyse within this framework. It indicated that it expects to take full advantage of the benefits of the ‘big data’ framework within 3–5 years. However, it cited the need for an additional six ‘full-time-equivalent’ statisticians and financial resources amounting to €500,000 to fully execute its mandate.
Figure 2.9 shows the data gaps reported by the Namibia Statistics Agency (NSA). The agency reported having no significant coverage of environmental statistics, followed by ICT and nutrition with an estimated 80 per cent data gap. This meant that, on average, broad social and other aggregates have data gaps of approximately 55 per cent. For economic aggregates, a 10 per cent data gap for monetary statistics was the only aggregate reported. The NSA indicated that the top three priority areas for statistical improvements were: 1) vital statistics, 2) education, and 3) environmental statistics.
Figure 2.10 shows the reported data gaps by the Nauru Bureau of Statistics (NBS). All of the aggregates have data gaps, with the exception of public finances. Reported gaps range from 10 per cent for education and population and demography to 100 per cent for
monetary statistics. The average reported data gaps for broad economic aggregates is an estimated 41 per cent, which is the largest among CSS respondents, while the average data gap for social and other aggregates is estimated at 38 per cent. This means that Nauru has the worst reported data gaps across all aggregates reported in the survey.
The NBS also reported the following as the top three priority areas for statistical development: 1) national trade statistics data (International Merchandise Trade Statistics [IMTS]); 2) migration statistics; and 3) monetary statistics. The most significant challenges the agency faces in managing large volumes of data are capture, visualisation and data anonymisation, security and metadata documentation. Some of the challenges in sharing information with people from other departments are: the absence of proper organisational guidelines on sharing, the bureaucratic procedures involved in sharing information/knowledge, lack of awareness of the clients’ knowledge needs, and the absence of a proper IT platform to share information. Poor information systems were highlighted as the largest barrier to storing received information efficiently and effectively.
The CSO in St Lucia reported a data gap for every aggregate, as shown in Figure 2.11. Gaps range from 20 per cent for prices to 50 per cent for health and
Figure 2.8 Malta – survey data gap results
0%10%20%30%40%50%60%70%80%90%
100%
National accounts
Prices
Trade
Public fin
ances
Balance of paym
ents
Monetary statistics
Labour mark
et
Health
Education
Population and demogra
phy
Crime
Environm
entIC
T
Nutrition
Gender
Figure 2.9 Namibia – survey data gap results
0%10%20%30%40%50%60%70%80%90%
100%
National accounts
Prices
Trade
Public fin
ances
Balance of paym
ents
Monetary statistics
Labour mark
et
Health
Education
Population and demogra
phy
Crime
Environm
entIC
T
Nutrition
Gender
Figure 2.10 Nauru – survey data gap results
0%10%20%30%40%50%60%70%80%90%
100%
National accounts
Prices
Trade
Public finances
Balance of paym
ents
Monetary statistics
Labour mark
et
Health
Education
Population and demogra
phy
Crime
Environm
entIC
T
Nutrition
Gender
36 Small States: Economic Review and Basic Statistics

education, for example. St Lucia has comparatively high data gaps across all aggregates, with an average data gap of 36 per cent for broad economic aggregates and 49 per cent for broad social and other aggregates. Only Kiribati and Nauru has higher average data gaps across the broad aggregates.
The CSO highlighted the following as the top three priority areas for statistical development in St Lucia: 1) quarterly GDP/update supply and use tables, 2) data on poverty and living conditions, and 3) environmental accounting and environment statistics. The CSO also identified search/retrieval, the recruitment of talent and analysis as the most significant challenges facing the agency in managing large amounts of data. Other challenges that contribute to the existence of data gaps in St Lucia are the lack of openness in sharing information, lack of trust and an absence of a proper IT platform for sharing information with other departments. Poor tools and technology are the biggest barriers to storing information that is received more efficiently and effectively.
The CSO in St Lucia is learning about ‘big data’ analytics, and indicated that it would: help the agency define clearer goals and improve resource spending; allow better understanding of interactions and attribute meaning to data trends; improve the speed and accuracy of decisions; and speed up the time it takes to make data analysis available to decision-makers. To improve the agency’s ability to manage and make decisions with ‘big data’, the CSO is currently educating senior management on its benefits, improving the security of stored data and investing in IT systems/solutions to improve data processing. It estimates that it can take full advantage of ‘big data’ in 3–5 years.
The Samoa Bureau of Statistics (SBS) reported significant data gaps for all aggregates surveyed. In Figure 2.12 the lowest reported data gap is 20 per cent for population and demography followed by 25 per cent for labour market statistics, while the highest is reported for nutrition statistics (60%). In general, Samoa has approximately
the same average reported data gaps for economic (36%) and social aggregates (39%).
Against this backdrop of high data gaps across all aggregates, the following were identified as priority areas for statistical development: 1) balance of payments, specifically foreign investment data, which is currently very limited and the activity of offshore companies; 2) monetary statistics – limited coverage of non-bank financial institutions; 3) agricultural/food security; and 4) health.
The SBS also identified analysis, capture, and distribution and sharing as the most significant challenges facing the agency when it comes to managing large amounts of data.
Figure 2.13 shows the reported data gaps for Seychelles, which range from 100 per cent in environmental and nutrition to 5 per cent in prices and trade. The large data gaps reported for environment and nutrition skews the average data gaps for the broad social and other aggregates to approximately 31 per cent, which is significantly higher than the reported 7 per cent for broad economic aggregates.
The National Statistics Bureau (NSB) identified: 1) environmental statistics, 2) investment and capital formation, and 3) offshore activities as the top three
Figure 2.12 Samoa – survey data gap results
0%
10%
20%
30%
40%
50%
60%
70%
National accounts
Prices
Trade
Public finances
Balance of paym
ents
Monetary statistics
Labour mark
et
Health
Education
Population and demogra
phy
Crime
Environm
entIC
T
Nutrition
Gender
Figure 2.13 Seychelles – survey data gap results
0%10%20%30%40%50%60%70%80%90%
100%
National accounts
Prices
Trade
Public finances
Balance of paym
ents
Monetary statistics
Labour mark
et
Health
Education
Population and demogra
phy
Crime
Environm
entIC
T
Nutrition
Gender
Figure 2.11 St Lucia – survey data gap results
0%
10%
20%
30%
40%
50%
60%
National accounts
Prices
Trade
Public finances
Balance of paym
ents
Monetary statistics
Labour mark
et
Health
Education
Population and demogra
phyCrim
e
Environm
entIC
T
Nutrition
Gender
The Role of Data and Statistics for Policy-making in Small States 37
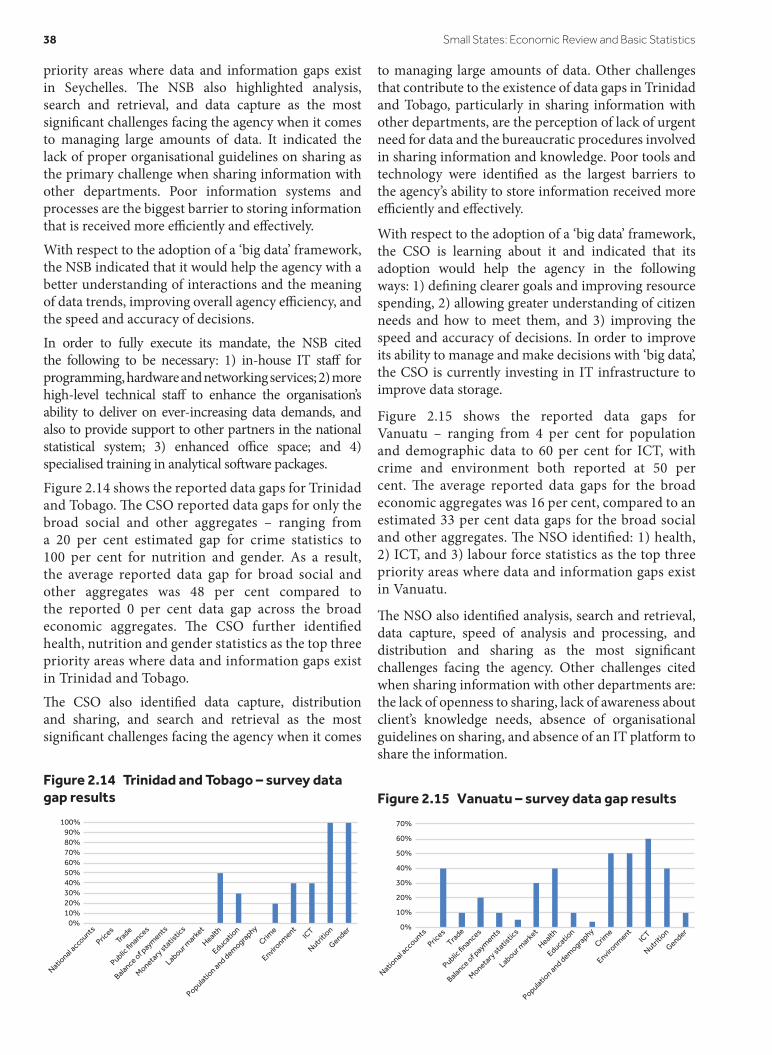
priority areas where data and information gaps exist in Seychelles. The NSB also highlighted analysis, search and retrieval, and data capture as the most significant challenges facing the agency when it comes to managing large amounts of data. It indicated the lack of proper organisational guidelines on sharing as the primary challenge when sharing information with other departments. Poor information systems and processes are the biggest barrier to storing information that is received more efficiently and effectively.
With respect to the adoption of a ‘big data’ framework, the NSB indicated that it would help the agency with a better understanding of interactions and the meaning of data trends, improving overall agency efficiency, and the speed and accuracy of decisions.
In order to fully execute its mandate, the NSB cited the following to be necessary: 1) in-house IT staff for programming, hardware and networking services; 2) more high-level technical staff to enhance the organisation’s ability to deliver on ever-increasing data demands, and also to provide support to other partners in the national statistical system; 3) enhanced office space; and 4) specialised training in analytical software packages.
Figure 2.14 shows the reported data gaps for Trinidad and Tobago. The CSO reported data gaps for only the broad social and other aggregates – ranging from a 20 per cent estimated gap for crime statistics to 100 per cent for nutrition and gender. As a result, the average reported data gap for broad social and other aggregates was 48 per cent compared to the reported 0 per cent data gap across the broad economic aggregates. The CSO further identified health, nutrition and gender statistics as the top three priority areas where data and information gaps exist in Trinidad and Tobago.
The CSO also identified data capture, distribution and sharing, and search and retrieval as the most significant challenges facing the agency when it comes
to managing large amounts of data. Other challenges that contribute to the existence of data gaps in Trinidad and Tobago, particularly in sharing information with other departments, are the perception of lack of urgent need for data and the bureaucratic procedures involved in sharing information and knowledge. Poor tools and technology were identified as the largest barriers to the agency’s ability to store information received more efficiently and effectively.
With respect to the adoption of a ‘big data’ framework, the CSO is learning about it and indicated that its adoption would help the agency in the following ways: 1) defining clearer goals and improving resource spending, 2) allowing greater understanding of citizen needs and how to meet them, and 3) improving the speed and accuracy of decisions. In order to improve its ability to manage and make decisions with ‘big data’, the CSO is currently investing in IT infrastructure to improve data storage.
Figure 2.15 shows the reported data gaps for Vanuatu – ranging from 4 per cent for population and demographic data to 60 per cent for ICT, with crime and environment both reported at 50 per cent. The average reported data gaps for the broad economic aggregates was 16 per cent, compared to an estimated 33 per cent data gaps for the broad social and other aggregates. The NSO identified: 1) health, 2) ICT, and 3) labour force statistics as the top three priority areas where data and information gaps exist in Vanuatu.
The NSO also identified analysis, search and retrieval, data capture, speed of analysis and processing, and distribution and sharing as the most significant challenges facing the agency. Other challenges cited when sharing information with other departments are: the lack of openness to sharing, lack of awareness about client’s knowledge needs, absence of organisational guidelines on sharing, and absence of an IT platform to share the information.
Figure 2.14 Trinidad and Tobago – survey data gap results
0%10%20%30%40%50%60%70%80%90%
100%
National accounts
Prices
Trade
Public finances
Balance of paym
ents
Monetary statistics
Labour mark
et
Health
Education
Population and demogra
phy
Crime
Environm
entIC
T
Nutrition
Gender
Figure 2.15 Vanuatu – survey data gap results
0%
10%
20%
30%
40%
50%
60%
70%
National accounts
Prices
Trade
Public finances
Balance of paym
ents
Monetary statistics
Labour mark
et
Health
Education
Population and demogra
phy
Crime
Environm
entIC
T
Nutrition
Gender
38 Small States: Economic Review and Basic Statistics

With respect to ‘big data’, the NSO cited that it would help the agency in the following ways: 1) greater understanding of citizen needs and how to meet them, 2) identifying issues within the delivery infrastructure and projecting future needs, and 3) improving overall agency efficiency. It expects to take full advantage of ‘big data’ analytics within 3–5 years, and is currently working to improve its ability to manage and make decisions with ‘big data’ by educating senior management on the benefits of ‘big data’, improving the security of stored data and investing in IT infrastructure to improve data storage.
Tables 2.4 and 2.5 summarise the estimated data gaps across the broad economic and social aggregates. The ‘traffic light’ colour-coding system is used to demonstrate the size of the data gap that exists across countries and broad aggregates. Red indicates a relatively high data gap, while green represents a relatively low data gap and amber shows the relative medium. In general, the average reported data gaps reflect the higher availability of data across the broad economic aggregates, which is not surprising given the relatively high resource allocation for the compilation of economic statistics compared to that for social and other statistics. As shown in Table 2.4, public finances have the lowest average reported data gaps at 12 per cent, but balances of payments and prices, national accounts and trade are only slightly higher. Labour market statistics have the highest reported gaps on average at 25 per cent because, as previously mentioned, some countries in the Organization of Eastern Caribbean States (OECS)
historically have not compiled continuous household labour force surveys.
Table 2.5 shows the results for broad social and other aggregates. The nutrition aggregate has the highest estimated data gap according to the respondents, with 12 of the countries reporting at least a 50 per cent data gap. Kiribati, Malta, Seychelles, and Trinidad and Tobago all indicated having no compiled data and statistics related to nutrition of the respective nation’s population. Nutrition as a broad aggregate has an average estimated data gap of approximately 67 per cent. Environmental data are the next highest aggregate, with an estimated value of 54 per cent, as Kiribati, Namibia and Seychelles all show a 100 per cent data gap and Grenada follows closely with 90 per cent.
Population and demographic data has the lowest estimates gap on average, which reflects the ten-year frequency with which surveys are conducted. It is, however, not surprising that education and health also exhibit the lowest estimated data gaps after population and demography, since many countries receive funding and technical assistance from international agencies like the World Health Organization (WHO) and Pan-American Health Organization (PAHO) in the area of health and the UN Educational, Scientific and Cultural Organization (UNESCO) and the UN Children’s Fund (UNICEF) in the area of education. These agencies are driven by evidence-based initiatives, which require the submission of data and information as part of their routine monitoring and evaluation procedures.
Table 2.4 Gap analysis for broad economic data aggregates (%)
Country Broad economic aggregates
National accounts
Prices Trade Public finances
Balance of payments
Monetary statistics
Labour market
Antigua & Barbuda 20 35 50 40 20 30 80Bahamas, The 20 20 0 0 0 0 0Barbados 10 0 0 10 10 0 0Cyprus 0 10 0 0 10 10 20Grenada 40 0 20 20 15 0 75Jamaica 0 0 10 0 0 0 10Kiribati 0 0 0 0 0 100 50Malta 0 0 0 0 0 0 0Namibia 0 0 0 0 0 10 0Nauru 30 30 60 0 40 100 30St Lucia 40 20 30 40 40 40 40Samoa 45 35 40 40 35 30 25Seychelles 10 5 5 5 10 5 10Trinidad & Tobago 0 0 0 0 0 0 0Vanuatu 0 40 10 20 10 5 30Average data gap 14 13 15 12 13 22 25
The Role of Data and Statistics for Policy-making in Small States 39

In general, social and other aggregates have significantly higher average estimated data gaps when compared to economic aggregates. Across the broad economic aggregates of the countries that responded to the survey, Malta and Trinidad and Tobago have the least reported data gaps, while Antigua and Barbuda and Nauru have the highest data gaps. For social and other aggregates, Barbados has the lowest estimated data gap on average of approximately 18 per cent, while Kiribati exhibited the highest estimated gap of 67 per cent. More information is provided in the charts in Appendix 2.1.
2.4.4 Challenges
There are numerous challenges facing small states in the collection of data and filling data gaps. These include human resources, information technology, as well as geographic and demographic issues to name a few; these are highlighted in the review of key documents on data in small states and captured in the survey responses. Equally worrisome are the important areas in which data gaps exist, namely social and environmental, and the heightened potential for ineffective policy formulation in the absence of such data. The persistence of these data gaps over time merits a deeper analysis of the key challenges. This is done in the following section, drawing on dialogue with statistical offices and key agencies assisting small states, including the IMF technical assistance centres.
Funding
Underfunding of national statistical agencies is a major hurdle for the majority of the small states, which must be overcome in order for the current level of statistical capacity to expand. This has been a perennial problem for most small states, as competing pressures from other social and economic projects have been given greater consideration from all governments. This situation is unlikely to change significantly in the foreseeable future, as countries have experienced low rates of economic growth in recent years which have severely impacted tax revenues. Further, most public finance systems across the CSS are undergoing some form of austerity, so unless external funding support is accessed to facilitate the development of statistical capacity, these agencies will continue to operate under extremely tight budgets which will further impair their capability.
Human resource constraints
According to the survey results and the statistical strategic plans reviewed, in many countries there is a lack of professionals with high competencies and/or relevant experiences to undertake statistical tasks. This causes two main problems in small states: it limits the ability to perform specialised tasks and increases reliance on a few qualified members of staff, which ultimately delays data analysis and production. Most countries and agencies surveyed mentioned the need
Table 2.5 Gap analysis for broad social and other aggregates (%)
Country Broad social and other aggregates
Health Education Population and demography
Crime Environment Information and communications technology
Nutrition Gender
Antigua & Barbuda
40 40 50 70 60 55 70 60
Bahamas, The 0 0 0 0 50 50 50 0Barbados 20 10 0 40 20 10 20 20Cyprus 30 20 20 25 10 20 50 20Grenada 20 5 5 10 90 60 90 50Jamaica 10 30 10 30 25 40 20 40Kiribati 90 40 0 50 100 100 100 55Malta 10 10 20 25 40 0 100 0Namibia 50 50 0 30 100 80 80 50Nauru 20 10 10 60 30 60 80 30St Lucia 50 50 50 50 50 50 50 40Samoa 35 30 20 40 40 50 60 40Seychelles 5 0 0 10 100 10 100 20Trinidad &
Tobago50 30 0 20 40 40 100 100
Vanuatu 40 10 4 50 50 60 40 10Average data
gap31 22 13 34 54 46 67 36
40 Small States: Economic Review and Basic Statistics

for ‘more high-level technically trained staff ’, and cited lack of key technical capabilities as a hindrance to filling data gaps. This begs the question of where does the problem lie? Is it that there are not sufficient suitably qualified persons residing in these countries?
The results of the survey suggest that the problem is two-fold, based on availability and affordability. First, there is a small pool of suitably qualified persons, attributed in part to the small number of persons opting for a career in statistics and to the relatively high personnel turnover in statistic offices due to low remuneration. The workload and exposure to specialised training also make these individuals prime targets for more lucrative work in the private sector and/or international agencies. As a result, most statistical offices have a large number of statistically untrained or temporary personnel. There is need for better remuneration packages to retain and attract well-qualified staff.
This raises the affordability aspect of the problem, which hinges on a lack of financial resources to recruit and retain the best staff and is compounded by the need for continuous training and re-training to shore up the knowledge base.
Consequently, a relatively small number of people are responsible for dealing with a diverse set of statistical functions such as consumer prices, designing sample surveys and compiling environmental statistics. In almost all countries, there was the absence of a strategy for developing statistical skills among the staff working for the different institutions that form the NSS. Training plans for individuals are rare, and few statistical producers have training plans for the units. Opportunities for external training appear from time to time, but are sometimes missed due to current systems of approval for attendance. Barbados cited the need for dedicated human resources (HR) staff to co-ordinate training and allocation of personnel, while Seychelles indicated the need for a strong HR presence – this also to assist with the training needs of the NSB.
Geographic and demographic characteristics and confidentiality
Another of the challenges identified, linked also to financial resources, is the relatively large samples required in relation to a smaller population size to obtain valid results in statistical surveys, as well as the higher per capita cost of data acquisition for large territories with a relatively small population or an unevenly and sparsely distributed population. Kiribati, for example, has islands 3,000 km apart and people have to take an international flight between these islands. Lack of anonymity of statistical units
in the population requires specialised treatment of aggregated data and public use samples. Issues of diversity between populations or sub-populations also lead to higher costs of implementing harmonised standards, classifications and coding systems.
Strict adherence to the confidentiality principle is observed in small states because of the relative ease with which a specific entity’s records of data may be identified, even when aggregation rules are employed to ensure non-disclosure. However, this fear is ever-present among various segments of the business community, who are of the view that submitted information will be shared with tax authorities. It is vitally important that the public at large is educated as to the flow of information across agencies operating within national statistical systems, so that issues and unfounded fears related to confidentiality are restricted to an absolute minimum.
IT issues
The challenges related to information technology are significant across Commonwealth small states. Some of the ‘pros’ of small statistical systems include a smaller amount of software customisation, due to the relatively narrow level of diversity of data elements and easier adoption of standardised coding and classification systems across statistical units when there is commitment. Some of the ‘cons’ are slow responses of central IT services for hardware and software support, and a lack of statistical data confidentiality from other agencies of government.
Most countries’ response to the survey cited the need for more IT resources in order to fully execute their mandate. Specifically these include the absence of a proper IT platform to share information, resulting in issues of search and retrieval function, processing times and storage. ICT strategic plans can be found under the profiles of some of the small states in the Commonwealth on the UNSD website, but these are generally related to the use of ICT at the national level as opposed to the specific needs of statistical production units within the NSS. A 2013 diagnostic of the Barbados Statistical Service revealed an absence of ICT strategy for a modern statistical information system, with some of the problems identified including a lack of standardisation, data integration and sharing, and security practices that are either not sufficiently designed and/or properly implemented.
Regional and external support
Given the lack of capacity and sometimes resource availability, most of the statistical offices in the CSS rely heavily on external and externally funded technical
The Role of Data and Statistics for Policy-making in Small States 41

expertise. For example, CARTAC is one of eight IMF Regional Technical Assistance Centres (RTACs) located around the world in the Pacific, the Caribbean, in Africa, the Middle East and Central America. CARTAC provides technical assistance in economic and financial management to 20 countries and territories in the Caribbean. The Government of Canada (through the Canadian International Development Institute [CIDA]) has provided the largest share of the centre’s funding, which is complemented by contributions from the IMF and other international donors. While clearly needed, this heavy reliance on external sources of funding means that the agenda for reform of these statistical systems is often externally determined and driven.
2.4.5 Priority areas
Given the challenges that small states face, in particular the financial resource constraints, it is not surprising that data gaps exist in key areas. It is unlikely that these will be resolved soon given ongoing resource constraints, and so efforts must focus on prioritising. The following priorities have been identified based on the information compiled by statistics professionals in the various member countries, and from a number of published strategic plans for the development of NSSs. It is by no means exhaustive.
Economic data priorities
Though economic data receives the largest share of statistics resources and attention across all CSS, there are still some stubborn areas where data gaps exist. Closure of these gaps would significantly improve existing economic policy-making frameworks:
• Development of quarterly national accounts
• Establishment of tourism satellite accounts
• Supply and use tables
• Enhanced labour markets indicators (including skills gap analyses)
• Improvements in agricultural statistics coverage and food security
• Enhanced centralised common business registers (including international business registers).
Most of the small states compile their national accounts on an annual basis using mainly the production and expenditure approaches. Transitioning to a quarterly basis would be a Herculean task given available resources, but the benefits accruing from more effective policy formulation are likely to exceed the investment. A quarterly national accounting framework provides the avenue for continual evaluation. Adopting quarterly national accounts would also facilitate the adoption of tourism satellite accounts and full supply and use tables.
In order to adequately address these areas, specialised training of personnel will be required within a well-defined executable work plan tailored specifically to each country’s needs and supported by donors and other development partners.
Social data priorities
As demonstrated in the analyses previously presented, there is a dearth of social data available for effective policy-making in most CSS. In particular, the provision of social integrated data are critically important. Though public expenditure on these areas accounts for a significant proportion of the government’s fiscal budget, not enough attention is paid to the collection of data and statistics to evaluate the effectiveness of such expenditures. Enhanced policy formation in this area could potentially result in significant improvements in resource allocations and efficiency.
Education information systems (EIS): In general, across the CSS there is no mechanism to track the performance of individuals as they progress through the various segments of the school system. This is especially critical for small states, as the rate of return on public investment should be monitored to assess the effectiveness of resource allocations. Timely strategic intervention could help close the achievement gaps that currently exist. These systems would also allow for better management and deployment of resources, since they would be driven by the country’s needs rather than from special interests. Identification of specific skill sets would make it easier for businesses and governments to plan more effectively to satisfy the needs of the current and future labour markets. Jamaica and Namibia identified education as one of their top three priority areas for statistical development.
Health information systems (HIS): These systems are not dissimilar to EIS, other than the focus on the delivery of better health care and management of the health system. The digitisation of health records helps access by medical officials at the right time, saves lives and reduces the overall cost of health care delivery. Improvements in national health surveillance would improve significantly and, with appropriate intervention, could also contribute to a reduction in long-term costs. Research opportunities for the purpose of enhancing preventative care would be a significant benefit. Malta identified the establishment of a system of health accounts as one of its top three priority areas where data and information gaps exist, as did Trinidad and Tobago and Vanuatu.
Environmental data priorities
The reality of climate change is just one of many serious challenges that confront SIDS, in particular, and therefore environmental indicators are essential to summarise the
42 Small States: Economic Review and Basic Statistics

results of any monitoring programme. Air and water pollution, water scarcity, desertification, and the depletion of natural resources cause frequent disasters such as floods and landslides, and are thus having an adverse impact on almost all forms of economic activity and generally diminishing the quality of life in small states.
To address these problems, a broad-based programme of environmental policies and regulations is needed. Such programmes require that countries collect and compile authentic environment data for use by government officials and other decision-makers. Data relating to existing environmental conditions are crucial for environmental planning and decision-making. CSS will therefore need to collect and collate environment statistics on an urgent basis. Table 2.6 below outlines the priority areas for environmental data collection, particularly for SIDS.
Environmental management that is conducive to the development of renewable energy, energy efficiency, and waste management will be the catalyst for reducing the impacts of economic shocks, as good management improves the room for manoeuvre when a country is faced by such shocks. Environmental management is particularly important for adaptation to climate change impacts, which could potentially usher in catastrophic situations, associated with, among other things, sea-level rise, earthquakes, floods, tsunamis, health hazards, and increased frequency of extreme events. Data are the lynch-pin of any good environmental management framework.
2.5 Addressing data challenges in small states
This section focuses on recommendations to address the data and statistical shortages in small states.
Table 2.6 Environment data priorities
Environmental component Social and economic activity
1. Flora Agricultural and livestock production (including land clearing, irrigation, grazing, harvesting, use of fertilisers and pesticides)
Forestry and loggingCompeting land use (settlements, agriculture, forestry, mining, recreation, etc.)Emissions hazardous to flora
2. Fauna Livestock productionHunting, trapping and game propagationCompeting land use (agriculture, ranching, settlements, etc.)Emission hazardous to fauna
3. Atmosphere Land use affecting climate (deforestation, desertification, drainage, irrigation, urban sprawl, infrastructure)
Emission of air pollutants from stationary and mobile sources (industry, agriculture, household, transportation)
4. Water a. Freshwater Water withdrawal (surface water, ground waters other)
Water use (industrial, domestic and municipal, agriculture)In-stream water use (hydropower generation, transportation, fishing)Waste water and discharge (includes sedimentation)
b. Marine water Non-consumptive water use (tidal energy generation, transportation, fishing, etc.)Waste withdrawal and use (desalination, consumption)Competing coastal land use (infrastructure, tourism, recreation)Seabed mining (including offshore oil drilling)Emissions from coasts and rivers, sea dumping, oil spills
5. Land/soil a. Surface Land use (agriculture and livestock, forestry and logging, mining and quarry, human
settlement, transportation, etc.)Waste and waste water discharge
b. Sub-surface Mining and treatment of metallic and non-metallic mineralsExtraction of energy resources (fossil fuels, geothermal and nuclear)Discharges (dusts and air pollutants, acid drainings, tailings, liquid wastes, radioactive
waste disposal)6. Human settlements Population growth and migration
Construction (residential, non-residential)Utilities (energy and water supply)Transportation (public, private)Land use in settlements (residential, industrial commercial, transportation and other
infrastructure)
The Role of Data and Statistics for Policy-making in Small States 43

A large proportion of this work is already underway, led by international agencies such the IMF through its RTACs. In the Asia-Pacific region, the United Nations Statistical Institute for Asia and the Pacific (UNSIAP) provides technical assistance to the CSS in the region, together with the Secretariat of the Pacific Community (SPC) and the Pacific Financial Technical Assistance Centre (PFTAC). In the Caribbean, the Caribbean Community (CARICOM) provides statistical technical assistance and support to the member countries, along with CARTAC. For the African countries, the African Regional Technical Assistance Centre (AFRITAC) South provides technical support to the southern African countries while the Statistical Office of the European Commission (EUROSTAT) provides additional support to the Mediterranean countries. The only drawback is that most of this work takes place across broad economic aggregates. UN agencies like UNESCO and UNICEF, and other international agencies like the WHO and the International Labour Organization (ILO), provide technical support in their areas of expertise, but generally it is not in the area of statistical development. Any technical assistance rendered is often not as sustained as with economic technical assistance.
2.5.1 Adapting NSDS approach to small countries
Partnership in Statistics for Development in the 21st Century (PARIS21) focuses its efforts on assisting and encouraging all low-income and lower-middle-income countries to design, implement and monitor national strategies for the development of statistics (NSDSs) and to have nationally owned and produced data for all MDG indicators. An NSDS is expected to provide a country with a strategy for developing statistical capacity across the entire national statistical system (NSS). The NSDS will provide a 5–10 year vision and will set milestones for getting there. It will present a comprehensive and unified framework for continual assessment of the evolving user needs and priorities for statistics, and for building the capacity needed to meet these needs in a co-ordinated, synergistic and efficient manner (PARIS21 2004). The framework will also include strategies for mobilising, harnessing and leveraging resources (both national and international) and a basis for effective and results-oriented strategic management of the NSS. Some of the considerations for adapting the NSDS to small countries are discussed hereafter.
Engendering political and legal commitment: In formulating NSDSs in small states, it is important to place special emphasis on support at the highest political level. Structural and systemic change to institutions producing statistical information is required in the
form of legislation that ensures that the statistical law of the country permits access to datasets for statistical purposes, such as national insurance, tax agencies etc. Specific methods to address this issue must be included in the NSDS endorsing and visioning process.
IT standardisation: It is important for each country to determine specific policies on the adoption of standardised software for specific applications, to reduce the cost of maintenance and ongoing ownership associated with acquiring software updates, i.e. trade processing or consumer prices etc. This approach could be linked to regional support mechanisms to lower the cost of ownership of software and hardware.
Statistical standards: NSDSs should put emphasis on: (a) ensuring compliance with international standards, International Classification of Diseases (ICD10), International Standard Classification of Occupations 2008 (ISCO-08), International Species Information System (ISIS), Harmonized System (HS), and System of National Accounts (SNA) 2008, which promote harmonisation and comparability of data; and (b) utilising strong statistical standards including data and metadata standards through the use of tools such as International Household Survey Network (IHSN) (Data Documentation Initiative [DDI], National Data Archive [NADA] catalogues), Development Information Database System (DEVInfo) (Statistical Data and Metadata Exchange [SDMX], DDI, Dublin Core Metadata Initiative [DCMI]), REtrieval of DATa for small Areas by Microcomputer (REDATAM) and Census and Survey Processing System (CSPRO). The application of these standards and data tools will allow wider availability and accessibility of data without additional technical overhead which is of limited availability in small states.
Integration of NSDS into regional strategies for the development of statistics (RSDS): For small states, the NSDS should be a buttress to a wider range of institutional supports composed of regional governing political, international, bureaucratic and specifically statistical entities. A mechanism for the co-ordination of RSDSs with NSDSs needs to be established. This mechanism should enable testing statistical activities in a pilot country, and replication of the exercise based on lessons learned to other countries within respective regions.
Within the framework of NSDSs and RSDSs, it is important to establish a set of protocols in order to deal with external agencies, as well as to co-ordinate funding and technical support received from these agencies. A few principles are relevant in this context:
• Recognition of small states’ limitations is important, especially in regard to expertise and specialisation. These challenges can be taken up through
44 Small States: Economic Review and Basic Statistics

consistent, persistent international/regional expert support and the creation of technical/administrative support centres.
• The link between RSDSs and NSDSs must be made for the purpose of enhancing the availability of timely, relevant and accessible statistical evidence for policy-making support and for maintaining the national ownership in the process. For this, the national benefits of any strategy must be clearly articulated and must enjoy wide intrinsic support among national actors. In addition, NSDSs and RSDSs linkages should be extended to the funding of regional/national support mechanisms, particularly in the implementation phase of NSDSs. The linkage between the NSDS and national development strategies is vital to enable statistics to be considered as national priorities for policy measurement and monitoring.
• For staff in NSOs, the regular participation in regional training programmes is highly recommended to build in-country expertise. The option of twinning countries – bilateral collaboration between less competent countries and countries with strong statistics – should be considered as an ongoing arrangement to provide statistical leadership and mentoring, as well as technical support in the long term.
Importance of users: More collaboration between data producers and data users needs to become the foundation of the NSDS approach. A particular characteristic of small states is the strong adherence to non-disclosure. However, this tradition must be balanced by recognising the need of users for reliable samples/datasets of anonymised data, inclusive of online dynamic use of encrypted databases. The adoption of the NSDS process will require support from user–producer workshops and could be enhanced by the use of social media, such as Twitter, Facebook and LinkedIn, in order to announce major data releases on a pre-announced calendar and answer and/or interact with users on questions pertinent to the specific dataset, where corresponding explanations are not deemed to be adequate on methodological grounds. The recognition of the valuable data validation and consistency review that users can bring to the process in terms of adding metadata to series, adding to coherence with related series, adding explanations to series volatility, as a consistency check for unusual results, must be incorporated into the collaborative relationships built.
Addressing human capacity issues: It is important to address human capacity issues if small states are to address data gaps. This will be challenging, but small states are making some effort to tackle this problem. For example, in the Pacific, the University of the South Pacific (USP) operates in all independent states in the Pacific
except Papua New Guinea, which has its own university. Since 2005 it has provided a modular degree programme in official statistics, part-funded by the EU, which allows non-graduate staff working in official statistics to study for qualifications and which will lead to professional status in their organisation. Students must pay their own fees or get their employer to pay, as there are no scholarships available. USP also runs relevant modules in economics and population studies. This results in better and more staff training and development, which are high on the Pacific countries’ list of necessary improvements.
A good example of the reform process at work is the case of Namibia. In order to address some of the challenges faced in Namibia, the NSA is currently undertaking initiatives to raise the profile of the newly created agency with a view to closing many of the data gaps that exist. The NSA is marketing and promoting the NSS’s statistical products and services, using the NSA’s website to promote access, issuing advance release calendars to promote confidence in the statistics being produced, and assisting users in making better use of statistics. The NSA website has enhanced the accessibility of statistics, with an interactive database from which users can download data quickly. These formats have to be standardised so that future outputs, whether printed or digital, will easily be recognised as emanating from the NSA. Accessibility has been improved by offering users a full range of publication options, including print version, website downloads, press releases and email messages, depending on user preferences. The NSA has taken statistics to schools and to the regions, and is currently collaborating with universities and other research institutions.
2.5.2 Improving data and statistical capacity in priority areas
Given the current level of resources available to most statistical offices, the primary objective would be to streamline as much as possible the workload of existing staff and improve organisational resource management. This requires much better planning on the part of senior management than currently exists in most countries, with the main focus of eliminating redundant activities.
At the moment, there is not a well-established relationship between agencies in the NSS and local universities and community colleges in many countries. The primary recommendation would be to create statistical courses at these educational institutions, which require students across the various specialisations to participate in focused research projects and/or data gathering exercises for which credit will be given. In the prevailing economic climate, this is the most cost-efficient way to tackle the problem and, once properly co-ordinated, could significantly
The Role of Data and Statistics for Policy-making in Small States 45

improve the availability of data and statistics in the areas previously identified. Programmes such as these would also prove useful in raising awareness of the importance of having data collected and produced on a timely basis. For example, teachers, doctors and nurses, lawyers in training etc. would each participate in a specific project whose output would actually be filling a specific data gap. Relationships would be established between various statistical units and these frontline staff, who in the future would be providing statistics to the agencies. This kind of forward planning is especially important in small states, where specialised resources are not always available and which therefore need a system that has a sufficiently large and varied set of non-statistics professionals capable of producing statistics at some minimum level.
The second recommendation in this area would be to also establish a working relationship between statistical agencies and other stakeholders such as NGOs. NGOs – though facing similar challenges – are a valuable source of data, information and sometimes resources, and one that remains highly underutilised across most of the CSS. As with the previous recommendation, the management of these relationships will prove critical to the success of such programmes. In Namibia, for example, in order to overcome issues related to low statistical advocacy and awareness, the NSA proposes to carry out the following between 2013 and 2017: 1) market and promote statistical products and services; 2) issue advance release calendars to promote confidence; 3) disseminate statistics in a user-friendly manner; 4) use press releases, press conferences and workshops for publicity; 5) take statistics to schools and to the regions; 6) collaborate with universities and other research institutions; and 7) collaborate with local and regional governments.
It is important for national statistics offices to foster and encourage cohesion and integration, sharing among international, regional and subregional partners mandated to assist with statistical development. This could take place as part of the overall monitoring and evaluation mechanism of the NSDS, with a view to providing adequate developmental support during the implementation phase of the NSDS. It will also help to enhance the confidence of the political directorate in the professionalism and the adequacy of quality standards in the statistical system.
2.5.3 Operational IT
Greater use of technology, in particular mobile technology, would substantially improve the coverage of statistics across the statistical systems. This requires funding to acquire the right hardware and software that is fit for the purpose; this is currently beyond the scope of many operational budgets in CSS. Naturally,
the significant reduction in time for data processing would allow more in-depth analysis to be completed as close to real time as possible. Moreover, truly integrated national IT platforms would also allow the delivery of ‘big data’ analytics to policy-makers and other users.
Leveraging the use of standardised software would play a key role in reducing training requirements of staff to make available to users data on a timely basis through the use of content management websites. Census and Statistics Dissemination’s (CELADE) REDATAM, for instance, helps build an interactive and dynamic website for the dissemination of census and survey data after a two-week training programme. The NSS has to designate a content manager, who will be in charge of updating content on the website based on a specific user publication security protocol and engaging in social interactions with users via Facebook, Twitter and LinkedIn. This will ensure quick and ready publication of recently released data to the general public, and will leverage the considerable ability of the user community to assist with metadata explanations of fluctuations in the data series, among other benefits. In general, statistical offices also need to exploit more open-source software to reduce the burden on their operational budgets.
Data storage is always a problem for national statistical systems, and for small states seeking to close gaps and expand coverage this will continue to be a challenge. Borrowing from the private sector, during the economic crisis organisations started looking at innovative ways to optimise their storage with the intention of maximising utilisation and optimising cost efficiency. Storage optimisation and efficiencies such as de-duplication,8 compression, thin provisioning, space-efficient snapshots, caching and tiering contribute to the objectives of maximising storage utilisation and minimising costs. Primary data de-duplication is proving to have the most dramatic impact on data footprint reduction and should be seriously considered.
Storage and server virtualisation allows a number of workloads with different characteristics to run on a single storage system to better allocate resources. Storage virtualisation is also being adopted to enable efficient usage of capacity, hence reducing the need to purchase additional storage systems.
Many of the above-mentioned efficiencies can be implemented on primary datasets. Efficiencies, such as primary de-duplication, bridge the gap between a lower cost reduction rate and higher data growth within an organisation. The ability to reasonably reduce the rate of data growth at the source (primary dataset) using primary de-duplication gives any IT organisation a better handle on capacity and costs.
46 Small States: Economic Review and Basic Statistics

2.6 Conclusion
Effective monitoring of development policies and programmes requires a stream of comprehensive socioeconomic and environment data. Such data provide baseline values for monitoring indicators. There is a dearth of data on important developmental issues, including the profile of rural populations, household food security and nutrition, poverty profiles of the population, the state of the environment, gender issues etc. This is bound to constrain effective monitoring, especially of poverty reduction programmes and attainment of the MDGs.
Existing data have quality problems caused by a number of factors – such as outdated sampling frames, inadequate survey instruments, definitional problems, very low response rates in business surveys, inadequate or lack of training for and supervision of data collectors, inadequate data scrutiny and handling, especially in line ministries, using outdated weights, insufficient data validation etc. Lack of data quality creates problems in setting some development targets, and there is also the danger that such data may lead to policy-makers drawing incorrect conclusions from movements in certain indicators. These observations are supported by the assessment of the MDGs, WDIs and the results of the present survey.
Many data series lack timeliness, which affects their usability – especially for decision-making. This is influenced to a large degree by the limited human resource capacity across the various statistical systems. Consequently, CSOs do not fully meet users’ needs for statistics in terms of timeliness, coverage, relevance and transparency, as well as harmonisation with other local data producers.
To date a number of countries have already embarked on redevelopment of their national statistical systems, with considerable support from international agencies and experts. A core aspect to the successful implementation of NSDSs is the leadership shown, especially within the statistical system in terms of openness to change and improvement that would enhance the timeliness, accuracy, relevance and accessibility of statistical data. It is therefore very critical that leaders exert a clearly articulated vision and mission for the NSDS process.
There is still a considerable amount of work to be done in order for small states to move towards a fully functioning, evidence-based, policy-making framework with the significant closure of exposed data gaps. In most cases, this will require the absolute buy-in of all stakeholders involved to provide the necessary leadership required to move the process along. International donor agencies, too, can play a role in facilitating this move by using their leverage and good relations to achieve better resource allocations through enhanced decision-making.
For small states in particular, the skill set that resides in statistical offices is among the highest in the country. Yet because of low public profiles, these skills are not being fully utilised in the policy-making framework other than for providing data and reports. It is the present author’s considered view that it is especially important for small states to fully engage all available knowledgeable resources in the policy-making framework.
This review has also revealed the strong need for agencies to improve their level of organisational efficiency as a prerequisite for an effective policy-making framework. The introduction of IT (hardware and software) must be matched with a constant drive to improve upon existing methodologies along with the relatively early adoption of the latest tools. Statistics professionals can be much more effective in small states if this kind of approach is deployed and accompanied by the right kind of management ethos. This would help to foster better collaboration within the NSS to the benefit of the respective country.
Acknowledgements
Gratitude and thanks are extended to the following persons who provided valuable assistance:
1. Statchel Edwards, Chief Statistician, Statistics Division (Antigua and Barbuda)
2. Victor Browne, Director (Ag.), Barbados Statistical Service
3. Karras Lui, Manager of Economics Department, Central Bank of Samoa
4. Laupua Fiti, CEO (Ag.) Economic Statistics, Samoa Bureau of Statistics
5. Marc PrudHomme, Real Sector Specialist, CARTAC
6. Laura Ahtime, Chief Executive Officer, National Bureau of Statistics (Seychelles)
7. Sterling Chadee, Assistant Director (Ag.), CSO (Trinidad and Tobago)
8. Benuel Linge, Senior Statistician, Vanuatu National Statistics Office
9. Costas Diamantides, Senior Statistics Officer, Statistical Service of Cyprus
10. Halim Brizan, Director, CSO (Grenada)
11. Ryan Als, Technical Officer, National Conservation Commission (Barbados)
12. Frederick Gordon, Manager, JAMSTATS, Planning Institute Of Jamaica
13. Joseph Bonello, Director – Economic Statistics, National Statistics Office (Malta)
The Role of Data and Statistics for Policy-making in Small States 47

14. Jackie Noabeb, Director: IT and Data Processing, Namibia Statistics Agency
15. Ipia Gadabu, Director, Nauru Bureau of Statistics
16. Edwin St Catherine, Director of Statistics, CSO St Lucia
17. Leona Wilson, Deputy Director, Bahamas Depart-ment of Statistics
18. Taiaopo Faumuina, Principal Statistician-Census and Survey, Samoa Bureau of Statistics
19. Aritita Tekaieti, Senior Statistician (Economic Statistics), National Statistics Office (Kiribati)
Notes 1 The definition of a small state as a country with 1.5 million
people or less was agreed by the Commonwealth Advisory Group in its report, A Future for Small States: Overcoming Vulnerability (Charles 1997). Jamaica, Lesotho, Namibia, Botswana and Papua New Guinea are included in the Commonwealth group of small states because they share similar characteristics to those of small states.
2 ‘Big data’ refers to datasets whose size is beyond the ability of typical database software tools to capture, store, manage and analyse. As technology advances over time, the size of datasets that qualify as big data will also increase. Also note that the definition can vary by sector, depending on what kinds of software tools are commonly available and what sizes of datasets are common in a particular industry. With those caveats, big data in many sectors today will range from a few dozen terabytes to multiple petabytes (thousands of terabytes) (Manyika et al. 2011).
3 More details can be found in ADB 2002. 4 See: http://mdgs.un.org/unsd/mdg/Data.aspx. The metadata
and responsible agencies can be found on http://mdgs.un.org/unsd/mdg/Metadata.aspx (accessed October 2013).
5 The relative data gap is calculated as the number of missing data divided by the total number of data points by region.
6 The full MDG database is available for download at http://mdgs.un.org/unsd/mdg/Default.aspx (accessed September 2013) and each country has 171 indicators ranging from 1990 up until the present.
7 Figures in square brackets [] are the number of indicators in the MDG database with data available for 2010.
8 Data de-duplication (often called ‘intelligent compression’ or ‘single-instance storage’) is a method of reducing storage needs by eliminating redundant data. Only one unique instance of the data is actually retained on storage media, such as disk or tape. Redundant data is replaced with a pointer to the unique data copy. See: http://SearchStorage.techtarget.com (accessed March 2014).
9 Although Papua New Guinea has a population of about 7 million, it faces many of the same challenges that other Commonwealth small states face and has thus been included in this review.
10 Dudley, N (ed.) (2008), Guidelines for Appling Protected Areas Management Categories, IUCN: Gland, Switzerland, 8–9.
References
Asian Development Bank (2002), Handbook on Environment Statistics, Economics and Research
Department, Asian Development Bank, Manila, available at: www.unpei.org/sites/default/files/PDF/PEMonitoring/Handbook-env-statistics.pdf (accessed October 2013).
Banks, G (2009), Evidence-based policy making: What is it? How do we get it? Australia and New Zealand School of Government, Canberra.
Barbados Statistical Service (2013), Barbados Statistical System Modernisation Project 2013, Government of Barbados, Bridgetown.
Busby, L (2002), The Production of Statistical Data and Information in the Caribbean – Proposals for increasing efficiency in this sphere, ECLAC, Santiago.
Busby, L (2003), General Data Challenges Facing the Caribbean in the Context of Sustainable Development, ECLAC, Santiago.
Central Statistical Office Swaziland (2003), Strategic Plan for Central Statistical Office in Swaziland (2004/05–2008/09), Government of Swaziland, Mbabane.
Charles, E (1997), A Future for Small States: Overcoming Vulnerability, Commonwealth Secretariat, London.
Manyika, J et al. (2011), Big data: The next frontier for innovation, competition, and productivity, McKinsey Global Institute, San Francisco.
Namibia Statistics Agency (2012), Strategic Plan for Namibia Statistics Agency (2012/13–2016/17), Namibia Statistics Agency, Windhoek.
Nurse, L and G Sem (2001), ‘Small Island States’, in JJ McCarthy, OF Canziani, NA Leary, DJ Dokken and KS White (eds), Climate Change 2001: Impacts, Adaptation, and Vulnerability, Cambridge University Press, Cambridge, 843–875.
PARIS21 (2004), A guide to designing a national strategy for the development of statistics, PARIS21, Paris, available at: www.paris21.org (accessed September 2013).
Powers, S (1992), ‘Statistical Needs in Eastern Europe’, Monthly Labor Review, 18–28, March.
PrudHomme, M (2013), Achievements and challenges from the Statistics Technical Assistance Section, CARTAC, Bridgetown.
Roberts, J L and I Ibitoye (2012), The Big Divide: A Ten Year Report of Small Island Developing States and Millennium Development Goals, Commonwealth Secretariat, London.
UNESCO (2010), Guidelines for planning education ain emergencies and reconstruction, International Institute for Educational Planning, UNESCO, Paris, available at: http://unesdoc.unesco.org/images/ 0019/001902/190223e.pdf (accessed December 2012).
World Health Organization (2008), Toolkit on monitoring health systems strengthening, WHO, Geneva, available at: www.who.int/healthinfo/statistics/toolkit_hss/EN_PDF_Toolkit_HSS_ServiceDelivery.pdf (accessed November 2013).
48 Small States: Economic Review and Basic Statistics

Appendix 2.1 Data gaps from the survey results
The figures below give a graphical representation of the reported data gaps by economic and social aggregates from the survey results.
Figure A2.1.1 Survey data gap results: national accounts
0%
5%
10%
15%
20%
25%
30%
35%
40%
45%
50%
Antigua & Barb
uda
The Bahamas
Barbados
Cyprus
Grenada
Jamaica
Kiribati
Malta
Namibia
Nauru
St Lucia
Samoa
Seychelles
Trinidad &
Tobago
Vanuatu
Figure A2.1.2 Survey data gap results: prices
0%
5%
10%
15%
20%
25%
30%
35%
40%
45%
Antigua & Barb
uda
The Bahamas
Barbados
Cyprus
Grenada
Jamaica
Kiribati
Malta
Namibia
Nauru
St Lucia
Samoa
Seychelles
Trinidad &
Tobago
Vanuatu
Figure A2.1.3 Survey data gap results: public finances
0%
5%
10%
15%
20%
25%
30%
35%
40%
45%
Antigua & Barb
uda
The Bahamas
Barbados
Cyprus
Grenada
Jamaica
Kiribati
Malta
Namibia
Nauru
St Lucia
Samoa
Seychelles
Trinidad &
Tobago
Vanuatu
49

Figure A2.1.4 Survey data gap results: monetary statistics
0%
10%
20%
30%
40%
50%
60%
70%
80%
90%
100%
Antigua & Barb
uda
The Bahamas
Barbados
Cyprus
Grenada
Jamaica
Kiribati
Malta
Namibia
Nauru
St Lucia
Samoa
Seychelles
Trinidad &
Tobago
Vanuatu
Figure A2.1.5 Survey data gap results: trade
0%
10%
20%
30%
40%
50%
60%
70%
Antigua & Barb
uda
The Bahamas
Barbados
Cyprus
Grenada
Jamaica
Kiribati
Malta
Namibia
Nauru
St Lucia
Samoa
Seychelles
Trinidad &
Tobago
Vanuatu
Figure A2.1.6 Survey data gap results: balance of payments
0%
5%
10%
15%
20%
25%
30%
35%
40%
45%
Antigua & Barb
uda
The Bahamas
Barbados
Cyprus
Grenada
Jamaica
Kiribati
Malta
Namibia
Nauru
St Lucia
Samoa
Seychelles
Trinidad &
Tobago
Vanuatu
50 Small States: Economic Review and Basic Statistics

Figure A2.1.7 Survey data gap results: labour market
0%
10%
20%
30%
40%
50%
60%
70%
80%
90%
Antigua & Barb
uda
The Bahamas
Barbados
Cyprus
Grenada
Jamaica
Kiribati
Malta
Namibia
Nauru
St Lucia
Samoa
Seychelles
Trinidad &
Tobago
Vanuatu
Figure A2.1.8 Survey data gap results: population and demography
0%
10%
20%
30%
40%
50%
60%
Antigua & Barb
uda
The Bahamas
Barbados
Cyprus
Grenada
Jamaica
Kiribati
Malta
Namibia
Nauru
St Lucia
Samoa
Seychelles
Trinidad &
Tobago
Vanuatu
Figure A2.1.9 Survey data gap results: health
0%
10%
20%
30%
40%
50%
60%
70%
80%
90%
100%
Antigua & Barb
uda
The Bahamas
Barbados
Cyprus
Grenada
Jamaica
Kiribati
Malta
Namibia
Nauru
St Lucia
Samoa
Seychelles
Trinidad &
Tobago
Vanuatu
The Role of Data and Statistics for Policy-making in Small States 51

Figure A2.1.10 Survey data gap results: education
0%
10%
20%
30%
40%
50%
60%
Antigua & Barb
uda
The Bahamas
Barbados
Cyprus
Grenada
Jamaica
Kiribati
Malta
Namibia
Nauru
St Lucia
Samoa
Seychelles
Trinidad &
Tobago
Vanuatu
Figure A2.1.11 Survey data gap results: information and communications technology
0%
10%
20%
30%
40%
50%
60%
70%
80%
90%
100%
Antigua & Barb
uda
The Bahamas
Barbados
Cyprus
Grenada
Jamaica
Kiribati
Malta
Namibia
Nauru
St Lucia
Samoa
Seychelles
Trinidad &
Tobago
Vanuatu
Figure A2.1.12 Survey data gap results: crime
0%
10%
20%
30%
40%
50%
60%
70%
80%
Antigua & Barb
uda
The Bahamas
Barbados
Cyprus
Grenada
Jamaica
Kiribati
Malta
Namibia
Nauru
St Lucia
Samoa
Seychelles
Trinidad &
Tobago
Vanuatu
52 Small States: Economic Review and Basic Statistics

Figure A2.1.13 Survey data gap results: environment
0%
10%
20%
30%
40%
50%
60%
70%
80%
90%
100%
Antigua & Barb
uda
The Bahamas
Barbados
Cyprus
Grenada
Jamaica
Kiribati
Malta
Namibia
Nauru
St Lucia
Samoa
Seychelles
Trinidad &
Tobago
Vanuatu
Figure A2.1.14 Survey data gap results: nutrition
0%
10%
20%
30%
40%
50%
60%
70%
80%
90%
100%
Antigua & Barb
uda
The Bahamas
Barbados
Cyprus
Grenada
Jamaica
Kiribati
Malta
Namibia
Nauru
St Lucia
Samoa
Seychelles
Trinidad &
Tobago
Vanuatu
Figure A2.1.15 Survey data gap results: gender
0%
10%
20%
30%
40%
50%
60%
70%
80%
90%
100%
Antigua & Barb
uda
The Bahamas
Barbados
Cyprus
Grenada
Jamaica
Kiribati
Malta
Namibia
Nauru
St Lucia
Samoa
Seychelles
Trinidad &
Tobago
Vanuatu
The Role of Data and Statistics for Policy-making in Small States 53

Appendix 2.2 World Development Indicators data gaps
The World Development Indicators (WDI) are the World Bank’s primary indicators for development, compiled from officially recognised international sources. They present the most current and accurate global development data available, and include national, regional and global estimates. A review of some of the data published on small states on the WDI database shows data gaps across many of the broad economic and social indicators. In general there are areas for which data are available at the top level, but are not available at lower levels that would allow for more in-depth analysis. In the presentation of figures below, each quadrant will show data for Commonwealth small states in Africa and the Mediterranean together, Asia-Pacific, Caribbean and then the variations of small states aggregates within the WDI database. The reader should note that Nauru does not appear in the list of countries in the WDI, and so no data are registered for any of the variables presented below. All data are for the year 2010 unless otherwise indicated.
Figure A2.2.1 shows GDP at purchasers’ prices, which is the sum of gross value added by all resident producers in the economy plus any product taxes and minus any subsidies not included in the value of the products. It is calculated without making deductions for depreciation of fabricated assets or for depletion and degradation of natural resources. Data are in current US dollars.
Dollar figures for GDP are converted from domestic currencies using single year official exchange rates. Data for Tuvalu have been appropriately scaled to be visible on the chart in the Asia-Pacific quadrant.
This indicator has no data gaps for the period in question, with the exception of Nauru as mentioned previously, since this variable is estimated and produced in all countries at least once every quarter in most instances. However, an examination of gross capital formation (GCF), a subcomponent of GDP, quickly reveals the data gaps.
Figure A2.2.2 shows GCF (formerly gross domestic investment), which consists of outlays on additions to the fixed assets of the economy plus net changes in the level of inventories. Fixed assets include land improvements (fences, ditches, drains and so on); plant, machinery and equipment purchases; and the construction of roads, railways and the like, including schools, offices, hospitals, private residential dwellings, and commercial and industrial buildings. Inventories are stocks of goods held by firms to meet temporary or unexpected fluctuations in production or sales, and ‘work in progress’. According to the 2008 System of National Accounts (SNA), net acquisitions of valuables are also considered capital formation. The data gaps for this indicator are most acute in the Asia-Pacific region.
Figure A2.2.1 GDP (current US$ million)
54 Small States: Economic Review and Basic Statistics

Figure A2.2.3 shows public health expenditure (as a percentage of total health expenditure), which consists of recurrent and capital spending from government (central and local) budgets, external borrowings and grants (including donations from international agencies and non-governmental organisations) and
social (or compulsory) health insurance funds. Total health expenditure is the sum of public and private health expenditure. It covers the provision of health services (preventive and curative), family planning activities, nutrition activities and emergency aid designated for health, but does not include provision
Figure A2.2.2 Gross capital formation (% of GDP)
Figure A2.2.3 Public health expenditure (% of total health expenditure)
The Role of Data and Statistics for Policy-making in Small States 55

of water and sanitation. This indicator has almost complete coverage across the CSS in the WDI database.
Figure A2.2.4 shows the fish species threatened across the CSS. Threatened species are the number of species classified by the International Union for the Conservation of Nature (IUCN) as endangered, vulnerable, rare, indeterminate, out of danger or insufficiently known. All countries, except Nauru, had data available on the WDI database in 2012.
Figure A2.2.5 shows carbon dioxide emissions stemming from the burning of fossil fuels and the manufacture of cement. CO2 emissions include carbon dioxide produced during consumption of solid, liquid and gas fuels and gas flaring. Data for Antigua and Barbuda, Belize, Dominica, Grenada, Lesotho, St Kitts and Nevis, St Lucia, and St Vincent and the Grenadines were scaled to appear on the chart. Trinidad and Tobago accounts for approximately half of the total emissions for all small states due to exploitation of its oil and gas resources.
Figure A2.2.6 shows the data available on the WDI database for marine protected areas. These are areas of intertidal or sub-tidal terrain – and overlying water and associated flora and fauna and historical and cultural features – that have been reserved by law or other effective means to protect part or the entire enclosed environment. No data were present in the database for Maldives in 2010, whereas Guyana was the only country in the Caribbean with no marine protected areas. For Africa, Botswana, Lesotho and Swaziland
are all landlocked countries and thus have no marine areas as defined for the indicator. The data values for Barbados, Dominica, Fiji, Grenada and St Lucia were scaled to appear on their respective charts.
Figure A2.2.7 shows the percentage of the total population living in areas where the elevation is 5 metres or less above sea level for the year 2000. The landlocked countries of Botswana, Lesotho and Swaziland in Africa are highly elevated, and therefore no one lives below 5 m.
Figure A2.2.8 shows public expenditure on education as a percentage of total government expenditure, which is the total public education expenditure (current and capital) expressed as a percentage of total government expenditure for all sectors in a given financial year. Public education expenditure includes government spending on educational institutions (both public and private), education administration, and subsidies for private entities (students/households and other private entities). Unlike public health expenditure, public education expenditure data are sketchy across all regions for CSS. Data gaps are more acute in the Asia-Pacific region, followed by Africa.
Figure A2.2.9 shows the primary completion rate, which is the total number of new entrants in the last grade of primary education, regardless of age, expressed as percentage of the total population of the theoretical entrance age to the last grade of primary. This indicator is also known as the ‘gross intake rate
Figure A2.2.4 Fish species threatened, 2012
56 Small States: Economic Review and Basic Statistics

to the last grade of primary’. The ratio can exceed 100 per cent due to over-aged and under-aged children who enter primary school late/early and/or repeat grades. The Caribbean and Mediterranean countries have full data coverage for 2010, while Africa and Asia lag behind. This indicator is better than the public education expenditure shown in Figure A2.2.8,
particularly as all the regional aggregates for small states have sufficient data to register.
Figure A2.2.10 shows the net enrolment rate for primary school. This is the ratio of children of the official primary school age who are enrolled in primary school to the total population of the official primary school age. Only three
Figure A2.2.5 CO2 emissions (kt)
Figure A2.2.6 Marine protected areas (% of territorial waters)
The Role of Data and Statistics for Policy-making in Small States 57

Asia-Pacific countries (Maldives, Samoa and Solomon Islands) had data available in 2010 on the WDI database. In Africa, only two countries (Lesotho and Namibia) had data available, while in the Caribbean, Barbados, Dominica and Grenada did not have data available on the database. Despite the gaps indicated, all the small states aggregate measures had data available.
Figure A2.2.11 shows public expenditure, which is cash payments for operating activities of the government in providing goods and services. It includes compensation of employees (such as wages and salaries), interest and subsidies, grants, social benefits and other expenses such as rent and dividends. There are significant data gaps for the Asia-Pacific region as only Maldives has
Figure A2.2.7 Population living below 5 metres above sea level (% of total population), 2000
Figure A2.2.8 Public expenditure on education (% total government expenditure)
58 Small States: Economic Review and Basic Statistics
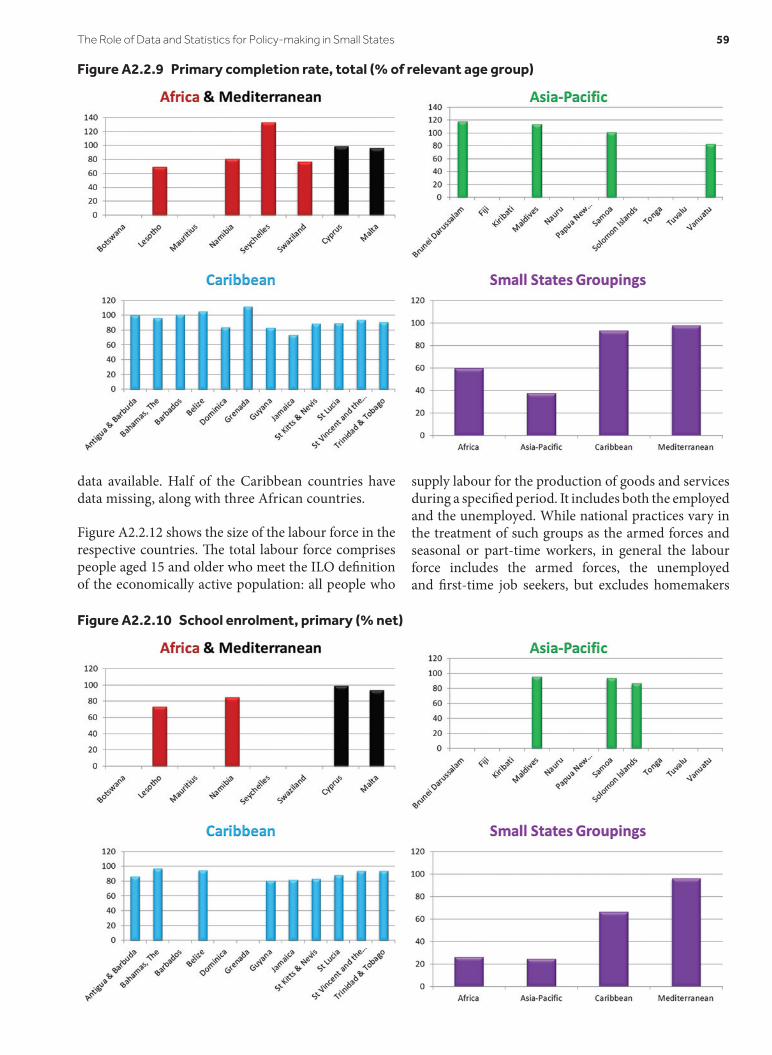
data available. Half of the Caribbean countries have data missing, along with three African countries.
Figure A2.2.12 shows the size of the labour force in the respective countries. The total labour force comprises people aged 15 and older who meet the ILO definition of the economically active population: all people who
supply labour for the production of goods and services during a specified period. It includes both the employed and the unemployed. While national practices vary in the treatment of such groups as the armed forces and seasonal or part-time workers, in general the labour force includes the armed forces, the unemployed and first-time job seekers, but excludes homemakers
Figure A2.2.9 Primary completion rate, total (% of relevant age group)
Figure A2.2.10 School enrolment, primary (% net)
The Role of Data and Statistics for Policy-making in Small States 59

and other unpaid caregivers and workers in the informal sector. The data gaps are most significant in the Caribbean region, particularly because some of the OECS countries, namely Antigua and Barbuda, Dominica, Grenada, and St Kitts and Nevis, historically have not conducted labour force surveys. Similarly, none of countries in the Asia-Pacific region (Kiribati,
Nauru and Tuvalu) or Seychelles in Africa conduct frequent labour force surveys. These are structural data gaps that will require sustained intervention.
Figure A2.2.13 shows the unemployment rate, which refers to the share of the labour force that is without work but available for and seeking employment.
Figure A2.2.11 Public expenditure (% of GDP)
Figure A2.2.12 Labour force
60 Small States: Economic Review and Basic Statistics

Definitions of ‘labour force’ and ‘unemployment’ differ by country. A significant number of countries across all three regions of Africa, Asia-Pacific and the Caribbean have missing data, which makes it impossible for any of the small states aggregates to be accurately generated. Only the Mediterranean shows on the aggregated small states chart.
Figure A2.2.14 shows the current account of the balance of payments, which is the sum of net exports of goods and services, net primary income and net secondary income. Data are in current US dollars. This variable has full coverage in three regions of Africa, the Caribbean and the Mediterranean. The Asia-Pacific has five countries (Brunei Darussalam, Kiribati, Nauru, Tonga and Tuvalu)
Figure A2.2.13 Unemployment, total (% of total labour force)
Figure A2.2.14 Current account of the balance of payments (US$ million)
The Role of Data and Statistics for Policy-making in Small States 61

with missing data for 2010. Of special note is that there is no data present on the database for Kiribati and Tuvalu. Additionally, none of the small states aggregates has any data present on the WDI database.
Figure A2.2.15 and Figure A2.2.16 show exports and imports of goods and services as a percentage of GDP.
Exports/imports of goods and services represent the value of all goods and other market services provided to/received from the rest of the world. They include the value of merchandise, freight, insurance, transport, travel, royalties, licence fees and other services, such as communication, construction, financial, information, business, personal and
Figure A2.2.15 Exports of goods and services (% of GDP)
Figure A2.2.16 Imports of goods and services (% of GDP)
62 Small States: Economic Review and Basic Statistics

government services. They exclude compensation of employees and investment income (formerly called ‘factor services’) and transfer payments. In both charts, Guyana is the only Caribbean country with missing data, while in Asia-Pacific, Kiribati, Nauru, Papua New Guinea and Tuvalu all have missing data.
Africa and the Mediterranean have full coverage, along with the small states aggregates.
Figure A2.2.17 shows trade in services as a percentage of GDP, which is the sum of service exports and imports divided by the value of GDP, all in current US dollars.
Figure A2.2.17 Trade in services (% of GDP)
Figure A2.2.18 Domestic credit to private sector (% of GDP)
The Role of Data and Statistics for Policy-making in Small States 63

Five Asia-Pacific countries now register data gaps, with all other regions having no such gaps.
Figure A2.2.18 shows domestic credit to private sector, which refers to financial resources provided to the private sector, such as through loans, purchases of non-equity securities, and trade credits and other accounts receivable that establish a claim for
repayment. For some countries, these claims include credit to public enterprises. Barbados is the only Caribbean country with no data for this variable on the WDI database for 2010. The countries in the Asia-Pacific region (Kiribati, Nauru and Tuvalu) with no data use the Australian dollar as their currency and have no monetary authority to monitor these variables.
Figure A2.2.19 New businesses registered (number)
Figure A2.2.20 Passenger cars (per 1,000 people)
64 Small States: Economic Review and Basic Statistics

Figure A2.2.19 shows the number of new businesses (limited liability corporations) registered in a calendar year. This variable clearly has a very large data gap, as only nine countries have data available and no region has complete coverage on the database. Figure A2.2.20 shows the number of passenger cars, which are road motor vehicles, other than two-wheelers, intended for the carriage of passengers and designed to seat no more than nine people (including the driver). This variable also shows that a significant data gap exists across the CSS with respect to some private sector variables.
In summary, a review of randomly selected WDI indicators is one of the simplest ways of obtaining data for this unique grouping of countries. The WDI database is available free of charge on the internet, and provides high ease of accessibility to data for multiple countries across multiple indicators simultaneously. Its coverage of indicators includes agricultural and rural development, aid effectiveness, climate change, gender, health and education, to name a few. Like the MDGs, there are areas where small states simply do not have the data and information available to accurately assess or measure their developmental progress.
The Role of Data and Statistics for Policy-making in Small States 65
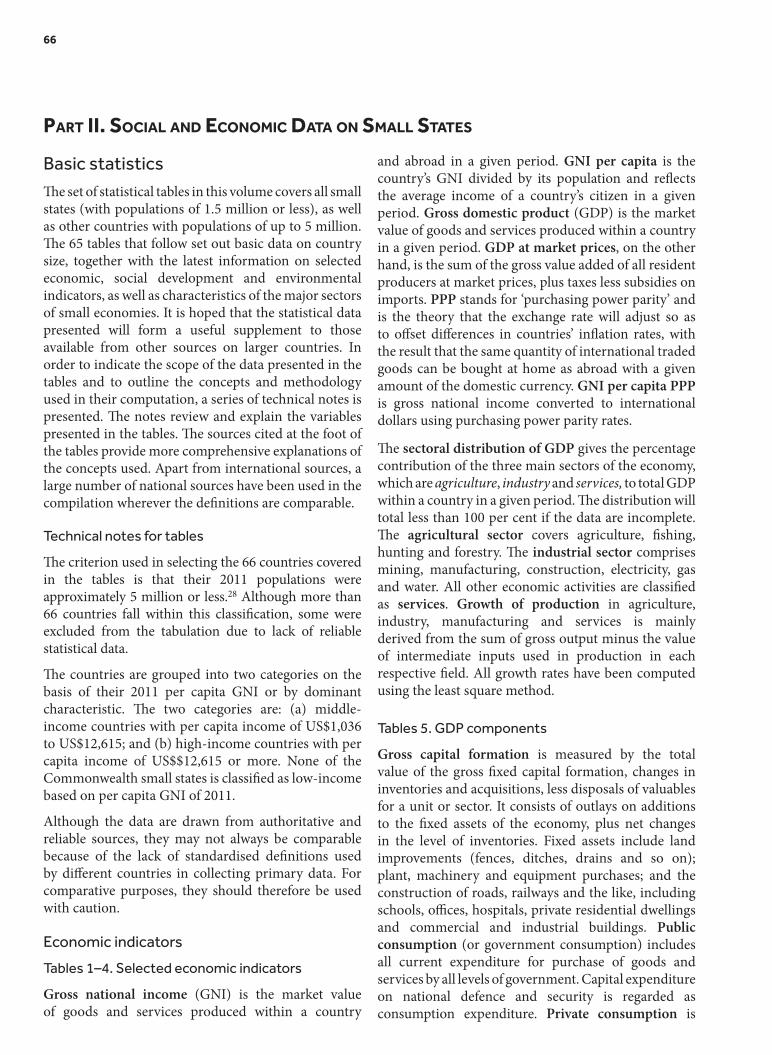
Part II. SocIal and EconomIc Data on Small States
Basic statistics
The set of statistical tables in this volume covers all small states (with populations of 1.5 million or less), as well as other countries with populations of up to 5 million. The 65 tables that follow set out basic data on country size, together with the latest information on selected economic, social development and environmental indicators, as well as characteristics of the major sectors of small economies. It is hoped that the statistical data presented will form a useful supplement to those available from other sources on larger countries. In order to indicate the scope of the data presented in the tables and to outline the concepts and methodology used in their computation, a series of technical notes is presented. The notes review and explain the variables presented in the tables. The sources cited at the foot of the tables provide more comprehensive explanations of the concepts used. Apart from international sources, a large number of national sources have been used in the compilation wherever the definitions are comparable.
Technical notes for tables
The criterion used in selecting the 66 countries covered in the tables is that their 2011 populations were approximately 5 million or less.28 Although more than 66 countries fall within this classification, some were excluded from the tabulation due to lack of reliable statistical data.
The countries are grouped into two categories on the basis of their 2011 per capita GNI or by dominant characteristic. The two categories are: (a) middle-income countries with per capita income of US$1,036 to US$12,615; and (b) high-income countries with per capita income of US$$12,615 or more. None of the Commonwealth small states is classified as low-income based on per capita GNI of 2011.
Although the data are drawn from authoritative and reliable sources, they may not always be comparable because of the lack of standardised definitions used by different countries in collecting primary data. For comparative purposes, they should therefore be used with caution.
Economic indicators
Tables 1–4. Selected economic indicators
Gross national income (GNI) is the market value of goods and services produced within a country
and abroad in a given period. GNI per capita is the country’s GNI divided by its population and reflects the average income of a country’s citizen in a given period. Gross domestic product (GDP) is the market value of goods and services produced within a country in a given period. GDP at market prices, on the other hand, is the sum of the gross value added of all resident producers at market prices, plus taxes less subsidies on imports. PPP stands for ‘purchasing power parity’ and is the theory that the exchange rate will adjust so as to offset differences in countries’ inflation rates, with the result that the same quantity of international traded goods can be bought at home as abroad with a given amount of the domestic currency. GNI per capita PPP is gross national income converted to international dollars using purchasing power parity rates.
The sectoral distribution of GDP gives the percentage contribution of the three main sectors of the economy, which are agriculture, industry and services, to total GDP within a country in a given period. The distribution will total less than 100 per cent if the data are incomplete. The agricultural sector covers agriculture, fishing, hunting and forestry. The industrial sector comprises mining, manufacturing, construction, electricity, gas and water. All other economic activities are classified as services. Growth of production in agriculture, industry, manufacturing and services is mainly derived from the sum of gross output minus the value of intermediate inputs used in production in each respective field. All growth rates have been computed using the least square method.
Tables 5. GDP components
Gross capital formation is measured by the total value of the gross fixed capital formation, changes in inventories and acquisitions, less disposals of valuables for a unit or sector. It consists of outlays on additions to the fixed assets of the economy, plus net changes in the level of inventories. Fixed assets include land improvements (fences, ditches, drains and so on); plant, machinery and equipment purchases; and the construction of roads, railways and the like, including schools, offices, hospitals, private residential dwellings and commercial and industrial buildings. Public consumption (or government consumption) includes all current expenditure for purchase of goods and services by all levels of government. Capital expenditure on national defence and security is regarded as consumption expenditure. Private consumption is
66

the market value of all goods and services purchased or received as income in kind by households and non-profit organisations within an economy. It includes imputed rent for owner-occupied dwellings. Gross savings are calculated as gross national income less total consumption, plus net transfers.
Table 6. Percentage change in the Consumer Prices Index
Percentage change in the Consumer Prices Index (CPI) has frequently been used to measure or indicate the rate of inflation in a specified period. Inflation as measured by the annual growth rate of the GDP implicit deflator shows the rate of price change in the economy as a whole. The GDP implicit deflator is the ratio of GDP in current local currency to GDP in constant local currency.
Tables 7–13. Trade statistics
Exports are the market value (free on board [FOB]) of movable goods, including non-monetary gold whose ownership changes from a resident to a foreigner. Imports are the market value (cost, insurance and freight [CIF]) of movable goods, including non-monetary gold whose ownership changes from a foreigner to a resident. The growth rates of merchandise exports and imports are in nominal terms. Trade balance is the difference between the monetary value of exports (FOB) and imports (CIF) of output in an economy over a specified period. A positive balance is referred to as a trade surplus, and it consists of more exports than imports; a negative balance is referred to as a trade deficit or a trade gap, and consists of more imports than exports. The destination of merchandise exports is the markets to which a country’s goods are exported, while the source of merchandise imports is the markets from which goods are imported.
With regard to the composition of merchandise exports, Food refers to the commodities in Standard International Trade Classification (SITC) sections 0 (food and live animals), 1 (beverages and tobacco), 4 (animal and vegetable oils and fats) and SITC division 22 (oil seeds, oil nuts and oil kernels). Fuels comprise SITC section 3 (mineral fuels). Manufactures refer to commodities in SITC sections 5 (chemicals), 6 (basic manufactures), 7 (machinery and transport equipment) and 8 (miscellaneous manufactured goods), excluding division 68 (non-ferrous metals). High-technology exports are products with high research and development (R&D) intensity, such as in aerospace, computers, pharmaceuticals, scientific instruments and electrical machinery. Agricultural raw materials comprise SITC section 2 (crude materials, except fuels) excluding divisions 22, 27 (crude fertilisers and minerals, excluding coal, petroleum and precious
stones) and 28 (metalliferous ores and scrap). Ores and metals comprise the commodities in SITC sections 27 (crude fertiliser, minerals), 28 (metalliferous ores, scrap) and 68 (non-ferrous metals).
Note: Merchandise export shares may not sum to 100 per cent because of unclassified trade.
Table 14. Export characteristics
The export characteristics comprise the concentration and diversification indices. The indices range between 0 and 1, with 1 representing the most extreme concentration and diversification of a country export.
Table 15. Selected indicators of openness and instability
Current account balance is the sum of net exports of goods and services, net primary income, and net secondary income. Export instability indices provide an indication of the relative magnitude of fluctuations in total merchandise export values, and have been calculated in the same way as coefficients of variation. This was done by dividing the mean of the total export in goods and services with the total export’s standard deviation. The indices range between 0 and 100, with 100 representing the most extreme volatility.
Table 16. Migration and remittances
Migrants’ remittances are current transfers by migrants who are employed or intend to remain employed for more than a year in another economy in which they are considered residents. Some developing countries classify workers’ remittances as a factor income receipt (and thus as a component of GNI). The World Bank adheres to international guidelines in defining GNI, and its classification of workers’ remittances may therefore differ from national practices. This item shows receipts by the reporting country. Data are in current US dollars.
Net migration refers to the number of immigrants minus the number of emigrants over a given period, expressed in thousands. It is calculated using the medium variant as an assumption.
Table 17. Fish catches
The data relate to nominal catches of freshwater, brackish water and marine species of fish, crustaceans, molluscs and other aquatic animals and plants killed, caught, trapped, collected, bred or cultivated for all commercial, industrial, recreational and subsistence purposes. The concept ‘nominal catches’ refers to the landings, and in most cases the quantity caught is converted to a live weight basis.
Social and Economic Data on Small States 67

Table 18. Energy production, consumption and trade
Data on energy refer to commercial forms of primary energy: coal and lignite, crude petroleum, natural gas and natural gas liquids, and hydro and nuclear electricity, converted to the coal equivalent. Botswana, Lesotho and Swaziland have no separate data, as they are incorporated in the South Africa Customs Union.
Table 19. Energy consumption and carbon emissions
Energy use per capita refers to use of primary energy before transformation to other end-use fuels, which is equal to indigenous production plus imports and stock changes, minus exports and fuels supplied to ships and aircraft engaged in international transport, divided by the population total.
Energy use intensity is the kilogram of oil equivalent of energy use per constant PPP GDP. PPP GDP is gross domestic product converted to 2005 constant international dollars using purchasing power parity rates. An international dollar has the same purchasing power over GDP as a US dollar has in the United States. For instance, the table indicates it would have cost $1,000 to purchase 86 kg of oil in Botswana in 2009, while the same amount would have purchased 120 kg of oil in Nauru.
Electric power consumption measures the production of power plants and combined heat and power plants less transmission, distribution and transformation losses and own-use by heat and power plants.
Carbon dioxide emissions are those stemming from the burning of fossil fuels and the manufacture of cement. They include carbon dioxide produced during consumption of solid, liquid and gas fuels and gas flaring.
Table 20. Tourist arrivals and earnings
Unless otherwise stated, the number of tourist arrivals refers to persons staying at least 24 hours or making at least one overnight stay in a country. Tourist earnings are defined as the receipts of a country from the payment of goods and services made by foreign tourists. International fare receipts are excluded. Total export earnings are defined as the total value of goods and services, including tourism.
Table 21. International reserves
International reserves consist of a country’s holdings of monetary gold, Special Drawing Rights (SDRs) and foreign exchange, as well as its reserve position in the
IMF. These data are also presented in terms of months of merchandise imports that the reserves could finance at current import levels.
Table 22. External debt: selected categories
External debt refers to debt owed to non-residents, repayable in convertible currency, goods or services, which have an original or extended maturity of over one year. Debt outstanding (disbursed only) is total outstanding debt drawn by the borrower at the end of the year. Short-term debt is debt with an original maturity of less than one year. Concessional debt must contain at least a 25 per cent grant element.
Table 23. Total net transfers on external debt
Net transfers on external debt are net flows minus interest payments during the year; negative transfers show net transfers made by the borrower to the creditor during the year. Data are in current US dollars. The total net transfers on external debt are aggregated as a percentage of gross domestic product.
Table 24. Principal indicators of debt
The principal indicators of debt comprise the external debt which is that part of the total debt in a country that is owed to creditors outside the country. The external debt is calculated in relation to the exports of goods and services (XGS). The XGS are the total value of all goods and services (including workers’ remittances) sold to the rest of the world.
Table 25. Composition of debt
The composition of debt comprises official and commercial debt. Official debt refers to loans from international organisations (multilateral loans), governments (bilateral loans) and their agencies, and autonomous public bodies. Commercial debt comprises loans from suppliers (manufacturers, exporters or other suppliers of goods), financial markets (private banks, other private financial institutions and publicly issued and privately placed bonds) and others (external liabilities on account of nationalised properties and unclassified debts).
Table 26. Foreign direct investment inflows
Foreign direct investment (FDI) is defined as a long-term investment by a foreign investor in an enterprise resident in an economy other than that in which the foreign direct investor is based. This table represents inward FDI flows. The foreign direct investment inflows have been aggregated as a percentage of gross domestic product.
68 Small States: Economic Review and Basic Statistics

Tables 27–28. Financial flows
Financial flow is defined as any and all of the transaction in the financial account of the balance of payments, most importantly international borrowing and lending and acquisition across borders of financial and real assets. All reported flows are in net terms. This refers to gross disbursements of grants and loans, minus repayments of previous loans. The net flows are separately reported from all sources and by major categories.
Table 29. Official development assistance commitments and disbursements
Official development assistance (ODA) is defined as those concessional flows to developing countries and multilateral institutions provided by official agencies, including state and local governments, or by their executive agencies. Use of IMF credit indicates any transactions in the IMF’s general account that take place outside its gold tranche.
Table 30. Aid dependency
Net bilateral aid flows from DAC donors are the net disbursements of official development assistance (ODA) or official aid from the members of the OECD’s Development Assistance Committee (DAC). Net official development assistance is disbursement flows (net of repayment of principal) that meet the DAC definition of ODA and are made to countries and territories on the DAC list of aid recipients. Net official development assistance per capita is calculated by dividing net ODA received by the mid-year population estimate.
The IDA Resource Allocation Index is based on the results of the World Bank’s annual Country Policy and Institutional Assessment (CPIA) exercise that covers the IDA-eligible countries. The CPIA rates countries against a set of 16 criteria grouped in four clusters: (a) economic management; (b) structural policies; (c) policies for social inclusion and equity; and (d) public sector management and institutions. The index is obtained by calculating the average score for each cluster and then by averaging those scores. For each of 16 criteria, countries are rated on a scale of 1 (low) to 6 (high).
GNI stands for gross national income and GCF stands for gross capital formation.
Table 31. Average exchange rates
Data refer to the period average of market exchange rates and official exchange rates for countries quoting rates in units of national currency per US dollar.
Table 32. Money supply and average national interest rates
Money supply equals the sum of currency outside banks and demand deposits other than those of the central government. In most cases the IMF’s category ‘money’ (or ‘quasi money’) is used, but where this is not available the definition M1 is used.
The interest rates refer to the rate at which the monetary authorities lend for the short- and medium-term financing needs of the private sector. These rates are normally differentiated according to creditworthiness of borrowers and objectives of financing.
Table 33. Ease of doing business
Ease of doing business ranks 189 economies, with first place being the best. A high ranking (a low numerical rank) means that the regulatory environment is more conducive to the starting and operation of a local firm. The index averages the country’s centile rankings on 10 topics covered in the World Bank’s Doing Business report. The ranking on each topic is the simple average of the centile rankings on its component indicators.
The data on Table 33 show the overall ranking and then the distance of each economy to the ‘frontier’ for each category of the index. The frontier represents the highest performance observed for each of the indicators across all economies measured in Doing Business (DB) since the inclusion of the indicator. An economy’s distance to frontier is reflected on a scale from 0 to 100, where 0 represents the lowest performance and 100 represents the frontier. For example, a score of 75 in DB 2013 means an economy was 25 percentage points away from the frontier constructed from the best performances across all economies and across time. A score of 80 in DB 2014 would then indicate the economy is improving. In this way the distance to frontier measure complements the annual ‘ease of doing business’ ranking, which compares economies with one another at a point in time. The table illustrates the performance scale on each topic that determines how easy it is to do business in any economy. A list of the subject topics is as follows:
• Starting a business: Measures the number of procedures, time and cost for a small or medium-sized limited liability company to start up and formally operate.
• Dealing with construction permits: This topic tracks the procedures, time and costs to build a warehouse – including obtaining necessary licences and permits, completing required notifications and inspections, and obtaining utility connections.
Social and Economic Data on Small States 69
• Getting electricity: This topic tracks the procedures, time and cost required for a business to obtain a permanent electricity connection for a newly constructed warehouse.
• Registering property: This topic examines the steps, time and cost involved in registering property, assuming a standardised case of an entrepreneur who wants to purchase land and a building that is already registered and free of title dispute.
• Getting credit: This topic explores two sets of issues – the strength of credit reporting systems and the effectiveness of collateral and bankruptcy laws in facilitating lending.
• Protecting investors: This topic measures the strength of minority shareholder protections against misuse of corporate assets by directors for their personal gain.
• Paying taxes: This topic addresses the taxes and mandatory contributions that a medium-sized company must pay or withhold in a given year, and measures the administrative burden in paying taxes.
• Trading across borders: Measures the time and cost (excluding tariffs) associated with exporting and importing a standardised cargo of goods by sea transport. The time and cost necessary to complete every official procedure for exporting and importing the goods are recorded; however, the time and cost for sea transport are not included. All documents needed by the trader to export or import the goods across the border are also recorded.
• Enforcing contracts: The topic assesses the efficiency of the judicial system by following the evolution of a commercial sale dispute over the quality of goods and tracking the time, cost and number of procedures involved from the moment the plaintiff files the lawsuit until payment is received.
• Resolving insolvency: This topic identifies weaknesses in existing bankruptcy law and the main procedural and administrative bottlenecks in the bankruptcy process
Table 34. Selected private sector indicators
Domestic credit to private sector refers to financial resources provided to the private sector, such as through loans, purchases of non-equity securities and trade credits, and other accounts receivable that establish a claim for repayment. For some countries, these claims include credit to public enterprises.
Interest rate spread is the interest rate charged by banks on loans to prime customers, minus the interest rate paid by commercial or similar banks for demand, time or savings deposits.
Total tax rate is the total amount of taxes payable by businesses (except for labour taxes) after accounting for deductions and exemptions as a percentage of profit. Tax revenue refers to compulsory transfers to the central government for public purposes. Certain compulsory transfers such as fines, penalties and most social security contributions are excluded. Refunds and corrections of erroneously collected tax revenue are treated as negative revenue.
Social and demographic indicators
Tables 35–36. Size and population data
Surface area is a country’s total area, including areas under inland bodies of water and some coastal waterways. Arable and permanently cropped land refers to the land being used by agricultural undertakings and farms, i.e. excluding state land reserves and areas belonging to non-agricultural undertakings. Population density is defined as the number of individuals per given unit of land (usually per square kilometre) and is derived by dividing the total population of a given area (usually a country) by its surface area. Population estimates are based on national population censuses, which vary in frequency and quality.
Table 37. Distribution of labour force
The table shows the distribution of the labour force in three different sectors, namely the agriculture, industry and service sectors. Agricultural labour force refers to those engaged in farming, forestry, hunting and fishing as a percentage of total labour force.
Table 38. Labour force participation
Total labour force comprises people aged 15 and older who meet the International Labour Organization definition of the economically active population, i.e. all people who supply labour for the production of goods and services during a specified period. Labour force participation rate is the proportion of the population aged 15 and older that is economically active. Female labour force as a percentage of the total shows the extent to which women are active in the labour force.
Employment to population ratio is the proportion of a country’s population that is employed. People aged 15–24 are generally considered the youth population. People aged 15 and older are generally considered the
70 Small States: Economic Review and Basic Statistics

working-age population. Vulnerable employment is unpaid family workers and own-account workers as a percentage of total employment. GDP per person employed is gross domestic product (GDP) divided by total employment in the economy. Purchasing power parity (PPP) GDP is GDP converted to 1990 constant. Unemployment refers to the share of the labour force that is without work but available for and seeking employment.
Table 39. Urban and rural populations
Urban population refers to the percentage of mid-year population classified as living in urban areas. These are usually defined as populated centres with certain characteristics, such as certain public and municipal services. They typically refer to centres of 2,000 people or more. Rural population is calculated as the difference between the total population and the urban population.
Table 40. Land use
Food production index shows the relative level of the aggregate volume of agricultural production for each year in comparison with the base period 2004–2006. It covers food crops that are considered edible and that contain nutrients. Coffee and tea are excluded because, although edible, they have no nutritive value.
Agriculture value added per worker is a measure of agricultural productivity. Value added in agriculture measures the output of the agricultural sector (ISIC divisions 1–5) less the value of intermediate inputs. Agriculture comprises value added from forestry, hunting and fishing, as well as cultivation of crops and livestock production. Data are in constant 2005 US dollars.
Cereal yield, measured as kilograms per hectare of harvested land, includes wheat, rice, maize, barley, oats, rye, millet, sorghum, buckwheat and mixed grains. Production data on cereals relate to crops harvested for dry grain only. Cereal crops harvested for hay or harvested green for food, feed or silage and those used for grazing are excluded. The indicator is as percentage of the country land area.
Forest area is land under natural or planted stands of trees of at least 5 metres in situ, whether productive or not, and excludes tree stands in agricultural production systems (for example, in fruit plantations and agroforestry systems) and trees in urban parks and gardens. The indicator is as percentage of the country land area.
Arable land includes land defined by the Food and Agriculture Organization (FAO) as land under
temporary crops (double-cropped areas are counted once), temporary meadows for mowing or for pasture, land under market or kitchen gardens, and land temporarily fallow. Land abandoned as a result of shifting cultivation is excluded.
Table 41. Population distribution by age
Population data have been classified into four age groups: 0–4; 5–14; 15–64; and 65+. The projections are based on assumptions of the medium variant.
Table 42. Selected demographic indicators
Crude birth rate refers to annual live births per thousand of mid-year population. Crude death rate refers to annual deaths per thousand of mid-year population. Infant mortality rate gives annual deaths of infants under one year of age per thousand live births.
Table 43. Life expectancy at birth
Life expectancy refers to average number of years of life remaining at birth.
Table 44. Adult literacy rate
Adult literacy rate refers to literate adults, able to read and write, as a percentage of total adult population aged 15 years and over. People aged 15–24 are generally considered the youth population.
Tables 45–47. Education statistics
Primary school enrolment refers to enrolment of all ages at the primary level as percentages of respective primary school age population. It includes children aged 6–11 years. For countries with universal education, enrolment may exceed 100 per cent, since some pupils are outside the age limits. Secondary education requires at least four years of approved education and provides general vocational or teacher training instructions for pupils usually of 12 to 17 years of age. For the tertiary level, the population used is the five-year age group following on from the secondary school leaving age.
Table 48. Primary education gender ratio
Ratio of girls to boys in primary and secondary education is the percentage of girls to boys enrolled at primary and secondary levels in public and private schools. Primary completion rate is the percentage of students completing the last year of primary school. It is calculated by taking the total number of students in the last grade of primary school, minus the number of
Social and Economic Data on Small States 71

repeaters in that grade, divided by the total number of children of official graduation age. The rate of primary completion could exceed 100, because it also includes pupils who completed primary school below the official graduation age.
Table 49. Selected characteristics of female population
The female population is expressed as a percentage share of the total population. Women in total labour force is expressed as the number of females in the labour force as a percentage share of the total labour force. The total fertility rate represents the number of children who would be born per woman, if the woman were to live to the end of her child-bearing years and bear children at each age in accordance with the prevailing age-specific fertility rates.
Table 50. Percentage of total government expenditure by main components
Total government expenditure covers all agencies performing central government functions. It excludes government-owned and/or controlled agencies that sell goods and services to the public, as well as government financial institutions. The table indicates the percentages of central government expenditure (or budgetary expenditure) with regard to defence and the social sectors.
Other development indicators
Table 51. Access to improved water sources
Access to an improved water source refers to the percentage of the population with reasonable access to an adequate amount of water from an improved source, such as a household connection, public standpipe, borehole, protected well or spring, or rainwater collection. Reasonable access is defined as the availability of at least 20 litres per person per day from a source within 1 kilometre of the dwelling.
Table 52. Access to improved sanitation
Access to improved sanitation facilities refers to the percentage of the population with at least adequate access to excreta disposal facilities that can effectively prevent human, animal and insect contact with excreta. Improved facilities range from simple but protected pit latrines to flush toilets with a sewerage connection.
Table 53. Human Development Index
The Human Development Index (HDI) is a composite index that measures the average achievement in a country in three basic dimensions of human
development: a long and healthy life measured by life expectancy at birth; knowledge, measured by adult literacy rates and enrolment in primary, secondary and tertiary levels; and standard of living measured by GDP per capita in PPP. A score of 1–0.8 represents ‘very high’ human development, 0.79–0.71 is ‘high’, 0.70–0.536 is ‘medium’ and scores below 0.536 represent ‘low’ human development.
Table 54. Selected characteristics of gender equality
The Gender Inequality Index (GII) reflects women’s disadvantage in three dimensions – reproductive health, empowerment and the labour market. The index shows the loss in human development due to inequality between female and male achievements in these dimensions. It ranges from 0, which indicates that women and men fare equally, to 1, which indicates that women fare as poorly as possible in all measured dimensions.
The share of women in wage employment in the non-agricultural sector is the share of women workers in wage employment in the non-agricultural sector expressed as a percentage of total wage employment in that same sector. Women in parliament is the percentage of parliamentary seats in a single or lower chamber held by women.
Table 55. Selected poverty index
The Inequality-adjusted Income Index is the Human Development Index adjusted for inequality in income distribution based on data from household surveys.
The Multi-dimensional Poverty Index (MPI) uses 10 indicators to measure three critical dimensions of poverty at the household level: education, health and living standards in 104 developing countries. These directly measure deprivations in health and educational outcomes, as well as key services such as water, sanitation and electricity. The measure reveals not only how many people are poor, but also the composition of their poverty. The MPI also reflects the intensity of poverty – the sum of weighted deprivations that each household faces at the same time. A person who is deprived in 70 per cent of the indicators is clearly worse off than someone who is deprived in 40 per cent of the indicators. Zero per cent indicates no deprivation in that indicator, while 100 per cent indicates deprivation in that indicator.
The poorest quintile’s percentage share of national income or consumption is the share that accrues to the bottom fifth (quintile) of the population. Inequality in the distribution of income is reflected in the percentage
72 Small States: Economic Review and Basic Statistics

shares of income or consumption accruing to portions of the population ranked by income or consumption levels.
The population living on less than US$1.25 a day at 2005 international prices shows the percentage of the population living below the poverty line. As a result of revisions in PPP exchange rates, poverty rates for individual countries cannot be compared with poverty rates reported in earlier editions.
The poverty gap is the mean shortfall from the poverty line (counting the non-poor as having zero shortfall), expressed as a percentage of the poverty line. This measure reflects the depth of poverty as well as its incidence. Note: Data showing as 0.5 signifies a poverty gap of less than 0.5 per cent. A theoretical value of zero implies that all the extremely poor people are exactly at the poverty line. A theoretical value of 100 per cent implies all the extremely poor people have zero income.
The proportion of the population below the minimum level of dietary energy consumption, referred to as the ‘prevalence of undernourishment’, is the percentage of the population that is undernourished or food deprived. The undernourished or food deprived are those individuals whose food intake falls below the minimum level of dietary energy requirements.
Table 56. Births delivered by skilled health personnel and maternal mortality
Percentage of births attended by skilled health personnel includes births attended by appropriately trained doctors, nurses, midwives or auxiliary nurses. Complications during pregnancy and childbirth are a leading cause of death and disability among women of reproductive age in developing countries. The maternal mortality ratio represents the risk associated with each pregnancy, i.e. the obstetric risk. This is also an MDG indicator.
Table 57. Universal access to reproductive health
Contraceptive prevalence rate is the percentage of women who are practising, or whose sexual partners are practising, any form of contraception. It is usually measured for married women aged 15–49 only. The adolescent birth rate measures the annual number of births to women 15 to 19 years of age per 1,000 women in that age group. It represents the risk of childbearing among adolescent women 15 to 19 years of age. It is also referred to as the ‘age-specific fertility rate’ for women aged 15–19.
Antenatal care coverage (at least one visit) is the percentage of women aged 15–49 with a live birth in a given time period that received antenatal care
provided by skilled health personnel (doctors, nurses or midwives) at least once during pregnancy, as a percentage of women age 15–49 years with a live birth in a given time period.
Women with unmet need for family planning are those who are fecund and sexually active but are not using any method of contraception, and report not wanting any more children or wanting to delay the next child. The concept of ‘unmet need’ points to the gap between women’s reproductive intentions and their contraceptive behaviour.
Table 58. Prevalence of underweight children
Prevalence of underweight children under 5 years is the proportion of those falling below −2 standard deviations (moderate underweight) and −3 deviations (severe underweight) from the median weight for age of the reference population.
Child immunisation measures the percentage of children aged 12–23 months who received vaccinations before 12 months or at any time before the survey. A child is considered adequately immunised against diphtheria, pertussis (or whooping cough) and tetanus (DPT) after receiving three doses of vaccine.
Table 59. Under-five mortality rate
Under-five mortality rate is the probability (expressed as a rate per 1,000 live births) of a child born in a specified year dying before reaching the age of five, if subject to current age-specific mortality rates.
Table 60. Summary statistics on HIV/AIDS
These estimates include all people with HIV infection, whether or not they have developed symptoms of AIDS. Estimated prevalence refers to the percentage of the adult population carrying the virus. Death rates refers to the estimate of the total number of people who have died from AIDS or related illness during the last year.
Condom use is the percentage of young men and women aged 15–24 reporting the use of a condom during sexual intercourse with a non-cohabiting, non-marital sexual partner in the last 12 months. The indicator is calculated by dividing the number of respondents ages 15–24 reporting use of a condom during sexual intercourse with a non-marital, non-cohabiting sexual partner in the last 12 months by the number of respondents ages 15–24 reporting sexual relations with a non-cohabitating, non-marital sexual partner in the last 12 months.
Percentage of population aged 15–24 years with comprehensive, correct knowledge of HIV/AIDS
Social and Economic Data on Small States 73

(UNICEF-WHO) is the percentage of population aged 15–24 who correctly identify the two major ways of preventing the sexual transmission of HIV (using condoms and limiting sex to one faithful, uninfected partner), who reject the two most common local misconceptions about HIV transmission, and who know that a healthy-looking person can transmit HIV. The UNICEF, Joint UN Programme on HIV/AIDS (UNAIDS) and WHO proxy for this indicator is: (a) percentage of women and men 15–24 who know that a person can protect herself from HIV infection by ‘consistent use of condom’; (b) percentage of women and men 15–24 who know a healthy-looking person can transmit HIV.
The ratio of school attendance of orphans to school attendance of non-orphans aged 10–14 measures the impact of the AIDS epidemic on orphans by looking at the ratio of the current school attendance rate of children aged 10–14 both of whose biological parents have died, to the current school attendance rate of children aged 10–14 both of whose parents are still alive and who currently live with at least one biological parent.
Proportion of population with advanced HIV infection with access to retroviral drugs is the percentage of adults and children with advanced HIV infection currently receiving antiretroviral therapy according to nationally approved treatment protocols (or WHO/Joint UN Programme on HIV/AIDS standards) among the estimated number of people with advanced HIV infection.
Table 61. Summary statistics on tuberculosis
Estimated TB deaths is an estimate of the total number of deaths related to TB within a given country. Incidence of tuberculosis refers to the estimated number of TB cases arising in a given time period (expressed here as rate per 100,000 population/year). All forms of TB are included, including cases in people with HIV.
Tuberculosis treatment success rate under directly observed treatment short course (DOTS) is the proportion of new smear-positive TB cases registered under DOTS in a given year that successfully completed treatment, whether with bacteriologic evidence of success (‘cured’) or without (‘treatment completed’). At the end of treatment, each patient is assigned one of the following six mutually exclusive treatment outcomes: cured; completed; died; failed; defaulted; and transferred out with outcome unknown. The proportions of cases assigned to these outcomes, plus any additional cases registered for treatment but not assigned to an outcome, add up to 100 per cent of cases registered.
Table 62. Environment
Carbon dioxide emissions are those stemming from the burning of fossil fuels and the manufacture of cement. They account for the largest share of greenhouse gases, which are associated with global warming. Forest change rate relates to the number of hectares of forest lost or gained and the percentage change. Threatened species are the number of species classified by the International Union for Conservation of Nature (IUCN) as endangered, vulnerable, rare, indeterminate, out of danger or insufficiently known.
Consumption of ozone depleting substances is used to monitor the reduction in the usage of ozone depleting substances (ODSs) as a result of the Montreal Protocol. Therefore the indicator covers only ODSs controlled under the Montreal Protocol. Reducing consumption ultimately leads to reductions in emissions, since most uses of ODSs finally lead to the substances being emitted into the atmosphere. The units of measurement are metric tonnes of ODSs weighted by their ozone depletion potential (ODP), otherwise referred to as ‘ODP tonnes’.
Proportion of total renewable water resources used is the total volume of groundwater and surface water withdrawn from their sources for human use (in the agricultural, domestic and industrial sectors), expressed as a percentage of the total volume of water available annually through the hydrological cycle (total actual renewable water resources). The terms ‘water resources’ and ‘water withdrawal’ are understood to be freshwater resources and freshwater withdrawal.
Proportion of terrestrial and marine areas protected to territorial area. The units of measure in this indicator are terrestrial protected areas, as well as marine protected areas in territorial waters (up to 12 nautical miles from the coast). The International Union for Conservation of Nature (IUCN) defines a protected area as ‘a clearly defined geographical space, recognized, dedicated and managed, through legal or other effective means, to achieve the long-term conservation of nature with associated ecosystem services and cultural values’29.
Table 63. Main indicators of internet communications
Internet users is based on nationally reported data. In some cases, surveys have been carried out that give a more precise figure for the number of internet users. The reported figure for internet users – which may refer only to users above a certain age – is divided by the total population to obtain users per 1,000 inhabitants. Secure servers are servers using encryption technology
74 Small States: Economic Review and Basic Statistics

in internet transactions. Fixed broadband internet subscribers are the number of broadband subscribers with a digital subscriber line, cable modem or other high-speed technology.
Table 64. Main indicators of telephone communications
Mobile cellular subscriptions refers to users of portable telephones subscribing to an automatic public mobile telephone service using cellular technology that provides access to the public switched telephone network (PSTN). Per 100 inhabitants is obtained by dividing the number of cellular subscribers by the population and multiplying by 100.
Population covered by mobile cellular network measures the percentage of inhabitants that are within range of a mobile cellular signal, irrespective of whether or not they are subscribers. This is calculated by dividing the number of inhabitants within range of a mobile cellular signal by the total population. Note that this is not the same as the mobile subscription density or penetration.
Mobile cellular tariff is based on the Organisation for Economic Co-operation and Development’s low-user definition, which includes the cost of monthly mobile use for 25 outgoing calls per month, spread over the same mobile network, other mobile networks and mobile to fixed-line calls and during peak, off-peak and weekend times, as well as 30 text messages per month.
Telephone lines per 100 population refers to a fixed telephone line which connects the subscriber’s terminal equipment to the public switched network and has a dedicated port in the telephone exchange equipment.
Table 65. Transport
Total road network includes motorways, highways, and main or national roads, secondary or regional roads, and all other roads in a country. A motorway is a road designed and built for motor traffic that separates the traffic flowing in opposite directions. Registered carrier departures worldwide are domestic take-offs and take-offs abroad for air carriers registered in the country.
The Liner Shipping Connectivity Index captures how well countries are connected to global shipping networks. It is computed by the United Nations Conference on Trade and Development (UNCTAD) based on five components of the maritime transport sector: number of ships; their container-carrying capacity; maximum vessel size; number of services; and number of companies that deploy container ships in a country’s ports. For each component, a country’s value is divided by the maximum value of each component in 2004, the five components are averaged for each country, and the average is divided by the maximum average for 2004 and multiplied by 100. The index generates a value of 100 for the country with the highest average index in 2004. The underlying data come from Containerisation International Online.
Social and Economic Data on Small States 75

Tabl
e 1.
Gro
ss n
atio
nal i
ncom
e (G
NI)
at
mar
ket
pric
es
Gro
up/c
ount
ryG
NI a
t cu
rren
t pr
ices
(U
S$
mill
ion)
GN
I per
cap
ita,
Atl
as m
etho
d (c
urre
nt U
S$)
Tota
l GN
I PPP
(cur
rent
in
tern
atio
nal U
S$)
GN
I per
cap
ita
PPP
(cur
rent
in
tern
atio
nal U
S$
mill
ion)
2009
2010
2011
2012
2009
2010
2011
2012
2009
2010
2011
2012
2009
2010
2011
2012
Mid
dle-
inco
me
Com
mon
wea
lth c
ount
ries
Bel
ize
1,24
11,
240
1,32
2–
4,23
04,
060
4,18
0–
2,01
82,
028
2,17
5–
6,70
06,
570
6,88
0–
Bo
tsw
ana
10,0
7713
,690
15,8
1114
,020
5,39
05,
990
7,07
07,
720
25,8
2627
,990
30,8
9133
,114
13,2
3014
,210
15,5
5016
,520
Do
min
ica
469
465
466
463
6,42
06,
570
6,70
06,
460
825
854
879
874
11,6
2011
,990
12,3
0012
,190
Fiji
2,87
13,
072
3,69
93,
830
3,90
03,
610
3,72
04,
200
3,90
83,
842
4,00
64,
265
4,58
04,
460
4,62
04,
880
Gre
nada
708
730
749
751
6,81
07,
050
7,19
07,
110
992
1,03
41,
079
1,08
79,
510
9,88
010
,270
10,3
00G
uyan
a2,
009
2,27
22,
567
2,84
92,
540
2,78
03,
050
3,41
02,
194
2,35
32,
511
2,70
32,
810
2,99
03,
170
3,40
0Ja
mai
ca11
,405
12,7
0913
,890
14,4
064,
510
4,57
04,
760
5,14
0–
––
––
––
–K
iriba
ti16
821
323
624
11,
820
2,04
02,
060
2,26
030
834
333
434
03,
200
3,51
03,
370
3,38
0Le
soth
o2,
116
2,62
22,
857
2,75
21,
090
1,17
01,
250
1,38
04,
028
4,25
04,
282
4,52
82,
020
2,12
02,
110
2,21
0M
aldi
ves
1,71
21,
823
1,83
31,
883
5,05
05,
490
5,80
05,
750
2,11
02,
266
2,46
82,
602
6,60
06,
960
7,43
07,
690
Mau
ritiu
s8,
793
9,83
511
,325
10,6
047,
260
7,95
08,
230
8,57
016
,470
18,2
7519
,279
20,4
2512
,920
14,2
7014
,990
15,8
20N
amib
ia8,
644
10,7
0012
,600
12,7
784,
150
4,43
05,
170
5,67
013
,347
14,2
4615
,896
16,8
806,
230
6,54
07,
170
7,47
0N
auru
––
––
––
––
––
––
––
––
Pap
ua N
ew G
uine
a7,
855
9,26
212
,003
15,0
241,
190
1,30
01,
480
1,79
015
,304
16,4
9018
,196
19,9
352,
280
2,40
02,
590
2,78
0St
Luc
ia1,
122
1,16
01,
195
1,17
26,
630
6,51
06,
720
6,53
01,
857
1,89
72,
005
1,99
310
,600
10,6
9011
,180
11,0
20St
Vin
cent
and
the
Gre
nadi
nes
661
669
678
701
6,26
06,
030
6,10
06,
380
1,14
11,
119
1,13
51,
182
10,4
5010
,240
10,3
8010
,810
Sam
oa
474
554
608
640
2,68
02,
840
2,97
03,
220
735
766
789
807
3,98
04,
120
4,21
04,
270
Seyc
helle
s80
192
61,
009
985
10,4
1010
,390
11,1
4011
,640
1,82
81,
998
2,14
32,
261
20,9
4022
,250
24,5
0025
,760
Solo
mo
n Is
land
s47
355
567
369
997
01,
050
1,12
01,
130
1,05
31,
186
1,25
51,
192
2,05
02,
250
2,33
02,
170
Swaz
iland
3,08
53,
465
3,71
83,
456
2,67
02,
650
2,83
02,
860
5,91
25,
870
6,00
05,
958
5,04
04,
920
4,95
04,
840
Tong
a32
537
343
948
23,
330
3,47
03,
800
4,24
046
848
252
354
04,
510
4,63
05,
000
5,14
0Tu
valu
4951
5561
––
––
––
––
––
––
Van
uatu
587
679
766
767
2,59
02,
700
2,87
03,
080
981
1,01
81,
060
1,11
24,
250
4,31
04,
390
4,50
0O
ther
cou
ntrie
sA
lban
ia12
,009
11,7
5912
,893
13,0
514,
030
4,04
04,
050
4,09
027
,127
27,4
2528
,368
29,7
058,
610
8,71
08,
990
9,39
0A
rmen
ia8,
815
9,59
910
,693
10,4
313,
180
3,33
03,
490
3,72
016
,568
17,4
3218
,974
20,7
665,
580
5,88
06,
400
6,99
0B
huta
n1,
219
1,49
71,
729
1,67
51,
850
1,99
02,
210
2,42
03,
410
3,78
14,
183
4,67
84,
840
5,27
05,
730
6,31
0B
osn
ia a
nd
Her
zego
vina
17,6
6117
,054
18,4
7017
,323
4,66
04,
640
4,69
04,
650
33,2
7533
,263
34,7
7535
,980
8,64
08,
650
9,06
09,
380
Cap
e V
erde
1,55
71,
586
1,84
61,
858
3,22
03,
340
3,61
03,
810
1,74
51,
828
1,99
22,
144
3,59
03,
750
4,06
04,
340
(con
tinue
d)
76

Tabl
e 1.
Gro
ss n
atio
nal i
ncom
e (G
NI)
at
mar
ket
pric
es (c
onti
nued
)
Gro
up/c
ount
ryG
NI a
t cu
rren
t pr
ices
(U
S$
mill
ion)
GN
I per
cap
ita,
Atl
as m
etho
d (c
urre
nt U
S$)
Tota
l GN
I PPP
(cur
rent
in
tern
atio
nal U
S$)
GN
I per
cap
ita
PPP
(cur
rent
in
tern
atio
nal U
S$
mill
ion)
2009
2010
2011
2012
2009
2010
2011
2012
2009
2010
2011
2012
2009
2010
2011
2012
Co
ngo,
Rep
ublic
of
6,97
99,
024
10,7
1310
,832
1,95
02,
210
2,20
02,
550
11,2
9112
,855
13,4
1715
,202
2,83
03,
130
3,18
03,
510
Co
sta
Ric
a28
,489
35,3
1740
,050
43,8
866,
180
6,86
07,
660
8,74
049
,400
52,7
2556
,413
60,4
8610
,740
11,2
9011
,910
12,5
90D
jibo
uti
––
––
––
––
––
––
––
––
Gab
on
11,0
6812
,732
16,2
9816
,577
7,88
08,
220
8,71
010
,070
18,7
5619
,376
20,9
7123
,328
12,3
5012
,450
13,1
6014
,290
Geo
rgia
10,6
7911
,416
14,0
1215
,723
2,54
02,
680
2,85
03,
280
20,6
9522
,037
23,8
2126
,448
4,69
04,
950
5,31
05,
860
Lao
PD
R5,
668
6,71
37,
741
8,67
688
098
01,
110
1,26
014
,062
14,8
7816
,523
18,1
412,
240
2,33
02,
530
2,73
0Le
bano
n34
,423
36,6
1539
,916
42,3
227,
760
8,36
08,
930
9,19
054
,245
58,3
9662
,006
63,7
0912
,770
13,4
5014
,150
14,4
00M
aced
oni
a, F
YR9,
231
9,21
510
,266
9,54
54,
450
4,58
04,
710
4,69
022
,734
23,0
3123
,464
24,3
5410
,820
10,9
6011
,150
11,5
70M
aurit
ania
3,07
93,
603
4,09
04,
066
1,00
098
098
01,
110
8,07
58,
296
8,59
19,
570
2,30
02,
300
2,32
02,
520
Mo
ldo
va5,
742
6,29
77,
580
7,82
01,
570
1,82
01,
980
2,07
010
,743
11,9
6512
,968
13,1
383,
010
3,36
03,
640
3,69
0M
ong
olia
4,38
85,
640
7,91
89,
592
1,79
01,
900
2,34
03,
160
9,83
510
,073
12,0
1114
,265
3,68
03,
710
4,36
05,
100
Mo
nten
egro
4,36
83,
959
4,29
04,
150
7,03
06,
670
6,81
06,
940
8,48
27,
884
8,09
38,
654
13,6
9012
,720
13,0
4013
,930
Pan
ama
25,6
1228
,902
33,1
7038
,908
7,10
07,
710
8,61
09,
910
47,9
5152
,627
59,0
6767
,804
13,2
6014
,310
15,7
9017
,830
São
To
mé
and
Prín
cipe
196
201
248
264
1,08
01,
140
1,24
01,
320
288
305
327
349
1,66
01,
710
1,78
01,
850
Surin
ame
3,88
14,
265
4,04
24,
544
7,00
07,
630
7,83
08,
480
3,93
04,
045
4,15
84,
541
7,55
07,
700
7,85
08,
500
Tim
or-
Lest
e2,
598
3,16
74,
216
4,85
22,
250
2,73
03,
340
3,67
04,
885
5,95
07,
189
7,76
14,
400
5,21
06,
110
6,41
0H
igh-
inco
me
Com
mon
wea
lth c
ount
ries
Ant
igua
and
B
arbu
da1,
156
1,10
41,
081
1,13
513
,420
12,6
2012
,210
12,6
401,
741
1,66
31,
631
1,71
520
,170
19,0
6018
,500
19,2
60
Bah
amas
, The
7,57
77,
564
7,59
9–
22,0
3021
,320
21,2
80–
10,2
9110
,424
10,8
95–
29,0
3028
,920
29,7
40–
Bar
bado
s3,
517
––
–12
,380
––
–5,
133
––
–18
,400
––
–B
rune
i Dar
ussa
lam
10,7
85–
––
31,5
90–
––
19,4
72–
––
49,3
70–
––
Cyp
rus
23,1
1922
,539
25,0
9722
,079
29,7
1028
,570
28,7
5026
,000
24,7
4924
,890
26,3
9325
,671
30,9
4030
,010
31,0
2029
,400
Mal
ta7,
411
7,49
38,
626
8,11
318
,220
18,6
2019
,780
19,7
609,
697
10,1
8411
,097
11,2
9123
,420
24,4
8026
,630
26,9
90St
Kitt
s an
d N
evis
676
686
719
717
13,1
0013
,110
13,4
7013
,330
861
881
917
926
16,6
5016
,830
17,3
1017
,280
Trin
idad
and
To
bago
18,2
3519
,603
21,9
5920
,162
16,2
6015
,740
14,6
6014
,400
32,2
3732
,759
32,1
3529
,957
24,3
8024
,670
24,1
1022
,400
Oth
er c
ount
ries
Bah
rain
16,9
1920
,572
––
15,5
9016
,050
––
24,7
2226
,802
––
20,7
5021
,420
––
Cro
atia
60,2
3056
,813
59,5
6154
,326
13,7
0013
,550
13,8
3013
,290
82,1
0479
,066
81,7
6884
,326
18,5
4017
,900
19,1
0019
,760
Equa
toria
l Gui
nea
7,16
66,
785
10,6
5211
,051
12,9
609,
840
11,6
7013
,560
13,7
4910
,953
13,4
4713
,901
20,3
1015
,730
18,7
8018
,880
(con
tinue
d)
77

Tabl
e 1.
Gro
ss n
atio
nal i
ncom
e (G
NI)
at
mar
ket
pric
es (c
onti
nued
)
Gro
up/c
ount
ryG
NI a
t cu
rren
t pr
ices
(U
S$
mill
ion)
GN
I per
cap
ita,
Atl
as m
etho
d (c
urre
nt U
S$)
Tota
l GN
I PPP
(cur
rent
in
tern
atio
nal U
S$)
GN
I per
cap
ita
PPP
(cur
rent
in
tern
atio
nal U
S$
mill
ion)
2009
2010
2011
2012
2009
2010
2011
2012
2009
2010
2011
2012
2009
2010
2011
2012
Esto
nia
18,5
1117
,794
21,0
0020
,877
14,2
6014
,150
15,2
6015
,830
25,2
6725
,424
27,9
3729
,460
18,8
5018
,970
20,8
5021
,990
Icel
and
9,75
410
,360
12,0
8312
,208
39,2
3033
,900
35,2
6038
,710
9,59
59,
307
10,0
2610
,741
30,1
3029
,260
31,4
3033
,550
Irela
nd18
6,53
817
2,74
717
8,19
917
3,09
645
,400
42,3
8038
,960
38,9
7014
9,69
315
3,95
715
3,39
016
1,11
033
,570
34,4
1033
,510
35,1
10K
uwai
t11
2,83
913
2,16
6–
–45
,480
44,7
30–
–14
0,88
614
7,28
7–
–49
,430
49,2
30–
–La
tvia
27,8
5124
,517
28,6
3228
,388
12,3
9011
,850
13,3
3014
,180
38,6
5636
,451
39,5
2742
,567
17,1
4016
,280
19,2
0021
,020
Lith
uani
a37
,817
36,0
1341
,289
40,9
3011
,700
11,6
2012
,940
13,8
5058
,087
59,0
7662
,900
67,9
3817
,390
17,9
7020
,760
22,7
60Lu
xem
bour
g33
,017
35,8
9542
,741
40,7
4568
,770
71,8
6077
,380
76,9
6026
,059
29,3
7633
,224
33,4
8252
,350
57,9
5064
,100
63,0
00N
orw
ay38
0,99
142
6,19
649
3,81
250
9,71
186
,130
86,8
5088
,500
98,8
6026
6,02
828
4,20
230
4,05
932
1,35
155
,090
58,1
3061
,390
64,0
30O
man
43,8
4754
,687
––
18,5
0019
,120
––
67,3
2671
,696
––
25,2
8025
,580
––
Qat
ar97
,135
125,
699
169,
302
–71
,260
73,4
4078
,720
–11
4,77
713
4,50
016
1,78
9–
73,3
8076
,870
84,6
70–
Slo
veni
a48
,060
46,2
1749
,583
44,9
0023
,750
23,9
1023
,780
22,7
1053
,382
53,5
0555
,359
54,4
7026
,170
26,1
2026
,970
26,4
70
Not
e: –
= n
ot a
vaila
ble
Sou
rce:
Wo
rld B
ank,
Wor
ld D
evel
opm
ent I
ndic
ator
s 20
13, a
vaila
ble
at: h
ttp:
//da
taba
nk.w
orld
bank
.org
(acc
esse
d M
ay 2
013)
78
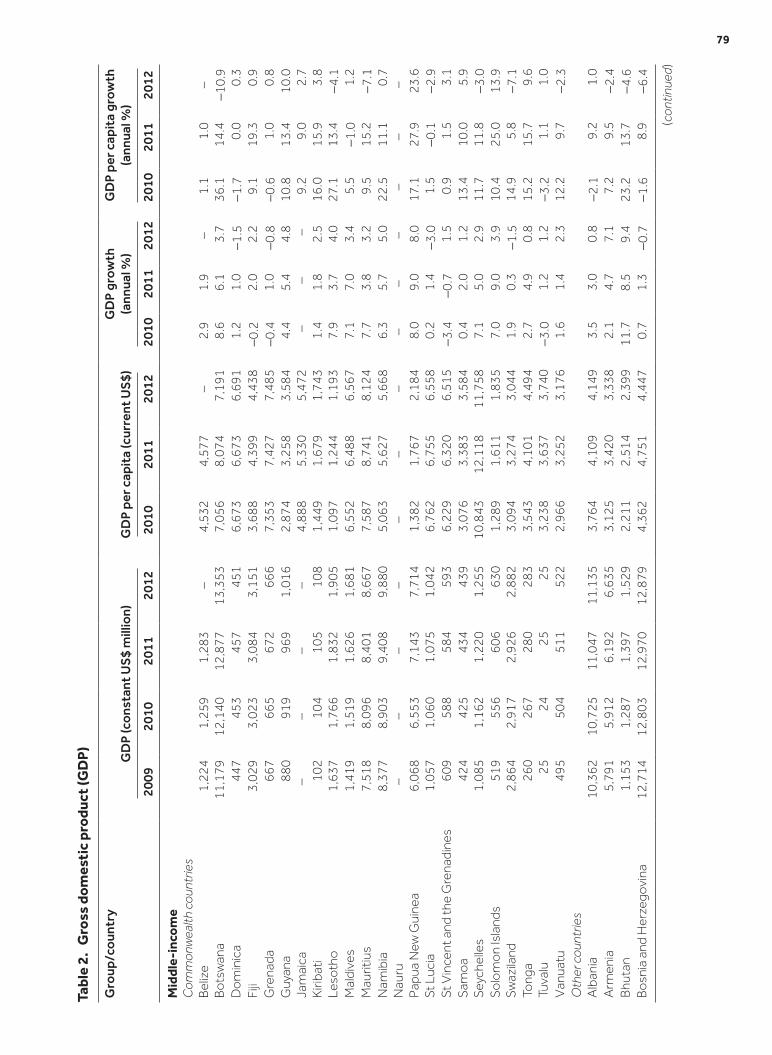
Tabl
e 2.
Gro
ss d
omes
tic
prod
uct
(GD
P)
Gro
up/c
ount
ryG
DP
(con
stan
t U
S$
mill
ion)
GD
P pe
r cap
ita
(cur
rent
US
$)G
DP
grow
th
(ann
ual %
)G
DP
per c
apit
a gr
owth
(a
nnua
l %)
2009
2010
2011
2012
2010
2011
2012
2010
2011
2012
2010
2011
2012
Mid
dle-
inco
me
Com
mon
wea
lth c
ount
ries
Bel
ize
1,22
41,
259
1,28
3–
4,53
24,
577
–2.
91.
9–
1.1
1.0
–B
ots
wan
a11
,179
12,1
4012
,877
13,3
537,
056
8,07
47,
191
8.6
6.1
3.7
36.1
14.4
−10.
9D
om
inic
a44
745
345
745
16,
673
6,67
36,
691
1.2
1.0
−1.5
−1.7
0.0
0.3
Fiji
3,02
93,
023
3,08
43,
151
3,68
84,
399
4,43
8−0
.22.
02.
29.
119
.30.
9G
rena
da66
766
567
266
67,
353
7,42
77,
485
−0.4
1.0
−0.8
−0.6
1.0
0.8
Guy
ana
880
919
969
1,01
62,
874
3,25
83,
584
4.4
5.4
4.8
10.8
13.4
10.0
Jam
aica
––
––
4,88
85,
330
5,47
2–
––
9.2
9.0
2.7
Kiri
bati
102
104
105
108
1,44
91,
679
1,74
31.
41.
82.
516
.015
.93.
8Le
soth
o1,
637
1,76
61,
832
1,90
51,
097
1,24
41,
193
7.9
3.7
4.0
27.1
13.4
−4.1
Mal
dive
s1,
419
1,51
91,
626
1,68
16,
552
6,48
86,
567
7.1
7.0
3.4
5.5
−1.0
1.2
Mau
ritiu
s7,
518
8,09
68,
401
8,66
77,
587
8,74
18,
124
7.7
3.8
3.2
9.5
15.2
−7.1
Nam
ibia
8,37
78,
903
9,40
89,
880
5,06
35,
627
5,66
86.
35.
75.
022
.511
.10.
7N
auru
––
––
––
––
––
––
–P
apua
New
Gui
nea
6,06
86,
553
7,14
37,
714
1,38
21,
767
2,18
48.
09.
08.
017
.127
.923
.6St
Luc
ia1,
057
1,06
01,
075
1,04
26,
762
6,75
56,
558
0.2
1.4
−3.0
1.5
−0.1
−2.9
St V
ince
nt a
nd th
e G
rena
dine
s60
958
858
459
36,
229
6,32
06,
515
−3.4
−0.7
1.5
0.9
1.5
3.1
Sam
oa
424
425
434
439
3,07
63,
383
3,58
40.
42.
01.
213
.410
.05.
9Se
yche
lles
1,08
51,
162
1,22
01,
255
10,8
4312
,118
11,7
587.
15.
02.
911
.711
.8−3
.0So
lom
on
Isla
nds
519
556
606
630
1,28
91,
611
1,83
57.
09.
03.
910
.425
.013
.9Sw
azila
nd2,
864
2,91
72,
926
2,88
23,
094
3,27
43,
044
1.9
0.3
−1.5
14.9
5.8
−7.1
Tong
a26
026
728
028
33,
543
4,10
14,
494
2.7
4.9
0.8
15.2
15.7
9.6
Tuva
lu25
2425
253,
238
3,63
73,
740
−3.0
1.2
1.2
−3.2
1.1
1.0
Van
uatu
495
504
511
522
2,96
63,
252
3,17
61.
61.
42.
312
.29.
7−2
.3O
ther
cou
ntrie
sA
lban
ia10
,362
10,7
2511
,047
11,1
353,
764
4,10
94,
149
3.5
3.0
0.8
−2.1
9.2
1.0
Arm
enia
5,79
15,
912
6,19
26,
635
3,12
53,
420
3,33
82.
14.
77.
17.
29.
5−2
.4B
huta
n1,
153
1,28
71,
397
1,52
92,
211
2,51
42,
399
11.7
8.5
9.4
23.2
13.7
−4.6
Bo
snia
and
Her
zego
vina
12,7
1412
,803
12,9
7012
,879
4,36
24,
751
4,44
70.
71.
3−0
.7−1
.68.
9−6
.4
(con
tinue
d)
79

(con
tinue
d)
Tabl
e 2.
Gro
ss d
omes
tic
prod
uct
(GD
P) (c
onti
nued
)
Gro
up/c
ount
ryG
DP
(con
stan
t U
S$
mill
ion)
GD
P pe
r cap
ita
(cur
rent
US
$)G
DP
grow
th
(ann
ual %
)G
DP
per c
apit
a gr
owth
(a
nnua
l %)
2009
2010
2011
2012
2010
2011
2012
2010
2011
2012
2010
2011
2012
Cap
e V
erde
1,28
11,
348
1,41
61,
477
3,40
23,
875
3,83
85.
25.
04.
33.
213
.9−1
.0C
ong
o, R
epub
lic o
f7,
221
7,85
38,
121
8,43
02,
920
3,41
43,
154
8.8
3.4
3.8
21.6
16.9
−7.6
Co
sta
Ric
a23
,838
25,0
2126
,131
27,4
727,
773
8,66
19,
391
5.0
4.4
5.1
21.7
11.4
8.4
Djib
out
i–
––
–1,
353
1,46
4–
––
–6.
08.
2–
Gab
on
9,07
69,
685
10,3
6310
,995
9,34
311
,789
11,4
306.
77.
06.
117
.526
.2−3
.0G
eorg
ia7,
756
8,24
18,
814
9,34
32,
614
3,22
03,
508
6.3
7.0
6.0
7.1
23.2
9.0
Lao
PD
R3,
706
4,02
24,
345
4,70
01,
123
1,26
21,
399
8.5
8.0
8.2
20.7
12.4
10.9
Leba
non
28,0
3029
,992
30,8
9231
,324
8,55
29,
148
9,70
57.
03.
01.
44.
87.
06.
1M
aced
oni
a, F
YR6,
939
7,14
07,
343
7,32
34,
442
4,96
24,
589
2.9
2.8
−0.3
0.2
11.7
−7.5
Mau
ritan
ia2,
698
2,83
52,
947
3,17
01,
017
1,15
41,
106
5.1
4.0
7.6
18.2
13.5
−4.2
Mo
ldo
va3,
269
3,57
74,
244
4,51
41,
632
1,97
02,
038
9.4
18.6
6.4
6.9
20.8
3.4
Mo
ngo
lia3,
247
3,45
44,
059
4,55
72,
286
3,18
13,
673
6.4
17.5
12.3
33.2
39.2
15.5
Mo
nten
egro
2,73
52,
804
2,89
42,
908
6,63
67,
253
6,81
32.
53.
20.
5−1
.19.
3−6
.1P
anam
a21
,519
23,1
5625
,611
28,3
677,
355
8,37
39,
534
7.6
10.6
10.8
10.1
13.8
13.9
São
To
mé
and
Prín
cipe
139
145
152
158
1,12
81,
355
1,40
24.
54.
94.
0−0
.520
.23.
4Su
rinam
e2,
100
2,18
72,
289
2,39
28,
319
8,12
58,
864
4.1
4.7
4.5
11.7
−2.3
9.1
Tim
or-
Lest
e63
569
577
083
676
692
81,
068
9.5
10.8
8.6
7.9
21.1
15.1
Hig
h-in
com
eC
omm
onw
ealth
cou
ntrie
sA
ntig
ua a
nd B
arbu
da1,
091
1,01
398
41,
007
13,0
1712
,757
13,2
07−7
.1−2
.82.
3−6
.9−2
.03.
5B
aham
as, T
he7,
501
7,57
57,
701
7,84
221
,881
21,4
9021
,908
1.0
1.7
1.8
−0.8
−1.8
1.9
Bar
bado
s4,
023
4,03
34,
064
4,06
414
,656
13,0
76–
0.3
0.8
0.0
13.7
−10.
8–
Bru
nei D
arus
sala
m9,
600
9,85
010
,067
10,2
8430
,880
40,2
4441
,127
2.6
2.2
2.2
13.5
30.3
2.2
Cyp
rus
18,9
6119
,207
19,3
0318
,840
27,8
8929
,372
26,3
151.
30.
5−2
.4−5
.25.
3−1
0.4
Mal
ta6,
477
6,65
36,
773
6,84
019
,625
21,9
6420
,848
2.7
1.8
1.0
0.3
11.9
−5.1
St K
itts
and
Nev
is57
457
558
557
913
,667
14,1
2213
,969
0.2
1.7
−1.1
−0.4
3.3
−1.1
Trin
idad
and
To
bago
18,9
4918
,989
18,4
9918
,730
15,5
7317
,627
17,9
340.
2−2
.61.
27.
013
.21.
7
80

Tabl
e 2.
Gro
ss d
omes
tic
prod
uct
(GD
P) (c
onti
nued
)
Gro
up/c
ount
ryG
DP
(con
stan
t U
S$
mill
ion)
GD
P pe
r cap
ita
(cur
rent
US
$)G
DP
grow
th
(ann
ual %
)G
DP
per c
apit
a gr
owth
(a
nnua
l %)
2009
2010
2011
2012
2010
2011
2012
2010
2011
2012
2010
2011
2012
Oth
er c
ount
ries
Bah
rain
17,0
5317
,792
18,1
6618
,784
18,3
34–
–4.
32.
13.
413
.1–
–C
roat
ia46
,939
46,2
7946
,273
45,3
4813
,327
14,4
3513
,227
−1.4
0.0
−2.0
−5.2
8.3
−8.4
Equa
toria
l Gui
nea
9,88
79,
719
10,1
9910
,454
17,6
1323
,473
24,0
36−1
.74.
92.
515
.133
.32.
4Es
toni
a13
,554
14,0
0515
,165
15,6
5414
,062
16,5
3416
,316
3.3
8.3
3.2
−1.4
17.6
−1.3
Icel
and
17,0
8816
,388
16,8
6117
,138
39,5
0644
,120
42,6
58−4
.12.
91.
63.
911
.7−3
.3Ire
land
208,
558
206,
960
209,
921
211,
890
46,0
1948
,249
45,8
36−0
.81.
40.
9−8
.44.
8−5
.0K
uwai
t88
,330
86,2
3691
,672
–41
,566
56,5
14–
−2.4
6.3
–11
.936
.0–
Latv
ia15
,556
15,3
0716
,138
17,0
4410
,723
13,8
3814
,009
−1.6
5.4
5.6
−6.6
29.0
1.2
Lith
uani
a26
,988
27,3
9029
,023
30,0
6211
,046
14,1
4814
,150
1.5
6.0
3.6
0.1
28.1
0.0
Luxe
mbo
urg
40,0
9041
,259
41,9
4242
,073
103,
574
114,
211
107,
476
2.9
1.7
0.3
3.0
10.3
−5.9
No
rway
314,
294
315,
797
319,
643
329,
524
86,1
5699
,143
99,5
580.
51.
23.
19.
815
.10.
4O
man
39,7
1141
,930
42,0
52–
20,6
4023
,731
–5.
60.
3–
17.3
15.0
–Q
atar
79,4
0392
,688
104,
702
111,
239
72,7
7390
,524
–16
.713
.06.
216
.624
.4–
Slo
veni
a38
,503
38,9
8839
,264
38,2
6522
,898
24,4
9322
,092
1.3
0.7
−2.5
−4.8
7.0
−9.8
Not
e: –
= n
ot a
vaila
ble
Sou
rce:
Wo
rld B
ank,
Wor
ld D
evel
opm
ent I
ndic
ator
s 20
13, v
ario
us is
sues
, bas
ed o
n m
arke
t pric
es, a
vaila
ble
at: h
ttp:
//da
taba
nk.w
orld
bank
.org
(acc
esse
d N
ove
mbe
r 201
3)
81

Table 3. Sectoral distribution of gross domestic product (% total of GDP)
Group/country Agriculture Industry Services
2008 2009 2010 2011 2008 2009 2010 2011 2008 2009 2010 2011
Middle-incomeCommonwealth countriesBelize 12 – – – 23 – – – 65 – – –Botswana 2 3 2 3 53 40 45 46 45 57 52 52Dominica 14 14 13 14 16 14 15 15 69 72 72 71Fiji 14 13 12 13 18 18 19 19 68 69 69 68Grenada 4 5 5 5 20 17 17 17 75 78 78 78Guyana 26 24 21 21 31 31 33 34 43 45 46 45Jamaica 6 6 6 7 23 21 21 22 72 73 73 72Kiribati 26 26 25 – 9 8 8 – 66 66 67 –Lesotho 8 8 9 8 37 33 32 34 55 59 60 59Maldives 6 6 6 6 17 12 12 13 77 82 82 82Mauritius 4 4 4 4 28 28 27 26 68 68 69 70Namibia 8 8 8 8 38 33 30 31 54 59 62 61Nauru – – – – – – – – – – – –Papua New Guinea 34 36 36 36 48 45 45 45 18 20 19 20St Lucia 5 4 3 3 18 18 17 16 77 78 80 81St Vincent and the
Grenadines7 7 7 6 20 20 19 20 74 73 73 74
Samoa 12 12 10 10 29 26 28 27 60 62 62 63Seychelles 3 2 2 2 16 14 14 14 82 84 84 84Solomon Islands 41 39 – – 6 6 – – 53 55 – –Swaziland 8 8 7 7 46 46 47 46 46 46 46 47Tonga 18 18 19 20 19 19 20 22 63 63 61 58Tuvalu 21 22 22 23 13 11 11 12 66 66 67 65Vanuatu 20 20 – – 9 10 – – 71 70 – –Other countriesAlbania 20 19 19 19 19 18 16 16 61 63 65 66Armenia 18 19 20 21 44 36 36 37 38 45 44 42Bhutan 19 19 17 16 44 43 45 44 37 38 38 40Bosnia and Herzegovina 8 8 8 9 30 28 28 26 62 64 64 65Cape Verde 6 9 10 10 18 18 18 18 75 73 72 72Congo, Republic of 4 5 4 3 77 71 75 77 19 24 21 20Costa Rica 7 7 7 6 29 27 26 26 64 65 67 68Djibouti – – – – – – – – – – – –Gabon 4 5 4 4 64 53 60 64 32 41 36 32Georgia 9 9 8 9 22 22 22 23 69 69 69 67Lao PDR 35 35 33 31 29 27 32 35 37 38 35 35Lebanon 7 6 6 6 22 23 23 21 71 70 71 74Macedonia, FYR 12 11 11 11 30 27 28 28 59 61 61 61Mauritania 19 20 17 13 41 35 44 50 41 45 39 37Moldova 11 10 14 15 14 13 13 14 75 77 72 71Mongolia 21 20 16 14 34 33 38 36 44 47 46 49Montenegro 9 10 9 9 21 20 21 19 70 70 70 71Panama 5 5 5 4 18 17 17 17 77 78 79 79São Tomé and Principe – – – – – – – – – – – –Suriname 10 11 10 10 43 38 38 38 47 52 52 52Timor-Leste – – – – – – – – – – – –High-incomeCommonwealth countriesAntigua and Barbuda 2 2 2 2 21 22 21 18 78 76 77 79Bahamas, The 2 2 2 2 15 14 15 16 83 84 83 82Barbados 3 3 – – 23 23 73 74 – –Brunei Darussalam 1 1 1 1 74 65 67 72 25 34 32 28Cyprus 2 – – – 20 – – – 78 – – –Malta 2 2 2 37 33 33 61 65 65 –
(continued)
82

Table 3. Sectoral distribution of gross domestic product (% total of GDP) (continued)
Group/country Agriculture Industry Services
2008 2009 2010 2011 2008 2009 2010 2011 2008 2009 2010 2011
St Kitts and Nevis 1 1 2 2 27 25 24 23 71 74 74 75Trinidad and Tobago 0 1 1 1 66 57 59 60 33 43 40 40Other countriesBahrain – – – – – – – – – – – –Croatia 5 5 5 5 28 27 27 26 67 67 68 68Equatorial Guinea 2 – – – 96 – – – 2 – – –Estonia 3 3 4 – 29 27 29 – 68 71 68 –Iceland 6 7 – – 27 25 – – 66 68 – –Ireland 1 1 – – 31 32 – – 67 67 – –Kuwait – – – – – – – – – – – –Latvia 3 3 4 – 23 21 22 – 74 76 74 –Lithuania 4 3 4 – 32 27 28 – 65 70 68 –Luxembourg 0 0 0 0 15 13 13 13 85 87 87 86Norway 1 1 2 – 45 39 40 54 60 58 –Oman – – – – – – – – – – – –Qatar – – – – – – – – – – – –Slovenia 3 2 2 – 34 31 32 64 66 66 –Uruguay 11 10 9 10 26 25 26 25 63 65 64 65
Note: – = not availableSource: World Bank, World Development Indicators 2013, available at: http://databank.worldbank.org (accessed May 2013)
83

Table 4. Growth of production (annual average %)
Group/country GDP Agriculture Industry Manufacturing Services
1999–2005
2006–2012
1999–2005
2006–2012
1999–2005
2006–2012
1999–2005
2006–2012
1999–2005
2006–2012
Middle-incomeCommonwealth countriesBelize 7.0 2.4 10.6 −5.7 5.6 8.3 6.4 8.1 6.5 2.6Botswana 5.3 4.6 −2.1 −1.0 5.6 7.0 1.7 3.3 – –Dominica 0.4 3.3 −1.3 0.6 −0.6 4.5 −3.7 −4.0 1.0 4.6Fiji 2.8 0.7 1.9 −0.8 2.3 0.2 1.6 0.6 3.3 0.8Grenada 5.3 −0.6 −3.7 8.7 10.9 −9.0 1.6 −0.9 4.1 1.5Guyana 0.7 3.1 0.2 −0.5 −1.2 5.7 0.7 15.3 2.3 6.6Jamaica 1.1 −0.6 −3.1 5.0 1.0 −2.7 −1.9 −1.3 2.0 0.5Kiribati 1.9 0.4 −0.2 1.4 −1.6 −0.9 4.0 −1.0 2.6 −0.3Lesotho 2.9 4.8 −1.2 1.5 7.6 5.9 11.5 2.6 2.0 4.4Maldives 6.0 8.0 6.0 −1.2 15.6 7.0 8.0 4.1 4.3 9.1Mauritius 3.9 4.7 0.5 0.6 2.0 2.8 1.0 1.9 6.0 6.1Namibia 4.6 4.4 4.1 −1.8 4.9 3.9 6.3 5.2 4.5 5.1Nauru – – – – – – – – – –Papua New Guinea 1.1 6.7 2.7 3.2 1.6 5.0 −1.0 3.8 −1.5 5.0St Lucia 1.4 2.0 −10.5 1.0 −0.7 4.2 2.6 2.6 2.9 3.0St Vincent and the
Grenadines3.7 1.1 −0.7 −1.2 2.6 0.0 −0.3 −0.2 4.2 0.8
Samoa 4.9 0.9 −1.7 −2.4 7.3 0.1 5.9 −5.6 5.7 2.3Seychelles 0.8 4.6 2.1 −3.2 2.7 3.0 0.9 −0.4 0.2 5.6Solomon Islands −1.2 6.2 4.0 5.9 −7.0 5.5 −7.1 1.6 −1.4 8.0Swaziland 2.2 1.6 2.0 0.8 1.6 −0.6 1.4 −0.6 0.4 4.4Tonga 2.8 1.0 1.2 −1.8 2.8 4.6 1.9 −1.0 3.4 0.6Tuvalu −0.2 1.9 −0.2 1.7 4.0 15.4 4.1 12.8 −0.5 0.4Vanuatu 1.6 4.1 1.7 3.0 −0.5 9.1 −3.2 12.4 2.0 4.1Other countriesAlbania 6.3 4.2 1.6 4.2 9.8 4.2 5.8 – 8.4 –Armenia 10.0 4.8 6.6 1.8 14.8 3.7 9.2 3.3 11.1 5.4Bhutan 7.8 9.4 2.9 1.6 9.6 12.5 5.7 13.7 9.6 9.0Bosnia and Herzegovina 5.7 2.4 −1.4 1.6 2.0 3.6 2.4 2.9 11.1 2.9Cape Verde 6.6 6.2 5.9 12.5 4.7 7.3 – – 7.2 6.3Congo, Republic of 3.6 4.8 4.3 5.1 2.0 5.3 10.6 7.9 5.8 4.5Costa Rica 4.4 4.7 2.2 3.1 5.2 3.6 5.6 3.2 4.8 5.4Djibouti 2.5 4.8 2.8 4.3 4.4 3.7 1.9 2.3 2.2 –Gabon −0.3 3.5 1.4 3.7 −1.9 −0.2 2.2 1.9 1.1 6.3Georgia 5.9 5.6 2.3 −0.6 8.2 5.1 7.5 5.0 6.9 8.1Lebanon 2.8 5.3 1.8 1.3 1.1 6.5 2.6 1.0 2.6 5.9Macedonia, FYR 2.4 3.0 0.0 2.8 2.8 3.4 3.3 0.1 2.6 3.3Mauritania 4.4 5.6 2.0 5.2 3.2 7.8 0.2 7.4 7.2 4.3Moldova 4.9 3.2 2.0 0.8 3.7 −1.1 7.5 −1.2 6.6 8.3Mongolia 5.3 8.9 −1.6 4.8 6.4 5.1 6.6 8.2 7.8 11.0Montenegro 1.1 3.8 −4.5 4.2 3.2 5.6 3.2 −1.1 4.1 3.5Panama 4.1 9.1 4.9 −2.1 2.0 8.4 −1.7 2.7 4.7 17.9São Tomé and Príncipe 3.7 4.8 – – – – – – – –Suriname 4.0 4.2 2.5 5.6 8.8 2.9 11.7 2.0 1.3 2.1Timor-Leste 2.4 9.2 – – – – – – – –High-incomeCommonwealth countriesAntigua and Barbuda 3.9 0.4 3.5 2.5 6.0 1.6 2.5 −1.6 3.4 −0.4Bahamas, The 2.8 0.3 1.6 −3.2 2.5 3.7 4.8 1.3 3.2 2.5
(continued)
84

Table 4. Growth of production (annual average %) (continued)
Group/country GDP Agriculture Industry Manufacturing Services
1999–2005
2006–2012
1999–2005
2006–2012
1999–2005
2006–2012
1999–2005
2006–2012
1999–2005
2006–2012
Barbados 0.7 −0.3 0.0 – 0.8 – −4.4 – 2.6 –Brunei Darussalam 2.3 1.1 7.6 0.8 1.9 −1.4 1.8 −0.7 3.0 4.7Cyprus 3.7 1.5 0.1 −5.0 2.3 3.2 0.5 0.0 4.2 4.6Malta 2.3 2.0 0.6 −3.3 −1.2 −0.1 −1.3 −0.6 4.4 4.6St Kitts and Nevis 3.5 1.2 4.1 −5.3 3.8 −2.1 6.8 −1.5 3.5 1.5Trinidad and Tobago 7.2 2.3 −3.3 7.2 11.4 6.5 8.6 22.8 4.9 −4.3Other countriesBahrain 5.7 5.8 – – – – – – – –Croatia 3.6 0.2 0.9 0.5 4.4 −1.5 3.7 −0.8 3.4 1.0Equatorial Guinea 28.3 4.2 4.2 – 31.6 – 137.9 . 27.7 –Estonia 6.5 2.0 0.4 3.4 8.2 0.4 10.3 1.5 6.2 0.5Iceland 4.3 0.8 0.1 −0.2 4.0 0.4 1.5 5.3 4.7 1.7Ireland 5.0 0.7 – – 6.7 – – – – –Kuwait 6.4 3.5 10.9 – 1.4 – 0.2 – 8.2 –Latvia 7.5 1.5 4.2 1.9 6.5 −1.6 5.5 −0.7 8.0 1.0Lithuania 5.9 2.4 0.6 1.2 6.6 0.4 8.6 0.2 6.1 2.1Luxembourg 5.0 1.7 −3.8 −2.3 3.8 −1.4 2.8 −2.6 5.1 2.4Norway 2.3 1.2 1.7 3.0 1.0 −2.4 1.7 1.0 3.2 2.5Oman 3.3 6.0 2.0 – 1.2 – 14.0 – 4.9 –Qatar 8.5 17.0 – – – – – – – –Slovenia 4.0 1.0 0.0 −1.4 4.6 1.1 5.2 1.3 4.1 2.7Uruguay −0.3 5.6 0.9 1.6 −0.3 3.4 0.8 3.6 −0.1 6.3
Note: – = not availableSource: World Bank, World Development Indicators 2013, available at: http://databank.worldbank.org (accessed June 2013)
85

Tabl
e 5.
GD
P co
mpo
nent
s (%
of t
otal
)
Gro
up/c
ount
ryG
ross
cap
ital
fo
rmat
ion
Hou
seho
ld
cons
umpt
ion
Gov
ernm
ent
cons
umpt
ion
Exte
rnal
bal
ance
on
good
s an
d se
rvic
esG
ross
sav
ings
2002
2007
2011
2002
2007
2011
2002
2007
2011
2002
2007
2011
2002
2007
2011
Mid
dle-
inco
me
Com
mon
wea
lth c
ount
ries
Bel
ize
2420
–75
67–
1415
–−1
4−2
–7
12.7
–B
ots
wan
a27
3031
4134
5421
2220
1114
−530
48.9
–D
om
inic
a13
2022
8185
8017
1617
−10
−21
−19
–−1
.25
Fiji
2021
–67
77–
1617
–−2
−15
−11
248.
9–
Gre
nada
2735
2179
8488
1213
16−1
8−3
3−2
5–
0.8
−6G
uyan
a21
2524
6688
9126
1515
−13
––
610
.9–
Jam
aica
2727
2174
8086
1515
16−1
6−2
2−2
316
15.5
8K
iriba
ti–
––
––
––
––
––
––
––
Leso
tho
3224
3510
810
699
3736
33−7
8−6
6−6
643
28.3
15M
aldi
ves
––
––
––
––
––
11–
––
–M
aurit
ius
2227
2561
6973
1413
133
−9−1
227
22.1
14N
amib
ia19
2420
6257
6321
2125
−2−1
−826
31.8
19N
auru
––
––
––
––
––
––
––
–P
apua
New
Gui
nea
21–
1661
–73
15–
83
–3
17–
–St
Luc
ia22
2834
6984
7120
1316
−11
−26
−21
–−2
.312
St V
ince
nt a
nd th
e G
rena
dine
s23
2725
6985
8716
1616
−8−2
8−2
9–
−0.8
−5S
amo
a–
––
––
––
––
–−2
9–
––
–Se
yche
lles
––
––
––
––
–−2
7−4
8−5
3–
––
Solo
mo
n Is
land
s5
––
88–
–22
––
−10
−20
−24
−3–
–Sw
azila
nd19
129
7075
8416
1415
−5−1
−822
18.7
–To
nga
2522
3898
104
8814
1817
−37
−43
−43
2217
.4–
Tuva
lu–
––
––
––
––
––
––
––
Van
uatu
1932
–74
58–
2117
–−1
4−7
–5
24.5
–O
ther
cou
ntrie
sA
lban
ia24
3025
9287
8910
98
−26
−26
−22
1519
.813
Arm
enia
2238
3186
7281
1010
12−1
7−2
0−2
515
31.1
19B
huta
n60
3759
3946
3821
1922
−20
−2–
–41
.2–
Bo
snia
and
Her
zego
vina
1931
2110
484
8025
2222
−47
−37
−23
115
.213
Cap
e V
erde
3647
3779
6273
2226
21−3
6−3
5−3
024
32.3
22
(con
tinue
d)
86

Tabl
e 5.
GD
P co
mpo
nent
s (%
of t
otal
) (co
ntin
ued)
Gro
up/c
ount
ryG
ross
cap
ital
fo
rmat
ion
Hou
seho
ld
cons
umpt
ion
Gov
ernm
ent
cons
umpt
ion
Exte
rnal
bal
ance
on
good
s an
d se
rvic
esG
ross
sav
ings
2002
2007
2011
2002
2007
2011
2002
2007
2011
2002
2007
2011
2002
2007
2011
Co
ngo,
Rep
ublic
of
2322
2531
3612
1817
1028
2552
–17
.1–
Co
sta
Ric
a23
2521
6867
6515
1318
−5−5
−415
18.8
15D
jibo
uti
1037
–67
57–
2825
–−5
−20
–15
––
Gab
on
2526
2745
3635
119
919
2929
31–
–G
eorg
ia29
3226
7573
7510
2218
−13
−27
−19
2212
.414
Lao
PD
R18
2782
697
10−8
−610
–16
Leba
non
1928
3383
8380
1715
14−1
9−2
5−2
7−4
11M
aced
oni
a, F
YR21
2527
7777
7422
1718
−20
−18
−20
1218
.426
Mau
ritan
ia15
3731
7367
4726
1515
−14
−18
6–
–M
old
ova
2224
8396
2021
−25
−41
1825
.913
Mo
ngo
lia25
3963
7647
4916
1313
−17
1−2
417
42.8
31M
ont
eneg
ro19
3420
8188
8425
2022
−25
−42
−26
–−2
4.8
–N
icar
agua
2528
8784
97
−20
−19
10–
19P
anam
a16
2428
6457
6415
1112
57
−321
39.3
18Su
rinam
e22
––
70–
–29
––
−21
––
−4–
–T
imo
r-Le
ste
––
––
––
––
––
––
––
–H
igh-
inco
me
Com
mon
wea
lth c
ount
ries
Ant
igua
and
Bar
buda
2339
2957
72–
2416
–−4
−27
−10
–9.
3–
Bah
amas
, The
2118
–61
69–
2517
–−6
−414
19.8
–B
arba
dos
2228
2763
6771
1112
154
−7−1
324
11.8
–B
rune
i Dar
ussa
lam
2113
1326
2417
2723
1725
4052
4549
.9–
Cyp
rus
1922
–65
66–
1817
–−2
−6–
158.
7–
Mal
ta14
2113
6362
6120
1921
4−2
518
14.4
–St
Kitt
s an
d N
evis
4247
3270
6069
109
11−2
2−1
6−1
2–
30.5
23Tr
inid
ad a
nd T
oba
go23
13–
5848
–14
10–
629
–23
37.6
–O
ther
cou
ntrie
sB
ahra
in20
27–
4634
–18
14–
1625
–20
––
Cro
atia
2529
2162
5859
2120
20−8
−7–
20–
20Eq
uato
rial G
uine
a30
4235
1814
385
33
4763
24–
––
Esto
nia
3239
2557
5452
1816
20−7
−94
2223
.425
(con
tinue
d)
87

Tabl
e 5.
GD
P co
mpo
nent
s (%
of t
otal
) (co
ntin
ued)
Gro
up/c
ount
ryG
ross
cap
ital
fo
rmat
ion
Hou
seho
ld
cons
umpt
ion
Gov
ernm
ent
cons
umpt
ion
Exte
rnal
bal
ance
on
good
s an
d se
rvic
esG
ross
sav
ings
2002
2007
2011
2002
2007
2011
2002
2007
2011
2002
2007
2011
2002
2007
2011
Icel
and
1829
1455
5752
2524
252
−11
920
13.1
7Ire
land
2226
1045
4849
1617
1917
922
2221
.314
Kuw
ait
1720
1850
3024
2514
148
3545
2857
.3–
Latv
ia27
4026
6262
6221
1716
−10
−20
−420
18.5
26Li
thua
nia
2131
1964
6564
2118
19−6
−13
−115
17.3
18Lu
xem
bour
g22
2121
4232
3116
1516
2032
3123
29.8
22N
orw
ay19
2623
4641
4122
1922
1314
1431
38.2
38O
man
19–
36–
24–
21–
2736
.5–
Qat
ar33
38–
1817
–17
22–
3223
––
–S
love
nia
2432
2256
5257
1917
211
−21
2527
.421
Uru
guay
1320
1973
7068
1211
131
−1–
1516
.917
Not
e: –
= n
ot a
vaila
ble
Sou
rce:
Wo
rld B
ank,
Wor
ld D
evel
opm
ent I
ndic
ator
s 20
13, a
vaila
ble
at: h
ttp:
//da
taba
nk.w
orld
bank
.org
(acc
esse
d Ju
ne 2
013)
88

Table 6. Prices (% change)
Group/country Consumer Prices Index (CPI) Inflation, GDP deflator (annual %)
2009 2010 2011 2012 2009 2010 2011 2012
Middle-incomeCommonwealth countriesBelize −1.1 5.6 −3.7 1.3 −1.1 0.7 1.5 –Botswana 8.0 6.9 8.5 7.5 3.6 20.6 7.6 −5.7Dominica 0.0 3.2 2.4 1.4 7.9 −2.7 −0.7 2.1Fiji 3.7 5.5 8.7 4.3 −0.2 8.2 10.2 −0.7Grenada −0.3 3.4 3.0 2.4 0.0 0.1 0.4 2.0Guyana 2.9 2.1 5.0 2.4 2.1 6.7 8.4 5.7Jamaica 9.6 12.6 7.5 6.9 10.9 9.7 6.3 6.7Kiribati – – – – 0.9 −1.3 2.8 2.5Lesotho 7.4 3.6 5.0 6.1 4.2 2.8 9.5 5.4Maldives 4.0 4.7 14.8 11.3 8.9 0.4 7.5 5.0Mauritius 2.5 2.9 6.5 3.9 −0.1 −1.6 3.9 3.4Namibia 8.8 4.5 5.0 6.5 4.0 1.5 6.9 10.5Nauru – – – – – – – –Papua New Guinea 6.9 6.0 8.4 2.2 −4.3 9.3 4.6 2.8St Lucia −1.7 3.3 2.8 4.2 −0.2 2.6 −0.4 1.0St Vincent and the
Grenadines0.4 1.5 3.2 2.6 −0.8 4.5 2.2 1.6
Samoa 6.3 0.8 5.2 2.0 3.0 1.4 2.2 1.7Seychelles 31.8 −2.4 2.6 7.1 26.3 −4.9 6.4 4.8Solomon Islands 7.1 1.1 7.3 2.6 −2.0 5.6 11.0 7.8Swaziland 7.4 4.5 6.1 9.4 6.0 −1.0 6.3 8.3Tonga 1.4 3.6 6.3 1.2 −2.1 4.3 5.2 1.0Tuvalu – – – – −2.1 3.3 −1.2 1.4Vanuatu 4.3 2.8 0.9 1.4 2.3 2.6 2.1 1.4Other countriesAlbania 2.3 3.6 3.5 2.0 2.4 3.5 3.0 3.0Armenia 3.4 8.2 7.7 2.6 2.6 7.9 4.2 −1.6Bhutan 4.4 7.0 8.8 10.9 4.8 6.0 8.8 1.5Bosnia and Herzegovina −0.4 2.2 3.7 2.0 0.1 2.3 2.3 1.8Cape Verde 1.0 2.1 4.5 2.5 4.2 3.3 3.9 3.5Congo, Republic of 5.3 5.0 1.3 3.9 −20.6 20.7 10.7 −1.2Costa Rica 7.8 5.7 4.9 4.5 8.4 8.0 4.1 4.0Gabon 1.9 1.5 1.3 2.7 −16.6 18.4 15.1 1.3Georgia 1.7 7.1 8.5 −0.9 −2.0 8.5 9.7 1.3Lebanon 1.2 4.0 – – 6.2 – 4.9 5.6Macedonia, FYR −0.7 1.6 3.9 3.3 0.7 2.7 3.4 –Mauritania 2.2 6.3 5.6 4.9 −10.9 21.4 14.1 −3.6Moldova −0.1 7.4 7.7 4.7 2.2 11.1 7.7 7.5Mongolia 6.3 10.1 9.5 15.0 1.8 20.0 12.1 12.0Montenegro 3.5 0.7 3.2 – 2.4 1.6 1.0 2.3Panama 2.4 3.5 5.9 5.7 1.1 4.2 4.4 4.6Suriname −0.1 6.9 17.7 5.0 6.5 8.2 12.1 6.4Timor-Leste 0.7 6.8 13.5 11.8 5.1 1.4 12.5 9.1High-incomeCommonwealth countriesAntigua and Barbuda −0.6 3.4 3.5 3.4 1.8 1.4 1.9 2.2Bahamas, The 2.1 1.3 3.2 2.0 −1.0 −0.1 −1.8 1.6Barbados 3.6 5.8 9.4 4.5 3.4 – – –Brunei Darussalam 1.0 0.4 2.0 0.5 −22.1 5.3 19.4 0.8Cyprus 0.4 2.4 3.3 2.4 −0.3 1.7 2.4 1.9Malta 2.1 1.5 2.7 2.4 2.6 2.9 4.9 2.3St Kitts and Nevis 2.0 0.5 7.1 1.4 2.5 0.6 2.8 1.1Trinidad and Tobago 7.0 10.5 5.1 9.3 −27.6 8.0 17.6 0.9
(continued)
89

Table 6. Prices (% change) (continued)
Group/country Consumer Prices Index (CPI) Inflation, GDP deflator (annual %)
2009 2010 2011 2012 2009 2010 2011 2012
Other countriesBahrain 2.8 2.0 −0.4 2.8 −14.4 13.7 – –Croatia 2.4 1.0 2.3 3.4 2.9 −0.1 2.0 2.1Equatorial Guinea 4.7 7.8 6.9 6.1 −30.0 26.3 24.4 11.1Estonia −0.1 3.0 5.0 3.9 −1.4 0.7 2.9 3.2Iceland 12.0 5.4 4.0 5.2 8.3 6.9 3.3 3.0Ireland −4.5 −0.9 2.6 1.7 −4.6 −2.2 0.2 1.9Kuwait 4.0 4.0 4.7 2.9 −18.9 13.1 26.4 –Latvia 3.5 −1.1 4.4 2.3 −1.5 −2.3 6.2 3.0Lithuania 4.4 1.3 4.1 3.1 −3.7 2.0 6.2 2.9Luxembourg 0.4 2.3 3.4 2.7 0.5 7.6 5.1 3.9Norway 2.2 2.4 1.3 0.7 −5.4 6.3 6.8 2.5Oman 3.9 3.2 4.1 2.9 −23.5 18.7 17.6 –Qatar −4.9 −2.4 1.9 1.9 −24.2 11.9 14.4 –Slovenia 0.9 1.8 1.8 2.6 3.0 −1.1 2.3 –Uruguay 7.1 6.7 8.1 8.1 4.9 4.8 8.0 8.8
Note: – = not availableSource: World Bank, World Development Indicators 2013, available at: http://databank.worldbank.org (accessed June 2013)
90

Table 7. Exports, imports and trade balance
Group/country Exports (US$ million) Imports (US$ million) Trade balance (US$ million)
2009 2010 2011 2009 2010 2011 2009 2010 2011
Middle-incomeCommonwealth countriesBelize 213 816 949 237 810 945 −25 7 4Botswana 3,745 4,917 6,782 4,934 5,956 7,682 −1,189 −1,040 −899Dominica 157 170 166 265 262 261 −108 −93 −94Fiji 1,313 1,709 1,814 1,702 2,005 2,219 −389 −296 −404Grenada 174 168 184 361 378 392 −187 −210 −208Guyana – – – – – – – – –Jamaica 4,151 4,134 4,459 6,280 6,647 7,768 −2,129 −2,513 −3,309Kiribati – – – – – – – – –Lesotho 783 971 1,181 1,978 2,482 2,732 −1,195 −1,511 −1,551Maldives 1,712 2,007 2,351 1,482 1,693 2,265 230 315 86Mauritius 4,326 5,101 6,011 5,152 6,196 7,475 −826 −1,095 −1,463Namibia 4,191 5,255 5,636 4,970 6,067 6,557 −779 −812 −920Nauru – – – – – – – – –Papua New Guinea 4,572 5,295 6,596 4,509 5,032 6,227 64 263 369St Lucia 544 629 559 648 786 823 −104 −157 −263St Vincent and the
Grenadines192 184 186 388 389 386 −196 −206 −200
Samoa 166 199 201 291 364 373 −124 −165 −172Seychelles 392 394 483 793 985 1,050 −401 −591 −567Solomon Islands 220 211 217 308 418 415 −88 −207 −199Swaziland 1,860 2,063 2,642 2,384 2,633 2,965 −524 −570 −322Tonga 45 49 77 203 214 263 −159 −165 −186Tuvalu – – – – – – – – –Vanuatu 300 327 351 292 375 396 7 −48 −45Other countriesAlbania 3,443 3,845 4,380 6,485 6,389 7,257 −3,042 −2,544 −2,877Armenia 1,338 1,929 2,406 3,719 4,197 4,928 −2,381 −2,268 −2,522Bhutan 578 631 634 786 926 967 −208 −294 −332Bosnia and
Herzegovina5,410 5,956 7,647 9,293 9,409 11,727 −3,883 −3,453 −4,079
Cape Verde 570 640 803 1,087 1,113 1,379 −517 −473 −576Congo, Republic of 6,756 10,221 12,591 4,816 6,568 5,021 1,939 3,653 7,570Costa Rica 12,423 13,784 15,279 12,258 14,607 17,020 165 −823 −1,741Djibouti – – – – – – – – –Gabon – – – 4,228 4,783 6,103 – – –Georgia 3,202 4,068 5,237 5,269 6,141 7,919 −2,067 −2,073 −2,683Lebanon 7,146 8,232 9,520 16,760 18,641 20,220 −9,614 −10,409 −10,700Macedonia, FYR 3,649 4,349 5,694 5,685 6,095 7,735 −2,036 −1,746 −2,040Mauritania 1,362 2,067 2,764 1,389 1,927 2,493 −27 140 272Moldova 2,006 2,280 3,151 3,996 4,566 6,037 −1,990 −2,286 −2,885Mongolia 2,305 3,392 5,462 2,637 3,866 7,608 −333 −474 −2,146Montenegro 1,334 1,428 1,809 2,707 2,594 2,975 −1,374 −1,166 −1,166Panama 19,625 20,606 21,636 15,379 18,608 22,516 4,246 1,998 −880São Tomé and
Príncipe20 24 28 103 129 142 −83 −105 −114
Suriname – – – – – – – – –Timor-Leste – – – – – – – – –High-incomeCommonwealth countriesAntigua and Barbuda 562 524 537 706 680 644 −145 −156 −107Bahamas, The 3,117 3,223 3,431 3,728 3,895 4,401 −611 −671 −970Barbados 2,179 1,946 – 2,322 2,153 – −143 −208 –
(continued)
91

Table 7. Exports, imports and trade balance (continued)
Group/country Exports (US$ million) Imports (US$ million) Trade balance (US$ million)
2009 2010 2011 2009 2010 2011 2009 2010 2011
Brunei Darussalam 7,811 10,074 13,297 3,841 4,066 4,765 3,970 6,007 8,531Cyprus 9,480 9,279 – 10,726 10,770 – −1,245 −1,490 –Malta 6,380 7,199 8,707 6,399 6,920 8,269 −19 279 438St Kitts and Nevis 170 199 228 347 335 315 −178 −136 −87Trinidad and Tobago 9,986 12,113 – 7,363 6,890 – 2,623 5,223 –Other countriesBahrain 15,705 – – 11,354 – – 4,351 – –Croatia 22,781 23,399 26,111 24,969 23,709 26,170 −2,188 −310 −59Equatorial Guinea 8,531 10,136 14,129 7,418 7,696 9,382 1,112 2,440 4,746Estonia 12,437 14,969 20,274 11,338 13,701 19,400 1,099 1,268 874Iceland 6,401 7,081 8,320 5,359 5,813 7,122 1,042 1,268 1,197Ireland 203,335 207,645 231,654 167,192 168,850 183,159 36,143 38,795 48,495Kuwait 62,985 74,702 116,409 31,133 32,687 37,191 31,852 42,015 79,218Latvia 11,356 12,920 16,758 11,739 13,262 17,849 −383 −342 −1,091Lithuania 20,129 24,898 33,231 20,653 25,273 33,868 −524 −375 −637Luxembourg 81,848 90,505 104,484 65,744 73,650 86,001 16,104 16,855 18,483Norway 151,689 170,525 203,736 105,021 120,129 137,455 46,668 50,395 66,280Oman 24,671 – – 19,443 – – 5,228 – –Qatar 45,958 – – 30,692 – – 15,266 – –Slovenia 28,644 30,690 35,815 27,939 30,425 35,298 704 265 518Uruguay 8,544 10,562 12,645 8,305 10,254 12,771 239 307 −126
Note: – = not availableSource: IMF, World Economic Outlook Database, available at: www.imf.org/external/pubs/ft/weo/2013/02/weodata/index.aspx
(accessed October 2013)
92

Tabl
e 8.
Des
tina
tion
of m
erch
andi
se e
xpor
ts (%
of t
otal
exp
orts
)
Gro
up/c
ount
ryH
igh
inco
me
econ
omie
sD
evel
opin
g ec
onom
ies
(wit
hin
and
outs
ide
regi
on)
2007
2008
2009
2010
2011
2007
2008
2009
2010
2011
Mid
dle-
inco
me
Com
mon
wea
lth c
ount
ries
Bel
ize
64.2
73.4
69.0
69.8
76.9
35.7
26.4
30.8
30.1
22.9
Bo
tsw
ana
––
––
––
––
––
Do
min
ica
30.7
56.7
61.8
62.2
62.9
67.3
42.0
36.7
36.2
35.8
Fiji
51.8
51.9
51.2
48.2
46.7
20.9
20.5
21.2
23.3
24.1
Gre
nada
24.0
32.6
19.7
23.4
24.0
42.2
28.1
25.8
29.7
29.6
Guy
ana
76.9
77.8
78.4
78.8
80.0
22.2
21.4
20.9
20.4
19.3
Jam
aica
88.3
88.3
90.3
82.3
90.7
11.1
11.0
8.6
16.4
8.4
Kiri
bati
71.1
50.3
64.5
46.3
43.2
––
––
–Le
soth
o–
––
––
––
––
–M
aldi
ves
52.8
51.5
62.1
41.2
57.5
11.6
9.5
16.3
31.0
18.4
Mau
ritiu
s84
.883
.382
.380
.879
.315
.116
.717
.719
.220
.7N
amib
ia–
––
––
––
––
–N
auru
––
––
––
––
––
Pap
ua N
ew G
uine
a48
.450
.750
.548
.052
.011
.711
.811
.413
.612
.8St
Luc
ia77
.975
.266
.646
.748
.521
.724
.433
.152
.850
.8St
Vin
cent
and
the
Gre
nadi
nes
75.1
68.3
77.1
69.9
56.0
24.8
31.6
22.8
29.9
43.8
Sam
oa
62.1
51.1
38.9
41.9
35.7
0.7
0.9
3.3
1.4
2.9
Seyc
helle
s75
.675
.584
.371
.682
.520
.620
.310
.322
.711
.1So
lom
on
Isla
nds
22.0
21.8
18.2
15.2
25.5
62.1
64.3
65.3
70.9
61.7
Swaz
iland
––
––
––
––
––
Tong
a84
.479
.780
.071
.168
.614
.117
.918
.625
.622
.1Tu
valu
29.5
52.8
55.5
53.1
88.1
––
––
–V
anua
tu48
.411
.436
.336
.134
.3–
––
––
Oth
er c
ount
ries
Alb
ania
87.1
79.7
80.1
75.8
75.4
11.0
13.7
12.6
17.7
17.0
Arm
enia
59.6
57.9
55.8
47.1
51.7
40.0
41.5
42.8
51.8
46.5
Bhu
tan
––
––
–0.
00.
00.
00.
00.
0B
osn
ia a
nd H
erze
govi
na93
.393
.392
.390
.290
.14.
75.
35.
86.
56.
9C
ape
Ver
de88
.289
.998
.195
.791
.811
.89.
20.
42.
56.
8C
ong
o, R
epub
lic o
f55
.660
.665
.259
.854
.944
.139
.334
.540
.044
.8C
ost
a R
ica
63.7
62.3
61.3
65.6
66.1
36.2
37.4
38.3
34.3
33.8
Djib
out
i8.
713
.314
.89.
38.
56.
07.
07.
512
.58.
9G
abo
n57
.558
.956
.655
.972
.930
.330
.427
.330
.516
.6G
eorg
ia37
.430
.529
.033
.328
.362
.669
.571
.066
.771
.6Le
bano
n55
.650
.560
.253
.150
.843
.548
.238
.746
.048
.1
(con
tinue
d)
93

Tabl
e 8.
Des
tina
tion
of m
erch
andi
se e
xpor
ts (%
of t
otal
exp
orts
) (co
ntin
ued)
Gro
up/c
ount
ryH
igh
inco
me
econ
omie
sD
evel
opin
g ec
onom
ies
(wit
hin
and
outs
ide
regi
on)
2007
2008
2009
2010
2011
2007
2008
2009
2010
2011
Mac
edo
nia,
FYR
64.8
57.7
55.3
55.9
59.2
35.2
42.3
33.1
30.9
29.5
Mau
ritan
ia49
.543
.837
.839
.837
.949
.255
.160
.958
.961
.1M
old
ova
35.2
32.6
34.8
32.2
37.4
64.5
67.0
64.4
66.9
61.9
Mo
ngo
lia23
.731
.222
.015
.010
.93.
84.
24.
13.
23.
0M
ont
eneg
ro–
––
––
––
––
–P
anam
a71
.874
.473
.770
.066
.820
.821
.023
.527
.729
.5S
ão T
om
é an
d P
rinci
pe68
.280
.689
.969
.884
.4–
––
––
Surin
ame
92.3
89.2
90.6
89.7
92.0
7.7
10.8
9.4
10.3
8.0
Tim
or-
Lest
e–
––
––
––
––
–H
igh-
inco
me
Com
mon
wea
lth c
ount
ries
Ant
igua
and
Bar
buda
92.5
88.0
88.4
22.8
17.3
4.5
7.9
8.1
66.1
73.2
Bah
amas
, The
90.2
87.2
85.2
65.7
68.0
9.5
12.5
14.5
34.0
31.7
Bar
bado
s46
.246
.655
.542
.857
.353
.453
.043
.956
.842
.2B
rune
i Dar
ussa
lam
67.0
72.0
76.4
80.8
78.2
32.5
27.6
22.9
18.6
21.3
Cyp
rus
64.4
60.5
63.7
66.9
66.6
18.7
18.4
20.9
21.1
18.1
Mal
ta80
.475
.669
.363
.561
.18.
59.
412
.69.
27.
5St
Kitt
s an
d N
evis
80.0
77.7
69.6
65.7
75.5
––
––
–Tr
inid
ad a
nd T
oba
go75
.273
.674
.069
.466
.123
.925
.624
.929
.532
.9O
ther
cou
ntrie
sB
ahra
in20
.119
.018
.017
.819
.311
.015
.19.
510
.510
.2C
roat
ia68
.066
.768
.268
.267
.228
.830
.531
.828
.731
.6Eq
uato
rial G
uine
a77
.782
.180
.783
.681
.10.
00.
00.
00.
00.
0Es
toni
a63
.564
.566
.665
.465
.435
.834
.532
.233
.333
.0Ic
elan
d94
.292
.391
.992
.090
.25.
87.
78.
18.
09.
8Ire
land
92.1
91.8
92.5
93.0
93.1
7.6
7.9
7.3
6.8
6.7
Kuw
ait
68.9
68.2
64.5
61.4
60.1
31.1
31.8
35.5
38.6
39.9
Latv
ia64
.059
.758
.758
.355
.235
.840
.141
.141
.644
.7Li
thua
nia
59.2
57.7
61.7
60.8
58.4
40.7
42.2
38.2
39.1
41.3
Luxe
mbo
urg
91.1
93.1
91.8
91.8
90.2
7.3
6.2
5.3
7.0
9.0
No
rway
94.4
94.7
92.8
93.1
93.3
5.4
5.1
7.1
6.9
6.6
Om
an48
.650
.756
.349
.747
.051
.449
.343
.750
.353
.0Q
atar
81.8
77.1
71.9
72.8
72.3
15.6
11.0
18.1
18.2
20.5
Slo
veni
a78
.576
.778
.179
.479
.221
.122
.821
.320
.120
.3U
rugu
ay37
.534
.130
.528
.929
.059
.062
.966
.668
.368
.2
Not
e: –
= n
ot a
vaila
ble
Sou
rce:
Wo
rld B
ank
(201
3), W
orld
Dev
elop
men
t Ind
icat
ors
2013
, ava
ilabl
e at
: htt
p://
data
bank
.wo
rldba
nk.o
rg (a
cces
sed
June
201
3)
94

Tabl
e 9.
Des
tina
tion
of m
erch
andi
se e
xpor
ts to
sel
ecte
d re
gion
s (%
sha
re o
f wor
ld e
xpor
ts)
Gro
up/c
ount
ryEu
rope
an U
nion
NA
FTA
Chi
na (M
ainl
and
Chi
na)
2009
2010
2011
2012
2009
2010
2011
2012
2009
2010
2011
2012
Mid
dle-
inco
me
Com
mon
wea
lth c
ount
ries
Bel
ize
27.0
30.0
28.2
37.5
31.4
35.4
43.3
33.3
0.0
0.1
0.6
1.4
Do
min
ica
20.0
6.9
7.6
6.2
1.8
1.0
1.0
0.9
0.6
1.4
0.2
0.5
Fiji
10.1
4.9
6.7
4.0
15.1
15.4
10.9
14.3
0.1
0.1
0.1
1.4
Gre
nada
3.6
4.8
5.8
5.2
6.6
8.3
7.4
8.1
0.0
0.0
0.0
0.0
Guy
ana
23.3
21.5
18.8
15.9
44.8
50.6
56.5
58.6
1.0
1.4
0.9
1.5
Jam
aica
9.6
12.0
27.7
16.7
59.7
46.3
55.8
47.0
1.3
0.3
0.2
2.1
Kiri
bati
––
––
––
––
––
––
Mal
dive
s34
.538
.070
.252
.72.
51.
32.
610
.20.
10.
00.
10.
1M
aurit
ius
58.9
74.0
67.4
62.0
8.8
10.3
11.1
10.3
0.4
0.4
0.3
0.3
Nam
ibia
––
––
––
––
––
––
Nau
ru–
––
––
––
––
––
–P
apua
New
Gui
nea
7.1
9.2
11.2
9.5
1.3
0.9
1.1
0.9
4.1
7.2
6.2
5.0
St L
ucia
64.3
12.7
6.3
23.0
11.4
14.4
19.2
14.2
0.1
0.1
0.3
0.1
St V
ince
nt a
nd th
e G
rena
dine
s52
.431
.319
.55.
80.
61.
42.
53.
20.
00.
00.
00.
0S
amo
a0.
81.
21.
30.
64.
02.
82.
21.
75.
70.
00.
00.
0Se
yche
lles
63.0
61.5
65.9
71.8
2.0
1.3
1.8
1.7
0.0
0.0
0.1
0.1
Solo
mo
n Is
land
s6.
710
.214
.010
.30.
30.
30.
30.
353
.059
.549
.848
.4To
nga
1.5
4.0
0.5
2.4
24.1
17.1
10.6
17.2
0.4
0.0
0.2
0.0
Tuva
lu–
––
––
––
––
––
–V
anua
tu5.
34.
02.
51.
41.
21.
21.
01.
10.
70.
31.
00.
9O
ther
cou
ntrie
sA
lban
ia64
.599
.091
.366
.60.
81.
51.
11.
24.
75.
52.
56.
9A
rmen
ia29
.371
.858
.342
.014
.610
.812
.812
.12.
63.
01.
22.
2B
osn
ia a
nd H
erze
govi
na54
.289
.490
.666
.50.
00.
00.
00.
00.
50.
50.
70.
5C
ape
Ver
de10
1.8
119.
512
2.6
92.3
0.0
0.0
2.3
5.1
––
0.1
0.0
Co
ngo,
Rep
ublic
of
8.0
26.7
25.4
25.8
43.1
31.4
20.3
13.0
23.5
28.7
38.5
39.0
Co
sta
Ric
a16
.119
.019
.679
.338
.741
.942
.041
.38.
83.
01.
913
.2D
jibo
uti
7.3
3.1
2.2
2.5
0.7
0.6
0.7
2.1
0.0
0.1
0.0
0.1
Gab
on
12.3
21.6
14.9
12.2
24.7
29.6
41.9
17.0
13.7
12.4
5.1
5.4
Lao
PD
R10
.913
.412
.89.
13.
12.
92.
01.
020
.123
.323
.421
.3M
aurit
ania
20.3
38.4
46.2
22.8
2.0
2.3
0.0
0.0
43.9
40.8
46.4
49.3
Nic
arag
ua–
––
––
––
––
––
–P
anam
a17
.219
.322
.822
.845
.740
.937
.335
.42.
55.
04.
94.
1S
ão T
om
é an
d P
rínci
pe11
8.7
83.1
53.4
74.5
2.3
3.4
10.6
5.5
0.0
0.1
0.0
0.4
Surin
ame
19.7
27.5
44.9
23.5
33.7
35.2
43.4
37.1
1.6
0.7
1.1
2.0
Tim
or-
Lest
e–
––
––
––
––
––
–
(con
tinue
d)
95

Tabl
e 9.
Des
tina
tion
of m
erch
andi
se e
xpor
ts to
sel
ecte
d re
gion
s (%
sha
re o
f wor
ld e
xpor
ts) (
cont
inue
d)
Gro
up/c
ount
ryEu
rope
an U
nion
NA
FTA
Chi
na (M
ainl
and
Chi
na)
2009
2010
2011
2012
2009
2010
2011
2012
2009
2010
2011
2012
Hig
h-in
com
eC
omm
onw
ealth
cou
ntrie
sA
ntig
ua a
nd B
arbu
da–
––
––
––
––
––
–B
aham
as, T
he10
.47
9.92
16.7
77.
3212
.210
.811
.314
.30.
60.
81.
42.
2B
arba
dos
16.4
16.9
3.0
3.4
37.6
36.0
28.1
29.3
0.0
0.0
2.1
4.0
Bru
nei D
arus
sala
m0.
30.
10.
10.
10.
60.
10.
30.
84.
07.
04.
42.
8C
ypru
s42
.861
.575
.047
.11.
51.
61.
73.
91.
31.
61.
52.
2M
alta
32.3
49.3
65.8
49.3
8.1
4.1
2.6
3.1
1.3
0.6
0.7
0.4
St K
itts
and
Nev
is4.
88.
96.
56.
064
.256
.766
.466
.40.
00.
30.
40.
1Tr
inid
ad a
nd T
oba
go12
.516
.816
.89.
746
.848
.644
.444
.0–
––
–O
ther
cou
ntrie
sB
ahra
in1.
83.
13.
53.
92.
01.
41.
52.
10.
80.
80.
90.
9Eq
uito
rial G
uine
a–
––
––
––
––
––
–Es
toni
a50
.286
.510
2.3
68.2
6.3
1.6
3.8
4.2
0.8
0.8
1.2
0.7
Icel
and
58.6
87.9
90.9
69.3
4.4
5.0
4.2
5.1
1.9
1.9
3.3
2.2
Irela
nd56
.258
.564
.757
.222
.023
.223
.719
.50.
10.
00.
00.
1K
uwai
t4.
67.
88.
06.
57.
68.
38.
411
.76.
79.
99.
69.
1N
orw
ay54
.190
.598
.981
.37.
36.
77.
35.
62.
11.
71.
81.
5O
man
1.9
2.2
2.8
1.4
3.7
2.3
4.7
2.7
20.3
27.1
30.1
31.8
Qat
ar7.
319
.625
.111
.01.
20.
81.
50.
910
.513
.112
.612
.6S
love
nia
111.
677
.227
4.2
1785
.046
6.9
1892
.630
124.
136
73.2
0.6
3.4
17.0
0.3
Uru
guay
17.3
26.0
21.5
16.0
8.8
6.4
6.7
7.3
11.0
13.2
14.4
18.2
Not
e: –
= n
ot a
vaila
ble
Sou
rce:
IMF,
Dire
ctio
n of
Tra
de S
tatis
tics
Year
book
201
3, a
vaila
ble
at: h
ttp:
//es
ds80
.mcc
.ac.
uk (a
cces
sed
June
201
3)
96

Table 10. Main sources of merchandise imports (% of total imports)
Group/country High income economies Developing economies
2007 2008 2009 2010 2011 2007 2008 2009 2010 2011
Middle-incomeCommonwealth countriesBelize 55.1 57.8 57.8 56.7 59.5 44.9 42.2 42.2 43.3 40.4Botswana – – – – – – – – – –Dominica 64.4 78.2 80.5 78.5 78.0 35.0 21.3 18.9 21.0 21.3Fiji 82.1 78.2 76.0 78.0 79.4 16.2 20.2 22.1 19.9 18.8Grenada 81.8 78.0 76.1 75.4 76.4 9.2 12.9 12.4 14.1 13.5Guyana 72.4 73.9 73.7 70.9 64.1 27.6 26.1 26.3 29.1 35.8Jamaica 72.3 71.5 66.2 65.3 60.4 26.3 27.7 31.8 32.2 37.3Kiribati 45.6 47.7 49.8 53.8 62.3 – – – – –Lesotho – – – – – – – – – –Maldives 63.0 66.2 61.2 62.4 62.9 36.8 33.6 38.6 37.4 37.0Mauritius 45.4 39.3 42.5 39.8 38.6 54.5 60.7 57.4 60.2 61.4Namibia – – – – – – – – – –Nauru – – – – – – – – – –Papua New Guinea 79.5 75.1 73.2 77.9 73.3 18.8 23.2 25.5 20.8 25.7St Lucia 30.4 12.7 13.4 19.6 16.6 69.6 87.3 86.6 80.4 83.3St Vincent and the
Grenadines82.7 82.4 71.6 80.9 79.0 17.3 17.5 28.3 19.1 21.0
Samoa 66.0 61.3 61.7 58.7 66.1 31.4 34.5 35.7 39.0 30.9Seychelles 68.7 69.2 61.1 63.1 63.8 21.2 22.0 27.5 23.3 22.9Solomon Islands 65.2 58.4 62.9 62.8 65.2 17.1 20.4 22.9 25.3 24.3Swaziland – – – – – – – – – –Tonga 51.0 48.5 48.5 53.7 47.5 44.0 47.6 47.0 42.4 51.1Tuvalu 39.3 33.7 71.7 53.7 41.8 0.0 0.0 0.0 0.0 0.0Vanuatu 73.7 75.5 74.9 89.8 57.7 22.1 20.8 21.6 8.5 38.5Other countriesAlbania 66.8 66.0 69.6 69.7 71.4 31.0 33.4 29.6 29.4 27.7Armenia 42.9 39.7 37.5 34.3 35.4 57.0 60.2 62.4 65.6 64.5Bhutan – – – – – – – – – –Bosnia and
Herzegovina87.1 86.1 89.0 86.4 83.6 11.8 12.4 9.8 12.6 15.3
Cape Verde 85.4 84.2 83.8 83.7 85.5 13.7 14.9 15.1 15.3 13.7Congo, Republic of 65.8 56.6 62.6 59.7 51.1 32.9 41.9 35.7 38.4 47.3Costa Rica 65.5 65.7 63.4 65.5 65.1 34.2 33.9 32.1 32.9 33.2Djibouti 45.9 44.5 44.1 37.8 36.3 1.3 2.9 2.2 2.3 2.6Gabon 77.1 73.5 71.2 68.3 70.4 21.3 24.8 26.8 29.7 28.0Georgia 36.3 39.8 36.7 35.3 34.4 63.7 60.1 63.3 64.7 65.5Lebanon 63.2 63.7 63.9 62.1 59.7 35.3 35.3 35.2 37.3 39.7Macedonia, FYR 51.8 52.6 55.4 54.0 64.9 48.2 47.4 44.4 45.6 34.6Mauritania 54.1 55.0 49.3 52.2 52.0 34.8 35.1 41.2 37.9 39.8Moldova 37.0 36.4 37.2 37.5 38.2 62.9 63.4 62.6 62.4 61.7Mongolia 29.0 27.7 31.9 27.0 28.4 71.0 72.3 68.1 73.0 71.6Montenegro – – – – – – – – – –Panama 56.7 46.6 44.1 42.9 40.0 26.0 27.8 29.0 28.7 29.0São Tomé and
Príncipe85.5 86.2 77.0 71.7 84.2 – – – – –
Suriname 79.7 78.7 80.0 60.1 72.9 20.3 21.1 19.8 39.9 27.1Timor-Leste – – – – – – – – – –High-incomeCommonwealth countriesAntigua and Barbuda 66.7 64.8 63.0 50.0 55.5 4.2 4.6 4.5 4.3 5.0Bahamas, The 74.3 72.7 66.6 63.2 65.5 23.8 25.5 31.5 34.7 32.2Barbados 87.4 74.8 77.4 64.0 58.3 12.6 25.2 22.6 35.9 41.7Brunei Darussalam 65.9 66.1 64.8 62.7 57.9 33.9 33.7 35.0 37.2 42.0Cyprus 83.7 83.7 85.8 83.3 85.6 16.1 16.0 14.0 14.9 13.5
(continued)
97

Table 10. Main sources of merchandise imports (% of total imports) (continued)
Group/country High income economies Developing economies
2007 2008 2009 2010 2011 2007 2008 2009 2010 2011
Malta 90.9 90.4 90.1 88.8 85.1 9.1 9.0 9.5 9.9 10.7St Kitts and Nevis 86.4 84.4 86.9 85.1 32.0 13.0 14.9 12.2 14.1 67.6Trinidad and Tobago 55.0 53.3 54.5 59.6 48.5 44.9 46.6 45.3 40.2 51.4Other countriesBahrain 82.6 78.5 80.4 73.0 73.4 16.7 21.0 19.0 26.4 26.0Croatia 70.9 70.6 70.3 67.0 67.8 29.0 29.4 29.7 32.9 32.1Equatorial Guinea 70.4 60.6 61.8 57.6 68.4 – – – – –Estonia 68.4 65.7 63.1 68.4 68.0 31.6 34.3 36.9 31.6 32.0Iceland 87.5 85.3 82.7 76.0 78.9 12.5 14.6 17.3 23.2 20.4Ireland 90.3 90.5 89.0 88.5 88.6 7.7 7.5 9.0 9.5 9.5Kuwait 76.6 70.8 70.5 66.7 66.5 23.4 29.1 29.5 33.3 33.4Latvia 68.5 63.7 63.9 64.2 64.0 31.5 36.3 36.1 35.8 36.0Lithuania 67.3 55.9 55.3 52.4 52.6 32.7 44.0 44.7 47.6 47.4Luxembourg 80.6 80.2 79.5 89.0 90.3 18.9 19.5 19.0 10.6 9.7Norway 83.3 82.2 80.9 79.2 79.2 16.7 17.8 19.1 20.8 20.8Oman 80.0 78.7 77.6 80.6 77.4 20.0 21.3 22.3 19.3 22.6Qatar 81.1 76.7 76.4 83.0 80.2 18.9 23.3 22.7 15.8 18.6Slovenia 83.9 82.1 81.1 78.4 78.9 15.8 16.7 17.9 20.1 20.2Uruguay 29.5 27.7 26.5 28.0 29.3 70.2 72.1 73.3 71.8 70.5
Note: – = not availableSource: World Bank, World Development Indicators 2013, available at: http://databank.worldbank.org (accessed June 2013)
98

Tabl
e 11
. C
ompo
siti
on o
f mer
chan
dise
exp
orts
(% o
f tot
al e
xpor
ts)
Gro
up/c
ount
ryFo
odFu
elM
anuf
actu
res
Hig
h te
chno
logy
Agr
icul
tura
l raw
m
ater
ials
Ore
s an
d m
etal
ex
port
s
2009
2010
2011
2009
2010
2011
2009
2010
2011
2009
2010
2011
2009
2010
2011
2009
2010
2011
Mid
dle-
inco
me
Com
mon
wea
lth c
ount
ries
Bel
ize
69.9
60.9
53.5
28.0
36.2
42.9
1.4
1.4
1.6
0.4
––
0.7
1.4
1.9
0.0
0.0
0.0
Bo
tsw
ana
5.1
5.1
2.2
0.3
0.4
0.4
78.0
79.5
88.4
0.9
0.4
0.9
0.2
0.2
0.2
16.1
14.5
8.4
Do
min
ica
50.8
27.1
––
0.1
–40
.866
.0–
––
–0.
00.
0–
8.1
6.7
–Fi
ji70
.2–
–0.
2–
–24
.6–
–4.
5–
–3.
6–
–0.
9–
–G
rena
da–
––
––
––
––
––
––
––
––
–G
uyan
a67
.764
.860
.30.
00.
0–
7.9
7.2
12.1
0.0
0.5
0.1
6.2
5.3
5.3
18.0
22.5
22.2
Jam
aica
27.1
24.6
–17
.222
.7–
47.5
40.4
–0.
50.
6–
0.2
0.2
–8.
112
.0–
Kiri
bati
69.7
67.0
80.6
––
23.2
27.6
10.6
33.8
42.7
–4.
51.
35.
20.
0–
–Le
soth
o8.
9–
–0.
0–
–83
.7–
–0.
3–
3.5
––
0.1
––
Mal
dive
s97
.796
.296
.80.
10.
00.
00.
10.
1–
––
0.0
0.0
2.3
3.8
3.1
Mau
ritiu
s32
.737
.233
.20.
00.
00.
064
.260
.264
.51.
90.
70.
80.
90.
50.
50.
70.
40.
7N
amib
ia24
.025
.324
.70.
81.
31.
347
.244
.345
.41.
41.
21.
60.
40.
70.
726
.827
.827
.6N
auru
––
––
––
––
––
––
––
––
––
Pap
ua N
ew G
uine
a–
––
––
––
––
––
––
––
––
–St
Luc
ia–
––
––
––
––
––
––
––
––
–St
Vin
cent
and
the
Gre
nadi
nes
84.1
82.3
82.4
0.0
0.0
0.0
14.1
15.7
16.2
0.8
0.2
0.0
0.1
0.0
0.0
1.7
1.9
1.4
Sam
oa
21.4
21.0
31.6
0.1
0.0
0.0
69.6
78.3
65.3
0.3
0.2
0.2
0.4
0.4
0.3
0.2
0.3
0.7
Seyc
helle
s–
––
––
––
––
––
––
––
––
–So
lom
on
Isla
nds
32.9
28.5
19.7
––
–0.
10.
10.
32.
171
.8–
0.5
0.6
50.3
0.0
0.1
0.2
Swaz
iland
––
––
––
––
––
––
––
––
––
Tong
a85
.988
.664
.20.
10.
0–
10.2
7.6
11.1
0.1
––
2.0
2.0
22.2
1.5
1.5
2.2
Tuva
lu–
––
––
––
––
––
––
––
––
–V
anua
tu73
.583
.785
.30.
10.
20.
121
.111
.08.
2–
––
1.4
1.6
2.8
0.7
0.1
1.6
Oth
er c
ount
ries
Alb
ania
5.6
4.5
4.1
11.6
18.0
21.2
70.1
62.1
60.1
0.8
0.9
0.5
3.0
2.4
2.6
9.6
12.8
11.9
Arm
enia
19.9
16.7
19.2
0.1
3.1
8.4
32.5
24.2
21.3
2.2
1.8
2.6
0.9
1.1
0.1
46.5
52.5
51.0
Bhu
tan
6.1
7.2
8.5
42.5
1.2
1.3
41.1
69.5
68.6
0.2
0.1
–0.
10.
20.
210
.221
.921
.4B
osn
ia a
nd H
erze
govi
na7.
77.
36.
813
.115
.013
.860
.757
.057
.73.
32.
63.
06.
25.
96.
29.
512
.212
.9C
ape
Ver
de72
.681
.683
.7–
–0.
026
.717
.515
.3–
–0.
6–
––
0.7
0.9
0.9
Co
ngo,
Rep
ublic
of
0.4
0.5
–70
.767
.7–
27.5
30.5
–3.
73.
7–
1.4
1.3
––
––
Co
sta
Ric
a24
.734
.735
.20.
60.
60.
346
.060
.960
.444
.240
.040
.81.
92.
72.
60.
71.
11.
5D
jibo
uti
0.4
––
––
–90
.7–
–0.
1–
––
––
0.3
––
Gab
on
0.8
––
83.1
––
4.2
––
3.0
––
8.9
––
3.0
––
Geo
rgia
32.6
21.9
–5.
05.
7–
41.3
49.6
–3.
91.
8–
2.1
1.1
–18
.621
.4–
(con
tinue
d)
99

Tabl
e 11
. C
ompo
siti
on o
f mer
chan
dise
exp
orts
(% o
f tot
al e
xpor
ts) (
cont
inue
d)
Gro
up/c
ount
ryFo
odFu
elM
anuf
actu
res
Hig
h te
chno
logy
Agr
icul
tura
l raw
m
ater
ials
Ore
s an
d m
etal
ex
port
s
2009
2010
2011
2009
2010
2011
2009
2010
2011
2009
2010
2011
2009
2010
2011
2009
2010
2011
Leba
non
16.4
14.9
18.4
0.5
0.2
0.1
72.5
63.6
66.9
4.5
12.8
2.4
0.9
0.7
0.8
7.6
10.7
13.7
Mac
edo
nia,
FYR
18.2
16.3
14.1
1.1
7.7
8.4
50.9
68.1
70.9
2.9
3.9
0.5
0.5
0.6
3.0
7.4
5.9
Mau
ritan
ia23
.757
.820
.4–
–5.
1–
––
––
–0.
00.
10.
067
.830
.48.
8M
old
ova
74.2
72.0
70.1
0.4
0.3
0.7
22.7
22.6
22.1
4.6
8.3
6.3
0.7
1.0
1.0
2.1
4.1
6.0
Mo
ngo
lia–
––
––
––
––
––
––
––
––
–M
ont
eneg
ro–
––
––
––
––
––
––
––
––
–P
anam
a84
.872
.65.
50.
90.
30.
08.
513
.293
.51.
40.
835
.41.
02.
40.
24.
911
.50.
8S
ão T
om
é an
d P
rínci
pe92
.494
.6–
––
–3.
04.
7–
15.6
14.0
0.7
0.7
0.0
0.0
–Su
rinam
e2.
22.
41.
84.
513
.09.
02.
01.
93.
513
.912
.16.
50.
50.
50.
70.
30.
30.
4T
imo
r-Le
ste
––
––
––
––
––
––
––
––
––
Hig
h-in
com
eC
omm
onw
ealth
cou
ntrie
sA
ntig
ua a
nd B
arbu
da48
.350
.758
.7–
––
45.6
47.6
36.9
––
––
–2.
46.
11.
82.
0B
aham
as, T
he20
.125
.123
.50.
00.
00.
069
.663
.366
.60.
00.
00.
00.
60.
50.
99.
611
.09.
0B
arba
dos
38.7
32.9
31.5
5.2
0.0
7.4
52.7
64.0
58.1
9.8
12.1
13.7
0.2
0.5
0.3
1.6
1.2
1.1
Bru
nei D
arus
sala
m–
––
––
––
––
––
––
––
––
–C
ypru
s37
.134
.437
.70.
00.
00.
050
.450
.243
.330
.936
.927
.31.
41.
71.
911
.013
.717
.0M
alta
4.7
5.2
3.7
1.6
25.7
42.6
92.0
67.8
52.7
48.0
47.1
47.2
0.1
0.1
0.1
0.5
0.5
0.4
St K
itts
and
Nev
is10
.011
.511
.80.
00.
00.
089
.287
.287
.30.
01.
30.
10.
00.
00.
00.
00.
10.
1Tr
inid
ad a
nd T
oba
go3.
22.
5–
79.0
66.1
–15
.331
.0–
0.2
0.1
–0.
00.
0–
2.5
0.3
–O
ther
cou
ntrie
sB
ahra
in3.
41.
95.
968
.674
.31.
112
.65.
617
.30.
00.
10.
20.
00.
00.
415
.418
.175
.4C
roat
ia12
.811
.311
.512
.912
.312
.066
.467
.866
.99.
89.
27.
63.
63.
63.
93.
64.
55.
2Eq
uato
rial G
uine
a–
––
––
––
––
––
––
––
––
–Es
toni
a10
.19.
99.
016
.215
.616
.662
.462
.563
.65.
79.
313
.44.
35.
14.
12.
23.
12.
8Ic
elan
d43
.541
.442
.61.
01.
01.
919
.314
.614
.031
.420
.920
.90.
70.
60.
735
.142
.040
.3Ire
land
8.8
9.2
–0.
71.
2–
85.6
84.5
–24
.321
.2–
0.4
0.5
–0.
60.
8–
Kuw
ait
0.3
––
93.2
––
6.2
––
0.5
––
0.1
––
0.2
––
Latv
ia17
.316
.815
.25.
15.
38.
360
.758
.656
.87.
87.
68.
29.
912
.210
.22.
83.
74.
6Li
thua
nia
18.9
17.3
15.8
21.4
23.4
25.4
54.9
53.9
53.0
10.0
10.6
10.2
2.0
2.3
2.3
1.1
1.4
1.8
Luxe
mbo
urg
8.6
8.3
8.1
1.3
1.0
0.8
81.4
79.5
79.1
8.8
8.4
9.7
0.9
3.0
3.7
4.9
5.6
5.5
No
rway
6.6
7.2
6.4
63.0
63.8
67.9
21.0
18.2
15.4
15.8
16.2
18.5
0.5
0.5
0.5
5.3
6.4
6.1
Om
an3.
12.
52.
275
.077
.874
.410
.310
.512
.70.
30.
62.
6–
––
3.8
2.7
2.5
Qat
ar–
––
72.8
––
5.3
––
––
––
––
0.1
––
Slo
veni
a4.
24.
14.
13.
34.
35.
887
.185
.283
.56.
55.
75.
81.
91.
91.
83.
34.
44.
7U
rugu
ay64
.3–
–1.
4–
–25
.5–
–5.
8–
–8.
5–
–0.
3–
–
Not
e: –
= n
ot a
vaila
ble
Sou
rce:
Wo
rld B
ank,
Wor
ld D
evel
opm
ent I
ndic
ator
s 20
13, a
vaila
ble
at: h
ttp:
//da
taba
nk.w
orld
bank
.org
(acc
esse
d Ju
ne 2
013)
100

Tabl
e 12
. M
erch
andi
se im
port
s by
sel
ecte
d re
gion
s (%
sha
re o
f wor
ld im
port
s)
Gro
up/c
ount
ryEu
rope
an U
nion
NA
FTA
Chi
na (M
ainl
and)
2009
2010
2011
2012
2009
2010
2011
2012
2009
2010
2011
2012
Mid
dle-
inco
me
Com
mon
wea
lth c
ount
ries
Bel
ize
13.5
8.9
9.4
22.0
47.8
48.5
48.9
35.8
4.4
5.0
5.0
4.7
Do
min
ica
7.7
4.5
5.7
5.0
21.7
14.4
16.2
16.7
6.0
7.6
5.5
5.1
Fiji
3.2
1.9
4.2
1.9
2.9
3.2
2.6
3.3
7.7
8.6
8.9
10.7
Gre
nada
7.4
5.0
5.1
4.4
19.7
20.0
20.4
17.6
1.2
1.3
1.4
4.5
Guy
ana
12.1
8.5
8.8
8.0
27.0
24.5
23.5
24.0
5.6
6.4
8.3
12.4
Jam
aica
7.3
6.8
5.7
3.8
41.6
37.9
38.7
35.9
4.6
4.9
6.3
12.2
Kiri
bati
––
––
––
––
––
––
Mal
dive
s9.
37.
58.
18.
33.
03.
03.
82.
74.
45.
87.
26.
0M
aurit
ius
26.5
23.0
23.7
22.6
2.5
2.8
2.4
2.4
12.6
13.4
14.1
16.0
Nam
ibia
––
––
––
––
––
––
Nau
ru–
––
––
––
––
––
–P
apua
New
Gui
nea
4.8
4.2
4.8
6.9
7.2
5.1
5.4
5.2
14.8
7.7
7.0
7.9
St L
ucia
2.1
1.2
1.3
2.4
5.0
12.0
8.6
19.5
0.2
0.2
0.3
1.3
St V
ince
nt a
nd th
e G
rena
dine
s27
.115
.69.
37.
414
.916
.413
.920
.312
.512
.512
.35.
6S
amo
a1.
51.
61.
41.
46.
14.
75.
55.
512
.016
.78.
415
.8Se
yche
lles
29.1
28.4
26.7
30.1
4.1
1.3
2.0
2.3
1.8
1.6
3.4
3.0
Solo
mo
n Is
land
s2.
40.
91.
01.
72.
41.
41.
31.
46.
07.
76.
47.
1To
nga
3.3
1.0
1.2
1.2
9.7
13.2
10.6
10.5
5.9
5.1
7.2
10.3
Tuva
lu–
––
––
––
––
––
–V
anua
tu18
.11.
93.
80.
01.
32.
31.
415
.211
.32.
526
.720
.2O
ther
cou
ntrie
sA
lban
ia65
.465
.264
.965
.71.
71.
92.
42.
27.
46.
46.
57.
6A
rmen
ia27
.327
.428
.226
.44.
33.
74.
54.
18.
710
.89.
89.
4B
osn
ia a
nd H
erze
govi
na67
.364
.862
.863
.40.
00.
00.
00.
00.
60.
60.
50.
6C
ape
Ver
de77
.778
.182
.277
.32.
32.
31.
41.
21.
84.
35.
28.
0C
ong
o, R
epub
lic o
f48
.844
.740
.139
.910
.09.
46.
56.
711
.912
.012
.413
.4C
ost
a R
ica
8.0
8.0
7.6
6.1
49.6
54.1
55.6
55.9
6.2
7.3
8.0
6.0
Djib
out
i10
.47.
87.
76.
19.
45.
34.
23.
413
.918
.516
.024
.6G
abo
n55
.151
.756
.450
.29.
310
.76.
910
.27.
19.
28.
312
.7G
eorg
ia30
.127
.929
.128
.95.
53.
83.
76.
34.
06.
47.
48.
3Le
bano
n38
.435
.836
.337
.911
.311
.010
.311
.78.
99.
18.
18.
3M
aced
oni
a, F
YR52
.353
.172
.973
.82.
72.
31.
10.
75.
75.
31.
71.
6M
aurit
ania
44.2
44.4
40.6
41.8
3.1
3.9
8.2
8.5
12.6
12.3
12.2
13.0
Mo
ldo
va43
.544
.255
.554
.61.
71.
80.
90.
97.
58.
32.
12.
6M
ong
olia
11.6
8.5
8.1
7.4
5.5
4.1
6.4
10.5
24.7
41.7
43.3
37.7
(con
tinue
d)
101

Tabl
e 12
. M
erch
andi
se im
port
s by
sel
ecte
d re
gion
s (%
sha
re o
f wor
ld im
port
s) (c
onti
nued
)
Gro
up/c
ount
ryEu
rope
an U
nion
NA
FTA
Chi
na (M
ainl
and)
2009
2010
2011
2012
2009
2010
2011
2012
2009
2010
2011
2012
Mo
nten
egro
66.0
68.9
71.0
69.2
––
––
0.0
0.1
0.0
0.0
Pan
ama
6.6
6.6
7.4
8.4
34.2
32.5
29.6
28.5
4.2
5.3
6.1
6.4
São
To
mé
and
Prín
cipe
67.2
62.5
75.6
73.6
4.6
1.4
6.2
1.1
2.5
1.9
1.8
3.3
Surin
ame
22.9
9.6
23.7
24.4
32.2
0.7
27.0
27.2
6.3
0.5
8.2
9.9
Tim
or-
Lest
e–
––
––
––
––
––
–H
igh-
inco
me
Com
mon
wea
lth c
ount
ries
Ant
igua
and
Bar
buda
––
––
––
––
––
––
Bah
amas
, The
8.5
11.9
3.4
5.1
24.7
28.0
30.0
34.7
4.0
5.1
4.5
5.0
Bar
bado
s10
.88.
57.
48.
532
.323
.221
.530
.66.
53.
86.
05.
7B
rune
i Dar
ussa
lam
9.7
13.9
12.8
24.0
4.5
4.8
3.2
2.8
6.1
12.9
12.8
21.3
Cyp
rus
72.1
69.8
68.9
69.1
1.7
1.5
2.5
1.4
5.5
5.2
4.8
4.5
Mal
ta74
.871
.274
.177
.85.
04.
93.
82.
93.
72.
93.
12.
8St
Kitt
s an
d N
evis
19.7
20.2
4.3
7.9
45.7
41.5
15.2
12.7
0.3
0.6
0.4
0.2
Trin
idad
and
To
bago
11.3
10.3
7.7
9.0
38.1
40.5
34.3
39.1
4.0
5.2
3.7
4.2
Oth
er c
ount
ries
Bah
rain
28.3
17.6
17.3
17.2
8.4
12.5
11.1
10.1
5.7
7.6
7.6
9.5
Cro
atia
62.8
60.2
61.8
62.4
3.2
2.8
2.6
2.7
6.8
7.2
7.1
7.1
Equi
toria
l Gui
nea
––
––
––
––
––
––
Esto
nia
80.5
84.2
84.1
83.9
1.5
1.1
1.5
0.8
2.5
3.8
4.6
4.4
Icel
and
51.8
0.2
0.1
0.1
8.9
10.0
12.1
11.4
5.0
6.0
6.3
7.1
Irela
nd63
.865
.968
.066
.818
.014
.714
.014
.13.
84.
13.
73.
8K
uwai
t29
.822
.619
.921
.111
.814
.013
.112
.59.
08.
99.
79.
1La
tvia
––
––
––
––
––
––
Lith
uani
a59
.157
.157
.357
.21.
51.
01.
10.
92.
52.
52.
02.
1N
orw
ay66
.363
.362
.864
.38.
48.
99.
68.
67.
88.
59.
19.
3O
man
17.1
17.8
15.6
14.5
6.9
6.2
6.6
6.7
4.8
4.8
4.3
6.3
Qat
ar32
.331
.427
.026
.513
.215
.913
.414
.97.
94.
25.
44.
7U
rugu
ay11
.811
.712
.714
.010
.711
.812
.411
.49.
813
.515
.116
.4
Not
e: –
= n
ot a
vaila
ble
Sou
rces
: Dire
ctio
n o
f Tra
de S
tatis
tics
and
The
UK
Fed
erat
ion
Info
rmat
ion
Cen
tre,
ava
ilabl
e at
: htt
p://
esds
80.m
cc.a
c.uk
(acc
esse
d Ju
ne 2
013)
102

Table 13. Merchandise trade with Commonwealth countries
Group/country Total exports (% of world) Total imports (% of world)
2008 2009 2010 2011 2012 2008 2009 2010 2011 2012
Middle-incomeCommonwealth countriesBelize 34.6 39.3 36.2 32.4 35.3 8.9 7.7 9.9 12.0 13.7Botswana – – – – – – – – – –Dominica 37.0 50.8 45.3 39.5 38.5 17.5 27.2 22.0 32.4 29.8Fiji 46.8 46.9 42.9 45.6 41.5 74.3 69.9 72.6 70.6 69.3Grenada 78.5 74.1 81.5 80.4 74.7 54.0 54.9 58.7 59.2 59.5Guyana 52.2 55.5 48.0 49.6 49.5 33.4 34.8 34.7 38.0 33.4Jamaica 17.3 26.8 29.4 30.8 19.8 0.1 0.0 24.3 21.3 19.8Kiribati – – – – – – – – – –Maldives 29.1 36.9 49.6 34.0 29.1 54.5 54.5 51.6 48.6 47.7Mauritius 42.8 36.8 33.3 33.6 35.1 44.9 40.9 43.9 43.9 42.5Namibia – – – – – – – – – –Nauru – – – – – – – – – –Papua New Guinea 34.1 34.2 32.3 36.9 34.2 67.2 60.6 64.5 64.9 63.2St Lucia – – – – – – – – – –St Vincent and the
Grenadines31.3 30.6 42.0 55.9 71.7 48.6 38.7 51.6 55.1 63.2
Samoa 43.6 30.4 36.3 29.8 30.3 65.2 66.8 60.6 66.3 64.4Seychelles 32.5 33.7 30.6 28.4 25.4 31.9 24.7 26.7 22.5 20.0Solomon Islands 7.3 7.2 6.4 18.7 26.9 72.0 67.8 70.1 71.9 69.8Tonga 31.1 26.8 30.8 29.2 41.4 269.7 154.4 68.4 72.9 71.9Tuvalu – – – – – – – – – –Vanuatu 4.3 6.1 6.5 7.8 7.5 47.0 44.4 23.8 52.9 42.4Other countriesAlbania 0.2 0.2 1.0 2.8 2.9 2.1 2.3 3.0 3.2 2.4Armenia 6.1 5.7 4.0 6.5 8.7 4.3 4.1 4.5 5.1 4.5Bosnia and Herzegovina 1.5 1.0 0.9 1.7 1.4 0.7 0.7 0.8 0.7 0.6Cape Verde 11.9 0.6 0.7 5.4 4.8 2.6 2.2 3.6 1.4 1.6Congo, Republic of 5.7 9.3 12.0 12.1 13.4 15.7 15.8 17.2 18.7 14.8Costa Rica 6.0 6.7 7.5 7.8 17.0 3.8 3.9 4.7 4.1 3.7Djibouti 2.1 1.6 1.2 1.3 1.9 26.4 25.8 27.9 26.9 19.5Gabon 9.9 17.2 25.5 23.3 25.6 13.9 13.9 13.9 12.8 12.8Georgia 12.7 11.8 9.5 7.6 10.2 3.4 4.2 3.7 3.2 4.0Lao PDR 4.1 4.7 4.8 5.6 8.6 3.3 3.0 2.4 2.6 2.2Lebanon 7.7 7.9 15.7 25.0 23.3 8.2 7.7 6.9 6.6 7.2Macedonia, FYR 2.0 3.1 2.1 1.7 2.2 2.8 3.1 7.1 8.7 10.0Mauritania 4.3 5.0 4.8 3.9 4.7 10.9 9.0 11.2 10.5 7.5Moldova 3.6 5.0 5.6 2.8 3.8 2.6 3.1 2.8 1.8 1.8Mongolia 13.5 14.7 9.9 7.2 4.7 4.3 4.7 5.3 4.9 3.9Montenegro 1.6 1.9 2.5 1.8 3.5 2.5 3.3 2.9 2.9 3.4Nicaragua 0.0 0.0 7.3 8.8 11.3 0.0 0.0 2.7 2.7 2.7Panama 7.3 4.5 13.8 20.4 21.0 2.4 1.7 1.7 1.8 1.6São Tomé and Príncipe 17.0 8.3 10.3 14.6 14.7 3.3 9.3 19.9 5.0 4.4Suriname 43.6 38.2 44.3 30.7 25.3 22.9 27.2 32.6 13.2 12.2Timor-Leste – – – – – – – – – –High-incomeCommonwealth countriesAntigua and Barbuda – – – – – – – – – –Bahamas, The 26.1 22.3 18.8 31.6 33.7 9.6 12.2 24.7 30.8 34.8Barbados 68.0 65.7 55.8 62.7 69.9 37.2 42.7 38.1 35.7 50.1Brunei Darussalam 18.7 23.0 21.3 22.6 24.6 62.0 63.0 58.3 56.4 61.5
(continued)
103

Table 13. Merchandise trade with Commonwealth countries (continued)
Group/country Total exports (% of world) Total imports (% of world)
2008 2009 2010 2011 2012 2008 2009 2010 2011 2012
Cyprus 13.8 13.2 14.2 15.3 15.4 12.9 12.5 11.6 11.0 9.5Malta 21.0 20.4 13.1 9.1 8.4 20.9 19.8 20.0 12.7 12.6St Kitts and Nevis – – – – – – – – – –Trinidad and Tobago 18.6 22.9 22.7 18.6 16.6 15.2 15.6 17.2 13.7 14.4Other countriesBahrain 11.5 8.1 7.1 7.6 8.5 12.0 12.9 13.8 13.4 12.3Equatorial Guinea 1.3 6.1 9.2 8.8 9.8 8.0 5.5 7.5 6.6 5.8Estonia 4.7 7.6 3.5 3.9 4.2 3.7 3.1 3.0 4.9 4.7Iceland 13.7 15.6 13.0 12.0 13.7 11.6 11.0 10.0 8.6 9.0Ireland 22.6 20.1 19.7 19.5 20.9 41.2 39.5 41.1 43.4 42.9Kuwait 29.3 28.2 25.2 27.0 26.5 14.6 14.7 17.1 16.5 13.0Latvia 5.2 4.9 5.3 4.6 4.9 2.5 2.8 3.3 4.0 3.3Lithuania 8.7 7.2 7.8 6.3 7.3 2.5 2.3 2.1 2.6 2.9Norway 31.3 27.8 31.3 31.5 28.2 12.0 11.0 12.6 13.0 12.1Oman 7.6 15.2 15.4 16.7 12.3 14.3 15.9 12.8 13.0 16.4Qatar 19.8 22.7 22.4 25.8 23.7 12.6 13.0 13.1 15.5 15.2Uruguay 5.5 6.3 5.5 4.8 5.3 11.0 8.8 9.7 8.2 7.2
Note: – = not availableSource: IMF, Direction of Trade Statistics Yearbook 2013, available at: http://esds80.mcc.ac.uk (accessed June 2013)
104

Tabl
e 14
. Ex
port
cha
ract
eris
tics
Gro
up/c
ount
ryN
umbe
r of p
rodu
cts
expo
rted
Div
ersi
ficat
ion
inde
xC
once
ntra
tion
inde
x
2008
2009
2010
2011
2008
2009
2010
2011
2008
2009
2010
2011
Mid
dle-
inco
me
Com
mon
wea
lth c
ount
ries
Bel
ize
145
227
189
870.
574
0.50
10.
535
0.73
60.
460
0.16
40.
382
0.36
0B
ots
wan
a25
425
418
615
80.
883
0.86
00.
800
0.89
10.
642
0.49
50.
595
0.78
3D
om
inic
a14
1624
200.
734
0.73
20.
743
0.71
00.
424
0.41
40.
407
0.37
9Fi
ji24
124
325
325
60.
734
0.73
40.
724
0.72
60.
224
0.21
10.
174
0.18
8G
rena
da16
232
2527
0.63
40.
656
0.64
00.
680
0.27
70.
224
0.23
50.
190
Guy
ana
220
7797
840.
822
0.82
90.
828
0.86
50.
322
0.37
70.
395
0.44
0Ja
mai
ca12
312
922
114
50.
781
0.76
10.
757
0.70
40.
556
0.37
10.
425
0.41
6K
iriba
ti97
1195
990.
701
0.74
30.
718
0.73
40.
665
0.71
10.
760
0.79
4Le
soth
o20
2123
630.
876
0.88
00.
881
0.83
40.
449
0.42
80.
437
0.32
6M
aldi
ves
164
4138
154
0.76
10.
818
0.82
30.
727
0.75
10.
746
0.75
20.
671
Mau
ritiu
s23
117
022
923
60.
725
0.70
70.
714
0.70
90.
249
0.26
00.
245
0.24
6N
amib
ia25
721
321
922
30.
792
0.75
60.
764
0.76
40.
271
0.22
50.
223
0.22
3N
auru
––
–14
0.76
80.
662
–0.
722
0.95
70.
839
–0.
910
Pap
ua N
ew G
uine
a13
612
913
213
80.
808
0.82
40.
815
0.81
20.
342
0.35
70.
371
0.34
5St
Luc
ia19
610
010
092
0.58
30.
622
0.62
10.
617
0.26
80.
299
0.30
40.
316
St V
ince
nt a
nd th
e G
rena
dine
s36
3425
240.
671
0.84
60.
782
0.82
30.
770
0.67
30.
529
0.63
1S
amo
a12
313
913
147
0.68
20.
729
0.77
80.
731
0.78
60.
672
0.74
40.
579
Seyc
helle
s20
056
7667
0.74
30.
838
0.81
50.
838
0.45
20.
521
0.45
80.
523
Solo
mo
n Is
land
s23
2126
330.
849
0.85
40.
862
0.84
20.
646
0.68
00.
728
0.61
5Sw
azila
nd16
916
619
019
00.
733
0.71
50.
729
0.75
00.
214
0.23
10.
242
0.24
3To
nga
88
151
152
0.55
60.
654
0.69
00.
657
0.27
70.
296
0.26
30.
232
Tuva
lu78
––
10.
550
0.54
00.
589
0.65
20.
303
0.17
20.
350
0.68
2V
anua
tu27
2816
160.
761
0.82
90.
822
0.82
60.
629
0.66
10.
795
0.63
2O
ther
cou
ntrie
sA
lban
ia24
724
624
218
80.
651
0.59
60.
698
0.65
80.
159
0.15
60.
191
0.20
1A
rmen
ia23
122
423
124
00.
719
0.74
40.
744
0.75
80.
256
0.21
80.
228
0.20
6B
huta
n48
5072
870.
777
0.64
30.
786
0.80
70.
447
0.44
80.
269
0.32
2B
osn
ia24
925
325
125
30.
585
0.61
10.
578
0.62
40.
115
0.10
60.
108
0.10
7C
ape
Ver
de21
136
1632
0.67
50.
699
0.73
50.
717
0.33
30.
372
0.48
40.
469
Co
ngo,
Rep
ublic
of
9410
712
012
60.
774
0.78
40.
792
0.80
60.
806
0.79
40.
762
0.78
5C
ost
a R
ica
246
246
245
246
0.68
20.
713
0.68
30.
748
0.26
70.
309
0.36
20.
471
Djib
out
i21
417
520
621
40.
670
0.64
80.
622
0.60
20.
419
0.41
20.
300
0.24
0G
abo
n10
794
137
150
0.83
60.
850
0.84
10.
821
0.73
60.
724
0.73
50.
750
Geo
rgia
152
223
160
190
0.74
30.
738
0.70
50.
689
0.21
70.
180
0.21
50.
185
Leba
non
254
249
250
226
0.61
90.
629
0.61
90.
640
0.10
40.
106
0.09
80.
123
(con
tinue
d)
105

Tabl
e 14
. Ex
port
cha
ract
eris
tics
(con
tinu
ed)
Gro
up/c
ount
ryN
umbe
r of p
rodu
cts
expo
rted
Div
ersi
ficat
ion
inde
xC
once
ntra
tion
inde
x
2008
2009
2010
2011
2008
2009
2010
2011
2008
2009
2010
2011
Mac
edo
nia,
FYR
197
241
217
198
0.68
20.
628
0.65
20.
623
0.23
10.
253
0.18
60.
168
Mau
ritan
ia16
216
818
918
70.
760
0.78
70.
805
0.82
00.
469
0.45
10.
484
0.48
2M
old
ova
227
175
178
187
0.67
50.
682
0.67
10.
640
0.17
30.
145
0.13
60.
133
Mo
ngo
lia13
511
412
713
10.
836
0.83
60.
845
0.84
20.
408
0.42
40.
489
0.52
2M
ont
eneg
ro20
911
711
711
60.
701
0.70
20.
670
0.75
60.
418
0.38
50.
371
0.38
9P
anam
a25
225
424
825
00.
615
0.60
50.
586
0.57
00.
167
0.19
60.
132
0.16
1S
ão T
om
é an
d P
rínci
pe12
810
415
0.59
90.
692
0.63
00.
611
0.56
50.
392
0.43
70.
586
Surin
ame
207
122
203
131
0.76
90.
839
0.83
50.
780
0.44
60.
518
0.45
30.
484
Tim
or-
Lest
e6
48
187
0.83
90.
779
0.77
10.
746
0.72
70.
755
0.45
70.
419
Hig
h-in
com
eC
omm
onw
ealth
cou
ntrie
sA
ntig
ua a
nd B
arbu
da22
523
023
676
0.65
70.
519
0.52
00.
526
0.43
90.
287
0.14
00.
121
Bah
amas
, The
210
201
8220
00.
775
0.79
20.
799
0.78
70.
396
0.44
90.
419
0.58
2B
arba
dos
241
243
231
218
0.56
80.
504
0.57
00.
660
0.20
70.
143
0.13
30.
321
Bru
nei D
arus
sala
m13
812
913
512
50.
824
0.84
50.
846
0.83
60.
677
0.66
50.
674
0.67
6C
ypru
s25
124
024
824
40.
514
0.42
80.
503
0.52
10.
172
0.14
50.
162
0.23
5M
alta
212
204
177
174
0.61
40.
631
0.61
50.
659
0.38
60.
385
0.28
20.
412
St K
itts
and
Nev
is19
2119
818
30.
683
0.66
70.
685
0.67
00.
369
0.35
30.
340
0.32
8Tr
inid
ad a
nd T
oba
go24
825
020
119
90.
738
0.77
10.
749
0.73
60.
367
0.40
30.
360
0.35
5O
ther
cou
ntrie
sB
ahra
in25
124
525
324
40.
716
0.68
80.
705
0.70
90.
394
0.33
90.
341
0.34
2Eq
uato
rial G
uine
a36
123
3013
10.
761
0.77
70.
737
0.74
90.
769
0.73
60.
819
0.70
5Es
toni
a25
225
525
325
50.
436
0.44
30.
462
0.48
80.
100
0.11
80.
108
0.15
0Ic
elan
d21
221
622
021
90.
758
0.77
90.
827
0.77
60.
422
0.40
60.
456
0.45
2Ire
land
251
252
252
250
0.60
90.
658
0.67
30.
690
0.22
50.
249
0.26
00.
260
Kuw
ait
247
246
227
234
0.78
90.
799
0.80
70.
788
0.70
40.
689
0.72
30.
738
Latv
ia25
125
225
225
20.
464
0.46
30.
475
0.45
10.
079
0.07
70.
081
0.09
2Lu
thia
nia
254
252
253
253
0.49
10.
483
0.48
70.
479
0.20
20.
169
0.18
80.
209
Luxe
mbo
urg
258
257
257
257
0.55
20.
521
0.54
50.
554
0.16
40.
122
0.12
30.
131
No
rway
253
253
256
253
0.60
90.
616
0.62
80.
618
0.41
70.
379
0.38
80.
403
Om
an24
324
421
823
70.
718
0.70
20.
683
0.67
10.
624
0.54
90.
458
0.59
3Q
atar
246
240
226
215
0.79
90.
775
0.79
60.
787
0.54
60.
516
0.48
60.
537
Uru
guay
188
181
203
209
0.66
10.
659
0.68
20.
674
0.19
70.
189
0.18
10.
200
Not
e: –
= n
ot a
vaila
ble
Sou
rce:
Uni
ted
Nat
ions
Co
nfer
ence
on
Trad
e an
d D
evel
opm
ent d
atab
ase,
ava
ilabl
e at
: htt
p://
unct
adst
at.u
ncta
d.o
rg (a
cces
sed
29 J
uly
2013
)
106

Tabl
e 15
. S
elec
ted
indi
cato
rs o
f ope
nnes
s an
d in
stab
ility
Gro
up/c
ount
ryM
erch
andi
se e
xpor
ts
(% o
f GD
P)M
erch
andi
se im
port
(%
of G
DP)
Cur
rent
acc
ount
bal
ance
(%
of G
DP)
Expo
rt in
stab
ility
m
easu
re
2009
2010
2011
2012
2009
2010
2011
2012
2009
2010
2011
2012
2003
–200
720
08–2
012
Mid
dle-
inco
me
Com
mon
wea
lth c
ount
ries
Bel
ize
15.8
58.4
65.6
–17
.657
.965
.3–
−6.1
−3.3
−1.4
–4.
819.
85B
ots
wan
a37
.035
.442
.344
.848
.842
.947
.950
.3−4
.50.
3–
−5.5
5.55
4.00
Do
min
ica
32.5
35.8
34.9
–54
.955
.254
.7–
−21.
3−1
7.4
−17.
5−1
1.5
11.1
629
.19
Fiji
45.6
53.9
47.5
49.4
59.1
63.2
58.1
60.4
−7.8
−11.
4–
–12
.72
3.31
Gre
nada
22.6
21.8
23.6
–46
.849
.150
.2–
−24.
3−2
8.2
−26.
6−2
7.2
8.84
18.4
8G
uyan
a46
.350
.1–
–67
.672
.7–
–−8
.2−7
.1–
−13.
99.
766.
20Ja
mai
ca34
.431
.330
.9–
52.3
49.5
53.8
–−9
.4−7
.0−1
4.3
−12.
86.
586.
14K
iriba
ti8.
9–
––
93.9
––
––
––
–3.
372.
64Le
soth
o45
.644
.046
.846
.511
2.4
110.
610
5.9
108.
0−2
.9−2
0.2
−21.
4–
6.76
4.14
Mal
dive
s86
.394
.110
9.2
105.
874
.679
.310
5.3
106.
8−1
7.2
−10.
0−2
3.9
−27.
04.
413.
39M
aurit
ius
49.0
52.5
53.5
54.7
58.3
63.8
66.4
66.6
−7.4
−10.
4−1
2.6
−11.
27.
697.
61N
amib
ia47
.347
.645
.242
.656
.155
.052
.248
.7−1
.41.
0−1
.2–
3.61
5.57
Nau
ru–
––
––
––
––
––
––
–P
apua
New
Gui
nea
57.8
55.9
53.2
51.0
57.0
53.1
50.2
47.8
−7.4
−6.7
––
3.31
5.33
St L
ucia
46.6
52.4
46.2
–55
.565
.567
.9–
−11.
9−1
5.1
−22.
5–
9.39
13.4
3St
Vin
cent
and
the
Gre
nadi
nes
28.5
27.0
26.9
–57
.657
.155
.9–
−29.
3−3
1.6
−30.
2–
11.3
116
.18
Sam
oa
33.2
34.7
31.7
–58
.063
.658
.9–
−1.5
−10.
8−1
2.2
–5.
608.
20Se
yche
lles
46.3
40.5
45.6
–93
.610
1.2
99.1
–−9
.7−1
9.5
−21.
4–
4.47
25.3
3So
lom
on
Isla
nds
36.6
31.1
25.0
26.1
51.3
61.5
47.9
43.1
−21.
4−3
1.0
−7.2
–2.
952.
81Sw
azila
nd58
.855
.966
.659
.375
.471
.374
.771
.2−1
3.1
−10.
0–
–15
.24
9.57
Tong
a14
.013
.217
.9–
63.8
58.0
60.6
–−1
7.0
––
–7.
258.
32Tu
valu
––
––
––
––
––
––
––
Van
uatu
49.1
46.6
44.7
–56
.352
.750
.3–
1.7
−12.
3−1
5.2
–5.
799.
75O
ther
cou
ntrie
sA
lban
ia28
.432
.433
.834
.453
.553
.956
.054
.6−1
5.3
−11.
4−1
2.1
−10.
02.
7911
.03
Arm
enia
15.5
20.8
23.7
25.0
43.0
45.3
48.6
48.9
−15.
8−1
4.7
−11.
1−1
0.6
3.82
4.60
Bhu
tan
45.7
39.8
34.6
32.1
62.2
58.4
52.7
53.2
−1.6
−9.0
−20.
5–
1.58
8.80
Bo
snia
and
Her
zego
vina
31.7
35.5
41.9
44.1
54.4
56.1
64.3
66.7
−6.6
−5.5
−9.6
−9.4
2.77
7.74
Cap
e V
erde
35.6
38.6
42.2
43.5
67.9
67.1
72.6
69.3
−15.
5−1
3.0
−16.
0−1
1.0
2.99
7.49
Co
ngo,
Rep
ublic
of
70.4
85.1
87.3
87.4
50.2
54.7
34.8
53.6
––
––
3.12
3.17
Co
sta
Ric
a42
.338
.037
.237
.541
.740
.241
.542
.3−2
.0−3
.5−5
.3−5
.35.
2911
.97
Djib
out
i38
.137
.332
.7–
55.1
43.7
52.5
–−6
.8–
––
10.1
612
.46
Gab
on
––
––
––
––
––
––
2.32
–G
eorg
ia29
.735
.036
.339
.548
.952
.854
.958
.3−1
0.6
−10.
3−1
2.8
−11.
52.
915.
07
(con
tinue
d)
107

Tabl
e 15
. S
elec
ted
indi
cato
rs o
f ope
nnes
s an
d in
stab
ility
(con
tinu
ed)
Gro
up/c
ount
ryM
erch
andi
se e
xpor
ts
(% o
f GD
P)M
erch
andi
se im
port
(%
of G
DP)
Cur
rent
acc
ount
bal
ance
(%
of G
DP)
Expo
rt in
stab
ility
m
easu
re
2009
2010
2011
2012
2009
2010
2011
2012
2009
2010
2011
2012
2003
–200
720
08–2
012
Leba
non
20.6
22.2
23.7
23.6
48.4
50.2
50.4
49.3
−19.
5−2
0.4
−12.
1–
6.40
9.25
Mac
edo
nia,
FYR
39.2
46.6
54.5
58.4
61.0
65.3
74.1
78.9
−6.5
−2.1
−3.0
−4.0
––
Mau
ritan
ia45
.056
.364
.758
.060
.069
.374
.894
.3–
––
–1.
683.
92M
old
ova
36.9
39.2
44.9
45.7
73.5
78.5
86.0
86.1
−8.2
−7.7
−11.
3−7
.0–
–M
ong
olia
50.3
54.7
62.3
50.9
57.5
62.4
86.8
76.9
−7.5
−14.
3−3
1.5
−32.
72.
412.
87M
ont
eneg
ro32
.134
.740
.241
.465
.463
.166
.265
.0−2
9.6
−24.
6−1
9.6
−18.
20.
007.
01P
anam
a81
.276
.269
.179
.063
.668
.871
.975
.2−0
.7−1
0.3
−14.
3−9
.04.
015.
94S
ão T
om
é an
d P
rínci
pe10
.012
.111
.5–
52.3
64.3
57.4
–−4
0.1
−43.
6−4
3.5
−37.
714
.42
4.63
Surin
ame
43.4
53.5
57.9
54.4
43.1
38.1
48.6
47.2
2.9
14.9
5.8
5.1
2.72
5.41
Tim
or-
Lest
e2.
02.
41.
6–
35.5
32.7
33.4
–16
3.1
190.
522
6.3
–1.
233.
26H
igh-
inco
me
Com
mon
wea
lth c
ount
ries
Ant
igua
and
Bar
buda
46.6
46.1
47.7
–58
.659
.957
.3–
−13.
9−1
4.1
−10.
7−6
.716
.22
12.4
2B
aham
as, T
he39
.940
.943
.644
.847
.749
.457
.462
.9−1
0.5
−10.
5−1
4.0
−17.
58.
197.
68B
arba
dos
60.6
47.3
––
64.6
52.4
––
−7.2
−5.3
––
4.46
11.2
5B
rune
i Dar
ussa
lam
72.8
81.4
81.3
81.4
35.8
32.9
29.1
31.2
37.1
––
–4.
215.
56C
ypru
s40
.340
.1–
–45
.646
.6–
–−1
0.5
−10.
0−4
.7−6
.65.
5211
.01
Mal
ta78
.888
.295
.1–
79.0
84.8
90.4
–−7
.9−4
.9−0
.51.
04.
568.
33St
Kitt
s an
d N
evis
23.9
27.9
30.5
–48
.946
.942
.1–
−24.
9−1
9.2
−8.6
−9.5
6.98
7.42
Trin
idad
and
To
bago
51.9
58.6
––
38.2
33.3
––
8.3
19.9
––
2.67
2.33
Oth
er c
ount
ries
Bah
rain
81.3
––
–58
.8–
––
2.9
3.4
––
3.39
6.17
Cro
atia
36.6
39.7
42.3
43.3
40.1
40.3
42.4
43.4
−4.9
−1.5
−0.7
−0.4
5.12
8.52
Esto
nia
65.1
79.4
91.5
92.5
59.3
72.7
87.6
92.0
3.6
2.9
2.2
−1.9
3.16
4.98
Icel
and
52.8
56.4
59.1
59.2
44.2
46.3
50.6
52.9
−11.
6−8
.1−6
.2−4
.84.
239.
34Ire
land
90.8
100.
810
4.9
108.
374
.682
.082
.984
.1−2
.21.
11.
24.
95.
7516
.85
Kuw
ait
59.5
60.1
65.9
–29
.426
.321
.1–
26.8
30.8
40.1
–2.
414.
48La
tvia
43.9
53.8
58.8
–45
.455
.262
.7–
8.8
3.0
−2.2
−1.7
2.80
6.29
Lith
uani
a54
.668
.677
.5–
56.1
69.6
79.0
–4.
00.
0−1
.4−0
.53.
245.
10Lu
xem
bour
g16
3.5
172.
417
6.5
170.
913
1.4
140.
314
5.3
140.
57.
08.
47.
15.
73.
2010
.35
No
rway
40.0
40.5
41.5
40.7
27.7
28.5
28.2
27.5
12.1
12.0
13.7
14.4
3.82
7.26
Om
an52
.6–
––
41.5
––
–−1
.310
.114
.3–
3.24
5.17
Qat
ar47
.1–
––
31.5
––
––
–30
.0–
2.23
3.09
Slo
veni
a58
.465
.471
.2–
57.0
64.9
70.2
–−0
.7−0
.6–
2.3
3.56
8.37
Uru
guay
28.3
27.2
27.2
26.3
27.4
26.3
27.7
29.7
−1.5
−2.2
−3.1
−5.4
3.40
6.13
Not
e: –
= n
ot a
vaila
ble
Sou
rces
: Wo
rld B
ank,
Wor
ld D
evel
opm
ent I
ndic
ator
s 20
13, a
vaila
ble
at: h
ttp:
//da
taba
nk.w
orld
bank
.org
; UN
CTA
D S
tatis
tics,
dat
a av
aila
ble
at: h
ttp:
//un
ctad
stat
.unc
tad.
org
/Rep
ort
Fold
ers/
repo
rtFo
lder
s.as
px?s
CS
_ref
erer
=&sC
S_C
hose
nLan
g=en
(acc
esse
d Ju
ne 2
013)
108

Tabl
e 16
. M
igra
tion
and
rem
itta
nces
Gro
up/c
ount
ryM
igra
nts’
rem
itta
nces
(US
$ m
illio
n)Re
mit
tanc
es a
s %
sha
re o
f GD
PN
et m
igra
tion
2009
2010
2011
2012
2009
2010
2011
2012
2009
2010
2011
2012
Mid
dle-
inco
me
Com
mon
wea
lth c
ount
ries
Bel
ize
80.3
79.5
77.5
82.7
66
55
–−9
727,
596
–B
ots
wan
a10
9.9
62.6
62.6
54.9
10
00
–18
,730
20,0
00–
Do
min
ica
25.4
26.3
26.7
26.2
55
56
––
Fiji
153.
815
8.0
158.
016
4.7
65
44
–−2
8,75
4−2
8,72
0–
Gre
nada
53.4
53.4
54.9
58.5
44
47
–−5
,000
−4,2
74–
Guy
ana
267.
037
3.1
373.
139
6.7
1317
14–
–−4
0,00
0−3
2,77
0–
Jam
aica
1,90
8.4
2,04
3.6
2,12
2.7
2,15
7.7
1615
1514
–−1
00,0
00−8
,000
–K
iriba
ti–
––
––
––
––
–−1
,000
–Le
soth
o54
7.9
610.
164
9.3
601.
932
2826
27–
−19,
998
−19,
998
–M
aldi
ves
4.5
3.2
3.0
3.0
00
00
–−5
3−5
3–
Mau
ritiu
s21
1.2
226.
424
9.0
246.
60
00
2–
00
–N
amib
ia13
.215
.315
.4–
00
0–
––
−3,3
36–
Nau
ru–
––
––
––
––
––
–P
apua
New
Gui
nea
12.0
10.8
10.8
8.9
00
00
–0
0–
St L
ucia
30.5
31.5
32.1
31.0
22
23
–−1
,000
40–
St V
ince
nt a
nd th
e G
rena
dine
s33
.233
.333
.935
.74
44
5–
−5,0
00−5
,000
–S
amo
a11
9.5
122.
113
9.1
128.
524
2122
21–
−15,
738
−12,
690
–Se
yche
lles
16.1
17.4
25.5
25.9
22
23
––
−1,5
51–
Solo
mo
n Is
land
s2.
51.
71.
92.
20
00
0–
0−1
1,86
8–
Swaz
iland
93.5
54.7
54.7
46.9
31
11
–−6
,000
−6,0
00–
Tong
a71
.571
.571
.574
.322
1917
16–
−8,1
96−8
,078
–Tu
valu
––
––
––
––
––
––
Van
uatu
11.5
11.8
21.8
19.4
22
33
––
0–
Oth
er c
ount
ries
Alb
ania
1,31
8.5
1,15
6.0
1,16
1.8
1,03
5.1
1110
99
–−4
7,88
9−5
0,00
2–
Arm
enia
769.
599
5.8
1,29
5.1
1,44
9.4
911
2013
–−7
5,00
0−5
0,00
1–
Bhu
tan
4.9
8.3
10.4
9.8
01
11
–16
,829
10,0
00–
Bo
snia
and
Her
zego
vina
2,13
2.9
1,82
4.2
1,95
9.2
1,86
2.6
1211
1111
–−1
0,00
0−5
,000
–C
ape
Ver
de13
8.1
132.
517
8.1
176.
89
89
9–
−17,
279
−17,
215
–C
ong
o, R
epub
lic o
f–
––
––
––
––
49,8
72−4
5,36
3–
Co
sta
Ric
a51
3.1
551.
754
0.5
521.
62
11
1–
75,6
0064
,260
–D
jibo
uti
32.5
32.6
32.4
31.5
––
––
–0
−15,
996
–G
abo
n–
––
––
––
––
5,00
05,
000
–G
eorg
ia71
4.3
806.
11,
109.
81,
060.
810
1011
8–
−150
,000
−125
,007
–
(con
tinue
d)
109

Tabl
e 16
. M
igra
tion
and
rem
itta
nces
(con
tinu
ed)
Gro
up/c
ount
ryM
igra
nts’
rem
itta
nces
(US
$ m
illio
n)Re
mit
tanc
es a
s %
sha
re o
f GD
PN
et m
igra
tion
2009
2010
2011
2012
2009
2010
2011
2012
2009
2010
2011
2012
Leba
non
7,55
8.1
7,65
2.9
7,53
0.8
7,47
1.8
2220
1818
–−1
2,50
050
0,00
1–
Mac
edo
nia,
FYR
381.
238
7.9
433.
739
2.9
44
44
–2,
000
−4,9
99–
Mau
ritan
ia–
––
––
––
––
9,90
0−2
,000
–M
old
ova
1,21
0.8
1,36
3.5
1,61
1.7
1,77
0.4
––
–23
–−1
71,7
48–
Mo
ngo
lia19
9.6
276.
527
9.4
288.
14
43
3–
−15,
001
−15,
001
–M
ont
eneg
ro30
2.0
300.
834
3.1
327.
27
78
8–
−2,5
08−2
,500
–P
anam
a33
6.2
410.
038
4.1
472.
31
21
1–
11,0
0028
,575
–S
ão T
om
é an
d P
rínci
pe2.
06.
46.
96.
5–
–−6
,496
–Su
rinam
e4.
84.
33.
93.
60
00
––
−4,9
98−5
,000
–T
imo
r-Le
ste
––
––
1415
12–
–−4
9,93
0−7
5,00
0–
Hig
h-in
com
eC
omm
onw
ealth
cou
ntrie
sA
ntig
ua a
nd B
arbu
da24
.023
.924
.221
.72
22
2–
–−5
6–
Bah
amas
, The
––
––
––
––
–6,
440
9,67
2–
Bar
bado
s11
4.5
81.9
81.9
84.3
22
22
–0
1,99
8–
Bru
nei D
arus
sala
m–
––
––
––
––
3,50
01,
760
–C
ypru
s15
0.3
142.
513
1.3
109.
81
11
1–
44,1
6635
,000
–M
alta
52.9
36.3
37.0
33.1
10
00
–5,
000
4,51
2–
St K
itts
and
Nev
is43
.551
.852
.441
.85
76
7–
––
–Tr
inid
ad a
nd T
oba
go10
9.3
90.9
90.9
94.6
10
00
–−1
9,80
6−1
5,00
0–
Oth
er c
ount
ries
Bah
rain
––
––
––
––
–44
7,85
622
,081
–C
roat
ia1,
270.
61,
287.
41,
378.
41,
389.
12
22
2–
10,0
00−2
0,00
0–
Esto
nia
306.
332
0.1
406.
639
4.3
22
22
–0
0–
Icel
and
23.5
24.9
27.0
35.2
00
00
–10
,417
5,42
9–
Irela
nd57
2.8
658.
275
5.5
742.
10
00
0–
100,
000
50,0
00–
Kuw
ait
––
––
––
––
–27
7,62
929
9,99
9–
Latv
ia59
1.1
613.
569
5.2
731.
82
32
2–
−10,
000
−10,
000
–Li
thua
nia
1,23
9.4
1,67
3.6
1,95
6.4
1,38
6.8
35
55
–−3
5,49
5−2
8,39
4–
Luxe
mbo
urg
1,63
1.6
1,63
9.4
1,75
6.2
1,64
1.8
33
33
–42
,469
25,6
02–
No
rway
631.
568
0.0
765.
075
5.7
00
00
–17
1,23
214
9,99
7–
Om
an39
.039
.039
.039
.00
00
0–
153,
003
1,02
9,93
8–
Qat
ar–
––
–0
––
857,
090
499,
998
–S
love
nia
277.
330
8.9
433.
153
5.6
11
11
–22
,000
22,0
00–
Uru
guay
101.
110
2.9
101.
598
.5–
––
––
−50,
000
−30,
000
–
Not
e: –
= n
ot a
vaila
ble
Sou
rce:
Wo
rld B
ank,
Wor
ld D
evel
opm
ent I
ndic
ator
s 20
13, a
vaila
ble
at: h
ttp:
//da
taba
nk.w
orld
bank
.org
(acc
esse
d Ju
ne 2
013)
.
110

Table 17. Fish production
Group/country Catches (’000 metric tonnes)
2002 2003 2004 2005 2006 2007 2008 2009 2010
Middle-incomeCommonwealth countriesBelize 54.7 19.1 16.8 41.3 26.0 30.6 43.9 14.6 114.0Botswana 0.1 0.1 0.2 0.1 0.1 0.1 0.1 0.1 0.0Dominica 1.2 1.0 0.7 0.6 0.7 0.7 0.7 0.8 1.0Fiji 40.3 37.2 50.2 45.0 50.4 48.1 45.7 41.5 41.0Grenada 2.2 2.5 2.0 2.1 2.2 2.4 2.4 2.6 2.0Guyana 48.0 60.3 57.3 54.0 54.4 48.1 42.5 44.1 45.0Jamaica 7.8 15.5 18.0 18.8 25.9 22.2 19.1 19.0 15.0Kiribati 36.7 33.7 35.0 35.6 34.5 35.2 29.1 42.0 45.0Lesotho – – – – – – – – –Maldives 163.4 155.4 158.5 186.2 184.3 144.4 133.3 116.9 95.0Mauritius 10.7 11.0 10.3 10.3 9.1 8.3 6.9 8.1 8.0Namibia 626.2 637.8 571.9 554.2 509.8 413.7 373.4 370.1 370.0Nauru 0.0 0.0 0.3 0.3 0.3 0.3 0.2 0.2 0.0Papua New Guinea 174.6 215.9 243.2 254.7 253.7 247.9 222.8 230.1 225.0St Lucia 1.6 4.8 8.8 1.8 4.8 5.2 3.9 4.0 2.0St Vincent and the
Grenadines44.5 4.8 8.6 1.7 4.7 5.3 3.8 – 66.0
Samoa 7.1 4.5 9.9 9.8 12.4 14.1 13.9 13.3 3.0Seychelles 63.6 87.1 101.8 109.5 93.4 65.9 69.5 81.5 87.0Solomon Islands 25.9 35.9 35.2 30.4 39.7 31.4 26.4 28.1 35.0Swaziland 0.1 0.1 0.1 0.1 0.1 0.1 0.1 0.1 0.0Tonga 5.3 4.8 3.4 2.7 3.1 3.2 2.6 2.1 2.0Tuvalu 0.6 1.5 2.5 2.6 2.6 2.6 2.6 4.2 11.0Vanuatu 45.0 58.4 210.7 227.4 224.1 211.2 171.5 144.7 98.0Other countriesAlbania 4.5 4.3 6.1 6.5 7.7 7.5 7.4 8.1 6.0Armenia 1.5 1.6 1.0 1.0 1.4 4.7 5.7 5.9 1.0Bhutan 0.3 0.3 0.3 0.3 0.2 0.2 0.2 0.2 0.0Bosnia and Herzegovina 2.0 2.0 8.4 9.1 9.6 9.6 9.6 9.6 2.0Cape Verde 8.2 8.1 10.4 21.6 24.6 18.3 23.8 16.8 20.0Congo, Republic of 51.9 53.9 57.1 54.7 59.1 59.2 54.2 61.3 65.0Costa Rica 33.0 49.9 45.6 46.4 42.0 47.5 48.8 46.5 22.0Djibouti 0.3 1.1 1.2 1.6 1.3 1.2 1.2 1.1 1.0Gabon 41.6 45.6 46.2 43.9 41.6 38.6 30.1 30.1 32.0Georgia 1.8 3.3 12.1 10.0 9.8 18.4 26.7 25.3 31.0Lebanon 4.0 3.9 4.7 4.6 4.6 4.6 4.6 4.6 4.0Macedonia, FYR 0.2 0.2 1.2 1.1 0.7 1.2 1.5 1.8 0.0Mauritania 156.1 199.7 270.7 304.9 165.3 223.2 195.3 178.5 276.0Moldova 0.6 0.4 5.0 5.0 5.6 5.9 6.1 6.3 2.0Mongolia 0.3 0.2 0.3 0.4 0.3 0.2 0.1 0.1 0.0Montenegro – – – – 3.0 3.0 3.0 3.0 1.0Panama 229.7 233.9 215.9 252.8 266.8 230.4 233.5 228.5 163.0São Tomé and Príncipe 3.7 4.0 4.1 4.2 4.2 4.3 4.3 4.3 5.0Suriname 27.2 32.7 30.7 27.7 30.8 29.7 23.8 25.9 34.0Timor-Leste 0.8 1.3 1.7 2.2 2.6 3.3 4.2 4.7 3.0High-incomeCommonwealth countriesAntigua and Barbuda 2.4 2.6 2.5 3.0 3.1 3.1 3.5 2.5 –Bahamas, The 12.3 12.7 11.4 11.1 10.7 8.4 9.2 9.1 12.0Barbados 2.5 2.8 2.1 2.2 2.0 2.2 3.6 3.5 3.0Brunei Darussalam 2.1 2.2 3.1 2.9 2.5 2.9 2.8 2.8 2.0Cyprus 2.0 1.8 3.7 4.3 4.8 5.0 5.4 4.8 1.0Malta 1.1 1.1 2.0 2.1 2.4 3.8 3.0 4.1 2.0St Kitts and Nevis 0.4 1.5 1.5 1.4 1.5 1.6 1.7 1.9 21.0Trinidad and Tobago 18.8 14.6 14.7 18.1 13.1 13.1 13.8 13.9 14.0
(continued)
111

Table 17. Fish production (continued)
Group/country Catches (’000 metric tonnes)
2002 2003 2004 2005 2006 2007 2008 2009 2010
Other countriesBahrain 13.6 14.5 14.5 11.9 15.6 15.0 14.2 16.4 13.0Croatia 21.2 20.0 40.5 45.8 51.4 53.1 61.1 69.2 53.0Equatorial Guinea 3.5 3.6 3.5 3.8 4.0 4.5 5.4 7.7 7.0Estonia 102.6 80.2 88.9 100.1 87.6 100.2 103.3 99.1 95.0Iceland 2149.5 2008.7 1764.0 1694.0 1356.3 1425.9 1311.7 1169.6 1 061Ireland 318.7 301.2 368.6 357.2 294.4 301.5 279.7 345.8 319.0Kuwait 5.4 4.1 5.2 5.2 6.2 4.7 4.7 4.7 4.0Latvia 113.7 114.5 125.9 151.2 141.0 156.0 158.5 163.7 165.0Lithuania 150.2 157.2 164.7 141.8 156.8 190.9 185.8 176.1 150.0Luxembourg – – – – – – – – –Norway 2922.9 2702.2 3309.5 3208.4 3114.2 3356.7 3279.7 3486.3 2 675Oman 142.7 138.5 165.5 157.5 147.8 151.8 152.0 158.7 164.0Qatar 7.2 11.3 11.1 13.9 16.4 15.2 17.7 14.1 14.0Slovenia 1.7 1.3 2.6 2.6 2.5 2.5 2.2 2.3 1.0Uruguay 108.8 117.3 123.0 125.9 134.0 108.8 108.8 81.5 74.0
Note: – = not availableSource: Food and Agriculture Organisation, Yearbook of Fishery Statistics, available at: www.fao.org (accessed June 2013)
112

Table 18. Energy production, consumption and trade
Group/country Primary energy production (thousand
tonnes of oil equivalent)
Commercial energy consumption (thousand tonnes of oil equivalent)
Net energy imports (% of total energy
consumption)
2009 2010 2011 2009 2010 2011 2009 2010 2011
Middle-incomeCommonwealth countriesBelize – – – – – – – – –Botswana 936 1,096 979 2,023 2,263 2,215 54 52 56Dominica – – – – – – – – –Fiji – – – – – – – – –Grenada – – – – – – – – –Guyana – – – – – – – – –Jamaica 534 464 549 3,022 2,830 3,066 82 84 82Kiribati – – – – – – – – –Lesotho – – – – – – – – –Maldives – – – – – – – – –Mauritius – – – – – – – – –Namibia 327 317 334 1,497 1,552 1,589 78 80 79Nauru – – – – – – – – –Papua New Guinea – – – – – – – – –St Lucia – – – – – – – – –St Vincent and the Grenadines – – – – – – – – –Samoa – – – – – – – – –Seychelles – – – – – – – – –Solomon Islands – – – – – – – – –Swaziland – – – – – – – – –Tonga – – – – – – – – –Tuvalu – – – – – – – – –Vanuatu – – – – – – – – –Other countriesAlbania 1,252 1,622 1,486 2,068 2,059 2,173 39 21 32Armenia 832 878 887 2,610 2,483 2,716 68 65 67Bhutan – – – – – – – – –Bosnia and Herzegovina 4,426 4,374 4,621 6,161 6,451 7,095 28 32 35Cape Verde – – – – – – – – –Congo, Republic of 15,300 17,371 16,672 1,416 1,511 1,659 −981 −1,050 −905Costa Rica 2,367 2,436 2,412 4,561 4,646 4,655 48 48 48Djibouti – – – – – – – – –Gabon 13,587 14,322 14,273 1,925 1,984 1,997 −606 −622 −615Georgia 1,185 1,312 1,117 3,096 3,122 3,543 62 58 68Lebanon 187 207 206 6,652 6,382 6,349 97 97 97Macedonia, FYR 1,607 1,616 1,784 2,811 2,883 3,122 43 44 43Mauritania – – – – – – – – –Moldova 130 130 123 3,171 3,426 3,331 96 96 96Mongolia 7,833 14,686 19,310 3,252 3,454 3,607 −141 −325 −435Montenegro 614 891 791 994 1,174 1,179 38 24 33Panama 843 843 818 3,367 3,710 4,058 75 77 80São Tomé and Príncipe – – – – – – – – –Suriname – – – – – – – – –Timor-Leste – – – – – – – – –High-incomeCommonwealth countriesAntigua and Barbuda – – – – – – – – –Bahamas, The – – – – – – – – –Barbados – – – – – – – – –Brunei Darussalam 18,939 18,573 18,695 3,043 3,240 3,832 −522 −473 −388Cyprus 83 89 96 2,525 2,443 2,368 97 96 96
(continued)
113

Table 18. Energy production, consumption and trade (continued)
Group/country Primary energy production (thousand
tonnes of oil equivalent)
Commercial energy consumption (thousand tonnes of oil equivalent)
Net energy imports (% of total energy
consumption)
2009 2010 2011 2009 2010 2011 2009 2010 2011
Malta 2 3 48 777 848 857 100 100 94St Kitts and Nevis – – – – – – – – –Trinidad and Tobago 43,254 44,171 42,163 20,277 21,370 20,918 −113 −107 −102Other countriesBahrain 17,548 17,725 18,081 9,340 9,472 9,506 −88 −87 −90Croatia 4,068 4,219 3,786 8,722 8,564 8,439 53 51 55Equatorial Guinea – – – – – – – – –Estonia 4,158 4,930 5,038 4,749 5,568 5,603 12 11 10Iceland 4,402 4,429 4,804 5,384 5,369 5,731 18 18 16Ireland 1,521 1,932 1,788 14,364 14,219 13,216 89 86 86Kuwait 130,568 134,653 154,345 30,815 32,586 32,523 −324 −313 −375Latvia 2,097 2,114 2,074 4,403 4,644 4,371 52 54 53Lithuania 4,392 1,519 1,534 8,766 7,052 7,287 50 78 79Luxembourg 114 123 116 3,956 4,220 4,171 97 97 97Norway 214,677 203,457 195,353 29,775 32,338 28,137 −621 −529 −594Oman 67,198 72,140 73,508 18,279 23,158 25,276 −268 −212 −191Qatar 142,464 178,345 211,229 24,942 28,973 33,285 −471 −516 −535Slovenia 3,665 3,729 3,764 7,097 7,230 7,249 48 48 48Uruguay 1,520 2,054 1,865 4,134 4,174 4,430 63 51 58
Note: – = not availableSource: World Bank, World Development Indicators 2013, available at: http://databank.worldbank.org (accessed June 2013)
114

Tabl
e 19
. En
ergy
con
sum
ptio
n an
d ca
rbon
em
issi
ons
Gro
up/c
ount
ry
Ener
gy u
se/c
apit
a
(kg
of o
il eq
uiva
lent
)
Ener
gy u
se in
tens
ity
(k
g of
oil
equi
vale
nt
per $
1,00
0 G
DP)
Elec
tric
pow
er
cons
umpt
ion
per
capi
ta (K
WH
)To
tal C
O2
emis
sion
s (k
t)
CO
2 em
issi
ons
inte
nsit
y
(kg
per 2
005
U
S$
of G
DP)
2009
2010
2011
2009
2010
2011
2009
2010
2011
2009
2010
2009
2010
Mid
dle-
inco
me
Com
mon
wea
lth c
ount
ries
Bel
ize
––
––
––
––
–41
442
20
0B
ots
wan
a1,
036
1,14
91,
115
8688
811,
531
1,61
71,
603
4,39
75,
233
00
Do
min
ica
––
––
––
––
–12
813
60
0Fi
ji–
––
––
––
––
847
1,29
10
0G
rena
da–
––
––
––
––
253
260
00
Guy
ana
––
––
––
––
–1,
555
1,70
12
2Ja
mai
ca1,
121
1,04
81,
133
––
–1,
905
1,22
21,
549
8,59
27,
158
––
Kiri
bati
––
––
––
––
–40
620
1Le
soth
o–
––
––
––
––
2618
00
Mal
dive
s–
––
––
––
––
1,06
71,
074
11
Mau
ritiu
s–
––
––
––
––
3,86
54,
118
11
Nam
ibia
698
712
717
120
117
113
1,54
01,
474
1,54
93,
183
3,17
60
0N
auru
––
––
––
––
––
––
–P
apua
New
Gui
nea
––
––
––
––
–3,
333
3,13
51
0St
Luc
ia–
––
––
––
––
385
403
00
St V
ince
nt a
nd th
e G
rena
dine
s–
––
––
––
––
202
209
00
Sam
oa
––
––
––
––
–16
116
10
0Se
yche
lles
––
––
––
––
–75
570
41
1So
lom
on
Isla
nds
––
––
––
––
–19
820
20
0Sw
azila
nd–
––
––
––
––
1,02
31,
023
00
Tong
a–
––
––
––
––
172
158
11
Tuva
lu–
––
––
––
––
––
––
Van
uatu
––
––
––
––
–11
711
70
0O
ther
cou
ntrie
sA
lban
ia65
665
468
987
8486
1,70
71,
801
2,02
23,
880
4,28
30
0A
rmen
ia87
983
891
617
616
417
11,
616
1,67
61,
755
4,35
34,
221
11
Bhu
tan
––
––
––
––
–38
947
70
0
(con
tinue
d)
115

Tabl
e 19
. En
ergy
con
sum
ptio
n an
d ca
rbon
em
issi
ons
(con
tinu
ed)
Gro
up/c
ount
ry
Ener
gy u
se/c
apit
a
(kg
of o
il eq
uiva
lent
)
Ener
gy u
se in
tens
ity
(k
g of
oil
equi
vale
nt
per $
1,00
0 G
DP)
Elec
tric
pow
er
cons
umpt
ion
pe
r cap
ita
(KW
H)
Tota
l CO
2
emis
sion
s (k
t)
CO
2 em
issi
ons
inte
nsit
y
(kg
per 2
005
U
S$
of G
DP)
2009
2010
2011
2009
2010
2011
2009
2010
2011
2009
2010
2009
2010
Bo
snia
and
Her
zego
vina
1,59
91,
677
1,84
822
123
025
02,
803
3,04
03,
189
30,5
9031
,125
22
Cap
e V
erde
––
––
––
––
–31
235
60
0C
ong
o, R
epub
lic o
f35
436
839
310
098
104
150
146
172
1,88
52,
028
00
Co
sta
Ric
a99
199
598
398
9591
1,81
31,
851
1,84
47,
818
7,77
00
0D
jibo
uti
––
––
––
––
–53
253
9–
–G
abo
n1,
267
1,27
51,
253
103
9994
1,00
497
490
781
2,57
40
0G
eorg
ia70
270
179
016
215
416
41,
585
1,74
31,
918
6,05
86,
241
11
Leba
non
1,56
61,
470
1,44
913
312
011
63,
093
3,47
63,
499
20,9
1720
,403
11
Mac
edo
nia,
FYR
1,33
81,
371
1,48
415
115
115
93,
370
3,52
13,
881
11,4
0810
,873
22
Mau
ritan
ia–
––
––
––
––
2,21
12,
215
11
Mo
ldo
va88
996
293
534
133
727
61,
741
1,72
31,
470
4,54
74,
855
11
Mo
ngo
lia1,
217
1,27
31,
310
347
346
308
1,43
11,
555
1,57
711
,052
11,5
113
3M
ont
eneg
ro1,
605
1,89
31,
900
159
183
178
5,00
25,
414
5,74
71,
822
2,58
21
1P
anam
a93
11,
009
1,08
582
8383
1,66
31,
732
1,82
98,
636
9,63
30
0S
ão T
om
é an
d P
rínci
pe–
––
––
––
––
9299
11
Surin
ame
––
––
––
––
–2,
468
2,38
41
1T
imo
r-Le
ste
––
––
––
––
–18
318
30
0H
igh-
inco
me
Com
mon
wea
lth c
ount
ries
Ant
igua
and
Bar
buda
––
––
––
––
–49
951
30
1B
aham
as, T
he–
––
––
––
––
1,64
32,
464
00
Bar
bado
s–
––
––
––
––
1,62
41,
503
1B
rune
i Dar
ussa
lam
7,71
58,
089
9,42
717
217
820
78,
605
8,54
88,
507
9,09
49,
160
11
Cyp
rus
2,31
62,
213
2,12
112
211
711
34,
609
4,62
34,
271
8,14
17,
708
00
Mal
ta1,
876
2,03
92,
058
8590
894,
418
4,15
64,
685
2,49
72,
589
00
St K
itts
and
Nev
is–
––
––
––
––
260
249
00
Trin
idad
and
To
bago
15,3
3216
,091
15,6
9165
268
668
95,
721
5,95
26,
332
48,1
7750
,682
33
Oth
er c
ount
ries
––
––
Bah
rain
7,83
87,
568
7,35
336
235
234
69,
045
9,89
510
,018
24,1
6924
,202
11
Cro
atia
1,96
91,
938
1,97
112
212
212
03,
712
3,81
43,
901
21,5
5520
,884
00
(con
tinue
d)
116

Tabl
e 19
. En
ergy
con
sum
ptio
n an
d ca
rbon
em
issi
ons
(con
tinu
ed)
Gro
up/c
ount
ry
Ener
gy u
se/c
apit
a
(kg
of o
il eq
uiva
lent
)
Ener
gy u
se in
tens
ity
(k
g of
oil
equi
vale
nt
per $
1,00
0 G
DP)
Elec
tric
pow
er
cons
umpt
ion
pe
r cap
ita
(KW
H)
Tota
l CO
2
emis
sion
s (k
t)
CO
2 em
issi
ons
inte
nsit
y
(kg
per 2
005
U
S$
of G
DP)
2009
2010
2011
2009
2010
2011
2009
2010
2011
2009
2010
2009
2010
Equa
toria
l Gui
nea
––
––
––
4,62
04,
679
00
Esto
nia
3,54
34,
155
4,18
221
924
823
15,
950
6,46
46,
256
14,7
4518
,339
11
Icel
and
16,9
0516
,882
17,9
6449
651
553
551
,259
51,4
4052
,374
2,05
41,
962
00
Irela
nd3,
221
3,17
82,
888
8786
796,
050
6,02
75,
701
40,6
2340
,000
00
Kuw
ait
10,8
1210
,893
10,4
0825
527
626
016
,351
16,7
5916
,122
81,8
6993
,696
11
Latv
ia1,
953
2,07
42,
124
151
162
145
2,87
53,
026
3,26
66,
824
7,61
60
0Li
thua
nia
2,62
52,
146
2,40
517
413
813
43,
431
3,27
13,
528
12,5
7813
,561
00
Luxe
mbo
urg
7,94
68,
324
8,04
611
712
111
814
,424
16,8
3415
,530
10,2
4910
,829
00
No
rway
6,16
66,
614
5,68
113
114
112
223
,860
24,8
9123
,174
47,0
7757
,187
00
Om
an6,
863
8,26
28,
356
278
334
363
5,70
25,
890
6,29
240
,264
57,2
021
1Q
atar
15,9
4716
,559
17,4
1923
723
624
014
,476
15,0
7515
,755
66,1
2070
,531
11
Slo
veni
a3,
479
3,52
93,
531
140
141
140
6,10
36,
521
6,80
615
,310
15,3
280
0U
rugu
ay1,
230
1,23
81,
309
106
9898
2,66
22,
805
2,81
07,
891
6,64
50
0
Not
e: –
= n
ot a
vaila
ble
Sou
rce:
Wo
rld B
ank,
Wor
ld D
evel
opm
ent I
ndic
ator
s 20
13, a
vaila
ble
at: h
ttp:
//da
taba
nk.w
orld
bank
.org
(acc
esse
d Ju
ne 2
013)
117

Table 20. Tourist arrivals and earnings
Group/countryNumber of tourist arrivals
(’000)Tourist receipts
(US$ million)
Tourist receipts as a proportion of total export
earnings (%)
2009 2010 2011 2009 2010 2011 2009 2010 2011
Middle-incomeCommonwealth countriesBelize 232 242 250 256 264 253 35.2 31.8 26.8Botswana 2,103 2,145 – 230 222 5.9 4.4 –Dominica 75 77 76 86 96 98 54.9 56.5 58.9Fiji 542 632 675 607 713 599 46.2 42.5 –Grenada 114 110 118 99 97 105 56.8 57.7 57.0Guyana 141 152 157 35 80 – 3.7 7.1 –Jamaica 1,831 1,922 1,952 2,070 2,095 2,060 51.3 52.3 48.1Kiribati 4 5 5 3 – – – – –Lesotho 320 414 397 30 25 26 3.9 2.7 2.1Maldives 656 792 931 1,366 1,713 1,868 85.1 85.3 80.3Mauritius 871 935 965 1,390 1,585 1,813 33.3 32.0 30.5Namibia 980 984 – 511 560 645 13.4 11.4 12.1Nauru – – – – – – – – –Papua New Guinea 126 146 165 2 3 4 0.0 0.0 –St Lucia 278 306 312 296 329 317 54.4 52.3 56.7St Vincent and the
Grenadines75 72 74 88 86 90 45.8 46.8 48.3
Samoa 122 122 121 115 124 135 66.4 63.6 68.2Seychelles 158 175 194 349 352 378 33.8 35.5 34.6Solomon Islands 18 21 23 50 65 – 21.3 19.8 –Swaziland 908 868 879 40 51 – 2.3 2.5 –Tonga 51 45 46 17 – – 40.1 – –Tuvalu 2 2 1 – – – – – –Vanuatu 99 97 94 214 242 252 70.5 73.8 71.2Other countriesAlbania 1,856 2,417 2,932 2,014 1,780 1,833 65.8 53.5 48.5Armenia 575 684 758 374 456 485 28.0 23.5 20.4Bhutan 23 41 66 51 64 76 8.9 10.5 10.2Bosnia and
Herzegovina311 365 392 753 662 719 17.5 13.5 12.6
Cape Verde 287 336 428 349 387 438 61.6 60.8 55.9Congo, Republic of 94 101 – – – – – – –Costa Rica 1,923 2,100 2,192 2,001 2,179 2,374 20.7 20.6 20.5Djibouti – – – 16 18 19 4.1 4.4 4.8Gabon – – – – – – – – –Georgia 1,500 2,032 2,822 537 737 1,059 16.9 18.3 20.2Lebanon 1,844 2,168 1,655 7,157 8,184 7,070 33.9 39.3 28.1Macedonia, FYR 259 262 327 232 209 250 7.7 5.8 5.2Mauritania – – – – – – – – –Moldova 7 8 11 240 232 262 14.0 11.7 9.6Mongolia 411 457 – 253 288 258 11.0 8.5 4.7Montenegro 1,044 1,088 1,201 705 713 826 52.4 49.1 45.1Panama 1,200 1,324 1,473 2,280 2,552 2,925 13.0 13.5 12.1São Tomé and Príncipe 15 8 – 8 11 16 42.3 45.7 54.2Suriname 151 205 220 70 69 69 4.1 3.0 2.6Timor-Leste 44 40 51 16 26 21 24.2 26.4 21.1High-incomeCommonwealth countriesAntigua and Barbuda 234 230 241 305 298 312 54.3 56.9 58.1Bahamas, The 1,327 1,370 1,346 2,025 2,159 2,269 66.1 67.6 66.0Barbados 519 532 568 1,122 1,074 – 59.6 51.9 –
(continued)
118

Table 20. Tourist arrivals and earnings (continued)
Group/countryNumber of tourist arrivals
(’000)Tourist receipts
(US$ million)
Tourist receipts as a proportion of total export
earnings (%)
2009 2010 2011 2009 2010 2011 2009 2010 2011
Brunei Darussalam 157 214 242 254 – – 3.1 – –Cyprus 2,141 2,173 2,392 2,474 2,371 2,724 26.2 24.9 25.5Malta 1,182 1,336 1,412 1,117 1,257 1,480 16.3 15.6 16.0St Kitts and Nevis 93 92 – 83 90 93 49.0 45.2 40.8Trinidad and Tobago 419 386 – 548 630 – 5.5 5.2 –Other countriesBahrain 8,861 11,952 6,732 1,873 2,163 1,766 11.9 12.1 7.7Croatia 8,694 9,111 9,927 9,308 8,255 9,614 40.7 35.5 36.6Equatorial Guinea – – – – – – – – –Estonia 2,059 2,372 2,665 1,445 1,412 1,683 11.7 9.5 8.3Iceland 494 489 566 547 560 750 8.6 7.9 9.0Ireland 7,189 7,134 7,630 8,458 8,187 9,629 4.2 3.9 4.2Kuwait 297 207 269 660 527 525 1.0 0.7 0.5Latvia 1,323 1,373 1,493 1,013 963 1,098 9.2 7.6 6.8Lithuania 1,341 1,507 1,775 1,102 1,097 1,417 5.5 4.4 4.3Luxembourg 849 793 871 4,148 4,100 4,807 5.7 5.1 5.3Norway 4,346 4,767 4,963 4,957 5,814 6,399 3.3 3.4 3.2Oman 1,280 1,048 1,092 1,246 1,612 3.7 3.2 3.3Qatar 1,659 1,519 2,527 – – 4,463 – – 3.7Slovenia 1,824 1,869 2,037 2,735 2,721 2,920 9.5 8.8 8.1Uruguay 2,055 2,353 2,857 1,451 1,649 2,375 16.8 15.5 18.7
Note: – = not availableSource: World Bank, World Development Indicators 2013, available at: http://databank.worldbank.org (accessed June 2013)
119
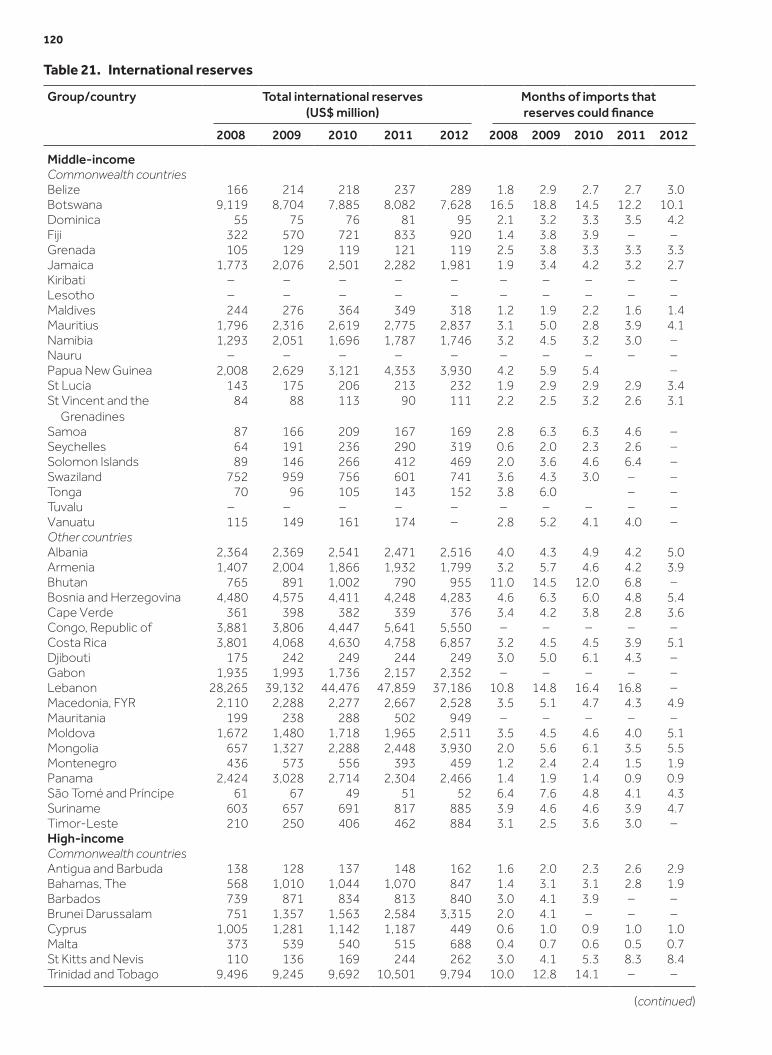
Table 21. International reserves
Group/country Total international reserves (US$ million)
Months of imports that reserves could finance
2008 2009 2010 2011 2012 2008 2009 2010 2011 2012
Middle-incomeCommonwealth countriesBelize 166 214 218 237 289 1.8 2.9 2.7 2.7 3.0Botswana 9,119 8,704 7,885 8,082 7,628 16.5 18.8 14.5 12.2 10.1Dominica 55 75 76 81 95 2.1 3.2 3.3 3.5 4.2Fiji 322 570 721 833 920 1.4 3.8 3.9 – –Grenada 105 129 119 121 119 2.5 3.8 3.3 3.3 3.3Jamaica 1,773 2,076 2,501 2,282 1,981 1.9 3.4 4.2 3.2 2.7Kiribati – – – – – – – – – –Lesotho – – – – – – – – – –Maldives 244 276 364 349 318 1.2 1.9 2.2 1.6 1.4Mauritius 1,796 2,316 2,619 2,775 2,837 3.1 5.0 2.8 3.9 4.1Namibia 1,293 2,051 1,696 1,787 1,746 3.2 4.5 3.2 3.0 –Nauru – – – – – – – – – –Papua New Guinea 2,008 2,629 3,121 4,353 3,930 4.2 5.9 5.4 –St Lucia 143 175 206 213 232 1.9 2.9 2.9 2.9 3.4St Vincent and the
Grenadines84 88 113 90 111 2.2 2.5 3.2 2.6 3.1
Samoa 87 166 209 167 169 2.8 6.3 6.3 4.6 –Seychelles 64 191 236 290 319 0.6 2.0 2.3 2.6 –Solomon Islands 89 146 266 412 469 2.0 3.6 4.6 6.4 –Swaziland 752 959 756 601 741 3.6 4.3 3.0 – –Tonga 70 96 105 143 152 3.8 6.0 – –Tuvalu – – – – – – – – – –Vanuatu 115 149 161 174 – 2.8 5.2 4.1 4.0 –Other countriesAlbania 2,364 2,369 2,541 2,471 2,516 4.0 4.3 4.9 4.2 5.0Armenia 1,407 2,004 1,866 1,932 1,799 3.2 5.7 4.6 4.2 3.9Bhutan 765 891 1,002 790 955 11.0 14.5 12.0 6.8 –Bosnia and Herzegovina 4,480 4,575 4,411 4,248 4,283 4.6 6.3 6.0 4.8 5.4Cape Verde 361 398 382 339 376 3.4 4.2 3.8 2.8 3.6Congo, Republic of 3,881 3,806 4,447 5,641 5,550 – – – – –Costa Rica 3,801 4,068 4,630 4,758 6,857 3.2 4.5 4.5 3.9 5.1Djibouti 175 242 249 244 249 3.0 5.0 6.1 4.3 –Gabon 1,935 1,993 1,736 2,157 2,352 – – – – –Lebanon 28,265 39,132 44,476 47,859 37,186 10.8 14.8 16.4 16.8 –Macedonia, FYR 2,110 2,288 2,277 2,667 2,528 3.5 5.1 4.7 4.3 4.9Mauritania 199 238 288 502 949 – – – – –Moldova 1,672 1,480 1,718 1,965 2,511 3.5 4.5 4.6 4.0 5.1Mongolia 657 1,327 2,288 2,448 3,930 2.0 5.6 6.1 3.5 5.5Montenegro 436 573 556 393 459 1.2 2.4 2.4 1.5 1.9Panama 2,424 3,028 2,714 2,304 2,466 1.4 1.9 1.4 0.9 0.9São Tomé and Príncipe 61 67 49 51 52 6.4 7.6 4.8 4.1 4.3Suriname 603 657 691 817 885 3.9 4.6 4.6 3.9 4.7Timor-Leste 210 250 406 462 884 3.1 2.5 3.6 3.0 –High-incomeCommonwealth countriesAntigua and Barbuda 138 128 137 148 162 1.6 2.0 2.3 2.6 2.9Bahamas, The 568 1,010 1,044 1,070 847 1.4 3.1 3.1 2.8 1.9Barbados 739 871 834 813 840 3.0 4.1 3.9 – –Brunei Darussalam 751 1,357 1,563 2,584 3,315 2.0 4.1 – – –Cyprus 1,005 1,281 1,142 1,187 449 0.6 1.0 0.9 1.0 1.0Malta 373 539 540 515 688 0.4 0.7 0.6 0.5 0.7St Kitts and Nevis 110 136 169 244 262 3.0 4.1 5.3 8.3 8.4Trinidad and Tobago 9,496 9,245 9,692 10,501 9,794 10.0 12.8 14.1 – –
(continued)
120

Table 21. International reserves (continued)
Group/country Total international reserves (US$ million)
Months of imports that reserves could finance
2008 2009 2010 2011 2012 2008 2009 2010 2011 2012
Other countriesBahrain 4,051 4,008 5,299 4,774 5,205 2.0 3.1 3.8 2.3 –Croatia 12,957 14,895 14,133 14,484 14,807 4.0 6.3 6.3 5.9 6.5Equatorial Guinea 4,431 3,252 2,346 3,054 4,397 – – – – –Estonia 3,972 3,981 2,567 207 287 2.3 3.7 2.0 0.1 0.2Iceland 3,571 3,883 5,789 8,548 4,085 3.1 5.5 8.2 9.9 5.4Ireland 1,039 2,151 2,114 1,695 1,386 0.0 0.1 0.1 0.1 0.1Kuwait 19,321 23,028 24,805 29,682 28,886 5.5 8.3 8.2 8.9 9.1Latvia 5,244 6,902 7,606 6,378 7,111 3.0 7.6 6.6 4.1 4.4Lithuania 6,443 6,623 6,598 8,202 8,218 2.1 3.8 2.9 2.8 2.7Luxembourg 398 809 848 1,011 871 0.0 0.0 0.0 0.0 0.0Norway 50,950 48,859 52,798 49,397 51,856 3.4 4.5 4.2 3.5 3.6Oman 11,582 12,204 13,025 14,366 14,400 4.6 5.8 5.6 5.3 4.4Qatar 9,997 18,804 31,182 16,809 32,521 – – – 3.2 5.4Slovenia 958 1,078 1,071 987 782 0.3 0.4 0.4 0.3 0.3Uruguay 6,360 8,038 7,656 10,302 13,591 6.4 9.9 7.6 8.4 10.0
Note: – = not availableSource: World Bank, World Development Indicators 2013, available at: http://databank.worldbank.org (accessed June 2013)
121

Tabl
e 22
. Ex
tern
al d
ebt:
sel
ecte
d ca
tego
ries
Gro
up/c
ount
ryTo
tal e
xter
nal d
ebt
outs
tand
ing
(dis
burs
ed)
(US
$ m
illio
n)
Sho
rt-t
erm
deb
t as
a
port
ion
of to
tal d
ebt
(dis
burs
ed) (
%)
Con
cess
iona
l deb
t as
a
prop
orti
on o
f tot
al d
ebt
outs
tand
ing
(dis
burs
ed) (
%)
Tota
l deb
t se
rvic
e
(US
$ m
illio
n)
2009
2010
2011
2009
2010
2011
2009
2010
2011
2009
2010
2011
Mid
dle-
inco
me
Com
mon
wea
lth c
ount
ries
Bel
ize
1,29
51,
307
1,27
80.
70.
50.
617
.117
.518
.412
612
713
2B
ots
wan
a1,
707
1,79
72,
396
13.4
19.9
17.2
20.1
17.3
11.6
4775
73D
om
inic
a27
228
328
413
.911
.59.
748
.854
.658
.421
1617
Fiji
536
555
861
13.1
11.0
24.7
20.9
23.2
19.8
2622
192
Gre
nada
571
578
567
6.4
6.7
6.0
43.5
42.9
43.3
2327
26G
uyan
a1,
172
1,48
51,
846
16.7
27.6
33.0
61.4
54.7
52.5
2032
46Ja
mai
ca11
,122
14,1
9314
,350
6.8
7.7
7.0
10.2
8.6
7.2
1,48
71,
189
1,64
9Le
soth
o75
677
779
20.
00.
00.
083
.984
.783
.238
3540
Mal
dive
s98
11,
007
983
18.9
22.2
23.3
27.3
34.7
42.3
9384
94M
aurit
ius
978
1,22
51,
435
0.8
0.3
0.7
35.1
36.5
40.2
143
131
162
Nam
ibia
––
––
––
––
––
––
Nau
ru–
––
––
––
––
––
–P
apua
New
Gui
nea
1,78
75,
965
12,5
827.
36.
61.
040
.112
.06.
054
381
21,
184
St L
ucia
433
580
448
19.5
38.9
21.6
46.8
38.4
51.1
4346
45St
Vin
cent
and
the
Gre
nadi
nes
222
273
283
0.2
0.0
0.0
47.9
62.8
66.4
3131
30S
amo
a25
332
536
80.
00.
00.
089
.491
.992
.99
1112
Seyc
helle
s1,
707
1,48
71,
779
56.7
65.9
71.5
12.0
10.4
8.5
6148
35So
lom
on
Isla
nds
172
231
256
1.5
1.7
4.2
75.8
54.1
46.1
1021
15Sw
azila
nd49
369
060
55.
533
.430
.934
.224
.227
.744
4343
Tong
a11
515
419
10.
00.
00.
089
.992
.594
.34
56
Tuva
lu–
––
––
––
––
––
–V
anua
tu15
517
320
220
.028
.338
.761
.656
.248
.46
66
Oth
er c
ount
ries
Alb
ania
4,66
14,
877
5,93
817
.911
.815
.036
.635
.630
.421
530
638
3A
rmen
ia5,
023
6,24
17,
383
10.4
9.9
11.8
46.2
39.1
34.7
424
968
926
Bhu
tan
761
907
1,03
50.
70.
70.
547
.244
.242
.476
8485
Bo
snia
and
Her
zego
vina
11,3
3610
,934
10,7
2914
.89.
512
.217
.619
.120
.052
580
186
9C
ape
Ver
de72
789
21,
025
0.2
0.2
0.1
89.6
83.0
82.0
3436
40C
ong
o, R
epub
lic o
f5,
224
2,61
82,
523
3.9
9.6
8.4
63.5
44.4
43.5
166
114
102
(con
tinue
d)
122

Tabl
e 22
. Ex
tern
al d
ebt:
sel
ecte
d ca
tego
ries
(con
tinu
ed)
Gro
up/c
ount
ryTo
tal e
xter
nal d
ebt
outs
tand
ing
(dis
burs
ed)
(US
$ m
illio
n)
Sho
rt-t
erm
deb
t as
a
port
ion
of to
tal d
ebt
(dis
burs
ed) (
%)
Con
cess
iona
l deb
t as
a
prop
orti
on o
f tot
al d
ebt
outs
tand
ing
(dis
burs
ed) (
%)
Tota
l deb
t se
rvic
e
(US
$ m
illio
n)
2009
2010
2011
2009
2010
2011
2009
2010
2011
2009
2010
2011
Co
sta
Ric
a8,
164
8,52
210
,291
27.5
28.5
23.5
7.7
8.4
6.6
1,28
697
21,
593
Djib
out
i89
476
176
713
.315
.111
.277
.976
.279
.236
3538
Gab
on
2,36
32,
555
2,87
94.
66.
96.
619
.019
.517
.641
544
040
4G
eorg
ia8,
556
9,51
911
,124
9.4
10.1
13.9
23.7
21.7
19.3
770
803
1,60
6Le
bano
n24
,803
24,5
9124
,767
12.5
14.2
13.4
6.1
5.7
5.5
4,61
14,
152
5,33
4M
aced
oni
a, F
YR5,
696
5,98
66,
286
33.3
34.3
28.7
12.0
11.4
10.6
552
653
949
Mau
ritan
ia2,
144
2,55
62,
709
8.9
9.3
5.6
75.6
74.9
76.0
7810
911
1M
old
ova
3,76
64,
818
5,45
237
.632
.534
.813
.311
.410
.839
039
646
8M
ong
olia
2,21
52,
506
2,56
43.
39.
29.
378
.270
.870
.710
817
211
4M
ont
eneg
ro2,
357
1,59
42,
093
51.2
11.7
21.7
17.7
25.3
21.0
6998
214
Pan
ama
11,2
4411
,382
12,5
830.
00.
00.
02.
02.
84.
287
51,
047
930
São
To
mé
and
Prín
cipe
160
181
231
12.1
11.0
11.2
67.1
70.9
74.8
22
2
Not
e: –
= n
ot a
vaila
ble
Sou
rce:
Wo
rld B
ank,
Wor
ld D
evel
opm
ent I
ndic
ator
s 20
13, a
vaila
ble
at: h
ttp:
//da
taba
nk.w
orld
bank
.org
(acc
esse
d Ju
ne 2
013)
123

Tabl
e 23
. To
tal n
et t
rans
fers
on
exte
rnal
deb
t
Gro
up/c
ount
ryTo
tal n
et t
rans
fers
on
exte
rnal
deb
t (U
S$
mill
ion)
Gro
ss d
omes
tic
prod
uct
(c
urre
nt U
S$
mill
ions
)To
tal n
et t
rans
fers
on
exte
rnal
deb
t (%
of G
DP)
2008
2009
2010
2011
2008
2009
2010
2011
2008
2009
2010
2011
Mid
dle-
inco
me
Com
mon
wea
lth c
ount
ries
Bel
ize
−38
−34
−88
−77
1,36
41,
349
1,39
91,
448
−2.8
−2.5
−6.3
−5.3
Bo
tsw
ana
61,
145
7057
611
,113
10,1
0713
,747
15,2
920.
111
.30.
53.
8D
om
inic
a9
−53
25−4
452
482
475
476
2.0
−11.
05.
3−0
.8Fi
ji−1
440
127
43,
591
2,88
23,
173
3,81
8−0
.41.
40.
07.
2G
rena
da30
−12
2−2
582
677
177
078
03.
6−1
.50.
2−3
.2G
uyan
a11
218
329
933
71,
923
2,02
62,
259
2,57
75.
89.
013
.213
.1Ja
mai
ca−7
20−4
112,
299
−477
13,6
8112
,069
13,2
0314
,426
−5.3
−3.4
17.4
−3.3
Kiri
bati
131
120
142
167
0.0
0.0
0.0
0.0
Leso
tho
8−1
189
1,63
11,
717
2,20
42,
525
0.5
−0.1
0.8
0.4
Mal
dive
s73
4212
838
1,89
21,
985
2,13
42,
154
3.9
2.1
6.0
1.8
Mau
ritiu
s−5
714
325
317
79,
641
8,83
59,
718
11,2
42−0
.61.
62.
61.
6N
amib
ia–
––
–8,
830
8,85
911
,066
12,6
23–
––
–N
auru
––
––
––
––
––
––
Pap
ua N
ew G
uine
a−1
0595
2,60
36,
703
8,01
07,
915
9,48
012
,394
−1.3
1.2
27.5
54.1
St L
ucia
295
−439
128
−144
1,16
51,
167
1,20
01,
211
25.3
−37.
710
.7−1
1.9
St V
ince
nt a
nd th
e G
rena
dine
s−6
−545
169
567
468
169
1−0
.9−0
.86.
60.
1S
amo
a17
2668
3557
450
157
263
43.
05.
111
.95.
5Se
yche
lles
4275
111
278
967
847
973
1,06
04.
38.
911
.526
.2So
lom
on
Isla
nds
−14
525
2464
660
167
986
7−2
.20.
83.
62.
8Sw
azila
nd29
−66
158
−75
3,02
03,
161
3,69
13,
969
1.0
−2.1
4.3
−1.9
Tong
a3
1336
3134
731
836
942
90.
94.
29.
77.
1Tu
valu
––
––
3027
3236
––
––
Van
uatu
211
1223
608
610
701
786
3.5
0.2
1.7
2.9
Oth
er c
ount
ries
Alb
ania
1,05
742
029
169
112
,969
12,1
1911
,858
12,9
608.
23.
52.
55.
3A
rmen
ia41
11,
358
1,05
092
611
,662
8,64
89,
260
10,1
383.
515
.711
.39.
1B
huta
n−6
013
9518
11,
257
1,26
51,
585
1,83
4−4
.81.
16.
09.
9B
osn
ia a
nd H
erze
govi
na−8
4592
9−6
93−4
918
,543
17,0
8316
,775
18,2
42−4
.65.
4−4
.1−0
.3C
ape
Ver
de43
6917
113
91,
562
1,60
11,
659
1,90
12.
84.
310
.37.
3C
ong
o, R
epub
lic o
f−1
19−2
2644
188
11,6
7511
,204
13,1
0815
,654
−1.0
−2.0
3.4
0.6
Co
sta
Ric
a34
7−1
,702
594
198
29,8
3829
,431
36,3
4641
,072
1.2
−5.8
1.6
0.5
(con
tinue
d)
124

Tabl
e 23
. To
tal n
et t
rans
fers
on
exte
rnal
deb
t (c
onti
nued
)
Gro
up/c
ount
ryTo
tal n
et t
rans
fers
on
exte
rnal
deb
t (U
S$
mill
ion)
Gro
ss d
omes
tic
prod
uct
(cur
rent
U
S$
mill
ions
)To
tal n
et t
rans
fers
on
exte
rnal
deb
t (%
of G
DP)
2008
2009
2010
2011
2008
2009
2010
2011
2008
2009
2010
2011
Djib
out
i18
6−3
−4–
––
––
––
–G
abo
n−8
18−1
6110
022
315
,732
12,0
7614
,539
18,7
91−5
.2−1
.30.
71.
2G
eorg
ia81
357
783
968
512
,799
10,7
6711
,638
14,4
356.
35.
47.
24.
7Le
bano
n−2
,658
−1,3
21−1
,623
−1,3
2530
,080
34,6
5137
,124
40,0
94−8
.8−3
.8−4
.4−3
.3M
aced
oni
a, F
YR38
568
965
169,
834
9,31
49,
339
10,3
953.
97.
40.
70.
2M
aurit
ania
274
7743
911
53,
790
3,02
73,
671
4,27
37.
22.
512
.02.
7M
old
ova
224
739
955
06,
055
5,43
95,
812
7,01
53.
70.
16.
97.
8M
ong
olia
7326
124
618
5,62
34,
584
6,20
08,
761
1.3
5.7
4.0
0.2
Mo
nten
egro
190
785
−733
449
4,52
04,
158
4,11
54,
502
4.2
18.9
−17.
810
.0P
anam
a−6
011,
015
−601
431
23,0
0224
,163
26,5
9031
,316
−2.6
4.2
−2.3
1.4
São
To
mé
and
Prín
cipe
318
2252
183
196
201
248
1.8
9.3
10.8
21.0
Surin
ame
––
––
3,53
33,
875
4,36
74,
304
–.
––
Not
e: –
= n
ot a
vaila
ble
Sou
rce:
Wo
rld B
ank,
Wor
ld D
evel
opm
ent I
ndic
ator
s 20
13, a
vaila
ble
at: h
ttp:
//da
taba
nk.w
orld
bank
.org
(acc
esse
d Ju
ne 2
013)
125

Table 24. Principal indicators of debt
Group/countryExternal debt (EDT)
(% of GNI)
External debt (% of exports of goods
and services)
Total debt service (% of total exports of goods and services)
2008 2009 2010 2011 2008 2009 2010 2011 2008 2009 2010 2011
Middle-incomeCommonwealth countriesBelize 106.4 104.4 105.2 96.0 146.1 176.8 156.7 134.3 16.9 17.2 15.3 13.9Botswana 3.4 14.9 12.2 13.8 7.2 39.9 33.0 – 1.1 1.1 1.4 –Dominica 68.5 58.2 61.1 59.9 178.0 166.8 160.7 164.4 11.2 12.7 8.9 9.8Fiji 11.2 18.7 18.0 23.6 20.4 39.0 31.6 . 1.3 1.9 1.3 –Grenada 70.5 80.6 79.0 73.8 278.9 313.3 330.5 296.4 10.9 12.8 15.3 13.3Guyana 44.6 58.3 65.4 – 82.1 122.9 128.5 – 2.6 2.1 2.7 –Jamaica 81.2 94.1 106.4 98.8 173.0 260.3 334.1 318.0 19.4 34.8 28.0 36.5Lesotho 32.2 33.5 28.7 27.1 41.0 48.8 43.7 – 2.2 2.5 1.9 –Maldives 50.8 52.8 50.8 50.2 86.3 117.7 105.7 – 9.1 11.2 8.9 –Mauritius 6.9 11.1 12.5 12.5 11.6 21.1 12.3 12.0 3.0 3.1 1.3 1.4Namibia – – – – – – – – – – – –Nauru – – – – – – – – – – – –Papua New Guinea 18.1 22.8 64.4 101.2 22.9 38.6 97.8 168.2 15.6 11.7 13.3 15.8St Lucia 78.8 41.0 50.1 37.6 153.0 77.3 89.7 77.6 10.6 7.7 7.1 7.8St Vincent and the Grenadines 30.3 33.7 41.6 42.1 92.9 107.7 139.3 141.9 13.4 15.1 16.0 15.2Samoa 38.4 49.9 56.2 58.5 107.2 139.5 161.6 180.8 4.2 4.7 5.3 5.8Seychelles 168.0 214.9 166.0 184.4 143.2 164.8 148.8 161.9 8.8 5.9 4.8 3.2Solomon Islands 30.3 36.5 41.6 37.9 57.6 69.7 65.8 33.7 5.2 4.0 5.9 2.0Swaziland 14.5 17.5 19.9 15.5 21.4 23.9 30.3 27.1 2.7 2.2 1.9 1.9Tonga 27.8 35.4 42.5 43.5 165.5 221.4 271.0 286.4 9.3 7.4 8.9 8.8Tuvalu – – – – – – – – – – – –Vanuatu 25.7 27.3 25.9 25.4 48.1 46.9 47.8 51.4 1.5 1.7 1.6 1.6Other countriesAlbania 30.0 38.8 41.5 46.0 105.0 135.5 131.7 144.9 4.2 6.3 8.3 9.3Armenia 29.2 57.0 64.3 68.3 128.7 244.7 215.5 202.9 13.3 20.6 33.4 25.4Bhutan 64.7 66.5 63.9 65.0 101.2 128.7 145.2 136.1 11.9 12.8 13.5 11.1Bosnia and Herzegovina 51.1 64.2 64.6 58.6 122.1 178.6 160.5 134.8 6.7 8.3 11.8 10.9Cape Verde 41.3 46.7 56.2 55.5 84.8 123.3 137.2 128.6 4.2 5.7 5.5 5.0Congo, Republic of 68.3 74.9 29.0 23.1 – – – – – – – –Costa Rica 31.8 28.6 24.2 25.7 85.2 82.5 78.9 87.3 14.6 13.0 9.0 13.5Djibouti 78.6 79.8 – – 211.7 211.5 173.3 – 8.4 8.5 8.1 –Gabon 17.3 24.0 22.4 19.7 – – – – – – – –Georgia 60.2 80.1 83.4 79.1 179.8 233.0 207.4 186.0 16.7 21.0 17.5 26.9Lebanon 79.7 71.5 63.9 61.7 98.0 107.2 110.5 92.6 17.8 19.9 18.7 19.9Macedonia, FYR 48.3 61.7 66.4 62.8 103.4 178.8 157.2 125.2 10.4 17.3 17.1 18.9Mauritania 55.3 69.6 72.1 70.8 97.3 130.7 110.8 87.3 3.1 4.7 4.7 3.6Moldova 54.9 65.6 76.4 72.0 119.7 163.4 175.8 149.4 16.5 16.9 14.5 12.8Mongolia 35.0 50.5 44.4 32.7 62.7 95.4 73.2 46.8 2.7 4.6 5.0 2.1Montenegro 32.7 56.8 39.1 45.6 75.2 149.8 95.4 99.7 3.5 4.4 5.9 10.2Panama 43.3 49.7 45.7 43.7 51.6 59.2 56.2 48.4 7.3 4.6 5.2 3.6São Tomé and Príncipe 71.2 80.8 89.0 92.2 671.5 745.0 698.1 747.5 11.9 9.8 6.4 5.4
Note: – = not availableSource: World Bank, World Development Indicators 2013, available at: http://databank.worldbank.org (accessed June 2013)
126

Table 25. Composition of debt
Group/countryOfficial debt as a
percentage of total debt outstanding (disbursed)
Commercial debt as a percentage of total debt outstanding (disbursed)
Debt at variable interest rate as a percentage of total debt outstanding
(disbursed)
2008 2009 2010 2011 2008 2009 2010 2011 2008 2009 2010 2011
Middle-incomeCommonwealth countriesBelize 80.0 80.4 78.2 79.6 20.0 19.6 21.8 20.4 32.0 32.4 34.9 34.4Botswana 88.7 81.3 75.2 79.2 11.3 18.7 24.8 20.8 11.1 61.3 58.8 68.5Dominica 67.4 74.3 77.8 80.7 32.6 25.7 22.2 19.3 3.7 3.9 4.3 5.4Fiji 92.2 67.2 70.3 63.3 7.8 32.8 29.7 36.7 23.0 16.9 18.9 15.5Grenada 86.5 86.6 85.3 85.9 13.5 13.4 14.7 14.1 40.5 39.0 38.4 38.5Guyana 79.4 66.5 59.6 57.1 20.6 33.5 40.4 42.9 2.4 2.0 2.0 2.2Jamaica 66.5 60.4 53.6 54.1 33.5 39.6 46.4 45.9 32.0 40.9 45.6 46.4Lesotho 94.9 90.0 89.9 89.9 5.1 10.0 10.1 10.1 1.3 1.1 1.2 1.4Maldives 53.3 56.9 63.6 69.6 46.7 43.1 36.4 30.4 45.3 41.5 30.1 21.3Mauritius 89.0 75.4 79.4 81.3 11.0 24.6 20.6 18.7 42.1 44.8 52.8 56.2Namibia – – – – – – – – – – – –Nauru – – – – – – – – – – – –Papua New Guinea 74.4 58.5 17.5 8.5 25.6 41.5 82.5 91.5 43.7 39.0 77.5 91.2St Lucia 38.0 72.7 55.4 69.2 62.0 27.3 44.6 30.8 8.0 15.2 11.2 13.0St Vincent and the Grenadines
99.6 91.5 93.4 91.9 0.4 8.5 6.6 8.1 14.1 17.3 17.5 17.1
Samoa 99.2 89.5 92.0 93.0 0.8 10.5 8.0 7.0 0.0 0.0 0.0 0.0Seychelles 43.3 41.4 31.2 25.8 56.7 58.6 68.8 74.2 6.9 6.3 6.3 5.3Solomon Islands 82.1 77.1 54.3 46.1 17.9 22.9 45.7 53.9 15.4 12.5 33.2 36.2Swaziland 81.3 79.2 55.8 56.9 18.7 20.8 44.2 43.1 17.2 17.4 12.7 11.1Tonga 89.8 91.0 93.4 94.7 10.2 9.0 6.6 5.3 – – – –Tuvalu – – – – – – – – – – – –Vanuatu 59.5 63.6 57.3 49.0 40.5 36.4 42.7 51.0 – – – –Other countriesAlbania 56.3 60.0 64.4 53.9 43.7 40.0 35.6 46.1 34.8 44.5 42.9 46.2Armenia 40.8 47.3 41.0 37.1 59.2 52.7 59.0 62.9 38.9 38.9 44.9 47.2Bhutan 97.5 98.1 98.3 98.6 2.5 1.9 1.7 1.4 0.0 1.1 3.2 4.3Bosnia and Herzegovina 30.6 31.6 34.1 36.1 69.4 68.4 65.9 63.9 69.8 62.0 63.6 59.8Cape Verde 97.6 96.3 97.3 97.9 2.4 3.7 2.7 2.1 11.3 14.6 14.3 13.7Congo, Republic of 88.2 83.2 74.4 72.3 11.8 16.8 25.6 27.7 23.4 21.7 19.4 21.5Costa Rica 34.9 39.4 44.6 38.1 65.1 60.6 55.4 61.9 30.1 40.8 41.4 52.0Djibouti 80.4 82.2 80.3 83.7 19.6 17.8 19.7 16.3 0.8 1.7 2.6 4.3Gabon 93.6 85.7 84.3 85.6 6.4 14.3 15.7 14.4 11.5 13.0 17.4 24.7Georgia 39.0 41.3 43.5 39.0 61.0 58.7 56.5 61.0 41.3 39.7 37.0 41.0Lebanon 84.7 83.1 82.2 83.2 15.3 16.9 17.8 16.8 6.0 4.1 3.5 3.4Macedonia, FYR 33.5 32.9 31.4 33.5 66.5 67.1 68.6 66.5 42.9 42.8 43.4 42.5Mauritania 83.4 85.8 85.0 87.9 16.6 14.2 15.0 12.1 7.8 7.6 5.7 4.9Moldova 22.0 21.5 17.4 15.7 78.0 78.5 82.6 84.3 40.6 38.2 43.9 41.0Mongolia 86.8 82.0 71.1 71.2 13.2 18.0 28.9 28.8 2.5 3.1 8.8 9.0Montenegro 56.7 46.4 84.7 73.8 43.3 53.6 15.3 26.2 24.0 17.4 28.1 29.7Panama 87.6 87.1 88.6 86.5 12.4 12.9 11.4 13.5 26.1 25.1 25.5 28.2São Tomé and Príncipe 82.6 78.1 80.2 81.9 17.4 21.9 19.8 18.1 2.3 5.0 4.4 3.5
Note: – = not availableSource: World Bank, World Development Indicators 2013, available at: http://databank.worldbank.org (accessed June 2013)
127

Tabl
e 26
. Fo
reig
n di
rect
inve
stm
ent
(FD
I) in
flow
s
Gro
up/c
ount
ryIn
war
d flo
ws
Gro
ss d
omes
tic
prod
uct
(Cur
rent
US
$ m
illio
n)FD
I (%
of G
DP)
2008
2009
2010
2011
2012
2008
2009
2010
2011
2012
2008
2009
2010
2011
2012
Mid
dle-
inco
me
Com
mon
wea
lth c
ount
ries
Bel
ize
170
109
9695
–1,
364
1,34
91,
399
1,44
8–
12.4
8.1
6.9
6.6
–B
ots
wan
a52
112
9−6
414
293
11,1
1310
,107
13,7
4715
,292
14,4
114.
71.
30.
02.
72.
0D
om
inic
a57
4124
34–
452
482
475
476
480
12.5
8.6
5.1
7.2
–Fi
ji35
013
519
620
4–
3,59
12,
882
3,17
33,
818
3,88
29.
84.
76.
25.
4–
Gre
nada
142
103
6041
–82
677
177
078
079
017
.213
.37.
85.
3–
Guy
ana
168
208
270
165
–1,
923
2,02
62,
259
2,57
72,
851
8.7
10.3
11.9
6.4
–Ja
mai
ca1,
377
485
186
173
–13
,681
12,0
6913
,203
14,4
2614
,840
––
––
–K
iriba
ti3
34
4–
131
120
142
167
176
2.0
2.6
2.6
2.3
–Le
soth
o11
210
011
413
2–
1,63
11,
717
2,20
42,
525
2,44
86.
95.
85.
25.
2–
Mal
dive
s17
515
421
628
2–
1,89
21,
985
2,13
42,
154
2,22
29.
37.
810
.113
.1–
Mau
ritiu
s37
825
743
027
3–
9,64
18,
835
9,71
811
,242
10,4
923.
92.
94.
42.
4–
Nam
ibia
750
550
686
969
–8,
830
8,85
911
,066
12,6
2313
,072
8.5
6.2
6.2
7.7
–N
auru
––
––
––
––
––
––
––
–P
apua
New
Gui
nea
−31
419
29−3
09–
8,01
07,
915
9,48
012
,394
15,6
54−0
.45.
30.
3−2
.5–
St L
ucia
161
146
110
81–
1,16
51,
167
1,20
01,
211
1,18
613
.812
.59.
26.
7–
St V
ince
nt a
nd th
e G
rena
dine
s15
910
410
311
0–
695
674
681
691
713
22.9
15.5
15.1
15.9
–
Sam
oa
463
515
–57
450
157
263
467
78.
00.
60.
92.
3–
Seyc
helle
s11
911
515
613
9–
967
847
973
1,06
01,
032
12.3
13.6
16.0
13.1
–So
lom
on
Isla
nds
9111
512
214
6–
646
601
679
867
1,00
814
.019
.217
.916
.9–
Swaz
iland
106
6613
695
–3,
020
3,16
13,
691
3,96
93,
747
3.5
2.1
3.7
2.4
–To
nga
4–
910
–34
731
836
942
947
21.
2–
2.3
2.4
–Tu
valu
22
22
–30
2732
3637
5.5
8.3
4.7
5.0
–V
anua
tu38
3242
58–
608
610
701
786
785
6.2
5.3
5.9
7.4
–O
ther
cou
ntrie
sA
lban
ia1,
241
1,34
31,
089
1,37
01,
265
12,9
6912
,119
11,8
5812
,960
13,1
199.
611
.19.
210
.69.
6A
rmen
ia93
577
757
066
348
911
,662
8,64
89,
260
10,1
389,
910
8.0
9.0
6.2
6.5
4.9
Bhu
tan
37
1916
–1,
257
1,26
51,
585
1,83
41,
780
0.2
0.5
1.2
0.9
–B
osn
ia a
nd H
erze
govi
na1,
005
139
329
380
633
18,5
4317
,083
16,7
7518
,242
17,0
485.
40.
82.
02.
13.
7C
ape
Ver
de21
112
711
610
553
1,56
21,
601
1,65
91,
901
1,89
713
.57.
97.
05.
52.
8C
ong
o, R
epub
lic o
f2,
526
1,86
22,
209
2,93
1–
11,6
7511
,204
13,1
0815
,654
17,8
7021
.616
.616
.918
.7–
Co
sta
Ric
a2,
078
1,34
71,
466
2,15
7–
29,8
3829
,431
36,3
4641
,072
45,1
537.
04.
64.
05.
3–
Gab
on
209
3353
172
8–
15,7
3212
,076
14,5
3918
,791
18,6
611.
30.
33.
73.
9–
Geo
rgia
1,59
165
386
91,
154
–12
,799
10,7
6711
,638
14,4
3515
,829
12.4
6.1
7.5
8.0
–Le
bano
n4,
333
4,80
44,
280
3,47
6–
30,0
8034
,651
37,1
2440
,094
42,9
4514
.413
.911
.58.
7–
(con
tinue
d)
128

Tabl
e 26
. Fo
reig
n di
rect
inve
stm
ent
(FD
I) in
flow
s (c
onti
nued
)
Gro
up/c
ount
ryIn
war
d flo
ws
Gro
ss d
omes
tic
prod
uct
(Cur
rent
US
$ m
illio
n)FD
I (%
of G
DP)
2008
2009
2010
2011
2012
2008
2009
2010
2011
2012
2008
2009
2010
2011
2012
Mac
edo
nia,
FYR
612
260
301
495
325
9,83
49,
314
9,33
910
,395
9,61
76.
22.
83.
24.
83.
4M
aurit
ania
343
−313
145
–3,
790
3,02
73,
671
4,27
34,
199
9.0
−0.1
3.6
1.1
–M
old
ova
727
135
202
294
169
6,05
55,
439
5,81
27,
015
7,25
412
.02.
53.
54.
22.
3M
ong
olia
845
624
1,69
14,
715
–5,
623
4,58
46,
200
8,76
110
,271
15.0
13.6
27.3
53.8
–M
ont
eneg
ro96
01,
527
760
558
–4,
520
4,15
84,
115
4,50
24,
231
21.2
36.7
18.5
12.4
–P
anam
a2,
534
1,08
62,
195
3,22
333
8323
,002
24,1
6326
,590
31,3
1636
,253
11.0
4.5
8.3
10.3
9.3
São
To
mé
and
Prín
cipe
7916
5135
2218
319
620
124
826
443
.17.
925
.214
.18.
5Su
rinam
e−2
31−9
3−2
4814
5–
3,53
33,
875
4,36
74,
304
4,73
8−6
.5−2
.4−5
.73.
4–
Tim
or-
Lest
e40
5029
47–
563
635
695
770
1,29
37.
17.
94.
16.
1–
Hig
h-in
com
eC
omm
onw
ealth
cou
ntrie
sA
ntig
ua a
nd B
arbu
da15
981
9758
–1,
240
1,09
11,
013
984
1,17
612
.87.
49.
55.
9–
Bah
amas
, The
860
664
872
595
–7,
828
7,50
17,
575
7,70
18,
149
11.0
8.9
11.5
7.7
–B
arba
dos
462
458
669
334
–4,
197
4,02
34,
033
4,06
44,
225
11.0
11.4
16.6
8.2
–B
rune
i Dar
ussa
lam
222
326
626
1,20
8–
9,77
39,
600
9,85
010
,067
16,9
542.
33.
46.
412
.0–
Cyp
rus
1,01
52,
180
711,
080
–19
,282
18,9
6119
,207
19,3
0322
,981
5.3
11.5
0.4
5.6
–M
alta
917
880
1,11
746
741
26,
654
6,47
76,
653
6,77
38,
722
13.8
13.6
16.8
6.9
4.7
St K
itts
and
Nev
is17
813
113
411
4–
610
574
575
585
748
29.1
22.8
23.3
19.5
–Tr
inid
ad a
nd T
oba
go2,
801
709
549
574
–19
,820
18,9
4918
,989
18,4
9923
,986
14.1
3.7
2.9
3.1
–O
ther
cou
ntrie
sB
ahra
in1,
794
257
156
781
–16
,540
17,0
5317
,792
18,1
66–
10.8
1.5
0.9
4.3
–C
roat
ia6,
057
3,42
884
81,
265
1,27
550
,443
46,9
3946
,279
46,2
7356
,442
12.0
7.3
1.8
2.7
2.3
Equa
toria
l Gui
nea
−794
1,63
61,
369
737
–9,
805
9,88
79,
719
10,1
9917
,697
−8.1
16.6
14.1
7.2
–Es
toni
a1,
873
1,86
72,
052
436
1,61
715
,774
13,5
5414
,005
15,1
6521
,854
11.9
13.8
14.6
2.9
7.4
Icel
and
1,20
864
258
1,10
751
218
,289
17,0
8816
,388
16,8
6113
,657
6.6
0.4
1.6
6.6
3.8
Irela
nd23
,259
53,9
3537
,764
11,5
0632
,933
220,
595
208,
558
206,
960
209,
921
210,
331
10.5
25.9
18.2
5.5
15.7
Kuw
ait
−61,
114
319
400
–93
,126
88,3
3086
,236
91,6
72–
0.0
1.3
0.4
0.4
–La
tvia
1,43
5−4
443
31,
502
916
18,9
6015
,556
15,3
0716
,138
28,3
247.
6−0
.32.
89.
33.
2Li
thua
nia
1,90
889
702
1,44
367
331
,654
26,9
8827
,390
29,0
2342
,087
6.0
0.3
2.6
5.0
1.6
Luxe
mbo
urg
49,1
57−3
1,73
6−8
4,66
318
,366
–41
,794
40,0
9041
,259
41,9
4257
,117
117.
6−7
9.2
−205
.243
.8–
No
rway
23,9
027,
482
20,3
997,
281
–31
9,51
831
4,29
431
5,79
731
9,64
349
9,66
77.
52.
46.
52.
3–
Om
an2,
952
1,50
91,
142
788
–39
,279
39,7
1141
,930
42,0
52–
7.5
3.8
2.7
1.9
–Q
atar
3,77
98,
125
4,67
0−8
732
770
,895
79,4
0392
,688
104,
702
–5.
310
.25.
0−0
.1–
Slo
veni
a1,
823
−349
633
818
−10
41,8
5538
,503
38,9
8839
,264
45,2
804.
4−0
.91.
62.
10.
0U
rugu
ay2,
142
1,60
32,
191
2,17
7–
20,6
3921
,102
22,9
9024
,492
49,0
6010
.47.
69.
58.
9–
Not
e: –
= n
ot a
vaila
ble
Sou
rce:
Wo
rld B
ank,
Wor
ld D
evel
opm
ent I
ndic
ator
s 20
13, a
vaila
ble
at: h
ttp:
//da
taba
nk.w
orld
bank
.org
(acc
esse
d Ju
ne 2
013)
129

Table 27. Total net financial flows from all sources (US$ millions)
Group/country 2005 2006 2007 2008 2009 2010 2011
Middle-incomeCommonwealth countriesBelize 24 −92 210 −124 41 11.7 30.3Botswana 82 96 128 643 1,249 239.3 796.2Dominica 7 349 38 1 35 29.0 27.0Fiji 118 −2 37 150 65 88.4 148.3Grenada 95 35 24 11 47 29.4 5.4Guyana 483 −24 112 214 143 170.8 176.4Jamaica −1,735 256 −61 239 121 958.9 603.4Kiribati 29 26 19 28 29 24.0 68.0Lesotho 50 60 110 134 118 254.0 291.0Maldives 127 142 121 73 64 114 −48Mauritius 147 749 12,572 985 1,819 4101 −1640Namibia 170 498 234 528 643 −102 664Nauru 12 18 26 33 26 28 37Papua New Guinea 496 429 514 325 2,224 5360.1 2040.3St Lucia 34 33 46 21 232 −38 131St Vincent and the Grenadines −12 16 500 215 56 2.3 −24Samoa 73 50 66 81 90 112 70Seychelles 21 −32 135 47 70 156 28Solomon Islands 170 216 256 263 215 403.1 350.0Swaziland 51 38 54 54 40 25 52Tonga 34 24 23 36 46 49 65Tuvalu 9 19 11 18 – 13 29Vanuatu 51 79 47 156 173 141 69Other countriesAlbania 481 503 673 839 799 887 801Armenia 213 364 560 481 657 584 511Bhutan 95 100 89 91 188 173 152Bosnia and Herzegovina 724 1,149 1,158 1,298 438 772 552Cape Verde 260 193 111 270 272 317 286Congo, Republic of 1,301 609 803 405 338 306 −868Costa Rica 651 1,331 764 806 −107 305 411Djibouti 96 182 133 155 328 106 188Gabon −68 166 582 −359 −277 509 533Georgia 346 765 580 1,447 1,295 867 1054Lebanon 385 532 819 1,115 – 839 132Macedonia, FYR 382 553 228 556 308 540 597Mauritania 189 182 316 314 300 390 478Moldova 157 376 433 462 233 658 405Mongolia 198 299 423 344 381 486 444Montenegro – 142 173 586 313 113 −43Panama 5,950 5,707 5,277 4,276 7,246 4693 1165São Tomé and Príncipe 32 27 13 42 34 46 64Suriname 19 38 71 118 – 134 305Timor-Leste 186 146 279 281 – 293 271
Note: – = not availableSource: OECD (2013), Geographical Distribution of Financial Flows to Developing Countries, 82–83
130

Tabl
e 28
. N
et fi
nanc
ial fl
ows
by m
ajor
cat
egor
ies
(US
$ m
illio
n)
Gro
up/c
ount
ryN
et b
ilate
ral fl
ows
from
DA
C
coun
trie
sM
ulti
late
ral fl
ows
Priv
ate
flow
s
Net
bila
tera
l flo
ws
from
EU
co
untr
ies
2008
2009
2010
2011
2008
2009
2010
2011
2008
2009
2010
2011
2008
2009
Mid
dle-
inco
me
Com
mon
wea
lth c
ount
ries
Bel
ize
−142
.26.
40
4.6
1634
12.5
25.8
−144
.81
10.1
0.1
−137
.512
.8B
ots
wan
a58
1.1
225.
419
016
3.7
6410
2349
.562
4.4
−92
95.9
84.2
73.7
379.
638
.2D
om
inic
a−1
8.5
6.7
3.4
7.1
19.9
2823
.920
.5−1
92
−2.3
−1−8
.215
.3Fi
ji11
1.6
44.5
64.5
122.
437
.821
23.3
25.5
76−8
−2.9
51.4
12.7
0.7
Gre
nada
––
––
––
––
––
––
13.7
2.9
Gre
nada
−18
−10.
94.
229
4330
.12.
2−2
1−4
−1.1
−2.2
−12
9.9
Guy
ana
84.3
6.1
70.8
87.6
128.
613
799
.888
.843
−35
6.6
17.2
75.6
16.9
Jam
aica
107.
9−1
8339
.924
4.4
132
304
920.
436
0.9
102
−145
32.9
184.
7−5
.622
8.1
Kiri
bati
20.6
24.6
2263
.16.
74.
71.
54.
8–
2−0
.13.
16.
33.
7Le
soth
o61
.468
90.2
139.
873
.346
161.
114
8.5
−4.5
−3−3
.9−2
.554
.352
.1M
aldi
ves
29.2
8.6
84.3
−56.
113
.957
20.3
2.9
12−7
28.5
−80.
438
.8−3
.6M
aurit
ius
816
1598
.541
01−1
639.
615
6.6
222
346.
615
280
315
2639
72.5
−175
3.1
765.
214
32N
amib
ia46
7.8
536.
7−1
02.4
663.
957
105
143.
346
.731
729
0−5
9.9
430.
539
2.2
499.
7N
auru
31.4
24.8
27.2
37.5
0.5
10.
9−0
.22
2–
−0.3
3.7
2.7
Pap
ua N
ew G
uine
a26
6.1
2074
5393
.620
07.7
−54.
459
.966
.532
.5−2
214
2741
03.6
−171
255
30.4
St L
ucia
−919
1.2
−39.
113
130
.741
25.5
20.3
−8.8
185
−40.
412
8.3
1.3
4.5
St V
ince
nt a
nd th
e
G
rena
dine
s19
1.9
17.8
2.3
−23.
524
.239
57.3
1618
213
1.3
−24.
519
5.4
24.8
Sam
oa
63.7
–11
269
.614
.831
57.6
39.7
3812
21.8
717
.816
.4Se
yche
lles
38.6
6015
628
.47
1038
.810
.634
4812
3.7
21.8
37.5
62.7
Solo
mo
n Is
land
s25
5.9
211
324.
132
2.9
147.
279
.527
.53.
740
.13.
58.
310
4Sw
azila
nd19
.514
.824
.652
.135
2644
.845
.71.
9−4
−6.5
−14.
816
7To
nga
26.6
41.3
48.8
658.
55
12.5
26.9
2.9
6−9
.5−2
.74
7.1
Tuva
lu15
14.8
1329
1.3
2.7
0.3
11.1
––
–0.
70.
30.
4V
anua
tu14
4.1
167.
814
0.9
68.6
11.5
50.
41.
753
.968
30.9
−22.
918
.827
.9O
ther
cou
ntrie
sA
lban
ia63
161
6.7
727.
751
0.6
198.
615
714
5.3
281.
836
436
650
1.5
299.
566
0.6
637.
3A
rmen
ia35
9.6
275.
926
5.5
179.
711
9.2
379
294.
932
2.7
130
1739
.919
.420
614
4.6
Bhu
tan
54.2
109.
498
.965
.536
.177
73.7
85.6
5.2
5125
.6−4
.628
.881
.7B
osn
ia a
nd H
erze
govi
na96
9.2
215.
839
0.6
373.
529
8.1
164.
529
1.5
108.
562
8.5
−57.
115
5.4
130.
710
37.2
185.
6C
ape
Ver
de20
7.2
210.
922
2.9
184.
363
6194
.510
2.2
44.5
49−2
7.7
−53.
520
4.8
178.
2C
ong
o, R
epub
lic o
f30
729
221
7.5
−938
9845
87.8
69.7
124
166.
5−3
2.1
−106
5.9
375.
727
5.9
Co
sta
Ric
a91
1.5
−128
.3−2
27.1
259.
8−1
05.7
2153
1.8
150.
283
5−2
41−3
0419
3.1
269.
7−8
.8
(con
tinue
d)
131

Tabl
e 28
. N
et fi
nanc
ial fl
ows
by m
ajor
cat
egor
ies
(US
$ m
illio
n) (
cont
inue
d)
Gro
up/c
ount
ryN
et b
ilate
ral fl
ows
from
DA
C
coun
trie
sM
ulti
late
ral fl
ows
Priv
ate
flow
s
Net
bila
tera
l flo
ws
from
EU
co
untr
ies
2008
2009
2010
2011
2008
2009
2010
2011
2008
2009
2010
2011
2008
2009
Djib
out
i98
.518
3.4
6313
1.9
46.3
134
35.3
49.3
32.6
50.4
−48.
741
.399
.915
0.2
Gab
on
−393
.9−3
29.1
511.
339
4.4
3552
−2.4
136.
5−2
42−2
9445
638
4.7
−18.
6−1
36.3
Geo
rgia
987.
649
035
6.2
574.
143
3.2
763
474
440.
338
341
13.3
135.
544
9.7
327.
1Le
bano
n70
3.2
414
642
17.8
342
109
124.
181
.949
.911
5.2
433.
7−1
72.3
680.
119
8.6
Mac
edo
nia,
FYR
369.
626
4.5
351.
726
1.2
171.
434
.514
7.5
157.
249
.911
5.2
258.
918
9.6
346.
124
0.9
Mau
ritan
ia14
9.3
143.
168
192.
114
113
630
3.9
273.
9−8
.724
−48
52.1
141.
515
9.3
Mo
ldo
va24
410
5.9
227.
811
.719
5.1
116.
339
7.6
362.
513
3.7
1213
1.4
−85.
526
7.3
166.
7M
ong
olia
173.
717
8.1
241
322.
215
8.8
181
232.
111
4.2
−61.
1–
20.3
55.4
103.
621
.7M
ont
eneg
ro51
5.9
247
712.
514
06.1
53.1
61.2
49.4
78.1
412
169
2.2
−141
.929
5.6
237.
7O
man
172.
97.
412
28.6
–−6
1.4
−3.2
−10.
7–
−149
.4−3
52.6
1245
–−1
56−9
7.3
Pan
ama
4103
.669
22.2
4408
.510
64.4
172.
632
228
4.2
99.9
4024
6839
3994
.361
5.5
−120
1018
.6S
ão T
om
é an
d P
rínci
pe20
.922
.729
.527
.220
.511
16.3
36.8
−4.9
3−3
.5−1
0.7
18.7
23.5
Surin
ame
86.3
147.
379
.820
4.4
31.1
4155
100.
412
.313
−10.
310
5.8
103.
515
8.3
Tim
or-
Lest
e23
419
4.7
260
230.
947
.234
32.8
40.1
310
−4.1
−0.6
107
74.5
Not
e: –
= n
ot a
vaila
ble
Sou
rce:
OEC
D (2
013)
, Geo
grap
hica
l Dis
trib
utio
n of
Fin
anci
al F
low
s to
Dev
elop
ing
Cou
ntrie
s, 7
8–79
, 80–
81, 8
6–87
, ava
ilabl
e at
: ww
w.o
bela
.org
(acc
esse
d Ju
ne 2
013)
132

Tabl
e 29
. O
ffici
al D
evel
opm
ent
Ass
ista
nce
com
mit
men
ts a
nd d
isbu
rsem
ents
Gro
up/c
ount
ryC
omm
itm
ents
(US
$ m
illio
ns)
Dis
burs
emen
t to
tal
(US
$ m
illio
n)
Dis
burs
emen
t as
a
prop
orti
on o
f co
mm
itm
ent
Per c
apit
a ne
t re
sour
ce
flow
s fr
om a
ll so
urce
s (U
S$)
Use
of I
MF
cred
it
(US
$ m
illio
n)
2009
2010
2011
2009
2010
2011
2009
2010
2011
2009
2010
2011
2009
2010
2011
Mid
dle-
inco
me
Com
mon
wea
lth c
ount
ries
Bel
ize
56.3
63.9
24.4
27.6
24.8
28.3
48.9
38.8
116.
291
.680
.289
.635
3535
Bo
tsw
ana
222.
312
1.2
129.
827
9.2
156.
112
0.6
125.
612
8.8
92.9
143.
079
.360
.790
8888
Do
min
ica
22.1
11.9
13.8
36.0
32.5
24.4
162.
727
3.1
177.
050
6.4
456.
034
1.2
3230
27Fi
ji66
.772
.774
.671
.076
.475
.310
6.5
105.
110
0.8
83.3
88.8
86.7
105
103
103
Gre
nada
52.5
18.3
47.0
47.8
33.8
12.0
91.0
184.
825
.645
8.4
323.
311
4.5
4146
46G
uyan
a10
9.4
372.
013
2.0
173.
416
7.0
158.
515
8.5
44.9
120.
122
1.9
194.
920
0.4
195
190
182
Jam
aica
98.4
133.
612
5.1
149.
314
1.2
43.8
151.
810
5.7
35.0
55.4
52.3
16.2
410
1188
1234
Kiri
bati
21.4
28.2
160.
627
.122
.863
.612
7.1
81.0
39.6
281.
923
3.5
640.
9–
––
Leso
tho
209.
927
2.8
276.
712
2.4
256.
225
9.3
58.3
93.9
93.7
61.5
127.
512
7.7
7679
80M
aldi
ves
103.
310
4.2
42.0
33.2
110.
846
.032
.110
6.3
109.
710
3.9
340.
013
8.6
2128
28M
aurit
ius
379.
632
2.1
135.
715
5.0
125.
318
2.7
40.8
38.9
134.
612
1.5
97.8
142.
015
214
914
9N
amib
ia43
4.0
395.
324
6.0
325.
525
6.4
274.
575
.064
.911
1.6
151.
911
7.7
123.
8–
––
Nau
ru23
.625
.237
.424
.027
.837
.510
1.7
110.
110
0.3
––
––
––
Pap
ua N
ew G
uine
a61
1.6
763.
772
4.4
411.
751
1.4
610.
767
.367
.084
.361
.474
.687
.119
719
319
3St
Luc
ia26
.918
.262
.341
.041
.235
.315
2.2
226.
256
.723
3.8
232.
019
6.9
3433
41St
Vin
cent
and
the
Gre
nadi
nes
13.2
11.3
41.1
30.8
16.9
17.8
232.
714
9.0
43.2
281.
615
4.1
162.
318
1823
Sam
oa
74.8
131.
979
.777
.314
7.5
99.7
103.
411
1.8
125.
241
8.6
792.
853
2.1
2626
26Se
yche
lles
68.6
80.6
9.0
22.8
56.0
20.9
33.2
69.5
233.
326
0.7
624.
323
8.8
3244
49So
lom
on
Isla
nds
261.
233
8.8
333.
020
5.9
340.
533
3.8
78.8
100.
510
0.2
399.
764
6.8
620.
416
2534
Swaz
iland
82.4
126.
722
3.3
56.0
91.5
124.
968
.072
.255
.947
.776
.610
3.0
7674
74To
nga
37.5
89.7
131.
417
.513
.342
.646
.614
.932
.437
8.9
676.
889
5.8
1010
10Tu
valu
18.6
22.0
44.4
17.5
13.3
42.6
93.8
60.5
95.8
1781
.213
56.5
4323
.4–
––
Van
uatu
100.
584
.499
.710
3.2
108.
391
.110
2.7
128.
491
.344
7.0
458.
437
6.7
2625
25O
ther
cou
ntrie
sA
lban
ia29
8.4
489.
845
4.6
357.
034
0.7
348.
811
9.6
69.6
76.7
113.
310
8.2
110.
614
412
911
7A
rmen
ia51
3.3
386.
333
6.5
526.
034
2.8
378.
210
2.5
88.7
112.
417
7.2
115.
712
7.6
725
876
963
(con
tinue
d)
133
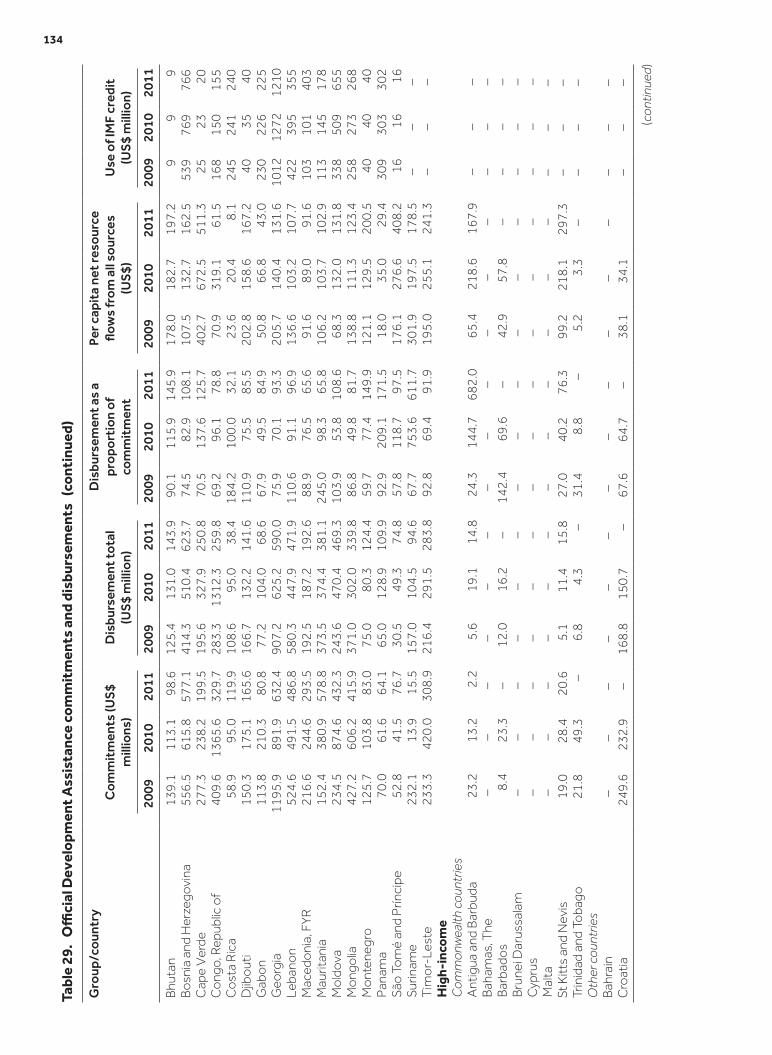
Tabl
e 29
. O
ffici
al D
evel
opm
ent
Ass
ista
nce
com
mit
men
ts a
nd d
isbu
rsem
ents
(co
ntin
ued)
Gro
up/c
ount
ryC
omm
itm
ents
(US
$ m
illio
ns)
Dis
burs
emen
t to
tal
(US
$ m
illio
n)
Dis
burs
emen
t as
a
prop
orti
on o
f co
mm
itm
ent
Per c
apit
a ne
t re
sour
ce
flow
s fr
om a
ll so
urce
s (U
S$)
Use
of I
MF
cred
it
(US
$ m
illio
n)
2009
2010
2011
2009
2010
2011
2009
2010
2011
2009
2010
2011
2009
2010
2011
Bhu
tan
139.
111
3.1
98.6
125.
413
1.0
143.
990
.111
5.9
145.
917
8.0
182.
719
7.2
99
9B
osn
ia a
nd H
erze
govi
na55
6.5
615.
857
7.1
414.
351
0.4
623.
774
.582
.910
8.1
107.
513
2.7
162.
553
976
976
6C
ape
Ver
de27
7.3
238.
219
9.5
195.
632
7.9
250.
870
.513
7.6
125.
740
2.7
672.
551
1.3
2523
20C
ong
o, R
epub
lic o
f40
9.6
1365
.632
9.7
283.
313
12.3
259.
869
.296
.178
.870
.931
9.1
61.5
168
150
155
Co
sta
Ric
a58
.995
.011
9.9
108.
695
.038
.418
4.2
100.
032
.123
.620
.48.
124
524
124
0D
jibo
uti
150.
317
5.1
165.
616
6.7
132.
214
1.6
110.
975
.585
.520
2.8
158.
616
7.2
4035
40G
abo
n11
3.8
210.
380
.877
.210
4.0
68.6
67.9
49.5
84.9
50.8
66.8
43.0
230
226
225
Geo
rgia
1195
.989
1.9
632.
490
7.2
625.
259
0.0
75.9
70.1
93.3
205.
714
0.4
131.
610
1212
7212
10Le
bano
n52
4.6
491.
548
6.8
580.
344
7.9
471.
911
0.6
91.1
96.9
136.
610
3.2
107.
742
239
535
5M
aced
oni
a, F
YR21
6.6
244.
629
3.5
192.
518
7.2
192.
688
.976
.565
.691
.689
.091
.610
310
140
3M
aurit
ania
152.
438
0.9
578.
837
3.5
374.
438
1.1
245.
098
.365
.810
6.2
103.
710
2.9
113
145
178
Mo
ldo
va23
4.5
874.
643
2.3
243.
647
0.4
469.
310
3.9
53.8
108.
668
.313
2.0
131.
833
850
965
5M
ong
olia
427.
260
6.2
415.
937
1.0
302.
033
9.8
86.8
49.8
81.7
138.
811
1.3
123.
425
827
326
8M
ont
eneg
ro12
5.7
103.
883
.075
.080
.312
4.4
59.7
77.4
149.
912
1.1
129.
520
0.5
4040
40P
anam
a70
.061
.664
.165
.012
8.9
109.
992
.920
9.1
171.
518
.035
.029
.430
930
330
2S
ão T
om
é an
d P
rínci
pe52
.841
.576
.730
.549
.374
.857
.811
8.7
97.5
176.
127
6.6
408.
216
1616
Surin
ame
232.
113
.915
.515
7.0
104.
594
.667
.775
3.6
611.
730
1.9
197.
517
8.5
––
–T
imo
r-Le
ste
233.
342
0.0
308.
921
6.4
291.
528
3.8
92.8
69.4
91.9
195.
025
5.1
241.
3–
––
Hig
h-in
com
eC
omm
onw
ealth
cou
ntrie
sA
ntig
ua a
nd B
arbu
da23
.213
.22.
25.
619
.114
.824
.314
4.7
682.
065
.421
8.6
167.
9–
––
Bah
amas
, The
––
––
––
––
––
––
––
–B
arba
dos
8.4
23.3
–12
.016
.2–
142.
469
.6–
42.9
57.8
––
––
Bru
nei D
arus
sala
m–
––
––
––
––
––
––
––
Cyp
rus
––
––
––
––
––
––
––
–M
alta
––
––
––
––
––
––
––
–St
Kitt
s an
d N
evis
19.0
28.4
20.6
5.1
11.4
15.8
27.0
40.2
76.3
99.2
218.
129
7.3
––
–Tr
inid
ad a
nd T
oba
go21
.849
.3–
6.8
4.3
–31
.48.
8–
5.2
3.3
––
––
Oth
er c
ount
ries
Bah
rain
––
––
––
––
––
––
––
–C
roat
ia24
9.6
232.
9–
168.
815
0.7
–67
.664
.7–
38.1
34.1
––
–
(con
tinue
d)
134

Tabl
e 29
. O
ffici
al D
evel
opm
ent
Ass
ista
nce
com
mit
men
ts a
nd d
isbu
rsem
ents
(co
ntin
ued)
Gro
up/c
ount
ryC
omm
itm
ents
(US
$ m
illio
ns)
Dis
burs
emen
t to
tal
(US
$ m
illio
n)
Dis
burs
emen
t as
a
prop
orti
on o
f co
mm
itm
ent
Per c
apit
a ne
t re
sour
ce
flow
s fr
om a
ll so
urce
s (U
S$)
Use
of I
MF
cred
it
(US
$ m
illio
n)
2009
2010
2011
2009
2010
2011
2009
2010
2011
2009
2010
2011
2009
2010
2011
Equa
toria
l Gui
nea
28.8
84.8
22.3
31.5
84.7
24.2
109.
599
.910
8.7
46.5
121.
733
.8–
––
Esto
nia
––
––
––
––
––
––
––
–K
uwai
t–
––
––
––
––
––
––
––
Latv
ia–
––
––
––
––
––
–13
0816
9916
93Li
thua
nia
––
––
––
––
––
––
215
211
211
Om
an19
4.3
21.1
–15
3.8
−40.
3–
79.2
−190
.8–
57.8
−14.
4–
––
–Q
atar
––
––
––
––
––
––
––
–S
love
nia
––
––
––
––
––
––
––
–U
rugu
ay40
.136
.136
.750
.046
.715
.112
4.6
129.
541
.214
.913
.94.
546
045
245
0
Not
e: –
= n
ot a
vaila
ble
Sou
rce:
OEC
D d
ata
avai
labl
e at
: htt
p://
stat
s.o
ecd.
org
/Ind
ex.a
spx?
Dat
aset
Co
de=H
S19
88 (d
ate
acce
ssed
Jun
e 20
13)
135

Table 30. Aid dependency
Group/country NET ODA received
Net ODA received (current US$ ’000)
Net bilateral aid flows from DAC donors, total (current US$ ’000)
NET ODA received per capita (current US$ ’000)
Gross national income (%)
Gross capital formation (%)
Imports (%)
IDA Resource Allocation Index (1 = low to 6 = high)
2009 2010 2011 2009 2010 2011 2009 2010 2011 2009 2010 2011 2009 2010 2011 2009 2010 2011 2009 2010 2011 2012
Commonwealth countriesBelize 27,560 24,760 29,790 17,170 19,250 15,470 92 80 90 2 2 2 – – – 3 3 3 – – – –Botswana 279,160 156,140 126,360 255,680 145,360 105,360 143 79 61 3 1 1 8 4 2 5 2 2 – – – –Dominica 35,950 32,450 24,790 27,710 29,210 23,690 506 456 341 8 7 5 38 32 22 13 12 9 4 4 4 4Fiji 70,990 76,400 75,230 62,510 68,660 71,620 83 89 87 2 2 2 – – – 4 3 – – – – –Grenada 47,810 33,840 12,800 18,090 18,820 12,120 458 323 114 7 5 2 26 20 7 12 8 3 4 4 4 4Guyana 173,350 153,210 159,430 92,800 93,470 98,310 222 195 200 9 7 6 32 27 26 12 9 3 3 3 3Jamaica 149,300 141,230 53,620 112,900 105,110 10,430 55 52 16 1 1 0 6 5 1 2 2 1 – – – –Kiribati 27,140 22,820 63,960 24,410 22,040 62,470 282 233 641 16 11 27 – – – – – – 3 3 3 3Lesotho 122,390 256,230 264,580 86,780 168,410 195,740 62 128 128 6 10 9 26 39 39 5 9 8 4 3 3 3Maldives 33,200 110,750 46,010 22,270 62,190 21,140 104 340 139 2 6 3 – – – 2 5 2 3 3 3 3Mauritius 154,970 125,270 191,540 156,790 126,030 183,860 122 98 142 2 1 2 8 5 6 3 1 2 – – – –Namibia 325,530 256,440 284,590 281,710 224,290 255,510 152 118 124 4 2 2 16 11 11 6 4 4 – – – –Nauru – – – – – – – – – – – – – – – – – – – – – –Papua New Guinea 411,700 511,410 612,320 354,540 490,790 575,750 61 75 87 5 6 5 26 30 30 8 7 3 3 3 3St Lucia 40,970 41,150 36,930 22,840 25,060 22,110 234 232 197 4 4 3 12 10 8 6 5 4 4 4 4 4St Vincent and the
Grenadines30,760 16,850 18,810 18,250 11,440 13,310 282 154 162 5 3 3 19 10 10 7 4 4 4 4 4 4
Samoa 77,310 147,480 101,110 55,510 100,770 81,940 419 793 532 16 27 16 – – – 24 37 23 4 4 4 4Seychelles 22,760 56,040 21,330 23,760 33,880 13,030 261 624 239 3 6 2 – – – 2 5 2 – – – –Solomon Islands 205,850 340,490 333,750 205,920 321,390 305,190 400 647 620 44 61 50 – – – 42 49 43 3 3 3 3Swaziland 56,030 91,450 129,740 33,660 52,550 95,390 48 77 103 2 3 3 17 24 33 2 3 – – – – –Tonga 39,240 70,450 93,730 35,360 59,230 75,820 379 677 896 12 19 21 50 63 58 20 – – 3 3 3 3Tuvalu 17,470 13,330 42,660 15,180 13,230 33,060 1781 1356 4323 36 26 77 – – – – – – – – – 3Vanuatu 103,190 108,310 92,060 100,870 109,560 92,160 447 458 377 18 16 12 43 45 43 30 23 17 3 3 3 3Other countriesAlbania 356,960 340,700 307,270 315,340 302,220 334,570 113 108 111 3 3 3 10 11 11 5 5 5 – – – –Armenia 525,970 342,820 374,280 274,210 239,840 264,450 177 116 128 6 4 4 18 11 12 12 7 7 4 4 4 4Bhutan 125,380 131,000 143,850 58,190 77,890 72,570 178 183 197 10 9 8 24 16 14 17 13 10 4 4 4 4Bosnia and Herzegovina 414,310 510,370 424,620 354,190 352,330 531,410 108 133 162 2 3 3 12 16 17 5 6 6 4 4 4 4Cape Verde 195,600 327,890 245,650 184,440 284,880 249,030 403 672 511 13 21 14 31 52 36 17 27 17 4 4 4 4Congo, Republic of 283,280 1,312,250 253,700 252,320 1,247,570 200,900 71 319 61 4 15 2 13 53 7 3 3 3 3Costa Rica 108,570 95,030 38,460 105,690 94,210 33,150 24 20 8 – – – 2 1 0 1 1 – – – – –Djibouti 166,710 132,240 141,620 107,950 108,850 101,720 203 159 167 – – – – – – 29 27 21 3 3 3 3Gabon 77,210 104,000 75,630 61,760 96,890 62,150 51 67 43 1 1 0 – – – – – – – – – –Georgia 907,160 625,190 549,670 609,190 508,620 498,990 206 140 132 8 5 4 65 25 16 16 9 6 4 4 4 4Lebanon 580,290 447,930 432,280 463,430 317,010 355,130 137 103 108 2 1 1 5 4 4 2 1 1 – – – –Macedonia, FYR 192,470 187,170 164,660 186,870 150,270 175,160 92 89 92 2 2 2 8 8 7 4 3 3 – – – –Mauritania 373,470 374,400 370,230 157,860 130,920 214,140 106 104 103 12 10 9 40 38 29 – – – 3 3 3 3Moldova 243,580 470,370 451,040 205,490 232,400 274,550 68 132 132 4 7 6 19 34 27 6 10 8 4 4 4 4Mongolia 370,980 301,970 339,820 219,400 238,890 256,550 139 111 123 8 5 4 24 12 6 13 7 4 3 3 3 3Montenegro 75,030 80,280 73,690 61,970 56,930 101,210 121 129 200 2 2 3 7 9 14 3 3 4 – – – –Panama 65,010 128,870 97,920 60,810 125,290 104,210 18 35 29 0 0 0 1 2 1 0 1 – – – – –São Tomé and Príncipe 30,510 49,300 75,080 23,270 38,990 42,850 176 277 408 16 25 30 – – – 29 40 50 3 3 3 3Suriname 157,040 103,660 94,580 151,110 97,260 74,770 302 197 179 4 2 2 – – – 9 6 4 – – – –Timor-Leste 216,440 291,500 283,760 193,280 272,740 261,660 195 255 241 8 9 7 – – – 18 21 15 3 3 3 3High-incomeCommonwealth countriesAntigua and Barbuda 5,640 19,070 15,300 3,350 19,270 15,080 65 219 168 – 2 1 1 5 4 1 3 2 – – – –Bahamas, The – – – – – – – – – – – – – – – – – – – – – –Barbados 11,960 16,200 – 10,650 14,800 – 43 58 – – – – 1 3 – – 1 – – – – –Brunei Darussalam – – – – – – – – – – – – – – – – – – – – – –Cyprus – – – – – – – – – – – – – – – – – – – – – –Malta – – – – – – – – – – – – – – – – – – – – – –St Kitts and Nevis 5,130 11,420 16,470 4,130 8,710 18,110 99 218 297 1 2 2 2 5 7 1 3 4 – – – –
(continued)
136

Table 30. Aid dependency
Group/country NET ODA received
Net ODA received (current US$ ’000)
Net bilateral aid flows from DAC donors, total (current US$ ’000)
NET ODA received per capita (current US$ ’000)
Gross national income (%)
Gross capital formation (%)
Imports (%)
IDA Resource Allocation Index (1 = low to 6 = high)
2009 2010 2011 2009 2010 2011 2009 2010 2011 2009 2010 2011 2009 2010 2011 2009 2010 2011 2009 2010 2011 2012
Commonwealth countriesBelize 27,560 24,760 29,790 17,170 19,250 15,470 92 80 90 2 2 2 – – – 3 3 3 – – – –Botswana 279,160 156,140 126,360 255,680 145,360 105,360 143 79 61 3 1 1 8 4 2 5 2 2 – – – –Dominica 35,950 32,450 24,790 27,710 29,210 23,690 506 456 341 8 7 5 38 32 22 13 12 9 4 4 4 4Fiji 70,990 76,400 75,230 62,510 68,660 71,620 83 89 87 2 2 2 – – – 4 3 – – – – –Grenada 47,810 33,840 12,800 18,090 18,820 12,120 458 323 114 7 5 2 26 20 7 12 8 3 4 4 4 4Guyana 173,350 153,210 159,430 92,800 93,470 98,310 222 195 200 9 7 6 32 27 26 12 9 3 3 3 3Jamaica 149,300 141,230 53,620 112,900 105,110 10,430 55 52 16 1 1 0 6 5 1 2 2 1 – – – –Kiribati 27,140 22,820 63,960 24,410 22,040 62,470 282 233 641 16 11 27 – – – – – – 3 3 3 3Lesotho 122,390 256,230 264,580 86,780 168,410 195,740 62 128 128 6 10 9 26 39 39 5 9 8 4 3 3 3Maldives 33,200 110,750 46,010 22,270 62,190 21,140 104 340 139 2 6 3 – – – 2 5 2 3 3 3 3Mauritius 154,970 125,270 191,540 156,790 126,030 183,860 122 98 142 2 1 2 8 5 6 3 1 2 – – – –Namibia 325,530 256,440 284,590 281,710 224,290 255,510 152 118 124 4 2 2 16 11 11 6 4 4 – – – –Nauru – – – – – – – – – – – – – – – – – – – – – –Papua New Guinea 411,700 511,410 612,320 354,540 490,790 575,750 61 75 87 5 6 5 26 30 30 8 7 3 3 3 3St Lucia 40,970 41,150 36,930 22,840 25,060 22,110 234 232 197 4 4 3 12 10 8 6 5 4 4 4 4 4St Vincent and the
Grenadines30,760 16,850 18,810 18,250 11,440 13,310 282 154 162 5 3 3 19 10 10 7 4 4 4 4 4 4
Samoa 77,310 147,480 101,110 55,510 100,770 81,940 419 793 532 16 27 16 – – – 24 37 23 4 4 4 4Seychelles 22,760 56,040 21,330 23,760 33,880 13,030 261 624 239 3 6 2 – – – 2 5 2 – – – –Solomon Islands 205,850 340,490 333,750 205,920 321,390 305,190 400 647 620 44 61 50 – – – 42 49 43 3 3 3 3Swaziland 56,030 91,450 129,740 33,660 52,550 95,390 48 77 103 2 3 3 17 24 33 2 3 – – – – –Tonga 39,240 70,450 93,730 35,360 59,230 75,820 379 677 896 12 19 21 50 63 58 20 – – 3 3 3 3Tuvalu 17,470 13,330 42,660 15,180 13,230 33,060 1781 1356 4323 36 26 77 – – – – – – – – – 3Vanuatu 103,190 108,310 92,060 100,870 109,560 92,160 447 458 377 18 16 12 43 45 43 30 23 17 3 3 3 3Other countriesAlbania 356,960 340,700 307,270 315,340 302,220 334,570 113 108 111 3 3 3 10 11 11 5 5 5 – – – –Armenia 525,970 342,820 374,280 274,210 239,840 264,450 177 116 128 6 4 4 18 11 12 12 7 7 4 4 4 4Bhutan 125,380 131,000 143,850 58,190 77,890 72,570 178 183 197 10 9 8 24 16 14 17 13 10 4 4 4 4Bosnia and Herzegovina 414,310 510,370 424,620 354,190 352,330 531,410 108 133 162 2 3 3 12 16 17 5 6 6 4 4 4 4Cape Verde 195,600 327,890 245,650 184,440 284,880 249,030 403 672 511 13 21 14 31 52 36 17 27 17 4 4 4 4Congo, Republic of 283,280 1,312,250 253,700 252,320 1,247,570 200,900 71 319 61 4 15 2 13 53 7 3 3 3 3Costa Rica 108,570 95,030 38,460 105,690 94,210 33,150 24 20 8 – – – 2 1 0 1 1 – – – – –Djibouti 166,710 132,240 141,620 107,950 108,850 101,720 203 159 167 – – – – – – 29 27 21 3 3 3 3Gabon 77,210 104,000 75,630 61,760 96,890 62,150 51 67 43 1 1 0 – – – – – – – – – –Georgia 907,160 625,190 549,670 609,190 508,620 498,990 206 140 132 8 5 4 65 25 16 16 9 6 4 4 4 4Lebanon 580,290 447,930 432,280 463,430 317,010 355,130 137 103 108 2 1 1 5 4 4 2 1 1 – – – –Macedonia, FYR 192,470 187,170 164,660 186,870 150,270 175,160 92 89 92 2 2 2 8 8 7 4 3 3 – – – –Mauritania 373,470 374,400 370,230 157,860 130,920 214,140 106 104 103 12 10 9 40 38 29 – – – 3 3 3 3Moldova 243,580 470,370 451,040 205,490 232,400 274,550 68 132 132 4 7 6 19 34 27 6 10 8 4 4 4 4Mongolia 370,980 301,970 339,820 219,400 238,890 256,550 139 111 123 8 5 4 24 12 6 13 7 4 3 3 3 3Montenegro 75,030 80,280 73,690 61,970 56,930 101,210 121 129 200 2 2 3 7 9 14 3 3 4 – – – –Panama 65,010 128,870 97,920 60,810 125,290 104,210 18 35 29 0 0 0 1 2 1 0 1 – – – – –São Tomé and Príncipe 30,510 49,300 75,080 23,270 38,990 42,850 176 277 408 16 25 30 – – – 29 40 50 3 3 3 3Suriname 157,040 103,660 94,580 151,110 97,260 74,770 302 197 179 4 2 2 – – – 9 6 4 – – – –Timor-Leste 216,440 291,500 283,760 193,280 272,740 261,660 195 255 241 8 9 7 – – – 18 21 15 3 3 3 3High-incomeCommonwealth countriesAntigua and Barbuda 5,640 19,070 15,300 3,350 19,270 15,080 65 219 168 – 2 1 1 5 4 1 3 2 – – – –Bahamas, The – – – – – – – – – – – – – – – – – – – – – –Barbados 11,960 16,200 – 10,650 14,800 – 43 58 – – – – 1 3 – – 1 – – – – –Brunei Darussalam – – – – – – – – – – – – – – – – – – – – – –Cyprus – – – – – – – – – – – – – – – – – – – – – –Malta – – – – – – – – – – – – – – – – – – – – – –St Kitts and Nevis 5,130 11,420 16,470 4,130 8,710 18,110 99 218 297 1 2 2 2 5 7 1 3 4 – – – –
137

Table 30. Aid dependency (continued)
Group/country NET ODA received
Net ODA received (current US$ ’000)
Net bilateral aid flows from DAC donors, total (current US$ ’000)
NET ODA received per capita (current US$ ’000)
Gross national income (%)
Gross capital formation (%)
Imports (%)
IDA Resource Allocation Index (1 = low to 6 = high)
2009 2010 2011 2009 2010 2011 2009 2010 2011 2009 2010 2011 2009 2010 2011 2009 2010 2011 2009 2010 2011 2012
Trinidad and Tobago 6,840 4,330 6,010 4,070 – 5 3 – – – – – – – – – – – – – –Other countriesBahrain – – – – – – – – – – – – – – – – – – – – – –Croatia 168,820 150,710 161,040 142,660 280 38 34 – – – – 1 1 1 1 – – – – –Equatorial Guinea 31,490 84,710 24,190 28,210 78,940 21,800 47 122 34 – 1 – – 1 – – – – – –Estonia – – – – – – – – – – – – – – – – – – – – – –Kuwait – – – – – – – – – – – – – – – – – – – – – –Latvia – – – – – – – – – – – – – – – – – – – – – –Lithuania – – – – – – – – – – – – – – – – – – – – – –Oman 153,820 −40,320 – 8,390 7,550 – 58 −14 – – – – – – – 1 – – – – – –Qatar – – – – – – – – – – – – – – – – – – – – – –Slovenia – – – – – – – – – – – – – – – – – – – – – –Uruguay 50,030 46,710 16,100 44,230 40,020 11,060 15 14 4 – – – 1 1 – 1 – – – – – –
Note: – = not availableSource: World Bank, World Development Indicators 2013, available at: http://databank.worldbank.org (accessed June 2013)
138

Table 30. Aid dependency (continued)
Group/country NET ODA received
Net ODA received (current US$ ’000)
Net bilateral aid flows from DAC donors, total (current US$ ’000)
NET ODA received per capita (current US$ ’000)
Gross national income (%)
Gross capital formation (%)
Imports (%)
IDA Resource Allocation Index (1 = low to 6 = high)
2009 2010 2011 2009 2010 2011 2009 2010 2011 2009 2010 2011 2009 2010 2011 2009 2010 2011 2009 2010 2011 2012
Trinidad and Tobago 6,840 4,330 6,010 4,070 – 5 3 – – – – – – – – – – – – – –Other countriesBahrain – – – – – – – – – – – – – – – – – – – – – –Croatia 168,820 150,710 161,040 142,660 280 38 34 – – – – 1 1 1 1 – – – – –Equatorial Guinea 31,490 84,710 24,190 28,210 78,940 21,800 47 122 34 – 1 – – 1 – – – – – –Estonia – – – – – – – – – – – – – – – – – – – – – –Kuwait – – – – – – – – – – – – – – – – – – – – – –Latvia – – – – – – – – – – – – – – – – – – – – – –Lithuania – – – – – – – – – – – – – – – – – – – – – –Oman 153,820 −40,320 – 8,390 7,550 – 58 −14 – – – – – – – 1 – – – – – –Qatar – – – – – – – – – – – – – – – – – – – – – –Slovenia – – – – – – – – – – – – – – – – – – – – – –Uruguay 50,030 46,710 16,100 44,230 40,020 11,060 15 14 4 – – – 1 1 – 1 – – – – – –
Note: – = not availableSource: World Bank, World Development Indicators 2013, available at: http://databank.worldbank.org (accessed June 2013)
139

Table 31. Average exchange rates
Group/country National currency per US$
2007 2008 2009 2010 2011 2012
Middle-incomeCommonwealth countriesBelize 2.0 2.0 2.0 2.0 2.0 2.0Botswana 6.1 6.8 7.2 6.8 6.8 7.6Dominica 2.7 2.7 2.7 2.7 2.7 2.7Fiji 1.6 1.6 2.0 1.9 1.8 1.8Grenada 2.7 2.7 2.7 2.7 2.7 2.7Guyana 202.3 203.6 204.0 203.6 204.0 204.4Jamaica 69.2 72.8 87.9 87.2 85.9 88.8Kiribati 1.2 1.2 1.3 1.1 1.0 1.0Lesotho 7.0 8.3 8.5 7.3 7.3 8.2Maldives 12.8 12.8 12.8 12.8 14.6 15.4Mauritius 31.3 28.5 32.0 30.8 28.7 30.1Namibia 7.0 8.3 8.5 7.3 7.3 8.2Nauru – – – – – –Papua New Guinea 3.0 2.7 2.8 2.7 2.4 2.1St Lucia 2.7 2.7 2.7 2.7 2.7 2.7St Vincent and the Grenadines 2.7 2.7 2.7 2.7 2.7 2.7Samoa 2.6 2.6 2.7 2.5 2.3 2.3Seychelles 6.7 9.5 13.6 12.1 12.4 13.7Solomon Islands 7.7 7.7 8.1 8.1 7.6 7.4Swaziland 7.0 8.3 8.5 7.3 7.3 8.2Tonga 2.0 1.9 2.0 1.9 1.7 1.7Tuvalu – – – – – –Vanuatu 102.4 101.3 106.7 96.9 89.5 –Other countriesAlbania 90.4 83.9 95.0 103.9 100.9 108.2Armenia 342.1 306.0 363.3 373.7 372.5 401.8Bhutan 41.3 43.5 48.4 45.7 46.7 53.4Bosnia and Herzegovina 1.4 1.3 1.4 1.5 1.4 1.5Cape Verde 80.6 75.3 79.4 83.3 79.3 85.8Congo, Republic of 479.3 447.8 472.2 495.3 471.9 510.5Costa Rica 516.6 526.2 573.3 525.8 505.7 502.9Djibouti 177.7 177.7 177.7 177.7 177.7 177.7Gabon 479.3 447.8 472.2 495.3 471.9 510.5Georgia 1.7 1.5 1.7 1.8 1.7 1.7Lebanon 1507.5 1507.5 1507.5 1507.5 1507.5 1507.5Macedonia, FYR 44.7 41.9 44.1 46.5 44.2 47.9Mauritania 258.6 238.2 262.4 275.9 281.1 296.6Moldova 12.1 10.4 11.1 12.4 11.7 12.1Mongolia 1170.4 1165.8 1437.8 1357.1 1265.5 1357.6Montenegro 0.7 0.7 0.7 0.8 0.7 0.8Panama 1.0 1.0 1.0 1.0 1.0 1.0São Tomé and Príncipe 13536.8 14695.2 16208.5 18498.6 17622.9 19068.4Suriname 2.7 2.7 2.7 2.7 3.3 3.3Timor-Leste 1.0 1.0 1.0 1.0 1.0 1.0High-incomeCommonwealth countriesAntigua and Barbuda 2.7 2.7 2.7 2.7 2.7 2.7Bahamas, The 1.0 1.0 1.0 1.0 1.0 1.0Barbados 2.0 2.0 2.0 2.0 2.0 2.0Brunei Darussalam 1.5 1.4 1.5 1.4 1.3 1.2Cyprus 0.4 – – – – –Malta 0.3 – – – – –St Kitts and Nevis 2.7 2.7 2.7 2.7 2.7 2.7Trinidad and Tobago 6.3 6.3 6.3 6.4 6.4 6.4
(continued)
140

Table 31. Average exchange rates (continued)
Group/country National currency per US$
2007 2008 2009 2010 2011 2012
Other countriesBahrain 0.4 0.4 0.4 0.4 0.4 0.4Croatia 5.4 4.9 5.3 5.5 5.3 5.9Equatorial Guinea 479.3 447.8 472.2 495.3 471.9 510.5Estonia 11.4 10.7 11.3 11.8 – –Iceland 64.1 87.9 123.6 122.2 116.0 125.1Ireland – – – – – –Kuwait 0.3 0.3 0.3 0.3 0.3 0.3Latvia 0.5 0.5 0.5 0.5 0.5 0.5Lithuania 2.5 2.4 2.5 2.6 2.5 2.7Luxembourg – – – – – –Norway 5.9 5.6 6.3 6.0 5.6 5.8Oman 0.4 0.4 0.4 0.4 0.4 0.4Qatar 3.6 3.6 3.6 3.6 3.6 3.6Slovenia – – – – – –Uruguay 23.5 20.9 22.6 20.1 19.3 20.3
Note: – = not availableSource: World Bank, World Development Indicators 2013, available at: http://databank.worldbank.org (accessed June 2013)
141

Table 32. Money supply and nominal interest rates
Group/country Money supply (millions national currency) Interest rates (% per annum)
2008 2009 2010 2011 2012 2008 2009 2010 2011 2012
Middle-incomeCommonwealth countriesBelize 706 713 708 839 1,103 14.1 14.1 13.9 13.4 12.4Botswana 7,768 7,108 9,264 8,675 10,555 16.5 13.8 11.5 11.0 11.0Dominica 210 231 229 224 272 9.1 10.0 9.5 8.8 9.0Fiji 1,357 1,262 1,411 2,000 2,092 8.0 7.9 7.5 7.5 7.0Grenada 509 480 474 460 446 9.5 11.0 10.6 10.7 9.7Guyana 75,525 79,639 97,300 113,587 132,055 14.6 14.5 14.5 14.5 13.9Jamaica 112,147 120,510 153,851 169,413 159,453 16.8 16.4 20.5 19.5 17.6Kiribati – – – – – – – – – –Lesotho 3,877 4,179 4,989 2,822 3,476 16.2 13.0 11.2 10.4 10.1Maldives 9,812 11,500 12,523 15,028 15,804 13.0 13.0 10.4 10.2 10.5Mauritius 75,590 86,001 85,798 89,733 96,801 11.5 9.3 8.9 8.9 8.7Namibia 17,998 20,547 23,061 26,319 24,949 13.7 11.1 9.7 8.7 8.7Nauru – – – – – – – – – –Papua New Guinea 5,520 6,233 7,644 9,620 11,148 9.2 10.1 10.4 10.8 10.8St Lucia 823 807 810 840 897 10.1 10.6 10.6 10.0 9.5St Vincent and the
Grenadines461 413 420 417 420 9.5 9.2 9.2 9.1 9.4
Samoa 189 224 265 254 246 12.7 12.1 10.7 10.0 9.9Seychelles 4,725 4,784 5,355 6,331 6,217 11.8 15.3 12.7 11.2 12.2Solomon Islands 995 1,128 1,304 1,873 2,396 14.4 15.3 14.4 13.2 11.3Swaziland 1,972 2,337 2,539 2,882 3,439 14.8 11.4 9.8 9.0 8.8Tonga 96 91 107 123 148 12.5 12.5 11.5 11.4 10.9Tuvalu – – – – – – – – – –Vanuatu 20,012 22,448 22,132 22,413 – 5.3 5.5 5.5 – –Other countriesAlbania 312,520 324,929 325,086 325,193 330,730 13.0 12.7 12.8 12.4 10.9Armenia 482,881 500,786 547,279 636,701 694,308 17.0 18.8 19.2 17.8 17.2Bhutan 14,165 22,634 29,074 33,216 33,376 13.8 13.8 14.0 14.0 14.0Bosnia and Herzegovina
6,799 6,625 7,111 7,286 7,196 7.0 7.9 7.9 7.4 6.9
Cape Verde 46,112 44,538 48,122 45,332 47,745 10.0 11.0 11.0 9.8 9.9Congo, Republic of 834,642 871,033 1,165,809 1,627,683 1,941,388 – – – – –Costa Rica 4,019,365 4,244,603 4,760,511 5,277,225 – 15.8 19.7 17.1 16.1 18.2Djibouti 82,236 102,678 127,292 123,096 – 11.6 11.1 10.3 10.6 –Gabon 759,260 764,766 933,103 1,236,573 1,221,798 – – – – –Georgia 2,641 2,787 3,695 4,069 4,262 23.0 24.2 22.5 22.2 22.1Lebanon 4,269,286 4,839,666 5,728,339 6,138,351 7,103,571 10.0 9.6 8.3 7.5 7.2Macedonia, FYR 69,744 72,710 79,845 85,166 88,739 9.7 10.1 9.5 8.9 8.5Mauritania 203,057 232,111 259,969 325,221 363,488 20.3 19.5 17.0 17.0 17.0Moldova 13,560 16,006 18,641 20,823 23,962 21.1 20.5 16.4 14.4 13.4Mongolia 930,460 1,023,239 1,923,758 2,521,915 2,694,515 20.6 21.7 20.1 16.6 18.1Montenegro 577 534 586 579 614 9.2 9.4 9.5 9.7 9.6Panama – – – – – 8.2 8.2 7.7 6.9 6.9São Tomé and Príncipe – – – – – 32.4 31.1 28.9 27.0 26.2Suriname 2,422 2,656 2,985 3,523 4,291 12.2 11.7 11.6 11.8 11.7Timor-Leste 104 157 141 163 206 13.1 11.2 11.0 11.0 12.2High-incomeCommonwealth countriesAntigua and Barbuda 1,238 967 978 950 965 10.4 10.1 11.0 10.9 10.2Bahamas, The 1,255 1,252 1,310 1,408 1,537 5.5 5.5 5.5 5.1 4.8Barbados 3,497 3,592 – – – 10.0 9.2 8.7 8.7 8.7Brunei Darussalam – – – – – 5.5 5.5 5.5 5.5 5.5Cyprus 9,314 10,560 10,926 11,381 11,820 – – – – –Malta 3,861 4,345 4,966 5,373 5,918 5.9 4.5 4.6 4.7 4.7
(continued)
142

Table 32. Money supply and nominal interest rates (continued)
Group/country Money supply (millions national currency) Interest rates (% per annum)
2008 2009 2010 2011 2012 2008 2009 2010 2011 2012
St Kitts and Nevis 726 678 744 857 1,002 8.7 8.8 8.6 9.4 8.7Trinidad and Tobago 19,227 26,655 – – – 12.4 11.9 9.3 8.0 –Other countriesBahrain 1,899 2,158 2,304 2,637 2,611 8.2 7.9 7.2 6.8 6.0Croatia 56,005 48,184 53,695 57,905 59,766 10.1 11.6 10.4 9.7 9.5Equatorial Guinea 509,698 668,395 891,786 960,842 1,480,100 – – – – –Estonia 3,697 3,612 4,646 7,201 8,219 8.5 9.4 7.8 6.1 5.7Iceland 518,118 539,395 524,986 505,957 467,736 – – – – –Ireland 79,601 101,213 98,467 91,392 93,376 – – – – –Kuwait 4,901 5,159 6,128 6,858 8,010 7.6 6.2 4.9 5.2 5.0Latvia 3,344 2,980 3,771 4,357 4,833 11.9 16.2 9.6 6.4 5.5Lithuania 23,322 22,049 27,397 31,318 35,896 8.4 8.4 6.0 – –Luxembourg 70,349 73,066 94,761 94,852 110,228 – – – – –Oman 2,289 2,697 3,298 3,443 3,968 7.1 7.4 6.8 6.2 5.7Qatar 67,306 71,393 87,579 113,318 118,577 6.8 7.0 7.3 5.5 5.4Slovenia 10,097 10,911 12,061 12,388 12,858 6.7 5.9 – – –Uruguay 120,218 121,379 156,219 186,611 203,325 12.4 15.3 10.3 9.8 11.2
Note: – = not availableSource: World Bank, World Development Indicators 2013, available at: http://databank.worldbank.org (accessed June 2013)
143

Table 33. Doing business
Group/country Rank Starting a business Dealing with construction permits Getting electricity Registering property Getting credit
2010 2011 2012 2013 2010 2011 2012 2013 2014 2010 2011 2012 2013 2014 2010 2011 2012 2013 2014 2010 2011 2012 2013 2014 2010 2011 2012 2013 2014Middle-incomeCommonwealth countriesBelize 93 99 104 106 70.74 70.46 70.05 69.97 70.64 90.77 90.69 90.62 90.61 90.72 78.6 78.5 78.41 78.39 78.55 61.89 61.91 61.93 61.9 61.85 43.75 43.75 43.75 43.75 43.75Botswana 50 52 65 56 72.55 72.54 72.57 72.59 72.58 60.81 60.62 61.06 61.61 70.95 70.51 70.4 70.72 70.92 70.79 79.87 79.9 79.82 79.74 79.77 62.5 62.5 62.5 62.5 62.5Dominica 85 88 69 77 87.41 87.48 87.72 88.5 88.34 83.39 83.39 83.39 83.43 83.42 77.33 77.27 77.43 78.37 78.16 58.67 58.69 59.46 59.39 59.35 56.25 56.25 56.25 56.25 56.25Fiji 61 62 58 62 74.52 74.7 72.98 66.49 66.59 75.41 75.44 75.4 75.29 75.31 76.62 76.95 76.54 77.43 77.69 82.39 82.39 82.39 78.91 78.91 68.75 68.75 68.75 68.75 68.75Grenada 98 92 102 107 83.86 84.88 84.89 85.61 85.54 88.73 88.73 88.73 88.79 88.78 74.28 74.19 74.24 74.51 74.52 55.49 58.87 58.86 58.82 58.83 43.75 43.75 43.75 43.75 43.75Guyana 101 100 113 115 79.03 80.33 81.65 81.57 81.75 82.53 82.71 82.76 82.75 82.77 50.29 51.84 51.98 51.89 52.12 71.9 71.9 67.16 67.16 67.16 25 25 25 25 25Jamaica 79 81 91 94 88.8 88.81 88.79 88.84 90.88 84.35 84.42 84.69 84.85 85.75 67.37 67.39 67.55 66.98 67.04 61.04 66.48 66.48 66.48 63.12 50 50 50 50 50Kiribati 91 93 117 122 79.02 78.81 78.92 78.89 78.82 71.74 71.64 71.69 71.68 71.64 50.38 49.31 49.89 49.75 49.4 53.29 53.28 53.28 53.27 53.27 31.25 31.25 31.25 31.25 31.25Lesotho 137 138 139 136 76.82 76.94 77.12 81.5 81.69 55.5 55.39 56.27 57.08 58.34 59.75 59.78 60.54 63.29 64.34 58.4 58.38 58.52 58.63 70.48 37.5 37.5 37.5 37.5 37.5Maldives 96 85 81 95 89.6 89.69 89.76 90.17 90.13 84.58 84.56 84.57 84.62 84.62 66.04 66.21 66.36 65.96 65.9 0 48.23 48.45 49.49 49.4 50 50 50 50 50Mauritius 20 20 20 20 91.16 91.2 91.23 91.26 91.23 66.53 66.57 66.59 66.61 66.62 81.65 81.78 81.85 82.94 82.99 68.97 69 69.46 70.27 70.28 56.25 56.25 56.25 68.75 75Namibia 68 69 94 98 67.17 67.41 67.56 67.4 67.85 82.58 82.85 82.88 82.77 82.85 72.52 72.74 72.93 75.44 75.77 58.12 54.86 55.26 50.78 47.09 68.75 68.75 68.75 68.75 68.75Nauru – – – – – – – – – – – – – – – – – – – – – – – – – – – – –Papua New Guinea 108 103 108 113 77.77 77.92 78.17 77.98 78.04 60.38 60.49 60.68 60.87 60.92 86.26 86.25 86.28 86.31 86.32 73.26 73.27 73.3 73.32 73.33 31.25 50 50 56.25 56.25St. Lucia 45 53 59 64 87.29 87.05 86.75 87.55 87.46 89.81 89.77 89.76 89.9 91.11 84.7 84.63 84.53 84.67 84.64 58.8 58.88 58.91 58.62 58.66 43.75 43.75 43.75 43.75 43.75St. Vincent and the
Grenadines72 75 75 82 84.47 84.66 84.53 85.05 85.14 89.84 89.78 89.77 89.8 89.8 – – – – – 55.56 55.56 55.55 55.59 55.6 43.75 43.75 43.75 43.75 43.75
Samoa 59 61 55 61 91.59 91.61 91.62 91.65 91.63 72.5 72.51 72.52 72.53 72.52 87.65 87.73 87.82 88.06 88.09 67.48 80.96 82.32 82.35 78.74 43.75 43.75 43.75 43.75 43.75Seychelles 92 95 77 80 73.21 73.42 73.6 73.81 74.19 75.49 75.4 75.44 75.5 75.52 60.18 59.86 60.09 60.36 61.53 74.44 74.44 74.44 74.44 74.44 25 25 25 25 25Solomon Islands 106 96 92 97 68.73 67.73 73.67 81.66 81.72 78.88 78.07 78.46 78.76 78.79 66.29 63.99 65.11 65.95 65.69 28.8 51.97 52.11 52.17 52.18 25 56.25 56.25 56.25 56.25Swaziland 120 123 63.26 64.25 64.7 65.33 68.82 82.64 82.68 82.84 83.06 82.91 57.71 57.91 58.54 59.39 58.8 56.45 56.6 58.95 58.93 58.94 68.75 68.75 68.75 68.75 68.75Tonga 66 71 60 57 88.3 88.45 90.02 90.26 90.33 84.77 84.99 85.04 85.14 85.22 81.58 81.66 82.78 82.82 82.85 55.3 55.51 51.64 51.66 51.68 43.75 43.75 56.25 56.25 68.75Tuvalu – – – – – – – – – – – – – – – – – – – – – – – – – – – – –Vanuatu 59 60 78 74 70.92 71.55 74.31 74.29 74.41 95.12 95.39 87.99 84.33 84.42 48.19 48.67 48.77 67.49 67.56 54.78 54.78 64.89 64.86 64.85 56.25 56.25 56.25 56.25 68.75Other countriesAlbania 81 82 82 90 86.01 86.06 86.46 89.3 89.44 47.33 47.38 – – – 55.52 55.51 55.62 55.67 55.78 56.41 54.93 59.28 60.18 60.75 87.5 87.5 87.5 87.5 87.5Armenia 44 48 40 37 89.59 89.54 94.45 94.49 97.32 64.36 64.15 71.25 72.69 72.67 47.87 47.72 47.8 55.02 55.05 92.57 92.14 92.18 92.38 92.41 68.75 68.75 75 75 75Bhutan 140 142 146 141 76.75 76.84 79.02 79.02 80.02 65.2 65.34 65.33 65.43 65.59 72.37 72.76 72.76 74.59 75.09 74.57 74.57 74.57 74.57 74.57 18.75 18.75 43.75 43.75 50Bosnia and Herzegovina 110 110 130 131 62.04 62.87 68.24 70.95 70.95 52.93 52.65 59.3 59.4 59.42 49.4 49.77 49.84 49.85 49.85 61.82 67.42 67.43 68.32 68.32 62.5 62.5 62.5 62.5 62.5Cape Verde 142 132 128 121 76.63 80.89 81.24 81.73 85.59 70.4 69.89 70.81 71.5 71.97 59.33 58.99 59.35 59.86 60.2 62.33 68.54 73.38 73.56 74.69 31.25 31.25 50 50 50Congo, Republic of 177 177 186 185 41.98 37.35 42.56 46.53 50.06 47 42.51 49.52 63.47 67.66 42.54 35.27 44.38 46.04 46.47 57.41 58.96 43.94 43.94 43.94 31.25 31.25 50 50 50Costa Rica 121 125 109 102 66.22 66.25 66.3 66.25 79.44 64.27 64.39 64.46 71.65 78.81 79.21 79.25 79.31 79.47 79.58 75.27 75.39 78.84 78.85 78.86 50 50 50 56.25 56.25Djibouti 157 158 172 160 26.58 32.34 32.89 31.73 59.9 51.63 54.73 50.58 53.39 54.19 37.36 38.24 38.31 42.07 43.14 56.6 56.86 56.86 57.06 57.11 12.5 12.5 12.5 12.5 18.75Gabon 158 156 169 163 71.72 70.92 71.78 72.32 76.02 70.88 70.69 70.88 70.83 77.84 58.59 58.22 58.59 61.47 61.65 61.23 61.23 61.23 53.94 53.94 31.25 31.25 50 50 50Georgia 13 12 9 8 95.44 95.28 97.36 97.43 97.47 91.44 91.43 91.46 91.5 91.52 72.75 72.53 72.93 83.77 83.94 96.4 99.78 99.8 99.81 99.81 75 81.25 87.5 93.75 93.75Lebanon 109 113 105 111 79.08 80.01 81.2 81.22 80.09 59.34 60.14 60.46 59.74 57.5 78 78.14 78.24 78.24 78.25 64.01 64.01 64.04 64.04 63.93 50 50 50 50 50Macedonia, FYR 36 38 36 25 – – – – – – – – – – – – – – – 68.16 68.16 69.85 69.68 71.03 68.75 68.75 81.25 81.25 93.75Mauritania 167 165 171 173 52.38 54.63 59.36 59.79 60.63 53.81 55.26 68.1 50.75 52 45.28 45.5 51.7 50.95 51.36 75.72 75.72 76.57 76.6 76.65 25 25 25 25 25Moldova 87 90 86 78 84.03 83.89 86.16 86.32 88.61 47.79 47.8 47.97 48.08 48.12 45.82 53.32 53.82 54.12 54.25 84.5 84.49 84.51 84.51 84.52 50 50 75 75 87.5Mongolia 63 73 80 76 84.02 83.86 84.43 86.48 90.39 61.8 61.76 61.89 61.99 66.23 46.91 46.76 47.46 47.8 51.85 81.94 81.86 81.98 81.97 82.02 56.25 56.25 62.5 68.75 68.75Montenegro 65 66 50 44 79.32 86.98 88.78 88.81 88.81 57.97 56.42 53.81 57.03 72.14 77.38 77.17 77.2 77.36 77.37 66.59 66.59 66.81 66.83 70.22 87.5 87.5 87.5 93.75 93.75Panama 62 72 61 55 87.32 87.98 88.25 88.59 90.79 75.62 75.71 75.75 76.92 78.64 84.1 84.11 84.11 84.12 84.13 – – – – – – – – – –Suriname 160 161 165 161 39.46 39.12 39.72 40.22 40.6 72.2 72.22 72.25 72.27 74.8 74.59 84.71 85.26 85.3 85.69 37.74 37.75 37.79 37.92 48.02 25 25 25 25 25Timor-Leste 174 174 167 172 29.32 47.13 55.25 60.49 59.99 63.17 63.11 63.14 63.26 63.24 93.45 92.68 89.69 91.43 91.26 – – – – – 12.5 12.5 31.25 31.25 31.25High-incomeCommonwealth countriesAntigua and Barbuda 56 64 66 71 81.87 81.7 81.52 81.71 81.76 84.94 84.91 84.87 84.91 84.92 89.43 89.37 89.31 89.38 89.4 62.06 58.63 58.56 58.64 58.67 43.75 43.75 43.75 43.75 43.75Bahamas, The 71 77 76 84 81.71 82.98 82.99 83.02 83.01 75.38 75.36 75.36 75.38 75.37 79.33 79.3 79.31 79.34 79.35 28.21 45.05 42.32 42.38 45.75 56.25 56.25 56.25 56.25 56.25Barbados – – 84 91 – – 82.77 82.81 82.81 – – 60.78 60.78 60.78 – – 66.43 66.44 66.44 – – 56.66 56.67 56.67 – – 56.25 56.25 56.25Brunei Darussalam 117 112 79 59 48.82 50.56 51.63 51.77 51.87 55.16 55.14 55.15 70.99 71 77.92 77.88 81.09 81.1 81.12 45.63 45.62 45.63 45.63 45.63 43.75 43.75 43.75 43.75 68.75Cyprus 35 37 38 39 88.03 87.92 87.86 87.95 87.96 61.72 61.78 61.75 61.77 61.71 54.36 54.39 54.37 54.4 54.37 60.69 61.5 61.16 62.42 62.76 56.25 68.75 68.75 68.75 68.75Malta 100 103 – – 72.23 72.26 72.26 – – 63.3 63.4 64.41 – – 68.37 68.43 68.43 – – 69.78 69.78 69.78 – – 18.75 18.75 18.75St. Kitts and Nevis 83 87 97 101 83.89 83.89 83.86 84.15 84.31 83.26 83.22 83.22 83.23 83.24 91.8 91.81 91.78 92.07 92.12 51.56 51.56 51.56 51.58 51.59 43.75 43.75 43.75 43.75 43.75Trinidad and Tobago 95 97 63 66 76.35 78.56 78.56 78.57 81.11 68.34 68.33 68.33 68.33 68.33 87.02 87.2 87.19 87.2 87.2 48.57 48.56 48.54 52.7 52.7 81.25 81.25 81.25 81.25 81.25Other countriesBahrain 25 28 47 46 77.74 73.86 74.53 76.02 76.16 88.39 88.34 88.34 88.36 88.36 76.35 76.28 76.29 76.32 76.32 91.76 88.68 88.68 88.68 88.68 37.5 37.5 37.5 37.5 43.75Croatia 89 84 88 89 83.03 87.61 87.72 87.9 88.32 50.59 60.6 60.58 58.37 59.98 78.13 78.1 78.1 78.13 78.13 66.6 66.6 66.71 66.71 66.71 68.75 68.75 75 75 75Equatorial Guinea 161 164 164 166 37.55 36.81 37.37 37.61 37.5 73.86 72.87 73.61 73.94 73.79 71.24 71.24 72.2 72.63 72.43 59.5 59.49 59.5 59.5 59.5 31.25 31.25 50 50 50Estonia 17 17 21 22 90.2 90.06 90.13 90.26 90.35 80.72 79.44 79.45 79.47 79.48 79.52 79.43 79.46 79.54 79.59 90.71 90.62 90.61 90.61 90.66 68.75 75 75 75 75Iceland 14 15 13 13 90.74 91.01 90.97 91.06 91.14 77.95 78.04 78.03 78.04 78.07 92.61 92.61 92.59 92.58 92.59 88.89 88.89 88.88 88.94 88.94 75 75 75 75 75Ireland 8 9 15 15 91.88 91.87 91.87 92.53 92.54 79.84 74.08 73.79 73.69 75.62 60.29 60.24 60.22 60.21 60.23 71.19 71.92 71.49 78.31 78.26 87.5 87.5 87.5 87.5 87.5Kuwait 69 74 101 104 68.01 66.8 69.8 70.56 69.51 64.13 63.7 63.9 64.17 64.14 69.69 69.63 69.68 69.7 69.7 69.7 69.68 70.64 70.64 70.64 43.75 43.75 43.75 43.75 43.75Latvia 27 24 24 24 88.63 88.61 91.06 91.09 91.79 61.36 63.23 63.21 63.24 71.89 60.89 60.73 72.41 72.6 72.83 74.94 75.28 81.3 81.3 81.31 93.75 93.75 93.75 93.75 93.75Lithuania 26 23 25 17 81.89 84.26 84.29 83.47 93.23 77.05 77.03 77.42 78.67 78.7 70.96 71.01 68.24 68.27 68.3 91.71 91.7 91.75 91.76 91.77 68.75 68.75 68.75 68.75 81.25Luxembourg 42 45 56 60 84.74 85.71 85.87 85.89 85.89 72.6 72.56 80.13 80.13 80.13 72.17 72.12 72.14 72.15 72.15 59.53 59.73 59.83 59.84 59.84 25 25 25 25 25Norway 7 8 7 9 90.29 90.23 90.26 90.97 90.99 74.15 74.08 74.08 84.67 84.69 86.48 86.48 86.48 86.48 86.48 95.49 95.49 95.49 95.49 95.5 62.5 62.5 62.5 62.5 62.5Oman 57 57 44 47 76.6 75.73 77.45 79.91 80.58 75.96 75.93 76.97 77.06 77.08 73.52 73.51 73.52 73.56 73.57 89.85 89.85 89.85 89.85 89.85 37.5 37.5 50 56.25 56.25Qatar 39 50 45 48 84.07 78.43 81.22 82.18 82.08 80.99 80.99 80.99 80.99 80.99 83.18 83.17 83.18 83.18 83.18 78.23 78.23 78.23 78.23 78.23 31.25 31.25 43.75 43.75 43.75Slovenia 43 42 31 33 93.09 94.8 94.86 94.85 94.84 76.59 77.72 77.74 77.73 80.43 83.33 83.3 83.31 83.31 83.31 46.55 67.28 71 71.01 70.99 50 50 50 50 50Uruguay 122 124 85 88 63.25 63 88.55 88.63 88.82 56.87 56.89 56.96 57.02 57.05 82.3 82.3 82.3 82.31 82.3 53.97 57.3 57.31 57.31 57.32 62.5 62.5 62.5 62.5 62.5

Table 33. Doing business (continued)
Group/country Protecting investors Paying taxes Trading across borders Enforcing contracts Resolving insolvency
2010 2011 2012 2013 2014 2010 2011 2012 2013 2014 2010 2011 2012 2013 2014 2010 2011 2012 2013 2014 2010 2011 2012 2013 2014Middle-incomeCommonwealth countriesBelize 43.33 43.33 43.33 43.33 43.33 68.76 68.76 74.77 74.77 74.77 69.01 68.91 68.98 70.2 70.79 35.64 35.64 35.64 35.64 35.64 67.15 67.33 67.46 67.74 68.29Botswana 60 60 60 60 60 76.36 75.78 75.78 75.78 75.78 44.14 44.29 47.77 52.24 50.73 60.58 62.28 63.47 63.47 63.47 60.92 64.43 65.24 65.57 65.57Dominica 63.33 63.33 63.33 63.33 63.33 69.66 69.66 69.57 69.57 69.57 70.4 71.02 70.53 70.73 70.91 41.89 41.89 41.89 41.89 41.89 29.83 28.95 30.01 30.19 29.97Fiji 60 60 60 60 60 67.87 68.34 68.89 68.73 69.18 60.01 60.92 61.28 61.71 60.82 62.88 62.88 62.88 62.88 62.88 47.02 47.78 47.88 47.85 48.24Grenada 63.33 63.33 63.33 63.33 63.33 67.63 67.63 67.63 67.63 67.63 73.29 78.02 78.04 77.79 78.02 42.93 42.93 42.93 42.93 42.93 – – – – –Guyana 53.33 53.33 53.33 53.33 53.33 61.51 61.51 64.4 64.4 66.65 70.09 71.02 71.38 71.81 72.08 60.44 60.44 60.44 60.44 60.44 18.59 18.68 18.68 18.68 19.01Jamaica 53.63 53.33 53.33 53.33 53.33 33.27 33.96 36.52 54.01 54 62.38 63.88 65.09 65.3 65.98 52.21 52.21 52.21 52.21 52.21 68.36 68.91 69.17 66.87 68.03Kiribati 60 60 60 60 60 88.86 88.86 88.86 88.86 88.86 72.8 72.85 72.43 72.59 72.73 62.83 62.83 62.83 62.83 62.83 – – – – –Lesotho 36.67 36.67 36.67 50 50 68.09 68.09 68.09 68.09 68.09 42.47 50.79 50.95 54.86 56.03 44.25 44.25 45.44 51.35 51.35 27.1 29.04 29.9 30.02 30.25Maldives 53.33 53.33 53.33 53.33 53.33 100 100 100 79.94 63.92 60.36 59.3 59.35 60.15 60.14 55.35 55.35 55.35 55.35 55.35 51.58 51.58 53.37 53.56 53.35Mauritius 76.67 76.67 76.67 76.67 76.67 89.56 88.97 88.69 88.84 88.86 84.91 85.5 85.42 85.87 85.92 59.87 61.92 61.92 61.92 63.13 35.54 37.22 37.22 43.3 43.47Namibia 53.33 53.33 53.33 53.33 53.33 65.19 65.19 65.19 66.38 66.38 56.93 57.49 56.89 57.82 59.28 62.38 62.38 62.38 62.38 63.48 32.9 35.71 36.37 36.94 37.01Nauru – – – – – – – – – – – – – – – – – – – – – – – – –Papua New Guinea 56.67 56.67 56.67 56.67 56.67 65.8 65.78 65.78 65.16 65.16 60.19 59.83 60.55 59.4 59.62 28.8 28.8 28.8 28.8 28.8 26.2 25.36 25.09 24.91 24.91St. Lucia 63.33 63.33 63.33 63.33 63.33 75.04 75.3 75.04 74.95 74.74 69.42 68.72 68.98 69.15 66.97 42.67 42.67 42.67 42.67 42.67 45.4 43.99 44.21 44.48 45.05St. Vincent and the Grenadines 63.33 63.33 63.33 63.33 63.33 68.22 69.53 69.53 69.53 69.67 78.57 78.52 78.82 78.79 78.89 54.18 54.18 54.18 54.18 54.18 – – – – –Samoa 63.33 63.33 63.33 63.33 63.33 70.69 70.69 70.69 70.69 70.69 74.26 74.37 74.42 74.5 74.56 56.36 56.36 56.36 56.36 56.36 18.37 18.71 19.18 19.27 19.31Seychelles 56.67 56.67 56.67 56.67 56.67 73.01 73.01 83.11 83.25 83.25 76.01 77.88 78.15 78.54 80.03 59.41 59.01 53.68 53.68 53.68 42.04 39.88 41.51 41.98 41.23Solomon Islands 56.67 56.67 60 60 60 79.23 79.23 79.23 79.23 79.23 70.48 70.33 70.69 71.87 72.29 43.22 43.22 43.22 43.22 43.22 25.03 24.77 25.21 25.27 25.7Swaziland 20 43.33 43.33 43.33 43.33 72.84 72.76 72.76 72.76 72.47 52.31 58.74 57.56 61.91 63.66 33.79 33.79 33.79 34.23 34.23 36.97 39.83 40.43 40.56 40.75Tonga 46.67 46.67 46.67 46.67 46.67 76.12 76.85 76.85 77.39 74.56 73.97 73.91 73.08 73.44 73.47 63.64 63.64 63.64 63.64 63.64 26.71 26.75 27.14 27.25 27.59Tuvalu – – – – – – – – – – – – – – – – – – – – – – – – –Vanuatu 53.33 53.33 53.33 53.33 53.33 78.95 78.95 78.95 78.95 78.95 62.9 62.6 65.68 65.89 66.02 60.54 60.54 60.54 60.54 60.54 43.65 45.27 45.27 45.27 44.72Other countriesAlbania 73.33 73.33 73.33 73.33 73.33 53.82 56.4 56.78 57.16 58.48 68.85 68.98 69.01 69.16 69.31 57.19 58.28 58.28 56.64 54.59 41 41.22 42.6 41.89 43.07Armenia 50 50 50 66.67 66.67 39.44 39.42 51.94 69.16 70.8 57.26 65.72 65.7 66.25 66.03 55.3 55.3 47.52 47.52 47.52 38.79 37.68 37.42 38.26 38.59Bhutan 36.67 36.67 36.67 36.67 36.67 69.81 69.81 69.81 69.81 69.81 39.73 33.68 34.71 36.63 36.86 66.18 66.18 66.18 66.18 66.18 – – – – –Bosnia and Herzegovina 46.67 46.67 46.67 46.67 46.67 51.37 51.37 51.37 58.1 60.29 66.2 65.42 65.94 66.13 66.27 56.4 55.68 55.68 55.68 55.68 38.04 36.75 37.03 37.55 38.17Cape Verde 40 40 40 40 40 55.29 69.31 69.13 70.03 70.03 67.95 68.27 68.51 68.79 69.03 64.75 64.75 65.47 65.47 65.47 – – – – –Congo, Republic of 33.33 33.33 33.33 33.33 33.33 16.6 16.37 16.94 17.17 24.57 24.16 6.94 10.03 11.46 13.5 41.34 41.34 41.34 41.34 41.34 18.83 18.83 18.94 18.83 18.94Costa Rica 30 30 30 30 30 49.18 49.58 56.83 62.16 62.16 76.59 77.34 78.01 79.46 79.5 48.6 48.6 48.6 48.6 48.6 26.93 22.46 23.52 23.84 25.97Djibouti 23.33 23.33 23.33 23.33 23.33 79.28 71.58 71.96 71.96 71.96 75.84 75.95 76.54 76.85 77.1 34.89 34.89 34.89 34.89 34.89 16.84 16.53 17.47 17.51 17.76Gabon 33.33 33.33 33.33 33.33 33.33 53.51 54.2 54.2 54.2 54.2 60.11 57.17 59.91 61.87 61.02 41.4 41.4 41.4 41.4 41.4 16.06 16.06 16.06 16.06 16.06Georgia 60 66.67 70 70 70 66.71 66.71 80.37 85.5 85.5 82.07 81.37 80.76 82.7 82.83 66.83 66.83 66.83 70.4 70.4 29.56 39.01 39.4 33.42 35.54Lebanon 50 50 50 50 50 80.37 80.37 80.37 80.37 80.37 67.67 68.19 69.61 69.51 69.96 53.4 53.4 53.4 53.4 53.4 31.71 32.62 33.62 34.08 34.34Macedonia, FYR 63.33 63.33 63.33 63.33 70 72.6 74.08 80.09 80.09 80.09 70.28 70.71 70.96 71.28 71.32 55.6 55.6 55.6 55.6 57.32 43.82 43.56 44.52 44.68 46.36Mauritania 36.67 36.67 36.67 36.37 36.67 14.75 24.11 24.11 24.11 24.11 47.97 46.45 50.41 51.83 52.43 55.03 55.03 55.03 55.03 55.03 – – – – –Moldova 46.67 46.67 46.67 53.33 53.33 61.76 62.08 61.85 62.24 67.91 48.88 49.23 52.52 53.43 54.27 75.05 75.05 72.61 72.1 71.83 30.29 29.87 33.15 33.85 34.72Mongolia 63.33 63.33 63.33 66.67 66.67 70.04 70.04 70.04 70.04 70.04 22.57 22.96 25.52 23.63 24.3 70.54 70.54 70.54 70.54 70.54 23.35 21.15 22.36 24.06 22.86Montenegro 63.33 63.33 63.33 63.33 63.33 48.77 48.85 60.87 70.47 70.47 73.36 77.28 77.43 77.31 77.46 45.77 45.77 45.77 45.77 45.77 46.28 45.99 45.85 51.18 51.26Panama – – – – – 40.06 40.09 40.2 40.02 45.06 90.93 90.72 90.58 90.82 91.01 53.34 53.34 53.34 53.34 53.34 28.23 28.23 29 29.13 29.13Suriname 20 20 20 20 20 75.31 75.31 75.31 75.31 75.31 66.38 66.57 66.76 66.64 67.09 25.87 25.87 25.87 25.87 25.87 8.62 9.18 9.12 9.11 9.12Timor-Leste 46.67 46.67 46.67 46.67 46.67 85.14 85.14 85.14 78.58 78.58 66.38 66.69 66.78 67.45 67.91 – 1.5 1.5 1.5 1.5 – – – – –
High-incomeCommonwealth countriesAntigua and Barbuda 63.33 63.33 63.33 63.33 63.33 52.12 52.12 52.12 52.12 52.12 76.59 76.75 76.28 71 71.19 58.11 58.11 58.11 58.11 58.11 37.6 38.84 37.02 37.26 38.03Bahamas, The 46.67 46.67 46.67 46.67 46.67 78.31 78.31 77.38 77.37 77.36 77.73 76.66 76.58 76.43 75.73 47.83 47.83 47.83 47.83 47.83 65.84 65.84 65.84 66.67 67.27Barbados – – 30 30 30 – – 66.11 66.66 66.65 – – 81.49 81.49 81.49 – – 39.32 39.32 39.32 – – 68.93 68.93 68.93Brunei Darussalam 46.67 46.67 46.67 46.67 46.67 84.18 86.55 82.29 82.29 82.29 76.13 75.29 78.51 79.42 79.29 44.33 44.33 44.33 44.33 44.33 50.03 50.03 50.03 50.03 50.03Cyprus 50 50 63.33 63.33 63.33 78.66 78.66 78.66 78.23 78.23 81.23 81.21 80.96 81.11 81.23 51.09 51.09 51.09 51.09 51.09 74.91 74.51 74.95 74.85 74.64Malta – – 56.67 56.67 56.67 – – 82.7 82.74 82.71 – – 78.72 78.88 79.02 – – 53.88 53.88 53.88 – – 41.47 41.47 41.52St. Kitts and Nevis 63.33 63.33 63.33 63.33 63.33 66.11 66.09 57.23 57.57 57.57 74.99 75.24 75.89 74.75 74.88 50.33 50.33 50.33 50.33 50.33 – – – – –Trinidad and Tobago 66.67 66.67 66.67 66.67 66.67 65.76 65.76 68.59 68.59 68.59 68.58 67.85 68.3 71.81 71.87 29.55 29.55 29.55 29.55 29.55 26.07 26.77 27.96 28.42 28.53Other countriesBahrain 46.67 46.67 46.67 46.67 46.67 92.81 92.81 92.81 92.81 92.81 70.36 70.29 71.17 71.17 71.17 48.49 48.49 48.49 48.49 48.49 66.98 68.04 69.87 70.1 71.35Croatia 33.33 33.33 33.33 33.33 33.33 76.41 75.86 75.86 75.86 81.87 67.47 67.71 67.51 67.67 68.62 62.74 62.74 62.74 62.44 62.44 32.27 30.36 31.5 31.91 32.09Equatorial Guinea 36.67 36.67 36.67 36.67 36.67 42.74 42.74 42.74 42.74 42.74 54.56 49.93 53.56 56.48 57.57 61.01 61.01 61.01 61.01 61.01 – – – – –Estonia 56.67 56.67 56.67 56.67 56.67 81.4 81.14 75.46 70.41 80.68 91.68 91.67 91.71 91.56 91.73 66.95 66.95 66.95 66.95 67.09 39.67 37.61 39.1 40.77 41.2Iceland – – – – – 78.54 78.54 77.12 76.55 78.62 78.16 79.15 79.92 80.69 82.06 81.95 81.51 81.51 81.51 81.51 81.15 83.16 89.46 89.98 89.46Ireland 83.33 83.33 83.33 83.33 83.33 93.08 93.08 93.08 92.89 92.89 93.31 92.97 92.8 92.72 92.78 – – – – – 91.68 92.61 92.06 92.72 92.82Kuwait 50 50 50 50 53.33 90.39 90.39 90.39 90.39 90.39 62.91 60.9 61.92 63.93 63.91 47.7 47.7 47.7 47.7 47.7 29.73 32.66 37.79 33.59 33.87Latvia 56.67 56.67 56.67 56.67 56.67 77.91 77.24 77.7 79.63 79.63 80.42 81.59 81.47 81.77 83.57 79.35 79.35 77.71 74.98 74.98 30.73 33.75 49.15 50.67 51.3Lithuania 50 50 56.67 56.67 56.67 77.21 76.46 77.58 77.62 77.6 83.71 83.72 84.45 85.26 85.65 73.46 73.46 73.46 73.46 73.46 52.29 51.14 51.25 51.42 51.26Luxembourg 43.33 43.33 43.33 43.33 43.33 86.25 86.25 86.25 86.25 86.44 80.47 80.52 81.3 81.79 82.14 85.07 85.07 85.07 85.07 85.07 44.21 46.29 46.05 46.07 46.06Norway 66.67 66.67 66.67 66.67 66.67 87.02 87.02 87.02 87.02 87.21 84.69 84.28 84.73 84.04 84.23 76.6 76.6 76.6 76.6 76.6 94.27 96.23 95.96 96.13 96.72Oman 50 50 50 50 50 91.02 91.02 91.02 91.02 90.73 71.59 73.1 73.95 74.78 74.78 48.75 48.75 48.75 48.75 48.75 37.17 36.96 37.81 38.73 39.53Qatar 43.33 43.33 43.33 43.33 43.33 98.28 98.28 98.28 97.15 97.49 73.47 71.76 71.75 74.65 74.65 50.98 50.98 50.98 53.72 53.72 55.85 56.15 56.19 58.75 58.92Slovenia 66.67 66.67 66.67 73.33 73.33 71.16 72.36 72.77 78.78 79.6 71.3 75.35 76.8 76.86 76.88 50.37 50.37 50.37 50.37 50.91 48.16 53.86 54.12 52.79 53.06Uruguay 50 50 50 50 50 47.63 47.63 47.63 59.81 59.81 66.93 67.41 68.52 69.81 71.07 52.94 52.94 52.94 52.81 52.81 45.54 42.04 45.96 45.85 47.72
Note: – = not availableSource: World Bank, Doing Business, available at: www.doingbusiness.org/custom (accessed December 2013)
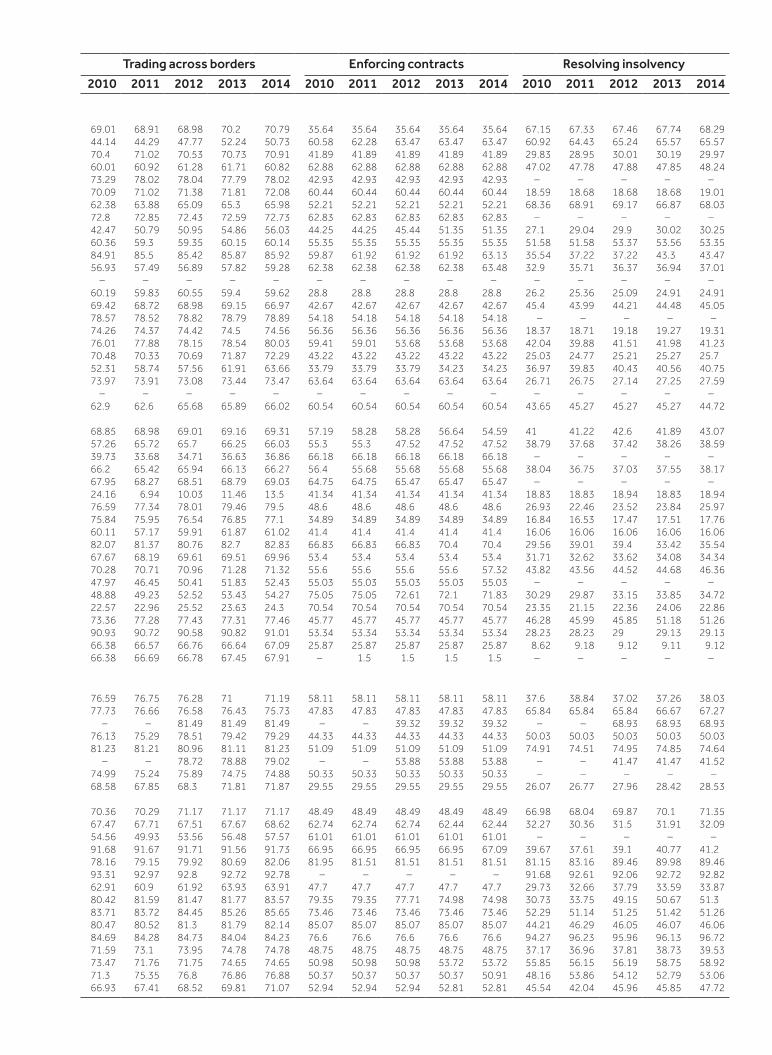

Table 34. Selected private sector indicators
Group/country
Domestic credit to private sector
(% of GDP)
Interest rate spread (lending
rate minus deposit rate, %)
Tax revenue collected by
central government (% of GDP)
Taxes payable by businesses (total
tax rate % of profit)
2010 2011 2012 2010 2011 2012 2010 2011 2012 2010 2011 2012
Middle-incomeCommonwealth countries – – – – – – – – – – – –Belize 62.3 60.3 – 6.1 6.9 – – – – 33.2 33.2 33.2Botswana 25.3 27.5 32.0 5.9 5.9 – 20.2 20.8 – 19.5 19.4 25.3Dominica 55.2 58.5 59.9 6.2 5.6 – – – – 37.3 37.5 37.5Fiji 82.6 74.6 78.4 2.1 3.7 – – – – 39.3 38.3 37.6Grenada 84.1 84.7 83.9 7.5 7.6 – 18.4 18.3 – 45.3 45.3 45.3Guyana 37.2 37.9 41.0 12.3 12.5 – – – – 39.1 36.1 36.1Jamaica 26.4 26.8 28.8 14.1 15.6 – 26.5 25.6 – 50.1 45.6 45.6Kiribati – – – – – – – – – 31.8 31.8 31.8Lesotho 13.6 14.7 18.8 7.5 7.7 – – – – 19.7 16.0 16.0Maldives 57.8 51.2 42.8 6.3 6.0 – 11.0 – 9.3 9.3 30.7Mauritius 87.9 91.5 100.7 0.5 1.8 – 18.6 18.4 – 27.2 28.5 28.5Namibia 50.1 48.5 48.4 4.7 4.4 – – 23.3 22.9 22.7Nauru – – – – – – – – – – – –Papua New Guinea 31.7 30.4 31.1 9.1 9.9 – – – – 42.3 42.3 42.2St Lucia 112.4 114.2 125.1 7.3 6.5 – – 34.0 34.4 34.6St Vincent and the Grenadines
51.9 51.8 52.8 6.3 6.1 – 23.1 22.2 – 38.7 38.7 38.7
Samoa 45.8 47.3 47.0 8.0 7.7 – – 18.9 18.9 18.9Seychelles 27.6 26.0 25.3 9.8 9.1 – 27.8 31.7 – 44.1 32.2 25.7Solomon Islands 27.2 23.1 23.2 11.1 11.2 – – – – 26.2 26.2 25.3Swaziland 23.0 27.2 25.0 5.9 6.2 – – – – 36.8 36.8 36.8Tonga 39.7 31.9 29.9 7.5 7.5 – – – – 25.5 25.7 25.7Tuvalu – – – – – – – – – – – –Vanuatu 64.7 67.9 – 3.9 – – – – – 8.4 8.4 8.4Other countriesAlbania 37.7 39.3 38.3 6.4 6.6 – – – – 40.6 38.5 38.7Armenia 28.4 35.4 42.9 10.3 8.5 – 16.9 17.0 – 38.6 38.8 38.8Bhutan 41.4 47.3 47.5 12.0 9.5 – – – – 40.8 40.8 40.8Bosnia and Herzegovina 63.3 62.0 62.3 4.7 4.6 – 20.3 20.9 – 22.7 24.1 24.1Cape Verde 62.1 64.5 59.4 7.9 6.5 – – – – 37.1 37.8 37.2Congo, Republic of 6.5 7.8 9.6 – – – – – – 65.5 65.9 62.9Costa Rica 45.2 47.3 49.1 11.8 12.1 – 13.5 13.8 – 55.0 55.0 55.0Djibouti – – – 9.3 9.1 – – – – 38.7 38.7 38.7Gabon 8.1 9.2 10.4 – – – – – – 43.5 43.5 43.5Georgia 31.8 32.7 34.5 15.0 16.4 – 22.1 23.9 – 15.3 16.5 16.5Lebanon 85.5 89.6 92.2 2.1 1.6 – 18.5 17.0 – 30.2 30.2 30.2Macedonia, FYR 44.5 45.3 47.5 2.4 3.0 – – – – 10.1 9.7 9.4Mauritania 28.0 26.3 28.8 9.0 9.0 – – – – 68.3 68.3 68.2Moldova 33.3 33.6 38.1 8.7 6.9 – 18.2 18.3 – 30.9 31.3 31.2Mongolia 39.6 51.6 52.3 8.2 6.1 – 22.7 21.9 – 24.3 24.6 24.6Montenegro 66.9 55.8 52.7 5.8 6.6 – – – – 26.6 22.3 22.3Panama 91.8 89.9 89.6 4.7 4.6 – – – – 48.7 45.2 42.0Suriname 24.0 24.3 25.4 5.4 5.4 – – – – 27.9 27.9 27.9Timor-Leste 12.5 12.2 12.4 10.2 10.2 – – – – 14.9 15.1 15.1High-incomeCommonwealth countries – – – –Antigua and Barbuda 80.0 77.5 71.8 7.6 7.5 – – – – 41.5 41.5 41.5Bahamas, The 83.4 84.4 81.4 2.1 2.4 – 14.1 16.8 – 46.1 47.7 47.8Barbados – – – 6.0 6.0 – 27.2 – – 45.4 45.4
(continued)
148

Table 34. Selected private sector indicators (continued)
Group/country
Domestic credit to private sector
(% of GDP)
Interest rate spread (lending
rate minus deposit rate, %)
Tax revenue collected by
central government (% of GDP)
Taxes payable by businesses (total
tax rate % of profit)
2010 2011 2012 2010 2011 2012 2010 2011 2012 2010 2011 2012
Brunei Darussalam 40.9 31.8 31.5 5.0 5.1 – – – – 17.3 16.8 16.8Cyprus 283.6 294.8 302.2 – – – 25.9 26.1 – 23.2 23.1 23.0Malta 132.8 129.9 127.9 – – – 27.0 27.7 – 41.6 41.6St Kitts and Nevis 65.5 65.3 65.2 4.0 5.0 – 17.0 19.7 – 52.7 52.7 52.1Trinidad and Tobago 33.2 30.5 30.7 7.8 6.5 – – – – 33.1 29.1 29.1Other countriesBahrain 67.7 68.9 70.0 6.0 5.8 – – – – 13.9 13.9 13.9Croatia 69.3 70.8 68.0 8.6 8.0 – 19.2 18.4 – 33.0 32.9 32.8Equatorial Guinea 8.9 8.9 6.7 – – – – 46.0 46.0 46.0Estonia 98.4 84.7 79.3 6.7 4.8 – 16.1 16.0 – 49.6 58.6 67.3Iceland 108.7 97.0 96.8 – – – 21.9 22.3 – 26.8 31.8 33.0Ireland 214.4 204.3 186.1 – – – 21.4 23.1 – 26.3 26.3 26.4Kuwait 76.3 61.7 – 2.6 3.0 – 0.9 0.7 – 10.7 10.7 10.7Latvia 99.1 82.2 67.7 7.7 5.9 – 12.8 13.3 – 38.5 37.9 36.6Lithuania 63.3 53.5 51.3 4.3 – 13.4 13.4 – 46.0 43.9 43.7Luxembourg 187.1 170.7 165.4 – – – 24.8 24.3 – 20.9 20.8 21.0Norway – – – – – – 27.4 28.4 – 41.6 41.6 41.6Oman 42.2 40.0 41.2 3.5 3.4 – 2.6 2.2 – 21.6 22.0 22.0Qatar 44.7 38.9 36.1 4.4 3.7 – 14.4 – – 11.3 11.3 11.3Slovenia 94.2 90.1 87.4 – – – 17.1 17.9 – 35.4 34.7 34.7Uruguay 23.1 23.8 24.1 6.2 5.2 – 19.3 19.6 – 42.0 42.0 42.0
Note: – = not available
Source: World Bank, World Development Indicators 2013, available at: http://databank.worldbank.org (accessed June 2013)
149

Tabl
e 35
. S
elec
ted
size
indi
cato
rs
Gro
up/c
ount
rySu
rfac
e ar
ea
(sq.
km
)La
nd a
rea
(sq.
km
)
Perm
anen
t cr
opla
nd (%
of
land
are
a)A
gric
ultu
ral l
and
(sq.
km)
Ara
ble
land
(%
of l
and
area
)Po
pula
tion
(’0
00)
Popu
lati
on
dens
ity
(per
sq.
km
)
Tota
l GN
I at
curr
ent
pric
es
(US
$ m
illio
n)
2011
2011
2011
2009
2010
2011
2009
2010
2011
2011
2011
2011
2012
Mid
dle-
inco
me
Com
mon
wea
lth c
ount
ries
Bel
ize
22,9
7022
,810
1.4
1,55
01,
570
1,57
03.
23.
33.
331
614
1322
–B
ots
wan
a58
1,73
056
6,73
0–
259,
180
258,
610
258,
610
0.6
0.5
0.5
1987
415
811
1402
0D
om
inic
a75
075
024
.024
526
026
08.
08.
08.
071
9546
646
3Fi
ji18
,270
18,2
704.
74,
276
4,27
64,
276
9.2
9.2
9.2
868
4836
9938
30G
rena
da34
034
020
.611
011
011
08.
88.
88.
810
530
974
975
1G
uyan
a21
4,97
019
6,85
00.
116
,760
16,7
7016
,770
2.1
2.1
2.1
791
425
6728
49Ja
mai
ca10
,990
10,8
309.
24,
490
4,49
04,
490
11.1
11.1
11.1
2707
250
1389
014
406
Kiri
bati
810
810
39.5
340
340
340
2.5
2.5
2.5
9912
323
624
1Le
soth
o30
,360
30,3
600.
123
,390
23,2
6023
,120
11.0
10.6
10.1
2030
6728
5727
52M
aldi
ves
300
300
10.0
7070
7010
.010
.010
.033
211
0718
3318
83M
aurit
ius
2,04
02,
030
2.0
910
910
890
39.4
39.4
38.4
1286
634
1132
510
604
Nam
ibia
824,
290
823,
290
–38
8,08
038
8,09
038
8,09
01.
01.
01.
022
183
1260
012
778
Nau
ru–
––
––
––
––
––
––
Pap
ua N
ew G
uine
a46
2,84
045
2,86
01.
511
,900
11,9
0011
,900
0.7
0.7
0.7
7013
1512
003
1502
4St
Luc
ia62
061
011
.511
011
011
04.
94.
94.
917
929
411
9511
72St
Vin
cent
and
the
Gre
nadi
nes
390
390
7.7
100
100
100
12.8
12.8
12.8
109
280
678
701
Sam
oa
2,84
02,
830
7.8
349
350
350
2.8
2.8
2.8
187
6660
864
0Se
yche
lles
460
460
4.3
3030
302.
22.
22.
287
190
1009
985
Solo
mo
n Is
land
s28
,900
27,9
902.
391
091
091
00.
60.
60.
653
819
673
699
Swaz
iland
17,3
6017
,200
0.9
12,2
2012
,220
12,2
2010
.210
.210
.212
1270
3718
3456
Tong
a75
072
015
.331
031
031
022
.222
.222
.210
514
543
948
2Tu
valu
3030
60.0
1818
18–
––
1032
856
62V
anua
tu12
,190
12,1
9010
.31,
870
1,87
01,
870
1.6
1.6
1.6
242
2076
676
7O
ther
cou
ntrie
sA
lban
ia28
,750
27,4
002.
712
,013
12,0
1312
,010
22.2
22.8
22.7
3154
115
1289
313
051
Arm
enia
29,7
4028
,480
1.9
17,4
5917
,350
17,1
0615
.815
.715
.129
6410
410
693
1043
1B
huta
n38
,394
38,3
940.
55,
170
5,20
05,
200
2.4
2.5
2.5
729
1917
2916
75B
osn
ia a
nd H
erze
govi
na51
,210
51,0
002.
021
,280
21,4
4021
,510
19.5
19.7
19.7
3839
7518
470
1732
3C
ape
Ver
de4,
030
4,03
00.
775
075
075
011
.711
.711
.749
112
218
4618
58
(con
tinue
d)
150

Tabl
e 35
. S
elec
ted
size
indi
cato
rs (c
onti
nued
)
Gro
up/c
ount
rySu
rfac
e ar
ea
(sq.
km
)La
nd a
rea
(sq.
km
)
Perm
anen
t cr
opla
nd (%
of
land
are
a)A
gric
ultu
ral l
and
(Sq.
km)
Ara
ble
land
(%
of L
and
Are
a)Po
pula
tion
(’0
00)
Popu
lati
on
dens
ity
(per
sq.
km
)
Tota
l GN
I at
curr
ent
pric
es
(US
$ m
illio
n)
2011
2011
2011
2009
2010
2011
2009
2010
2011
2011
2011
2011
2012
Co
ngo,
Rep
ublic
of
342,
000
341,
500
0.2
105,
600
105,
600
105,
600
1.5
1.5
1.5
4225
1210
713
1083
2C
ost
a R
ica
51,1
0051
,060
6.5
18,5
0018
,800
18,8
004.
54.
94.
947
3893
4005
043
886
Djib
out
i23
,200
23,1
80–
17,0
2017
,020
17,0
200.
10.
10.
184
737
––
Gab
on
267,
670
257,
670
0.7
51,6
0051
,600
51,6
001.
31.
31.
315
946
1629
816
577
Geo
rgia
69,7
0069
,490
1.7
25,2
7024
,685
24,6
906.
76.
06.
044
8378
1401
215
723
Jord
an89
,320
88,7
801.
010
,250
10,0
2310
,026
2.3
2.0
2.0
6181
7028
660
3117
2La
o P
DR
236,
800
230,
800
0.4
23,4
6023
,780
23,7
805.
96.
16.
165
2128
7741
8676
Leba
non
10,4
5010
,230
12.3
6,63
06,
400
6,38
012
.011
.110
.943
8342
839
916
4232
2M
aced
oni
a, F
YR25
,710
25,2
201.
410
,130
11,1
9011
,180
16.7
16.4
16.4
2104
8310
266
9545
Mau
ritan
ia1,
030,
700
1,03
0,70
0–
396,
510
397,
110
397,
110
0.4
0.4
0.4
3703
440
9040
66M
old
ova
33,8
5032
,854
9.0
24,7
2024
,650
24,5
9055
.255
.255
.135
6112
475
8078
20M
ong
olia
1,56
4,12
01,
553,
560
–1,
136,
760
1,13
5,88
01,
135,
070
0.4
0.4
0.4
2754
279
1895
92M
ont
eneg
ro13
,810
13,4
501.
25,
140
5,12
05,
120
12.9
12.8
12.8
621
4642
9041
50P
anam
a75
,420
74,3
402.
522
,550
22,6
0022
,670
7.3
7.3
7.3
3740
5033
170
3890
8P
arag
uay
406,
752
397,
300
0.2
209,
000
209,
900
209,
900
9.6
9.8
9.8
6573
1724
841
2332
4S
ão T
om
é an
d P
rínci
pe96
096
040
.649
048
548
79.
48.
99.
118
319
124
826
4Su
rinam
e16
3,82
015
6,00
0–
814
780
820
0.4
0.4
0.4
530
340
4245
44T
imo
r-Le
ste
14,8
7014
,870
4.0
3,75
03,
650
3,60
011
.110
.410
.111
7679
4216
4852
Hig
h-in
com
eC
omm
onw
ealth
cou
ntrie
sA
ntig
ua a
nd B
arbu
da44
044
02.
390
9090
9.1
9.1
9.1
8820
010
8111
35B
aham
as, T
he13
,880
10,0
100.
414
015
015
00.
80.
90.
936
637
7599
Bar
bado
s43
043
02.
316
014
015
030
.225
.627
.928
265
5–
–B
rune
i Dar
ussa
lam
5,77
05,
270
0.9
114
114
114
0.6
0.6
0.6
407
77–
–C
ypru
s9,
250
9,24
03.
51,
276
1,14
01,
185
9.4
8.9
9.1
1117
121
2509
722
079
Mal
ta32
032
04.
193
103
103
25.0
28.1
28.1
417
1302
8626
8113
St K
itts
and
Nev
is26
026
00.
455
5760
15.4
17.3
19.2
5320
471
971
7Tr
inid
ad a
nd T
oba
go5,
130
5,13
04.
354
054
054
04.
94.
94.
913
3326
021
959
2016
2O
ther
cou
ntrie
sB
ahra
in76
076
03.
984
8484
1.8
1.8
1.8
1293
1701
––
Cro
atia
56,5
9055
,960
1.5
12,9
9613
,338
13,2
6115
.516
.216
.042
8176
5956
154
326
Equa
toria
l Gui
nea
28,0
5028
,050
2.5
3,06
03,
040
3,04
04.
74.
64.
671
626
1065
211
051
Esto
nia
45,2
3042
,390
0.1
9,31
09,
490
9,45
014
.115
.214
.913
4032
2100
020
877
(con
tinue
d)
151
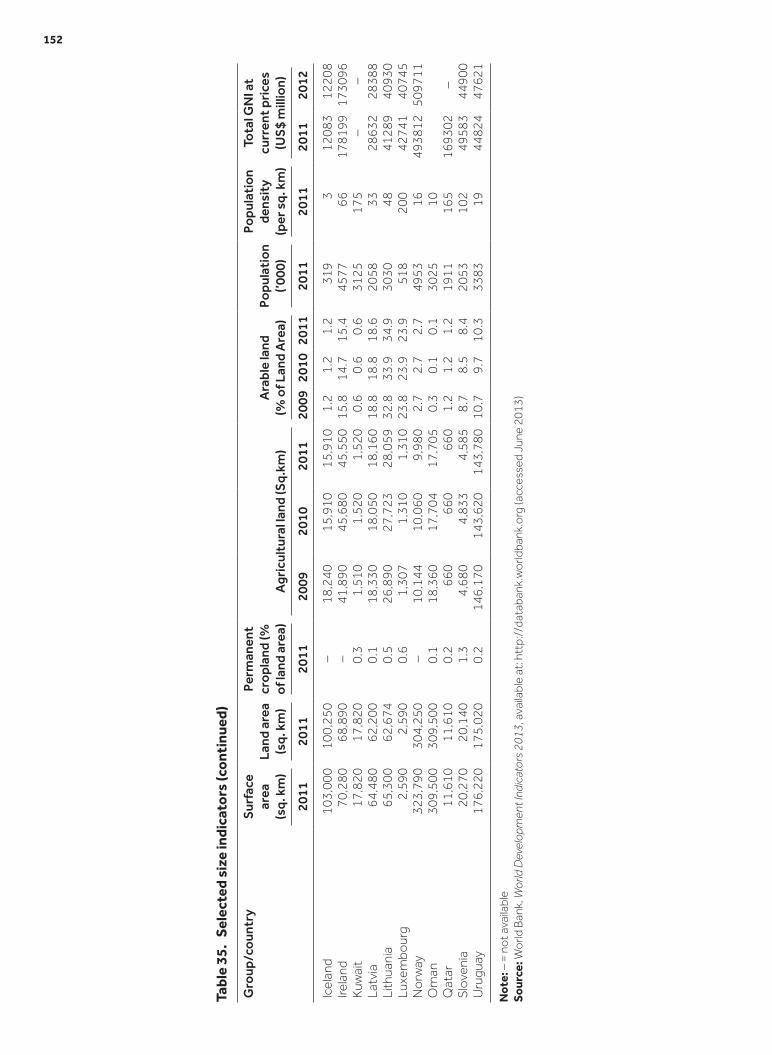
Tabl
e 35
. S
elec
ted
size
indi
cato
rs (c
onti
nued
)
Gro
up/c
ount
rySu
rfac
e ar
ea
(sq.
km
)La
nd a
rea
(sq.
km
)
Perm
anen
t cr
opla
nd (%
of
land
are
a)A
gric
ultu
ral l
and
(Sq.
km)
Ara
ble
land
(%
of L
and
Are
a)Po
pula
tion
(’0
00)
Popu
lati
on
dens
ity
(per
sq.
km
)
Tota
l GN
I at
curr
ent
pric
es
(US
$ m
illio
n)
2011
2011
2011
2009
2010
2011
2009
2010
2011
2011
2011
2011
2012
Icel
and
103,
000
100,
250
–18
,240
15,9
1015
,910
1.2
1.2
1.2
319
312
083
1220
8Ire
land
70,2
8068
,890
–41
,890
45,6
8045
,550
15.8
14.7
15.4
4577
6617
8199
1730
96K
uwai
t17
,820
17,8
200.
31,
510
1,52
01,
520
0.6
0.6
0.6
3125
175
––
Latv
ia64
,480
62,2
000.
118
,330
18,0
5018
,160
18.8
18.8
18.6
2058
3328
632
2838
8Li
thua
nia
65,3
0062
,674
0.5
26,8
9027
,723
28,0
5932
.833
.934
.930
3048
4128
940
930
Luxe
mbo
urg
2,59
02,
590
0.6
1,30
71,
310
1,31
023
.823
.923
.951
820
042
741
4074
5N
orw
ay32
3,79
030
4,25
0–
10,1
4410
,060
9,98
02.
72.
72.
749
5316
4938
1250
9711
Om
an30
9,50
030
9,50
00.
118
,360
17,7
0417
,705
0.3
0.1
0.1
3025
10Q
atar
11,6
1011
,610
0.2
660
660
660
1.2
1.2
1.2
1911
165
1693
02–
Slo
veni
a20
,270
20,1
401.
34,
680
4,83
34,
585
8.7
8.5
8.4
2053
102
4958
344
900
Uru
guay
176,
220
175,
020
0.2
146,
170
143,
620
143,
780
10.7
9.7
10.3
3383
1944
824
4762
1
Not
e: –
= n
ot a
vaila
ble
Sou
rce:
Wo
rld B
ank,
Wor
ld D
evel
opm
ent I
ndic
ator
s 20
13, a
vaila
ble
at: h
ttp:
//da
taba
nk.w
orld
bank
.org
(acc
esse
d Ju
ne 2
013)
152

Table 36. Population indicators
Group/countryTotal population (’000)
Annual population growth (% per year)
2007 2008 2009 2010 2011 2012 2008 2009 2010 2011 2012
Middle-incomeCommonwealth countriesBelize 286 294 301 309 316 324 2.6 2.5 2.5 2.5 2.5Botswana 1,915 1,934 1,952 1,969 1,987 2,004 1.0 0.9 0.9 0.9 0.9Dominica 71 71 71 71 71 72 0.1 0.2 0.2 0.3 0.4Fiji 835 844 852 861 868 875 1.0 1.0 0.9 0.9 0.8Grenada 104 104 104 105 105 105 0.3 0.4 0.4 0.4 0.4Guyana 770 776 781 786 791 795 0.7 0.7 0.6 0.6 0.6Jamaica 2,676 2,687 2,696 2,701 2,707 2,712 0.4 0.3 0.2 0.2 0.2Kiribati 93 95 96 98 99 101 1.5 1.5 1.5 1.5 1.5Lesotho 1,956 1,972 1,990 2,009 2,030 2,052 0.8 0.9 1.0 1.0 1.1Maldives 308 314 320 326 332 338 1.8 1.9 1.9 1.9 2.0Mauritius 1,260 1,269 1,275 1,281 1,286 1,291 0.6 0.5 0.5 0.4 0.4Namibia 2,081 2,111 2,143 2,179 2,218 2,259 1.4 1.5 1.7 1.8 1.9Nauru – – – – – – – – – – –Papua New Guinea 6,398 6,551 6,705 6,859 7,013 7,167 2.4 2.4 2.3 2.2 2.2St Lucia 170 173 175 177 179 181 1.5 1.4 1.3 1.1 0.9St Vincent and the
Grenadines109 109 109 109 109 109 0.1 0.1 0.1 0.0 0.0
Samoa 182 183 185 186 187 189 0.7 0.7 0.7 0.8 0.8Seychelles 85 87 87 90 87 88 2.3 0.4 2.8 −2.6 0.4Solomon Islands 492 504 515 526 538 550 2.3 2.3 2.2 2.2 2.2Swaziland 1,135 1,154 1,174 1,193 1,212 1,231 1.7 1.7 1.7 1.6 1.6Tonga 102 103 104 104 105 105 0.6 0.6 0.5 0.4 0.4Tuvalu 10 10 10 10 10 10 0.2 0.2 0.2 0.2 0.2Vanuatu 220 225 231 236 242 247 2.5 2.4 2.4 2.3 2.3Other countriesAlbania 3,166 3,157 3,151 3,150 3,154 3,162 −0.3 −0.2 0.0 0.1 0.3Armenia 2,990 2,977 2,968 2,963 2,964 2,969 −0.4 −0.3 −0.2 0.0 0.2Bosnia and Herzegovina 3,869 3,861 3,853 3,846 3,839 3,834 −0.2 −0.2 −0.2 −0.2 −0.1Cape Verde 484 485 486 488 491 494 0.2 0.2 0.4 0.6 0.8Congo, Republic of 3,759 3,876 3,995 4,112 4,225 4,337 3.1 3.1 2.9 2.8 2.6Costa Rica 4,463 4,533 4,601 4,670 4,738 4,805 1.6 1.5 1.5 1.5 1.4Djibouti 799 810 822 834 847 860 1.4 1.5 1.5 1.5 1.5Gabon 1,447 1,483 1,519 1,556 1,594 1,633 2.4 2.4 2.4 2.4 2.4Georgia 4,388 4,384 4,411 4,453 4,483 4,512 −0.1 0.6 0.9 0.7 0.6Lebanon 4,140 4,186 4,247 4,341 4,383 4,425 1.1 1.5 2.2 1.0 1.0Macedonia, FYR 2,097 2,099 2,101 2,102 2,104 2,106 0.1 0.1 0.1 0.1 0.1Mauritania 3,330 3,423 3,516 3,609 3,703 3,796 2.8 2.7 2.7 2.6 2.5Moldova 3,577 3,570 3,566 3,562 3,561 3,560 −0.2 −0.1 −0.1 0.0 0.0Mongolia 2,595 2,633 2,672 2,713 2,754 2,796 1.5 1.5 1.5 1.5 1.5Montenegro 618 619 619 620 621 621 0.1 0.1 0.1 0.1 0.1Panama 3,491 3,553 3,616 3,678 3,740 3,802 1.8 1.8 1.7 1.7 1.7São Tomé and Príncipe 163 168 173 178 183 188 3.0 3.0 2.9 2.8 2.7Suriname 510 515 520 525 530 535 1.0 0.9 0.9 0.9 0.9Timor-Leste 1,046 1,078 1,110 1,143 1,176 1,210 3.0 3.0 2.9 2.9 2.9
High-incomeCommonwealth countriesAntigua and Barbuda 84 85 86 87 88 89 1.1 1.1 1.1 1.1 1.0Bahamas, The 342 348 354 360 366 372 1.8 1.8 1.7 1.6 1.5Barbados 276 278 279 280 282 283 0.5 0.5 0.5 0.5 0.5Brunei Darussalam 381 388 394 401 407 412 1.7 1.6 1.6 1.5 1.4Cyprus 409 412 414 416 417 418 0.7 0.5 0.5 0.2 0.4
(continued)
153

Table 36. Population indicators (continued)
Group/countryTotal population (’000)
Annual population growth (% per year)
2007 2008 2009 2010 2011 2012 2008 2009 2010 2011 2012
Malta 1,063 1,077 1,091 1,104 1,117 1,129 1.3 1.3 1.2 1.2 1.1St Kitts and Nevis 50 51 52 52 53 54 1.3 1.2 1.2 1.2 1.2Trinidad and Tobago 1,310 1,316 1,323 1,328 1,333 1,337 0.5 0.5 0.4 0.4 0.3Other countriesBahrain 1,032 1,116 1,192 1,252 1,293 1,318 8.1 6.8 5.0 3.3 1.9Croatia 4,436 4,434 4,429 4,418 4,281 4,267 0.0 −0.1 −0.3 −3.1 −0.3Equatorial Guinea 640 658 677 696 716 736 2.9 2.9 2.9 2.8 2.8Estonia 1,342 1,341 1,340 1,340 1,340 1,339 −0.1 0.0 0.0 0.0 0.0Iceland 312 317 318 318 319 320 1.9 0.3 −0.1 0.3 0.4Ireland 4,357 4,426 4,459 4,474 4,577 4,589 1.6 0.8 0.3 2.3 0.3Kuwait 2,555 2,702 2,850 2,992 3,125 3,250 5.8 5.5 5.0 4.4 4.0Latvia 2,276 2,266 2,255 2,239 2,058 2,025 −0.4 −0.5 −0.7 −8.1 −1.6Lithuania 3,376 3,358 3,339 3,287 3,030 2,986 −0.5 −0.6 −1.6 −7.8 −1.5Luxembourg 480 489 498 507 518 531 1.8 1.9 1.8 2.2 2.5Norway 4,709 4,768 4,829 4,889 4,953 5,019 1.3 1.3 1.3 1.3 1.3Oman 2,570 2,594 2,663 2,803 3,025 3,314 0.9 2.7 5.2 7.9 9.6Qatar 1,152 1,359 1,564 1,750 1,911 2,051 17.9 15.1 11.9 9.2 7.3Slovenia 2,018 2,021 2,040 2,049 2,053 2,058 0.2 0.9 0.4 0.2 0.3Uruguay 3,338 3,349 3,360 3,372 3,383 3,395 0.3 0.3 0.3 0.3 0.3
Note: – = not available
Source: World Bank, World Development Indicators 2013, available at: http://databank.worldbank.org (accessed June 2013)
154

Table 37. Distribution of labour force (% of total employment)
Group/country Agriculture Industry Services
2009 2010 2011 2009 2010 2011 2009 2010 2011
Middle-incomeCommonwealth countriesBelize – – – – – – – – –Botswana – – – – – – – – –Dominica – – – – – – – – –Fiji – – – – – – – – –Grenada – – – – – – – – –Guyana – – 1.4 15.1 – – 68.9Jamaica 20.2 20.2 17.6 16.6 15.9 16.1 63.2 63.8 66.3Lesotho – – – – – – – – –Maldives – – – – – – – – –Mauritius 9 8.7 8.4 29.7 28.2 27.6 61.3 63.1 64Namibia – – – – – –Nauru – – – – – – – – –Papua New Guinea – – – – – – – – –St Lucia – – – – – – – – –St Vincent and the Grenadines – – – – – – – – –Samoa – – – – – – – – –Seychelles – – – – – – – – –Solomon Islands – – – – – – – – –Swaziland – – – – – – – – –Tonga – – – – – – – – –Tuvalu – – – – – – – – –Vanuatu 60.5 – – 7 – – 31.1 – –Other countriesAlbania 44.1 – – 19.9 – – 36 – –Armenia – – – – – – – – –Bhutan 65.4 59.5 60.1 6.4 6.7 9.2 28.2 33.8 30.6Bosnia and Herzegovina 21.2 19.7 19.6 31.4 31 28.9 47.3 49.3 51.5Cape Verde – – – – – – – – –Congo, Republic of – – – – – – – – –Costa Rica 12.3 15 14.1 21.6 19.5 19.8 62.2 64.7 65.8Djibouti – – – – – – – – –Gabon – – – – – – – – –Georgia – – – – – – – – –Lebanon – – – – – – – – –Macedonia, FYR – – – – – – – – –Mauritania – – – – – – – – –Moldova 28.2 27.5 27.5 19.3 18.7 18.7 52.5 53.8 53.7Mongolia 40 – – 14.9 – – 45 – –Montenegro 6.5 6.2 5.6 20.7 20 19 72.8 73.9 75.5Panama 17.9 17.4 17 19.1 18.7 18.6 63 63.9 64.4Suriname – – – – – – – – –Timor-Leste – – – – – – – – –High-incomeCommonwealth countriesAntigua and Barbuda – – – – – – – – –Bahamas, The 2.9 – 3.7 16 – 12.9 80.8 – 83Barbados – 2.8 3.3 – 19.6 20.3 – 77.6 76.4Cyprus 3.9 3.8 3.9 22.2 20.8 21.4 73.9 75.3 74.7Malta 1.4 1.2 1.1 24.7 24.5 24.4 72.8 73 73.2St Kitts and Nevis – – – – – – – – –Trinidad and Tobago – – – – – – – – –Other countriesBahrain – – – – – – – – –Croatia 13.9 14.9 15.4 28.9 27.3 27.5 57 57.6 56.7Equatorial Guinea – – – – – – – – –Estonia 4 4.2 4.4 31.3 30.1 31.9 64.1 65.1 62.9Iceland 4.8 5.5 5.5 18.8 17.9 18.1 74.7 75.2 75.2Ireland 5 4.6 4.6 21.3 19.5 18.9 73.3 75.4 76.2Kuwait – – – – – – – – –Latvia 8.7 8.8 9.5 25 24 23.3 66.3 66.9 66.7Lithuania 9.2 9 8.5 26.8 24.4 24.4 63.6 66.2 66.7Luxembourg 1.3 1 1.2 12.4 12 12.7 83.7 81.1 82.7Norway 2.7 2.5 – 20.2 19.7 – 76.9 77.6 –Oman – – – – – – – – –Qatar 1.6 – 1.4 58.4 – 54.1 40.1 – 44.6Slovenia 9.1 8.8 – 33 32.5 – 57.4 58.3 –Uruguay 11.1 11.5 10.7 20.8 21.3 21.1 68.1 67.2 68.1
Note: – = not availableSource: World Bank, World Development Indicators 2013, available at: http://databank.worldbank.org (accessed June 2013)

Table 38. Labour force participation
Group/country
Total labour force
Labour force (female) (% of labour force)
Participation rate 15 and older (%) Employment population ratio (%) Vulnerable GDP per person Unemployed
Male Female 15 and older Youth 15–24Employment (% of total employment)
Employed (constant 1990 PPP$)
Total (% of total labour force)
2009 2010 2011 2009 2010 2011 2009 2010 2011 2009 2010 2011 2009 2010 2011 2009 2010 2011 2009 2010 2011 2009 2010 2011 2009 2010 2011
Middle-incomeCommonwealth countriesBelize 124,131 128,871 133,565 37.0 37.3 37.5 81.6 81.8 81.8 47.4 48.0 48.3 58.7 59.3 59.0 44.2 44.7 43.9 – – – – – – – – –Botswana 976,526 991,801 1,005,715 46.9 46.8 46.7 81.3 81.5 81.6 71.4 71.6 71.7 63.1 63.5 63.3 41.1 41.3 41.3 – – – – – – – – –Dominica – – – – – – – – – – – – – – – – – – – – – – – – – – –Fiji 361,057 364,577 368,216 32.3 32.4 32.4 79.6 79.6 79.5 39.3 39.3 39.3 57.0 57.0 56.7 39.9 40.0 39.4 – – – – – – – – –Grenada – – – – – – – – – – – – – – – – – – – – – – – – – – –Guyana 293,237 295,504 299,189 34.4 34.8 35.1 80.1 79.6 79.1 40.8 41.3 41.8 53.4 53.5 53.7 35.1 35.0 34.8 – – – – – – 20.2 21.0 21.0Jamaica 1,228,523 1,222,906 1,233,691 45.0 45.1 45.1 73.1 72.0 71.8 56.7 56.0 56.0 57.3 55.9 55.6 27.3 24.9 25.6 – – – 8,947 8,686 8,668 11.4 12.4 12.7Lesotho 808,367 824,318 839,962 46.3 46.1 46.1 73.2 73.3 73.4 58.6 58.7 58.9 48.0 50.0 48.4 28.9 30.4 29.2 – – – – – – – – –Maldives 144,856 150,069 155,275 41.7 41.9 42.0 76.1 76.4 76.8 54.5 55.1 55.7 57.2 57.1 57.7 43.2 42.7 42.8 – – – – – – – – –Mauritius 583,701 600,893 607,287 37.0 37.5 37.7 75.1 75.7 75.5 42.6 43.9 44.1 54.2 54.9 54.7 32.3 31.4 31.9 15.9 16.0 15.1 – – – 7.3 7.7 7.9Namibia 846,542 869,080 894,912 47.8 47.9 47.9 69.8 69.8 69.9 58.2 58.4 58.6 39.9 40.0 42.9 10.9 11.1 13.6 – – – – – – – – –Nauru – – – – – – – – – – – – – – – – – – – – – – – – – – –Papua New Guinea 2,953,485 3,026,382 3,110,615 48.3 48.3 48.3 74.2 74.1 74.1 70.9 70.6 70.6 70.8 70.6 70.7 55.1 54.5 54.6 – – – – – – – 4.0 –St Lucia 90,741 93,083 95,095 46.7 46.7 46.7 76.7 77.0 77.3 63.5 63.9 64.2 – – – – – – – – – 9,534 9,827 9,915 – – –St Vincent and the
Grenadines53,436 53,907 54,219 40.8 41.0 41.1 78.4 78.5 78.4 55.2 55.5 55.7 – – – – – – – – – – – – – – –
Samoa 69,399 70,044 70,459 34.1 34.2 34.3 78.4 78.2 77.8 42.9 42.9 42.8 – – – – – – – – – – – – – – –Seychelles – – – – – – – – – – – – – – – – – – – – – – – – – – –Solomon Islands 203,298 208,660 214,191 39.6 39.6 39.6 79.8 79.9 79.9 53.1 53.1 53.2 64.1 64.4 64.5 44.7 45.1 45.2 – – – – – – – – –Swaziland 402,211 413,019 424,051 39.6 39.7 39.5 70.5 70.7 70.8 43.3 43.5 43.6 43.5 43.6 43.8 25.8 25.8 25.5 – – – – – – – – –Tonga 41,494 41,786 41,960 42.7 42.7 42.7 75.3 75.2 75.0 53.6 53.6 53.6 – – – – – – – – – – – – – – –Tuvalu – – – – – – – – – – – – – – – – – – – – – – – – – – –Vanuatu 100,164 103,099 106,309 43.5 43.5 43.5 79.7 79.7 79.7 61.3 61.3 61.3 – – – – – – 70.0 – – – – – 4.6 – –Other countriesAlbania 1,454,792 1,468,341 1,481,955 41.3 41.4 41.4 71.3 71.3 71.3 49.7 49.7 49.6 52.1 52.1 52.3 37.8 38.7 38.6 – – – 14,943 15,168 15,324 13.8 – –Armenia 1,363,721 1,370,922 1,384,754 42.4 42.2 42.0 69.1 69.6 70.2 48.7 49.0 49.4 39.9 41.1 40.9 17.8 18.1 18.5 – – – 27,248 27,463 28,502 – –Bhutan 346,415 358,039 369,673 41.6 41.5 41.5 75.4 76.0 76.5 65.2 65.5 65.8 67.9 68.3 69.1 41.8 41.7 42.8 74.2 68.8 70.9 4.0 3.3 3.1Bosnia and
Herzegovina1,444,382 1,470,900 1,477,101 38.5 39.3 39.2 58.5 58.5 58.6 34.0 35.2 35.2 34.6 33.7 33.5 16.5 14.0 13.9 27.2 26.6 25.2 28,251 28,330 28,906 24.1 27.2 27.6
Cape Verde 215,795 220,700 226,236 38.3 38.3 38.5 83.0 83.1 83.3 49.8 50.2 50.8 61.7 62.0 62.4 53.8 53.7 53.6 – – – – – – – – –Congo, Republic of 1,623,475 1,674,739 1,721,621 48.7 48.6 48.7 72.5 72.7 72.9 68.1 68.2 68.4 66.1 66.2 66.3 40.4 40.4 40.2 – – – – – – – – –Costa Rica 2,140,472 2,198,391 2,252,521 36.0 36.2 36.4 78.9 78.9 78.9 45.5 46.0 46.4 59.2 59.8 59.8 42.1 42.5 42.2 20.1 20.4 20.2 17,716 18,116 18,518 7.8 7.3 7.7Djibouti 273,810 281,252 288,356 34.5 34.6 34.9 66.9 67.0 67.2 35.1 35.5 36.0 – – – – – – – – – – – – – – –Gabon 561,040 577,777 594,604 46.3 46.3 46.3 64.8 64.9 65.0 55.8 56.0 56.3 50.2 50.4 50.9 14.6 14.7 15.0 – – – – – – – – –Georgia 2,327,861 2,356,832 2,380,869 47.0 47.0 47.0 73.7 73.8 74.2 55.5 55.6 55.8 53.0 53.5 55.0 20.4 20.0 21.8 – – – 16,136 17,110 18,039 16.9 16.3 15.1Lebanon 1,457,550 1,513,589 1,552,450 23.7 23.9 24.0 70.7 70.8 70.8 22.3 22.5 22.6 41.6 41.7 41.6 22.9 22.7 22.2 – – – – – – – – –Macedonia, FYR 958,204 966,803 972,885 38.2 38.5 38.6 68.7 68.9 68.9 42.3 42.7 42.9 37.6 37.9 38.4 15.7 15.4 15.5 22.9 23.1 22.5 15,327 15,402 15,748 32.2 32.0 31.4Mauritania 1,112,724 1,152,180 1,187,609 26.3 26.4 26.7 79.0 79.1 79.2 28.1 28.4 28.7 35.8 36.0 36.1 18.7 18.9 18.9 – – – – – – – – –Moldova 1,262,344 1,216,982 1,233,244 49.5 49.2 49.3 45.9 44.5 45.1 39.6 37.9 38.4 39.9 38.0 38.7 18.4 18.0 18.8 28.5 28.6 28.7 12,269 13,591 14,655 6.4 7.4 6.7Mongolia 1,146,127 1,175,069 1,203,092 46.0 46.1 46.1 64.4 65.0 65.5 53.4 53.9 54.3 55.4 57.3 57.6 30.4 32.0 32.2 57.5 – – – – – – – –Montenegro – – – – – – – – – – – – – – – – – – – – – – – – 19.1 19.7 19.7Panama 1,679,462 1,715,863 1,755,576 36.9 37.1 37.3 83.0 82.6 82.5 49.0 49.3 49.6 61.7 61.7 62.0 42.9 42.1 42.1 32.2 30.9 29.3 – – – 6.6 6.5 4.5Suriname 199,891 203,422 207,142 36.8 37.1 37.3 68.5 68.7 68.7 39.7 40.1 40.5 46.9 47.3 47.7 19.4 19.4 19.4 – – – – – – – – –Timor-Leste 331,672 341,224 352,853 33.3 33.4 33.6 74.8 74.4 74.1 38.5 38.4 38.4 54.8 54.5 54.3 41.0 40.6 40.5 – 69.9 – – – – – 3.6 –High-incomeCommonwealth countriesAntigua and
Barbuda– – – – – – – – – – – – – – – – – – – – – – – – – – –
Bahamas, The 202,249 207,327 211,650 48.3 48.3 48.3 79.3 79.4 79.3 69.2 69.3 69.3 63.6 64.6 65.0 38.8 39.9 41.1 – – – – – – 14.2 – 13.7Barbados 158,286 159,494 160,420 46.5 46.4 46.4 76.3 76.3 76.2 64.8 64.8 64.8 63.4 62.9 62.5 43.3 42.4 41.8 – – – 19,395 19,375 19,663 10.0 10.8 11.2Cyprus 571,331 584,478 594,546 43.2 43.5 43.5 71.5 71.3 71.5 56.2 57.1 57.2 60.6 60.4 59.5 36.1 34.3 31.2 14.7 13.9 13.6 26,629 27,009 27,360 5.3 6.2 7.7Malta 175,472 179,713 180,321 34.0 34.4 34.6 67.2 67.8 67.4 34.0 35.0 35.2 46.9 47.7 47.8 44.6 45.1 45.0 9.3 9.8 9.3 32,142 32,318 32,664 6.9 6.9 6.4St Kitts and Nevis – – – – – – – – – – – – – – – – – – – – – – – – – – –Trinidad and Tobago 686,124 692,788 698,723 42.1 42.2 42.2 77.7 78.0 78.3 54.3 54.6 54.9 62.1 62.9 62.3 47.3 48.1 46.7 – – – 49,936 49,815 50,599 – – –
(continued)
156

Table 38. Labour force participation
Group/country
Total labour force
Labour force (female) (% of labour force)
Participation rate 15 and older (%) Employment population ratio (%) Vulnerable GDP per person Unemployed
Male Female 15 and older Youth 15–24Employment (% of total employment)
Employed (constant 1990 PPP$)
Total (% of total labour force)
2009 2010 2011 2009 2010 2011 2009 2010 2011 2009 2010 2011 2009 2010 2011 2009 2010 2011 2009 2010 2011 2009 2010 2011 2009 2010 2011
Middle-incomeCommonwealth countriesBelize 124,131 128,871 133,565 37.0 37.3 37.5 81.6 81.8 81.8 47.4 48.0 48.3 58.7 59.3 59.0 44.2 44.7 43.9 – – – – – – – – –Botswana 976,526 991,801 1,005,715 46.9 46.8 46.7 81.3 81.5 81.6 71.4 71.6 71.7 63.1 63.5 63.3 41.1 41.3 41.3 – – – – – – – – –Dominica – – – – – – – – – – – – – – – – – – – – – – – – – – –Fiji 361,057 364,577 368,216 32.3 32.4 32.4 79.6 79.6 79.5 39.3 39.3 39.3 57.0 57.0 56.7 39.9 40.0 39.4 – – – – – – – – –Grenada – – – – – – – – – – – – – – – – – – – – – – – – – – –Guyana 293,237 295,504 299,189 34.4 34.8 35.1 80.1 79.6 79.1 40.8 41.3 41.8 53.4 53.5 53.7 35.1 35.0 34.8 – – – – – – 20.2 21.0 21.0Jamaica 1,228,523 1,222,906 1,233,691 45.0 45.1 45.1 73.1 72.0 71.8 56.7 56.0 56.0 57.3 55.9 55.6 27.3 24.9 25.6 – – – 8,947 8,686 8,668 11.4 12.4 12.7Lesotho 808,367 824,318 839,962 46.3 46.1 46.1 73.2 73.3 73.4 58.6 58.7 58.9 48.0 50.0 48.4 28.9 30.4 29.2 – – – – – – – – –Maldives 144,856 150,069 155,275 41.7 41.9 42.0 76.1 76.4 76.8 54.5 55.1 55.7 57.2 57.1 57.7 43.2 42.7 42.8 – – – – – – – – –Mauritius 583,701 600,893 607,287 37.0 37.5 37.7 75.1 75.7 75.5 42.6 43.9 44.1 54.2 54.9 54.7 32.3 31.4 31.9 15.9 16.0 15.1 – – – 7.3 7.7 7.9Namibia 846,542 869,080 894,912 47.8 47.9 47.9 69.8 69.8 69.9 58.2 58.4 58.6 39.9 40.0 42.9 10.9 11.1 13.6 – – – – – – – – –Nauru – – – – – – – – – – – – – – – – – – – – – – – – – – –Papua New Guinea 2,953,485 3,026,382 3,110,615 48.3 48.3 48.3 74.2 74.1 74.1 70.9 70.6 70.6 70.8 70.6 70.7 55.1 54.5 54.6 – – – – – – – 4.0 –St Lucia 90,741 93,083 95,095 46.7 46.7 46.7 76.7 77.0 77.3 63.5 63.9 64.2 – – – – – – – – – 9,534 9,827 9,915 – – –St Vincent and the
Grenadines53,436 53,907 54,219 40.8 41.0 41.1 78.4 78.5 78.4 55.2 55.5 55.7 – – – – – – – – – – – – – – –
Samoa 69,399 70,044 70,459 34.1 34.2 34.3 78.4 78.2 77.8 42.9 42.9 42.8 – – – – – – – – – – – – – – –Seychelles – – – – – – – – – – – – – – – – – – – – – – – – – – –Solomon Islands 203,298 208,660 214,191 39.6 39.6 39.6 79.8 79.9 79.9 53.1 53.1 53.2 64.1 64.4 64.5 44.7 45.1 45.2 – – – – – – – – –Swaziland 402,211 413,019 424,051 39.6 39.7 39.5 70.5 70.7 70.8 43.3 43.5 43.6 43.5 43.6 43.8 25.8 25.8 25.5 – – – – – – – – –Tonga 41,494 41,786 41,960 42.7 42.7 42.7 75.3 75.2 75.0 53.6 53.6 53.6 – – – – – – – – – – – – – – –Tuvalu – – – – – – – – – – – – – – – – – – – – – – – – – – –Vanuatu 100,164 103,099 106,309 43.5 43.5 43.5 79.7 79.7 79.7 61.3 61.3 61.3 – – – – – – 70.0 – – – – – 4.6 – –Other countriesAlbania 1,454,792 1,468,341 1,481,955 41.3 41.4 41.4 71.3 71.3 71.3 49.7 49.7 49.6 52.1 52.1 52.3 37.8 38.7 38.6 – – – 14,943 15,168 15,324 13.8 – –Armenia 1,363,721 1,370,922 1,384,754 42.4 42.2 42.0 69.1 69.6 70.2 48.7 49.0 49.4 39.9 41.1 40.9 17.8 18.1 18.5 – – – 27,248 27,463 28,502 – –Bhutan 346,415 358,039 369,673 41.6 41.5 41.5 75.4 76.0 76.5 65.2 65.5 65.8 67.9 68.3 69.1 41.8 41.7 42.8 74.2 68.8 70.9 4.0 3.3 3.1Bosnia and
Herzegovina1,444,382 1,470,900 1,477,101 38.5 39.3 39.2 58.5 58.5 58.6 34.0 35.2 35.2 34.6 33.7 33.5 16.5 14.0 13.9 27.2 26.6 25.2 28,251 28,330 28,906 24.1 27.2 27.6
Cape Verde 215,795 220,700 226,236 38.3 38.3 38.5 83.0 83.1 83.3 49.8 50.2 50.8 61.7 62.0 62.4 53.8 53.7 53.6 – – – – – – – – –Congo, Republic of 1,623,475 1,674,739 1,721,621 48.7 48.6 48.7 72.5 72.7 72.9 68.1 68.2 68.4 66.1 66.2 66.3 40.4 40.4 40.2 – – – – – – – – –Costa Rica 2,140,472 2,198,391 2,252,521 36.0 36.2 36.4 78.9 78.9 78.9 45.5 46.0 46.4 59.2 59.8 59.8 42.1 42.5 42.2 20.1 20.4 20.2 17,716 18,116 18,518 7.8 7.3 7.7Djibouti 273,810 281,252 288,356 34.5 34.6 34.9 66.9 67.0 67.2 35.1 35.5 36.0 – – – – – – – – – – – – – – –Gabon 561,040 577,777 594,604 46.3 46.3 46.3 64.8 64.9 65.0 55.8 56.0 56.3 50.2 50.4 50.9 14.6 14.7 15.0 – – – – – – – – –Georgia 2,327,861 2,356,832 2,380,869 47.0 47.0 47.0 73.7 73.8 74.2 55.5 55.6 55.8 53.0 53.5 55.0 20.4 20.0 21.8 – – – 16,136 17,110 18,039 16.9 16.3 15.1Lebanon 1,457,550 1,513,589 1,552,450 23.7 23.9 24.0 70.7 70.8 70.8 22.3 22.5 22.6 41.6 41.7 41.6 22.9 22.7 22.2 – – – – – – – – –Macedonia, FYR 958,204 966,803 972,885 38.2 38.5 38.6 68.7 68.9 68.9 42.3 42.7 42.9 37.6 37.9 38.4 15.7 15.4 15.5 22.9 23.1 22.5 15,327 15,402 15,748 32.2 32.0 31.4Mauritania 1,112,724 1,152,180 1,187,609 26.3 26.4 26.7 79.0 79.1 79.2 28.1 28.4 28.7 35.8 36.0 36.1 18.7 18.9 18.9 – – – – – – – – –Moldova 1,262,344 1,216,982 1,233,244 49.5 49.2 49.3 45.9 44.5 45.1 39.6 37.9 38.4 39.9 38.0 38.7 18.4 18.0 18.8 28.5 28.6 28.7 12,269 13,591 14,655 6.4 7.4 6.7Mongolia 1,146,127 1,175,069 1,203,092 46.0 46.1 46.1 64.4 65.0 65.5 53.4 53.9 54.3 55.4 57.3 57.6 30.4 32.0 32.2 57.5 – – – – – – – –Montenegro – – – – – – – – – – – – – – – – – – – – – – – – 19.1 19.7 19.7Panama 1,679,462 1,715,863 1,755,576 36.9 37.1 37.3 83.0 82.6 82.5 49.0 49.3 49.6 61.7 61.7 62.0 42.9 42.1 42.1 32.2 30.9 29.3 – – – 6.6 6.5 4.5Suriname 199,891 203,422 207,142 36.8 37.1 37.3 68.5 68.7 68.7 39.7 40.1 40.5 46.9 47.3 47.7 19.4 19.4 19.4 – – – – – – – – –Timor-Leste 331,672 341,224 352,853 33.3 33.4 33.6 74.8 74.4 74.1 38.5 38.4 38.4 54.8 54.5 54.3 41.0 40.6 40.5 – 69.9 – – – – – 3.6 –High-incomeCommonwealth countriesAntigua and
Barbuda– – – – – – – – – – – – – – – – – – – – – – – – – – –
Bahamas, The 202,249 207,327 211,650 48.3 48.3 48.3 79.3 79.4 79.3 69.2 69.3 69.3 63.6 64.6 65.0 38.8 39.9 41.1 – – – – – – 14.2 – 13.7Barbados 158,286 159,494 160,420 46.5 46.4 46.4 76.3 76.3 76.2 64.8 64.8 64.8 63.4 62.9 62.5 43.3 42.4 41.8 – – – 19,395 19,375 19,663 10.0 10.8 11.2Cyprus 571,331 584,478 594,546 43.2 43.5 43.5 71.5 71.3 71.5 56.2 57.1 57.2 60.6 60.4 59.5 36.1 34.3 31.2 14.7 13.9 13.6 26,629 27,009 27,360 5.3 6.2 7.7Malta 175,472 179,713 180,321 34.0 34.4 34.6 67.2 67.8 67.4 34.0 35.0 35.2 46.9 47.7 47.8 44.6 45.1 45.0 9.3 9.8 9.3 32,142 32,318 32,664 6.9 6.9 6.4St Kitts and Nevis – – – – – – – – – – – – – – – – – – – – – – – – – – –Trinidad and Tobago 686,124 692,788 698,723 42.1 42.2 42.2 77.7 78.0 78.3 54.3 54.6 54.9 62.1 62.9 62.3 47.3 48.1 46.7 – – – 49,936 49,815 50,599 – – –
157

Table 38. Labour force participation (continued)
Group/country
Total labour force
Labour force (female) (% of labour force)
Participation rate 15 and older (%) Employment population ratio (%) Vulnerable GDP per person Unemployed
Male Female 15 and older Youth 15–24Employment (% of total employment)
Employed (constant 1990 PPP$)
Total (% of total labour force)
2009 2010 2011 2009 2010 2011 2009 2010 2011 2009 2010 2011 2009 2010 2011 2009 2010 2011 2009 2010 2011 2009 2010 2011 2009 2010 2011
Other countriesBahrain 657,579 707,016 732,938 19.4 19.4 19.4 86.2 87.2 87.3 38.5 39.2 39.4 63.6 64.9 65.0 32.2 32.4 30.0 2.0 2.0 – 9,278 9,335 9,175 – – –Croatia 1,985,139 1,964,550 1,906,924 45.9 45.8 45.8 60.0 59.6 59.7 46.5 46.0 46.0 48.2 46.3 45.5 25.5 25.1 23.6 16.6 17.8 18.0 23,293 23,971 25,129 9.1 11.8 13.4Equatorial Guinea 354,494 366,258 377,875 44.7 44.7 44.7 92.3 92.3 92.3 80.5 80.6 80.6 81.1 81.1 80.3 68.2 68.1 67.0 – – – – – – – – –Estonia 699,640 697,270 700,504 49.4 50.1 50.0 68.7 67.7 68.2 55.7 56.5 56.7 53.1 51.1 54.2 30.0 26.5 31.3 4.4 4.9 4.6 41,537 44,605 45,481 13.8 16.9 12.5Iceland 186,491 187,373 188,497 47.0 47.4 47.3 78.5 78.2 78.4 69.9 70.8 70.8 68.9 68.8 69.4 58.0 56.5 58.4 7.7 8.4 8.2 45,538 43,847 44,647 7.2 7.6 7.1Ireland 2,147,374 2,122,113 2,174,578 43.9 44.2 44.2 69.5 68.3 68.5 52.8 52.4 52.6 53.9 52.2 51.8 35.6 31.3 30.7 12.2 11.9 11.8 52,972 55,068 56,749 11.8 13.6 14.4Kuwait 1,430,499 1,514,779 1,585,115 23.9 23.9 23.9 81.6 82.2 82.3 43.1 43.3 43.4 65.8 66.3 66.4 31.1 31.2 30.7 – – – 10,932 11,055 11,440 – – –Latvia 1,185,740 1,151,326 1,068,632 50.0 50.4 50.3 68.3 66.3 67.2 55.4 54.7 55.2 50.7 48.7 51.2 28.5 27.3 30.0 7.7 7.5 7.7 27,037 28,299 28,935 17.1 18.7 15.4Lithuania 1,633,349 1,621,550 1,506,729 50.4 50.7 50.6 63.2 63.4 63.9 53.3 53.9 54.1 49.9 47.9 49.6 21.8 19.6 20.7 9.6 8.8 8.2 27,177 29,055 29,778 13.7 17.8 15.4Luxembourg 234,863 238,396 244,090 43.3 43.4 43.6 66.1 65.4 65.2 48.9 48.9 49.2 54.4 54.6 54.4 27.0 21.5 21.7 5.9 4.9 5.9 52,145 52,585 51,938 5.1 4.4 4.9Norway 2,602,970 2,612,210 2,653,584 47.2 47.0 47.1 70.7 70.2 70.1 62.3 61.5 61.7 64.4 63.5 63.7 53.1 51.6 52.5 5.9 5.6 5.2 50,281 50,494 51,456 3.2 3.6 3.3Oman 1,104,412 1,220,810 1,377,914 18.8 17.9 16.8 78.5 79.9 81.6 27.5 28.0 28.3 53.8 55.3 56.5 31.7 32.2 30.6 – – – 24,376 24,724 25,157 – – –Qatar 1,138,229 1,304,192 1,430,538 12.7 12.3 12.0 94.3 95.2 95.2 51.5 52.1 51.8 84.8 86.0 86.0 64.3 66.5 64.7 0.1 – 0.2 16,005 16,903 18,585 0.3 – 0.6Slovenia 1,038,834 1,039,292 1,038,926 45.9 45.6 45.6 65.4 65.2 65.1 53.5 53.1 53.1 55.8 54.7 54.2 34.7 33.5 33.4 12.8 13.5 13.2 35,071 36,478 37,109 5.9 7.2 8.2Uruguay 1,700,162 1,708,962 1,725,293 44.5 44.5 44.5 76.8 76.6 76.5 55.4 55.4 55.6 60.8 61.0 61.6 43.8 43.6 44.1 23.2 22.2 – 22,064 23,775 25,016 7.3 6.8 6.0
Note: – = not availableSource: World Bank, World Development Indicators 2013, available at: http://databank.worldbank.org (accessed June 2013)
158

Table 38. Labour force participation (continued)
Group/country
Total labour force
Labour force (female) (% of labour force)
Participation rate 15 and older (%) Employment population ratio (%) Vulnerable GDP per person Unemployed
Male Female 15 and older Youth 15–24Employment (% of total employment)
Employed (constant 1990 PPP$)
Total (% of total labour force)
2009 2010 2011 2009 2010 2011 2009 2010 2011 2009 2010 2011 2009 2010 2011 2009 2010 2011 2009 2010 2011 2009 2010 2011 2009 2010 2011
Other countriesBahrain 657,579 707,016 732,938 19.4 19.4 19.4 86.2 87.2 87.3 38.5 39.2 39.4 63.6 64.9 65.0 32.2 32.4 30.0 2.0 2.0 – 9,278 9,335 9,175 – – –Croatia 1,985,139 1,964,550 1,906,924 45.9 45.8 45.8 60.0 59.6 59.7 46.5 46.0 46.0 48.2 46.3 45.5 25.5 25.1 23.6 16.6 17.8 18.0 23,293 23,971 25,129 9.1 11.8 13.4Equatorial Guinea 354,494 366,258 377,875 44.7 44.7 44.7 92.3 92.3 92.3 80.5 80.6 80.6 81.1 81.1 80.3 68.2 68.1 67.0 – – – – – – – – –Estonia 699,640 697,270 700,504 49.4 50.1 50.0 68.7 67.7 68.2 55.7 56.5 56.7 53.1 51.1 54.2 30.0 26.5 31.3 4.4 4.9 4.6 41,537 44,605 45,481 13.8 16.9 12.5Iceland 186,491 187,373 188,497 47.0 47.4 47.3 78.5 78.2 78.4 69.9 70.8 70.8 68.9 68.8 69.4 58.0 56.5 58.4 7.7 8.4 8.2 45,538 43,847 44,647 7.2 7.6 7.1Ireland 2,147,374 2,122,113 2,174,578 43.9 44.2 44.2 69.5 68.3 68.5 52.8 52.4 52.6 53.9 52.2 51.8 35.6 31.3 30.7 12.2 11.9 11.8 52,972 55,068 56,749 11.8 13.6 14.4Kuwait 1,430,499 1,514,779 1,585,115 23.9 23.9 23.9 81.6 82.2 82.3 43.1 43.3 43.4 65.8 66.3 66.4 31.1 31.2 30.7 – – – 10,932 11,055 11,440 – – –Latvia 1,185,740 1,151,326 1,068,632 50.0 50.4 50.3 68.3 66.3 67.2 55.4 54.7 55.2 50.7 48.7 51.2 28.5 27.3 30.0 7.7 7.5 7.7 27,037 28,299 28,935 17.1 18.7 15.4Lithuania 1,633,349 1,621,550 1,506,729 50.4 50.7 50.6 63.2 63.4 63.9 53.3 53.9 54.1 49.9 47.9 49.6 21.8 19.6 20.7 9.6 8.8 8.2 27,177 29,055 29,778 13.7 17.8 15.4Luxembourg 234,863 238,396 244,090 43.3 43.4 43.6 66.1 65.4 65.2 48.9 48.9 49.2 54.4 54.6 54.4 27.0 21.5 21.7 5.9 4.9 5.9 52,145 52,585 51,938 5.1 4.4 4.9Norway 2,602,970 2,612,210 2,653,584 47.2 47.0 47.1 70.7 70.2 70.1 62.3 61.5 61.7 64.4 63.5 63.7 53.1 51.6 52.5 5.9 5.6 5.2 50,281 50,494 51,456 3.2 3.6 3.3Oman 1,104,412 1,220,810 1,377,914 18.8 17.9 16.8 78.5 79.9 81.6 27.5 28.0 28.3 53.8 55.3 56.5 31.7 32.2 30.6 – – – 24,376 24,724 25,157 – – –Qatar 1,138,229 1,304,192 1,430,538 12.7 12.3 12.0 94.3 95.2 95.2 51.5 52.1 51.8 84.8 86.0 86.0 64.3 66.5 64.7 0.1 – 0.2 16,005 16,903 18,585 0.3 – 0.6Slovenia 1,038,834 1,039,292 1,038,926 45.9 45.6 45.6 65.4 65.2 65.1 53.5 53.1 53.1 55.8 54.7 54.2 34.7 33.5 33.4 12.8 13.5 13.2 35,071 36,478 37,109 5.9 7.2 8.2Uruguay 1,700,162 1,708,962 1,725,293 44.5 44.5 44.5 76.8 76.6 76.5 55.4 55.4 55.6 60.8 61.0 61.6 43.8 43.6 44.1 23.2 22.2 – 22,064 23,775 25,016 7.3 6.8 6.0
Note: – = not availableSource: World Bank, World Development Indicators 2013, available at: http://databank.worldbank.org (accessed June 2013)
159

Tabl
e 39
. U
rban
and
rura
l pop
ulat
ion
(%)
Gro
up/c
ount
ryU
rban
Rur
alA
nnua
l urb
an g
row
th ra
te
2009
2010
2011
2012
2009
2010
2011
2012
2009
2010
2011
2012
Mid
dle-
inco
me
Com
mon
wea
lth c
ount
ries
Bel
ize
45.2
45.0
44.8
44.6
54.8
55.0
55.2
55.4
1.9
1.9
2.0
2.0
Bo
tsw
ana
60.2
61.0
61.6
62.3
39.8
39.0
38.4
37.7
2.1
2.1
1.9
1.9
Do
min
ica
67.0
67.1
67.2
67.3
33.0
32.9
32.8
32.7
0.2
0.3
0.5
0.6
Fiji
51.4
51.8
52.2
52.6
48.6
48.2
47.8
47.4
1.8
1.7
1.6
1.5
Gre
nada
38.5
38.8
39.2
39.5
61.5
61.2
60.8
60.5
1.2
1.2
1.3
1.3
Guy
ana
28.3
28.3
28.4
28.5
71.7
71.7
71.6
71.5
0.7
0.6
0.9
0.9
Jam
aica
52.0
52.0
52.1
52.2
48.0
48.0
47.9
47.8
0.3
0.2
0.4
0.4
Kiri
bati
43.8
43.8
43.9
44.1
56.2
56.2
56.1
55.9
1.6
1.6
1.8
1.8
Leso
tho
26.1
26.8
27.6
28.3
73.9
73.2
72.4
71.7
3.7
3.6
3.7
3.7
Mal
dive
s38
.740
.041
.142
.261
.360
.058
.957
.85.
15.
04.
74.
6M
aurit
ius
41.9
41.8
41.8
41.8
58.1
58.2
58.2
58.2
0.3
0.3
0.4
0.5
Nam
ibia
37.3
37.8
38.4
39.0
62.7
62.2
61.6
61.0
3.0
3.1
3.3
3.3
Nau
ru–
––
––
––
––
––
–P
apua
New
Gui
nea
12.5
12.4
12.5
12.6
87.5
87.6
87.5
87.4
2.1
2.1
2.8
2.7
St L
ucia
19.3
18.3
17.6
17.0
80.7
81.7
82.4
83.0
−3.4
−3.8
−2.7
−3.0
St V
ince
nt a
nd th
e G
rena
dine
s48
.548
.949
.349
.751
.551
.150
.750
.30.
90.
80.
80.
8
Sam
oa
20.3
20.1
19.9
19.7
79.7
79.9
80.1
80.3
−0.4
−0.4
−0.2
−0.2
Seyc
helle
s52
.953
.253
.654
.047
.146
.846
.446
.01.
03.
4−1
.91.
1So
lom
on
Isla
nds
19.6
20.0
20.5
20.9
80.4
80.0
79.5
79.1
4.5
4.4
4.4
4.3
Swaz
iland
21.4
21.3
21.3
21.2
78.6
78.7
78.7
78.8
1.1
1.1
1.4
1.4
Tong
a23
.323
.423
.523
.676
.776
.676
.576
.40.
80.
70.
90.
8Tu
valu
49.7
50.1
50.6
51.0
50.3
49.9
49.4
49.0
1.0
1.0
1.0
1.0
Van
uatu
24.3
24.6
24.9
25.2
75.7
75.4
75.1
74.8
3.6
3.6
3.6
3.5
Oth
er c
ount
ries
Alb
ania
51.2
52.3
53.4
54.4
48.8
47.7
46.6
45.6
2.0
2.1
2.1
2.2
Arm
enia
64.1
64.1
64.1
64.2
35.9
35.9
35.9
35.8
−0.4
−0.2
0.1
0.2
Bhu
tan
34.0
34.8
35.6
36.3
66.0
65.2
64.4
63.7
4.0
4.0
3.9
3.8
Bo
snia
and
Her
zego
vina
47.2
47.7
48.3
48.8
52.8
52.3
51.7
51.2
0.9
0.8
1.0
1.0
Cap
e V
erde
61.0
61.8
62.6
63.3
39.0
38.2
37.4
36.7
1.6
1.7
1.8
2.0
Co
ngo,
Rep
ublic
of
62.8
63.2
63.6
64.1
37.2
36.8
36.4
35.9
3.7
3.6
3.4
3.3
Co
sta
Ric
a63
.764
.264
.665
.136
.335
.835
.434
.92.
32.
22.
22.
1D
jibo
uti
77.0
77.0
77.1
77.2
23.0
23.0
22.9
22.8
1.5
1.5
1.6
1.6
Gab
on
85.4
85.8
86.1
86.5
14.6
14.2
13.9
13.5
3.0
3.0
2.8
2.7
Geo
rgia
52.7
52.7
52.9
53.0
47.3
47.3
47.1
47.0
0.7
1.0
0.9
0.9
Jord
an82
.282
.582
.783
.017
.817
.517
.317
.02.
52.
52.
52.
5La
o P
DR
32.0
33.1
34.2
35.3
68.0
66.9
65.8
64.7
5.7
5.5
5.2
5.1
(con
tinue
d)
160

Tabl
e 39
. U
rban
and
rura
l pop
ulat
ion
(%) (
cont
inue
d)
Gro
up/c
ount
ryU
rban
Rur
alA
nnua
l urb
an g
row
th ra
te
2009
2010
2011
2012
2009
2010
2011
2012
2009
2010
2011
2012
Leba
non
87.0
87.1
87.2
87.4
13.0
12.9
12.8
12.6
1.6
2.3
1.1
1.1
Mac
edo
nia,
FYR
59.2
59.2
59.3
59.4
40.8
40.8
40.7
40.6
0.1
0.1
0.3
0.3
Mau
ritan
ia41
.141
.241
.541
.858
.958
.858
.558
.23.
13.
03.
23.
2M
old
ova
46.2
46.9
47.7
48.4
53.8
53.1
52.3
51.6
1.5
1.5
1.5
1.5
Mo
ngo
lia66
.667
.668
.569
.333
.432
.431
.530
.73.
03.
02.
82.
8M
ont
eneg
ro62
.963
.163
.363
.537
.136
.936
.736
.50.
40.
40.
40.
4P
anam
a73
.874
.675
.275
.826
.225
.424
.824
.22.
82.
82.
52.
4P
arag
uay
60.8
61.4
61.9
62.4
39.2
38.6
38.1
37.6
2.7
2.7
2.6
2.6
São
To
mé
and
Prín
cipe
61.2
62.0
62.7
63.3
38.8
38.0
37.4
36.7
4.2
4.1
3.8
3.7
Surin
ame
68.9
69.3
69.7
70.1
31.1
30.7
30.3
29.9
1.6
1.5
1.5
1.5
Tim
or-
Lest
e27
.628
.028
.328
.772
.472
.071
.771
.34.
34.
24.
24.
2H
igh-
inco
me
Com
mon
wea
lth c
ount
ries
Ant
igua
and
Bar
buda
30.0
29.9
29.9
29.9
70.0
70.1
70.1
70.1
0.6
0.6
1.0
1.0
Bah
amas
, The
83.9
84.1
84.3
84.4
16.1
15.9
15.7
15.6
2.0
1.9
1.8
1.8
Bar
bado
s43
.343
.944
.444
.956
.756
.155
.655
.11.
71.
71.
71.
6B
rune
i Dar
ussa
lam
75.2
75.6
76.0
76.3
24.8
24.4
24.0
23.7
2.2
2.1
2.0
1.9
Cyp
rus
70.1
70.3
70.5
70.7
29.9
29.7
29.5
29.3
1.5
1.4
1.4
1.4
Mal
ta94
.594
.794
.895
.05.
55.
35.
25.
00.
70.
70.
30.
6St
Kitt
s an
d N
evis
32.0
31.9
32.0
32.1
68.0
68.1
68.0
67.9
1.1
1.1
1.4
1.4
Trin
idad
and
To
bago
13.2
13.4
13.7
14.0
86.8
86.6
86.3
86.0
2.5
2.4
2.3
2.3
Oth
er c
ount
ries
Bah
rain
88.6
88.6
88.7
88.8
11.4
11.4
11.3
11.2
6.6
5.0
3.3
2.0
Cro
atia
57.3
57.5
57.8
58.1
42.7
42.5
42.2
41.9
0.3
0.1
−2.7
0.2
Equa
toria
l Gui
nea
39.2
39.3
39.5
39.7
60.8
60.7
60.5
60.3
3.1
3.0
3.3
3.2
Esto
nia
69.5
69.5
69.5
69.6
30.5
30.5
30.5
30.4
0.0
0.0
0.1
0.0
Icel
and
93.5
93.6
93.7
93.8
6.5
6.4
6.3
6.2
0.5
0.0
0.4
0.5
Irela
nd61
.661
.962
.262
.538
.438
.137
.837
.51.
20.
82.
80.
8K
uwai
t98
.298
.298
.398
.31.
81.
81.
71.
75.
34.
94.
44.
0La
tvia
67.8
67.7
67.7
67.7
32.2
32.3
32.3
32.3
−0.6
−0.8
−8.4
−1.6
Lith
uani
a66
.967
.067
.167
.233
.133
.032
.932
.8−0
.4−1
.5−8
.0−1
.3Lu
xem
bour
g84
.985
.285
.485
.615
.114
.814
.614
.42.
12.
12.
52.
8N
orw
ay78
.879
.179
.479
.621
.220
.920
.620
.41.
71.
71.
61.
7O
man
72.9
73.2
73.4
73.7
27.1
26.8
26.6
26.3
3.0
5.5
8.0
9.5
Qat
ar98
.498
.798
.898
.91.
61.
31.
21.
114
.311
.58.
97.
2S
love
nia
50.1
50.0
49.9
49.9
49.9
50.0
50.1
50.1
0.7
0.2
0.1
0.2
Uru
guay
92.3
92.5
92.5
92.6
7.7
7.5
7.5
7.4
0.5
0.5
0.4
0.4
Not
e: –
= n
ot a
vaila
ble
Sou
rce:
Wo
rld B
ank,
Wor
ld D
evel
opm
ent I
ndic
ator
s 20
13, a
vaila
ble
at: h
ttp:
//da
taba
nk.w
orld
bank
.org
(acc
esse
d Ju
ne 2
013)
161

Tabl
e 40
. La
nd u
se
Gro
up/c
ount
ryFo
od p
rodu
ctio
n in
dex
(200
4–20
06)=
100
Agr
icul
tura
l Pro
duct
ivit
y (C
onst
ant
US
$ 20
05)
Cer
eal y
ield
(kg
per h
ecta
re)
Fore
st a
rea
(%
of la
nd a
rea)
Ara
ble
land
(% o
f lan
d ar
ea)
2009
2010
2011
2009
2010
2011
2009
2010
2011
2010
2011
2009
2010
2011
Mid
dle-
inco
me
Com
mon
wea
lth c
ount
ries
Bel
ize
88.4
89.9
86.7
3,56
73,
474
3,28
32,
972
2,79
92,
817
61.1
60.6
3.2
3.3
3.3
Bo
tsw
ana
112.
812
3.8
127.
6–
––
359
374
393
20.0
19.8
0.6
0.5
0.5
Do
min
ica
112.
411
3.5
110.
87,
467
6,68
87,
091
1,14
81,
417
2,28
859
.559
.28.
08.
08.
0Fi
ji87
.583
.182
.52,
605
2,47
42,
661
2,81
62,
602
3,07
555
.555
.79.
29.
29.
2G
rena
da83
.687
.691
.53,
737
3,51
23,
660
792
861
1,03
250
.050
.08.
88.
88.
8G
uyan
a10
4.8
105.
911
3.4
4,28
44,
472
4,68
54,
366
4,16
74,
741
77.2
77.2
2.1
2.1
2.1
Jam
aica
98.9
98.6
103.
53,
136
3,17
23,
516
1,25
71,
172
1,27
031
.131
.111
.111
.111
.1K
iriba
ti11
6.3
117.
411
5.7
2,18
1–
––
––
15.0
15.0
2.5
2.5
2.5
Leso
tho
94.0
111.
410
7.4
309
392
368
421
909
664
1.4
1.5
11.0
10.6
10.1
Mal
dive
s77
.783
.587
.32,
928
2,90
33,
067
1,97
32,
264
2,50
83.
03.
010
.010
.010
.0M
aurit
ius
100.
898
.596
.97,
083
6,91
37,
317
8,00
06,
833
7,44
217
.217
.339
.439
.438
.4N
amib
ia92
.391
.291
.3–
––
365
373
354
8.9
8.8
1.0
1.0
1.0
Nau
ru–
––
––
––
––
––
––
–P
apua
New
Gui
nea
116.
311
4.8
111.
6–
––
4,15
64,
279
4,45
763
.463
.10.
70.
70.
7St
Luc
ia11
1.5
90.7
95.6
2,17
61,
780
1,66
4–
––
77.0
77.0
4.9
4.9
4.9
St V
ince
nt a
nd th
e G
rena
dine
s96
.510
7.0
117.
93,
478
2,83
22,
425
3,35
03,
281
5,29
768
.568
.712
.812
.812
.8
Sam
oa
107.
210
8.4
103.
82,
854
2,53
62,
493
––
–60
.460
.42.
82.
82.
8Se
yche
lles
83.5
79.1
86.7
831
780
807
––
–88
.588
.52.
22.
22.
2So
lom
on
Isla
nds
114.
112
0.4
119.
01,
177
––
2,92
33,
500
4,21
179
.178
.90.
60.
60.
6Sw
azila
nd10
1.5
104.
210
5.0
1,28
71,
329
1,37
31,
077
1,22
61,
148
32.7
33.0
10.2
10.2
10.2
Tong
a10
7.0
103.
699
.43,
624
3,59
03,
781
––
–12
.512
.522
.222
.222
.2Tu
valu
110.
011
0.7
104.
44,
884
4,87
64,
905
––
–33
.333
.3–
––
Van
uatu
105.
510
6.5
104.
82,
510
2,63
12,
714
565
538
559
36.1
36.1
1.6
1.6
1.6
Oth
er c
ount
ries
Alb
ania
112.
711
9.1
125.
53,
069
3,30
23,
462
4,31
54,
762
4,45
928
.328
.322
.222
.822
.7A
rmen
ia12
3.8
102.
911
6.3
7,54
46,
438
6,94
22,
250
2,06
82,
742
9.2
9.1
15.8
15.7
15.1
Bhu
tan
89.2
95.0
100.
564
963
062
52,
166
2,48
22,
705
84.6
84.9
2.4
2.5
2.5
Bo
snia
and
Her
zego
vina
109.
310
5.2
110.
121
,784
22,8
9524
,693
4,50
33,
853
3,72
542
.842
.819
.519
.719
.7C
ape
Ver
de12
6.7
128.
413
2.4
3,91
74,
655
–23
122
017
821
.021
.011
.711
.711
.7C
ong
o, R
epub
lic o
f12
1.0
125.
312
9.3
600
634
685
791
780
814
65.6
65.6
1.5
1.5
1.5
Co
sta
Ric
a10
0.5
109.
011
3.6
5,60
96,
007
6,13
23,
791
3,77
03,
376
51.0
51.5
4.5
4.9
4.9
Djib
out
i12
6.5
113.
711
3.6
––
–1,
222
1,44
42,
000
0.2
0.2
0.1
0.1
0.1
Gab
on
112.
812
3.4
135.
0–
––
1,65
81,
687
1,69
885
.485
.41.
31.
31.
3G
eorg
ia77
.573
.076
.72,
232
2,33
72,
531
1,90
41,
271
2,20
139
.539
.46.
76.
06.
0
(con
tinue
d)
162

Tabl
e 40
. La
nd u
se (c
onti
nued
)
Gro
up/c
ount
ryFo
od p
rodu
ctio
n in
dex
(200
4–20
06)=
100
Agr
icul
tura
l Pro
duct
ivit
y (C
onst
ant
US
$ 20
05)
Cer
eal y
ield
(Kg
per h
ecta
re)
Fore
st a
rea
(% o
f lan
d ar
ea)
Ara
ble
land
(%
of l
and
area
)
2009
2010
2011
2009
2010
2011
2009
2010
2011
2010
2011
2009
2010
2011
Leba
non
94.3
92.1
95.1
37,1
6941
,417
44,2
392,
619
2,65
62,
802
13.4
13.4
12.0
11.1
10.9
Mac
edo
nia,
FYR
107.
311
8.7
116.
09,
625
10,8
0311
,504
3,38
63,
330
3,50
239
.639
.816
.716
.416
.4M
aurit
ania
102.
611
3.6
112.
41,
009
1,05
31,
001
717
946
1,39
50.
20.
20.
40.
40.
4M
old
ova
89.5
87.1
94.7
1,86
92,
106
2,34
02,
373
2,73
42,
866
11.7
11.9
55.2
55.2
55.1
Mo
ngo
lia14
7.1
114.
412
4.5
2,99
02,
505
2,51
41,
552
1,37
01,
485
7.0
7.0
0.4
0.4
0.4
Mo
nten
egro
99.8
98.4
111.
75,
958
6,06
06,
903
3,46
43,
494
3,66
640
.440
.412
.912
.812
.8P
anam
a10
3.5
108.
311
2.8
4,21
43,
626
3,55
02,
095
2,36
12,
569
43.7
43.6
7.3
7.3
7.3
São
To
mé
and
Prín
cipe
114.
011
3.1
116.
2–
––
2,46
23,
000
3,00
028
.128
.19.
48.
99.
1Su
rinam
e12
3.7
131.
512
9.9
3,53
13,
556
3,70
94,
209
4,23
24,
133
94.6
94.6
0.4
0.4
0.4
Tim
or-
Lest
e13
3.0
125.
911
1.8
––
–2,
316
2,45
12,
252
49.9
49.1
11.1
10.4
10.1
Hig
h-in
com
eC
omm
onw
ealth
cou
ntrie
sA
ntig
ua a
nd B
arbu
da10
9.5
110.
411
3.1
1,77
52,
248
2,40
22,
053
2,07
52,
000
22.3
22.3
9.1
9.1
9.1
Bah
amas
, The
111.
111
5.8
114.
328
,669
29,9
3733
,967
1,75
82,
727
4,41
051
.451
.40.
80.
90.
9B
arba
dos
99.3
92.3
93.3
––
–2,
109
3,18
93,
444
19.4
19.4
30.2
25.6
27.9
Bru
nei D
arus
sala
m10
5.6
113.
711
5.4
85,2
0080
,206
83,8
6751
558
059
172
.171
.80.
60.
60.
6C
ypru
s84
.884
.185
.2–
––
1,82
41,
998
1,88
718
.718
.89.
48.
99.
1M
alta
95.8
96.3
95.2
57,9
3656
,234
–4,
849
4,79
35,
302
0.9
0.9
25.0
28.1
28.1
St K
itts
and
Nev
is35
.433
.737
.01,
152
1,13
11,
207
––
–42
.342
.315
.417
.319
.2Tr
inid
ad a
nd T
oba
go94
.599
.110
5.1
1,32
02,
114
2,07
12,
619
2,57
73,
416
44.1
44.0
4.9
4.9
4.9
Oth
er c
ount
ries
Bah
rain
126.
411
4.8
157.
7–
––
––
–0.
70.
71.
81.
81.
8C
roat
ia11
4.0
100.
710
1.3
22,5
9723
,489
24,6
866,
117
5,46
75,
228
34.3
34.4
15.5
16.2
16.0
Equa
toria
l Gui
nea
116.
311
2.5
114.
6–
––
––
–58
.057
.54.
74.
64.
6Es
toni
a11
6.0
116.
211
9.8
7,59
88,
385
–2,
761
2,46
52,
596
52.3
52.1
14.1
15.2
14.9
Icel
and
108.
910
9.4
110.
770
,508
––
––
–0.
30.
31.
21.
21.
2Ire
land
94.6
100.
910
3.4
––
–6,
887
7,45
58,
440
10.7
10.9
15.8
14.7
15.4
Kuw
ait
131.
213
3.3
136.
2–
––
6,98
48,
573
8,64
80.
40.
40.
60.
60.
6La
tvia
120.
511
9.3
118.
45,
205
5,46
73,
075
2,86
72,
748
53.9
54.1
18.8
18.8
18.6
Lith
uani
a11
7.2
102.
510
9.4
9,32
09,
369
3,45
02,
763
3,03
034
.534
.632
.833
.934
.9Lu
xem
bour
g10
2.2
91.5
97.0
42,7
8042
,945
42,1
996,
202
5,59
35,
193
33.5
33.5
23.8
23.9
23.9
No
rway
99.7
101.
295
.947
,162
53,9
01–
3,44
64,
004
3,22
633
.133
.32.
72.
72.
7O
man
100.
112
5.4
121.
1–
––
15,3
4210
,649
10,2
690.
00.
00.
30.
10.
1Q
atar
116.
712
5.1
127.
9–
––
6,32
47,
593
6,05
00.
00.
01.
21.
21.
2S
love
nia
93.7
95.8
93.0
100,
141
112,
484
–5,
260
5,97
86,
372
62.2
62.3
8.7
8.5
8.4
Uru
guay
108.
411
4.1
115.
28,
658
8,40
99,
391
4,07
64,
267
4,58
710
.010
.210
.79.
710
.3
Not
e: –
= n
ot a
vaila
ble
Sou
rce:
Wo
rld B
ank,
Wor
ld D
evel
opm
ent I
ndic
ator
s 20
13, a
vaila
ble
at: h
ttp:
//da
taba
nk.w
orld
bank
.org
(acc
esse
d Ju
ne 2
013)
163

Tabl
e 41
. Po
pula
tion
dis
trib
utio
n by
age
, act
ual a
nd p
roje
cted
(%)
Gro
up/c
ount
ryA
ge 0
–4A
ge 5
–14
Age
15–
64A
ge 6
5+
2010
2015
2020
2025
2010
2015
2020
2025
2010
2015
2020
2025
2010
2015
2020
2025
Mid
dle-
inco
me
Com
mon
wea
lth c
ount
ries
Bel
ize
12.0
11.2
10.6
9.7
23.3
21.0
19.8
19.0
61.0
63.6
65.0
65.5
4.0
4.2
4.7
5.8
Bo
tsw
ana
–11
.110
.19.
421
.520
.620
.319
.663
.264
.064
.265
.03.
94.
35.
46.
1D
om
inic
a–
––
––
––
––
––
––
––
–Fi
ji10
.49.
49.
08.
220
.919
.318
.617
.564
.165
.365
.465
.65.
06.
07.
08.
6G
rena
da9.
59.
38.
77.
618
.317
.217
.517
.265
.366
.566
.166
.27.
27.
07.
69.
0G
uyan
a12
.57.
87.
97.
820
.717
.915
.815
.264
.767
.069
.969
.06.
27.
36.
38.
0Ja
mai
ca9.
08.
98.
17.
619
.717
.916
.716
.063
.365
.065
.965
.67.
78.
29.
310
.7K
iriba
ti–
––
––
––
––
––
––
––
–Le
soth
o12
.612
.511
.711
.025
.524
.322
.522
.156
.758
.361
.462
.64.
84.
94.
44.
4M
aldi
ves
10.1
9.0
7.1
6.0
18.3
16.0
14.7
14.0
68.5
70.8
72.4
72.7
4.4
4.3
5.8
7.3
Mau
ritiu
s6.
06.
95.
85.
615
.313
.812
.111
.570
.370
.471
.770
.47.
59.
010
.412
.2N
amib
ia12
.812
.011
.110
.423
.622
.521
.420
.359
.961
.563
.064
.13.
74.
04.
65.
2N
auru
––
––
––
––
––
––
––
––
Pap
ua N
ew G
uine
a14
.013
.112
.411
.825
.424
.222
.921
.758
.159
.861
.362
.62.
52.
83.
43.
8St
Luc
ia7.
98.
17.
46.
617
.116
.015
.614
.667
.468
.969
.269
.46.
87.
07.
89.
4St
Vin
cent
and
the
Gre
nadi
nes
8.3
8.1
7.2
6.7
18.0
16.7
15.8
14.6
66.8
68.3
69.0
68.8
6.7
6.9
8.0
9.9
Sam
oa
14.0
10.3
10.8
10.9
27.4
23.8
21.9
20.6
56.4
60.8
61.2
61.4
4.9
5.0
6.1
7.1
Seyc
helle
s–
––
––
––
––
––
––
––
–So
lom
on
Isla
nds
15.0
12.6
12.8
12.1
24.8
23.8
23.8
22.4
52.8
60.3
59.8
61.6
3.1
3.3
3.6
4.0
Swaz
iland
13.7
13.1
12.2
11.3
25.4
24.0
23.2
22.7
57.8
59.3
60.7
61.8
3.4
3.7
4.0
4.2
Tong
a13
.511
.611
.010
.724
.225
.123
.421
.256
.757
.359
.761
.35.
96.
05.
96.
7Tu
valu
––
––
––
––
––
––
––
––
Van
uatu
––
––
––
––
––
––
––
––
Oth
er c
ount
ries
Alb
ania
6.3
7.3
5.9
5.5
15.9
13.5
12.2
11.8
67.4
68.5
70.1
68.2
9.7
10.7
11.8
14.6
Arm
enia
7.3
7.4
6.5
5.7
12.9
13.7
14.2
13.5
68.7
68.0
66.7
65.3
11.0
10.9
12.6
15.5
Bhu
tan
9.8
9.5
8.3
7.4
20.1
18.2
16.9
15.9
65.3
67.1
69.2
70.1
4.9
5.1
6.7
6.1
Bo
snia
and
H
erze
govi
na4.
34.
13.
93.
910
.79.
38.
68.
270
.971
.469
.867
.614
.015
.317
.720
.4
Cap
e V
erde
10.2
10.8
8.5
7.7
24.1
21.7
17.0
15.8
60.4
63.8
68.5
69.3
4.1
3.7
6.1
7.1
Co
ngo,
Rep
ublic
of
16.6
13.6
14.3
13.6
25.3
24.6
24.9
24.1
56.0
58.0
57.0
58.4
3.8
3.8
3.8
3.9
Co
sta
Ric
a7.
87.
86.
86.
217
.415
.614
.113
.368
.269
.170
.069
.36.
57.
59.
211
.3D
jibo
uti
12.4
11.6
11.9
11.1
23.2
21.9
21.4
21.0
61.1
62.8
62.8
62.8
3.3
3.7
3.9
4.3
Gab
on
14.6
11.7
11.9
11.3
23.3
21.7
20.9
20.8
60.1
62.1
62.2
62.4
4.3
4.7
5.0
5.5
Geo
rgia
6.7
5.8
5.1
4.6
13.8
11.3
11.8
11.0
69.0
68.2
66.7
65.4
14.3
14.7
16.5
19.1
(con
tinue
d)
164

Tabl
e 41
. Po
pula
tion
dis
trib
utio
n by
age
, act
ual a
nd p
roje
cted
(%) (
cont
inue
d)
Gro
up/c
ount
ryA
ge 0
–4A
ge 5
–14
Age
15–
64A
ge 6
5+
2010
2015
2020
2025
2010
2015
2020
2025
2010
2015
2020
2025
2010
2015
2020
2025
Leba
non
6.3
7.5
6.7
6.3
17.2
14.8
14.0
13.2
67.9
70.1
70.5
70.3
7.4
7.7
8.8
10.2
Mac
edo
nia,
FYR
5.4
5.2
4.9
4.7
12.2
11.1
10.5
10.1
70.6
70.9
69.9
68.7
11.8
12.9
14.7
16.6
Mau
ritan
ia15
.313
.613
.412
.724
.824
.223
.923
.058
.159
.459
.760
.92.
72.
83.
03.
4M
old
ova
6.0
5.9
5.5
4.9
6.0
6.2
12.0
11.6
72.2
71.2
68.4
67.0
11.2
11.9
14.1
16.5
Mo
ngo
lia10
.310
.59.
88.
78.
817
.419
. 018
.468
.367
.966
.567
.04.
14.
24.
75.
9M
ont
eneg
ro6.
56.
05.
65.
313
.312
.312
.011
.468
.068
.060
.760
.06.
713
.715
.417
.3P
anam
a10
.09.
18.
48.
019
.218
.217
.016
.064
.465
.262
.161
.83.
17.
58.
59.
9Su
rinam
e9.
18.
67.
97.
519
.517
.816
.115
.265
.066
.764
.162
.96.
56.
97.
79.
1T
imo
r-Le
ste
16.8
17.2
16.4
15.8
27.5
26.0
26.4
26.1
52.3
53.7
52.0
53.0
3.0
3.1
3.3
3.4
Hig
h-in
com
eC
omm
onw
ealth
cou
ntrie
sA
ntig
ua a
nd B
arbu
da–
––
––
––
––
––
––
––
–B
aham
as, T
he7.
57.
76.
96.
516
.915
.313
.513
.268
.069
.064
.562
.37.
08.
09.
912
.1B
arba
dos
6.4
5.4
5.3
5.1
11.5
10.9
10.5
10.5
72.5
71.5
62.3
62.3
10.4
12.2
15.0
18.0
Bru
nei D
arus
sala
m8.
78.
47.
87.
117
.115
.715
.113
.970
2.0
71.5
67.4
66.8
3.5
4.4
6.1
7.8
Cyp
rus
5.8
5.8
5.4
5.3
11.8
10.9
10.7
10.3
69.3
68.8
63.9
62.5
13.2
14.5
14.3
16.1
Mal
ta4.
74.
64.
44.
410
.79.
39.
19.
070
.068
.159
.257
.314
.817
.920
.322
.7St
Kitt
s an
d N
evis
––
––
––
––
––
––
––
––
Trin
idad
and
To
bago
7.3
7.1
6.2
5.5
13.5
13.4
13.6
12.9
72.5
71.6
65.3
63.3
6.9
8.0
9.7
12.0
Oth
er c
ount
ries
Bah
rain
7.2
7.9
6.9
5.9
17.3
15.9
14.1
13.9
71.8
73.5
75.2
74.0
2.3
2.8
3.8
6.2
Cro
atia
5.0
4.9
4.9
4.8
10.2
9.6
9.9
10.0
67.7
67.0
65.1
63.2
17.3
18.6
20.1
21.9
Equa
toria
l Gui
nea
15.4
15.6
14.3
13.3
25.1
24.6
23.7
23.6
56.4
57.0
58.6
58.6
2.8
2.7
3.4
4.5
Esto
nia
5.6
6.3
5.9
5.5
9.5
10.7
11.9
12.0
67.6
65.3
63.3
62.5
17.1
17.7
18.9
20.1
Icel
and
7.2
6.9
7.1
6.8
13.2
12.8
13.6
13.4
67.9
67.4
64.4
62.9
11.8
12.9
14.9
16.9
Irela
nd7.
97.
27.
06.
413
.213
.914
.613
.967
.966
.464
.063
.811
.412
.514
.415
.9K
uwai
t9.
57.
77.
67.
114
.814
.715
.913
.974
.474
.473
.774
.92.
33.
12.
84.
1La
tvia
5.2
5.4
5.5
5.2
8.8
9.7
10.8
11.3
68.7
67.4
65.0
63.7
17.4
17.5
18.6
19.8
Lith
uani
a5.
14.
95.
65.
59.
99.
310
.611
.269
.068
.766
.864
.716
.417
.117
.018
.6Lu
xem
bour
g5.
75.
65.
95.
912
.011
.211
.211
.468
.468
.867
.866
.314
.014
.515
.116
.4N
orw
ay6.
35.
86.
26.
212
.712
.112
.112
.166
.265
.463
.662
.215
.016
.618
.119
.6O
man
10.3
10.2
7.0
6.0
20.5
18.5
17.7
14.3
66.0
67.7
67.2
69.2
3.1
3.6
4.3
6.2
Qat
ar4.
95.
44.
33.
510
.210
.610
.19.
683
.082
.584
.284
.51.
11.
51.
43.
5S
love
nia
5.1
4.9
4.8
4.5
9.0
9.2
9.9
9.8
69.9
67.9
64.8
62.9
16.4
17.9
20.5
22.7
Uru
guay
7.3
7.0
6.8
6.5
15.2
14.4
13.8
13.3
63.6
64.3
59.4
59.0
13.9
14.4
14.8
15.9
Not
e: –
= n
ot a
vaila
ble
Sou
rce:
Po
pula
tion
Div
isio
n o
f the
Dep
artm
ent o
f Eco
nom
ic a
nd S
oci
al A
ffai
rs o
f the
Uni
ted
Nat
ions
Sec
reta
riat,
Wor
ld P
opul
atio
n Pr
ospe
cts:
The
201
0 Re
visi
on, a
vaila
ble
at: h
ttp:
//es
a.un
.org
/unp
d/ (a
cces
sed
July
201
3)
165

Tabl
e 42
. S
elec
ted
dem
ogra
phic
indi
cato
rs
Gro
up/c
ount
ryC
rude
bir
th ra
te (p
er 1
,000
mid
-yea
r po
puat
ion)
Cru
de d
eath
rate
(per
1,0
00 m
id-y
ear
popu
lati
on)
Infa
nt m
orta
lity
rate
(per
1,0
00 li
ve b
irth
s)
2008
2009
2010
2011
2008
2009
2010
2011
2008
2009
2010
2011
Mid
dle-
inco
me
Com
mon
wea
lth c
ount
ries
Bel
ize
25.1
24.8
24.5
24.3
3.9
3.8
3.8
3.8
16.3
15.8
15.1
14.5
Bo
tsw
ana
24.0
23.8
23.6
23.3
13.0
13.0
13.1
13.3
24.3
22.4
21.3
20.3
Do
min
ica
––
13.8
––
–8.
7–
11.1
11.0
10.9
10.7
Fiji
22.2
21.9
21.6
21.2
6.6
6.6
6.7
6.8
15.4
14.9
14.7
14.1
Gre
nada
19.3
19.4
19.4
19.4
6.2
6.2
6.1
6.0
10.9
10.8
10.5
10.3
Guy
ana
18.6
18.3
18.1
17.8
5.9
5.8
5.7
5.7
31.8
31.2
30.3
29.4
Jam
aica
16.7
16.3
15.3
15.2
6.3
6.4
6.6
6.6
17.2
16.8
16.3
15.7
Kiri
bati
––
––
––
––
40.6
39.5
38.6
37.7
Leso
tho
28.4
28.1
27.8
27.5
16.6
16.2
15.8
15.5
71.0
68.3
67.2
62.6
Mal
dive
s17
.116
.916
.816
.63.
63.
63.
63.
613
.912
.110
.69.
2M
aurit
ius
12.9
12.0
11.7
11.5
7.1
7.2
7.1
7.0
13.2
13.1
13.0
12.8
Nam
ibia
27.2
26.7
26.3
25.8
8.7
8.4
8.2
8.2
36.4
33.9
31.8
29.6
Nau
ru–
––
––
––
––
––
–P
apua
New
Gui
nea
31.2
30.7
30.2
29.7
7.9
7.7
7.6
7.5
47.3
46.1
46.0
44.8
St L
ucia
13.2
13.1
13.0
12.8
5.8
5.8
5.7
5.7
14.1
14.0
14.0
13.8
St V
ince
nt a
nd th
e G
rena
dine
s17
.517
.317
.116
.87.
47.
47.
37.
319
.319
.419
.319
.5
Sam
oa
25.7
25.1
24.6
24.2
5.5
5.4
5.4
5.4
16.9
16.5
16.2
16.0
Seyc
helle
s17
.818
.116
.816
.87.
67.
87.
47.
411
.811
.811
.811
.9So
lom
on
Isla
nds
33.0
32.5
31.9
31.3
6.1
5.9
5.8
5.6
20.2
19.7
18.9
18.4
Swaz
iland
29.9
29.7
29.4
29.1
14.8
14.6
14.4
14.3
77.6
74.0
71.4
69.0
Tong
a28
.027
.627
.226
.66.
26.
26.
16.
114
.213
.813
.513
.2Tu
valu
––
––
––
––
27.3
26.5
25.9
25.1
Van
uatu
30.2
29.9
29.5
29.2
5.0
4.9
4.8
4.8
13.1
12.6
11.8
11.4
Oth
er c
ount
ries
Alb
ania
12.9
12.8
12.8
12.7
6.0
6.1
6.1
6.2
15.1
14.1
13.4
12.8
Arm
enia
15.2
15.3
15.3
15.2
8.7
8.8
8.9
9.0
18.0
17.2
16.4
15.6
Bhu
tan
21.3
20.9
20.4
20.1
7.1
7.0
6.9
6.9
47.5
45.7
43.6
42.0
Bo
snia
and
Her
zego
vina
8.8
8.7
8.5
8.4
9.5
9.7
9.9
10.1
7.3
7.1
6.9
6.7
Cap
e V
erde
21.7
21.1
20.7
20.3
5.2
5.3
5.3
5.4
21.1
20.1
19.1
18.2
Co
ngo,
Rep
ublic
of
35.9
35.6
35.3
35.0
11.6
11.4
11.2
11.0
65.2
64.8
64.3
63.8
Co
sta
Ric
a16
.215
.915
.715
.54.
14.
24.
24.
28.
98.
88.
78.
6D
jibo
uti
29.3
29.1
28.9
28.7
10.4
10.3
10.2
10.0
75.0
74.2
73.0
71.8
Gab
on
27.4
27.2
27.1
27.1
9.3
9.1
8.9
8.8
52.5
51.5
50.4
49.3
Geo
rgia
12.1
12.0
11.9
–11
.111
.211
.3–
20.8
19.9
19.2
18.3
Jord
an26
.025
.525
.024
.54.
04.
04.
04.
019
.418
.918
.418
.0
(con
tinue
d)
166

Tabl
e 42
. S
elec
ted
dem
ogra
phic
indi
cato
rs (c
onti
nued
)
Gro
up/c
ount
ryC
rude
bir
th ra
te (p
er 1
,000
mid
-yea
r po
puat
ion)
Cru
de d
eath
rate
(per
1,0
00 m
id-y
ear
popu
lati
on)
Infa
nt m
orta
lity
rate
(per
1,0
00 li
ve b
irth
s)
2008
2009
2010
2011
2008
2009
2010
2011
2008
2009
2010
2011
Lao
PD
R23
.823
.222
.822
.36.
56.
46.
36.
239
.237
.435
.233
.8Le
bano
n15
.715
.515
.415
.26.
96.
96.
96.
99.
69.
18.
58.
0M
aced
oni
a, F
YR11
.010
.910
.810
.69.
19.
29.
39.
410
.29.
79.
28.
7M
aurit
ania
34.6
34.2
33.8
33.3
10.0
9.8
9.7
9.5
76.2
76.1
75.9
75.6
Mo
ldo
va12
.212
.312
.312
.313
.413
.413
.413
.315
.214
.414
.313
.8M
ong
olia
23.1
23.4
23.5
23.3
6.5
6.4
6.4
6.4
30.7
28.7
27.3
25.5
Mo
nten
egro
12.5
12.4
12.3
12.2
10.3
10.4
10.5
10.5
7.6
7.2
6.8
6.5
Pan
ama
20.6
20.3
19.9
19.6
5.0
5.0
5.0
5.0
17.8
17.5
17.1
16.7
Par
agua
y24
.724
.524
.224
.05.
55.
55.
55.
521
.420
.619
.919
.1S
ão T
om
é an
d P
rínci
pe32
.231
.731
.230
.78.
17.
97.
87.
658
.758
.358
.358
.2Su
rinam
e19
.018
.718
.418
.17.
37.
27.
27.
228
.127
.226
.326
.0T
imo
r-Le
ste
39.0
38.8
38.5
38.1
8.5
8.3
8.1
7.9
54.1
51.0
48.5
45.8
Hig
h-in
com
eC
omm
onw
ealth
cou
ntrie
sA
ntig
ua a
nd B
arbu
da–
––
––
––
–7.
97.
26.
76.
4B
aham
as, T
he15
.515
.515
.515
.45.
45.
45.
45.
413
.814
.014
.114
.1B
arba
dos
10.8
10.8
10.9
10.9
8.8
8.7
8.7
8.7
16.9
16.9
17.2
17.7
Bru
nei D
arus
sala
m19
.919
.519
.218
.83.
23.
23.
33.
36.
15.
95.
85.
6C
ypru
s11
.811
.711
.711
.66.
86.
86.
86.
83.
23.
02.
82.
6M
alta
10.0
10.0
9.6
10.3
7.9
7.8
7.2
7.9
5.4
5.2
5.1
5.1
St K
itts
and
Nev
is–
––
––
––
–7.
36.
86.
56.
1Tr
inid
ad a
nd T
oba
go14
.814
.814
.714
.68.
08.
08.
18.
125
.425
.024
.824
.5O
ther
cou
ntrie
sB
ahra
in20
.420
.019
.518
.92.
82.
72.
72.
79.
08.
98.
78.
6C
roat
ia9.
910
.19.
89.
411
.811
.811
.811
.65.
04.
84.
64.
4Eq
uato
rial G
uine
a37
.237
.036
.736
.415
.014
.814
.614
.483
.982
.680
.879
.6Es
toni
a12
.011
.811
.811
.012
.412
.011
.811
.44.
03.
63.
22.
8Ic
elan
d15
.215
.815
.414
.16.
36.
36.
46.
22.
01.
81.
81.
7Ire
land
17.0
16.7
16.5
16.3
6.4
6.5
6.1
6.3
3.8
3.6
3.4
3.2
Kuw
ait
18.4
18.3
18.2
17.9
3.1
3.1
3.1
3.1
9.6
9.5
9.4
9.3
Latv
ia10
.69.
68.
69.
113
.713
.313
.413
.98.
78.
27.
67.
1Li
thua
nia
10.4
11.0
10.8
11.3
13.1
12.6
12.8
13.5
6.0
5.5
5.1
4.7
Luxe
mbo
urg
11.5
11.3
11.6
10.9
7.4
7.3
7.4
7.4
2.7
2.6
2.4
2.3
No
rway
12.7
12.8
12.6
12.2
8.7
8.6
8.5
8.4
2.9
2.8
2.7
2.6
Om
an18
.818
.417
.917
.53.
73.
83.
83.
99.
38.
57.
97.
3Q
atar
14.0
13.3
12.7
12.2
1.6
1.5
1.5
1.5
7.3
7.0
6.7
6.4
Slo
veni
a10
.810
.710
.910
.79.
19.
29.
19.
12.
72.
52.
32.
1U
rugu
ay14
.614
.514
.414
.49.
49.
49.
49.
410
.29.
69.
18.
7
Not
e: –
= n
ot a
vaila
ble
Sou
rce:
Wo
rld B
ank,
Wor
ld D
evel
opm
ent I
ndic
ator
s 20
13, a
vaila
ble
at: h
ttp:
//da
taba
nk.w
orld
bank
.org
(acc
esse
d Ju
ne 2
013)
167

Tabl
e 43
. Li
fe e
xpec
tanc
y at
bir
th (y
ears
)
Gro
up/c
ount
ryTo
tal
Mal
eFe
mal
e
2008
2009
2010
2011
2008
2009
2010
2011
2008
2009
2010
2011
Mid
dle-
inco
me
Com
mon
wea
lth c
ount
ries
Bel
ize
72.8
73.0
73.3
73.5
70.0
70.2
70.4
70.6
75.8
76.0
76.3
76.6
Bo
tsw
ana
46.3
46.3
46.4
46.7
46.5
46.7
46.9
47.3
46.0
45.9
45.9
46.0
Do
min
ica
––
––
––
––
––
––
Fiji
69.0
69.2
69.4
69.6
66.2
66.3
66.5
66.7
72.0
72.2
72.4
72.6
Gre
nada
72.0
72.2
72.3
72.5
69.7
69.8
70.0
70.1
74.5
74.7
74.8
75.0
Guy
ana
65.3
65.5
65.7
65.9
62.7
63.0
63.2
63.4
68.0
68.1
68.3
68.5
Jam
aica
72.3
72.6
72.8
73.1
69.7
70.0
70.3
70.6
75.1
75.3
75.5
75.7
Kiri
bati
67.2
67.6
67.9
68.2
64.5
64.8
65.1
65.5
70.1
70.4
70.8
71.1
Leso
tho
45.7
46.6
47.5
48.2
45.5
46.4
47.2
48.0
46.0
46.9
47.7
48.5
Mal
dive
s75
.976
.376
.877
.274
.875
.375
.876
.277
.077
.477
.978
.3M
aurit
ius
72.6
72.9
73.0
73.3
69.2
69.4
69.5
69.7
76.1
76.6
76.7
77.0
Nam
ibia
60.2
61.4
62.5
63.3
57.5
58.7
59.7
60.5
63.0
64.3
65.4
66.1
Nau
ru–
––
––
––
––
––
–P
apua
New
Gui
nea
61.6
61.8
62.0
62.2
59.6
59.8
60.0
60.1
63.7
64.0
64.2
64.3
St L
ucia
74.0
74.2
74.4
74.6
71.5
71.7
71.8
72.0
76.6
76.9
77.1
77.3
St V
ince
nt a
nd th
e G
rena
dine
s71
.972
.072
.272
.369
.870
.070
.170
.274
.074
.274
.374
.5
Sam
oa
71.8
72.1
72.4
72.7
68.8
69.1
69.3
69.6
75.1
75.3
75.6
75.9
Seyc
helle
s73
.273
.073
.573
.567
.768
.469
.769
.778
.977
.977
.477
.4So
lom
on
Isla
nds
66.6
66.8
67.1
67.3
65.2
65.5
65.8
66.0
68.0
68.2
68.4
68.7
Swaz
iland
47.3
47.9
48.3
48.7
47.6
48.2
48.8
49.1
47.0
47.5
47.9
48.2
Tong
a71
.972
.072
.272
.369
.169
.269
.369
.574
.875
.075
.275
.3Tu
valu
––
––
––
––
––
––
Van
uatu
70.2
70.5
70.8
71.1
68.4
68.6
68.9
69.2
72.2
72.5
72.9
73.2
Oth
er c
ount
ries
Alb
ania
76.6
76.8
77.0
77.2
73.6
73.8
74.0
74.2
79.9
80.0
80.1
80.3
Arm
enia
73.9
74.1
74.2
74.3
70.7
70.8
70.9
71.1
77.4
77.5
77.7
77.8
Bhu
tan
66.0
66.5
67.0
67.5
65.7
66.2
66.7
67.2
66.2
66.8
67.3
67.8
Bo
snia
and
H
erze
govi
na75
.575
.775
.876
.073
.073
.173
.373
.578
.278
.378
.478
.6
Cap
e V
erde
73.1
73.5
73.9
74.2
69.3
69.7
70.0
70.4
77.2
77.5
77.9
78.2
Co
ngo,
Rep
ublic
of
55.9
56.6
57.2
57.8
54.7
55.3
55.9
56.4
57.2
57.9
58.6
59.2
Co
sta
Ric
a78
.979
.179
.379
.576
.676
.877
.077
.381
.381
.581
.781
.8D
jibo
uti
59.3
59.8
60.3
60.8
57.8
58.3
58.8
59.3
60.8
61.3
61.9
62.4
Gab
on
61.4
61.9
62.3
62.7
60.4
60.8
61.3
61.7
62.4
62.9
63.4
63.8
Geo
rgia
73.4
73.5
73.7
73.8
69.8
70.0
70.1
70.3
77.1
77.3
77.4
77.5
(con
tinue
d)
168

Tabl
e 43
. Li
fe e
xpec
tanc
y at
bir
th (y
ears
) (co
ntin
ued)
Gro
up/c
ount
ryTo
tal
Mal
eFe
mal
e
2008
2009
2010
2011
2008
2009
2010
2011
2008
2009
2010
2011
Leba
non
78.5
78.9
79.3
79.6
76.4
76.8
77.1
77.5
80.8
81.2
81.5
81.8
Mac
edo
nia,
FYR
74.4
74.6
74.7
74.9
72.2
72.4
72.5
72.7
76.8
76.9
77.0
77.2
Mau
ritan
ia60
.760
.961
.061
.259
.259
.459
.659
.762
.262
.462
.662
.7M
old
ova
68.2
68.3
68.5
68.6
64.5
64.6
64.7
64.8
72.2
72.3
72.4
72.6
Mo
ngo
lia66
.466
.666
.967
.162
.562
.863
.063
.270
.470
.771
.071
.2M
ont
eneg
ro74
.174
.374
.474
.571
.972
.072
.272
.376
.576
.676
.876
.9P
anam
a76
.676
.776
.977
.273
.773
.974
.174
.379
.679
.880
.080
.1Sã
o To
mé
and
Prín
cipe
65.5
65.7
65.9
66.0
63.6
63.8
64.0
64.1
67.4
67.6
67.8
68.0
Surin
ame
69.8
70.1
70.3
70.6
66.5
66.8
67.1
67.4
73.2
73.4
73.7
73.9
Tim
or-
Lest
e64
.865
.465
.966
.563
.363
.964
.565
.066
.466
.967
.568
.1H
igh-
inco
me
Com
mon
wea
lth c
ount
ries
Ant
igua
and
Bar
buda
75.0
75.2
75.3
75.5
72.6
72.8
73.0
73.2
77.4
77.6
77.8
78.0
Bah
amas
, The
74.2
74.4
74.6
74.8
71.3
71.5
71.6
71.8
77.4
77.5
77.7
77.9
Bar
bado
s74
.574
.674
.875
.072
.272
.372
.572
.676
.977
.177
.277
.4B
rune
i Dar
ussa
lam
77.6
77.8
78.0
78.2
75.7
75.9
76.1
76.3
79.6
79.8
80.0
80.1
Cyp
rus
79.0
79.2
79.3
79.5
76.9
77.1
77.3
77.5
81.2
81.3
81.4
81.6
Mal
ta79
.479
.980
.982
.076
.777
.678
.980
.282
.382
.383
.183
.9St
Kitt
s an
d N
evis
––
––
––
––
––
––
Trin
idad
and
To
bago
69.4
69.5
69.6
69.7
65.9
66.0
66.1
66.2
73.0
73.1
73.3
73.4
Oth
er c
ount
ries
Bah
rain
76.0
76.1
76.3
76.4
75.2
75.4
75.5
75.6
76.7
76.9
77.0
77.2
Cro
atia
75.9
76.2
76.5
76.9
72.4
72.9
73.5
73.9
79.6
79.6
79.6
80.0
Equa
toria
l Gui
nea
50.4
51.0
51.5
52.1
49.1
49.6
50.2
50.7
51.8
52.4
53.0
53.6
Esto
nia
73.8
74.8
75.4
76.1
68.6
69.8
70.6
71.2
79.2
80.1
80.5
81.3
Icel
and
81.6
81.8
81.9
82.4
80.0
79.8
79.8
80.7
83.3
83.8
84.1
84.1
Irela
nd79
.179
.980
.980
.576
.877
.478
.778
.381
.682
.583
.282
.8K
uwai
t74
.074
.174
.274
.373
.173
.273
.273
.374
.975
.075
.175
.3La
tvia
72.4
73.1
73.5
73.6
67.2
68.3
68.8
68.6
77.9
78.1
78.4
78.8
Lith
uani
a71
.872
.973
.373
.666
.367
.568
.068
.177
.678
.678
.879
.3Lu
xem
bour
g80
.580
.680
.681
.078
.178
.177
.978
.583
.183
.383
.583
.6N
orw
ay80
.680
.881
.081
.378
.378
.678
.979
.183
.083
.183
.283
.6Q
atar
77.8
78.0
78.1
78.3
77.0
77.1
77.3
77.4
78.8
78.9
79.0
79.2
Slo
veni
a78
.879
.079
.480
.075
.475
.876
.376
.882
.382
.382
.783
.3U
rugu
ay76
.376
.576
.676
.872
.873
.073
.273
.479
.980
.180
.280
.3
Not
e: –
= n
ot a
vaila
ble
Sou
rce:
Wo
rld B
ank,
Wor
ld D
evel
opm
ent I
ndic
ator
s 20
13, a
vaila
ble
at: h
ttp:
//da
taba
nk.w
orld
bank
.org
(acc
esse
d Ju
ne 2
013)
169

Tabl
e 44
. A
dult
lite
racy
rate
s (%
)
Gro
up/c
ount
ry20
0920
10
Adu
lts
(15
and
olde
r)Yo
uth
(15–
24 y
ears
old
)A
dult
s (1
5 an
d ol
der)
Yout
h (1
5–24
yea
rs o
ld )
Tota
lM
ale
Fem
ale
Tota
lM
ale
Fem
ale
Tota
lM
ale
Fem
ale
Tota
lM
ale
Fem
ale
Mid
dle-
inco
me
Com
mon
wea
lth c
ount
ries
Bel
ize
––
––
––
––
––
––
Bo
tsw
ana
84.1
83.8
84.5
95.3
––
84.5
84.0
84.9
95.3
93.6
96.9
Do
min
ica
––
––
––
––
––
––
Fiji
––
––
––
––
––
––
Gre
nada
––
––
––
––
––
––
Guy
ana
85.0
82.4
87.3
93.1
92.4
93.7
––
––
––
Jam
aica
86.4
81.2
91.2
95.2
––
86.6
81.6
91.4
95.4
92.5
98.4
Kiri
bati
––
––
––
––
––
––
Leso
tho
75.8
65.5
85.0
83.2
74.2
92.1
89.6
83.3
95.6
91.9
85.8
98.1
Mal
dive
s–
––
––
––
––
––
–M
aurit
ius
87.9
90.6
85.3
96.5
––
88.5
90.9
86.2
96.7
95.7
97.7
Nam
ibia
88.5
88.9
88.1
93.0
––
88.8
89.0
88.5
93.1
91.1
95.1
Nau
ru–
––
––
––
––
––
–P
apua
New
Gui
nea
60.1
63.6
56.5
67.5
––
60.6
63.9
57.3
68.4
65.1
71.9
St L
ucia
––
––
––
––
––
––
St V
ince
nt a
nd th
e G
rena
dine
s–
––
––
––
––
––
–
Sam
oa
98.8
99.0
98.5
99.5
––
98.8
99.0
98.6
99.5
99.4
99.6
Seyc
helle
s91
.891
.492
.399
.1–
–91
.891
.492
.399
.198
.899
.4So
lom
on
Isla
nds
––
––
––
––
––
––
Swaz
iland
––
––
––
87.4
88.1
86.8
93.6
92.1
95.1
Tong
a–
––
––
––
––
––
–Tu
valu
––
––
––
––
––
––
Van
uatu
––
––
––
82.6
84.3
80.8
94.3
94.1
94.4
Oth
er c
ount
ries
Alb
ania
––
––
––
––
––
––
Arm
enia
99.5
99.7
99.4
99.8
––
99.6
99.7
99.4
99.8
99.7
99.8
Bhu
tan
––
––
––
––
––
––
Bo
snia
and
Her
zego
vina
97.8
99.4
96.4
99.7
––
97.9
99.4
96.5
99.7
99.7
99.7
Cap
e V
erde
84.8
90.1
80.2
98.2
––
84.3
89.3
79.4
98.3
97.5
99.1
Co
ngo,
Rep
ublic
of
––
––
––
––
––
––
Co
sta
Ric
a–
––
––
–96
.295
.996
.498
.297
.898
.7D
jibo
uti
––
––
––
––
––
––
Gab
on
87.7
91.4
84.1
97.6
––
88.4
91.9
84.9
97.7
98.7
96.8
Geo
rgia
99.7
99.8
99.7
99.8
––
99.7
99.8
99.7
99.8
99.8
99.9
(con
tinue
d)
170

Tabl
e 44
. A
dult
lite
racy
rate
s (%
) (co
ntin
ued)
Gro
up/c
ount
ry20
0920
10
Adu
lts
(15
and
olde
r)Yo
uth
(15–
24 y
ears
old
)A
dult
s (1
5 an
d ol
der)
Yout
h (1
5–24
yea
rs o
ld )
Tota
lM
ale
Fem
ale
Tota
lM
ale
Fem
ale
Tota
lM
ale
Fem
ale
Tota
lM
ale
Fem
ale
Leba
non
––
––
––
––
––
––
Mac
edo
nia,
FYR
97.1
98.7
95.6
98.7
––
97.3
98.7
95.9
98.7
98.8
98.5
Mau
ritan
ia57
.564
.550
.367
.7–
–58
.064
.951
.268
.371
.365
.3M
old
ova
98.5
99.0
98.0
99.5
––
98.5
99.1
98.1
99.5
99.3
99.6
Mo
ngo
lia–
––
––
–97
.496
.997
.995
.894
.497
.4M
ont
eneg
ro98
.499
.497
.499
.399
.499
.398
.499
.497
.499
.399
.499
.3P
anam
a93
.694
.293
.096
.4–
–94
.194
.793
.597
.697
.997
.3S
ão T
om
é an
d P
rínci
pe88
.893
.784
.095
.3–
–89
.293
.984
.795
.394
.795
.9Su
rinam
e–
––
––
–94
.795
.494
.098
.498
.098
.8T
imo
r-Le
ste
––
––
––
58.3
63.6
53.0
79.5
80.5
78.6
Hig
h-in
com
eC
omm
onw
ealth
cou
ntrie
sA
ntig
ua a
nd B
arbu
da99
.098
.499
.4–
––
99.0
98.4
99.4
––
–B
aham
as, T
he–
––
––
––
––
––
–B
arba
dos
––
––
––
––
––
––
Bru
nei D
arus
sala
m95
.396
.893
.799
.7–
–95
.296
.893
.699
.799
.899
.7C
ypru
s97
.399
.196
.999
.0–
–98
.399
.297
.399
.999
.999
.9M
alta
––
––
––
––
––
––
St K
itts
and
Nev
is–
––
––
––
––
––
–Tr
inid
ad a
nd T
oba
go98
.799
.298
.399
.5–
–98
.899
.298
.499
.699
.599
.6O
ther
cou
ntrie
sC
roat
ia–
––
––
–91
.999
.598
.210
0.0
100.
010
0.0
Equa
toria
l Gui
nea
––
––
––
98.8
97.1
90.6
99.6
99.6
99.7
Esto
nia
––
––
––
99.8
99.8
99.8
98.0
97.7
98.3
Icel
and
––
––
––
99.8
––
99.8
99.7
99.8
Irela
nd–
––
––
––
––
––
–La
tvia
99.8
99.8
99.8
99.7
––
99.8
99.8
99.8
99.7
99.7
99.7
Lith
uani
a99
.799
.799
.799
.8–
–99
.799
.799
.799
.899
.899
.8Lu
xem
bour
g–
––
––
––
––
––
–N
orw
ay–
––
––
––
––
––
–O
man
––
––
––
––
––
––
Qat
ar–
96.5
95.4
––
––
96.5
95.4
––
–S
love
nia
99.7
99.7
99.7
99.8
––
99.7
99.7
99.7
99.8
99.8
99.9
Uru
guay
98.3
97.6
98.6
99.0
––
98.1
97.6
98.5
98.8
98.4
99.2
Not
e: –
= n
ot a
vaila
ble
Sou
rce:
Wo
rld B
ank,
Wor
ld D
evel
opm
ent I
ndic
ator
s 20
13, a
vaila
ble
at: h
ttp:
//da
taba
nk.w
orld
bank
.org
(acc
esse
d Ju
ne 2
013)
171

Tabl
e 45
. Pr
imar
y ed
ucat
ion
leve
l enr
olm
ent
rati
o (%
)
Gro
up/c
ount
ry20
0920
1020
11
Tota
lM
ale
Fem
ale
Tota
lM
ale
Fem
ale
Tota
lM
ale
Fem
ale
Mid
dle-
inco
me
Com
mon
wea
lth c
ount
ries
Bel
ize
120
127
114
121
127
116
121
126
116
Bo
tsw
ana
110
112
108
––
––
––
Do
min
ica
107
109
106
112
113
111
119
119
118
Fiji
105
106
104
––
–10
510
510
5G
rena
da10
510
810
210
310
510
2–
––
Guy
ana
8584
8685
8386
8785
89Ja
mai
ca89
9187
8991
87–
––
Leso
tho
103
103
102
103
104
102
103
105
101
Mal
dive
s11
011
110
810
610
810
410
410
510
3M
aurit
ius
––
––
––
––
–N
amib
ia10
710
810
710
710
810
6–
––
Nau
ru–
––
––
––
––
Pap
ua N
ew G
uine
a–
––
––
––
––
St L
ucia
9697
9494
9692
9394
92St
Vin
cent
and
the
Gre
nadi
nes
––
––
––
––
–
Sam
oa
103.
010
3.2
102.
710
7.5
106.
510
8.6
104.
610
2.8
106.
5So
lom
on
Isla
nds
––
–14
514
614
4–
––
Swaz
iland
111
115
106
116
121
111
115
121
109
Tong
a–
––
––
––
––
Tuva
lu–
––
––
––
––
Van
uatu
110
113
107
117
120
114
––
–O
ther
cou
ntrie
sA
lban
ia–
––
––
––
––
Arm
enia
––
––
––
––
–B
huta
n11
010
911
111
111
011
211
111
111
2B
osn
ia a
nd H
erze
govi
na10
510
410
688
8788
9090
91C
ape
Ver
de11
011
510
611
011
410
510
911
410
5C
ost
a R
ica
112
112
111
110
110
109
107
108
107
Djib
out
i55
5851
––
–59
6256
Geo
rgia
111
110
112
109
107
111
106
105
108
Leba
non
102
103
101
105
106
103
108
109
106
Mac
edo
nia,
FYR
8989
9090
8991
––
–M
aurit
ania
100
9810
310
299
105
101
9810
4M
old
ova
9494
9394
9493
9494
93M
ong
olia
110
111
109
122
123
121
120
121
118
(con
tinue
d)
172

Tabl
e 45
. Pr
imar
y ed
ucat
ion
leve
l enr
olm
ent
rati
o (%
) (co
ntin
ued)
Gro
up/c
ount
ry20
0920
1020
11
Tota
lM
ale
Fem
ale
Tota
lM
ale
Fem
ale
Tota
lM
ale
Fem
ale
Mo
nten
egro
112
113
111
107
107
106
9595
95P
anam
a10
911
010
710
810
910
610
710
910
6S
ão T
om
é an
d P
rínci
pe–
––
––
––
––
Surin
ame
113
116
111
––
–11
511
811
2T
imo
r-Le
ste
109
112
106
117
119
115
124
126
122
Hig
h-in
com
eC
omm
onw
ealth
cou
ntrie
sA
ntig
ua a
nd B
arbu
da10
110
398
102
106
9799
102
95B
aham
as, T
he11
311
111
411
411
311
5–
––
Bar
bado
s11
411
211
612
011
912
212
612
612
5B
rune
i Dar
ussa
lam
111
111
111
108
107
109
105
104
106
Cyp
rus
105
106
105
102
102
102
––
–M
alta
––
––
––
––
–St
Kitt
s an
d N
evis
9493
9593
9394
9089
91Tr
inid
ad a
nd T
oba
go10
410
610
210
510
710
3–
––
Oth
er c
ount
ries
Bah
rain
––
––
––
––
–Eq
uato
rial G
uine
a85
8784
8788
8587
8886
Esto
nia
9910
098
9999
98–
––
Icel
and
9999
100
9999
99–
––
Irela
nd10
810
710
810
810
810
810
710
810
7K
uwai
t–
––
––
––
––
Latv
ia10
010
198
101
101
100
100
100
100
Lith
uani
a97
9896
9696
9594
9593
Luxe
mbo
urg
––
–97
9698
––
–N
orw
ay99
9999
9999
99–
––
Om
an10
510
710
4–
––
104
105
103
Qat
ar10
610
710
610
310
310
310
510
610
4S
love
nia
9898
9798
9998
9999
99U
rugu
ay11
311
511
111
211
411
0–
––
Not
e: –
= n
ot a
vaila
ble
Sou
rces
: Wo
rld B
ank,
Wor
ld D
evel
opm
ent I
ndic
ator
s 20
13, a
vaila
ble
at: h
ttp:
//da
taba
nk.w
orld
bank
.org
; Uni
ted
Nat
ions
, Mille
nium
Dev
elop
men
t Goa
l Ind
icat
ors,
ava
ilabl
e at
: htt
p://
mdg
sun.
org
/un
sd/m
dg/S
erie
sDet
ail.a
spx?
srid
=591
(acc
esse
d Ju
ne 2
013)
173

Tabl
e 46
. S
econ
dary
edu
cati
on e
nrol
men
t le
vel r
atio
(% g
ross
)
Gro
up/c
ount
ry20
0820
0920
1020
11
Tota
lM
ale
Fem
ale
Tota
lM
ale
Fem
ale
Tota
lM
ale
Fem
ale
Tota
lM
ale
Fem
ale
Mid
dle-
inco
me
––
––
––
––
––
––
Com
mon
wea
lth c
ount
ries
––
––
––
––
––
––
Bel
ize
––
––
––
––
––
––
Bo
tsw
ana
––
––
––
––
––
––
Do
min
ica
102
100
104
102
9610
898
9410
398
9510
2Fi
ji88
8591
8683
91–
––
9087
94G
rena
da11
011
510
510
110
110
110
810
610
9–
––
Guy
ana
9289
9692
8995
9187
9693
8998
Jam
aica
9693
9896
9596
9391
94–
––
Leso
tho
4135
4744
3751
4639
5449
4157
Mal
dive
s–
––
––
––
––
––
–M
aurit
ius
––
––
––
––
––
––
Nam
ibia
––
––
––
––
––
––
Nau
ru–
––
––
––
––
––
–P
apua
New
Gui
nea
––
––
––
––
––
––
St L
ucia
9391
9596
9497
9697
9695
9794
St V
ince
nt a
nd th
e G
rena
dine
s10
810
211
410
910
711
210
710
610
9–
––
Sam
oa
––
–84
7890
8579
9182
7788
Seyc
helle
s11
110
411
911
510
812
211
911
412
512
411
713
1So
lom
on
Isla
nds
––
––
––
4851
45–
––
Swaz
iland
––
–54
5454
5858
5860
6159
Tong
a–
––
––
––
––
––
–Tu
valu
––
––
––
––
––
––
Van
uatu
––
––
––
5554
55–
––
Oth
er c
ount
ries
Alb
ania
––
––
––
––
––
––
Bhu
tan
5557
5461
6161
6665
6670
6971
Bo
snia
and
Her
zego
vina
9291
9393
9294
9088
9189
8891
Cap
e V
erde
8782
9185
7893
8880
9590
8397
Co
sta
Ric
a91
8893
9794
100
100
9710
310
199
104
Djib
out
i29
3424
3136
27–
––
3640
32G
eorg
ia89
9187
86–
––
––
––
–Le
bano
n83
7887
8479
8881
7786
8379
88M
aced
oni
a, F
YR83
8582
8384
8284
8483
––
–M
aurit
ania
2224
2124
2622
2426
2227
2925
Mo
ldo
va88
8790
8988
9088
8789
8887
89M
ong
olia
––
–96
9299
8986
9293
9095
(con
tinue
d)
174

Tabl
e 46
. S
econ
dary
edu
cati
on e
nrol
men
t le
vel r
atio
(% g
ross
) (co
ntin
ued)
Gro
up/c
ount
ry20
0820
0920
1020
11
Tota
lM
ale
Fem
ale
Tota
lM
ale
Fem
ale
Tota
lM
ale
Fem
ale
Tota
lM
ale
Fem
ale
Mo
nten
egro
9690
103
100
100
101
104
103
105
9797
97P
anam
a71
6974
7370
7674
7277
7471
77Su
rinam
e76
6786
7567
83–
––
8574
97T
imo
r-Le
ste
5050
5058
5858
5656
5658
5759
Hig
h-in
com
eC
omm
onw
ealth
cou
ntrie
sA
ntig
ua a
nd B
arbu
da11
111
310
810
810
810
810
510
510
610
510
610
4B
aham
as, T
he94
9395
9493
9596
9398
––
–B
arba
dos
102
9710
810
196
106
101
9610
510
498
110
Bru
nei D
arus
sala
m10
410
210
510
710
610
911
010
811
211
211
111
3C
ypru
s98
9899
9898
9991
9192
––
–M
alta
9697
9410
511
198
101
107
95–
––
St K
itts
and
Nev
is10
299
105
9995
102
9898
9794
9396
Trin
idad
and
To
bago
9087
93–
––
––
––
––
Oth
er c
ount
ries
Bah
rain
––
––
––
––
––
––
Equa
toria
l Gui
nea
––
––
––
––
––
––
Esto
nia
102
101
104
104
103
105
107
107
107
––
–Ic
elan
d10
910
711
110
710
610
910
810
710
9–
––
Irela
nd11
411
011
811
711
412
112
111
812
411
911
712
1K
uwai
t10
198
104
––
––
––
––
–La
tvia
100
9910
194
9494
9596
9496
9894
Lith
uani
a98
9898
9898
9899
100
9899
100
97Lu
xem
bour
g98
9699
––
–10
110
010
3–
––
No
rway
112
113
111
110
111
109
111
112
110
––
–O
man
9696
9610
010
110
0–
––
104
105
103
Qat
ar86
7699
8777
100
9486
104
102
9810
6S
love
nia
9797
9797
9797
9798
9797
9897
Uru
guay
8882
9490
8596
9085
96–
––
Not
e: –
= n
ot a
vaila
ble
Sou
rce:
Wo
rld B
ank,
Wor
ld D
evel
opm
ent I
ndic
ator
s 20
13, a
vaila
ble
at: h
ttp:
//da
taba
nk.w
orld
bank
.org
(acc
esse
d Ju
ly 2
013)
175

Tabl
e 47
. Te
rtia
ry e
duca
tion
leve
l enr
olm
ent
rati
o (%
)
Gro
up/c
ount
ry20
0820
0920
1020
11
Tota
lM
ale
Fem
ale
Tota
lM
ale
Fem
ale
Tota
lM
ale
Fem
ale
Tota
lM
ale
Fem
ale
Mid
dle-
inco
me
Com
mon
wea
lth c
ount
ries
Bel
ize
1914
2322
1627
2117
2621
1626
Bo
tsw
ana
––
––
––
––
––
––
Fiji
––
––
––
––
–62
––
Gre
nada
––
–53
4561
––
––
––
Guy
ana
11 9
1311
715
12 7
1712
717
Jam
aica
2516
3525
1535
26–
––
––
Leso
tho
––
––
––
––
––
––
Mal
dive
s13
1214
––
––
––
––
–M
aurit
ius
2522
2829
2632
3128
3432
2837
Nam
ibia
9 8
10–
––
––
––
––
Nau
ru–
––
––
––
––
––
–P
apua
New
Gui
nea
––
––
––
––
––
––
St L
ucia
15 9
2016
923
11 6
1615
1119
St V
ince
nt a
nd th
e G
rena
dine
s–
––
––
––
––
––
–
Sam
oa
––
––
––
––
––
––
Seyc
helle
s–
––
––
––
––
3 1
4So
lom
on
Isla
nds
––
––
––
––
––
––
Swaz
iland
––
––
––
––
– 6
6 6
Tong
a–
––
––
––
––
––
–Tu
valu
––
––
––
––
––
––
Van
uatu
––
––
––
––
––
––
Oth
er c
ount
ries
Alb
ania
2925
3330
2534
3934
4544
3850
Arm
enia
4841
5450
4456
5245
5849
4355
Bhu
tan
7 8
5–
––
7 9
5 9
10 7
Bo
snia
and
Her
zego
vina
3531
3936
3141
3631
4138
3343
Cap
e V
erde
1210
1415
1317
1816
2020
1724
Co
sta
Ric
a–
––
––
––
––
4338
49D
jibo
uti
3 3
2 3
4 3
3 4
3 5
6 4
Geo
rgia
3431
3725
2328
2825
3130
2733
Leba
non
5247
5853
4958
5449
5958
5462
Mac
edo
nia,
FYR
4037
4440
3744
3936
42–
––
Mau
ritan
ia 4
5 2
4 5
2 4
6 3
5 7
3M
old
ova
4033
4738
3245
3833
4439
3445
Mo
ngo
lia48
3759
5140
6253
4265
5746
69
(con
tinue
d)
176

Tabl
e 47
. Te
rtia
ry e
duca
tion
leve
l enr
olm
ent
rati
o (%
) (co
ntin
ued)
Gro
up/c
ount
ry20
0820
0920
1020
11
Tota
lM
ale
Fem
ale
Tota
lM
ale
Fem
ale
Tota
lM
ale
Fem
ale
Tota
lM
ale
Fem
ale
Mo
nten
egro
3834
4245
3951
4843
53–
––
Pan
ama
4535
5445
3554
4636
56–
––
Surin
ame
––
––
––
––
––
––
Tim
or-
Lest
e–
––
1719
14–
––
––
–H
igh-
inco
me
Com
mon
wea
lth c
ount
ries
Bah
amas
, The
––
––
––
––
––
––
Bar
bado
s–
––
7243
103
6640
9562
3690
Bru
nei D
arus
sala
m18
1223
1914
2417
1222
2015
25C
ypru
s43
4442
5256
4848
5146
––
–M
alta
3025
3633
2839
3530
41–
––
St K
itts
and
Nev
is18
1225
––
––
––
––
–Tr
inid
ad a
nd T
oba
go–
––
––
––
––
––
–O
ther
cou
ntrie
sB
ahra
in–
––
––
––
––
––
–C
roat
ia49
4455
4943
5554
4662
––
–Es
toni
a63
4779
6347
7964
4980
––
–Ic
elan
d74
5197
7452
9779
5710
1–
––
Irela
nd58
5264
6155
6766
6271
6864
72K
uwai
t–
––
––
––
––
––
–La
tvia
6847
8966
4786
6044
7757
4471
Lith
uani
a76
6093
7762
9374
5990
6956
83Lu
xem
bour
g11
1110
––
–18
1719
––
–N
orw
ay73
5691
7456
9274
5793
––
–O
man
20–
–24
2128
2421
2929
2534
Qat
ar11
627
105
2610
526
125
31S
love
nia
8670
103
8771
103
9074
106
8666
107
Uru
guay
6547
8363
4681
6347
80–
––
Not
e: –
= n
ot a
vaila
ble
Sou
rce:
The
Wo
rld B
ank,
Wor
ld D
evel
opm
ent I
ndic
ator
s 20
13, d
ata
vaila
ble
at h
ttp:
//da
taba
nk.w
orld
bank
.org
/ (ac
cess
ed J
uly
2013
)
177

Tabl
e 48
. Pr
imar
y ed
ucat
ion
gend
er ra
tio
Gro
up/c
ount
ryR
atio
of g
irls
to b
oys
in p
rim
ary
and
seco
ndar
y ed
ucat
ion
(%)
Prim
ary
com
plet
ion
rate
(% o
f rel
evan
t ag
e gr
oup)
Fem
ale
Mal
eTo
tal
2009
2010
2011
2009
2010
2011
2009
2010
2011
2009
2010
2011
Mid
dle-
inco
me
Com
mon
wea
lth c
ount
ries
Bel
ize
––
–99
9810
710
711
311
410
310
511
0B
ots
wan
a–
––
98–
–97
––
97–
–D
om
inic
a–
––
––
––
––
––
–Fi
ji10
410
410
5–
103
105
–10
410
5–
103
Gre
nada
––
––
––
––
––
––
Guy
ana
105
107
107
9485
8791
8284
9283
85Ja
mai
ca98
99–
7473
–75
74–
7573
–K
iriba
ti–
––
––
––
––
––
–Le
soth
o10
810
610
678
7976
5860
6068
7068
Mal
dive
s–
––
114
105
103
126
122
111
120
114
107
Mau
ritiu
s–
––
––
––
––
––
–N
amib
ia–
––
8885
–80
77–
8481
–N
auru
––
––
––
––
––
––
Pap
ua N
ew G
uine
a–
––
––
––
––
––
–St
Luc
ia–
––
––
––
––
––
–St
Vin
cent
and
the
Gre
nadi
nes
––
––
––
––
––
––
Sam
oa
107
108
109
9810
310
310
310
095
101
101
98Se
yche
lles
–96
––
––
––
––
––
Solo
mo
n Is
land
s94
9492
7278
7872
7676
7277
77Sw
azila
nd–
––
––
––
––
––
–To
nga
––
––
––
––
––
––
Tuva
lu–
97–
8483
–85
84–
8583
–V
anua
tuO
ther
cou
ntrie
sA
lban
ia–
––
––
––
––
––
–A
rmen
ia10
210
2–
–85
82–
–83
Bhu
tan
101
102
102
9110
198
8389
9287
9595
Bo
snia
and
Her
zego
vina
102
102
102
–71
76–
6975
–70
76C
ape
Ver
de10
410
410
395
9896
9510
094
9599
95C
ost
a R
ica
102
102
102
9797
101
9595
9796
9699
Djib
out
i82
–85
34–
4537
4736
46G
eorg
ia–
––
108
116
112
116
–11
011
6–
Leba
non
104
104
103
8789
8983
8585
8587
87
(con
tinue
d)
178

Tabl
e 48
. Pr
imar
y ed
ucat
ion
gend
er ra
tio
(con
tinu
ed)
Gro
up/c
ount
ryR
atio
of g
irls
to b
oys
in p
rim
ary
and
seco
ndar
y ed
ucat
ion
(%)
Prim
ary
com
plet
ion
rate
(% o
f rel
evan
t ag
e gr
oup)
Fem
ale
Mal
eTo
tal
2009
2010
2011
2009
2010
2011
2009
2010
2011
2009
2010
2011
Mac
edo
nia,
FYR
9910
0–
93–
–92
––
92–
–M
aurit
ania
101
101
101
72–
–68
––
70–
–M
old
ova
101
101
101
9193
9094
9192
9392
91M
ong
olia
103
103
102
–10
911
6–
109
115
–10
911
5M
ont
eneg
ro10
010
010
0–
116
––
114
–11
5P
anam
a10
110
110
210
197
101
101
9710
110
197
101
Surin
ame
105
–11
091
–93
81–
8286
88T
imo
r-Le
ste
9698
9868
6774
6864
7168
6572
Hig
h-in
com
eC
omm
onw
ealth
cou
ntrie
sB
aham
as, T
he10
210
4–
104
99–
100
95–
102
97–
Bar
bado
s10
710
610
510
310
711
492
9610
897
101
111
Bru
nei D
arus
sala
m10
210
210
111
611
812
011
411
812
011
511
812
0C
ypru
s10
010
1–
103
101
–10
398
–10
399
–M
alta
9394
–91
97–
9396
–92
97–
St K
itts
and
Nev
is–
––
––
––
––
––
–Tr
inid
ad a
nd T
oba
go–
––
9291
–92
91–
9291
–O
ther
cou
ntrie
sB
ahra
in–
––
––
––
––
––
–C
roat
ia10
210
5–
9593
–95
93–
9593
–Es
toni
a10
199
–98
95–
9798
–98
96–
Icel
and
102
101
–99
97–
100
99–
9998
–Ire
land
103
102
101
–10
4–
–10
2–
–10
3–
Kuw
ait
––
––
––
––
––
––
Latv
ia99
9898
8690
9292
9493
8992
93Li
thua
nia
9998
9894
100
9497
9997
9699
95Lu
xem
bour
g–
102
––
84–
–83
––
83–
No
rway
9999
–10
099
–10
199
–10
099
–O
man
98–
9810
0–
108
102
–10
610
1–
107
Qat
ar11
310
910
310
0–
9699
–96
100
–96
Slo
veni
a99
9999
9596
–95
97–
9596
–U
rugu
ay10
410
4–
106
104
–10
510
5–
106
104
–
Not
e: –
= n
ot a
vaila
ble
Sou
rce:
Wo
rld B
ank,
Wor
ld D
evel
opm
ent I
ndic
ator
s 20
13, a
vaila
ble
at: h
ttp:
//da
taba
nk.w
orld
bank
.org
(acc
esse
d Ju
ne 2
013)
179
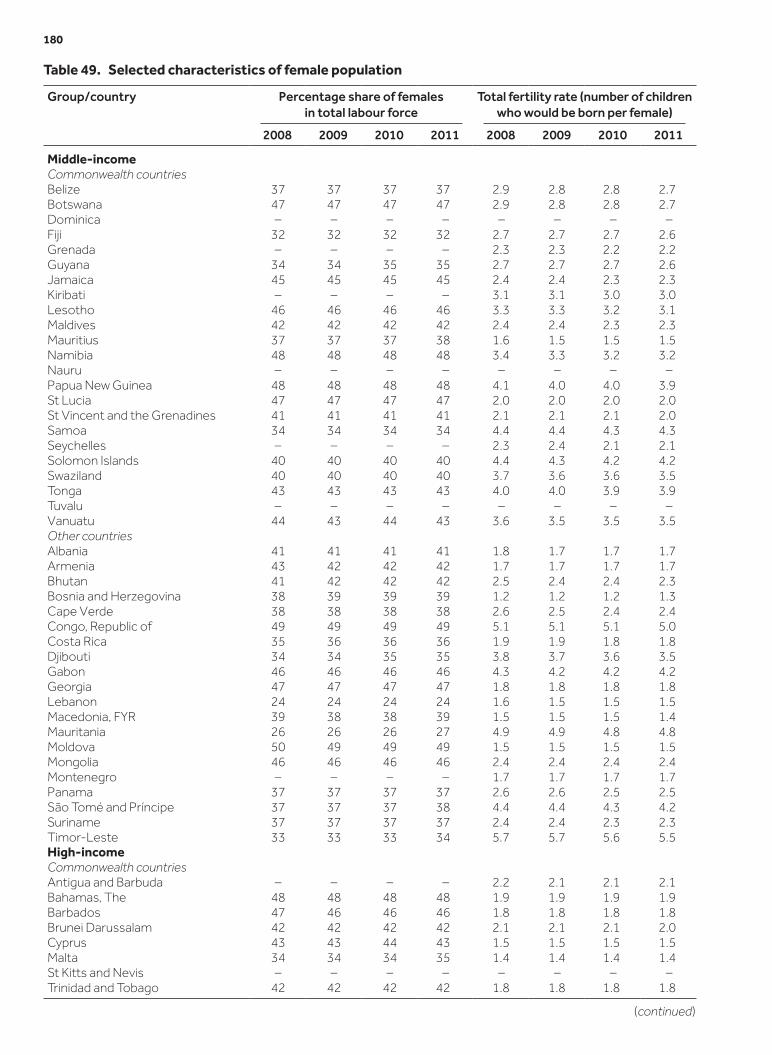
Table 49. Selected characteristics of female population
Group/country Percentage share of females in total labour force
Total fertility rate (number of children who would be born per female)
2008 2009 2010 2011 2008 2009 2010 2011
Middle-incomeCommonwealth countriesBelize 37 37 37 37 2.9 2.8 2.8 2.7Botswana 47 47 47 47 2.9 2.8 2.8 2.7Dominica – – – – – – – –Fiji 32 32 32 32 2.7 2.7 2.7 2.6Grenada – – – – 2.3 2.3 2.2 2.2Guyana 34 34 35 35 2.7 2.7 2.7 2.6Jamaica 45 45 45 45 2.4 2.4 2.3 2.3Kiribati – – – – 3.1 3.1 3.0 3.0Lesotho 46 46 46 46 3.3 3.3 3.2 3.1Maldives 42 42 42 42 2.4 2.4 2.3 2.3Mauritius 37 37 37 38 1.6 1.5 1.5 1.5Namibia 48 48 48 48 3.4 3.3 3.2 3.2Nauru – – – – – – – –Papua New Guinea 48 48 48 48 4.1 4.0 4.0 3.9St Lucia 47 47 47 47 2.0 2.0 2.0 2.0St Vincent and the Grenadines 41 41 41 41 2.1 2.1 2.1 2.0Samoa 34 34 34 34 4.4 4.4 4.3 4.3Seychelles – – – – 2.3 2.4 2.1 2.1Solomon Islands 40 40 40 40 4.4 4.3 4.2 4.2Swaziland 40 40 40 40 3.7 3.6 3.6 3.5Tonga 43 43 43 43 4.0 4.0 3.9 3.9Tuvalu – – – – – – – –Vanuatu 44 43 44 43 3.6 3.5 3.5 3.5Other countriesAlbania 41 41 41 41 1.8 1.7 1.7 1.7Armenia 43 42 42 42 1.7 1.7 1.7 1.7Bhutan 41 42 42 42 2.5 2.4 2.4 2.3Bosnia and Herzegovina 38 39 39 39 1.2 1.2 1.2 1.3Cape Verde 38 38 38 38 2.6 2.5 2.4 2.4Congo, Republic of 49 49 49 49 5.1 5.1 5.1 5.0Costa Rica 35 36 36 36 1.9 1.9 1.8 1.8Djibouti 34 34 35 35 3.8 3.7 3.6 3.5Gabon 46 46 46 46 4.3 4.2 4.2 4.2Georgia 47 47 47 47 1.8 1.8 1.8 1.8Lebanon 24 24 24 24 1.6 1.5 1.5 1.5Macedonia, FYR 39 38 38 39 1.5 1.5 1.5 1.4Mauritania 26 26 26 27 4.9 4.9 4.8 4.8Moldova 50 49 49 49 1.5 1.5 1.5 1.5Mongolia 46 46 46 46 2.4 2.4 2.4 2.4Montenegro – – – – 1.7 1.7 1.7 1.7Panama 37 37 37 37 2.6 2.6 2.5 2.5São Tomé and Príncipe 37 37 37 38 4.4 4.4 4.3 4.2Suriname 37 37 37 37 2.4 2.4 2.3 2.3Timor-Leste 33 33 33 34 5.7 5.7 5.6 5.5High-incomeCommonwealth countriesAntigua and Barbuda – – – – 2.2 2.1 2.1 2.1Bahamas, The 48 48 48 48 1.9 1.9 1.9 1.9Barbados 47 46 46 46 1.8 1.8 1.8 1.8Brunei Darussalam 42 42 42 42 2.1 2.1 2.1 2.0Cyprus 43 43 44 43 1.5 1.5 1.5 1.5Malta 34 34 34 35 1.4 1.4 1.4 1.4St Kitts and Nevis – – – – – – – –Trinidad and Tobago 42 42 42 42 1.8 1.8 1.8 1.8
(continued)
180

Table 49. Selected characteristics of female population (continued)
Group/country Percentage share of females in total labour force
Total fertility rate (number of children who would be born per female)
2008 2009 2010 2011 2008 2009 2010 2011
Other countriesBahrain 20 19 19 19 2.2 2.2 2.1 2.1Croatia 45 46 46 46 1.5 1.5 1.5 1.5Equatorial Guinea 45 45 45 45 5.3 5.2 5.1 5.0Estonia 49 49 50 50 1.7 1.6 1.6 1.5Iceland 47 47 47 47 2.2 2.2 2.2 2.0Ireland 43 44 44 44 2.1 2.1 2.1 2.1Kuwait 24 24 24 24 2.7 2.7 2.7 2.7Latvia 49 50 50 50 1.4 1.3 1.2 1.3Lithuania 50 50 51 51 1.5 1.6 1.6 1.8Luxembourg 43 43 43 44 1.6 1.6 1.6 1.5Norway 47 47 47 47 2.0 2.0 2.0 1.9Oman 19 19 18 17 2.9 2.9 2.9 2.9Qatar 13 13 12 12 2.2 2.1 2.1 2.1Slovenia 46 46 46 46 1.5 1.5 1.6 1.6Uruguay 44 44 45 45 2.1 2.1 2.1 2.1
Note: – = not availableSource: World Bank, World Development Indicators 2013, available at: http://databank.worldbank.org (accessed July 2013)
181

Table 50. Total government expenditure by main components (%)
Group/country Defence Education Health
2009 2010 2011 2009 2010 2011 2009 2010 2011
Middle-incomeCommonwealth countriesBelize 5.0 – – – – – 12.9 13.1 13.4Botswana 8.3 8.3 7.9 16.2 – – 7.2 8.7 8.7Dominica – – – – 9.3 8.6 10.5 12.3Fiji – – – 14.7 – 14.4 10.3 10.8 9.1Grenada – – – – – – 9.5 8.2 11.0Guyana – – – 13.2 16.7 13.5 17.3 14.8 16.2Jamaica 2.3 2.2 – – 11.5 – 5.5 6.8 6.6Kiribati – – – – – – 12.0 10.0 10.0Lesotho – – – – – – 11.0 13.8 14.6Maldives – – – 16.0 – 16.6 12.9 9.3 9.3Mauritius – 0.7 0.4 11.6 13.7 – 8.7 10.8 9.7Namibia – – – – – – 6.5 6.5 6.5Nauru – – – – – – – – –Papua New Guinea – – – – – – 10.0 9.8 12.8St Lucia – – – 10.3 10.9 11.9 15.1 13.3 11.1St Vincent and the Grenadines – – – 13.8 10.2 – 13.2 11.6 11.7Samoa – – – – – – 18.3 23.4 25.1Seychelles 3.5 3.0 3.3 – – – 8.8 9.3 9.3Solomon Islands – – – 26.0 34.0 – 21.1 20.3 25.5Swaziland – – – 18.0 16.0 21.0 13.5 13.7 14.9Tonga – – – – – – 11.7 13.0 15.8Tuvalu – – – – – – 13.8 18.1 18.0Vanuatu – – – 23.7 – – 17.7 17.2 15.0Other countriesAlbania – – – – – – 8.5 8.5 9.8Armenia 17.5 18.6 18.1 12.7 11.5 11.7 6.6 6.4 5.8Bhutan – – – 11.0 9.4 11.5 10.7 8.4 7.9Bosnia and Herzegovina 3.5 3.3 3.5 – – – 15.7 16.7 16.2Cape Verde 1.9 – – 15.9 14.4 – 9.9 8.2 7.9Congo, Republic of – – – – – – 4.6 6.5 6.5Costa Rica – – – 23.1 – – 30.6 29.0 28.0Djibouti – – – – – – 14.1 14.1 14.1Gabon – – – – – – 6.6 6.6 6.6Georgia 18.1 14.8 12.1 7.7 – – 6.1 6.9 6.9Lebanon 14.0 15.4 16.0 7.2 7.2 7.1 8.5 5.8 5.8Macedonia, FYR – – – – – – 11.6 11.9 11.7Mauritania – – – – 15.2 14.7 11.0 13.1 10.9Moldova 1.2 0.9 0.9 21.0 22.3 22.0 13.4 13.1 13.3Mongolia 3.1 3.3 3.3 14.6 – 11.9 9.1 8.6 6.8Montenegro – – – – – – 13.6 13.6 13.6Panama – – – – – 14.8 14.7 15.1 12.8São Tomé and Príncipe – – – – – – 5.6 5.6 5.6Suriname – – – – – – 11.9 11.9 11.9Timor-Leste – – – 15.5 11.7 8.1 7.1 5.0 2.9High-incomeCommonwealth countriesAntigua and Barbuda – – – 9.8 – – 9.1 18.7 15.9Bahamas, The – – – – – – 16.8 15.2 14.9Barbados – – – 14.3 13.5 7.8 9.3 10.9Brunei Darussalam – – – – 8.5 13.7 7.5 8.8 8.8Cyprus 4.8 4.9 5.0 17.3 15.8 – 6.8 6.9 6.9Malta 1.7 1.7 1.7 12.6 – – 12.7 13.0 13.3St Kitts and Nevis – – – – – – 5.4 6.8 6.9Trinidad and Tobago – – – – – – 7.6 9.3 8.0
(continued)
182

Table 50. Total government expenditure by main components (%) (continued)
Group/country Defence Education Health
2009 2010 2011 2009 2010 2011 2009 2010 2011
Other countriesBahrain – – – – – – 11.4 9.6 9.2Croatia 4.9 4.6 4.8 – – – 17.7 17.7 17.7Equatorial Guinea – – – – – – 7.0 7.0 7.0Estonia 6.2 5.0 5.2 13.5 14.0 – 11.6 12.3 12.3Iceland 0.2 15.3 – – 15.5 14.5 15.4Ireland 1.4 1.0 1.3 13.3 – – 14.5 13.5 13.5Kuwait 12.0 10.3 9.8 – – – 5.6 6.9 5.9Latvia 4.0 3.0 3.4 12.8 11.3 – 9.3 9.3 9.3Lithuania 3.5 3.0 3.0 12.9 13.2 – 12.6 12.6 12.6Luxembourg – – – – – – 15.5 15.5 15.5Norway 4.5 4.3 4.6 15.7 15.2 – 17.7 17.7 17.7Oman 36.4 35.1 21.2 – – – 5.8 6.2 4.9Qatar – – – – – – 6.4 5.2 5.8Slovenia 3.9 3.9 3.3 11.6 11.4 – 13.7 13.0 13.0Uruguay 7.1 6.6 6.5 – – – 19.2 18.8 20.0
Note: – = not availableSource: World Bank, World Development Indicators 2013, available at: http://databank.worldbank.org (accessed July 2013)
183

Table 51. Access to improved water sources (% of population)
Group/country Urban Rural Population with access (%)
2007 2008 2009 2010 2007 2008 2009 2010 2007 2008 2009 2010
Middle-incomeCommonwealth countriesBelize 96 97 97 98 93 95 97 99 95 96 97 98Botswana 99 99 99 99 91 91 92 92 96 96 96 96Dominica 96 96 96 96 92 – – – 95 – – –Fiji 100 100 100 100 95 95 95 95 98 98 98 98Grenada 97 97 97 97 – – – – – – – –Guyana 96 97 97 98 91 92 92 93 92 93 93 94Jamaica 98 98 98 98 88 88 88 88 93 93 93 93Kiribati – – – – – – – – – – – –Lesotho 92 92 91 91 74 74 73 73 78 79 78 78Maldives 100 100 100 100 96 97 97 97 97 98 98 98Mauritius 100 100 100 100 99 99 99 99 99 99 99 99Namibia 99 99 99 99 86 88 90 90 91 92 93 93Nauru – – – – – – – – – – – –Papua New Guinea 87 87 87 87 33 33 33 33 40 40 40 40St Lucia 98 98 98 98 95 95 95 95 96 96 96 96St Vincent and the
Grenadines– – – – – – – – – – – –
Samoa 96 96 96 96 94 95 95 96 94 95 95 96Seychelles 98 100 100 100Solomon Islands – – – – – – – – – – – –Swaziland 90 90 91 91 58 60 62 65 65 66 68 71Tonga 100 100 100 100 100 100 100 100 100 100 100 100Tuvalu – – – – – – – – – – – –Vanuatu 97 97 97 98 82 83 85 87 86 86 88 90Other countriesAlbania 97 97 96 96 94 94 94 94 95 96 95 95Armenia 99 99 99 99 92 94 96 97 96 97 98 98Bhutan 99 99 100 100 90 92 93 94 93 94 95 96Bosnia and Herzegovina 100 100 100 100 98 98 98 98 99 99 99 99Cape Verde 88 89 89 90 84 84 85 85 86 87 87 88Congo, Republic of 95 95 95 95 34 33 33 32 71 71 71 71Costa Rica 100 100 100 100 90 91 91 91 96 97 97 97Djibouti 98 99 99 99 55 54 54 54 88 88 88 88Gabon 95 95 95 95 41 41 41 41 87 87 87 87Georgia 100 100 100 100 96 96 96 96 98 98 98 98Lebanon 100 100 100 100 100 100 100 100 100 100 100 100Macedonia, FYR 100 100 100 100 99 99 99 99 100 100 100 100Mauritania 51 52 52 52 45 47 48 48 47 49 50 50Moldova 99 99 99 99 92 92 93 93 95 95 96 96Mongolia 99 100 100 100 50 51 53 53 80 81 82 82Montenegro 99 99 99 99 96 96 96 96 98 98 98 98Panama 97 97 97 97 83 83 83 – 93 93 93 –São Tomé and Príncipe 89 89 89 89 85 88 88 88 87 89 89 89Suriname 97 97 97 97 80 81 81 81 92 92 92 92Timor-Leste 84 86 88 91 57 58 59 60 64 66 67 69High-incomeCommonwealth countriesAntigua and Barbuda 95 95 95 95 – – – – – – – –Bahamas, The 98 98 98 98 – – – – – – – –Barbados 100 100 100 100 100 100 100 100 100 100 100 100Brunei Darussalam – – – – – – – – – – – –Cyprus 100 100 100 100 100 100 100 100 100 100 100 100Malta 100 100 100 100 100 100 100 100 100 100 100 100St Kitts and Nevis 99 99 99 99 99 99 99 99 99 99 99 99Trinidad and Tobago 98 98 98 98 93 93 93 93 94 94 94 94
(continued)
184

Table 51. Access to improved water sources (% of population) (continued)
Group/country Urban Rural Population with access (%)
2007 2008 2009 2010 2007 2008 2009 2010 2007 2008 2009 2010
Other countriesBahrain 100 100 100 100 – – – – – – – –Croatia 100 100 100 100 97 97 97 97 99 99 99 99Equatorial Guinea – – – – – – – – – – – –Estonia 99 99 99 99 97 97 97 97 98 98 98 98Iceland 100 100 100 100 100 100 100 100 100 100 100 100Ireland 100 100 100 100 100 100 100 100 100 100 100 100Kuwait 99 99 99 99 99 99 99 99 99 99 99 99Latvia 100 100 100 100 96 96 96 96 99 99 99 99Lithuania 98 98 98 98 81 81 81 – 92 92 92 –Luxembourg 100 100 100 100 100 100 100 100 100 100 100 100Norway 100 100 100 100 100 100 100 100 100 100 100 100Oman 91 92 93 93 77 77 78 78 87 88 89 89Qatar 100 100 100 100 100 100 100 100 100 100 100 100Slovenia 100 100 100 100 99 99 99 99 99 99 99 99Uruguay 100 100 100 100 98 100 100 100 100 100 100 100
Note: – = not availableSource: World Bank, World Development Indicators 2013, available at: http://databank.worldbank.org (accessed July 2013)
185

Table 52. Access to improved sanitation (% of population)
Group/country Urban Rural
2008 2009 2010 2011 2008 2009 2010 2011
Middle-incomeCommonwealth countriesBelize 91 92 93 93 86 87 87 87Botswana 75 75 75 78 40 41 41 42Dominica – – – – – – – –Fiji 94 94 94 92 71 71 71 82Grenada 96 96 96 – 97 97 97 –Guyana 87 87 88 88 81 81 82 82Jamaica 78 78 78 78 82 82 82 82Kiribati 50 50 51 51 29 29 30 30Lesotho 33 33 32 32 24 24 24 24Maldives 98 98 98 98 92 95 97 98Mauritius 91 91 91 92 88 88 88 90Namibia 57 57 57 57 16 17 17 17Nauru – – – – – – – –Papua New Guinea 57.5 27.3 57 57 13.2 13.2 13.3 13St Lucia 71 71 71 70 63 63 63 64St Vincent and the Grenadines – – – – 96 96 96 –Samoa 99 99 98 93 98 98 98 91Seychelles 97 98 98 97 97 97 97 97Solomon Islands 98 98 98 81 15 15 15 15Swaziland 64 64 64 63 54 55 55 55Tonga 98 98 98 99 96 96 96 89Tuvalu – – – – – – – –Vanuatu 62 63 64 65 51 52 54 55Other countriesAlbania 95 95 95 95 90 92 93 93Armenia 95 95 95 96 80 80 80 81Bhutan 71 72 73 74 29 29 29 29Bosnia and Herzegovina 99 99 99 100 92 92 92 92Cape Verde 70 72 73 74 40 42 43 45Congo, Republic of 20 20 20 20 16 15 15 15Costa Rica 95 95 95 95 96 96 96 92Djibouti 63 63 63 73 10 10 10 22Gabon 33 33 33 33 30 30 30 30Georgia 96 96 96 96 93 93 93 91Lebanon 100 100 100 100 – – – –Macedonia, FYR 92 92 92 97 82 82 82 83Mauritania 50 51 51 51 9 9 9 9Moldova 88 89 89 89 80 81 82 83Mongolia 64 64 64 64 29 29 29 29Montenegro 92 92 92 92 87 87 87 87Panama 75 75 77 77 51 51 54 54São Tomé and Príncipe 30 30 30 41 19 19 19 23Suriname 90 90 90 90 66 66 66 66Timor-Leste 69 71 73 68 36 37 37 27High-incomeCommonwealth countriesAntigua and Barbuda 98 98 98 91 – – – 91Bahamas, The 100 100 100 – 100 100 100 –Barbados 100 100 100 – 100 100 100 –Brunei Darussalam – – – – – – – –Cyprus 100 100 100 100 100 100 100 100Malta 100 100 100 100 100 100 100 100St Kitts and Nevis 96 96 96 – 96 96 96 –Trinidad and Tobago 92 92 92 92 92 92 92 92
(continued)
186

Table 52. Access to improved sanitation (% of population) (continued)
Group/country Urban Rural
2008 2009 2010 2011 2008 2009 2010 2011
Other countriesBahrain 100 100 100 99 99 99 99 99Croatia 99 99 99 99 98 98 98 98Equatorial Guinea – – – – – – – –Estonia 96 96 96 100 94 94 94 94Iceland 100 100 100 100 100 100 100 100Ireland 100 100 100 100 98 98 98 98Kuwait 100 100 100 100 100 100 100 100Latvia 82 82 – – 71 71 – –Lithuania 95 95 95 95 69 69 – –Luxembourg 100 100 100 100 100 100 100 100Norway 100 100 100 100 100 100 100 100Oman 100 100 100 97 92 95 95 95Qatar 100 100 100 100 100 100 100 100Slovenia 100 100 100 100 100 100 100 100Uruguay 100 100 100 99 99 99 99 98
Note: – = not availableSource: World Bank, World Development Indicators 2013, available at: http://databank.worldbank.org (accessed July 2013)
187

Table 53. Human Development Index (HDI)
Group/country 2010 2011 2012
Rank 0–1 value Rank 0–1 value Rank 0–1 value
Middle-incomeCommonwealth countriesBelize 78 0.694 93 0.699 96 0.702Botswana 98 0.633 118 0.633 119 0.634Dominica – – 81 0.724 72 0.745Fiji 86 0.699 100 0.688 96 0.702Grenada – – 67 0.748 63 0.770Guyana 104 0.611 117 0.633 118 0.636Jamaica 80 0.688 79 0.727 85 0.730Kiribati – – 122 0.624 121 0.629Lesotho 141 0.427 160 0.45 158 0.461Maldives 107 0.602 109 0.661 104 0.688Mauritius 72 0.701 77 0.728 80 0.737Namibia 105 0.606 120 0.625 128 0.608Nauru – – – – – –Papua New Guinea 137 0.431 153 0.466 156 0.466St Lucia – – 82 0.723 88 0.725St Vincent and the Grenadines – – 85 0.717 83 0.733Samoa – – 99 0.688 96 0.702Seychelles – – 52 0.773 46 0.806Solomon Islands 123 0.494 142 0.51 143 0.530Swaziland 13 0.874 140 0.522 141 0.536Tonga 85 0.677 90 0.704 95 0.710Tuvalu – – – – – –Vanuatu – – 125 0.617 124 0.626Other countriesAlbania 64 0.719 70 0.739 70 0.749Armenia 76 0.695 86 0.716 87 0.729Bhutan – – 141 0.522 140 0.538Bosnia and Herzegovina 68 0.71 74 0.733 81 0.735Cape Verde 118 0.534 133 0.568 132 0.586Congo, Republic of 126 0.489 137 0.533 142 0.534Costa Rica 62 0.725 69 0.744 62 0.773Djibouti 147 0.402 165 0.43 164 0.445Gabon 93 0.648 106 0.674 106 0.683Georgia 74 0.698 75 0.733 72 0.745Lebanon – – 71 0.739 72 0.745Macedonia, FYR – – – – – –Mauritania 136 0.433 159 0.453 155 0.467Moldova – – – – 113 0.660Mongolia 100 0.622 110 0.653 108 0.675Montenegro 49 0.769 54 0.771 52 0.791Panama 54 0.755 58 0.768 59 0.780São Tomé and Príncipe 127 0.488 144 0.509 144 0.525Suriname 94 0.646 104 0.68 105 0.684Timor-Leste 120 0.502 147 0.495 134 0.576High-incomeCommonwealth countriesAntigua and Barbuda – – 60 0.76 67 0.760Bahamas, The 43 0.784 53 0.771 49 0.794Barbados 42 0.788 47 0.838 38 0.825Brunei Darussalam 37 0.805 33 0.854 30 0.855Cyprus 35 0.81 31 0.84 31 0.848Malta 33 0.815 36 0.832 32 0.847St Kitts and Nevis – – 72 0.735 72 0.745Trinidad and Tobago 59 0.736 62 0.76 67 0.760
(continued)
188

Table 53. Human Development Index (HDI) (continued)
Group/country 2010 2011 2012
Rank 0–1 value Rank 0–1 value Rank 0–1 value
Other countriesBahrain 39 0.801 42 0.806 48 0.796Croatia 51 0.767 46 0.796 47 0.805Equatorial Guinea 117 0.538 136 0.537 136 0.554Estonia 34 0.812 34 0.835 33 0.846Iceland 17 0.869 14 0.898 13 0.906Ireland 5 0.895 7 0.908 7 0.916Kuwait 47 0.771 63 0.76 54 0.790Latvia 48 0.769 43 0.805 44 0.814Lithuania 44 0.783 40 0.81 41 0.818Luxembourg 24 0.852 25 0.867 26 0.875Norway 1 0.938 1 0.943 1 0.955Oman – – 89 0.705 84 0.731Qatar 38 0.803 37 0.831 36 0.834Slovenia 29 0.838 21 0.884 21 0.892Uruguay 52 0.765 48 0.783 51 0.792
Note: – = not availableSource: Human Development Report data, available at: http://hdr.undp.org (accessed 25 February 2013)
189

Table 54. Selected characteristics of gender equality
Group/country Gender inequality index 2012
Share of women in wage employment (%)
Seats held by women in parliament (%)
Ranking 0–1 value 2007 2008 2009 2010 2009 2010 2011 2012
Middle-incomeCommonwealth countriesBelize 79 0.435 37.7 – – – – – – 3.1Botswana 102 0.485 43.4 – 41.6 41.4 7.9 7.9 7.9 7.9Dominica – – – – – – 14.3 12.5 12.5 12.5Fiji – – – – – – – – – –Grenada – – – – – – 13.3 13.3 13.3 13.3Guyana 104 0.49 – – – – 30 30 31.3 31.3Jamaica 87 0.458 46.3 48.2 – – 13.3 13.3 12.7 12.7Kiribati – – – – – – 4.3 4.3 8.7 8.7Lesotho 113 0.534 – – – – 24.2 24.2 24.2 26.7Maldives 64 0.357 – – – – 6.5 6.5 6.5 6.5Mauritius 70 0.377 37.2 37 36.9 37.6 17.1 18.8 18.8 18.8Namibia 86 0.455 – – – – 26.9 24.4 24.4 24.4Nauru – – – – – – – – – –Papua New Guinea 134 0.617 – – – – 0.9 0.9 0.9 2.7St Lucia – – – – – – 11.1 11.1 16.7 16.7St Vincent and the Grenadines – – – – – – 21.7 14.3 17.4 17.4Samoa – – – – – – 8.2 8.2 4.1 4.1Seychelles – – – – – – 23.5 23.5 43.8 43.8Solomon Islands – – – – – – – – – 2Swaziland 112 0.525 – – – – 13.6 13.6 13.6 13.6Tonga 90 0.462 – – – – 3.1 0 3.6 3.6Tuvalu – – – – – – – – – –Vanuatu – – 37.8 38.9 – – 3.8 3.8 1.9 –Other countriesAlbania 41 0.251 – – – – 16.4 16.4 15.7 15.7Armenia 59 0.34 41.4 40.4 43.1 – 9.2 9.2 8.4 10.7Bhutan 92 0.464 – – 26.8 – 8.5 8.5 8.5 8.5Bosnia and Herzegovina – – 38.2 39.3 40.5 41 19 16.7 21.4 21.4Cape Verde – – – – – – 18.1 18.1 20.8 20.8Congo, Republic of 132 0.61 – – – – 7.3 7.3 7.3 7.4Costa Rica 62 0.346 41.1 41.5 42.8 43.3 36.8 38.6 38.6 38.6Djibouti – – – – – – 13.8 13.8 13.8 13.8Gabon 105 0.492 – – – 34.5 14.7 14.7 14.2 15.8Georgia 81 0.438 47.8 46.2 46.7 48.5 5.1 6.5 6.6 12Lebanon 78 0.433 – – – – 3.1 3.1 3.1 3.1Macedonia, FYR 30 0.162 43 41.9 42.2 42.2 32.5 32.5 30.9 32.5Mauritania 139 0.643 – – – – 22.1 22.1 22.1 22.1Moldova 49 0.303 54.6 54.1 54.3 55 23.8 18.8 19.8 19.8Mongolia 56 0.328 51.2 51.1 52.6 52.7 3.9 3.9 3.9 14.9Montenegro – – 46.3 11.1 11.1 12.3 17.3Panama 108 0.503 43.1 42.2 42.1 42.9 8.5 8.5 8.5 8.5São Tomé and Príncipe – – – – – – 7.3 18.2 18.2 18.2Suriname 94 0.467 – – – 36.3 25.5 9.8 11.8 11.8Timor-Leste – – – – – – 29.2 29.2 32.3 38.5High-incomeCommonwealth countriesAntigua and Barbuda – – 50.6 50.6 – – 10.5 10.5 10.5 10.5Bahamas, The 53 0.316 48.8 49.2 50.2 – 12.2 12.2 12.2 13.2Barbados 51 0.343 50.4 50.7 – – 10 10 10 10Brunei Darussalam – – – – – – – – – –Cyprus 22 0.134 49.1 48.7 48.3 48.8 12.5 12.5 10.7 10.7Malta 39 0.236 35.7 35.9 36.4 – 8.7 8.7 8.7 8.7St Kitts and Nevis – – – – – – 6.7 6.7 6.7 6.7Trinidad and Tobago 50 0.311 – – – – 26.8 28.6 28.6 28.6
(continued)
190

Table 54. Selected characteristics of gender equality (continued)
Group/country Gender inequality index 2012
Share of women in wage employment (%)
Seats held by women in parliament (%)
Ranking 0–1 value 2007 2008 2009 2010 2009 2010 2011 2012
Other countriesBahrain 45 0.258 9.8 9.6 9.6 10 2.5 2.5 10 10Croatia 33 0.179 45.5 45.8 47.1 47 23.5 23.5 23.8 23.8Equatorial Guinea – – – – – – 10 10 10 10Estonia 29 0.158 52.3 51.8 53.9 54 22.8 22.8 19.8 20.8Iceland 10 0.089 50 49.4 51.1 51.7 42.9 42.9 39.7 39.7Ireland 19 0.121 48.2 49.2 51.8 52.1 13.9 13.9 15.1 15.1Kuwait 47 0.274 – – – – 7.7 7.7 7.7 6.2Latvia 36 0.216 52 52.7 54.2 54.2 22 20 23 23Lithuania 28 0.157 53 – 54.3 54.4 19.1 19.1 19.1 24.5Luxembourg 26 0.149 43.8 43.3 43.7 44 20 20 25 21.7Norway 5 0.065 49.2 49.1 49.6 49.4 39.6 39.6 39.6 39.6Oman 59 0.34 – 21.9 – – – – 1.2 1.2Qatar 117 0.546 12.3 9.8 12.1 – – – –Slovenia 8 0.08 46.8 47.4 47.9 47.8 14.4 14.4 32.2 32.2Uruguay 69 0.367 45.5 – – – 14.1 15.2 12.1 12.1
Note: – = not availableSources: World Bank, World Development Indicators 2013, available at: http://databank.worldbank.org; Gender Inequality Index,
available at: http://undp.org (accessed July 2013)
191

Tabl
e 55
. S
elec
ted
pove
rty
indi
cato
rs
Gro
up/c
ount
ry
Ineq
ualit
y-ad
just
ed
Inco
me
Inde
x
Ineq
ualit
y-ad
just
ed
Inco
me
Inde
x 20
12
Mul
ti-
dim
ensi
onal
Po
vert
y In
dex
Poor
est
quin
tile
’s
perc
enta
ge
shar
e of
na
tion
al in
com
e
Popu
lati
on
belo
w
$1.2
5 a
day
(%)
Pove
rty
gap
at
$1.2
5 a
day
(P
PP) (
%)
Perc
enta
ge o
f po
pula
tion
bel
ow
min
imum
leve
l of
diet
ary
ener
gy
cons
umpt
ion
valu
elo
ss (%
)va
lue
loss
(%)
2012
2000
–201
020
02–2
011
2008
2009
2010
2009
2010
2011
Mid
dle-
inco
me
Com
mon
wea
lth c
ount
ries
Bel
ize
––
––
0.02
––
––
–7.
47.
16.
8B
ots
wan
a–
––
––
––
–.
–30
.329
27.9
Do
min
ica
––
––
––
––
––
55
5Fi
ji–
––
––
8.00
––
1.1
–5
55
Gre
nada
––
––
––
––
––
20.6
18.8
17.9
Guy
ana
0.33
732
.10.
393
24.4
50.
03–
––
––
5.7
5.1
5.1
Jam
aica
0.45
424
.10.
434
30.1
4–
9.65
––
––
8.5
8.7
8.7
Kiri
bati
––
––
––
––
––
77.
58.
2Le
soth
o0.
213
47.0
0.22
947
.04
0.16
18.9
743
.4–
––
16.5
16.3
16.6
Mal
dive
s0.
436
23.2
0.48
923
.15
0.02
6.80
––
––
6.5
5.9
5.6
Mau
ritiu
s0.
581
16.6
0.60
216
.59
––
––
––
5.6
5.5
5.7
Nam
ibia
0.18
768
.30.
191
68.3
40.
1921
.78
31.9
––
–33
.834
.233
.9N
auru
––
––
––
––
––
––
–P
apua
New
Gui
nea
––
––
––
––
––
––
–St
Luc
ia–
––
––
––
––
–13
.514
.314
.6St
Vin
cent
and
the
Gre
nadi
nes
––
––
––
––
––
5.6
5.3
5S
amo
a–
––
––
––
––
–5
55
Seyc
helle
s–
––
––
18.7
7–
––
–8.
68.
68.
6So
lom
on
Isla
nds
––
––
––
––
––
12.5
12.5
12.7
Swaz
iland
0.32
240
.90.
343
40.9
10.
0913
.98
40.6
––
16.0
12.9
11.9
11.4
Tong
a–
––
––
––
––
––
––
Tuva
lu–
––
––
––
––
––
––
Van
uatu
––
0.52
618
.33
0.13
5.29
––
––
7.3
7.9
8.5
Oth
er c
ount
ries
Alb
ania
0.51
018
.30.
510
13.8
60.
014.
530.
60.
2–
–5
55
Arm
enia
0.50
410
.80.
450
23.1
10.
006.
801.
30.
3–
0.5
55
5B
huta
n–
–0.
518
19.2
10.
126.
4910
.2–
––
––
–B
osn
ia a
nd H
erze
govi
na0.
502
19.3
––
0.00
12.3
1–
––
–5
55
( con
tinue
d)
192

Tabl
e 55
. S
elec
ted
pove
rty
indi
cato
rs (
cont
inue
d)
Gro
up/c
ount
ry
Ineq
ualit
y-ad
just
ed
Inco
me
Inde
x
Ineq
ualit
y-ad
just
ed
Inco
me
Inde
x 20
12
Mul
ti-
dim
ensi
onal
Po
vert
y In
dex
Poor
est
quin
tile
’s
perc
enta
ge
shar
e of
na
tion
al in
com
e
Popu
lati
on
belo
w
$1.2
5 a
day
(%)
Pove
rty
gap
at
$1.2
5 a
day
(P
PP) (
%)
Perc
enta
ge o
f po
pula
tion
bel
ow
min
imum
leve
l of
diet
ary
ener
gy
cons
umpt
ion
valu
elo
ss (%
)va
lue
loss
(%)
2012
2000
–201
020
02–2
011
2008
2009
2010
2009
2010
2011
Cap
e V
erde
––
0.34
830
.29
–10
.71
––
––
10.2
10.1
8.9
Co
ngo,
Rep
ublic
of
0.34
230
.30.
430
37.8
80.
2114
.51
54.1
––
–35
.736
.337
.4C
ost
a R
ica
0.44
233
.70.
365
21.7
1–
7.71
–1.
51.
8–
5.2
5.8
6.5
Djib
out
i0.
355
21.3
0.55
622
.05
0.14
7.82
18.8
––
–22
.220
.619
.8G
abo
n0.
536
22.1
0.42
825
.87
–8.
86–
––
–6.
16.
26.
5G
eorg
ia0.
428
22.7
0.58
320
.94
0.00
6.60
15.3
4.6
4.2
5.8
29.7
28.2
24.7
Leba
non
0.48
930
0.60
520
.10
–6.
71–
––
–5
55
Mac
edo
nia,
FYR
––
0.34
623
.78
0.01
7.80
–0.
00.
00.
0–
––
Mau
ritan
ia0.
329
21.5
0.34
623
.78
0.35
7.80
23.4
6.8
––
8.4
99.
3M
old
ova
––
0.42
917
.00
0.01
5.28
0.4
0.3
0.1
0.1
––
–M
ong
olia
0.42
216
.40.
444
19.6
70.
076.
20–
––
–26
.325
.624
.2M
ont
eneg
ro0.
589
11.3
0.60
012
.56
0.01
4.56
0.1
0.1
0.0
0.0
55
5P
anam
a0.
410
40.5
0.43
140
.50
–17
.08
––
1.8
2.1
1211
.110
.2S
ão T
om
é an
d P
rínci
pe0.
231
44.2
––
0.15
––
––
–7.
57.
57.
7Su
rinam
e0.
403
34.9
0.42
632
.85
0.04
––
––
–12
.911
.911
.4T
imo
r-Le
ste
0.40
117
.80.
485
17.8
20.
364.
6137
.432
.236
.238
.2H
igh-
inco
me
Com
mon
wea
lth c
ount
ries
Ant
igua
and
Bar
buda
––
––
––
––
––
21.1
2020
.5B
aham
as, T
he0.
588
24.5
––
––
––
––
7.1
77.
2B
arba
dos
––
––
––
––
––
55
5B
rune
i Dar
ussa
lam
––
––
––
––
––
55
5C
ypru
s0.
704
10.9
0.69
813
.60
––
––
––
55
5M
alta
––
0.68
313
.61
––
––
––
55
5St
Kitt
s an
d N
evis
––
––
––
––
––
16.6
15.5
14Tr
inid
ad a
nd T
oba
go0.
610
21.9
0.62
121
.94
0.02
––
––
–9.
59.
3–
Oth
er c
ount
ries
Bah
rain
––
––
––
––
––
––
–C
roat
ia0.
523
27.8
0.53
727
.80
0.02
5.21
0.1
0.1
––
55
5Eq
uato
rial G
uine
a–
––
––
––
––
––
––
Esto
nia
0.62
714
.50.
627
17.7
20.
036.
350.
5–
––
55
5Ic
elan
d0.
718
11.8
0.72
713
.23
––
––
––
55
5Ire
land
0.70
113
.80.
720
13.7
9–
5.65
––
––
55
5
(con
tinue
d)
193

Tabl
e 55
. S
elec
ted
pove
rty
indi
cato
rs (
cont
inue
d)
Gro
up/c
ount
ry
Ineq
ualit
y-ad
just
ed
Inco
me
Inde
x
Ineq
ualit
y-ad
just
ed
Inco
me
Inde
x 20
12
Mul
ti-
dim
ensi
onal
Po
vert
y In
dex
Poor
est
quin
tile
’s
perc
enta
ge
shar
e of
na
tion
al in
com
e
Popu
lati
on
belo
w
$1.2
5 a
day
(%)
Pove
rty
gap
at
$1.2
5 a
day
(P
PP) (
%)
Perc
enta
ge o
f po
pula
tion
bel
ow
min
imum
leve
l of
diet
ary
ener
gy
cons
umpt
ion
valu
elo
ss (%
)va
lue
loss
(%)
2012
2000
–201
020
02–2
011
2008
2009
2010
2009
2010
2011
Kuw
ait
––
––
––
––
––
55
5La
tvia
0.56
121
0.49
829
.99
0.01
–0.
10.
10.
1–
55
5Li
thua
nia
0.60
117
.50.
524
21.8
2–
9.53
–0.
1–
–5
55
Luxe
mbo
urg
0.77
113
.50.
807
11.5
5–
4.61
––
––
55
5N
orw
ay0.
789
10.6
0.79
712
.81
–3.
88–
––
–5
55
Om
an–
––
––
––
––
––
––
Qat
ar–
––
––
13.3
3–
––
––
––
Slo
veni
a0.
723
8.5
0.72
99.
90–
4.80
0.1
––
–5
55
Uru
guay
0.50
527
.80.
521
27.8
60.
0110
.35
0.2
0.1
0.1
0.1
55
5
Not
e: –
= n
ot a
vaila
ble
Sou
rces
: Wo
rld B
ank,
Wor
ld D
evel
opm
ent I
ndic
ator
s 20
13, a
vaila
ble
at: h
ttp:
//da
taba
nk.w
orld
bank
.org
; H
uman
Dev
elo
pmen
t Rep
ort
dat
a, a
vaila
ble
at: h
ttp:
//hd
rsta
ts.u
ndp.
org
/en/
indi
cato
rs/7
1606
.htm
l (ac
cess
ed J
uly
2013
)
194
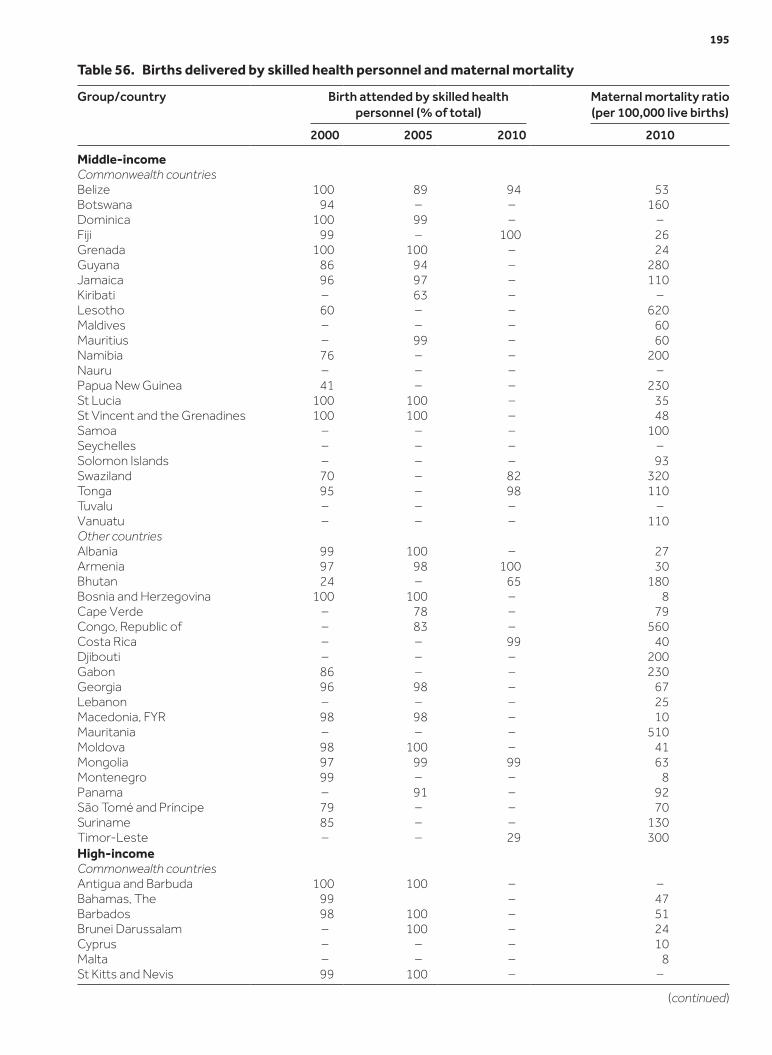
Table 56. Births delivered by skilled health personnel and maternal mortality
Group/country Birth attended by skilled health personnel (% of total)
Maternal mortality ratio (per 100,000 live births)
2000 2005 2010 2010
Middle-incomeCommonwealth countriesBelize 100 89 94 53Botswana 94 – – 160Dominica 100 99 – –Fiji 99 – 100 26Grenada 100 100 – 24Guyana 86 94 – 280Jamaica 96 97 – 110Kiribati – 63 – –Lesotho 60 – – 620Maldives – – – 60Mauritius – 99 – 60Namibia 76 – – 200Nauru – – – –Papua New Guinea 41 – – 230St Lucia 100 100 – 35St Vincent and the Grenadines 100 100 – 48Samoa – – – 100Seychelles – – – –Solomon Islands – – – 93Swaziland 70 – 82 320Tonga 95 – 98 110Tuvalu – – – –Vanuatu – – – 110Other countriesAlbania 99 100 – 27Armenia 97 98 100 30Bhutan 24 – 65 180Bosnia and Herzegovina 100 100 – 8Cape Verde – 78 – 79Congo, Republic of – 83 – 560Costa Rica – – 99 40Djibouti – – – 200Gabon 86 – – 230Georgia 96 98 – 67Lebanon – – – 25Macedonia, FYR 98 98 – 10Mauritania – – – 510Moldova 98 100 – 41Mongolia 97 99 99 63Montenegro 99 – – 8Panama – 91 – 92São Tomé and Príncipe 79 – – 70Suriname 85 – – 130Timor-Leste – – 29 300High-incomeCommonwealth countriesAntigua and Barbuda 100 100 – –Bahamas, The 99 – 47Barbados 98 100 – 51Brunei Darussalam – 100 – 24Cyprus – – – 10Malta – – – 8St Kitts and Nevis 99 100 – –
(continued)
195

Table 56. Births delivered by skilled health personnel and maternal mortality (continued)
Group/country Birth attended by skilled health personnel (% of total)
Maternal mortality ratio (per 100,000 live births)
2000 2005 2010 2010
Trinidad and Tobago 96 – – 46Other countriesBahrain – 99 – 20Croatia 100 100 100 17Equatorial Guinea 65 – – 240Estonia 100 100 – 2Iceland – – – 5Ireland – – – 6Kuwait – – – 14Latvia 100 100 – 34Lithuania 100 100 – 8Luxembourg – – – 20Norway – – – 7Oman 95 98 – 32Qatar – – – 7Slovenia 100 100 – 12Uruguay – – – 29
Note: – = not availableSource: World Bank, World Development Indicators 2013, available at: http://databank.worldbank.org (accessed July 2013)
196

Table 57. Universal access to reproductive health
Group/country Contraceptive prevalence rate
(%) (female 15–49 years)
Adolescent birth rate per 1,000 women (ages 15–19)
(%)
Antenatal care coverage, at
least one visit (%)
Unmet need for family planning
(% of total) (15–49 years)
Survey year % 2001 2009 2010 2011 2007–2012 2005–2012
Middle-incomeCommonwealth countriesBelize 2006 34.3 94.2 75.5 74.0 72.4 94 –Botswana 2007 52.8 63.6 48.8 47.1 45.5 94 –Dominica – – – – – – 100 –Fiji 2010 31.8 42.4 44.3 43.8 43.3 100 –Grenada 2006 54.0 53.2 39.6 38.2 36.8 100 –Guyana 2009 42.5 80.7 62.6 59.7 56.8 92 29Jamaica 2008 72.3 87.0 74.3 72.8 71.2 99 –Kiribati 2009 22.3 – – – – 88 –Lesotho 2009 47.0 90.5 68.4 65.9 63.3 92 23Maldives 2009 34.7 27.7 11.4 11.0 10.6 99 29Mauritius – – 36.4 34.0 33.3 32.6 – –Namibia 2007 55.1 83.5 66.4 62.4 58.4 95 21Nauru – – – – – – 95 –Papua New Guinea 2006 32.4 71.9 64.9 63.9 63.0 79 –St Lucia – – 63.5 59.3 58.2 57.0 99 –St Vincent and the
Grenadines2006 48.0 66.9 57.0 56.1 55.1 100 –
Samoa 2009 28.7 38.6 27.2 26.6 26.1 93 48Seychelles – – – – – – – –Solomon Islands 2007 34.6 70.3 68.0 66.9 65.7 74 11Swaziland 2010 65.2 103.8 77.5 74.3 71.1 97 13Tonga 2010 31.5 21.5 20.6 19.7 18.9 98 –Tuvalu 2007 30.5 – – – – 97 24Vanuatu 2007 38.4 58.8 52.6 52.0 51.3 84 –Other countriesAlbania 2009 69.3 16.2 16.7 16.1 15.5 97 13Armenia 2010 54.9 40.9 34.7 34.2 33.7 99 19Bhutan 2010 65.6 61.6 48.1 47.0 45.9 97 12.0Bosnia and Herzegovina 2006 35.7 19.9 15.2 14.6 14.0 99 –Cape Verde – – 96.9 76.6 74.1 71.7 98 17Congo, Republic of – – 130.4 116.2 115.0 113.8 89 20Costa Rica 2010 82.1 78.5 64.2 63.4 62.7 90 –Djibouti 2008 22.5 29.3 21.6 20.9 20.2 92 –Gabon – – 111.7 86.4 84.6 82.8 94 –Georgia 2010 53.4 50.9 42.6 41.6 40.5 98 16Lebanon 2009 53.7 22.3 15.9 15.7 15.6 96 –Macedonia, FYR – – 27.7 20.3 19.5 18.6 – –Mauritania 2007 9.3 89.7 76.1 74.5 72.9 75 –Moldova – – 41.6 31.9 31.0 30.1 – –Mongolia 2010 54.9 24.0 20.0 19.6 19.1 – 14Montenegro 2006 39.4 21.4 16.8 16.2 15.5 97 –Panama 2009 52.2 89.8 79.9 78.6 77.2 96 –São Tomé and Príncipe 2009 38.4 83.0 61.8 59.7 57.5 98 48Suriname 2006 45.6 46.0 37.7 36.7 35.8 90 –Timor-Leste 2010 22.3 70.5 60.4 57.7 55.0 84 32High-incomeCommonwealth countriesAntigua and Barbuda – – – – – – 100 –Bahamas, The – – 47.6 30.4 29.7 29.0 98 –Barbados – – 44.9 41.9 41.5 41.2 100 –
(continued)
197

Table 57. Universal access to reproductive health (continued)
Group/country Contraceptive prevalence rate
(%) (female 15–49 years)
Adolescent birth rate per 1,000 women (ages 15–19)
(%)
Antenatal care coverage, at
least one visit (%)
Unmet need for family planning
(% of total) (15–49 years)
Survey year % 2001 2009 2010 2011 2007–2012 2005–2012
Brunei Darussalam – – 26.7 24.1 23.7 23.2 99 –Cyprus – – 8.4 6.1 5.9 5.7 99 –Malta – – 16.3 15.1 14.0 12.9 100 –St Kitts and Nevis 2008 54.0 – – – – 100 –Trinidad and Tobago 2006 42.5 36.7 33.5 32.9 32.2 96 –Other countriesBahrain – – 16.1 14.9 14.9 14.8 100 –Croatia – – 15.0 13.2 13.1 12.9 – –Equatorial Guinea – – 129.8 119.6 117.9 116.3 86 –Estonia – – 23.9 20.5 19.4 18.3 – –Iceland – – 18.5 13.4 12.8 12.2 – –Ireland – – 19.0 14.0 12.3 10.6 – –Kuwait – – 18.3 14.0 14.2 14.3 100 –Latvia – – 17.7 15.9 14.9 13.8 92 –Lithuania – – 23.0 18.3 17.6 16.9 100 –Luxembourg – – 11.4 9.4 9.1 8.8 – –Norway – – 10.2 8.3 8.0 7.7 – –Oman 2008 24.4 23.1 9.3 9.3 9.3 99 –Qatar – – 19.7 15.9 15.8 15.6 100 –Slovenia – – 9.3 4.8 4.7 4.6 100 –Uruguay – – 64.3 60.3 59.9 59.5 96 –
Note: – = not availableSources: World Bank, World Development Indicators 2013, available at: http://databank.worldbank.org; United Nations, data available
at: http://data.un.org/ and http://unstats.un.org/unsd/mdg/ (accessed July 2013)
198

Table 58. Children’s health
Group/country Prevalence of underweight children under 5 years of age Immunisation DPT rate (% of children age
12–23 months)
Survey yearAge
(months)
Underweight
Moderate /severe (%)
Severe (%)
Stunted/ severe (%) 2008 2009 2010 2011
Middle-incomeCommonwealth countriesBelize 2006 0–59 4.3 0.7 21.6 94 97 96 95Botswana 2007 0–59 11.2 3.8 31.4 96 96 96 96Dominica – – – – – 96 99 98 98Fiji – – – – – 99 99 99 99Grenada – – – – – 99 99 97 94Guyana 2009 0–59 10.5 1.6 18.2 93 98 95 93Jamaica 2007 0–59 2 0 3.7 99 99 99 99Kiribati 1999 0–59 0 0 0 82 86 91 99Lesotho 2009 0–59 13.2 2.3 39.2 83 83 83 83Maldives 2009 0–59 17.3 3.3 18.9 98 98 96 96Mauritius 1995 0–59 – – – 99 99 99 98Namibia 2006–2007 0–59 16.6 3.8 29 83 83 83 82Nauru 2007 0–59 4.8 0.8 24 – – – –Papua New Guinea 2005 0–59 18.4 5.3 42.6 52 62 56 61St Lucia – – – – – 96 95 97 97St Vincent and the Grenadines – – – – – 99 99 99 95Samoa – – – – – 46 72 87 91Seychelles – – – – – 99 99 99 99Solomon Islands 2007 0–59 11.8 2.4 32.8 78 81 79 88Swaziland 2010 0–59 5.8 1 30.9 94 94 89 91Tonga – – – – – 99 99 99 99Tuvalu 2007 0–59 1.6 0.3 10 99 88 89 96Vanuatu 2007 0–59 – – – 68 68 68 68Other countriesAlbania 2008–2009 0–59 5.2 1.7 19.3 99 98 99 99Armenia 2010 0–59 4.7 1.2 19.3 89 93 94 95Bhutan 2010 0–59 12.7 3.2 33.5 96 93 91 95Bosnia and Herzegovina 2005 0–59 1.4 0.4 10.4 91 90 89 88Cape Verde 2006 6–59 – – – 99 99 99 90Congo, Republic of 2005 0–59 11.4 2.9 30 89 91 90 90Costa Rica 2008–2009 0–59 1.1 5.6 90 86 91 85Djibouti 2010 6–59 22.9 4.9 30.8 89 89 88 87Gabon 2000 0–59 8.4 2.2 25.1 45 45 45 45Georgia 2009 0–59 1.1 0.5 11.3 92 88 91 94Lebanon 2004 0–59 – – – 81 81 81 81Macedonia, FYR – – – – – 95 96 95 95Mauritania 2010 6–59 20.3 3.5 22.5 74 64 64 75Moldova 2005 0–59 3.2 0.5 10.3 95 85 90 93Mongolia 2010 0–59 4.7 2.4 15.9 96 95 96 99Montenegro 2005 0–59 1.7 0.5 7 95 92 94 95Panama 2008 0–59 3.9 – 19.1 86 85 94 87São Tomé and Príncipe 2008–2009 0–59 13.1 3.1 29.3 99 98 98 96Suriname 2006 0–59 7.2 0.7 10.7 85 87 96 86Timor–Leste 2009–2010 0–59 44.7 15.4 58.1 79 72 72 67High-incomeCommonwealth countriesAntigua and Barbuda – – – – – 99 99 98 99Bahamas, The – – – – – 93 96 99 98Barbados – – – – – 85 93 86 91Brunei Darussalam – – – – – 98 99 95 97
(continued)
199

Table 58. Children’s health (continued)
Group/country Prevalence of underweight children under 5 years of age Immunisation DPT rate (% of children age
12–23 months)
Survey yearAge
(months)
Underweight
Moderate/severe (%)
Severe (%)
Stunted/ severe (%) 2008 2009 2010 2011
Cyprus – – – – – 97 99 99 99Malta – – – – – 72 73 76 96St Kitts and Nevis – – – – – 98 97 95 97Trinidad and Tobago 2000 0–59 – – – 90 90 90 90Other countriesBahrain 1995 0–59 – – – 98 98 99 99Croatia 1995–1996 12–71 – – – 96 96 97 96Equatorial Guinea 2004 0–59 11 − 35 33 33 33 33Estonia – – – – – 95 95 94 93Iceland – – – – – 98 96 96 96Ireland – – – – – 93 94 94 95Kuwait 1996 0–59 – – – 99 99 98 99Latvia – – – – – 97 95 89 94Lithuania – – – – – 96 98 95 92Luxembourg – – – – – 99 99 99 99Norway – – – – – 94 94 93 94Oman 2009 0–59 8.6 1 9.8 99 98 99 99Qatar 1995 – – – – 97 99 97 93Slovakia – – – – – 97 96 96 96Uruguay 2002 0–59 5.4 1.6 14.7 94 95 95 95
Note: – = not availableSources: World Bank, World Development Indicators 2013, available at: http://databank.worldbank.org; UNICEF and WHO data,
available at: http://unstats.un.org/unsd/mdg/Metadata.aspx?IndicatorId=0&SeriesId=762 (accessed July 2013)
200

Table 59. Under-five mortality rate per 1,000 births
Group/country 2007 2008 2009 2010 2011 2012
Middle-incomeCommonwealth countriesBelize 21 20 20 19 19 18Botswana 62 62 61 58 56 53Dominica 14 14 13 13 13 13Fiji 22 23 23 23 23 22Grenada 15 14 14 14 14 14Guyana 40 39 38 37 36 35Jamaica 20 19 18 18 17 17Kiribati 65 65 64 63 61 60Lesotho 120 117 113 108 102 100Maldives 19 16 15 13 12 11Mauritius 16 16 15 15 15 15Namibia 57 53 49 45 41 39Nauru – – – – – –Papua New Guinea 72 70 68 67 65 63St Lucia 19 19 19 18 18 18St Vincent and the Grenadines 24 24 24 24 24 23Samoa 19 19 18 18 18 18Seychelles 14 14 14 14 13 13Solomon Islands 35 34 34 33 32 31Swaziland 117 114 106 92 85 80Tonga 15 15 14 14 13 13Tuvalu 35 34 33 32 31 30Vanuatu 21 20 20 19 19 18Other countriesAlbania 20 20 19 18 17 17Armenia 21 20 19 18 17 16Bhutan 55 52 50 48 46 45Bosnia and Herzegovina 9 8 8 8 7 7Cape Verde 27 26 25 24 23 22Congo, Republic of 110 107 105 102 99 96Costa Rica 10 11 10 10 10 10Djibouti 94 91 89 86 83 81Gabon 75 72 70 67 65 62Georgia 24 23 22 22 21 20Lebanon 12 11 11 10 10 9Macedonia, FYR 12 12 11 10 9 7Mauritania 97 94 92 89 87 84Moldova 21 20 19 19 18 18Mongolia 37 34 32 30 29 28Montenegro 9 8 8 7 6 6Panama 22 21 20 20 19 19São Tomé and Príncipe 64 61 59 57 55 53Suriname 25 24 23 22 21 21Timor-Leste 71 68 65 62 59 57High-incomeCommonwealth countriesAntigua and Barbuda 12 11 11 11 10 10Bahamas, The 18 18 18 18 17 17Barbados 20 20 20 19 19 18Brunei Darussalam 9 8 8 8 8 8Cyprus 4 4 4 4 3 3Malta 7 7 7 7 7 7St Kitts and Nevis 11 11 10 10 10 9Trinidad and Tobago 24 23 23 22 21 21
(continued)
201

Table 59. Under-five mortality rate per 1,000 births (continued)
Group/country 2007 2008 2009 2010 2011 2012
Other countriesBahrain 11 11 10 10 10 10Croatia 6 6 6 5 5 5Equatorial Guinea 118 114 111 107 104 100Estonia 6 5 5 4 4 4Iceland 3 3 3 3 2 2Ireland 5 5 4 4 4 4Kuwait 11 11 11 11 11 11Latvia 11 10 10 9 9 9Lithuania 9 8 7 7 6 5Luxembourg 3 3 3 3 2 2Norway 4 4 3 3 3 3Oman 13 12 12 12 12 12Qatar 9 9 9 8 8 7Slovenia 4 4 4 3 3 3Uruguay 13 12 10 9 8 7
Note: – = not availableSource: World Bank, World Development Indicators 2013, available at: http://databank.worldbank.org (accessed July 2013)
202

Tabl
e 60
. Su
mm
ary
stat
isti
cs o
n H
IV/A
IDS
Gro
up/c
ount
ry
Esti
mat
ed n
o. o
f peo
ple
livin
g w
ith
HIV
/AID
S
Esti
mat
ed p
reva
lenc
e
rate
in a
dult
s (1
5–49
)
(%)
Esti
mat
ed to
tal d
eath
s
in a
dult
s an
d ch
ildre
n
Con
dom
use
, pop
ulat
ion
ages
15–
24
Com
preh
ensi
ve c
orre
ct
know
ledg
e of
HIV
/AID
S,
ages
15–
24 (%
of
popu
lati
on)
Rati
o of
sch
ool
atte
ndan
ce o
f
orph
ans
to s
choo
l
atte
ndan
ce o
f
non-
orph
ans
aged
10–
14 y
ears
Ant
iret
rovi
ral
ther
apy
cove
rage
(% o
f peo
ple
wit
h
adva
nced
HIV
infe
ctio
n)
2009
2010
2011
2009
2010
2011
2009
2010
2011
Year
Fem
ale
Year
Mal
eYe
arFe
mal
eYe
arM
ale
Year
Rat
io20
0920
1020
11
Mid
dle-
inco
me
Com
mon
wea
lth c
ount
ries
Bel
ize
3,10
03,
000
3,00
02.
42.
42.
350
050
050
0–
––
––
––
––
–45
–62
Bo
tsw
ana
320,
000
330,
000
330,
000
24.1
23.7
23.4
7,50
05,
400
4,20
0–
––
––
––
––
–90
–95
Do
min
ica
––
––
––
––
––
––
––
––
––
––
––
Fiji
50,0
0048
,000
47,0
000.
10.
10.
110
010
010
0–
––
––
––
––
–93
–87
Gre
nada
48,0
0049
,000
51,0
00–
––
––
–20
0554
2005
68.5
––
––
––
––
–G
uyan
a4,
800
5,40
05,
900
1.2
1.1
1.1
500
500
500
2009
32.1
2009
62.3
2009
54.1
2009
46.6
2009
0.9
72–
82Ja
mai
ca25
,000
25,0
0025
,000
1.8
1.8
1.8
2,10
01,
800
1,60
020
0466
2004
74–
––
––
–50
–60
Kiri
bati
27,0
0029
,000
30,0
00–
––
––
––
––
––
––
––
––
––
Leso
tho
20,0
0019
,000
19,0
0023
23.2
23.3
16,0
0016
,000
14,0
0020
0940
.320
0959
.920
0438
.620
0928
.720
091
50–
58M
aldi
ves
7,10
07,
200
7,20
00.
10.
10.
110
010
010
0–
––
––
––
––
–22
–22
Mau
ritiu
s87
0,00
083
0,00
079
0,00
01
11
1,00
01,
000
1,00
0–
––
––
––
––
–19
–37
Nam
ibia
––
–13
.713
.613
.46,
600
5,70
05,
200
2007
54.8
2007
7820
0759
.420
0752
.920
061
78–
95N
auru
––
––
––
––
––
––
––
––
––
––
––
Pap
ua N
ew G
uine
a26
,000
26,0
0025
,000
0.7
0.7
0.7
1,40
01,
200
1,10
0–
––
––
––
––
–58
–68
St L
ucia
<1,0
00<1
,000
<1,0
00–
––
––
––
––
––
––
––
––
––
St V
ince
nt a
nd th
e
Gre
nadi
nes
2,30
02,
400
2,50
0–
––
––
––
––
––
––
––
––
––
Sam
oa
120,
000
120,
000
120,
000
––
––
––
––
––
––
––
––
––
–Se
yche
lles
––
––
––
––
––
––
––
––
––
––
––
Solo
mo
n Is
land
s–
––
––
––
––
––
––
––
––
––
––
–Sw
azila
nd–
––
25.8
25.9
268,
100
7,80
06,
800
2007
43.5
2007
6620
0752
.120
0752
.320
061
64–
83To
nga
46,0
0044
,000
42,0
00–
––
––
––
––
––
––
––
––
––
Tuva
lu14
,000
14,0
0014
,000
––
––
––
––
––
––
––
––
––
–V
anua
tu4,
800
5,40
05,
900
––
––
––
––
––
––
––
––
––
–O
ther
cou
ntrie
sA
lban
ia–
––
––
––
––
2009
12.6
2009
49.8
2009
35.9
2009
2220
081
––
–A
rmen
ia3,
000
3,20
03,
300
0.2
0.2
0.2
500
500
500
2010
9.2
2010
73.6
2005
22.6
2005
15.1
2010
112
–22
Bhu
tan
<1,0
00<1
,000
<1,0
000.
20.
30.
310
010
010
0–
––
––
––
––
19–
24B
osn
ia a
nd H
erze
govi
na–
––
––
––
––
––
––
––
––
––
––
–C
ape
Ver
de<1
,000
<1,0
00<1
,000
11
150
020
020
0–
––
––
––
––
44–
46C
ong
o, R
epub
lic o
f78
,000
77,0
0076
,000
3.3
3.3
3.3
5,20
04,
800
4,60
020
0921
.620
0939
.820
098.
320
0921
.920
090.
924
–44
Co
sta
Ric
a8,
900
9,30
09,
500
0.3
0.3
0.3
500
500
500
––
––
––
––
––
68–
73D
jibo
uti
9,40
08,
800
8,20
01.
61.
51.
41,
000
1,00
01,
000
––
––
––
––
––
19–
27G
abo
n46
,000
44,0
0042
,000
5.2
5.1
52,
700
2,60
02,
500
––
––
––
––
––
48–
53G
eorg
ia4,
800
5,40
05,
900
0.2
0.2
0.2
100
200
200
––
––
––
––
––
63–
76Le
bano
n–
––
0.1
0.1
0.1
200
200
200
––
––
––
––
––
35–
36
(con
tinue
d)
203

Tabl
e 60
. Su
mm
ary
stat
isti
cs o
n H
IV/A
IDS
(co
ntin
ued)
Gro
up/c
ount
ry
Esti
mat
ed n
o. o
f peo
ple
livin
g w
ith
HIV
/AID
S
Esti
mat
ed p
reva
lenc
e
rate
in a
dult
s (1
5–49
)
(%)
Esti
mat
ed to
tal d
eath
s
in a
dult
s an
d ch
ildre
n
Con
dom
use
, pop
ulat
ion
ages
15–
24
Com
preh
ensi
ve c
orre
ct
know
ledg
e of
HIV
/AID
S,
ages
15–
24 (%
of
popu
lati
on)
Rati
o of
sch
ool
atte
ndan
ce o
f
orph
ans
to s
choo
l
atte
ndan
ce o
f
non-
orph
ans
aged
10–
14 y
ears
Ant
iret
rovi
ral
ther
apy
cove
rage
(% o
f peo
ple
wit
h
adva
nced
HIV
infe
ctio
n)
2009
2010
2011
2009
2010
2011
2009
2010
2011
Year
Fem
ale
Year
Mal
eYe
arFe
mal
eYe
arM
ale
Year
Rat
io20
0920
1020
11
Mac
edo
nia,
FYR
––
––
––
––
––
––
––
––
––
––
––
Mau
ritan
ia12
,000
11,0
0011
,000
11.
11.
11,
200
1,30
01,
500
––
––
––
––
––
21–
21M
old
ova
18,0
0018
,000
18,0
000.
50.
50.
51,
100
1,00
01,
000
2005
22.1
2005
54.5
––
––
2005
119
–29
Mo
ngo
lia<1
,000
<1,0
00<1
,000
0.1
0.1
0.1
100
100
100
––
––
––
––
–15
–27
Mo
nten
egro
––
––
––
––
––
––
––
––
––
––
––
Pan
ama
16,0
0017
,000
17,0
000.
80.
80.
81,
500
1,30
01,
200
––
––
––
––
––
42–
49S
ão T
om
é an
d P
rínci
pe1,
500
1,50
01,
400
11
110
010
010
020
0924
.320
0955
.220
0942
.620
0943
.420
080.
939
–52
Surin
ame
3,70
03,
800
3,90
01.
21.
11
500
500
500
––
––
––
––
––
38–
53T
imo
r-Le
ste
––
––
––
––
––
–20
108.
320
1012
.220
1019
.720
090.
9–
––
Hig
h-in
com
eC
omm
onw
ealth
cou
ntrie
sA
ntig
ua a
nd B
arbu
da–
––
––
––
––
––
––
––
––
––
––
–B
aham
as, T
he6,
900
7,00
07,
000
2.9
2.8
2.8
500
500
500
––
––
––
––
––
––
–B
arba
dos
1,40
01,
500
1,50
00.
90.
90.
910
010
010
0–
––
––
––
––
––
––
Bru
nei D
arus
sala
m–
––
––
––
––
––
––
––
––
––
––
–C
ypru
s–
––
––
––
––
––
––
––
––
––
––
–M
alta
<500
<500
<500
0.1
0.1
0.1
100
100
100
––
––
––
––
––
––
–St
Kitt
s an
d N
evis
––
––
––
––
–20
0748
2007
73.7
––
––
––
––
–Tr
inid
ad a
nd T
oba
go14
,000
14,0
0014
,000
1.5
1.5
1.5
1,00
01,
000
1,00
0–
––
––
––
––
––
––
Oth
er c
ount
ries
Bah
rain
––
––
––
––
––
––
––
––
––
––
––
Cro
atia
<100
<100
<100
00
010
010
010
0–
––
––
––
––
––
––
Equa
toria
l Gui
nea
2,70
02,
900
3,00
04
45
1,00
01,
000
1,00
0–
––
––
––
––
––
––
Esto
nia
7,10
07,
200
7,20
01
11
500
500
500
––
––
––
––
––
––
–Ic
elan
d<5
00<5
00<5
000
00
100
100
100
––
––
––
––
––
––
–Ire
land
[700
6,00
06,
100
00
010
010
010
0–
––
––
––
––
––
––
Kuw
ait
––
––
––
––
––
––
––
––
––
––
––
Latv
ia6,
500
6,40
06,
200
11
150
01,
000
1,00
0–
––
––
––
––
–17
–18
Lith
uani
a<1
,000
<1,0
00<1
,000
00
010
010
010
0–
––
––
––
––
–29
–25
Luxe
mbo
urg
<100
<100
<100
00
010
010
010
0–
––
––
––
––
––
––
No
rway
3,30
03,
400
3,50
00
00
100
100
100
––
––
––
––
––
––
–O
man
2,10
02,
300
2,50
0–
––
––
––
––
––
––
––
––
––
Qat
ar–
––
0–
–10
0–
––
––
––
––
––
––
––
Slo
veni
a<5
00<5
00<5
000
00
100
100
100
––
––
––
––
––
––
–U
rugu
ay13
,000
13,0
0013
,000
11
11,
000
1,00
01,
000
––
––
––
––
––
39–
41
Not
e: –
= n
ot a
vaila
ble
Sou
rces
: Wo
rld B
ank,
Wor
ld D
evel
opm
ent I
ndic
ator
s 20
13, a
vaila
ble
at: h
ttp:
//da
taba
nk.w
orld
bank
.org
; UN
AID
S d
ata,
ava
ilabl
e at
: ww
w.u
naid
s.o
rg/e
n/da
taan
alys
is/d
atat
oo
ls/a
idsi
nfo
; W
TO d
ata,
ava
ilabl
e at
: ww
w.w
ho.in
t/gh
o/h
iv/e
pide
mic
_sta
tus/
case
s_al
l/en/
inde
x.ht
ml (
acce
ssed
Jul
y 20
13)
204

Table 61. Summary statistics on tuberculosis (TB)
Group/country TB death rates, TB mortality (% per 100,000 population)
(upper bound)
Incidence of TB 2011 (per 100,000
population)
TB treatment success rate under DOTS
(2009–2010)
2008 2009 2010 2011 2011 2009 2010
Middle-incomeCommonwealth countriesBelize 4.1 4 4.4 4.6 40 – –Botswana 45 45 42 41 455 79 81Dominica 2.6 3.1 3.6 4.4 13 100 100Fiji 2.7 2.1 2.3 2.2 26 94 67Grenada 1.5 1.4 1.4 1.2 4 50 75Guyana 26 32 34 36 110 70 71Jamaica 0.4 0.4 0.4 0.3 7 70 47Kiribati 10 8.9 7.5 6.2 356 97 93Lesotho 28 28 28 31 632 70 69Maldives 1.9 2.1 2.4 2.9 34 47 82Mauritius 1 1 1 1 21 88 90Namibia 21 20 19 18 723 85 85Nauru 13 11 9 6.2 – – –Papua New Guinea 106 109 108 107 346 72 58St Lucia 2.6 2.5 2.4 2.2 5 57 89St Vincent and the Grenadines 2.3 2.1 1.8 1.6 24 – 0Samoa 2.9 2.8 2.4 2 10 90 100Seychelles 1.3 1.5 1.6 1.9 30 64 100Solomon Islands 37 33 31 29 103 88 87Swaziland 57 63 71 96 1,317 69 73Tonga 5 5 5.2 5.4 16 83 83Tuvalu 98 98 87 84 – – –Vanuatu 21 14 18 16 67 96 80Other countriesAlbania 0.5 0.4 0.4 0.3 13 89 91Armenia 11 12 11 11 55 73 72Bhutan 64 45 22 22 192 92 90Bosnia and Herzegovina 7.2 7.2 7.2 7.2 49 99 –Cape Verde 51 49 47 44 145 – –Congo, Republic of 80 80 79 77 387 78 77Costa Rica 1.2 1 0.9 0.8 12 54 87Djibouti 158 155 144 136 620 79 80Gabon 113 106 92 82 450 55 63Georgia 4.8 4.6 4.4 4.3 125 75 76Lebanon 2.2 2.2 2.6 2.7 15 82 80Macedonia, FYR 2.4 2.1 1.7 1.3 20 90 90Mauritania 143 148 153 159 344 63 69Moldova 19 18 18 18 161 54 57Mongolia 6 5.8 5.6 5.5 223 88 86Montenegro 0.7 0.2 0.2 0.2 17 86 87Panama 6.3 6.4 6.8 6.8 48 80 80São Tomé and Príncipe 20 22 25 28 94 98 78Suriname 2.5 2.7 3.3 3.5 44 66 60Timor-Leste 138 118 112 115 498 – 88High-incomeCommonwealth countriesAntigua and Barbuda 1.4 1.3 0.2 1.1 7 67 33Bahamas, The 0.9 0.8 0.7 0.7 13 81 68Barbados 0.5 0.5 0.1 0.6 – 100 100Brunei Darussalam 3 2.9 2.7 2.7 70 71 81Cyprus 0.2 0.2 0.2 0.1 4 29 –Malta 0.3 0.3 0.3 0.3 9 80 20
(continued)
205

Table 61. Summary statistics on tuberculosis (TB) (continued)
Group/country TB death rates, TB mortality (% per 100,000 population)
(upper bound)
Incidence of TB 2011 (per 100,000
population)
TB treatment success rate under DOTS
(2009–2010)
2008 2009 2010 2011 2011 2009 2010
St Kitts and Nevis 0.3 2.9 2.9 2.9 6 80 100Trinidad and Tobago 2 2.1 2.2 2.2 21 69 76Other countriesBahrain 0.7 0.6 0.6 0.7 18 98 96Croatia 2.5 2.3 2.2 2.1 17 63 75Equatorial Guinea 47 65 70 60 202 66 70Estonia 3.8 3.4 3.1 2.7 25 59 68Iceland 0.3 0.3 0.3 0.3 5 75 88Ireland 0.5 0.5 0.5 0.5 8 67 62Kuwait 0.9 0.9 0.9 0.9 36 85 87Latvia 5.7 5.3 4.7 4.2 42 75 76Lithuania 9.6 9.5 8.9 8.4 59 73 68Luxembourg 0.4 0.3 0.3 0 1 – –Norway 0.1 0.1 0.1 0.2 6 82 –Oman 1.4 1.5 1.3 1.2 14 98 97Qatar 0.2 0.2 0.2 0.2 37 80 67Slovenia 1 1.1 1.1 1.1 9 87 85Uruguay 1.9 1.9 1.7 1.7 21 80 85
Note: – = not availableSources: World Health Organization data available at: www.who.int; Millenium Development Goals Indicators, data available at:
http://mdgs.un.org (accessed July 2013)
206

Tabl
e 62
. En
viro
nmen
t
Gro
up/c
ount
ry
Car
bon
diox
ide
emis
sion
s (t
onne
s pe
r cap
ita)
Fore
st c
hang
e ra
te
Num
ber o
f spe
cies
th
reat
ened
wit
h ex
tinc
tion
(201
2)C
onsu
mpt
ion
of
ozon
e de
plet
ing
subs
tanc
es (t
onne
s)
Prop
orti
on o
f to
tal w
ater
re
sour
ces
used
(% to
tal)
Prop
orti
on o
f te
rres
tria
l and
m
arin
e ar
eas
prot
ecte
d to
te
rrit
oria
l are
a (%
tota
l)ha
%ha
%Pl
ant
2007
2008
2009
2000
–200
520
05–2
009
Mam
mal
Fish
(hig
her)
2009
2010
2100
2005
2010
2009
2010
Mid
dle-
inco
me
Com
mon
wea
lth c
ount
ries
Bel
ize
1.4
1.3
1.2
−10
−0.6
5−1
0−0
.68
830
12.
53.
11.
9–
–30
.93
30.9
3B
ots
wan
a2.
42.
52.
2–
––
–7
29
1111
2.7
––
3.70
3.70
Do
min
ica
2.2
1.9
1.9
–−0
.57
–−0
.59
319
610.
40.
40.
2–
–0.
180.
18Fi
ji1.
41.
31.
03
0.34
30.
346
133
7.6
9.2
14.5
––
0.15
0.15
Gre
nada
2.3
2.4
2.4
––
––
319
210.
80.
80.
2–
–4.
764.
76G
uyan
a2.
12.
12.
1–
––
–10
2820
61.
12.
42.
4–
–7.
347.
34Ja
mai
ca5.
04.
43.
2–
−0.1
–−0
.12
522
–19
.515
.75.
7–
–22
.63
22.6
3K
iriba
ti0.
50.
50.
5–
––
–1
114
–0.
1–
––
0.49
0.49
Leso
tho
––
––
0.47
–0.
462
1–
3.8
3.1
2.5
––
––
Mal
dive
s3.
03.
23.
3–
––
–2
1888
5.1
43.
7–
15.7
0.72
0.72
Mau
ritiu
s3.
13.
13.
0−1
−2.0
5–
0.06
615
2510
.75.
38.
826
.4–
14.6
814
.68
Nam
ibia
1.5
1.9
1.6
−74
−0.9
4−7
4−0
.99
1228
26
10.7
10–
–0.
770.
77N
auru
––
––
––
––
––
––
––
––
–P
apua
New
Gui
nea
0.8
0.5
0.5
−139
−0.4
7−1
42−0
.49
3945
142
3.2
3.3
1.7
––
1.37
1.37
St L
ucia
2.3
2.3
2.2
–0.
13–
–2
204
0.4
01.
1–
–1.
231.
23St
Vin
cent
and
the
Gre
nadi
nes
1.8
1.8
1.8
–0.
23–
0.3
220
20.
40.
20.
3–
–1.
181.
18
Sam
oa
0.9
0.9
0.9
––
––
213
550.
20.
30.
3–
–0.
920.
92Se
yche
lles
7.3
7.8
8.4
––
––
518
31.
41.
30.
9–
–3.
023.
02So
lom
on
Isla
nds
0.4
0.4
0.4
−5−0
.24
−6−0
.25
2018
161.
62.
32
––
0.12
0.12
Swaz
iland
1.0
1.1
1.0
50.
874
0.8
64
29.
55
3.1
––
9.42
9.42
Tong
a1.
71.
71.
7–
––
–2
120
0.1
0.1
0.1
––
0.19
0.19
Tuva
lu–
––
––
––
210
80.
10.
1–
––
0.47
0.47
Van
uatu
0.4
0.5
0.5
––
––
815
00.
10.
50.
1–
–8.
428.
42O
ther
cou
ntrie
sA
lban
ia1.
41.
30.
9−0
.26
30.
34−1
339
15.
46.
56.
53.
1–
7.99
7.99
Arm
enia
1.6
1.8
1.5
−4−1
.42
−4−1
.53
93
224
.97.
17.
536
.8–
28.3
528
.35
Bhu
tan
0.6
0.6
0.6
110.
3411
0.34
273
–0.
30.
30.
3–
0.4
0.58
0.58
(con
tinue
d)
207

(con
tinue
d)
Tabl
e 62
. En
viro
nmen
t (c
onti
nued
)
Gro
up/c
ount
ry
Car
bon
diox
ide
emis
sion
s (t
onne
s pe
r cap
ita)
Fore
st c
hang
e ra
te
Num
ber o
f spe
cies
th
reat
ened
wit
h ex
tinc
tion
(201
2)C
onsu
mpt
ion
of
ozon
e de
plet
ing
subs
tanc
es (t
onne
s)
Prop
orti
on o
f to
tal w
ater
re
sour
ces
used
(% to
tal)
Prop
orti
on o
f te
rres
tria
l and
m
arin
e ar
eas
prot
ecte
d to
te
rrit
oria
l are
a (%
tota
l)ha
%ha
%Pl
ant
2007
2008
2009
2000
–200
520
05–2
009
Mam
mal
Fish
(hig
her)
2009
2010
2100
2005
2010
2009
2010
Bo
snia
and
H
erze
govi
na7.
78.
38.
0–
––
–4
313
5.8
3.5
3.4
0.9
0.9
0.16
0.16
Cap
e V
erde
0.6
0.6
0.6
–0.
36–
0.36
324
371.
80.
30.
3–
–9.
689.
68C
ong
o, R
epub
lic o
f0.
40.
40.
5−1
7−0
.08
−12
−0.0
511
4511
37.
310
.610
.6–
–17
.64
17.6
4C
ost
a R
ica
1.9
1.9
1.8
230.
9523
0.9
950
221
1.5
180.
912
7.9
––
0.05
0.05
Djib
out
i0.
60.
60.
6–
––
–8
1711
921
1.5
180.
912
7.9
––
14.5
814
.58
Gab
on
1.6
1.6
1.1
––
––
1461
029
.730
.646
0.1
–3.
393.
39G
eorg
ia1.
41.
41.
3−3
−0.0
9−3
−0.0
910
90
4.6
5.9
4.3
2.9
–16
.38
16.3
8Le
bano
n3.
74.
15.
01
0.83
n.s.
0.06
1022
158
.488
.692
.318
.6–
14.4
014
.40
Mac
edo
nia,
FYR
5.6
5.8
5.5
30.
355
0.47
513
0–
––
16.1
–1.
131.
13M
aurit
ania
0.6
0.6
0.6
––
––
1632
2720
.420
.520
.511
.8–
20.5
920
.59
Mo
ldo
va1.
31.
31.
3–
––
–4
82
––
––
–1.
381.
38M
ong
olia
4.0
4.1
5.3
––
––
112
–1.
91.
51.
21.
61.
613
.39
13.3
9M
ont
eneg
ro5.
97.
94.
8–
––
–6
252
0.9
0.6
0.7
––
11.4
811
.48
Pan
ama
1.9
2.0
2.3
−12
−0.3
5−1
2−0
.36
1541
191
2524
.623
.8–
–11
.49
11.4
9S
ão T
om
é an
d P
rínci
pe0.
80.
80.
80
00
05
1434
0.2
0.3
0.3
––
––
Surin
ame
4.8
4.8
4.8
00
−4−0
.02
826
262.
71.
34
––
12.1
912
.19
Tim
or-
Lest
e0.
20.
20.
2−1
1−1
.35
−11
−1.4
44
51
0.9
0.5
0.2
14.3
–6.
366.
36H
igh-
inco
me
Com
mon
wea
lth c
ount
ries
Ant
igua
and
Bar
buda
5.1
5.1
5.3
–−0
.4–
–2
184
0.5
0.1
0.4
11.8
–0.
980.
98B
aham
as, T
he7.
47.
47.
60
0–
–6
295
3.5
6.1
3.1
––
1.01
1.01
Bar
bado
s5.
35.
55.
80
0–
–3
202
5.1
2.3
2.7
108
–0.
070.
07B
rune
i Dar
ussa
lam
25.3
27.6
23.7
−2−0
.41
−2−0
.47
347
985.
86.
98.
1–
–29
.58
29.5
8C
ypru
s7.
77.
97.
5–
0.14
–0.
045
1916
––
––
18.4
4.54
4.54
Mal
ta6.
76.
26.
0–
––
–3
174
––
––
–1.
671.
67St
Kitt
s an
d N
evis
4.9
4.9
5.0
––
––
219
50.
40.
60.
5–
–2.
042.
04Tr
inid
ad a
nd T
oba
go26
.435
.435
.8−1
−0.3
1−1
−0.3
22
251
38.5
54.1
34.3
––
9.60
9.60
Oth
er c
ount
ries
Bah
rain
24.2
23.1
20.7
–3.
84–
3.26
38
–55
.658
.757
.320
5.8
–0.
740.
74C
roat
ia5.
55.
34.
94
0.19
30.
187
606
53.
44.
8–
0.6
9.55
9.55
208

Tabl
e 62
. En
viro
nmen
t (c
onti
nued
)
Gro
up/c
ount
ry
Car
bon
diox
ide
emis
sion
s (t
onne
s pe
r cap
ita)
Fore
st c
hang
e ra
te
Num
ber o
f spe
cies
th
reat
ened
wit
h ex
tinc
tion
(201
2)C
onsu
mpt
ion
of
ozon
e de
plet
ing
subs
tanc
es (t
onne
s)
Prop
orti
on o
f to
tal w
ater
re
sour
ces
used
(% to
tal)
Prop
orti
on o
f te
rres
tria
l and
m
arin
e ar
eas
prot
ecte
d to
te
rrit
oria
l are
a (%
tota
l)ha
%ha
%Pl
ant
2007
2008
2009
2000
–200
520
05–2
009
Mam
mal
Fish
(hig
her)
2009
2010
2100
2005
2010
2009
2010
Equa
toria
l Gui
nea
7.4
7.3
7.1
−12
−0.6
7−1
2−0
.71
1928
676.
26.
45.
7–
–14
.02
14.0
2Es
toni
a14
.913
.711
.92
0.08
−7−0
.31
15
0–
––
14–
22.5
622
.56
Icel
and
7.5
7.0
6.4
16.
661
3.32
612
–1.
8–
–0.
1–
13.1
813
.18
Irela
nd10
.29.
89.
312
1.82
91.
245
211
––
––
–1.
211.
21K
uwai
t30
.731
.330
.3–
2.73
–2.
46
11–
426.
143
9.1
397.
8–
–1.
111.
11La
tvia
3.5
3.3
3.0
110.
3411
0.34
16
1–
––
––
0.36
0.36
Lith
uani
a4.
54.
53.
8–
––
–3
60
––
–9.
6–
4.87
4.87
Luxe
mbo
urg
22.4
21.8
20.4
00
00
01
––
––
––
20.0
520
.05
No
rway
9.6
10.6
9.7
760.
8176
0.78
719
2−5
.11.
6−0
.20.
8–
10.8
610
.86
Om
an17
.716
.015
.20
00
09
276
32.1
32.2
34.8
83.9
–9.
319.
31Q
atar
57.1
48.6
44.0
0–
0–
311
–79
.794
.196
.638
1–
1.39
1.39
Slo
veni
a8.
08.
57.
52
0.16
20.
164
29–
––
–2.
93
13.0
713
.07
Uru
guay
1.8
2.5
2.4
221.
4845
2.79
1136
036
.830
.623
.6–
–0.
270.
27
Not
e: –
= n
ot a
vaila
ble
Sou
rces
: Wo
rld B
ank,
Wor
ld D
evel
opm
ent I
ndic
ator
s 20
13, a
vaila
ble
at: h
ttp:
//da
taba
nk.w
orld
bank
.org
; Fo
od
and
Agr
icul
ture
Org
anis
atio
n, a
vaila
ble
at: w
ww
.fao
.org
/fo
rest
ry/f
oris
/web
view
/fo
rest
ry2/
inde
x.js
p?si
teId
=683
3&si
tetr
eeId
=320
38&
lang
Id=1
&ge
oId
=0; M
DG
Indi
cato
rs, a
vaila
ble
at: h
ttp:
//un
stat
s.un
.org
/uns
d/m
dg/D
ata.
aspx
(acc
esse
d o
n Ju
ly 2
013)
209

Tabl
e 63
. M
ain
indi
cato
rs o
f int
erne
t co
mm
unic
atio
ns
Gro
up/c
ount
ryIn
tern
et u
sers
(p
er 1
,000
peo
ple)
Sec
ure
inte
rnet
ser
vers
(p
er 1
,000
,000
peo
ple)
Fixe
d br
oadb
and
inte
rnet
su
bscr
iber
s (p
er 1
00 p
eopl
e)
2008
2009
2010
2011
2009
2010
2011
2012
2008
2009
2010
2011
Mid
dle-
inco
me
Com
mon
wea
lth c
ount
ries
Bel
ize
11.3
11.7
14.0
–10
2.0
104.
010
7.0
92.0
2.7
2.7
2.9
3.1
Bo
tsw
ana
6.3
6.2
6.0
7.0
7.0
17.0
18.0
23.0
0.5
0.5
0.6
0.8
Do
min
ica
41.2
42.0
47.5
51.3
15.0
22.0
31.0
35.0
10.3
10.7
12.3
–Fi
ji13
.017
.020
.028
.024
.026
.032
.031
.01.
51.
52.
72.
7G
rena
da23
.224
.133
.5–
6.0
9.0
8.0
5.0
8.6
11.9
13.8
–G
uyan
a18
.223
.929
.932
.06.
05.
07.
05.
00.
70.
91.
52.
6Ja
mai
ca23
.624
.327
.731
.596
.010
6.0
131.
013
9.0
3.6
4.1
4.3
3.9
Kiri
bati
7.0
9.0
9.1
10.0
1.0
1.0
––
––
–0.
1Le
soth
o3.
63.
73.
94.
2–
1.0
1.0
1.0
0.7
0.8
0.8
0.9
Mal
dive
s23
.224
.828
.334
.010
.017
.027
.030
.05.
04.
94.
86.
4M
aurit
ius
21.8
22.5
28.3
35.0
79.0
111.
015
0.0
174.
03.
65.
37.
28.
9N
amib
ia5.
36.
511
.612
.019
.032
.046
.045
.00.
00.
00.
40.
8N
auru
––
––
––
––
––
––
Pap
ua N
ew G
uine
a1.
21.
61.
32.
010
.022
.048
.052
.0–
0.1
0.1
0.1
St L
ucia
32.0
36.0
40.0
42.0
15.0
22.0
21.0
17.0
9.1
10.8
11.8
12.1
St V
ince
nt a
nd th
e G
rena
dine
s21
.031
.038
.543
.011
.012
.014
.021
.08.
610
.511
.412
.9S
amo
a5.
06.
07.
0–
4.0
4.0
4.0
5.0
0.1
0.1
0.1
–Se
yche
lles
40.4
41.0
43.2
69.0
100.
011
6.0
99.0
3.2
4.6
7.3
10.4
Solo
mo
n Is
land
s3.
04.
05.
06.
01.
02.
04.
04.
00.
30.
40.
40.
4Sw
azila
nd6.
98.
911
.018
.15.
012
.016
.08.
00.
10.
10.
10.
2To
nga
8.1
10.0
16.0
25.0
3.0
2.0
3.0
3.0
0.7
1.0
1.1
1.2
Tuva
lu15
.020
.025
.030
.0–
––
–3.
01.
02.
44.
6V
anua
tu7.
37.
58.
0–
44.0
51.0
54.0
32.0
0.1
0.2
0.2
0.1
Oth
er c
ount
ries
Alb
ania
23.9
41.2
45.0
49.0
22.0
27.0
44.0
60.0
2.0
2.9
3.3
4.0
Arm
enia
6.2
15.3
25.0
32.0
23.0
54.0
86.0
80.0
0.4
1.0
2.8
5.0
Bhu
tan
6.6
7.2
13.6
21.0
3.0
3.0
4.0
9.0
0.3
0.5
1.2
1.8
Bo
snia
and
Her
zego
vina
34.7
37.7
52.0
60.0
32.0
60.0
76.0
99.0
5.0
6.3
8.2
9.7
Cap
e V
erde
20.0
25.0
30.0
32.0
6.0
7.0
8.0
12.0
1.7
2.5
3.2
4.3
Co
ngo,
Rep
ublic
of
4.3
4.5
5.0
5.6
2.0
5.0
5.0
6.0
0.0
0.0
0.0
0.0
Co
sta
Ric
a32
.334
.336
.542
.145
0.0
502.
052
6.0
456.
02.
43.
96.
28.
7D
jibo
uti
2.3
4.0
6.5
7.0
4.0
5.0
5.0
4.0
0.3
0.6
0.9
1.2
Gab
on
6.2
6.7
7.2
8.0
10.0
12.0
13.0
18.0
0.2
0.3
0.3
0.3
Geo
rgia
10.0
20.1
26.9
36.6
37.0
53.0
84.0
117.
02.
63.
45.
87.
5Le
bano
n22
.530
.143
.752
.065
.012
1.0
175.
021
5.0
4.7
4.7
4.7
5.2
Mac
edo
nia,
FYR
46.0
51.8
51.9
56.7
34.0
50.0
59.0
83.0
8.8
10.6
11.5
12.6
(con
tinue
d)
210

Tabl
e 63
. M
ain
indi
cato
rs o
f int
erne
t co
mm
unic
atio
ns (c
onti
nued
)
Gro
up/c
ount
ryIn
tern
et u
sers
(p
er 1
,000
peo
ple)
Sec
ure
inte
rnet
ser
vers
(p
er 1
,000
,000
peo
ple)
Fixe
d br
oadb
and
inte
rnet
su
bscr
iber
s (p
er 1
00 p
eopl
e)
2008
2009
2010
2011
2009
2010
2011
2012
2008
2009
2010
2011
Mau
ritan
ia1.
92.
34.
04.
57.
07.
07.
07.
00.
20.
20.
20.
2M
old
ova
23.4
27.5
32.3
38.0
35.0
48.0
70.0
82.0
3.2
5.2
7.5
10.0
Mo
ngo
lia12
.512
.612
.920
.022
.029
.038
.054
.01.
21.
42.
63.
2M
ont
eneg
ro32
.935
.137
.540
.012
.016
.016
.019
.05.
48.
48.
3–
Pan
ama
33.8
39.1
40.1
42.7
296.
044
6.0
511.
050
9.0
5.8
6.8
7.3
7.9
São
To
mé
and
Prín
cipe
15.5
16.4
18.8
20.2
2.0
3.0
3.0
12.0
0.2
0.3
0.3
0.4
Surin
ame
21.1
31.4
31.6
32.0
10.0
11.0
18.0
20.0
1.1
1.6
3.0
4.6
Tim
or-
Lest
e0.
20.
20.
20.
9–
1.0
3.0
–0.
00.
00.
00.
0H
igh-
inco
me
Com
mon
wea
lth c
ount
ries
Ant
igua
and
Bar
buda
75.0
74.2
80.0
82.0
–96
.096
.0–
5.7
7.3
8.0
6.7
Bah
amas
, The
31.5
33.9
43.0
65.0
90.0
127.
014
6.0
118.
07.
69.
37.
24.
5B
arba
dos
66.5
68.7
70.2
71.8
80.0
90.0
110.
010
6.0
18.1
21.0
20.6
22.1
Bru
nei D
arus
sala
m46
.049
.053
.056
.017
.026
.046
.046
.04.
45.
15.
45.
7C
ypru
s42
.349
.853
.057
.748
1.0
925.
012
52.0
888.
013
.716
.117
.618
.9M
alta
50.1
58.9
63.0
69.2
409.
057
0.0
696.
068
1.0
23.0
26.5
29.2
30.9
St K
itts
and
Nev
is60
.069
.076
.0–
–66
.064
.098
.021
.725
.127
.9–
Trin
idad
and
To
bago
34.8
44.3
48.5
55.2
62.0
97.0
115.
012
9.0
6.4
9.4
10.8
11.5
Oth
er c
ount
ries
Bah
rain
52.0
53.0
55.0
77.0
75.0
123.
015
6.0
179.
07.
36.
55.
413
.8C
roat
ia50
.656
.360
.370
.751
7.0
746.
099
0.0
1046
.011
.915
.518
.319
.6Eq
uato
rial G
uine
a1.
82.
16.
0–
1.0
2.0
2.0
1.0
––
0.2
–Es
toni
a70
.672
.574
.176
.542
2.0
582.
071
4.0
884.
021
.022
.423
.324
.8Ic
elan
d91
.093
.095
.095
.054
6.0
803.
096
5.0
1005
.033
.433
.233
.433
.9Ire
land
65.3
67.4
69.9
76.8
3312
.044
72.0
5180
.046
03.0
17.7
19.7
21.1
22.0
Kuw
ait
42.0
50.8
61.4
74.2
238.
038
0.0
505.
058
2.0
1.6
1.7
1.7
–La
tvia
63.4
66.8
68.4
71.7
258.
038
8.0
457.
055
6.0
17.4
19.3
19.3
20.4
Lith
uani
a55
.259
.862
.165
.140
5.0
584.
077
5.0
815.
015
.816
.920
.622
.1Lu
xem
bour
g82
.287
.390
.690
.953
6.0
716.
096
9.0
1054
.029
.431
.433
.232
.9N
orw
ay90
.692
.193
.494
.048
81.0
8073
.089
66.0
9430
.032
.433
.834
.635
.4O
man
20.0
51.5
62.0
68.0
–77
.015
2.0
186.
01.
21.
51.
61.
8Q
atar
44.3
53.1
81.6
86.2
90.0
150.
023
6.0
289.
07.
58.
88.
18.
7S
love
nia
58.0
64.0
70.0
72.0
429.
062
2.0
889.
011
46.0
21.1
22.2
23.5
24.3
Uru
guay
39.3
41.8
46.4
51.4
119.
015
1.0
237.
027
3.0
6.8
9.0
10.9
13.5
Not
e: –
= n
ot a
vaila
ble
Sou
rce:
Wo
rld B
ank,
Wor
ld D
evel
opm
ent 2
013,
dat
a av
aila
ble
at: h
ttp:
//da
taba
nk.w
orld
bank
.org
(acc
esse
d Ju
ne 2
013)
211

Tabl
e 64
. M
ain
indi
cato
rs o
f tel
epho
ne c
omm
unic
atio
ns
Gro
up/c
ount
ryM
obile
cel
lula
r sub
scri
ptio
ns p
er 1
00
inha
bita
nts
Popu
lati
on c
over
ed
by m
obile
cel
lula
r ne
twor
k (%
)
Mob
ile c
ellu
lar
tari
ff
(US
$ pe
r mon
th)
Tele
phon
e lin
es
per 1
00 p
opul
atio
n
2008
2009
2010
2011
2008
2011
2011
2008
2009
2011
Mid
dle-
inco
me
Com
mon
wea
lth c
ount
ries
Bel
ize
53.5
53.0
62.3
70.0
––
31.0
9.7
9.4
9.0
Bo
tsw
ana
76.0
94.6
117.
814
2.8
99.0
96.0
13.2
7.3
6.9
7.0
Do
min
ica
133.
514
5.0
155.
816
4.0
–90
.017
.725
.724
.323
.0Fi
ji71
.175
.181
.183
.7–
–19
.815
.316
.015
.0G
rena
da57
.910
9.9
116.
7–
––
17.1
27.6
27.2
27.0
Guy
ana
59.6
64.9
70.8
69.9
–97
.08.
418
.519
.520
.0Ja
mai
ca10
0.1
108.
211
6.1
108.
110
1.2
–12
.911
.811
.210
.0K
iriba
ti1.
010
.110
.613
.6–
–18
.71.
91.
98.
0Le
soth
o27
.930
.845
.556
.2–
75.0
22.0
4.1
4.1
2.0
Mal
dive
s14
1.6
146.
815
6.5
165.
710
0.0
100.
06.
815
.315
.78.
0M
aurit
ius
80.5
84.1
91.7
99.0
99.0
99.0
6.7
28.7
29.4
29.0
Nam
ibia
47.8
72.8
85.5
96.4
–10
0.0
14.1
6.4
6.3
7.0
Nau
ru–
––
––
––
––
–P
apua
New
Gui
nea
13.3
21.1
27.8
34.2
––
23.3
1.0
1.4
2.0
St L
ucia
102.
611
0.0
113.
712
3.0
–10
0.0
21.2
24.1
23.8
20.0
St V
ince
nt a
nd th
e G
rena
dine
s11
9.2
110.
812
0.5
120.
510
0.0
100.
016
.820
.921
.121
.0S
amo
a68
.282
.891
.4–
–17
.615
.817
.519
.0Se
yche
lles
109.
212
8.6
135.
914
5.7
98.0
98.0
17.4
25.7
29.9
32.0
Solo
mo
n Is
land
s5.
99.
527
.949
.8–
––
1.6
1.6
2.0
Swaz
iland
46.2
56.9
61.2
63.7
91.0
95.0
24.3
3.8
3.8
6.0
Tong
a49
.051
.252
.252
.6–
–11
.024
.829
.929
.0Tu
valu
10.2
16.3
21.6
––
–15
.317
.315
.0V
anua
tu15
.856
.370
.955
.8–
90.0
25.4
4.6
3.1
3.0
Oth
er c
ount
ries
Alb
ania
58.5
77.2
84.0
96.4
99.3
99.0
25.8
10.8
11.4
11.0
Arm
enia
46.8
71.0
125.
010
3.6
–99
.08.
820
.320
.419
.0B
huta
n36
.147
.554
.365
.6–
100.
03.
63.
93.
74.
0B
osn
ia a
nd H
erze
govi
na84
.286
.582
.784
.599
.310
0.0
15.9
27.3
26.5
25.0
Cap
e V
erde
57.0
59.1
75.0
79.2
96.0
96.0
31.7
14.7
14.6
15.0
Co
ngo,
Rep
ublic
of
47.1
74.8
92.0
93.8
––
–0.
60.
60.
0C
ost
a R
ica
41.7
42.5
65.1
92.2
69.2
70.0
3.4
31.8
32.7
26.0
Djib
out
i13
.214
.818
.621
.385
.095
.013
.01.
71.
92.
0G
abo
n89
.692
.910
6.9
117.
3–
––
1.8
1.8
1.0
Geo
rgia
62.7
64.9
91.4
102.
398
.099
.010
.214
.114
.131
.0
(con
tinue
d)
212

Tabl
e 64
. M
ain
indi
cato
rs o
f tel
epho
ne c
omm
unic
atio
ns (c
onti
nued
)
Gro
up/c
ount
ryM
obile
cel
lula
r sub
scri
ptio
ns
per 1
00 in
habi
tant
s
Popu
lati
on c
over
ed
by m
obile
cel
lula
r ne
twor
k (%
)
Mob
ile c
ellu
lar
tari
ff
(US
$ pe
r mon
th)
Tele
phon
e lin
es
per 1
00 p
opul
atio
n
2008
2009
2010
2011
2008
2011
2011
2008
2009
2011
Leba
non
34.2
57.0
68.0
78.6
–97
.019
.018
.019
.221
.0M
aced
oni
a, F
YR95
.994
.510
4.5
107.
2–
100.
019
.122
.321
.320
.0M
aurit
ania
63.5
64.6
80.2
93.6
62.0
–14
.42.
32.
22.
0M
old
ova
66.7
77.3
88.6
104.
8–
–12
.631
.231
.933
.0M
ong
olia
66.1
82.9
91.1
105.
165
.788
.03.
67.
57.
07.
0M
ont
eneg
ro18
4.1
205.
318
5.3
––
100.
016
.5–
–27
.0P
anam
a11
4.9
175.
218
9.0
188.
683
.292
.09.
415
.415
.516
.0S
ão T
om
é an
d P
rínci
pe31
.649
.762
.168
.3–
90.0
12.7
4.8
4.7
5.0
Surin
ame
127.
614
6.9
169.
617
8.9
––
14.3
14.7
16.1
16.0
Tim
or-
Lest
e11
.631
.953
.453
.2–
–16
.60.
20.
20.
0H
igh-
inco
me
Com
mon
wea
lth c
ount
ries
Ant
igua
and
Bar
buda
157.
215
3.7
189.
319
6.4
–10
0.0
25.3
43.7
42.5
40.0
Bah
amas
, The
107.
310
6.0
124.
986
.110
0.0
100.
017
.539
.838
.138
.0B
arba
dos
106.
112
3.6
128.
112
7.0
–99
.021
.255
.149
.851
.0B
rune
i Dar
ussa
lam
103.
710
5.4
109.
110
9.2
––
18.3
21.0
20.6
20.0
Cyp
rus
94.4
89.6
93.7
97.7
100.
010
0.0
7.9
38.4
38.0
36.0
Mal
ta93
.210
1.7
109.
412
4.9
100.
010
0.0
20.6
58.5
59.3
56.0
St K
itts
and
Nev
is14
5.8
145.
915
2.7
––
–15
.139
.939
.638
.0Tr
inid
ad a
nd T
oba
go13
5.7
138.
214
1.2
135.
6–
100.
013
.723
.722
.722
.0O
ther
cou
ntrie
sB
ahra
in13
6.9
119.
912
4.2
128.
0–
100.
015
.020
.920
.321
.0C
roat
ia10
3.1
106.
011
1.9
116.
410
0.0
100.
03.
442
.442
.040
.0Eq
uato
rial G
uine
a27
.229
.457
.059
.1–
––
37.2
36.8
2.0
Esto
nia
121.
011
7.1
123.
213
9.0
100.
010
0.0
23.3
1.5
1.5
35.0
Icel
and
108.
510
7.7
106.
510
6.1
99.0
99.0
17.9
62.9
59.7
59.0
Irela
nd11
6.0
106.
610
5.2
108.
499
.099
.037
.350
.247
.845
.0K
uwai
t58
.998
.914
5.4
175.
1–
100.
07.
821
.220
.918
.0La
tvia
101.
210
1.9
102.
410
2.9
––
12.5
26.2
24.9
23.0
Lith
uani
a14
9.5
148.
514
7.2
151.
310
0.0
100.
09.
623
.422
.422
.0Lu
xem
bour
g14
5.2
144.
714
3.3
148.
399
.910
0.0
26.0
53.3
53.0
54.0
No
rway
109.
011
0.8
114.
711
5.6
––
14.6
39.8
36.9
31.0
Om
an12
2.1
146.
416
5.5
169.
096
.498
.08.
711
.611
.110
.0Q
atar
102.
412
2.0
124.
312
3.1
100.
010
0.0
18.7
19.0
18.0
16.0
Slo
veni
a10
1.8
103.
810
4.5
106.
699
.610
0.0
23.9
48.6
45.5
43.0
Uru
guay
104.
812
2.5
131.
714
0.8
100.
010
0.0
21.4
28.8
28.5
29.0
Not
e: –
= n
ot a
vaila
ble
Sou
rce:
Wo
rld B
ank,
Sta
te o
f the
Mar
ket 2
013:
Pow
er a
nd C
omm
unic
atio
ns, a
vaila
ble
at: h
ttp:
//w
di.w
orld
bank
.org
/tab
le/5
.11
(acc
esse
d A
pril 2
013)
213

Tabl
e 65
. Tr
ansp
ort
Gro
up/c
ount
ryRo
ads:
tota
l net
wor
k (k
m)
Air
: num
ber o
f reg
iste
red
carr
ier d
epar
ture
sLi
ner S
hipp
ing
Con
nect
ivit
y In
dex
(max
imum
val
ue)
2008
2009
2010
2008
2009
2010
2011
2008
2009
2010
2011
2012
Mid
dle-
inco
me
Com
mon
wea
lth c
ount
ries
Bel
ize
––
––
–19
,855
31,7
552
24
410
Bo
tsw
ana
––
–6,
105
6,14
27,
681
7,91
0–
––
––
Do
min
ica
–1,
646
1,51
2–
––
–2
32
22
Fiji
––
–46
,467
45,5
9526
,127
17,8
1210
99
912
Gre
nada
––
––
––
–4
44
44
Guy
ana
––
––
–9,
351
12,2
314
44
44
Jam
aica
22,1
2122
,121
22,1
2122
,894
16,8
408,
547
3,45
418
2033
2822
Kiri
bati
––
––
––
–3
33
33
Leso
tho
––
––
––
––
––
––
Mal
dive
s–
––
5,00
64,
971
5,17
0–
55
22
2M
aurit
ius
2,02
82,
066
11,7
4211
,144
11,7
5012
,353
1715
1715
24N
amib
ia–
42,1
0044
,138
5,45
05,
439
8,56
69,
383
1114
1412
15N
auru
––
––
––
––
––
––
Pap
ua N
ew G
uine
a–
––
21,7
5121
,450
32,7
4136
,364
77
69
7St
Luc
ia–
––
––
––
44
44
5St
Vin
cent
and
the
Gre
nadi
nes
––
––
––
–5
44
44
Sam
oa
12,6
9912
,492
4,37
83,
578
75
55
4Se
yche
lles
508
508
508
11,8
9611
,238
12,9
8913
,139
45
56
7So
lom
on
Isla
nds
––
–13
,649
13,5
297,
851
7,38
94
46
66
Swaz
iland
––
––
––
––
––
––
Tong
a–
––
––
––
44
44
3Tu
valu
––
––
––
––
––
––
Van
uatu
––
–1,
775
1,66
711
,381
10,7
454
44
44
Oth
er c
ount
ries
Alb
ania
––
–5,
058
5,14
09,
412
11,1
142
24
51
Arm
enia
7,70
47,
705
7,70
56,
681
7,63
28,
761
5,56
1–
––
––
Bhu
tan
5,36
35,
983
6,92
02,
772
2,70
62,
353
3,19
5–
––
––
Bo
snia
and
Her
zego
vina
–22
,703
22,7
031,
004
1,35
91,
664
1,12
1–
––
––
Cap
e V
erde
––
–12
,236
11,5
6010
,363
10,6
584
54
44
Co
ngo,
Rep
ublic
of
––
––
–3,
470
4,45
112
1110
1113
Co
sta
Ric
a38
,049
39,0
3939
,018
36,7
8633
,285
30,2
2131
,356
1315
1311
14D
jibo
uti
––
––
––
–10
1820
2117
Gab
on
––
–5,
654
5,42
35,
654
1,14
69
99
89
Geo
rgia
–18
,608
19,1
095,
487
5,05
45,
502
6,27
14
44
45
(con
tinue
d)
214

Tabl
e 65
. Tr
ansp
ort
(con
tinu
ed)
Gro
up/c
ount
ryRo
ads:
tota
l net
wor
k (k
m)
Air
: num
ber o
f reg
iste
red
carr
ier d
epar
ture
sLi
ner S
hipp
ing
Con
nect
ivit
y In
dex
(max
imum
val
ue)
2008
2009
2010
2008
2009
2010
2011
2008
2009
2010
2011
2012
Leba
non
––
–12
,306
13,5
3219
,882
21,2
8829
3030
3543
Mac
edo
nia,
FYR
13,9
2213
,940
13,9
342,
813
1,38
91,
367
––
––
––
Mau
ritan
ia10
,560
10,6
281,
159
1,11
41,
884
3,36
68
76
68
Mo
ldo
va12
,778
12,7
7912
,837
4,93
35,
047
5,60
36,
014
––
––
–M
ong
olia
11,2
1811
,218
5,59
24,
783
5,33
15,
996
––
––
–M
ont
eneg
ro7,
404
7,62
47,
763
––
––
30
44
1P
anam
a13
,727
13,9
7415
,137
46,2
9266
,236
56,6
2662
,437
3033
4138
42S
ão T
om
é an
d P
rínci
pe–
––
1,14
21,
143
1,18
7–
32
32
2Su
rinam
e–
––
4,90
04,
560
1,92
5–
44
44
4T
imo
r-Le
ste
––
––
––
––
––
––
Hig
h-in
com
e–
––
––
––
––
––
–C
omm
onw
ealth
cou
ntrie
s–
––
––
––
––
––
–A
ntig
ua a
nd B
arbu
da–
––
28,3
5626
,371
39,8
6536
,534
43
22
2B
aham
as, T
he–
––
33,4
3330
,267
23,2
4225
,300
1619
2625
27B
arba
dos
––
–5
54
65
Bru
nei D
arus
sala
m2,
972
3,06
43,
029
13,0
7112
,274
12,3
3311
,705
44
55
4C
ypru
s12
,321
12,3
8012
,483
19,3
9918
,556
15,3
1812
,509
1213
1617
16M
alta
3,09
6–
–17
,334
18,3
6216
,828
14,7
0330
3838
4145
St K
itts
and
Nev
is–
––
––
––
63
33
3Tr
inid
ad a
nd T
oba
go–
––
15,0
1714
,247
28,9
0936
,648
1316
1618
19O
ther
cou
ntrie
sB
ahra
in3,
942
4,08
34,
122
–69
,808
62,4
7358
,946
68
810
18C
roat
ia29
,248
29,3
4329
,333
24,7
2824
,613
24,7
6626
,743
158
922
21Eq
uato
rial G
uine
a–
––
––
––
44
44
5Es
toni
a58
,399
58,3
8358
,412
11,4
788,
592
9,88
310
,927
56
66
5Ic
elan
d12
,870
12,8
8912
,862
12,4
3112
,924
12,5
2614
,156
55
55
5Ire
land
96,4
24–
–48
3,74
152
8,09
860
1,26
263
2,83
08
89
613
Kuw
ait
6,34
26,
524
6,60
817
,999
18,1
9135
,975
29,7
646
78
67
Latv
ia69
,686
69,5
7468
,941
28,9
1527
,123
54,5
8954
,241
65
66
5Li
thua
nia
81,0
3081
,331
82,1
3112
,238
11,6
336,
253
3,06
58
810
1010
Luxe
mbo
urg
––
2,88
047
,639
51,9
3241
,751
41,0
38–
––
––
No
rway
93,2
4793
,853
93,5
09–
110,
396
324,
685
353,
129
88
87
5O
man
53,4
3056
,361
––
25,5
4232
,850
38,6
4330
4549
4947
Qat
ar–
9,96
69,
830
68,8
1877
,178
90,8
1910
9,52
53
28
47
Slo
veni
a38
,872
38,9
2539
,026
24,4
7725
,478
21,8
4021
,370
1620
2122
22U
rugu
ay–
––
9,38
88,
731
19,0
86–
2322
2424
32
Not
e: –
= n
ot a
vaila
ble
Sou
rce:
Wo
rld B
ank,
Wor
ld D
evel
opm
ent I
ndic
ator
s 20
13, a
vaila
ble
at: h
ttp:
//da
taba
nk.w
orld
bank
.org
(acc
esse
d Ju
ly 2
013)
215