smallsats by the numbers 2021 - brycetech.com
TRANSCRIPT

1
Smallsats by the Numbers 2021

2
Introduction
Smaller satellites are of increasing interest; growing use in recent years
Bryce’s Smallsats by the Numbers presents historical information on smaller satellites launched 2011 – 2020 (regardless of operational status)
Definition used here, 600 kg and under, reflects the five smallest mass classes defined by the FAA
‘Smallsat’ or ‘very small satellite’ are often used to refer to smaller satellites
Due to the large quantity of LEO broadband telecommunications smallsats launched in 2020, this report provides data views that both exclude and include LEO broadband telecommunications smallsat systems that have launched operational satellites as of 2020 to provide insight into trends in other types of systems
Mass Class Name Kilograms (kg)
Femto 0.01 – 0.09
Pico 0.1 – 1
Nano 1.1 – 10
Micro 11 – 200
Mini 201 – 600
Small 601 – 1,200
Medium 1,201 – 2,500
Intermediate 2,501 – 4,200
Large 4,201 – 5,400
Heavy 5,401 – 7,000
Extra Heavy > 7,001
From FAA The Annual Compendium of Commercial
Space Transportation: 2018
Sm
alls
ats

3
2020 Smallsat Highlights
Remote
Sensing, 11%
Technology
Development, 3%
Communications,
83%
Scientific, 2%
Other, 1%
1,202 Smallsats
Launched
Micro
Mini
Nano
Micro
40% of all smallsats launched in last
10 years launched in 2020
43% of total upmass represented by
smallsats in 2020
68 launches in 2020 carried
smallsats
14%of smallsats launched on
small/micro launch vehicles in
2020

4
Smallsats in Context and Operator/Mission Type Trends
Smallsat Mass Trends
Smallsat Launch Trends
Looking Forward

5
Smallsats Launched and Total Spacecraft Upmass 2011 – 2020
Smallsats in Context and Operator/Mission Type Trends
3,968 Spacecraft
launched
~4,000 MTTotal upmass
6%
28%
12%28%
7%
5%
4%3%
3% 3%
8%
1%
6%
10%
12%
13%21%
29%
Mass ClassName
Kilograms (kg)
Femto 0.01 – 0.09
Pico 0.1 – 1
Nano 1.1 – 10
Micro 11 – 200
Mini 201 – 600
Small 601 – 1,200
Medium 1,201 – 2,500
Intermediate 2,501 – 4,200
Large 4,201 – 5,400
Heavy 5,401 – 7,000
Extra Heavy > 7,001
Femto, Pico each <0.1%
Nano 0.1%
1,282 Spacecraft
launched
~554 MTTotal upmass
4%
9%
14%
67%
1%2%
39%
4%
3%
6%7%
9%
11%
21%
Femto 0%
Pico and Nano 0.1%
2011 –
2020
2020 Smallsats represent 75% of
spacecraft launched 2011 – 2020, 9% of total upmass
Smallsats represent 94% of spacecraft launched in 2020, 43% of total upmass
Each 1%

6
Spacecraft Launched 2011 – 2020, by Mass Class
Smallsats in Context and Operator/Mission Type Trends
0
200
400
600
800
1000
1200
1400
2011 2012 2013 2014 2015 2016 2017 2018 2019 2020
Small (601-1,200 kg) Medium (1,201-2,500 kg) Intermediate (2,501-4,200 kg)
Large (4,201-5,400 kg) Heavy (5,401-7000 kg) Extra Heavy (7,000+ kg)
Starlink
and
Oneweb
smallsats
All other
smallsats
Sm
alls
ats
(≤ 6
00kg
)
130 195 173 126
338 328263 265
937
126
52
Nu
mb
er
of
Sp
acecra
ft L
au
nch
ed
Starlink and OneWeb
smallsatsOther Smallsats
39

7
Smallsats 2011 – 2020, by Mass Class
Smallsats in Context and Operator/Mission Type Trends
0
200
400
600
800
1000
1200
2011 2012 2013 2014 2015 2016 2017 2018 2019 2020
Femto (.01-.09 kg) Pico (.1-1 kg) Nano (1.1-10 kg) Micro (11-200 kg) Mini (201-600 kg)
Nu
mb
er
of
Sm
all
sa
tsL
au
nc
he
d
1,202
39 52
130195 173
126
338 328389
8
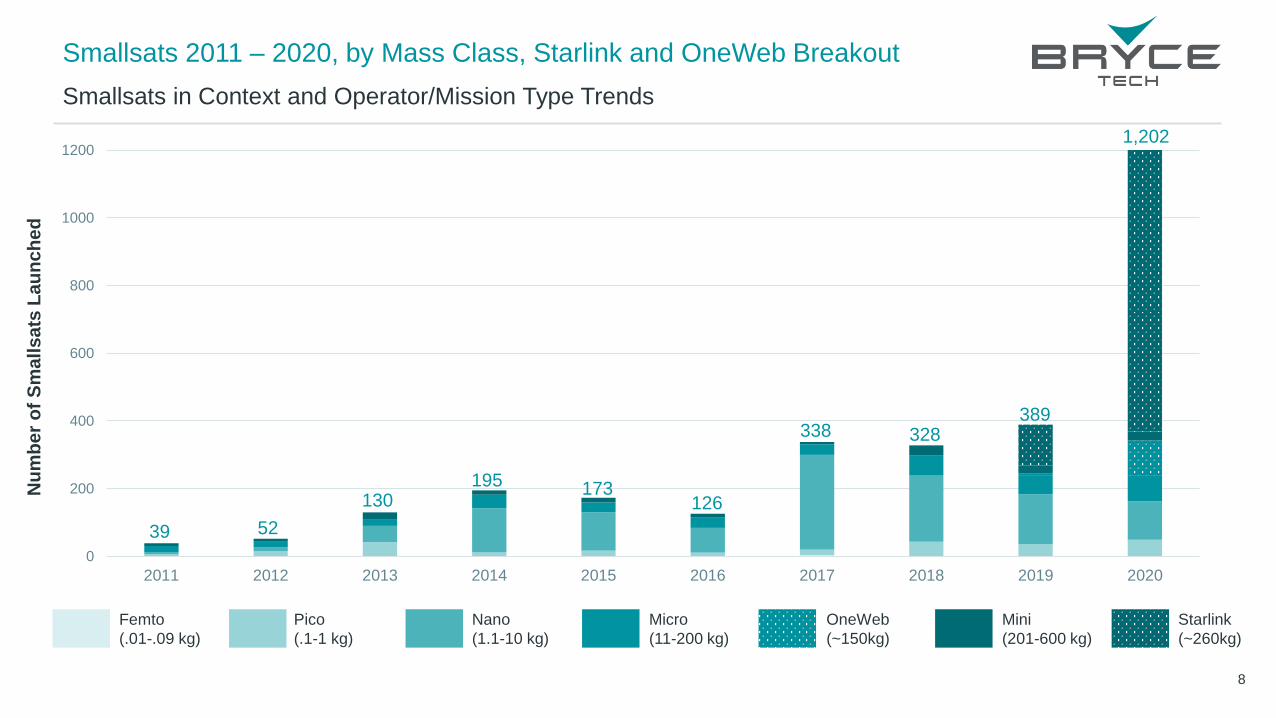
Smallsats 2011 – 2020, by Mass Class, Starlink and OneWeb Breakout
Smallsats in Context and Operator/Mission Type Trends
Femto
(.01-.09 kg)
Pico
(.1-1 kg)
Nano
(1.1-10 kg)
Micro
(11-200 kg)
Mini
(201-600 kg)
0
200
400
600
800
1000
1200
2011 2012 2013 2014 2015 2016 2017 2018 2019 2020
OneWeb
(~150kg)
Starlink
(~260kg)
Nu
mb
er
of
Sm
all
sa
tsL
au
nc
he
d
1,202
39 52
130195 173
126
338 328389

9
Share of Smallsats 2011 – 2020, by Mass Class Including Starlink and OneWeb
Smallsats in Context and Operator/Mission Type Trends
15%
29%32%
6%10% 9% 5%
13%9%
4%
18%
21%
37%
67%65%
58%
83%
60%
38%
9%
46%
33%
14%
21% 17%
25%
9%
18%
16%
15%
21%17% 17%
7% 8% 8%2%
9%
37%
72%
0
200
400
600
800
1000
1200
0%
10%
20%
30%
40%
50%
60%
70%
80%
90%
100%
2011 2012 2013 2014 2015 2016 2017 2018 2019 2020
Femto (.01-.09 kg) Pico (.1-1 kg) Nano (1.1-10 kg) Micro (11-200 kg) Mini (201-600 kg)
Sh
are
of
Sm
all
sa
tsL
au
nc
he
d Nu
mb
er o
f Sm
alls
ats
La
un
ch
ed
Including heavier LEO broadband constellation smallsats, mini smallsats constitute the largest share of
smallsats in 2020
10
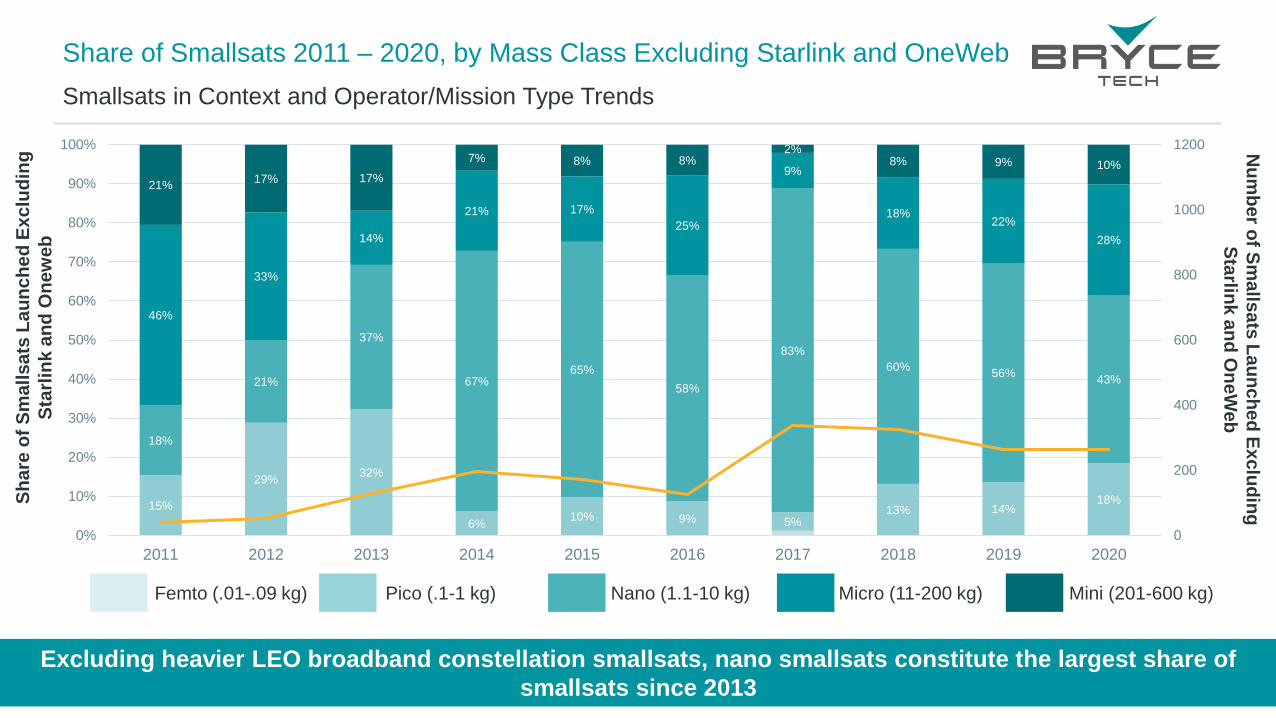
Share of Smallsats 2011 – 2020, by Mass Class Excluding Starlink and OneWeb
Smallsats in Context and Operator/Mission Type Trends
15%
29%32%
6%10% 9% 5%
13% 14%18%
18%
21%
37%
67%65%
58%
83%
60%56%
43%
46%
33%
14%
21% 17%
25%
9%
18%22%
28%
21%17% 17%
7% 8% 8%2%
8% 9% 10%
0
200
400
600
800
1000
1200
0%
10%
20%
30%
40%
50%
60%
70%
80%
90%
100%
2011 2012 2013 2014 2015 2016 2017 2018 2019 2020
Femto (.01-.09 kg) Pico (.1-1 kg) Nano (1.1-10 kg) Micro (11-200 kg) Mini (201-600 kg)
Sh
are
of
Sm
all
sa
tsL
au
nc
he
d E
xc
lud
ing
Sta
rlin
ka
nd
On
ew
eb
Nu
mb
er o
f Sm
alls
ats
La
un
ch
ed
Ex
clu
din
g
Sta
rlink
an
d O
ne
We
b
Excluding heavier LEO broadband constellation smallsats, nano smallsats constitute the largest share of
smallsats since 2013

11
41%
17%
8%
54%
39%
53%
66%
38%
25%
11%
13%
52%
61%
28%
43%
36%
30%
40%
33%
3%
10%
12% 11%
10% 10%0%
1%
11%
6%
5%
1%
32%
78%
36%
15% 17%
7% 6%10% 6%
3% 2%4% 3% 1% 2% 2% 1%5%
2% 1%
0%
10%
20%
30%
40%
50%
60%
70%
80%
90%
100%
2011 2012 2013 2014 2015 2016 2017 2018 2019 2020
Share of Smallsats 2011 – 2020, by Application Including Starlink and OneWeb
Smallsats in Context and Operator/Mission Type Trends
Remote
Sensing
Technology
Development
Communications(Excluding Starlink +
OneWeb)
Scientific Other/Unknown
Sh
are
of
Sm
all
sa
tsL
au
nc
he
d
Relative share of remote sensing and technology development smallsats has decreased due to launch of LEO
communication smallsats
Communications(Starlink + OneWeb)

12
Smallsats 2011 – 2020 by Application Excluding OneWeb and Starlink
Smallsats in Context and Operator/Mission Type Trends
41%
17%
8%
54%
39%
53%
66%
38% 37%
49%
13%
52%
61%
28%
43%
36%
30%
40%49%
15%10%
12% 11%
10% 10%
1%
11%
9%
22%
36%
15% 17%
7% 6%10%
1%
6%4%
10%
3% 1% 2% 2% 1%5% 2% 3%
0%
10%
20%
30%
40%
50%
60%
70%
80%
90%
100%
2011 2012 2013 2014 2015 2016 2017 2018 2019 2020
Remote SensingTechnology
DevelopmentCommunications Scientific Other/Unknown
When excluding Starlink + OneWeb, remote sensing and technology demonstration smallsats historically
have largest shares
Sh
are
of
Sm
all
sa
tsL
au
nc
he
d E
xc
lud
ing
On
eW
eb
an
d S
tarl
ink
4%

13
Number of Smallsats 2011 – 2020, by Operator Type
Smallsats in Context and Operator/Mission Type Trends
0
200
400
600
800
1000
1200
2011 2012 2013 2014 2015 2016 2017 2018 2019 2020
Nu
mb
er
of
Sm
all
sa
tsL
au
nc
he
d
174
937
42
25 24
All Other
SmallsatsNon-Profit Government Civil Government Military
1,202Smallsats
Launched
2020
Number of commercial smallsats launched increased from 3 smallsats in 2011 and 2012 to 1,111 in 2020
OneWeb +
Starlink

14
Commercial Smallsat Operators 2011 – 2020
Smallsats in Context and Operator/Mission Type Trends
17%
47%
22%
7%
5% 2%
Commercial
Operators124
2,013Commercial
Smallsats Launched
2011 – 2020
Operator # of Smallsats
SpaceX 955
Planet 437
Spire Global 131
OneWeb 110
Swarm Technologies 45
CGSTL 26
Satellogic 20
ORBCOMM 19
Spacety 12
Astro Digital 10
Zuhai Orbita 10
Guodian Gaoke 10
GeoOptics 8
BlackSky 7
Commsat Tech Dev Co. 7
ICEYE 6
Commercial Operators with more than 5 smallsats*83% of smallsats launched 2011 – 2020 are owned by 5
operators
*As of the end of 2020
Operators with
more than 5
smallsats (from
124 other
operators)

15
36%
32%
8%
4%
3%
3%2%
11%
Smallsats 2011 – 2020, by Operator Country
Smallsats in Context and Operator/Mission Type Trends
Operator Country # of Smallsats
USA 2,027 (955 Starlink)
China 224
UK 129
Japan 82
Russia 83
Germany 49
Canada 29
Argentina 23
France 21
India 18
Australia 17
South Korea 17
Italy 16
Singapore 14
Spain 13
Israel 12
Finland 10
Operator
countries with 10
or more smallsats
(from 65 other
countries)
Each 1%
2,972Smallsats
Launched
2011 – 2020
US
Operators*
*OneWeb smallsats included under United Kingdom

16
Number of Government Smallsats 2011 – 2020, by Country
Smallsats in Context and Operator/Mission Type Trends
0
20
40
60
80
100
120
140
160
180
USA China Russia Japan India Germany France Iran Europe Taiwan Israel
Five or Fewer Smallsats
Canada Norway
Vietnam United Kingdom
South Korea Algeria
UAE Italy
North Korea Ecuador
Poland The Philippines
Ethiopia Turkey
Indonesia Australia
Egypt Nigeria
Spain Ukraine
Belarus Colombia
Malaysia Kazakhstan
Brazil Thailand
Mexico Pakistan
Peru Belgium
Sweden Rwanda
Chile
Nu
mb
er
of
Go
ve
rnm
en
t S
ma
lls
ats
La
un
ch
ed
Countries with More than Five Government Smallsats

17
Largest Government Smallsat Operators 2011 – 2020
Smallsats in Context and Operator/Mission Type Trends
Type 15 Largest Government OperatorsOpen-Source Data
Country# of Smallsats
Launched
Civil
National Aeronautics and Astronautics and Space Administration USA 56
Los Alamos National Laboratory (LANL) USA 16
Roscosmos Russia 14
Japan Aerospace Exploration Agency (JAXA) Japan 12
Indian Space Research Organisation (ISRO) India 9
Deutsches Zentrum für Luft- und Raumfahrt e.V. (DLR) Germany 7
European Space Agency (ESA) Europe 7
Chinese Academy of Sciences China 7
National Space Program Office (NSPO) Taiwan 7
Centre National d'Etudes Spatiales (CNES) France 5
Military
US Department of Defense USA 77
Russia MoD/Aerospace Forces Russia 22
People’s Liberation Army China 16
National University of Defence Technology (NUDT) China 13
National Reconnaissance Office USA 9

18
Number of Academic Smallsats 2011 – 2020, by Institution
Smallsats in Context and Operator/Mission Type Trends
0
2
4
6
8
10
12
14
16
18
KyushuInstitute ofTechnology
TechnicalUniversity of
Berlin
University ofColorado
BostonUniversity
San JoseState
University
NanyangTechnicalUniversity
CaliforniaPolytechnic
StateUniversity
MontanaState
University
TsinghuaUniversity
University ofToronto
NanjingUniversity
Nu
mb
er
of
Ac
ad
em
ic S
ma
lls
ats
La
un
ch
ed
Academic Institutions with More than Five Smallsats Launched
Nearly 210 academic operators
launched smallsats 2011 – 2020
19
Smallsats in Context and Operator/Mission Type Trends
Smallsat Mass Trends
Smallsat Launch Trends
Looking Forward

20
Spacecraft Upmass by Spacecraft Mass Class, 2011 – 2020
Smallsat Mass Trends
0
100,000
200,000
300,000
400,000
500,000
600,000
2011 2012 2013 2014 2015 2016 2017 2018 2019 2020
Small (601-1,200 kg)
Medium (1,201-2,500 kg) Intermediate (2,501-4,200 kg) Large (4,201-5,400 kg) Heavy (5,401-7000 kg) Extra Heavy (7,000+ kg)
Micro (11-200kg) Mini (201-600kg)Nano (1.1-10kg)Femto + Pico (.01-1kg)
To
tal
Mass L
au
nch
ed
by S
pacecra
ft
Ma
ss
Cla
ss
Sm
alls
ats
(≤ 6
00kg
)

21
Smallsats as a Share of Total Upmass 2011 – 2020
Smallsat Mass Trends
1% 1%2% 2% 2% 2% 2%
5%
11%
43%
5%
0%
5%
10%
15%
20%
25%
30%
35%
40%
45%
50%
2011 2012 2013 2014 2015 2016 2017 2018 2019 2020
Sh
are
of
To
tal M
as
s L
au
nc
he
d
Smallsats as a Share of Total Upmass
Smallsats as a Share of Total Upmass (Excluding
Starlink + OneWeb)
554,277 kg Total spacecraft upmass 2020
239,150 kg Total smallsat upmass 2020

22
4757
112
86
6241 48 56
17
55
109
199
0
100
200
300
400
500
600
2011 2012 2013 2014 2015 2016 2017 2018 2019 2020
Average Mass, Smallsats 2011 – 2020
Smallsat Mass Trends
Avera
ge S
mallsat
Mass (
kg
)
Smallsats on average are increasing in mass
Average Smallsat Mass
Average Smallsat Mass
Excluding Starlink + OneWeb
23
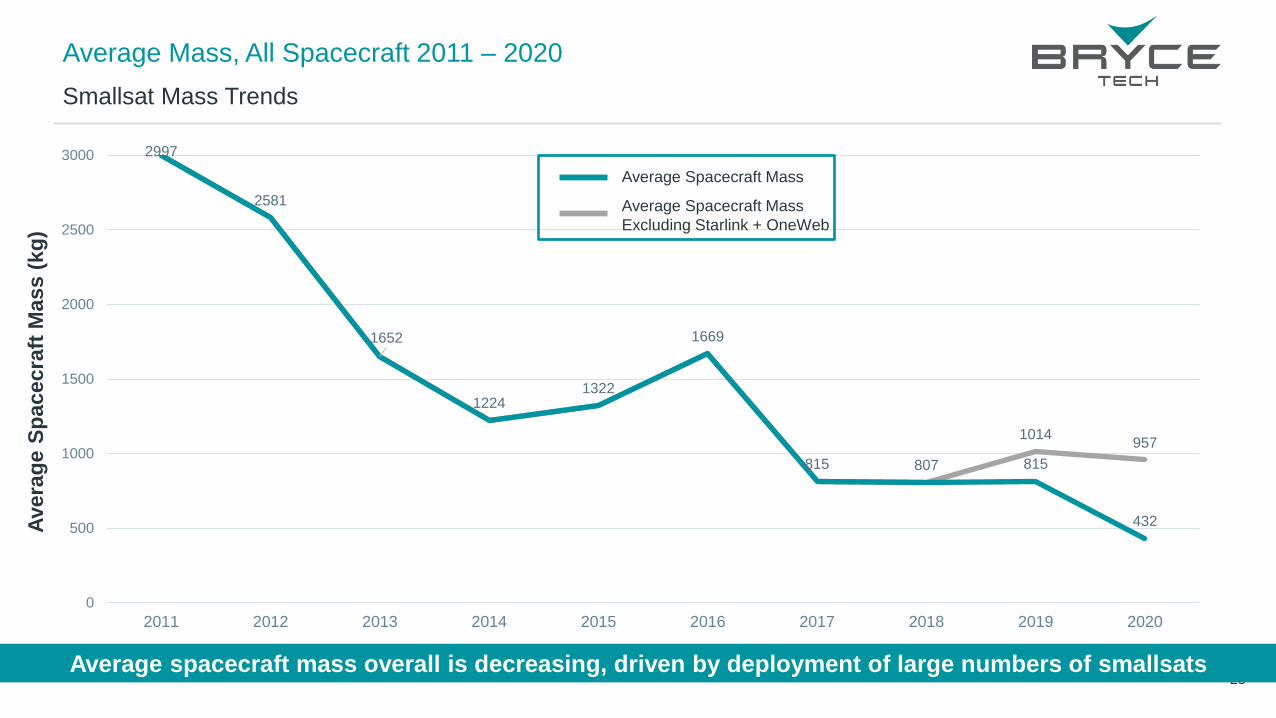
2997
2581
1652
12241322
1669
815 807
1014957
815
432
0
500
1000
1500
2000
2500
3000
2011 2012 2013 2014 2015 2016 2017 2018 2019 2020
Average Mass, All Spacecraft 2011 – 2020
Smallsat Mass Trends
Avera
ge S
pacecra
ft M
ass (
kg
)
Average Spacecraft Mass
Average Spacecraft Mass
Excluding Starlink + OneWeb
Average spacecraft mass overall is decreasing, driven by deployment of large numbers of smallsats

24
Smallsats in Context and Operator/Mission Type Trends
Smallsat Mass Trends
Smallsat Launch Trends
Looking Forward

25
Smallsats 2011 – 2020, by Country of Launch Provider
Smallsat Launch Trends
Other
Sh
are
of
Sm
all
sa
tsL
au
nc
he
d
41%
25%
42%
55% 58%
40%
27%
43%
57%
78%
23%
19%
39%
29%
5%
2% 28%
14%
10%
11%
13%
4%
5%3%
10%
22%
41%
20%
13%
1%
8%
12%
6%3%
16%
13%
4%
20% 14%
5%13%
17%
2%
7%
1%
3% 5%
13%
4%10% 10%
14%
1% 3% 3%3%
10%
1% 1% 1% 2% 1%
0%
10%
20%
30%
40%
50%
60%
70%
80%
90%
100%
2011 2012 2013 2014 2015 2016 2017 2018 2019 2020

26
Number of Launches With Smallsats 2011 – 2020
Smallsat Launch Trends
16 19 22 23 21 21 22
48 46
68
68 5959
6965 64
68
66
56
46
0
20
40
60
80
100
120
2011 2012 2013 2014 2015 2016 2017 2018 2019 2020
Nu
mb
er
of
La
un
ch
es
wit
h a
nd
wit
ho
ut
Sm
all
sa
ts
Launches with
smallsats
Launches without
smallsats
Number of launches per year with smallsats has generally increased over the 10-year period

27
Number of Launches with Smallsats 2011 – 2020, by Launch Vehicle Category
Smallsat Launch Trends
58
11
4 6 6 811
23 2511
11
11
19 15 1514
37
23
43
0
10
20
30
40
50
60
70
2011 2012 2013 2014 2015 2016 2017 2018 2019 2020
Nu
mb
er
of
La
un
ch
es
wit
h S
ma
lls
ats
Launches of Micro – Small Launch
Vehicles with Smallsats
Launches of Medium – Super Heavy Vehicles
with Smallsats
Launch Vehicle
CategoryCapacity (kg) to LEO
Micro ≤500
Small 500 – 2,268
Medium 2,269 – 5,443
Intermediate 5,444 – 11,340
Heavy 11,341 – 30,000
Super Heavy >30,000

28
Share of Smallsats 2011 – 2020, by Launch Vehicle Category
Smallsat Launch Trends
21%
37% 39%
5%
26%
16%8%
13%20%
14%
79%
63% 61%
95%
74%
84%92%
87%80%
86%
0%
10%
20%
30%
40%
50%
60%
70%
80%
90%
100%
2011 2012 2013 2014 2015 2016 2017 2018 2019 2020
Sh
are
of
Sm
all
sa
tsL
au
nc
he
d
Smallsats on Micro – Small Launch
VehiclesSmallsats on Medium – Super Heavy Vehicles
Launch Vehicle
CategoryCapacity (kg) to LEO
Micro ≤500
Small 500 – 2,268
Medium 2,269 – 5,443
Intermediate 5,444 – 11,340
Heavy 11,341 – 30,000
Super Heavy >30,000

29
Number of Smallsats 2011 – 2020, by Launch Vehicle Category
Smallsat Launch Trends
Nu
mb
er
of
Sm
all
sa
tsL
au
nc
he
d
0
200
400
600
800
1000
1200
2011 2012 2013 2014 2015 2016 2017 2018 2019 2020
Smallsats on Micro – Small Launch Vehicles
Smallsats on Medium – Super Heavy Vehicles
Smallsats on Medium – Super Heavy Vehicles
Excluding Starlink and OneWeb
Launch Vehicle
CategoryCapacity (kg) to LEO
Micro ≤500
Small 500 – 2,268
Medium 2,269 – 5,443
Intermediate 5,444 – 11,340
Heavy 11,341 – 30,000
Super Heavy >30,000

30
Smallsats 2016 – 2020, by Launch Vehicle
Smallsat Launch Trends
Fa
lcon
9
PS
LV
So
yu
z 2
.1a
/b
Ele
ctr
on
An
tare
s 2
30
Atla
s V
Ve
ga
42 other vehicles
(<70 smallsats
launched)
Nu
mb
er
of
Sm
all
sa
tsL
au
nc
he
d b
y L
au
nc
h V
eh
icle
0
200
400
600
800
1000
1200
2016 2017 2018 2019 2020
Starlink OneWeb

31
Smallsats in Context and Operator/Mission Type Trends
Smallsat Mass Trends
Smallsat Launch Trends
Looking Forward

32
Number of Spacecraft Launched 2011 – First Half 2021
Looking Forward
0
200
400
600
800
1000
1200
1400
2011 2012 2013 2014 2015 2016 2017 2018 2019 2020 2021
Sm
alls
ats
(≤ 6
00kg
)
# of spacecraft launched in first 6 months of 2021 (97% smallsats) already surpasses 2020 record
Nu
mb
er
of
Sp
ac
ec
raft
La
un
ch
ed
Spacecraft (>600kg) launched
Smallsats (≤ 600kg) launched
H12021
33
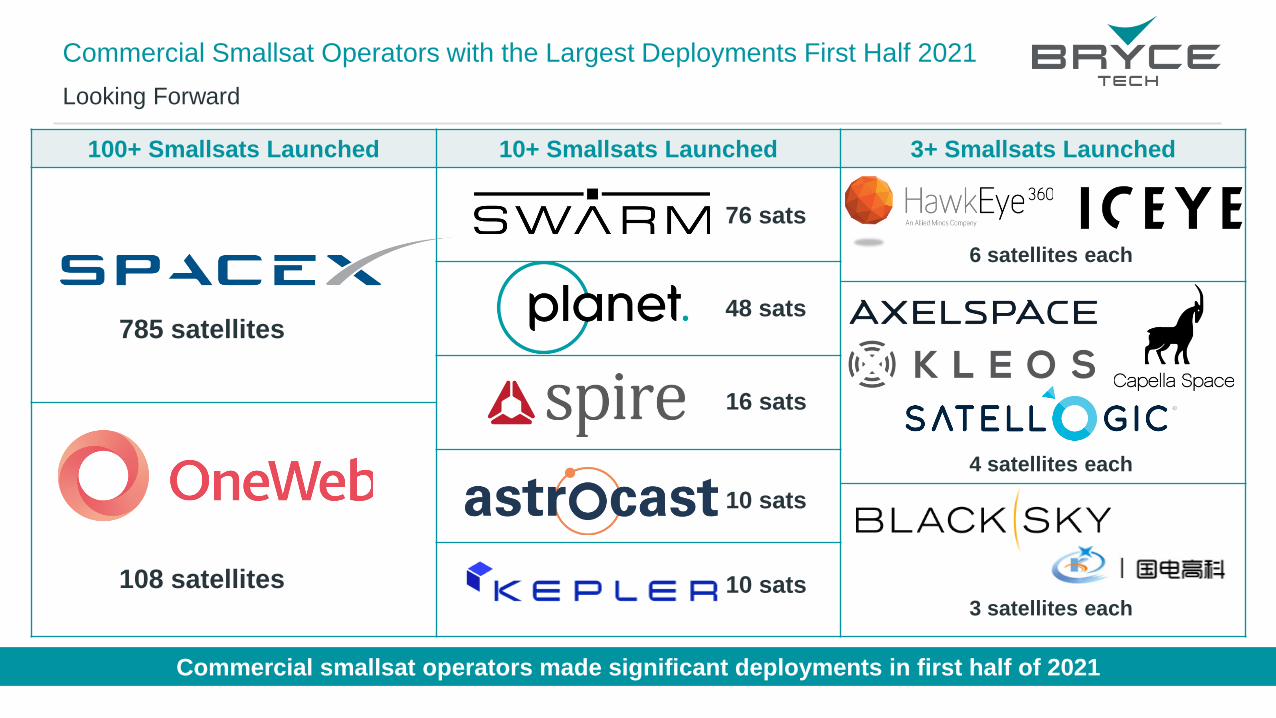
100+ Smallsats Launched 10+ Smallsats Launched 3+ Smallsats Launched
Commercial Smallsat Operators with the Largest Deployments First Half 2021
Looking Forward
785 satellites
108 satellites
76 sats
48 sats
16 sats
10 sats
10 sats
6 satellites each
4 satellites each
3 satellites each
Commercial smallsat operators made significant deployments in first half of 2021

34
Looking Forward: Areas To Watch
Looking Forward
Smallsat Launch Options Smallsat operators have an increasing number of launch options including small launch and rideshare. Dozens of new small launch
vehicles (many <500kg capacity) are in development to launch smallsats. Launch providers, especially medium – super heavy are
increasing rideshare opportunities/initiatives to capture demand from smallsat customers
Business OutcomesSmallsat business ventures of all types continue efforts to prove both their business models and their ability to generate significant
revenue. Financial outcomes of today’s smallsat companies will impact the long-term smallsat market
Communications Constellations Smallsat telecommunications operators dominated smallsat activity in 2020 and are continuing deployments in 2021. Launch of these large
constellations will influence smallsat activity in the next few years
Government use of SmallsatsGovernments are increasingly seeking to leverage smallsats/including in architecture planning to augment existing capabilities
• Space Development Agency deployed first smallsats in 2021, preparing
tranches of smallsats in support of National Defense Space Architecture
• DARPA continuing development of Blackjack constellation to demonstrate
network of smallsats for military comms, missile warning, and navigation
• NASA supporting smallsat launch through ELaNa, other initiatives
• NOAA exploring use of smallsats for weather forecast modeling
• France launching Composante Optique 3D (CO3D) system for civil and
government remote sensing applications
• JAXA RAPIS/RAISE technology demonstration systems
• Several Chinese smallsat systems, various stages development/operation

35