smart goals, smart tools - handouts for janapi.ning.com/.../smartgoalssmarttoolshojan.pdf · smart...
TRANSCRIPT

SMART Goals, SMART Tools
Jan O’Neill

SMART Goals Accelerate Learning For AllNES Professional Learning Communities at Work Institutes 2004
PRESENTER PACKET
1
SMART Goals SMART Tools!
Professional Learning Communities at Work Institute
2006
Jan O’Neill
By the end of this session you will be able to say…
“I know what a SMART Goal is and how to construct one
using a Tree Diagram.”
Goals
Data Teamwork

SMART Goals Accelerate Learning For AllNES Professional Learning Communities at Work Institutes 2004
PRESENTER PACKET
2
“The annual goal statementsthat emerge from school
improvement efforts are rarelylinked to student achievement,and they seldom challenge the
basic elements of practice.”
-- G. McGonagill, 1992
“Clear, measurable goals are at the center of the mystery
of a school’s success, mediocrity or failure.”
-- S.J. Rosenholz, 1991
FOCUS: Team Goals“Transforming broad directives into specific and measurable performance goals is the surest first step for a team trying to shape a common purpose.”
Katzenbach & Smith (1993)
SMART Goals Accelerate Learning For AllNES Professional Learning Communities at Work Institutes 2004
PRESENTER PACKET
3
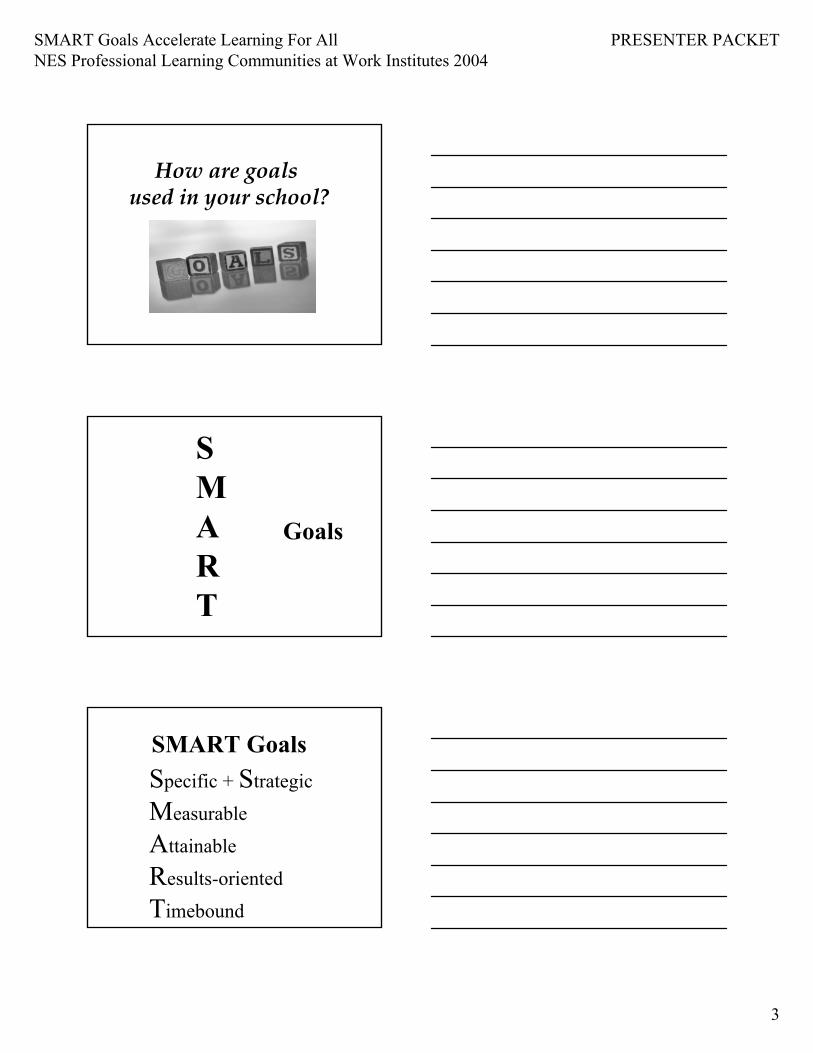
How are goals used in your school?
Goals
SMART
SMART GoalsSpecific + Strategic
Measurable
Attainable
Results-oriented
Timebound

SMART Goals Accelerate Learning For AllNES Professional Learning Communities at Work Institutes 2004
PRESENTER PACKET
4
Why does SMART work?
• FOCUSED• SHORT & LONG TERM• ALIGNED• STUDENT CENTERED
SMART goals focuson the few things
most likely to have the greatest impact!
Pareto Principle80% of the troubleis caused by 20%of the problems
Used with permission from Joiner Associates

SMART Goals Accelerate Learning For AllNES Professional Learning Communities at Work Institutes 2004
PRESENTER PACKET
5
SMART goals have both short and long
term impact!
School wide:Breakthrough
Grade Level: Incremental
BASELINE
DESIRED
GAP
SMART goals align with other key
strategic initiatives.

SMART Goals Accelerate Learning For AllNES Professional Learning Communities at Work Institutes 2004
PRESENTER PACKET
6
Levels of SMART GoalsChallenging, inspiring, strategic
far-reaching goalsPrioritized targeted area/s
based on our unique student needsFocused on specific
skills, knowledgewithin shorter
time frame
District5 yrs.School1-3 yrs
Grade levelDepartmentQuarter,Semester orYear
SMART goals focus on results!
RESULTPROCESS
Following a recipe
SMART Goals Accelerate Learning For AllNES Professional Learning Communities at Work Institutes 2004
PRESENTER PACKET
7
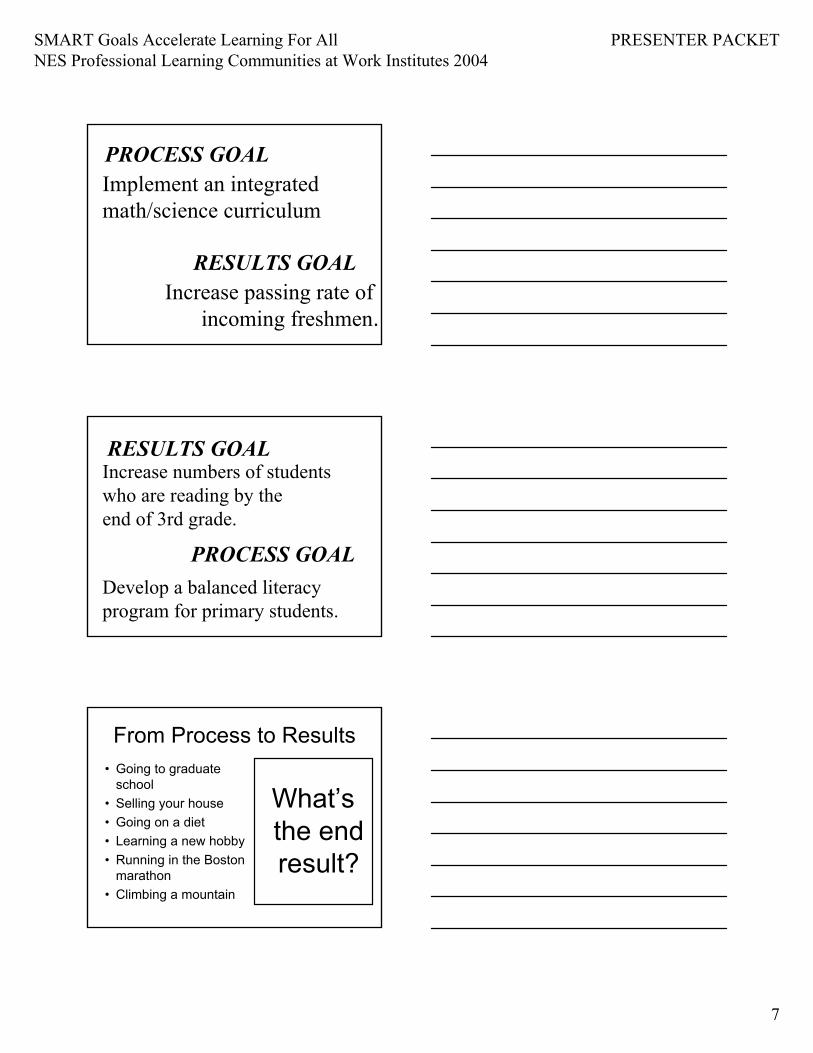
Implement an integratedmath/science curriculum
Increase passing rate of incoming freshmen.
PROCESS GOAL
RESULTS GOAL
Develop a balanced literacyprogram for primary students.
PROCESS GOAL
RESULTS GOALIncrease numbers of students who are reading by the end of 3rd grade.
From Process to Results• Going to graduate
school• Selling your house• Going on a diet• Learning a new hobby• Running in the Boston
marathon• Climbing a mountain
What’s the end result?

SMART Goals Accelerate Learning For AllNES Professional Learning Communities at Work Institutes 2004
PRESENTER PACKET
8
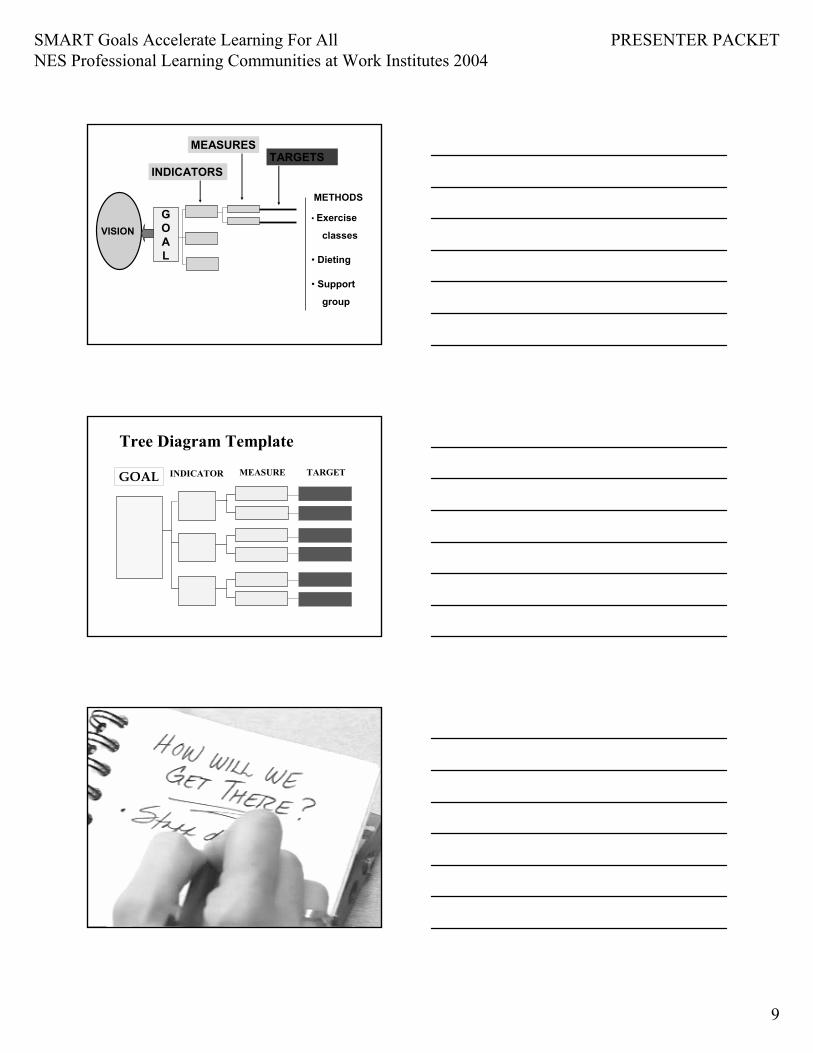
The Tree Diagram• A graphic
organizer• A collaborative
planning tool• A template for
making goals SMARTer
SMARTGOAL
INDICATOR MEASURE TARGET
Tree Diagram Template
GOAL
SMART
GOAL INDICATOR MEASURE TARGET
Tree Diagram Template
Improvephysicalfitness bySept. 1, 2006.
Weightloss
scale 2 pounds eachweek
Cardiovascular fitness
Size of clothes From size X to size Y
Energylevel
journal From avg 3 to avg 4
RESULTS GOAL
Blood pressure From 135/100 to100/60
Vital capacity(lungs) From 3 to 5 liters
SMART Goals Accelerate Learning For AllNES Professional Learning Communities at Work Institutes 2004
PRESENTER PACKET
9
VISIONGOAL
INDICATORS
MEASURESTARGETS
METHODS
• Exercise
classes
• Dieting
• Support
group
SMARTGOAL
INDICATOR MEASURE TARGET
Tree Diagram Template
GOAL

SMART Goals Accelerate Learning For AllNES Professional Learning Communities at Work Institutes 2004
PRESENTER PACKET
10
0102030405060708090
100
2002-03 . .
60% Gap
2014
NCLB -100%by 2014
A Thinking ProcessGREATEST AREA OF NEED
SUBJECT AREA(Accountability Gap, Proficiency Gap and
Change over Time)
DISAGGREGATION BY GENDER, ETHNICITY, F/R LUNCH, ETC.
ITEM ANALYSIS
SYSTEMIC PROGRAMMING PATTERNS
INSTRUCTIONAL STRATEGIES LINKED TO KIDS
SUBTEST & / OR GRADE LEVEL ANALYSIS OF
STANDARDS, SKILLS OR KNOWLEDGE
SMART Goal
GREATEST AREA OF NEEDSUBJECT AREA
(Accountability Gap, Proficiency Gap and Change over Time)
What?

SMART Goals Accelerate Learning For AllNES Professional Learning Communities at Work Institutes 2004
PRESENTER PACKET
11
GAN by Subject Area• Proficiency
Gap
• Accountability Gap
• Change over Time
• What is it?• Why is it important?
• What is it?• Why is it important?
• What is it?• Why is it important?
Run Charts
0
10
20
30
40
50
60
70
80
2002 2003 2004 2005
MathLang. ArtsReading
SMART Tree Diagram Example
District Accountability Goal:90% of students will score proficientor advanced in each tested area by 2009.

SMART Goals Accelerate Learning For AllNES Professional Learning Communities at Work Institutes 2004
PRESENTER PACKET
12
What is the Greatest Area of Need?
Can we verify this with multiple measures?
8th Grade Achievement Test % Meeting the Standard
0
20
40
60
80
100
Math Writing Reading Science
2002 2003 2004
What should our school wide SMART Goal be?
General Rule:School wide goals are usually
1-3 years out.
SMART Goals Accelerate Learning For AllNES Professional Learning Communities at Work Institutes 2004
PRESENTER PACKET
13
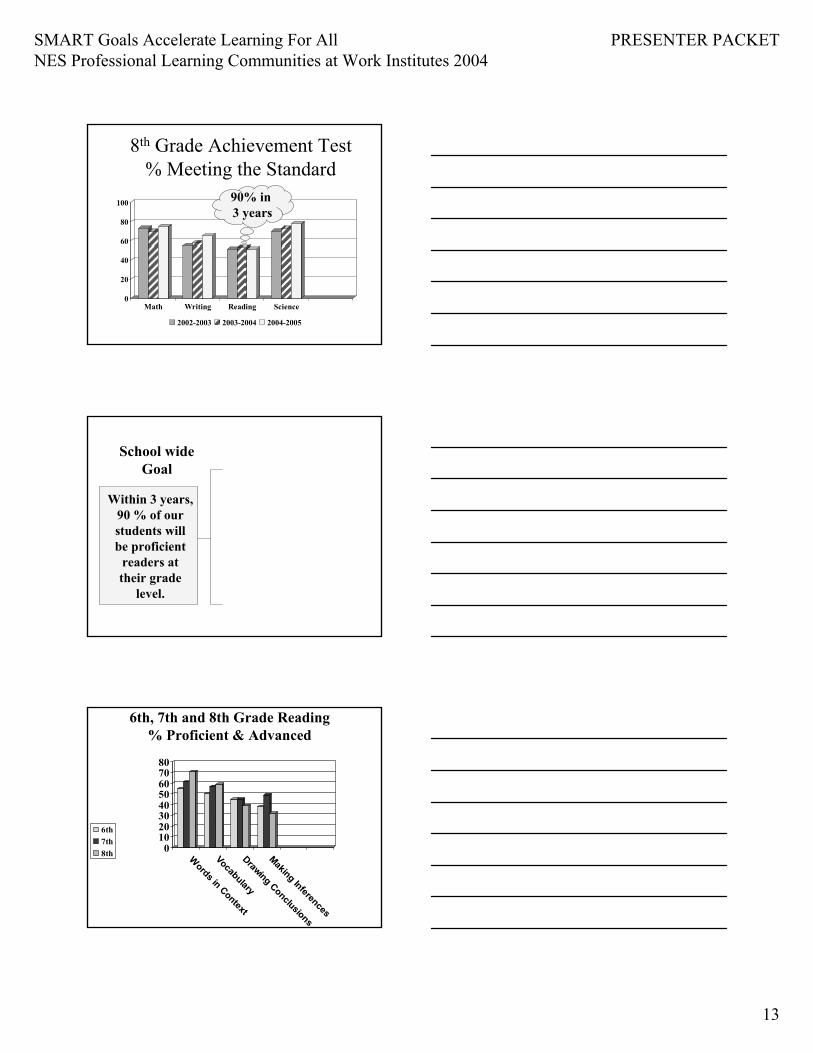
8th Grade Achievement Test % Meeting the Standard
0
20
40
60
80
100
Math Writing Reading Science
2002-2003 2003-2004 2004-2005
90% in 3 years
Within 3 years, 90 % of our students will be proficient
readers at their grade
level.
School wideGoal
6th, 7th and 8th Grade Reading% Proficient & Advanced
01020304050607080
Words in Context
Vocabulary
Drawing Conclusions
Making Inferences
6th7th8th

SMART Goals Accelerate Learning For AllNES Professional Learning Communities at Work Institutes 2004
PRESENTER PACKET
14
Drawing Conclusions
School wide Goal
Indicator
Within 3 years, 90 % of our
students will be proficient
readers at their grade level.
How will we measureprogress on our SMART Goal?
MEASURES:Tools used to monitor progress toward our goal. Measures are
specific to the indicators.
Measures: Our School! 8th grade achievement test
(annual/summative)! district reading assessments 6-8
(fall/spring...formative)! classroom assessments and
projects (ongoing / formative)

SMART Goals Accelerate Learning For AllNES Professional Learning Communities at Work Institutes 2004
PRESENTER PACKET
15
DrawingConclusions
School wide Goal
IndicatorDistrict
Assessment
Measure
MakingInferences
State TestWithin 3 years, 90 % of our students
will be proficient readers at their grade
level.
What should our targets be?
TARGETS:Shorter term incremental steps toward the goal. Targets are
set for each measure.
Selecting Targets Can Be Tricky!
" Based on the data, what is attainable?
" Based on our resources, what is attainable?
" If we have no data, what is a reasonable yet challenging level of improvement we think we have a chance of achieving?
SMART Goals Accelerate Learning For AllNES Professional Learning Communities at Work Institutes 2004
PRESENTER PACKET
16
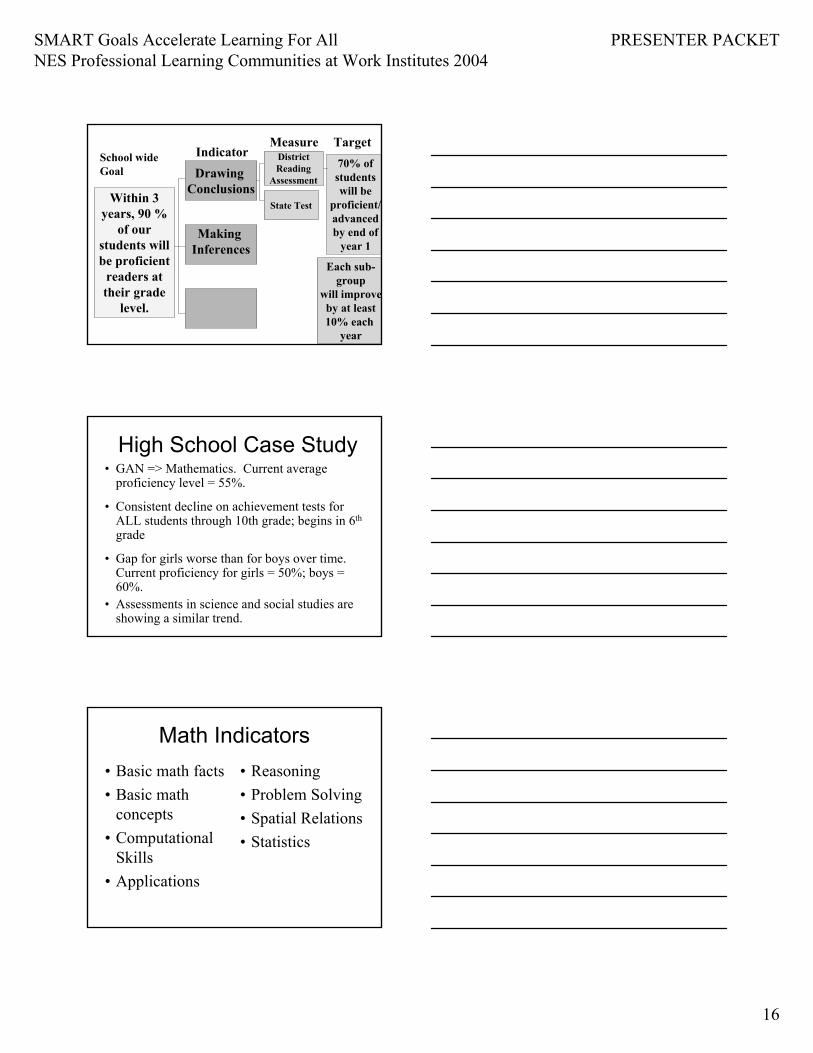
Drawing Conclusions
School wide Goal
Indicator DistrictReading
Assessment
Measure
Making Inferences
Target
State TestWithin 3
years, 90 % of our
students will be proficient
readers at their grade
level.
70% ofstudentswill be
proficient/advancedby end of
year 1
Each sub-group
will improveby at least10% each
year
High School Case Study• GAN => Mathematics. Current average
proficiency level = 55%.
• Consistent decline on achievement tests for ALL students through 10th grade; begins in 6th
grade
• Gap for girls worse than for boys over time. Current proficiency for girls = 50%; boys = 60%.
• Assessments in science and social studies are showing a similar trend.
Math Indicators• Basic math facts• Basic math
concepts• Computational
Skills• Applications
• Reasoning• Problem Solving• Spatial Relations• Statistics

SMART Goals Accelerate Learning For AllNES Professional Learning Communities at Work Institutes 2004
PRESENTER PACKET
17
Common Assessments
010203040506070
Algebraic Functions
Problem Solving
Spatial Relations
Measurement
Operations
Applications
% Passing
Passing =80% or betterPassing =4 or higher on A 6 point rubric
Measures• Timed tests• Weekly quizzes• Unit tests• Pre / post math
competency tests• Performance
tasks / rubrics
• SATs / ACTs• Standardized tests• Quarterly,
semester, final exams
• Grades
Agenda - Purpose: To create a SMART Goal Tree
1 min. Select meeting roles -Facilitator, Timekeeper, and Scribe
10 min. Develop one branch of the Goal Tree for this high school.
2 min. Evaluate your meeting.

SMART Goals Accelerate Learning For AllNES Professional Learning Communities at Work Institutes 2004
PRESENTER PACKET
18
SMARTGOAL
INDICATOR MEASURE TARGET
Tree Diagram Template
GOAL
Use post-it notes
SMARTGOAL
INDICATOR MEASURE TARGET
Tree Diagram Template
GOAL
80 % of students will be proficient in math by 2006
ProblemSolving
PerformanceTask
From 50 -80%GirlsFrom 60-80% Boys
How will we get to where we want to be?
SMARTStrategies Link Directly to Goals
Collaboration

SMART Goals Accelerate Learning For AllNES Professional Learning Communities at Work Institutes 2004
PRESENTER PACKET
19
Results-oriented Planning & Improvement
VISIONGOAL
INDICATORS MEASURES TARGETS METHODS
Improvement Strategies Include...
• Innovations in teaching• Use of instructional best practices• Curriculum alignment• Development & use of common assessments• Professional development• Process improvements• System interventions and improvements
Goals can give us Direction
But only if they are clear and measurable

SMART Goals Accelerate Learning For AllNES Professional Learning Communities at Work Institutes 2004
PRESENTER PACKET
20
SMART Goals AccelerateLearning for All!
The Handbook for SMART School Teams –Solution Tree
The Power of SMART Goals –Solution Tree
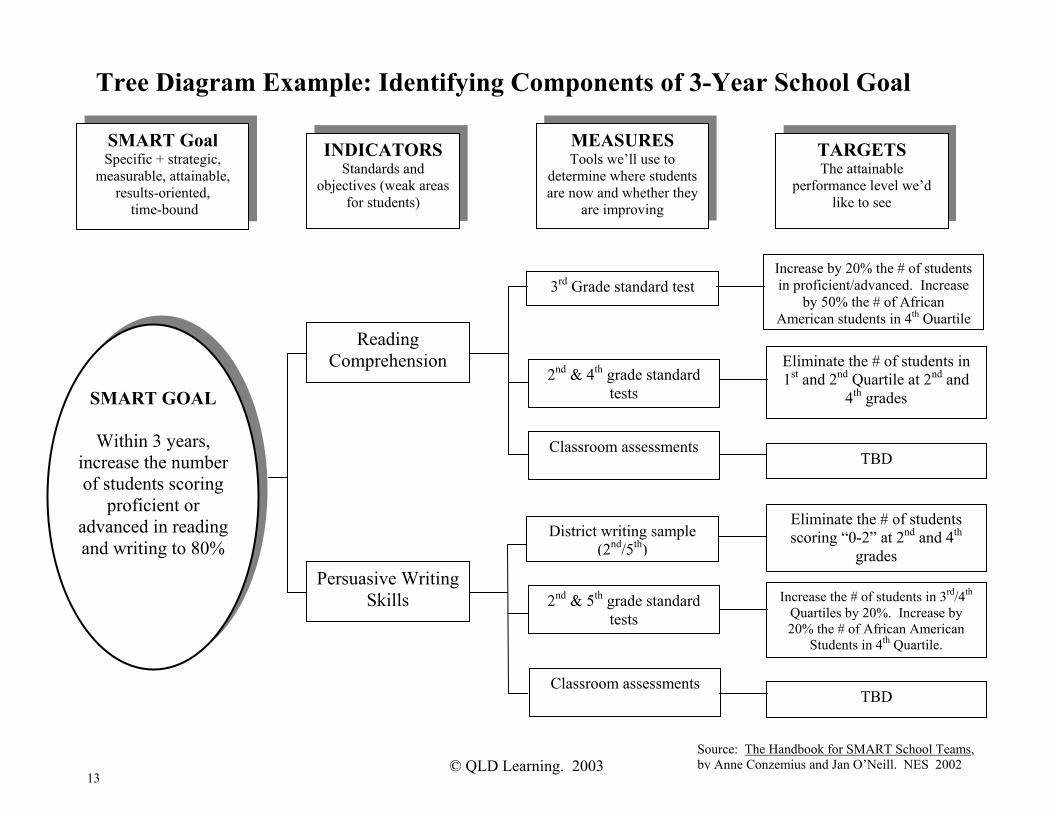
Tree Diagram Example: Identifying Components of 3-Year School Goal
SMART Goal Specific + strategic,
measurable, attainable, results-oriented,
time-bound
MEASURES Tools we’ll use to
determine where students are now and whether they
are improving
INDICATORSStandards and
objectives (weak areas for students)
TARGETS The attainable
performance level we’d like to see
Reading Comprehension
3rd Grade standard test
Persuasive Writing Skills
Classroom assessments
2nd & 5th grade standard tests
Increase by 20% the # of students in proficient/advanced. Increase
by 50% the # of African American students in 4th Quartile
Eliminate the # of students in 1st and 2nd Quartile at 2nd and
4th grades
Eliminate the # of students scoring “0-2” at 2nd and 4th
grades District writing sample
(2nd/5th)
Increase the # of students in 3rd/4th Quartiles by 20%. Increase by 20% the # of African American
Students in 4th Quartile.
Classroom assessments TBD
2nd & 4th grade standard tests
TBD
SMART GOAL
Within 3 years, increase the number of students scoring
proficient or advanced in reading and writing to 80%
Source: The Handbook for SMART School Teams, by Anne Conzemius and Jan O’Neill. NES 2002
© QLD Learning. 2003
13

1
SMARTGOAL
INDICATOR MEASURE TARGET
Tree Diagram Template
GOAL

1
SMART
GOAL INDICATOR MEASURE TARGET
Tree Diagram Template
Improvephysicalfitness bySept. 1, 2006.
Weightloss
scale 2 pounds eachweek
Cardiovascular fitness
Size of clothes From size X to size Y
Energylevel
journal From avg 3 to avg 4
RESULTS GOAL
Blood pressure From 135/100 to100/60
Vital capacity(lungs) From 3 to 5 liters
© QLD Learning. 2003 30
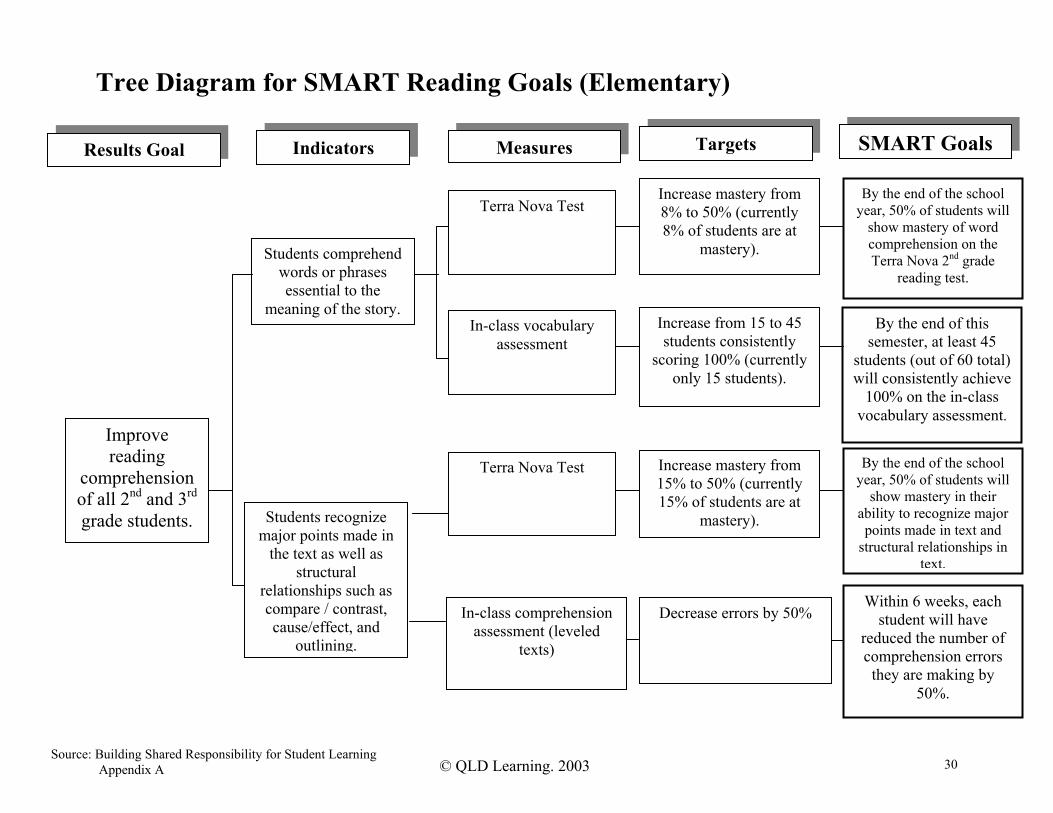
Tree Diagram for SMART Reading Goals (Elementary)
Students comprehend words or phrases essential to the
meaning of the story.
Indicators Measures
In-class vocabulary assessment
Targets
In-class comprehension assessment (leveled
texts)
Improve reading
comprehension of all 2nd and 3rd grade students.
Results Goal
Students recognize major points made in
the text as well as structural
relationships such as compare / contrast, cause/effect, and
outlining.
Terra Nova Test
Increase mastery from 8% to 50% (currently 8% of students are at
mastery).
Increase from 15 to 45 students consistently
scoring 100% (currently only 15 students).
Increase mastery from 15% to 50% (currently 15% of students are at
mastery).
Decrease errors by 50%
Source: Building Shared Responsibility for Student Learning Appendix A
SMART Goals
By the end of the school year, 50% of students will
show mastery of word comprehension on the Terra Nova 2nd grade
reading test.
By the end of this semester, at least 45
students (out of 60 total) will consistently achieve
100% on the in-class vocabulary assessment.
By the end of the school year, 50% of students will
show mastery in their ability to recognize major points made in text and
structural relationships in text.
Within 6 weeks, each student will have
reduced the number of comprehension errors they are making by
50%.
Terra Nova Test

© QLD Learning. 2003 31
Tree Diagram for SMART Writing Goals (Middle School)
Logic and organization of writing is clear.
Indicators Measures
State writing exam
Targets
Performance task as measured by qualified
outside experts.
Improve writing skills of all 8th
graders.
Results Goal
Writing is persuasive and compelling.
8th grade vocabulary list, first semester
Class average of 4.5 or higher on 6-point rubric (current average is 3.0)
80% score proficient or advanced (current is
65%). None at “minimal” (current is
10%).
Increase from fall baseline of 50% average
accuracy to 75% average accuracy.
80% of readers (current is 40%).
Source: Building Shared Responsibility for Student Learning Appendix A
SMART Goals
By the end of the school year, the 8th grade class
will achieve a class average of at least 4.5 on
the district-developed writing rubric
By the end of the school year, at least 80% of our students will score either proficient or advanced, and no one will score “minimal” on the state
writing exam.
By the end of this semester, all students
will show at least 75% mastery of the 8th grade
vocabulary list.
By the third quarter, 80% of readers will
report they were persuaded by the students’ written
arguments.
Vocabulary use is developmentally appropriate and accurate for the
context.
District rubric

© QLD Learning. 2003 32
Tree Diagram for SMART Analytical Thinking Goals (High School)
Students demonstrate ability to gather,
organize and analyze information.
Indicators Measures
Performance assessments grades 9-12
using 4 point rubric (common measure developed by math
and science)
District assessment in grade 8
Targets
Performance assessments in science (lab demonstrations).
Common measure TBD.
Improve students’ analytical
thinking skills.
Results Goal
Students demonstrate ability to evaluate the validity and reliability
of information.
Sub-test from state test in grade 9
State does not test this
80% students score 3 or better (no data on
current score)
80% will score above standard on math and science components
(current is 60%)
90% will score at or above state average on
math and science components (current is
75%)
All students score 4 or higher on 6 point rubric
(current is 20% 3 or below)
Source: Building Shared Responsibility for Student Learning Appendix A
SMART Goals
By the end of the semester, 80% of
students will score a 3 or better on a 4-point performance rubric
By the end of the year, 80% of students will
score above standard on the math and science components of the district assessment
By the end of the year, 90% of students will
score at or above state average on the math and science components of
the state test
By the end of this semester, all students will score at least 4 on
the science class performance assessment

© QLD Learning. 2003 33
Tree Diagram for SMART Climate Goals (Schoolwide)
Staff absenteeism
Indicators Measures
Request forms for new projects
Targets
Transfer request forms
Improve school climate and
teacher morale.
Results Goal
Staff retention
Agenda review
50% fewer days absent (current average is 7
days)
4 out of 5 of the new projects requested will
be collaborative (currently 4 out of 5 new
projects requested are individual in nature.
Principal responsible for only 50% of agenda
items (currently 100%).
No staff requests to transfer (has averaged 5
per year for past 3 years).
Source: Building Shared Responsibility for Student Learning Appendix A
SMART Goals
By this time next year, we will have reduced
our absenteeism by 50% to an average of 3.5
days.
Within two years, 4 out of 5 of the new projects
requested bill be collaborative in nature.
By spring of next year, the staff and the
principal will share 50/50 responsibility for developing and leading
faculty meetings.
Over the next three years, the number of
staff requests to transfer will be reduced from an average of 5 per year to
zero.
Involvement in staff meetings
Substitute teacher logs and payroll reporting
sheets
Collaboration on projects