smith - technical challenges to meeting goals
TRANSCRIPT

Technical Challenges to
Meeting Goals at
Multiple Scales
Douglas R. Smith, USDA-ARS

Lake Erie and Harmful Algal Blooms
2011 Central Lake Erie Basin Microcystis-containing bloom
DRP
(kg P/ha)
TP
(kg P/ha)
Maumee 0.273 1.12
Sandusky 0.311 1.41
Honey Cr. 0.369 1.29
Rock Cr. 0.250 1.38

Lake Erie and Harmful Algal Blooms
2011 Central Lake Erie Basin Microcystis-containing bloom
Measured DRP
(kg P/ha)
TP
(kg P/ha)
Maumee 0.273 1.12
Sandusky 0.311 1.41
Honey Cr. 0.369 1.29
Rock Cr. 0.250 1.38
Binational Agreement to:
Reduce annual TP by 40%
Reduce Spring SP and TP by 40%
Targets DRP
(kg P/ha)
TP
(kg P/ha)
Maumee 0.16 0.67
Sandusky 0.19 0.85
Honey Cr. 0.22 0.77
Rock Cr. 0.15 0.83

WHAT CAN WE DO?
Buffers
Nutrient Interception
Wetlands (IA-CREP)
Stream
Diversions
Near-Zero
Discharge Drainage
Bioreactors
Restored Prairie Pothole
Wetlands
Controlled
Drainage

Hydrologic Year 2008-2011 Maumee River Soluble Phosphorus Loading
Day of Hydrologic Year (Day 1 = October 1)
0 100 200 300
Tota
l Pho
spho
rus
Load
(kg)
0
200000
400000
600000
800000
HY08 Soluble P
HY09 Soluble P
HY10 Soluble P
HY11 Soluble P
84.6%
61.9%
44.3%
81.1%
Fertilizer Spreading
“Season”

J F M A M J J A S O N D
Vo
lum
etr
ic D
ep
th (
mm
)
0
20
40
60
80
100
120
140
160
180Precip > PET
PET
2005-2010 Precip
Drainage and Fertilizer Spreading Season

Nutrient Budgets, Sources and Pathways
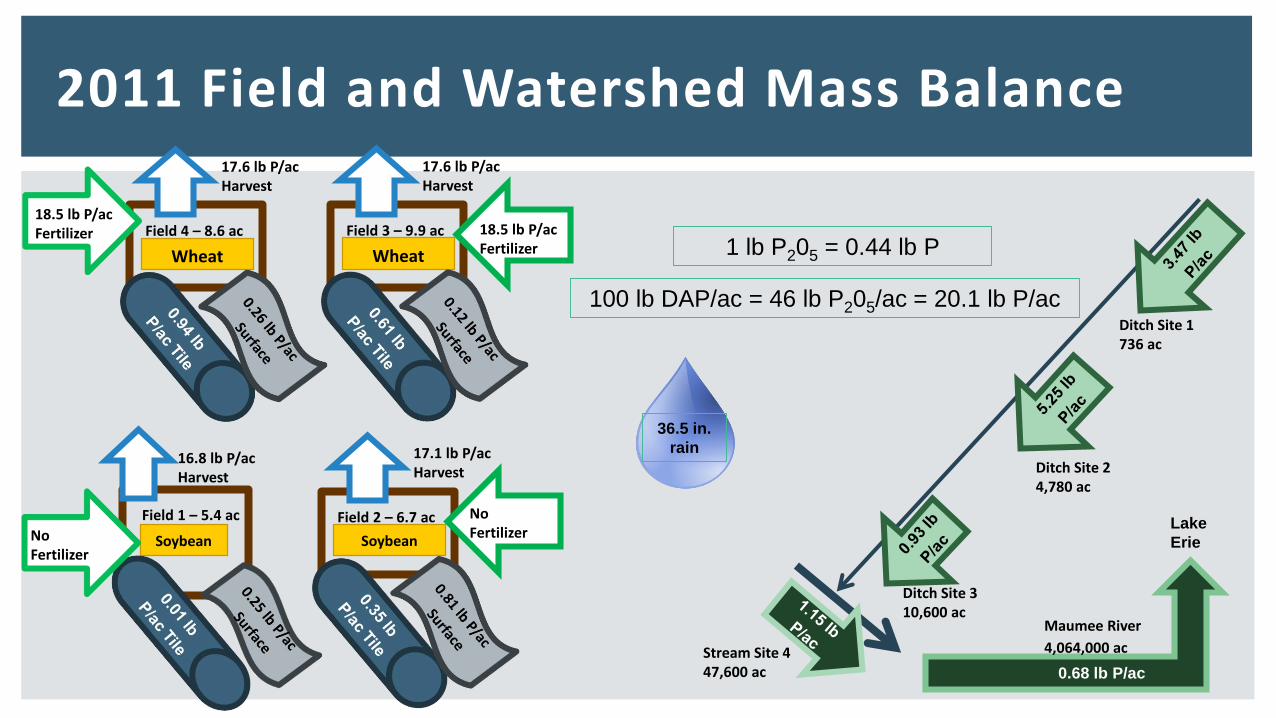
2011 Field and Watershed Mass Balance
Field 4 – 8.6 ac
Wheat
18.5 lb P/acFertilizer
17.6 lb P/ac Harvest
Field 1 – 5.4 ac
Soybean
16.8 lb P/ac Harvest
Field 3 – 9.9 ac
Wheat
18.5 lb P/acFertilizer
17.6 lb P/ac Harvest
NoFertilizer
Field 2 – 6.7 ac
Soybean
NoFertilizer
17.1 lb P/ac Harvest
Ditch Site 1736 ac
Ditch Site 24,780 ac
Ditch Site 310,600 ac
Stream Site 447,600 ac 0.68 lb P/ac
Lake
Erie
Maumee River
4,064,000 ac
36.5 in.
rain
1 lb P205 = 0.44 lb P
100 lb DAP/ac = 46 lb P205/ac = 20.1 lb P/ac

0
1
2
3
4
5
6
7
8
9
10
11
12
13
14
15
16
10 20 30 40 50 60 70 80 90 100
110
120
130
140
150
160
170
180
190
200
210
220
230
240
250
260
270
280
Mor
e
FREQ
UEN
CY A
MO
NG
120
SAM
PLES
Phosphorus Concentration in 0-6" Surface Soil (mg P/ kg soil - or - ppm)
Phosphorus Content after Harvest data from Diane Stott
According to the Tri-state Fertility Guide, no
P fertilizer application recommended
beyond 50 ppm P

St. Joseph River Watershed
!\
!\
!\!\
!\
!\
!\
!\
!\
!\
!\
!\!\
!\!\!\!\!\!\
Ma
tso
n D
itch
Swartz Ditch
W S
mith
Ditc
h
Cedar C
reek
Dib
bling D
itch
Lein
s Ditch
Ho
ffeld
er
Dit
ch
Ced
ar Cree
k
Mats
on Ditc
h
AD
AS2AS1
F34
CME
CLG
BME
BLG
AME
ALG
MI
IN
OH
MI
IN
OH
MI
Ontario
Tile Drainage
Direct Drainage
Pot-Hole
!
LowPoint
¯
0 50 100 150 200 250
Miles
0 5 10 15 20 25
Miles
0 0.5 1 1.5 2 2.5
Miles

Nutrient losses were higher from watersheds with more:
‒ Direct Drainage
‒ Pothole Drainage
Influence of Drainage Class on Nutrient Losses

Soil Test Phosphorus 0-2" (mg/kg)
0 100 200 300 400 500 600
DR
P c
on
cen
trati
on
(m
g/L
)
0.0
0.5
1.0
1.5
2.0
DRP concentration range
site median
Relationship between soil test phosphorus and dissolved phosphorus concentration in tile discharge (UBWC and Upper Wabash watersheds)
What’s Wrong with the Current System?
Courtesy: K. King
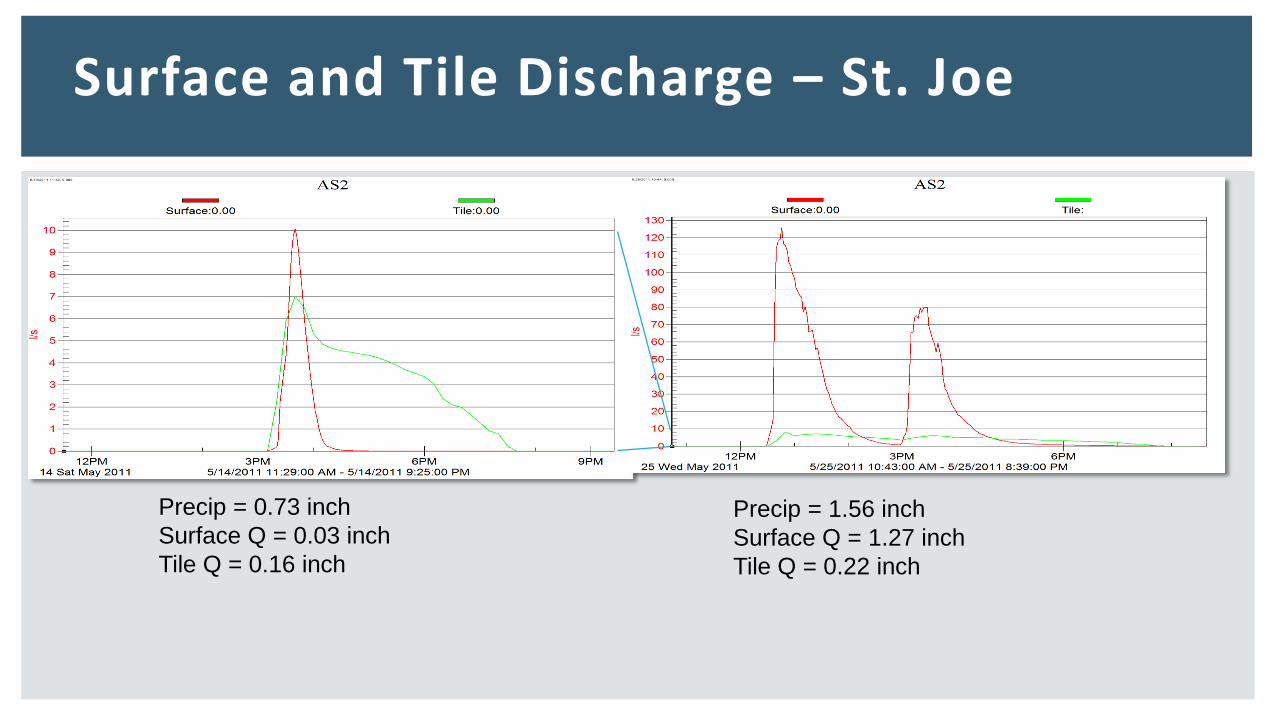
Surface and Tile Discharge – St. Joe
Precip = 0.73 inch
Surface Q = 0.03 inch
Tile Q = 0.16 inch
Precip = 1.56 inch
Surface Q = 1.27 inch
Tile Q = 0.22 inch

Field 1 Field 2 Field 3 Field 4
Rel
ativ
e S
ub
surf
ace
Tile
Dis
char
ge
(%)
0
20
40
60
80
100
120
Annual Relative Volume of Discharge
Through Subsurface Tile – St. Joe

Watershed Results—2005-2010 UBWC
Courtesy: K. King
40% of annual total phosphorus load at EOF from tile discharge (Enright and Madramootoo,
2004)
25% of TP and 50% of soluble P leaving watershed originated in tile drainage (Culley
and Bolton, 1983)
Soluble P Total P
2005 0.317 0.234
2006 0.346 0.300
2007 0.313 0.264
2008 0.756 0.759
2009 0.591 0.485
2010 0.669 0.630
AVG 0.499 0.445
Fraction of annual
watershed loading
originating from tile
Watershed Loss (kg)
0 20 40 60 80 100 120 140 160
T
ile L
osse
s (
kg
)
0
20
40
60
80
100
120
140
160
Total P
Soluble P
y = 0.457x+0.219
R2 = 0.86
y=0.342x+0.173
R2=0.72

LEGACY PHOSPHORUS
Sediment source
tracking indicated about
50% of sediment was
from field sources and
50% from stream bank.
Roughly ½ of sediment
(and by proxy P) is from
stream bank or stream
bed
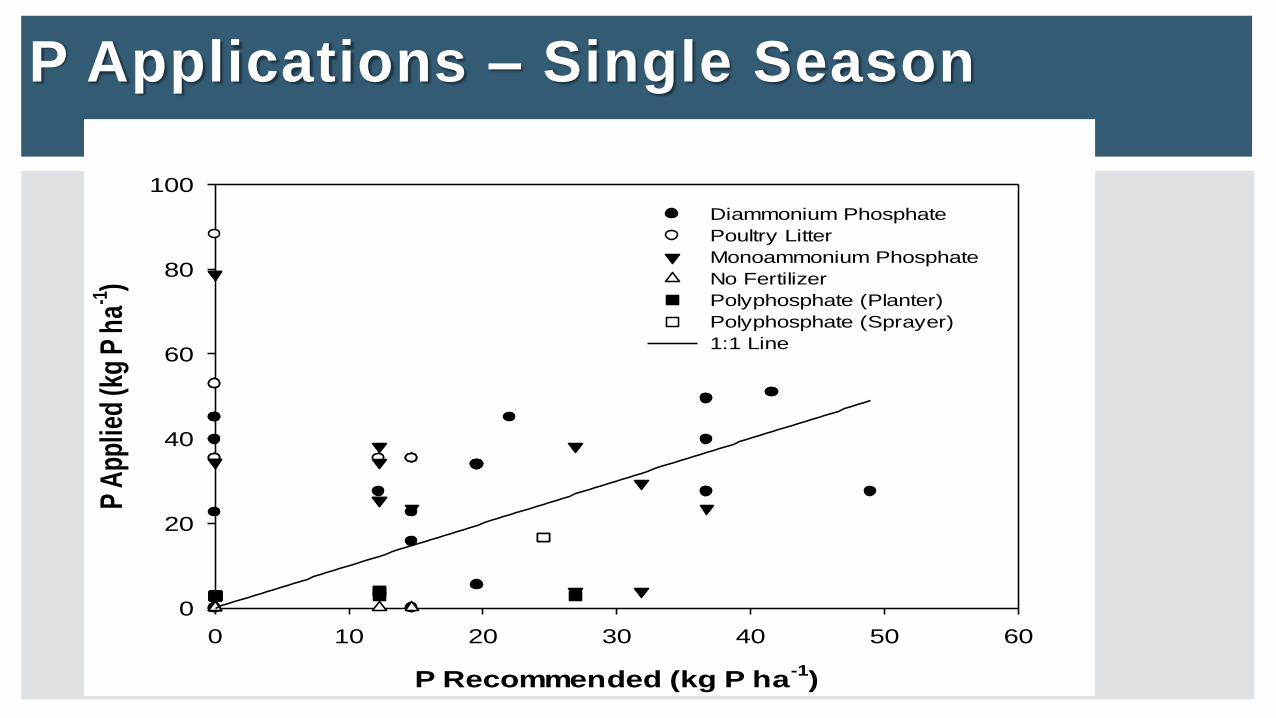
P Applications – Single Season
P Recommended (kg P ha-1
)
0 10 20 30 40 50 60
P A
pplie
d (k
g P
ha-1
)
0
20
40
60
80
100
Diammonium Phosphate
Poultry Litter
Monoammonium Phosphate
No Fertilizer
Polyphosphate (Planter)
Polyphosphate (Sprayer)
1:1 Line

P Application - Rotation
P Recommended (kg P ha-1
)
0 20 40 60 80 100
P a
pplie
d (k
g P
ha-1
)
0
20
40
60
80
100
120
140
160
180
200
Diammonium Phosphate
Poultry Litter
Monoammonium Phosphate
No Fertilizer
Polyphosphate (Planter)
Polyphosphate (Sprayer)
1:1 Line

Conservation Practices

Goals to reduce P loading to Lake Erie by ~40%
Conservation Practices Generally Designed for Erosion
Stop the sediment, stop the P
Expectations for Water Quality Improvement

Grassed waterwaysContour filter strips
Conservation cover
Practices for Managing Runoff & Water Quality
Sediment detention basins

Relative Change in Annual Load for
Nutrients and Sediments by Conservation Practice
NH4-N NO3-N TKN Soluble P Total P Sediment
Rel
ativ
e C
hang
e in
Ann
ual L
oad
-100
-50
0
50
100
150
200
Grassed Waterway
Blind Inlet
Conservation Crop Rotation
Tillage
Monitored Conservation Practices in WLEB

APEX Modeling of All Conservation in St. Joe
Nitrogen Loading from Fields Where Single or Multiple
Conservation Practices Have Been Implemented
If No Practices With Conservation
Nitr
ogen
(lb)
0
2000000
4000000
6000000
8000000
10000000
Sediment Loading from Fields Where Single or Multiple
Conservation Practices Have Been Implemented
If No Practices With Conservation
Sed
imen
t Loa
d (to
ns)
0
10000
20000
30000
40000
50000
60000
1 Conservation Practice
2 Conservation Practices
3 or more Conservation Practices

Certainty Programs – Stewardship Tool for
Environmental Performance

Agricultural Conservation Planning Framework

Alternative Surface Drainage
Tile Riser Blind Inlet

Novel Practices: Re-Saturated Buffer

In-Channel Phosphorus Retention
Mark Tomer, ARSJoe Magner, Univ.
Minn.
Entrained wetlands
Constructed wetlands
Two-stage ditch
Stream
restoration/reconnection
Pete Kleinman, ARS

WHAT CAN WE DO?
Buffers
Nutrient Interception
Wetlands (IA-CREP)
Stream
Diversions
Near-Zero
Discharge Drainage
Bioreactors
Restored Prairie Pothole
Wetlands
Controlled
Drainage

No single source of P
No single pathway of P
No silver bullet
Most farmers do what is asked
If we are giving the wrong advice, it is the farmer that pays the price
Conclusions

?Thank You!