so2 as a possible proxy for volcanic ash in aviation...
TRANSCRIPT

JOURNAL OF GEOPHYSICAL RESEARCH: ATMOSPHERES, VOL. 118, 1–12, doi:10.1002/jgrd.50505, 2013
SO2 as a possible proxy for volcanic ash in aviation hazard avoidanceT. M. Sears,1 G. E. Thomas,1 E. Carboni,1 A. J. A. Smith,1 and R. G. Grainger1
Received 6 September 2012; revised 26 April 2013; accepted 16 May 2013.
[1] Airborne volcanic ash poses a significant danger to aircraft, but is difficult toquantify accurately using satellite data, while sulphur dioxide is much easier to detectaccurately, but is much less of a direct hazard to aviation. This paper investigates thereliability of using SO2 as a proxy for the location of volcanic ash, using an SO2 retrievalfrom the Infrared Atmospheric Sounding Interferometer (IASI) and ash detections fromIASI and the Advanced Along Track Scanning Radiometer (AATSR). Using a numerical“missed ash fraction” applied to the eruptions of Eyjafjallajökull in 2010 andPuyehue-Cordón Caulle in 2011 reveals that the SO2 flag typically misses �30% of thedetectable ash. Furthermore, the missed ash fraction is found to be highly variable, bothbetween the two eruptions and over the course of each eruption, with values of over 80%found on some days. The detection threshold of the AATSR ash flag is also investigatedusing radiative transfer calculations, allowing the threshold of the IASI flag to beinferred, and these are related to the ash contamination levels.Citation: Sears, T. M., G. E. Thomas, E. Carboni, A. J. A. Smith, and R. G. Grainger (2013), SO2 as a possible proxy for volcanicash in aviation hazard avoidance, J. Geophys. Res. Atmos., 118, doi:10.1002/jgrd.50505.
1. Introduction1.1. Motivation
[2] Volcanic eruptions can release large quantities (Tg)of volcanic ash and also gases such as water vapor, carbondioxide, and sulphur dioxide into the atmosphere [Robock,2000]. These eruptions can occur in remote locations whichare not the focus of regular measurements, and the firstindications of such events often come from satellite observa-tions. These satellite measurements are key tools in detectingand tracking both ash and gases from eruptions. Sulphurdioxide (SO2) is often used as an indication of volcanichazard when using satellite observations [e.g., Carn et al.,2009], under the assumption that ash and SO2 are collo-cated passive tracers. However, it has been shown that thisassumption does not hold in general. This is usually due tothe differing densities of ash and SO2 coupled with verti-cal wind shear causing lateral separation of the ash and gasplumes [e.g., Schneider et al.,1999; Prata and Kerkmann,2007; Rose et al., 2000; Thomas and Prata, 2011]. Whileprevious work has demonstrated that separation does occur,in this work we introduce a numerical missed ash fraction,defined in section 2, which allows a quantitative assessmentof the effectiveness of SO2 as a proxy for ash and its evolu-tion throughout an eruption period. We use the eruptions ofEyjafjallajökull in 2010 and Puyehue in 2011 as case studies,
1Atmospheric, Oceanic and Planetary Physics, University of Oxford,Oxford, UK.
Corresponding author: G. E. Thomas, Atmospheric, Oceanic andPlanetary Physics, University of Oxford, Oxford, OX1 3PU, UK.([email protected])
©2013. American Geophysical Union. All Rights Reserved.2169-897X/13/10.1002/jgrd.50505
using ash flags derived from the Advanced Along TrackScanning Radiometer (AATSR), the Infrared AtmosphericSounding Interferometer (IASI) satellite instruments, and anSO2 flag derived from IASI.
[3] The volcanic ash hazard to aircraft arises from a rangeof physical damage done by the ash. The most significantof these is that, if ash enters a jet engine, it melts due tothe high operating temperatures (the melting point of vol-canic ash is � 1100 K while typical operating temperaturesof aircraft engines are � 1400 K, [Vogel et al., 2011]), andthen adheres to moving parts of the turbine, causing themto jam and, potentially, the engine to stall. One of the mostfamous examples of this, and the one which first broughtthe danger of ash to the media’s attention, was the case inJune 1982 of a British Airways Boeing 747-200 that lostpower to all four engines mid-flight. It glided for 16 minbefore the crew managed to restart three of the four enginesand make an emergency landing at Jakarta, Indonesia. Fol-lowing the incident, investigation of the engines revealedsignificant damage due to volcanic ash from the nearbyMt. Galunggung, which was erupting at the time [ICAO,2007]. Another similar incident occurred 3 weeks later, andanother during the 1989 eruption of Mt. Redoubt, Alaska.These further encounters confirmed that the 1982 BritishAirways incident was not a one-off event, and that any vol-canic ash encounter is likely to have serious consequences[Casadevall, 1994]. Other effects caused by ash encoun-ters include the sandblasting of the windscreen and landinglights, affecting visibility, the blocking of pitot tubes causingflight instruments to show incorrect readings, and interfer-ence with the communication systems in the aircraft dueto the charged nature of the ash particles [Casadevall andMurray, 2000]. Between the years 1970 and 2000, over 90aircraft sustained damage as a direct result of flying through
1
SEARS ET AL.: SO2 AS A POSSIBLE PROXY FOR VOLCANIC ASH
clouds of volcanic ash. The danger of the ash is compoundedby the fact that it is invisible on aircraft radar and so, par-ticularly at night, there is no way of pilots knowing if theyare heading for a hazardous cloud until they reach it andsymptoms begin.
[4] In addition to the potential loss of life and assets, thefinancial implications of any accident would be severe, as isthe cost associated with any prolonged closure of airspaceor airports as a result of a volcanic eruption—being ableto accurately predict ash cloud movements could thereforebring financial benefits to airlines. According to the Interna-tional Air Transport Association, during the 2010 eruptionof Eyjafjallajökull in Iceland, the closure of airspace overmuch of Europe caused a loss to the airline industry of anestimated US$1.7 billion (The International Air TransportAssociation press release no. 15, 21 April 2010: http://www.iata.org/pressroom/pr/Pages/2010-04-21-01.aspx).
[5] Although the immediate negative effects are not asserious as those from ash, SO2, which is also emitted in largeamounts from volcanoes, can also have a detrimental effecton aircraft, leading to degradation of parts and hence costlyrepairs [Vogel et al., 2011]. During 1983–1984, Japan Air-lines saw an increase from 1 to 30–40 in replacement cockpitwindows due to crazing. This was attributed to acidic con-ditions in the stratosphere due to long-lived stratosphericsulphuric acid (H2SO4) aerosols from the 1982 eruption ofthe El Chichón Volcano, Mexico [Bernard and Rose, 1990].
[6] As well as inconveniences to air travel, SO2 has anegative effect on the environment, mainly through thefollowing reactions:
SO2 + OH + M! HSO3 + M, (1)HSO3 + O2 ! HO2 + SO3, (2)
SO3 + H2O + M! H2SO4 + M, (3)
where M denotes either N2 or O2. The lifetime of SO2depends strongly on the availability of oxidizing agents, inparticular the presence of water vapor, but is typically a fewdays in the troposphere. The net result is the production ofsulphuric acid, which forms sulphate aerosol and, in highconcentrations, acid rain [Ward, 2009].
[7] While ash is the primary concern for air travel, SO2is, in general, easier to identify and quantify using remotesensing, since there is good sensitivity to absorption by SO2in both the ultraviolet and infrared regions, meaning thereare many different satellite instruments which can be usedto detect it. Also, background levels are generally low (lessthan 1 DU, compared to volcanic column amounts >1 DUwithin volcanic plumes over hundreds or thousands of kilo-meters downwind of an explosive eruption) and as a result,the majority of positive detections will be from volcanicactivity [Carn et al., 2009; Zehner, 2012]. Ash detectioncan be hampered by the presence of overlying ice or waterclouds causing the ash to be obscured and, in addition to this,high concentrations of water vapor in clouds can sometimesbe flagged as ash, thus causing false positive ash detections.Also, the presence of ice within the ash cloud can affectidentification [Clarisse et al., 2010]. Another difficulty withthe detection of ash is that sometimes ash clouds do not dis-play sufficient thermal contrast to distinguish them from theunderlying terrain and so do not show up in satellite images[Pergola et al., 2004].
[8] At the time of the 2010 eruption of Eyjafjallajökull,the London Volcanic Ash Advisory Centre (LVAAC), whichwas responsible for determining the areas likely to beaffected by ash, did not use quantitative data from satellitesfor this purpose due to the difficulties in reliably quantify-ing ash. Instead, it relied upon a sophisticated Lagrangianparticle dispersion model in order to predict the trajecto-ries of the ash particles, with satellite images simply beingused to verify the results obtained from the dispersionmodel [Webster et al., 2012]. The significant uncertaintiesin the model meant that a conservative estimate of the loca-tion and concentration of ash had to be taken in order toeliminate the possibility of any aircraft encountering unfore-cast ash. More quantitative estimates from satellite data arebeing developed to work alongside the dispersion modelto improve ash forecasts [Francis et al., 2012], but thedifficulty of determining ash properties from satellite dataremains. The use of satellite SO2 products by the VAACs isalready well developed, with the Support to Aviation Con-trol Service (SACS) regularly supplying near-real-time SO2products from a range of UV and infrared satellite sen-sors [van der A et al., 2010], so being able to reliably useSO2 as a proxy for ash would be advantageous to VAACs.Although there have been several studies comparing ash andSO2 emissions from various volcanic eruptions [Schneideret al., 1999; Prata and Kerkmann, 2007; Rose et al., 2000;Thomas and Prata, 2011], but these have been largely qual-itative. In this work we attempt to provide a quantitativemeasure of the effectiveness of satellite SO2 products as anash proxy.
1.2. Retrieval Techniques[9] The satellite used for the majority of the SO2 and
ash detection for the eruptions studied for the purposes ofthis paper was the Infrared Atmospheric Sounding Interfer-ometer (IASI) on board the EUMETSAT Metop-A satel-lite. However, for comparison, an ash retrieval was alsoused from the Advanced Along Track Scanning Radiome-ter (AATSR), which was stationed on board the now-defunctENVISAT satellite from 2002 until communication was lostwith the satellite in April 2012.1.2.1. IASI
[10] IASI completes a global scan once every 12 h. Theinstrument works in the thermal infrared region and uses aFourier transform spectrometer covering the spectral range645–2760 cm–1 (3.62–15.5�m). Its field-of-view consistsof four circular pixels, each of diameter 12 km at the sur-face, within a square of 50 km � 50 km, step-scanned acrosstrack in 30 steps, giving a swath of approximately 2000 km.Clerbaux et al. [2009] present a diagram of the setup intheir Figure 1. IASI has been widely used for the detectionof SO2, and a brightness temperature index based on chan-nels around the so-called �3 band centered at 7.3�m[Clarisse et al., 2008] is now included in the SACS system.
[11] Both the SO2 and ash detection schemes used withIASI in this work rely on the approach described by Walkeret al. [2011, 2012]. The scheme makes use of a generalizederror covariance that contains not only the instrument noise,but covariance due to interfering trace gases and broadbandscatterers (such as aerosols and clouds) that should be unre-lated to the required retrieved property. Since these signalsare included in the covariance, they need not be retrieved nor
2
SEARS ET AL.: SO2 AS A POSSIBLE PROXY FOR VOLCANIC ASH
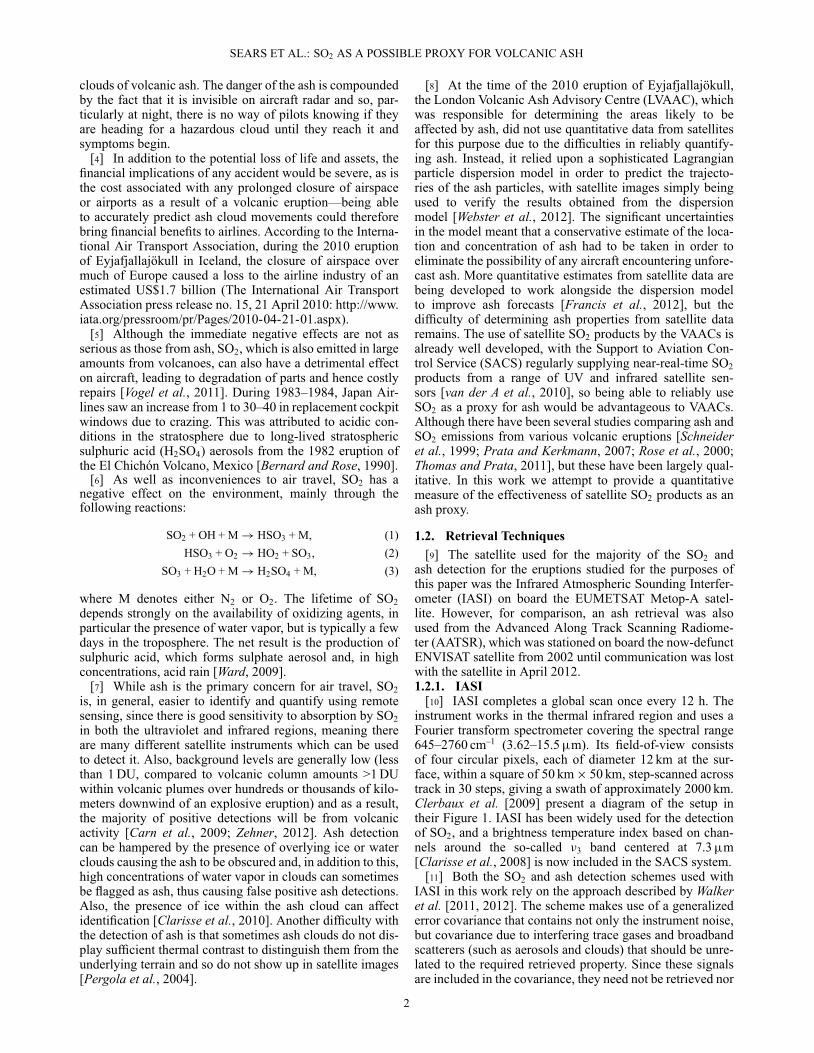
Figure 1. Optical depths at different wavelengths for SO2(assuming 5 DU centered at an altitude of 15 km, shown inblack) and ash (assuming a plume thickness of 1 km, an ashparticle effective radius of 2.26�m and a particle numberdensity of 10 cm–3, shown in green). Also shown are theregions sampled by both IASI (in blue) and AATSR (in red).SO2 short wave data are taken from Bogumil et al. [2003].
their variance taken account of in the forward model of theatmosphere.
[12] Using the notation of Rodgers [2000], we define themeasured spectra, y, as a function of the forward model,F(x, b):
y = F(x, b) + �random + �systematic, (4)where x is the quantity of interest (either optical depth ofvolcanic ash or column amount of SO2), b contains the prop-erties of some background atmospheric state, and � indicatesa vector of errors in F(x, b). The value of x is calculatedby linearizing about some fixed value, x0, leading to thefollowing expression:
y – F(x0, b) = K (x – x0) + �random + �systematic, (5)
where K is the Jacobian of y with respect to x. The leastsquares estimate of x can be obtained by
x = x0 +�KTS–1
� K�–1 KTS–1
� (y – F(x0, b)) . (6)
The error covariance matrix, S� , is built up from IASI mea-surements in the same geographical area and time of yearwhen no volcanic signals are present.
[13] This approach has the advantage of making use ofthe high spectral resolution provided by the IASI instrument,while not sacrificing computational speed. The retrievedvalue of x does, however, rely heavily on the choice oflinearization point and so requires independent calibrationmeasurements of x to provide accurate numerical results.
[14] The �3 absorption features (at 7.3�m) are used inthe SO2 detection scheme [Walker et al., 2012]. This detec-tion scheme is complemented with an SO2 column amountoptimal estimation retrieval, which uses both the 8.7�m�1 and �2 bands [Carboni et al., 2012]. The latter has thestrongest absorption; however, it lies within a strong absorp-tion band for water vapor and as a result is not very sensitive
to emission from the lower atmosphere. The 8.7�m band isweaker, but lies in an atmospheric window and so contains atotal column SO2 signal. By using both bands, the retrievalhas some sensitivity to plume height, as well as a columnamount.
[15] Walker et al. [2012] performed a sensitivity study ofthis IASI SO2 detection using data from the 2010 Eyjafjal-lajökull eruption. They found that the detection thresholddecreased exponentially with height; plumes that lay below2 km provided a threshold of 17 DU, but this rapidlyimproved to 3.3 DU between 2–4 km, 1.3 DU for 4–6 kmand reached 0.3 DU for the tropopause cold point. This sen-sitivity is approximately an order of magnitude better thanearlier IASI SO2 flags [Clerbaux et al., 2009; Zehner, 2012]and was able to reliably detect the plume from the earliestexplosive stages of the eruption.
[16] The application of this method to volcanic ash detec-tion with IASI is a more recent development, and theapproach taken is similar to that described by Clarisse et al.[2012]. In this case the x defined in equation 4 is the volcanicash optical depth, � , and a broad region of the IASI spectrumfrom 7.8–14.7�m is used. The value of � retrieved stronglydepends on the linearization point, �0 chosen, which lim-its its usefulness in determining the amount of ash present.However, the method has been found to be a useful ash flagfor the presence of ash clouds, as elevated ash amounts areclearly visible above the noise in the retrieved fields.1.2.2. AATSR
[17] AATSR measures radiance in seven different chan-nels ranging from the visible to the thermal infrared. One ofthe defining features of AATSR is the fact that it takes twoimages, one of which is a nadir view and the other a for-ward view at a zenith angle of 55ı. This allows the radiancefrom the surface and the radiance from particles in the atmo-sphere to be distinguished from each other, since in eachview the signal has a different atmospheric path length. Fol-lowing any particular forward view image, it takes � 150 sfor the satellite to be in a position such that the nadir viewsamples the same region, and as such the two views are near-simultaneous. The instrument has a swath width of 512 km(with 555 pixels across the nadir swath and 371 pixels acrossthe forward swath), and global coverage is achieved every3–6 days. The spatial resolution of this instrument is bet-ter than that of IASI (� 1 km as opposed to � 12 km),but the small swath width and relatively infrequent cover-age of any particular area reduces the number of coincidentmeasurements from AATSR, hence the desire for an IASIash retrieval. A full description of the AATSR instrument isgiven by Llewellyn Jones [1993] and Smith et al. [2001].
[18] The measured radiances were converted into ashheights using the parallax between the two images. Thebrightness temperature difference between the 10.8�m andthe 12�m channels can be used as a rough, qualitative indi-cation of the amount of ash present in each pixel. Thisbrightness temperature difference gives a negative valuewhere ash is present, but a positive value where water vaporor ice (i.e., cloud) is present, as described by Prata [1989]and Wen and Rose [1994]. In this work, a pixel was flaggedas ash if both of the following conditions were met:
BT10.8 – BT12.0 < –0.1K (7)
3

SEARS ET AL.: SO2 AS A POSSIBLE PROXY FOR VOLCANIC ASH
BT10.8 – BT3.7 < –20.0K. (8)
The additional condition on the brightness temperaturedifference between the 3.7�m and 10.8�m channels isimposed as a means of removing false detections, as high,cold ice cloud can also produce a negative 10.8–12�mbrightness temperature difference.1.2.3. Comparison of Instruments
[19] Figure 1 shows the spectral optical depth for a 5 DUcolumn of SO2, with a Gaussian altitude distribution cen-tered around 15 km, and a 1 km thick ash plume. Thehorizontal bars at the top of the plot show the wavelengthscovered by IASI and AATSR. From this it can clearly beseen that SO2 has a spectral-line based signature, whilethe corresponding result for ash is a broadband spectrum.Furthermore, all seven of the AATSR channels are com-pletely clear from the SO2 spectral features, meaning thatthe AATSR ash retrieval is unlikely to be affected by anySO2 present. The spectral region sampled by IASI, however,encompasses both ash and SO2 features, which suggests thatthe presence of ash may affect the IASI SO2 retrieval, andvice versa. This is found to be the case where ash concentra-tions are particularly high, such as very close to volcanoesthemselves, and a method to reduce this problem is discussedlater in relation to the 2011 eruption of Puyehue.
2. Methodology2.1. Determining Collocation
[20] In order to quantify the collocation of ash and SO2,we define a “missed ash fraction” (as well as an analogousmissed SO2 fraction), which can be used to compare anypair of satellite derived ash and SO2 products. We define themissed ash fraction as the ratio of the area containing ash,but no detectable SO2 to the total area containing ash. Underthe assumption that the ash-flag detection thresholds are notchanged by the presence of SO2, the following procedurecan be used to estimate the missed ash fraction.
[21] The products are first regridded onto a common spa-tial grid, where each grid cell is flagged as containing ashand/or SO2 if it contains any satellite pixels with a posi-tive detection from each flag. The two products can then bedirectly compared on a point by point basis. Then, havinglimited the set of grid cells to those present in both ash andSO2 products, the missed ash fraction is then defined as theratio of the number of pixels which have been flagged as ashbut not SO2, over the total number of pixels flagged as ash(i.e., pixels flagged as both ash and SO2 and those flaggedsolely as ash). This was carried out for two groups of orbitsper day (morning and afternoon) using the IASI data andcould be verified by AATSR readings where available.
2.2. Ash Detection Thresholds[22] One major issue which needed to be addressed was
to determine how the lower ash detection threshold of thesatellites corresponds to the lowest designated safe level ofash for aircraft flight. This is difficult to determine using theIASI ash flag, as it uses an empirical statistical approach noteasily simulated with radiative transfer; however, it can beestimated for AATSR. Using this value and studying cor-responding plots from the two satellites allows a relativethreshold of IASI compared to AATSR to be determined.
[23] Although there is no official international “no flylimit,” the International Civil Aviation Organization (ICAO)and the UK Civil Aviation Authority (CAA) have definedthree categories of ash concentration, �: low contamination(0.2 < � � 2 mg m–3), medium contamination (2 < � <4 mg m–3) and high contamination (� � 4 mg m–3) [CivilAviation Authority, 2011]. Areas of low contamination maybe entered by aircraft and are generally considered safe,while those of medium and high contamination require asafety case to be completed by airlines before flying throughthem, and, in general, commercial airlines only have thissafety case for the medium contamination ash situation.Thus the “no fly” limit is effectively 4 mg m–3. The thresh-olds are largely scientifically unverified due to the difficultyin determining them without putting lives at risk, and asa result a “zero tolerance” approach is often taken (and isadvised by the ICAO, [International Federation of AirlinePilots’ Associations, 2011]) in order to avoid any possibleincidents. Initially, a zero tolerance blanket restriction wasput in place during the 2010 eruption of Eyjafjallajökull, butfollowing pressure from airlines, the CAA introduced theabove limits on 18 May 2010. Using a Lagrangian trans-port model constrained by satellite observations of the ashcloud, Stohl et al. [2011] showed that, at a latitude-longituderesolution of 0.25 � 0.25ı (approximately 450 km2 at Euro-pean latitudes), the limit of 4 mg m–3 was only very rarelyexceeded, and even that of 2 mg m–3 was only exceeded ontwo occasions, and only over 1.5% and 0.9% of Europe,respectively. This result does not discount subgrid concen-trations that were significantly above these limits, and thedifference in spatial resolution between the resolution usedby Stohl et al. [2011] and the 1 km2 pixels size of AATSRshould be noted.
[24] Evidence from engine tests suggests that the con-centrations of ash which caused engine flameout in the1989 encounter with ash from Mt. Redoubt were as highas 2 g m–3 [Przedpelski and Casadevall, 1994]. The Institu-tion of Mechanical Engineers have calculated, based on thefact that 80 kg of ash were found deposited in each turbineengine, that if the plane had been flying in the same condi-tions but with only 4 mg m–3 (the currently accepted absoluteno-fly limit) then only 160 g of ash would have made itsway into the engines, suggesting a hugely cautious safetythreshold [Institution of Mechanical Engineers, 2010]. Forthese reasons, many believe the thresholds given above aretoo severe. Nevertheless, until more definitive tests can becarried out on aircraft engines, and satellite measurementsof ash concentrations made with only negligible uncertainty,then it will remain necessary to be over-cautious in thismatter.
[25] By assuming the ash lies in a homogeneous layer ofuniform thickness s then the optical depth � of the plume canbe estimated as
� =Z s
0ˇdz � ˇs
where ˇ is the extinction coefficient. Using spectral extinc-tion measurements of ash from Mt. Aso, Japan (D. M. Peters,personal communication, 2012), the value of ˇ obtainedfor the ash is 0.03 km–1 at 550 nm assuming a concentra-tion of 1 particle cm–3. Aso ash extinctions were used as aproxy for Eyjafjallajökull, as the measurements were read-ily available at the time—subsequent comparison of spectra
4

SEARS ET AL.: SO2 AS A POSSIBLE PROXY FOR VOLCANIC ASH
Figure 2. Variation of the threshold optical depth for ashdetection (calculated using the DISORT model) with plumealtitude, assuming a particle effective radius of 2.26�m anda plume thickness of 1 km.
from Eyjafjallajökull ash samples have shown it to be simi-lar enough for this analysis to be considered valid. This canthen be used to calculate an expression for the number den-sity of ash particles as a function of optical depth and plumethickness. A range of in situ and ground based estimatesof the particle size distribution within the distal ash cloudfrom Eyjafjallajökull are available. Measurements from theFacility for Airborne Atmospheric Measurement (FAAM)BAe 146 aircraft and AERONET stations in North West-ern Europe [Johnson et al., 2012; Derimian et al., 2012]both suggest an ash effective radius of �1.3–1.6�m, whilemeasurements from the DLR Falcon aircraft found largerparticles, with an effective radius of 6.3�m [Turnbull et al.,2012]. The effect radius assumed in calculating the radiativeproperties of the Aso ash was 2.26�m.
[26] Using the Discrete Ordinates Radiative Transfer(DISORT) model [Stamnes et al., 1988] with the assumedeffective radius of 2.26�m and plume thickness of 1 km, itwas discovered that the threshold ash detection optical depthfor AATSR varies as a function of ash altitude, as shown inFigure 2. If it is assumed that most of the ash lies at an alti-tude of between 3 and 6 km, as seems to be the case from theAATSR height retrievals [Grainger et al., 2013], as well asin situ [Turnbull et al., 2012] and lidar [Marenco et al., 2011]aircraft measurements, then it can be seen that the thresholdoptical depth can be taken very approximately as equal to 1.
[27] Using an ash density value of �ash = 2400 kg m–3
[Niemeier et al., 2009] allows a relationship between opti-cal depth, layer depth, and ash concentration to be found(Figure 3). The approximate detection threshold is marked asa white vertical line in the figure, and the black line indicatesthe ICAO/CAA threshold of 4 mg m–3. Any points belowthis line denote ash concentrations above the high contami-nation threshold. It is stated in Winker et al. [2012] that theash plume from Eyjafjallajökull was between 0.4 and 1 kmthick at altitudes between 1 and 7 km. It can be seen thatat a plume thickness of 0.4 km, there is a region to the leftof the detection threshold, which is still within the no fly
concentration region. Thus, there is potentially some areas ofhigh contamination which are not being detected by AATSR.Although at a thickness of 1 km this is no longer the case,the fact that the relevant plume thickness range is right onthe boundary between all significant ash being detected andsome being missed means that, in reality, the chances arethat some ash in the plume will be missed by AATSR. It canalso be seen from Figure 3 that for all plumes with a thick-ness less than � 700 m, all of the ash which is detected willoccur in concentrations higher than the 4 mg m–3 threshold,so no ash flags should be ignored unless there is very strongevidence that it is a false positive detection.
[28] This calculation has assumed throughout the pres-ence of ash in isolation, and so it should be mentionedagain that the presence of ice or water cloud can affect theresults and hence can alter this detection threshold, as canthe presence of an ice/ash mixture.
[29] By looking at the amounts of ash detected by theIASI and AATSR on the same day, an estimate of the rela-tive ash detection thresholds can be made. As an example,Figure 4 shows these results for 9 May 2010 during theEyjafjallajökull eruption, calculated using a grid box of sidelength equivalent to 0.5ı longitude and latitude. The Metopand ENVISAT platforms are both in sun-synchronous orbits,with local equatorial crossing times of 9:30 and 10:00,respectively. Thus, although there will be some evolution ofthe scene during this interval, observations of the ash cloudbetween the two instruments should be highly correlated atthis spatial scale. The red points in Figure 4 show whereboth satellites agree that ash is present. The green and bluepoints at the edges of the plume denote where just IASI andjust AATSR respectively detect ash. The higher occurrenceof blue points than green ones shows that there are more gridboxes where ash is being detected by AATSR than by IASI,hence suggesting that IASI is slightly less sensitive to ash(i.e., has a slightly higher detection threshold concentration).
Figure 3. The concentrations of ash present at differentoptical depths for different thicknesses of plume (assumedhomogeneous). The white vertical line denotes the detec-tion threshold for the AATSR satellite, the horizontal dashedlines denote the probable range of geometrical plume thick-nesses given by Winker et al. [2012], and the black linecorresponds to a concentration of 4 mg m–3.
5

SEARS ET AL.: SO2 AS A POSSIBLE PROXY FOR VOLCANIC ASH
Figure 4. Results from 9 May 2010 for comparisonbetween the ash detection of IASI and AATSR. (grey)Neither satellite detects ash; (green) Only IASI detectsash; (blue) Only AATSR detects ash; (red) Both satellitesdetect ash.
3. Studies of Particular Eruptions3.1. Eyjafjallajökull 2010
[30] In April and May 2010, there was a major eruptionof the Eyjafjallajökull volcano, Iceland (63.63ıN, 19.62ıW;1666 m a.s.l.), with the main explosive phase of the eruptionbeginning on 14 April. IASI data from the period 14 Aprilto 17 May were studied, with two images per day. A more
limited sampling of AATSR images (due to its narrowswath) were also available for comparison with IASI, sothe behavior of the two species could be observed over theperiod of a whole month.
[31] Four days were looked at in detail, and results fromthe entire period analyzed. Figure 5 shows the maps for the4 days of interest using ash and SO2 flags from IASI, whileFigure 6 shows the corresponding images using AATSR forthe ash detection. The missed ash fraction, as defined insection 2, can be thought of as the number of blue points inthese figures, divided by the number of blue plus red points.
[32] The IASI calculations used a grid box of side lengthequivalent to 0.1ı longitude and latitude, while those usingthe AATSR ash flag used a grid box of side length equiv-alent to 0.5ı longitude and latitude. The region covered inthe IASI case was 50ıW–40ıE, 45ıN–70ıN, while due toits smaller swath width, the AATSR region was smaller andcovered 30ıW–10ıE, 48ıN–72ıN. The IASI ash flag used athreshold value of six retrievals flagging high optical depth(out of a total of 24) to indicate the presence of ash, whilethe AATSR flag used the thresholds defined in equations (7)and (8).
[33] The initial stages of the eruption were characterizedby strong ash emission, but little SO2 [Thomas and Prata,2011]. This is probably partly due to the fact that the eruptionoccurred from beneath a glacier, and so initially, there was alot of ice and water present, meaning much of the SO2 couldreact via equations (1)–(3) to form sulphuric acid beforemaking it into the distal ash cloud observed from space. Thiscan be seen in Figure 5a which shows the area on 15 April.The red points denote collocation of ash and SO2 and showthat the two species are strongly correlated for much of theplume. However a certain amount of separation of species is
Figure 5. The location of ash and SO2 from the Eyjafjallajökull eruption for the mornings of (a) 15 April,(b) 7 May, (c) 9 May, and (d) 15 May 2010 using the IASI SO2 and ash flags. In each map the black crossmarks the location of the volcano. (red) Both ash and SO2 are present; (blue) Only SO2 is present (green);Only ash is present.
6

SEARS ET AL.: SO2 AS A POSSIBLE PROXY FOR VOLCANIC ASH
Figure 6. The location of ash and SO2 from the Eyjafjallajökull eruption for the mornings of (a) 15 April,(b) 7 May, (c) 9 May, and (d) 15 May 2010 using the IASI SO2 and AATSR ash flags. In each map theblack cross marks the location of the volcano. (red) Both ash and SO2 are present; (green) Only SO2 ispresent; (blue) Only ash is present; (grey) No AATSR data, but SO2 is present; (orange) No IASI data,but ash is present.
evident, with the blue and green points representing just ashand just SO2, respectively. This agrees with what Thomasand Prata found in their study using data from the SpinningEnhanced Visible and Infrared Imager (SEVIRI) and OzoneMonitoring Instrument (OMI) [Thomas and Prata, 2011].Figure 6a shows the corresponding plot using AATSR forash detection, which appears to agree very closely with thatfrom IASI in the plume. One major anomaly is the apparentadditional ash cloud off the west coast of Ireland. How-ever, when this is studied using a false color image of theAATSR data, this cloud is not visible and does not show upnoticeably on visual inspection of a plot of the brightnesstemperature difference described in section 1.2.2. Therefore,it must be concluded that this is a false positive result, pos-sibly due to ice cloud, which can affect AATSR retrieval.Further suspected false positives are evident in the IASIimage in a region around 52ıN, 35ıE. The reason for theseis unknown.
[34] Following this initial explosive phase, there followeda much quieter period with very little long range ash trans-port. The lull in activity was observed in the results fromIASI and AATSR with only relatively few points flaggingash or SO2 during this period. This was followed by a fur-ther period with stronger ash and gas emission from 5 May[Prata and Prata, 2012]. The increase in activity was alsoobserved by IASI and AATSR. The next date shown is7 May (Figures 5b and 6b). The IASI plot shows some sig-nificant areas of collocation throughout the plume, but also asignificant quantity of SO2 without corresponding ash. Froman aviation safety situation, this appears to be a scenariowhere, if SO2 were used as a proxy, it would overestimate
the region containing ash. The corresponding AATSR imagealso gives the same result for the region covered by theAATSR swath, as does the information presented by Thomasand Prata [2011]. Their data also highlight the fact that, ingeneral, it is regions of low SO2 concentration which lackcorresponding ash detection. Thus, there is the possibilitythat ash is in fact present here, but in concentrations belowthe detection threshold of the instruments. As discussed insection 2.2, it is possible that this ash is still in concentrationsthat exceed the high contamination threshold.
[35] Figures 5c and 6c show the situation on 9 May. TheIASI plot (Figure 5c) clearly shows the long SO2 plume andsuggests that ash collocation only occurs in certain areas ofthe plume. The AATSR plot (Figure 6c) backs up this sug-gestion, although the fact that AATSR only covers a narrowregion of the map means that it cannot be used to verify allof the IASI information. Once again, in both figures, thereis the possibility that areas which are detected as containingonly SO2 may in fact contain ash at concentrations belowthe detection thresholds for the two satellites, but potentiallyabove the high contamination threshold. Figure 7 shows anindication of the column amount of SO2 present in eachpixel for IASI, as retrieved using the method of Carboniet al. [2012], and Figure 8 shows the brightness tempera-ture difference (described in section 1.2.2) for the AATSRdata, which gives a first-order indication of the amount ofash present. The feature which is easy to identify in all theplots for this particular day is the region of collocation cen-tered at around 59ıN, 20ıW, which is visible as a “pool”of red points in Figures 5c and 6c. It can be seen fromFigure 7 that this region is where the SO2 concentration
7

SEARS ET AL.: SO2 AS A POSSIBLE PROXY FOR VOLCANIC ASH
Figure 7. Amount of SO2 from the Eyjafjallajökull erup-tion for the morning of 9 May 2010. The black cross marksthe location of the volcano.
is highest in this part of the cloud (with a column amountof �10 DU), while the surrounding concentrations are low(<5 DU). From the ash map (Figure 8), it is clear that evenwhere ash is detected in the area around 59ıN, 20ıW, theamount present is significantly less than in the main plume asevidenced by brightness temperature differences approach-ing zero. Hence, the ash may well be present in the wholecloud, but undetectable.
[36] The final images to be studied are those from 15 May(Figures 5d and 6d). The IASI image again clearly shows alarge plume of gases, with ash only showing up for a certainproportion of the plume. As for the other dates, this is essen-tially mirrored by the AATSR map, but with the AATSR mapperhaps showing slightly more ash, further suggesting thepossibility of a slightly lower detection threshold as foundearlier. What should be noted is the lack of blue points inall of the panels shown from this later part of the eruption,demonstrating that although SO2 frequently appears with-out any corresponding ash, the converse is rarely true, whichmay suggest that SO2 could serve as a conservative proxy forthe possible presence of ash. However, this will be examinedin more detail below and shown not always to be the case.
3.2. Puyehue 2011[37] Beginning in June 2011, there was a volcanic erup-
tion from the Puyehue-Cordón Caulle volcanic complex,Chile (40.5ıS, 72.2ıW; 1793 m a.s.l.). IASI covered thewhole region twice a day and data from 5 June to 2 Julywere studied. One AATSR snapshot was available foreach day from 6 to 9 June. However the limited cov-erage of AATSR meant that these images were of verylimited benefit and so were only used for the verifica-tion of the IASI ash flag around the crater (see below).The distal ash cloud from this eruption eventually cir-cled the globe and caused the cancelation of flights fromAustralia and New Zealand (http://earthobservatory.nasa.gov/NaturalHazards/view.php?id=50985). For this case theregion used for study was 180ıW–180ıE (i.e., the entirelongitude range), and 58ıS–24ıS. For the majority of theregion, the same IASI ash flag threshold was used as for the
Eyjafjallajökull eruption to minimize noise, while maximiz-ing the ash detection. However, the high concentrations ofash around the volcano and the high altitude of the plumemeant that the ash flag failed to work correctly and missedsignificant areas where ash had been detected and confirmedby AATSR. Because of this, for a small region around thecrater itself, a lower ash flag threshold value was used inorder to pick up ash in this region.
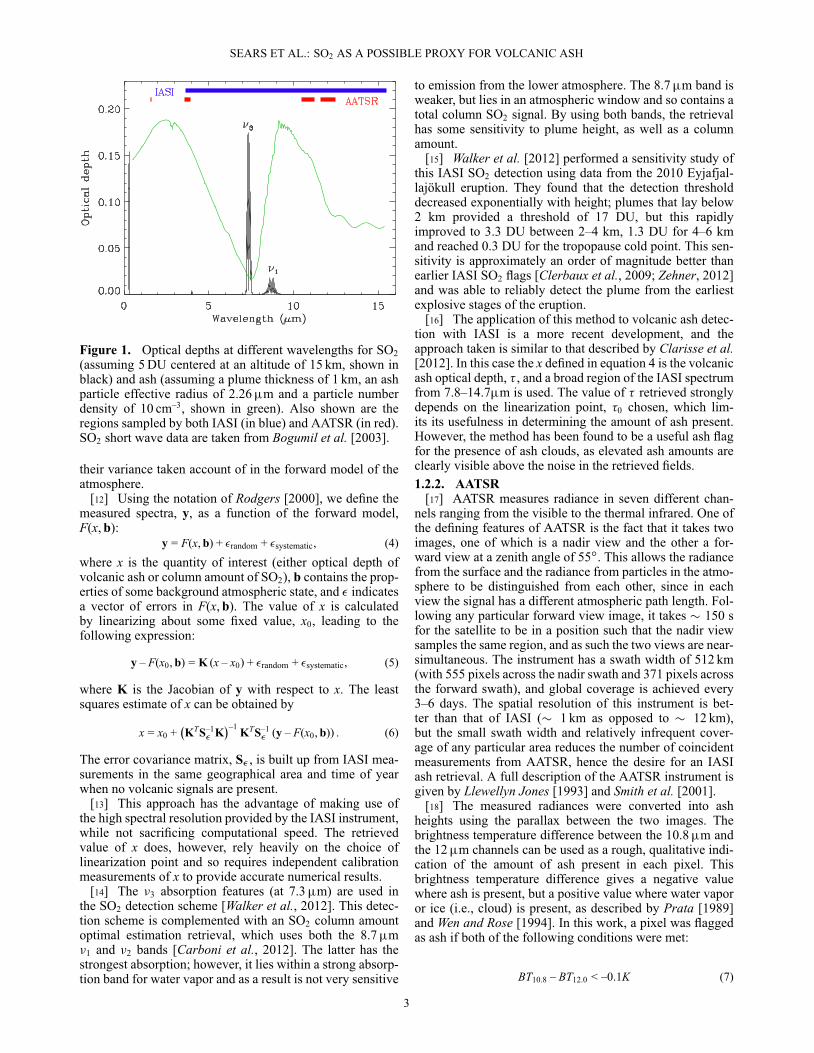
[38] One example plot from this eruption (9 June 2011)is given in Figure 9. Close to the volcano, there is an areawith a significant amount of ash present without any corre-sponding SO2 (although this could be partly due to the forcedlower flag threshold mentioned above). There is also a largevolcanic cloud stretching across the ocean toward Australiaand New Zealand. This cloud, as for most of those seen forEyjafjallajökull, shows collocation for a lot of its area, withthe remainder being flagged as containing SO2 but no ash.Again, it may be that undetectable, but potentially exceed-ing the high contamination threshold, ash is present even inthe regions where it is not being flagged.
4. Analysis[39] The missed ash fraction calculation described in
section 2 was applied to the gridded data, as shown inFigures. 5, 6 and 9, for the full period of each eruption andplotted as a function of time since the start of the eruption(bottom panels in Figures 10 and 11). The top panels ineach case show the total number of grid boxes, which wereflagged as containing ash on each day. The day to day vari-ability of the plotted quantity is indicated by the error bars,which are the RMS of the difference between the plottedvalue on successive days. These plots do not relate simply tothe evolution of the ash cloud with time or distance traveledfrom the volcano, since they show the results for the entireash and SO2 clouds, regardless of emission time. However,they do serve to show the level of consistency in the corre-spondence of the two products. It can immediately be seenthat the amount of ash missed shows considerable variabilityover time.
Figure 8. Brightness temperature difference between the10.8�m and 12�m channels of AATSR for the Eyjafjalla-jökull eruption for the morning of 9 May 2010. The blackcross marks the location of the volcano.
8
SEARS ET AL.: SO2 AS A POSSIBLE PROXY FOR VOLCANIC ASH
Figure 9. The location of ash and SO2 from the Puyehue eruption for the morning of 9 June 2011 usingthe IASI SO2 and ash flags. The black cross marks the location of the volcano. (red) Both ash and SO2are present; (green) Only SO2 is present; (blue) Only ash is present.
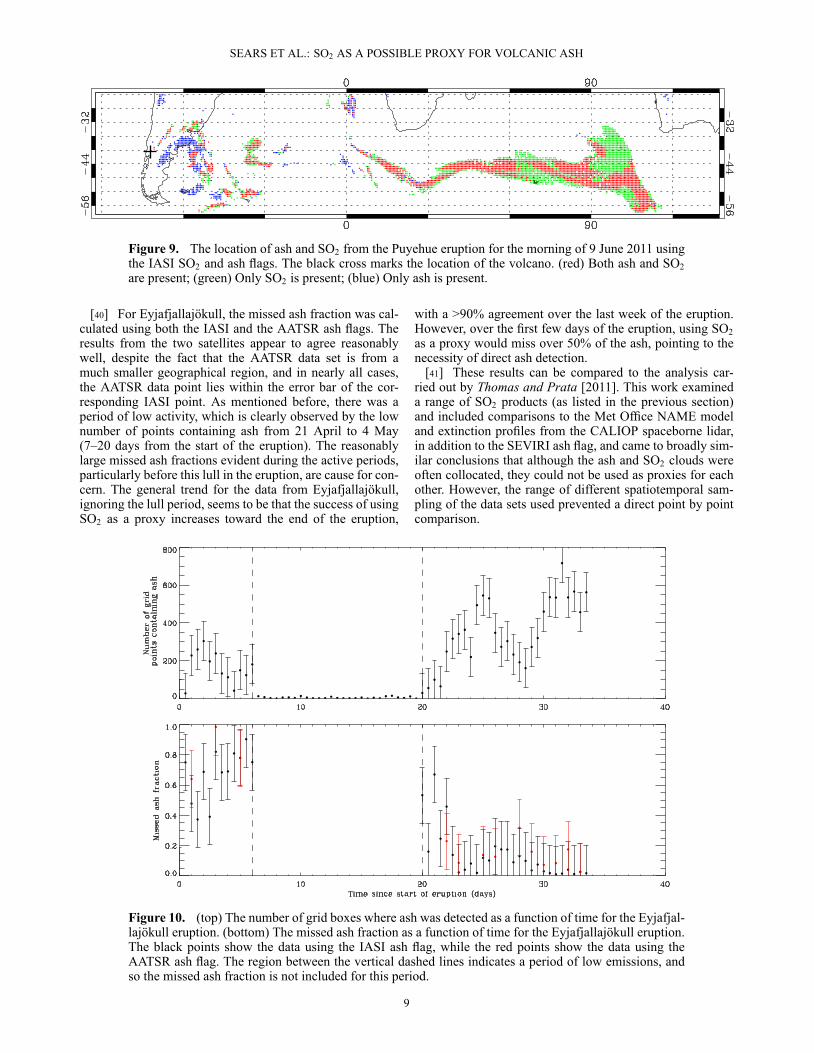
[40] For Eyjafjallajökull, the missed ash fraction was cal-culated using both the IASI and the AATSR ash flags. Theresults from the two satellites appear to agree reasonablywell, despite the fact that the AATSR data set is from amuch smaller geographical region, and in nearly all cases,the AATSR data point lies within the error bar of the cor-responding IASI point. As mentioned before, there was aperiod of low activity, which is clearly observed by the lownumber of points containing ash from 21 April to 4 May(7–20 days from the start of the eruption). The reasonablylarge missed ash fractions evident during the active periods,particularly before this lull in the eruption, are cause for con-cern. The general trend for the data from Eyjafjallajökull,ignoring the lull period, seems to be that the success of usingSO2 as a proxy increases toward the end of the eruption,
with a >90% agreement over the last week of the eruption.However, over the first few days of the eruption, using SO2as a proxy would miss over 50% of the ash, pointing to thenecessity of direct ash detection.
[41] These results can be compared to the analysis car-ried out by Thomas and Prata [2011]. This work examineda range of SO2 products (as listed in the previous section)and included comparisons to the Met Office NAME modeland extinction profiles from the CALIOP spaceborne lidar,in addition to the SEVIRI ash flag, and came to broadly sim-ilar conclusions that although the ash and SO2 clouds wereoften collocated, they could not be used as proxies for eachother. However, the range of different spatiotemporal sam-pling of the data sets used prevented a direct point by pointcomparison.
Figure 10. (top) The number of grid boxes where ash was detected as a function of time for the Eyjafjal-lajökull eruption. (bottom) The missed ash fraction as a function of time for the Eyjafjallajökull eruption.The black points show the data using the IASI ash flag, while the red points show the data using theAATSR ash flag. The region between the vertical dashed lines indicates a period of low emissions, andso the missed ash fraction is not included for this period.
9

SEARS ET AL.: SO2 AS A POSSIBLE PROXY FOR VOLCANIC ASH
Figure 11. (top) The number of grid boxes where ash was detected as a function of time for the Puyehueeruption using the IASI ash flag. (bottom) The missed ash fraction as a function of time for the Puyehueeruption using the IASI ash flag.
[42] For the eruption of Puyehue, the mean amount of ashmissed is 33%. Furthermore, there is no dramatic lull in theeruption here, as evidenced in Figure 11 (top), where thenumber of ash points remains relatively high throughout. Inmost of the maps for this eruption, it is evident that the vastmajority of the points where ash is flagged without corre-sponding SO2 are close to the volcano itself. This is perhapscounterintuitive, but it could well be that there is in fact SO2present here, which is not being picked up due to the largeamounts of ash masking the SO2 detection. Nevertheless, ifthe SO2 is not detectable, then it is no good as a proxy forash, whether it is actually present or not. In an opposite trendto the case of Eyjafjallajökull, the missed ash fraction showsan upward trend, rising from �20% during the first half ofthe eruption to frequent values of over 50% in the last 10days. This is believed to be due to the wind conditions duringthis particular case study, which may have caused the speciesto separate more in the later part of the eruption. Also, forPuyehue, the cloud extended around an entire latitude circleover the course of approximately 1 week, providing moreopportunity for the ash and SO2 to separate and for SO2 tobe oxidized.
[43] The data from the Puyehue eruption further show thatSO2 is not a suitable proxy to use, since missing � 30% ofash is definitely not acceptable. The differing trends betweenthe eruptions studied demonstrates that there is no clearand predictable pattern which can be adopted, and eruptionsmust be studied on a case-by-case basis.
[44] The missed ash fractions only provide a very roughindication of how much ash is being missed in each caseand give a spatial fraction rather than a fraction by mass,
as any amount of detectable ash or SO2 within each gridbox causes the box to be flagged as containing that species,regardless of concentration. The flags themselves have somepotential problems (as discussed in section 1.2), causing ashor SO2 to remain undetected when they are in fact present,and also causing false positive detections due to water or icecloud, or just due to inherent noise in the retrievals. On topof these, the methods involved have introduced some furtheruncertainty; first, not all the ash or SO2 from the eruption isnecessarily included in the calculations, as the calculationsare only taken over a certain geographical region, so any ashor gases outside this particular zone will not be included.Furthermore, the resolution for Eyjafjallajökull is only 0.1ılongitude and latitude at best, and for Puyehue, it is only0.5ı longitude and latitude, which can cause some errors,particularly at the edges of the plumes. The errors have beenestimated from the obtained data by taking the RMS valueof the differences between each successive measurement ofmissed ash fraction and total ash fraction for the IASI data.Since consecutive points from AATSR are not necessarilyon consecutive days, the error on these measurements cannotbe estimated directly, and so have been assumed to be equalto the errors found in the IASI case. In reality, the errors forAATSR may be slightly higher due to the coarser grid usedin the analysis of the data.
[45] Some ash exceeding the high contamination thresh-old will remain undetected by IASI and AATSR, which willcause a slight departure in each calculation from the “true”missed ash fraction. Whether it has overestimated or under-estimated the amount of missed ash cannot be specified, as itdepends on the location of the undetected ash. An educated
10

SEARS ET AL.: SO2 AS A POSSIBLE PROXY FOR VOLCANIC ASH
guess would lead us to suspect that the undetected ash islocated on the green points on the plots (i.e., in the locationsflagged as containing SO2 but no ash) immediately adjacentto points where ash is detected (i.e., red points), which wouldthus improve (lower) the missed ash fraction if all ash wasdetected. Where strong vertical wind shear has affected thevolcanic cloud, this may not be the case and ash may in factexist at locations without any SO2. For different eruptions,which may have slightly different ash properties, the exactflag thresholds will vary slightly, so it can never be assumedthat all ash is being detected.
5. Conclusions[46] Comparisons of volcanic SO2 detected by the IASI
instrument and volcanic ash detected by the IASI andAATSR instruments from the 2010 eruption of Eyjafjalla-jökull and the 2011 eruption of Puyehue-Cordón Caulle havebeen compared, using the concept of a missed ash fractionbased on regridded data. For both eruptions the emitted SO2and ash clouds showed considerable coincidence on visualinspection. The calculated missed ash fractions showed thatin some instances using SO2 as a proxy for the location ofthe ash cloud would result in less than 10% of the satellitedetected ash being missed, although the overall area of ashcontamination would be substantially over estimated, partic-ularly during the later stages of the Eyjafjallajökull eruption.However, the degree collocation was found to be very vari-able, both between the two eruptions and throughout thecourse of each eruption. On the worst days, more than 80%of the observed ash cloud was found to be not coincidentwith detected SO2.
[47] Reasons for this variability include the separation ofthe clouds due to wind shear and differences in the atmo-spheric life times of the two species [Thomas and Prata,2011; Prata and Kerkmann, 2007]. Limitations of the twodetection schemes, such as masking of ash by ice or waterclouds, or the masking of SO2 spectral signatures by veryhigh ash loading, also contribute.
[48] It is clear that satellite sensors can provide valuabledetection of both ash and SO2, at sensitivities that are of rel-evance to aircraft safety, but neither method is 100% reliableand one can certainly not be taken as a proxy for the other.Given the wide range of both UV and infrared instrumentswhich are capable of detecting SO2, as well as the limitationsof ash detection from space, the use of satellite SO2 productsin mitigating the aviation hazard is clearly justified, both indetecting the occurrence of eruptions in remote locations andas an initial indicator of areas that present a potential avia-tion hazard. However, direct ash detection by satellite is alsorequired.
[49] The simplicity and speed of simple ash and SO2detection algorithms, such as those used here, makes themsuitable for adaptation to operational near-real-time prod-ucts, which should greatly improve confidence in the disper-sion models used by the VAACs.
[50] Acknowledgments. The authors would like to thank PatrickWatts, Adam Povey, and Daniel Peters for their input to this paper. Thiswork was partly funded by the UK Natural Environment Research Coun-cil (NERC) National Centre for Earth Observation (NCEO) and the NERCVANAHEIM project NE/1015592/1.
ReferencesBernard, A., and W. Rose (1990), The injection of sulfuric acid
aerosols in the stratosphere by the El Chichón volcano and itsrelated hazards to the international air traffic, Nat. Hazards, 3, 59–67,doi:10.1007/BF00144974.
Bogumil, K., et al. (2003), Measurements of molecular absorption spec-tra with the SCIAMACHY pre-flight model: Instrument characterizationand reference data for atmospheric remote-sensing in the 230–2380 nmregion, J. Photoch. Photobio. A, 157(2-3), 167–184, doi:10.1016/S1010-6030(03)00062-5.
Carboni, E., R. Grainger, J. Walker, A. Dudhia, and R. Siddans (2012),A new scheme for sulphur dioxide retrieval from IASI measurements:Application to the Eyjafjallajökull eruption of April and May 2010,Atmos. Chem. Phys., 12(23), 11417–11434, doi:10.5194/acp-12-11417-2012.
Carn, S., A. Krueger, N. Krotkov, K. Yang, and K. Evans (2009), Track-ing volcanic sulfur dioxide clouds for aviation hazard mitigation, Nat.Hazards, 51, 325–343, doi:10.1007/s11069-008-9228-4.
Casadevall, T. J. (1994), The 1989–1990 eruption of Redoubt volcano,Alaska: Impacts on aircraft operations, J. Volcanol. Geoth. Res., 62(1–4),301–316.
Casadevall, T. J., and T. M. Murray (2000), Advances in volcanic ashavoidance and recovery, Boeing Aero Mag., 9, 19–27, http://www.boeing.com/commercial/aeromagazine/aero_09/volcanic_story.html, Accessed25 July 2012.
Civil Aviation Authority, (2011), Guidance regarding flight operationsin the vicinity of volcanic ash, CAA Technical Notice, SN-2011/004,http://www.caa.co.uk/docs/1425/20110526GuidanceRegardingFlightOp-erationsInTheVicinityOfVolcanicAsh.pdf, Accessed 27 July 2012.
Clarisse, L., P. F. Coheur, A. J. Prata, D. Hurtmans, A. Razavi, T. Phulpin,J. Hadji-Lazaro, and C. Clerbaux (2008), Tracking and quantifying vol-canic SO2 with IASI, the September 2007 eruption at Jebel at Tair, Atmos.Chem. Phys., 8(24), 7723–7734, doi:10.5194/acp-8-7723-2008.
Clarisse, L., F. Prata, J.-L. Lacour, D. Hurtmans, C. Clerbaux, and P. F.Coheur (2010), A correlation method for volcanic ash detection usinghyperspectral infrared measurements, Geophys. Res. Lett., 37, L19806,doi:10.1029/2010GL044828.
Clarisse, L., P.-F. Coheur, F. Prata, J. Hadji-Lazaro, D. Hurtmans, and C.Clerbaux (2012), A unified approach to infrared aerosol remote sens-ing and type specification, Atmos. Chem. Phys., 13(4), 2195–2221,doi:10.5194/acp-13-2195-2013.
Clerbaux, C., et al. (2009), Monitoring of atmospheric composition usingthe thermal infrared IASI/Metop sounder, Atmos. Chem. Phys., 9 (16),6041–6054, doi:10.5194/acp-9-6041-2009.
Derimian, Y., O. Dubovik, D. Tanre, P. Goloub, T. Lapyonok, andA. Mortier (2012), Optical properties and radiative forcing of theEyjafjallajökull volcanic ash layer observed over Lille, France, in 2010,J. Geophys. Res., 117, D00U25, doi:10.1029/2011JD016815.
Francis, P. N., M. C. Cooke, and R. W. Saunders (2012), Retrieval ofphysical properties of volcanic ash using Meteosat: A case study fromthe 2010 Eyjafjallajökull eruption, J. Geophys. Res., 117, D00U09,doi:10.1029/2011JD016788.
Grainger, R. G., D. M. Peters, G. E. Thomas, A. Smith, R. Siddans, E.Carboni, and A. Dudhia (2013), Measuring volcanic plume and ashproperties from space, in remote sensing of volcanoes and volcanic pro-cesses: Integrating observation and modelling, Geol. Soc. Spec. Publ.,380, doi:10.1144/SP380.7, in press.
ICAO (2007), Manual on Volcanic Ash, Radioactive Material, and ToxicChemical Clouds (2nd edn), International Civil Aviation Organization,Doc. 9691, AN/954, Montreal, Canada. http://www.paris.icao.int/news/pdf/9691.pdf, Accessed 11 July 2012.
International Federation of Airline Pilots’ Associations (2011), Flightoperations in the presence of volcanic contamination. Aircraft Design& Operation Committee Statement, 12POS01, http://www.ifalpa.org/ifalpa-statements/aircraft-design-a-operation.html, Accessed 11 July2012.
Institution of Mechanical Engineers, (2010), Volcanic ash: To fly or not tofly, Tech. Rep., Institution of Mechanical Engineers.
Johnson, B., et al. (2012), In situ observations of volcanic ash clouds fromthe FAAM aircraft during the eruption of Eyjafjallajökull in 2010, J.Geophys. Res., 117, D00U24, doi:10.1029/2011JD016760.
Llewellyn Jones, D. (1993), Precise sea-surface temperature measurementfrom the ERS-1 satellite—A Climate Challenge, Endeavour, 17(2),52–59, doi:10.1016/0160-9327(93)90197-B.
Marenco, F., B. Johnson, K. Turnbull, S. Newman, J. Haywood, H.Webster, and H. Ricketts (2011), Airborne lidar observations of the 2010Eyjafjallajökull volcanic ash plume, J. Geophys. Res., 116, D00U05,doi:10.1029/2011JD016396.
11

SEARS ET AL.: SO2 AS A POSSIBLE PROXY FOR VOLCANIC ASH
Niemeier, U., C. Timmreck, H.-F. Graf, S. Kinne, S. Rast, and S. Self(2009), Initial fate of fine ash and sulfur from large volcanic eruptions,Atmos. Chem. Phys., 9(22), 9043–9057, doi:10.5194/acp-9-9043-2009.
Pergola, N., V. Tramutoli, F. Marchese, I. Scaffidi, and T. Lacava (2004),Improving volcanic ash cloud detection by a robust satellite technique,Remote Sens. Environ., 90(1), 1–22, doi:10.1016/j.rse.2003.11.014.
Prata, A. (1989), Observations of volcanic ash clouds in the 10–12�mwindow using AVHRR/2 data, Int. J. Remote Sens., 10(4-5), 751–761.
Prata, A. J., and J. Kerkmann (2007), Simultaneous retrieval of volcanicash and SO2 using MSG-SEVIRI measurements, Geophys. Res. Lett., 34,L05813, doi:10.1029/2011JD016800.
Prata, A. J., and A. T. Prata (2012), Eyjafjallajökull volcanic ash concentra-tions determined using Spin Enhanced Visible and Infrared Imager mea-surements, J. Geophys. Res., 117, D00U23, doi:10.1029/2006GL028691.
Przedpelski, Z. J., and J. Casadevall (1994), Impact of volcanic ash from 15December 1989 Redoubt volcanic eruption on GE CF6-80C2 turbofanengines, in Volcanic Ash and Aviation Safety: Proceedings of the FirstInternational Symposium on Volcanic Ash and Aviation Safety, July 1991,pp. 129–135, U.S. Geological Survey Bulletin 2047, Seattle, Washington.
Robock, A. (2000), Volcanic eruptions and climate, Rev. Geophys., 38(2),191–219.
Rodgers, C. D. (2000), Inverse Methods for Atmospheric Sounding: The-ory and Practice, pp. 65–72, World Scientific Publishing Co., Singapore.
Rose, W. I., G. J. S. Bluth, and G. G. J. Ernst (2000), Integratingretrievals of volcanic cloud characteristics from satellite remote sen-sors: A summary, Phil. Trans. R. Soc. A., 358(1770), 1585–1606,doi:10.1098/rsta.2000.0605.
Schneider, D., W. Rose, L. Coke, G. Bluth, I. Sprod, and A. Krueger(1999), Early evolution of a stratospheric volcanic eruption cloudas observed with TOMS and AVHRR, J. Geophys. Res., 104(D4),4037–4050, doi:10.1029/1998JD200073.
Smith, D., J. Delderfield, D. Drummond, T. Edwards, C. Mutlow, P. Read,and G. Toplis (2001), Calibration of the AATSR instrument, Adv. SpaceRes., 28(1), 31–39, doi:10.1016/S0273-1177(01)00273-3.
Stamnes, K., S.-C. Tsay, W. Wiscombe, and K. Jayaweera (1988), Numer-ically stable algorithm for discrete-ordinate-method radiative transfer inmultiple scattering and emitting layered media, Appl. Optics, 27(12),2502–2509, doi:10.1364/AO.27.002502.
Stohl, A., et al. (2011), Determination of time- and height-resolved volcanicash emissions and their use for quantitative ash dispersion modeling: The2010 Eyjafjallajökull eruption, Atmos. Chem. Phys., 11(9), 4333–4351,doi:10.5194/acp-11-4333-2011.
Thomas, H. E., and A. J. Prata (2011), Sulphur dioxide as a volcanic ashproxy during the April–May 2010 eruption of Eyjafjallajökull Volcano,Iceland, Atmos. Chem. Phys., 11(14), 6871–6880, doi:10.5194/acp-11-6871-2011.
Turnbull, K., B. Johnson, F. Marenco, J. Haywood, A. Minikin, B.Weinzierl, H. Schlager, U. Schumann, S. Leadbetter, and A. Woolley(2012), A case study of observations of volcanic ash from the Eyjafjal-lajökull eruption: 1. In situ airborne observations, J. Geophys. Res., 117,D00U12, doi:10.1029/2011JD016688.
van der A, R., et al. (2010), GMES service element Promote 2, S3 serviceprospectus, Ver. 3, report, pp. 54, European Space Agency, Paris.
Vogel, L., et al. (2011), Early in-flight detection of SO2 via differentialoptical absorption spectroscopy: A feasible aviation safety measure toprevent potential encounters with volcanic plumes, Atmos. Meas. Tech.,4(9), 1785–1804, doi:10.5194/amt-4-1785-2011.
Walker, J. C., A. Dudhia, and E. Carboni (2011), An effective methodfor the detection of trace species demonstrated using the MetOpInfrared Atmospheric Sounding Interferometer, Atmos. Meas. Tech., 4(8),1567–1580, doi:10.5194/amt-4-1567-2011.
Walker, J. C., E. Carboni, A. Dudhia, and R. G. Grainger (2012),Improved detection of sulphur dioxide in volcanic plumes usingsatellite-based hyperspectral infrared measurements: Application tothe Eyjafjallajökull 2010 eruption, J. Geophys. Res., 117, D00U16,doi:10.1029/2011JD016810.
Ward, P. L. (2009), Sulfur dioxide initiates global climate changein four ways, Thin Solid Films, 517(11), 3188–3203, doi:10.1016/j.tsf.2009.01.005.
Webster, H. N., et al. (2012), Operational prediction of ash concentrationsin the distal volcanic loud from the 2010 Eyjafjallajökull eruption, J.Geophys. Res., 117, D00U08, doi:10.1029/2011JD016790.
Wen, S., and W. I. Rose (1994), Retrieval of sizes and total masses of par-ticles in volcanic clouds using AVHRR bands 4 and 5, J. Geophys. Res.,99(D3), 5421–5431, doi:10.1029/93JD03340.
Winker, D. M., Z. Liu, A. Omar, J. Tackett, and D. Fairlie (2012), CALIOPobservations of the transport of ash from the Eyjafjallajökull volcano inApril 2010, J. Geophys. Res., 117, D00U15, doi:10.1029/2011JD016499.
Zehner, C. (ed.) (2012), Monitoring Volcanic Ash from Space—ESA-EUMETSAT Workshop on the 14 April to 23 May 2010 Eruption atthe Eyjafjöll volcano, South Iceland, ESA-ESRIN, 26–27 May 2010,ESA-Publication STM-280, Frascati, Italy, doi:10.5270/atmch-10-01.
12