social and economic evaluation methods for fisheries: a ... 4.5.1 soci… · the economic...
TRANSCRIPT

Fisheries Research Contract Report No. 21, 2009
Fisheries Research Division Western Australian Fisheries and Marine Research Laboratories PO Box 20 NORTH BEACH, Western Australia 6920
Social and economic evaluation methods for fisheries:
a review of the literature
Prepared for the Department of Fisheries, Government of Western Australia and the
Western Australian Marine Science Institution (WAMSI)
Simon Vieira, Jacki Schirmer & Edwina Loxton

ii Fisheries Research Contract Report [Western Australia] No. 21, 2009
Correct citation:
Vieira, S., Schirmer, J. and Loxton, E. (2009). Social and economic evaluation methods for fisheries: a review of the literature. Fisheries Research Contract Report No. 21. Department of Fisheries, Western Australia. 94p.
Enquiries:
WA Fisheries and Marine Research Laboratories, PO Box 20, North Beach, WA 6920 Tel: +61 8 9203 0111 Email: [email protected] Website: www.fish.wa.gov.au ABN: 55 689 794 771
A complete list of Fisheries Research Contract Reports is available online at www.fish.wa.gov.au
© Department of Fisheries, Western Australia. May 2009. ISSN: 1446 - 5868 ISBN: 1 921258 57 8

Fisheries Research Contract Report [Western Australia] No. 21, 2009 iii
Contents
1.0 Executive summary ..................................................................................................... 1
2.0 Introduction ................................................................................................................. 2
2.1 Fisheries management in Western Australia ........................................................... 22.1.1 Social and Economic Implications Associated with Implementing EBFM ........................................................................................................... 5
2.2 Social and economic evaluation methods .............................................................. 52.2.1 Background ................................................................................................... 52.2.2 Data collection methods (for social and economic evaluations) ................. 6
3.0 Economic evaluation methods ..................................................................................... 8
3.1 Background ............................................................................................................. 8
3.2 Economic evaluation methods for market based uses ............................................ 10
3.3 Economic evaluation methods for non-market based uses and values .................. 20
3.4 Other non-specific economic evaluation methods ................................................. 36
4.0 Social evaluation methods ........................................................................................... 45
4.1 Introduction ............................................................................................................. 45
4.2 Background ............................................................................................................. 45
4.3 Conceptual frameworks used for social science studies ........................................ 48
4.4 Types of data commonly collected and analysed ................................................... 53
4.5 Examples of different methods used in social evaluation of fisheries ................... 57
5.0 References ..................................................................................................................... 83
Fisheries management in Western Australia .................................................................. 83
Economic evaluations .................................................................................................... 83
Social evaluations ........................................................................................................... 88

iv Fisheries Research Contract Report [Western Australia] No. 21, 2009

Fisheries Research Contract Report [Western Australia] No. 21, 2009 1
1.0 Executive summary
The Department of Fisheries Western Australia is responsible for managing Western Australia’s fishery resources in a way that is consistent with the principles of Ecologically Sustainable Development (ESD). Implementing these principles in a practical manner for fisheries has involved the development of a new management approach that is termed Ecosystems Based Fisheries Management (EBFM). This process incorporates social and economic factors into the management process along with biological and environmental considerations, at both the Fisheries and regional levels.
To date, minimal work has been done to address social and economic factors in accordance with EBFM. This is primarily due to a lack of understanding regarding the information needs, their relative importance and the methods that can be used to address these information needs. The aim of this paper is to identify methods that can be used to collect and analyse social and economic information for EBFM.
Accordingly, the current paper outlines a variety of evaluation methods that can be used to assess the social and economic benefits that are generated from fishery resources. The report first provides some background information regarding social and economic assessments before outlining the available alternatives for ‘economic evaluation methods’ and ‘social evaluation methods’. Examples of use in the literature are provided.
The economic evaluation methods define the focus of economic evaluations – that being the concept of net economic benefits. Market based evaluations (for resource use when prices are observable), non-market based evaluations (where resource use does not operate within a market) and other non-specific economic methods are then outlined.
The social evaluation methods section provides a broad background on social science approaches, their methods and limitations. Different approaches to social evaluations are then described, with a focus on three levels:
• Conceptualframeworkscommonlyusedforsocialevaluation;
• Commontypesofinformation,andhowtheyaretypicallycollectedandanalysed;and
• Examplesof theuseofdifferentdata collectionandanalysismethods inprevious socialevaluation studies in the fisheries sector.
By using the methods outlined in the report, fishery researchers and managers can access the information needed to incorporate social and economic factors into fishery management decision-making. However, to identify the social and economic information and/or evaluation needs and determine how such information will guide policy making, clearly defined and consistent policy objectives are required. Developing such social and economic policy objectives for the management of Western Australia’s fisheries should be a focus of future research.

2 Fisheries Research Contract Report [Western Australia] No. 21, 2009
2.0 Introduction
Western Australia’s fishery resources are a source of social and economic benefits for the state. These benefits are enjoyed by a number of different stakeholders including commercial fishers, recreational fishers, indigenous fishers, aquaculturists and conservationists as well as the general public. The Department of Fisheries Western Australia is responsible for the management of these fishery resources consistent with the principles of ecologically sustainable development (ESD). Implementing these principles in a practical manner for fisheries has involved the development of a new management approach that is termed Ecosystem Based Fisheries Management (EBFM). This process incorporates social and economic factors into the management process along with biological and environmental considerations.
This paper outlines various evaluation methods that can be used to assess the social and economic benefits generated from fishery resources. By using the methods outlined here, fishery researchers and managers will be able to incorporate social and economic factors into fishery management decision-making.
The structure of the paper is as follows. First, a brief outline of Western Australian fisheries management, including the EBFM process is provided. Secondly, a description of economic and social evaluation methods is provided together with relevant examples from the published literature. For each method discussed, a summary of its relevance, usefulness, data requirements and relative cost is provided.
2.1 Fisheries management in Western Australia
The Department of Fisheries Western Australia is responsible for the management of the State’s fisheryresourcesandpearlingindustry.TheDepartmenthastheobjectiveto;
’conserve, develop and share the fish resources of the State for the benefit of present and future generations’ (Fish Resources Management Act 1994).
In accordance with this objective, the Department is committed to the principles of ecologically sustainable development (ESD) using an ecosystem based fisheries management approach. This approach requires fisheries management that addresses the human impacts on target and bycatch species, the broader ecosystem and the economic and social benefits that arise from the use of fishery resources.
Ecosystem Based Fisheries Management
Ecologically Sustainable Development is now accepted as the foundation for natural resource management in Australia. This concept covers all the ecological impacts of an activity along with the social and economic outcomes that they generate. Implementing these ESD principles has involved the development of a new ecosystem-based management approach, which can be termed Ecosystem Based Fisheries Management (EBFM).
To identify the issues, EBFM has been divided into 3 main categories:
• Contributionstoenvironmentalwellbeing;
• Contributionstohumanwellbeing;and
• Governanceorabilitytoachieve.

Fisheries Research Contract Report [Western Australia] No. 21, 2009 3
These categories are further divided and subdivided into more specific components using a tree structure (Figure 1) (Fletcher et al. 2002). This is referred to as a ‘component tree’ and each category is tailored to suit the region or ecosystem in which reporting is being applied.
The risk of change to each ‘component’ as a result of environmental, human or ecological impacts is assessed through an established risk assessment process. The risk for each component is assessed using pre-specified ‘consequence’ levels as well as an assessment of ‘likelihood’ to arrive at a category of risk. If the risk for a particular component is ‘low’ there are no specific management responses required. If the risk is determined to be ‘medium,’ specific management and or monitoring is required. If the risk category is ‘high,’ the management activities need to be increased (taken from ‘Implementing an Ecosystems-Based Approach for fisheries and the Marine Environment.’ ESD Subprogram, Fletcher 2002)
While this framework effectively identifies components that are relevant to ESD, there have been difficulties associated with the identification of which indicators and assessment methods are most relevant to addressing the social and economic components of ESD for fisheries.

4 Fisheries Research Contract Report [Western Australia] No. 21, 2009
Empl
oym
ent
Dist
ribut
ion
Inju
ries
Life
style
Skills
Dev
elop
Indu
stry S
truct
ure
Inco
me
Econ
omic
Regi
ons
x in
divf
isher
y
Com
mer
cial
Regi
o ns
x in
divf
isher
y
Recr
eatio
nal
Met
ro
Else
wher
e
Regi
ons
x in
divf
isher
y
Char
ter
Regi
ons
x Se
ctor
Aqua
cultu
re
Inco
me
Cultu
ral V
alue
sTr
aditio
nal F
ishing
Acce
ss to
Land
Cont
inua
tion
of A
ctiviv
ties
Regi
ons
Cust
omar
y
Dive
rs
Oth
erNo
-Tak
e
Non
Extra
ctive
Use
rs
Dire
ct S
take
hold
ers
Cultu
ral
/Her
itage
Val
ue
Vica
rious
User
s
Perc
eptio
ns/A
ttitu
des
Stat
ewide
Serv
ices
Fish
Con
sum
ers
Stat
ewide
Cape
s
Geo
grap
he b
ay
Met
ro
North
Regi
onal
Com
mun
ities
(See
ext
ratre
e)
Indi
geno
us C
omm
unitie
s(N
o dir
ecti
nvol
vem
ent
but a
ffecte
d)
Dep.
Com
mun
ities
Socia
l &Ec
onom
ic Va
lues
Proc
esso
rs
Fish
& B
aitSu
pplie
rs
Rest
aura
nts
& Fo
odO
utle
ts
Boat
Buil
ders
Fish
ing
Gea
rSu
pplie
rs
Recr
eatio
nal o
pseg
min
ing
town
s
Tour
ist A
ccom
dn
Indi
rect
Sta
keho
lder
s
Socia
l Cap
ital
Infra
stru
ctur
e
Empl
oym
ent
Mon
itorin
g
Skills
Attit
udes
Gen
eral
Com
mun
ity
Regi
onal
Com
mun
ities
Fig
ure
1.
D
raft
com
pone
nt t
rees
illu
stra
ting
soci
al &
eco
nom
ic v
alue
s fo
r th
e so
uth
wes
t re
gion
of
WA
.

Fisheries Research Contract Report [Western Australia] No. 21, 2009 5
The need to incorporate the types of social and economic information shown in Figure 1 into decisions made by the Department of Fisheries WA is evident in the Department’s management objectives and its commitment to ESD and EBFM. However, the question of how to incorporate such social and economic information into decision-making can only be determined once a set of clearly defined social and economic policy objectives have been set.
The current paper aims to contribute to the development of EBFM in Western Australia by outlining the various methods available to undertake social and economic evaluations of fisheries. The use of such methods will allow the collection of social and economic information relevant to fishery policy decision-making. The relative merit of the different types of information that can be gathered and consequently, the different types of methods available, ultimately depend on what policy objectives are put in place.
2.1.1 Social and Economic Implications Associated with Implementing EBFM
The Western Australian Marine Science Institution (WAMSI) is providing the funding to further develop methods for the implementation of EBFM . In addition to the need to better understand the social and economic considerations accounted for under EBFM, there is a gap in the knowledge of how to formally encompass social and economic sustainability in the fisheries management context.
This paper aims to review the methods for completing social and economic assessments for use in EBFM. Qualitative and quantitative evaluation methods will be identified to assist the development of analytical frameworks and strategies that can form the basis for fisheries policy in Western Australia. Methods that are applicable for use with either small or large data sets will be discussed. In addition, an assessment of the strengths and weaknesses of each method will be undertaken to provide guidance with regard to the circumstances in which they should be employed.
2.2 Social and economic evaluation methods
2.2.1 Background
Both social and economic evaluations may involve the analysis of the benefits and costs that are derived by an entity (individual, group or community) from a given resource.
Economic evaluations focus on ‘net economic benefits’, which describe benefits through the use of prices and markets. This allows a relatively straightforward approach to the measurement and comparison of benefits across uses.
Social evaluations, tend to focus on a broader definition of benefits and costs that an entity derives from a given activity or resource. Often, the benefits or costs to society that are dealt with in social evaluations are not captured in market-based information (as used in economic evaluations). The large number of factors that can be dealt with in social evaluations means that such evaluations can focus on a variety of issues and produce multiple outputs. In addition, the breadth of social evaluations means they can be undertaken using both qualitative and quantitative methods.
In what follows, an outline of the characteristics and methods of each evaluation type is provided. First, data collection methods than can be used for both social and economic
6 Fisheries Research Contract Report [Western Australia] No. 21, 2009
evaluations are briefly discussed. Then, the aim of each evaluation type is further defined and the data analysis methods than can be used are listed and discussed with reference to relevant literature. Economic evaluation methods are discussed initially, followed by social evaluation methods.
2.2.2 Data collection methods (for social and economic evaluations)
The choice of data collection method is an important consideration when undertaking any social or economic evaluation. Before selecting which data collection and analysis methods are most appropriate, a range of contextual information is therefore needed, particularly:
• Agreedgoals for thedata collection and analysis–what is thepurposeof the research?What information is needed about social or economic impacts or issues? This mayrequire fisheries managers, fishers or policy makers to set clear social, and economic and management objectives for each situation, which can then be used to drive the identification ofdataneeds,datacollectionandanalysismethods;
• Planned use of the data by fisheries managers, fishers or policy makers. This enablesidentification of which data collection and analysis methods will best meet the needs of data users;
• Reviewoftheavailabledataandtheaccessibleresourcesforobtainingexistingdataand/orcollecting new data.
A brief outline of data collection methods is provided below taken from Schirmer and Casey (2005, pp. 36-42) who provide an overview of social data collection methods.
Secondary data and information
There will often be data and information already available that is relevant to the required evaluation. Schirmer and Casey (2005) identify previous research reports, government documents, industry documents and media reports as possible sources of qualitative secondary information. Likewise, there are a variety of sources of quantitative data. A number of Australian government agencies perform social and economic data collection, the outputs of which are freely available. For example, the Census of Population and Housing data available from the Australian Bureau of Statistics have a variety of social and economic data1. Both qualitative and quantitative data can also be obtained from previous research project publications (Schirmer and Casey 2005).
Primary qualitative data
Primary qualitative data collection is amore costly option relative to the use of secondaryinformation given that the data collection process is more time and labour intensive. However, it will be required if previous research relevant to the evaluation has not been performed (Schirmer and Casey 2005).
Focus groups, workshops and interviews are a common means of obtaining primary qualitative data from a representative sample of a given population. Both focus groups and workshops involve stakeholders attending group forums to discuss issues and questions relating to the research topic. Interviews with individual stakeholders are also a common means of collecting primary qualitative data. These interviews often allow more detailed information to be collected
1 Some Census of Population and Housing dataarefreelyavailable;howeveraccessingdetailedinformationbeyondsimplenumbersemployedinfishingrequiresspecialdataordersfromtheABSwhicharedeliveredonafeebasis.

Fisheries Research Contract Report [Western Australia] No. 21, 2009 7
and also allow stakeholders to communicate information that they might not have been willing to provide in a public forum. The information that can be collected via these methods can be used as a means of scoping out relevant issues and are often used at the start of an evaluation to guide the evaluation objectives and method (Schirmer and Casey 2005).
Primary quantitative data
Surveys of relevant stakeholder groups are the most common method used to collect primary quantitative data. Surveys are particularly relevant to the performance of economic evaluations where the collection of accurate numerical data is required. Data collection via surveys generally involves a series of open- or close-ended questions that respondents are required to address. Three types of surveys can be performed. In order of increasing cost and decreasingaccuracytheyare;mailsurveys(includingviaemail),phonesurveys,andface-to-face survey interviews (Schirmer and Casey, 2005). Further information on the design of social surveys, social data collection methods and examples of use are provided in the discussion of social surveys.

8 Fisheries Research Contract Report [Western Australia] No. 21, 2009
3.0 Economic evaluation methods
3.1 Background
An optimum economic outcome is one where an allocation of resources (such as time, labour, capital, fish stocks and so on) is associated with a maximisation of net economic benefits2, an outcome also referred to as an efficient allocation of resources. Net economic benefits refer to the difference between the economic benefits earned and the economic costs incurred from the use of a resource. Total economic benefit refers to any benefit received from using a resource. This can include the revenue earned from commercial harvesting of fish or the non-monetary benefit associated with the recreational harvest of fish. Economic costs refer to any costs that are incurred in order to earn such economic benefits. This may include the cost associated with the use of inputs such as fuel and labour by a commercial fisher or the cost of recreational fishing gear.
In accordance with the above, economic evaluations are generally concerned with net economic benefits and economic efficiency. An economic evaluation might look at the current and/or historical net economic benefits generated from the use of a fishery resource. Alternatively, an economic evaluation might investigate the level of net economic benefits that could be earned from the use of a fishery resource in the future or under different settings. In terms of economic efficiency, an evaluation might determine a fishery’s optimum efficiency level and compare previous performance against that level.
The relative ease with which net economic benefits can be valued varies according to the form of net benefit being earned from the resource. For example, commercial users of fishery resources operate within explicit markets with observable market prices. For example, the market price commercial fishers pay for inputs (e.g. prices paid for fishing equipment or the wages paid for labour) and the market price they receive for their output (catch) can be observed. Net economic benefits can therefore be estimated as the revenue fishers receive for their output minus the total costs of their inputs.
By definition, net economic benefits include not only those economic benefits generated from the commercial use of a fish stock (commercial fishing, charter fishing and wild-harvest aquaculture) but also the benefit derived by recreational users, non-extractive users (such as divers) and vicarious users that may derive benefits associated with existence values, option values and bequest values3. However, there are difficulties associated with valuing these non-commercial benefits.
Non-commercial uses of fishery resources are generally not associated with easily observed market prices and cost data. Non-commercial uses include activities such as recreational fishing and non-extractive uses such as diving. Using recreational fishing as an example, there is no readily observable market price that a recreational fisher must pay in order to go and fish. In addition to such non-commercial uses, there can also be non-monetary net economic benefits derived from non-use values. These include ‘existence values’, which are benefits gained from knowing a resource exists, ‘option values’, associated with having the option to use a resource
2 Also commonly referred to as net economic value or net economic returns. 3 Existencevaluesareassociatedwiththebenefitgainedfromsimplyknowingaresourceexists.Bequestvaluesreflectthevalueofmaintainingresourcesforfuturegenerations.Optionvaluesarethevaluethatindividualsattachtohavingtheoptiontousearesourceinthefuture(Permanetal.,1999).

Fisheries Research Contract Report [Western Australia] No. 21, 2009 9
in the future, and ‘bequest values’, associated with maintaining resources for future generations (Permanetal.,1999).
To deal with these non-monetary benefits, economic researchers use ‘non-market valuation methods’. These methods involve the use of techniques to fill the information gap created by the absence of markets for non-commercial uses (and non-use values) of resources.
Two categories of non-market valuation methods exist (Blamey 2002). ‘Revealed preference methods’ rely on the behaviour (or revealed preferences) of non-commercial uses of a resource to value that resource or activity. ‘Stated preference methods’ require non-commercial users of a resource to state their value or preferences in response to specially designed interview questions. This latter category of non-market valuation, unlike the former, can also be used to assess any non-use values associated with a resource.
The ability to value both non-market and market uses of fishery resources allows fishery managers to make resource allocation decisions that maximise a fishery’s total net economic benefits across all of its uses or sectors. To determine this allocation, the marginal net economic benefit of an extra unit of a good or resource (such as a kilogram of fish in a fishery) amongst all uses needs to be known. The resource can then be allocated to its most valued use. The optimal allocation will occur where the marginal net economic benefit of an additional unit of that resource becomes equal amongst all uses4.
Accordingly, the economic methods outlined in this section of the report can be used to:
• estimate or provide an indication of the marginal net economic benefit associated withcommercialandnon-commercialusesoffisheryresources;
• estimate the marginal net economic benefit associated with non-use values attached tofisheryresources(existencevalues,optionvaluesandbequestvalues);
• assesscommercialsector(andvessel level)efficiencyandproductivityasanindicatorofeconomicperformance(intermsofperformancerelativetoeconomicoptimum);
• determineanefficientallocationofresourceswhereneteconomicbenefitsaremaximised;and
• assesssector/industryinterdependencieswithinaneconomy.
It should be noted that the motive for undertaking such economic evaluations is that such information is required for government to fulfil its role of managing fishery resources on behalf of society. This role is the responsibility of government given the common property nature of fishery resources - without government management, resource depletion and a classic ‘tragedy of the commons’ outcome may result. Accordingly, governments should aim to manage fishery resources so that they provide the optimal benefit to society – where the benefits are optimised in both current and future periods.
The remainder of this section of the report consists of three sections. These include:
• economicevaluationmethodsformarketbaseduses;
• economicevaluationmethodsfornon-marketbasedusesandvalues;and
• othernon-specificeconomicevaluationmethods.
4 ThereaderisreferredtoMcLeodandNicholls(2004a)forfurtherexplanationofbenefit-costanalysisofmulti-sectorfisheries.

10 Fisheries Research Contract Report [Western Australia] No. 21, 2009
3.2 Economic evaluation methods for market based uses
The evaluation methods that follow can be used to evaluate the economic performance of commercial uses of fishery resources where markets exist for the fishery output being produced and the inputs being used to produce that output.
Market based economic valuation
Relevant to: Commercial sectors. Output: Total net economic benefits and marginal net economic benefits in a commercial sector. Usefulness: Indicator of economic performance. The data collected can also be used to undertake other economic valuations and to determine the parameters of bioeconomic models. Data: Revenue and cost data. Access to data depends on industry cooperation. Time/cost: Medium-high given large data requirements.
What is it?
A market economic valuation of a commercial fishing sector estimates the total net economic benefits generated from the use of a fishery resource by the commercial sector in a given time period. Vieira and Hohnen (2007, pg. 35) define the net economic benefits to a commercial fishing sector as ‘the long run profits from a fishery after all costs have been met, including fuel, crew costs, repairs, the opportunity cost of family and owner labour, fishery management costs, depreciation and the opportunity cost of capital’. While this definition captures the net economic benefits to producers (fishers) in a commercial sector it does not capture the benefits to consumers of commercially caught fish. An all-encompassing definition is provided by McLeod and Nicholls (2004a, pg. vi) who state that the appropriate economic values to be considered include:
• the benefit enjoyed by seafood consumers or recreational fishers in excess of what wassacrificed to buy or catch fish; and
• the benefits enjoyed by commercial fishermen, and fish wholesalers, distributors andretailers in excess of what was sacrificed to catch and supply fish to consumers’.
Estimates of net economic benefits only provide an indicator of a fishery’s previous economic performance as such estimates do not reveal how the fishery performed relative to its potential where net economic benefits have been maximised, a point commonly referred to as maximum economic yield (MEY). Estimation of MEY requires the construction of a bioeconomic model (as described in the bioeconomic modelling section). Estimates of net economic benefits are therefore most informative when analysed within a time series. Where net economic benefits over a period of time are close to zero or negative it is likely that management of that commercial fishery could be improved. Where net economic benefits are positive and increasing over a period of time, a commercial fishery may be moving towards MEY (Vieira and Hohnen, 2007).
Market economic evaluations may also be used to estimate market supply and demand curves to calculate the marginal net economic benefits to the commercial sector. The marginal net economic benefit can be defined as the additional net economic benefit that arises from harvesting the final (or marginal) unit of fish. Such information is relevant to resource allocation decisions between sectors (e.g. commercial and recreational sectors). For instance, where the use of a resource by one sector has higher marginal net economic benefits relative to another sector, then the sector with the lower benefit should be allocated a larger proportion of the resource until the benefits are equal (see McLeod and Nicholls (2004a) for a more detailed explanation).

Fisheries Research Contract Report [Western Australia] No. 21, 2009 11
How is it done?
The estimation of total net economic benefits to producers in a commercial sector requires revenueandcostdataforindividualcommercialvessels;normallyobtainedfromthefinancialstatements of operators in surveys. The collection of such information can be costly and time consuming. For the calculation of fishery revenue, total fishery catch and individual fish prices can be multiplied together. Alternatively, total revenue received from the sale of landed fish can be taken directly from the financial statements of operators. For the estimation of economic costs, vessel operating costs are required. Such costs include the costs of fuel, labour, repairs, maintenance, administration and bait. Also required are estimates of the value of capital invested in the fishery including the value of boats, boat fittings, shore based structures and licences. These latter values must be obtained by questioning a vessel’s owner given that relevant data is not contained in the financial statements of fishers (Vieira and Hohnen, 2007).
The definition of costs for the calculation of net economic benefits differs from the definition of accounting costs. Total economic costs include what are known as ‘opportunity costs’. The opportunity cost associated with an input (labour, capital, land and so on) can be defined as ‘thevalueofthemosthighlyvaluedforgonealternative’(KatzandRosen,1998,pg.3).Putsimply it is the value of what could have been earned from an input had it been used elsewhere. To exemplify, a commercial fishery operator might own a boat that has a market value of $1,000,000. Rather than investing that $1,000,000 into the operation of the boat in a fishery to earn a return from the fishery, the next best alternative might be a long-term bank deposit which earns a 7 per cent return. Therefore, the owner of the vessel could sell their boat and earn a return of $70,000 (7% * $1,000,000) from their investment. This return of $70,000 is the opportunity cost of capital.
For inputs obtained from an efficiently operating market, the prices paid by operators should represent their economic opportunity cost. For ease of estimation, markets are generally assumed to be efficient and market prices are therefore assumed to represent the opportunity cost for a number of inputs, such as fuel, gear, repairs and maintenance (Holland, 2002). However, some costs may require special treatment. The economic cost of labour, for instance, may not be accurately represented in the financial statements of the operator. For example, workers that are family members may be paid less. Additionally, vessel owners may perform an unpaid role on the vessel. Under such circumstances a value for the opportunity cost of labour must be imputed. A minimum wage or a calculated average wage for the fishery can be used. Alternatively, operators can be directly asked how much they would need to pay someone else to perform the task in question (Vieira and Hohnen, 2007) or what they could earn in alternative employment.
Determining the economic cost of capital is also difficult. The opportunity cost of capital can be based on an estimate of the market value of the vessel by the owner or by using a depreciated value of capital. Depreciation (the cost associated with the wear and tear of capital items), as reported in operator’s financial statements, may inaccurately reflect the true economic cost of depreciation. Accounting for the impact of capital repairs and maintenance on both the opportunity cost of capital and depreciation can also be difficult.
While the above approach allows the estimation of total net economic benefits to a commercial sector, an approach more relevant to estimating marginal net economic benefits is to derive a supply curve for a commercial sector’s supply of fish to market. The supply curve essentially represents the willingness to accept compensation of all fishing businesses that supply their fishcatchtomarket.Producersurpluscanbeestimatedfromaderivedsupplycurveforagiven

12 Fisheries Research Contract Report [Western Australia] No. 21, 2009
period and is defined as the total revenue received by all firms in a sector minus the economic cost of supplying a given level of output (or fish) and is equivalent to total net economic benefits (Box 1). The advantage associated with estimating a supply curve is that marginal net economic benefits can be estimated by deriving the change in producer surplus that results from an incremental change in quantity supplied.
Similarly, to incorporate the net economic benefits to consumers that benefit from the commercial use of a fishery resource, a market demand curve for a fishery’s product must be estimated. From this curve, consumer surplus (which is equivalent to the net economic benefits that accrues to consumers of fishery products) can be estimated (Box 1). By estimating consumer surplus, in addition to the net economic benefits earned by producers (or producer surplus), this approach more accurately captures the full economic benefits to society from the commercial use of a fishery resource. However, the data requirements to estimate a market demand curve are significant and require fish price and sales data be collected from relevant fish processors and retailers. The reader is referred to McLeod and Nicholls (2004a) for a further explanation of estimating net economic benefits for a commercial sector using supply and demand curves.
It should be noted that if producers in a commercial sector export most of their product, consumer surplus should be excluded from an evaluation as the majority of consumption benefits are received by foreign consumers (McLeod and Nicholls 2004a). Similarly, evaluation of consumer surplus may be less important if the demand curve associated with the fishery product is flat. This means that a number of close substitutes exist for the given product so that prices for that product are the same for all levels of quantity demanded. Accordingly, changes to the quantity of fish consumed won’t result in changes in consumer surplus. Therefore, it may be appropriate to ignore consumer surplus.
Limitations and issues
A number of issues are commonly encountered when gathering commercial data for any market economic valuation. For boats that operate in multiple fisheries, the apportioning of revenues and costs to the fishery being evaluated may be difficult. It may also be difficult to obtain accurate data for boats operating within a large and vertically integrated business structure. For example, some firms may include multiple fishing vessels, undertake their own fish processing or retail and exporting activities. McLeod and Nicholls (2004b, 2004c, 2004d) note that the confidential nature of the data required can limit cooperation amongst fishery operators and fish retailers to supply the required information. They suggest that researchers should attempt to build a rapport with commercial operators and gain their confidence to address such issues through pre-survey meetings and workshops with operators. A second problem noted by McLeod and Nicholls (2004b, 2004c, 2004d) is that many commercial fisheries consist of a small number of operators. As a result, sample data sets may be too small in size so that the confidentiality of each respondent’s information may not be adequately protected.

Fisheries Research Contract Report [Western Australia] No. 21, 2009 13
Box 1. Explanation of demand, supply, consumer surplus and producer surplus.
DEMAND SUPPLYPrice
p1
S1D1
a
Price
p1
gf
b
qD1 qS1Quantity Quantity
Demand
the demand diagram shows demand curve D1. It shows how the quantity demanded of a given product decreases as price increases given consumer’s willingness to pay for that product.Inthediagram,qD1isthequantityofdemandthatwillprevailunderpricep1.Pricedepends on where the supply curve (as shown in the supply diagram) intersects the demand curve. Overlaying demand curve D1 with supply curve S1 will give a price of p1.
Consumer surplus is the total value or benefit to consumers associated with the quantity of product being consumed less the total amount spent by consumers to obtain the product. This is represented by the area beneath a demand curve and above the prevailing price (p1). Therefore, for demand curve D1, consumer surplus is triangle ‘a’ while total consumer expenditure is represented by square ‘c’ plus triangle ‘d’.
Supply
The supply graph shows a supply curve S1, the prevailing price p1 and the quantity that will be supplied by producers under the prevailing price as qS1. It shows how quantity supplied by producers increases with price according to producers’ willingness to accept compensation (or payment) for their output.
Producer surplus is equivalent to the total revenue received by firms for their output(quantity multiplied by price as shown by rectangle ‘f+g’) less the economic cost (or resource cost) of producing that quantity of output (triangle ‘g’). In the supply diagram, producer surplus is therefore the area above the supply curve and below the prevailing price (p1) represented by triangle ‘f’.
For a more thorough explanation of these concepts as they apply to fisheries the reader is referred to McLeod and Nicholls (2004a).

14 Fisheries Research Contract Report [Western Australia] No. 21, 2009
Examples of market based economic valuations in fisheries research
Vieira, S., Wood, R. and Causer, T. (2008) Australian Fisheries Surveys Report 2008: Results for Selected Fisheries, 2005-06 and 2006-07, ABARE Report Prepared for the Fisheries Resources Research Fund, Canberra, October. Available at:http://www.abare.gov.au/publications_html/fisheries/fisheries_08/08_AFSurveys.pdf
The Australian Bureau of Agricultural and Resource Economics (ABARE) survey a number of fisheries managed by the Australian federal government on an annual basis to assess each fishery’s economic performance. The results from the most recent survey undertaken by ABARE in 2008 are presented in Vieira et al. (2008).
To undertake the survey, ABARE researchers contact all operators in each fishery to request their co-operation. Survey interviews typically take between one and two hours and each fishery is surveyed every second year so as to minimise survey burden. On average, 30 per cent of the fishers are sampled. Sample design and weighting (whereby a weight is given to each sampled boat that determines how representative that boat is) address estimation issues that result from not sampling the whole population.
Data collected in the survey include fish sales revenue, fishing costs, the replacement cost of unpaid labour and the market value and replacement cost of capital. The data are used to estimate fishery level net economic return and average vessel level financial performance which, as defined by ABARE, excludes economic costs such as the opportunity cost of capital and includes revenues and costs earned in other fisheries. It should be noted that ABARE’s analysis of fishery economic performance does not incorporate the net economic benefits to consumers from commercial use.
McLeod, P. and Nicholls, J. (2004b, 2004c, 2004d) A Socio-economic valuation of resource allocation options between recreational and commercial sectors, Fisheries Research and Development Corporation, Economic Research Associates.
Part II: The Western Australian Cockburn Sound Managed Crab Fishery.
Part III: The Perth Abalone Fishery Case Study Western Australia.
Part IV: The West Coast Wetline Fishery Case Study.
Net economic benefits to both recreational and commercial sectors (in terms of extractive use) of three Western Australian fisheries are estimated in three separate case studies. The case studies are used to evaluate economic approaches to determining fishery resource allocations between recreational and commercial uses.
For each fishery’s commercial sector, both producer surplus (net economic benefits to fishery operators and processors) and consumer surplus (net economic benefits to fishery product consumers) are estimated. In each case study, supply and demand curves are first derived using revenue and cost data collected from firms via surveys. From these curves, producer and consumer surplus are estimated respectively.

Fisheries Research Contract Report [Western Australia] No. 21, 2009 15
Productivity and efficiency analysis
Relevant to: Commercial sectors. Output: Efficiency and productivity indicators and analysis. Usefulness: Useful indicator of economic performance. Data: Revenue/cost data, price data, catch data, input usage data, effort data, vessel characteristics. Time/cost: Medium-high given large data requirements and analysis.
What is it?
The concept of productivity5 refers to ‘the ratio of output to input for a specific production situation’, whereby, ‘[r]ising productivity implies either more output is produced with the same amount of inputs, or that less inputs are required to produce the same level of output’ (Rogers, 1998, pg. 5). As suggested by Rogers (1998), productivity is closely linked to efficiency, whereby a fully efficient firm is said to be operating on the production frontier – a curve which shows the maximum amount of output that can be produced from available inputs (labour, capital and so on). A firm that approaches its production frontier is said to be becoming more efficient (which will be captured as an improvement in productivity). An outward shift of the production frontier reflects an improvement in production technology (which will also be reflectedasanimprovementinproductivity).Accordingly,Grosskopf(1993,p.160)definesproductivity growth as the ‘net change in efficiency and technical change, where the former is understood to be the change in how far an observation is from the frontier of technology and the latter is understood to be shifts in the production frontier’.
Newton and Wood (2008) outline four possible sources of productivity gains in fisheries. These include improvements in technology, adopting existing technologies (previously prevented due to a slow response by operators or management regulations), increased or newly found fish stocks and structural shifts in the make-up of the fishery towards more productive vessels. They note that all of these sources, to varying degrees, can be influenced by management.
How is it done?
There are a number of ways that sector level efficiency and productivity can be analysed. The useofproductivityindicesisthesimplestapproachandisthefocusofthissection.Productivityindices are a quantitative means of representing productivity changes or changes in the ratio of output produced to inputs used over time. The index essentially compares the ratio of output to inputs to an earlier time period – normally a base year or the immediately preceding year. AsputbyNewtonandWood(2008),theproductivityindexisaratioofaninputindex;whichshows changes in inputs used over time. This index takes into account the relative contribution of each input to total cost in each time period, to an output index which reveals movements in output over time taking into account the relative contribution of each output to total revenue in each time period.
Benefits, limitations and issues
Jin et al. (2002, pg. 541) state that understanding productivity is important to fisheries management ‘since productivity allows fisheries to become more competitive but also places additional harvest pressure on fish stocks. Because it is not a measurable input or output and is virtually impossible to control, productivity growth adds considerable complication to fisheries
5 Productivityasitisusedherereferstoeconomicproductivityandnotbiologicalproductivity.

16 Fisheries Research Contract Report [Western Australia] No. 21, 2009
management. Productivity measurement can provide useful information about effective fishing effort, as opposed to nominal measures of effort such as catch per day at sea’.
FelthovenandPaul(2004)performareviewoftheliteratureonfisheryproductivityanalysisand note that the literature is currently sparse. It was pointed out that most studies have failed to adapt standard methods of productivity analysis to analysing productivity in fisheries. This is necessary given the unique characteristics of fisheries relative to other industries. They identify research needs that are uniquely relevant to fisheries, including the need to incorporate fishery bycatch, to account for environmental fluctuations and incorporate biological stock fluctuations intotheanalysisofproductivity.FelthovenandPaul(2004)notethatworkbyJinetal.(2002)(described below) provides one of the few studies that have made such an adaptation.
Newton and Wood (2008) highlight some limitations associated with the use of productivity indices. First of all, productivity indices do not provide information on how close a fishery is operating to economic optimum (MEY). They also point out that interpretation of productivity indices is best performed over a long period of time. This is particularly true when annual variations in stock and weather are not taken into account in the calculation of productivity indices. Yet, they also note that when the data used to estimate productivity indices has been collected over a long period of time that there may be issues associated with changes in sampling procedures. As final points, the boat-level economic data required to calculate productivity indices are often not readily available. If the required data is to be collected, there may be difficulties getting adequate industry cooperation if the fishery has low boat numbers orasmallnumberofboatstakeamajorproportionofthecatch.Giventheselimitations,effortshould be made to collect long-term and environmental data, as well as cooperation from industry members through the assurance of confidentiality in public documents and meetings. Unfortunately, if sampling procedures change over time only a broad qualitative analysis of trends may be undertaken.
Examples of productivity and efficiency analysis in fisheries research
Newton, P. and Wood, R. (2008) Analysis of productivity in the gillnet, hook and trap sector, Australian Bureau of Agricultural and Resource Economics, Report to the Fisheries Resources Research Fund.
The authors undertake a productivity index analysis of a fishery over a seven year period from 1998 to 2005 using survey data collected by the Australian Bureau of Agricultural and Resource Economics (ABARE).
A revenue-share weighted aggregate output index for the seven year time period was first derived using price and landings data. That is, an aggregate output index was calculated based on five separate output indices for five major species groups caught in the fishery. The relative contribution of each species group to the aggregate output index was determined by its weight, the calculation of which was based on each species group’s relative contribution to total revenue.
In dealing with inputs, the authors identify five categories of input – fuel, labour, repairs and maintenance, capital and other inputs. Using a combination of survey expenditure, various price series data (such as historical fuel prices) and price index data (for example, an index of repairs and maintenance expenditure by fishers), the authors derived a cost-share weighted input index based on the five input categories for the seven year time period. A productivity index was then calculated by combining the derived input and output indexes.

Fisheries Research Contract Report [Western Australia] No. 21, 2009 17
Jin, D., Thunberg, E., Kite-Powell, H. and Blake, K. (2002) Total Factor Productivity Change in the New England Groundfish Fishery: 1964-1993, Journal of Environmental Economics and Management, Vol. 4, pp. 540-556.
Jin et al. (2002) estimate change in total factor productivity for the New England groundfish fishery from 1964 to 1993. However, they adapt the standard total factor productivity analysis to incorporate the effect of stock fluctuations. The authors note that the study was only possible given the availability of well-documented landings, effort and stock data.
Using the available data, the authors incorporate stock abundance data for various species into the calculation of the productivity indices by weighting the stock abundance of each species with the corresponding revenue share per year. As noted by the authors “[a]fter accounting for the stock effect, the residual may be explained by other factors, such as regulatory impacts and technical change” (Jin et al. (2002), factors which may be of greater interest to policy makers.
Other approaches to productivity and efficiency analysis
Other more complex approaches to productivity and efficiency analysis are available and can be divided into two types of approaches (Coelli et al. 1998). The first approach involves the use of least squares econometric modelling or regression techniques (normally based on fisheries and economic data from a sample of vessels in the sector) to estimate and analyse the productionfunctionsortechnologyinasector.Giventhattheproductionfunctionestimatedisbased on the actual performance of firms, the final production function expresses a relationship between output and input that assumes that all firms sampled are fully efficient. The relationship between output and input can be used to assess the impacts of various factors, such as stock biomass, fish prices, and input costs on efficiency. Such approaches are also commonly used to estimate profit and cost functions to determine the degree to which key variables impact on boat-level profit and cost. In the fisheries context, the estimation of the production function in suchawayisrequiredforbioeconomicmodelling(GoodayandGaleano,2003)wherethefishstock biomass is treated as an endogenous6 variable.
The second approach can be described as frontier estimation. The least squares econometric approaches just described define an average relationship between outputs and inputs in firms with the average relationship for the sector being a line of best fit to output and input data fromallthesampledfirms(orvessels).Giventhattheanalysisofefficiencyimpliestheneedto understand how well firms are performing relative to optimal efficiency, an analysis that focuses on the average performance across firms may not always be desirable. Accordingly, the frontier approach involves estimating a frontier, which is defined by the most efficient firms (fishing vessels) in a sector (fishing fleet), and assumes that not all firms are fully efficient. The performance of firms relative to this frontier can then be assessed and aggregated to determine the overall efficiency of an entire sector or fishing fleet (Coelli et al. 1998). The calculation of such frontiers can take the form of a production frontier or cost frontiers (that show firms that have the least cost relative to output) for the analysis of sectors where cost minimisation behaviour is likely (this is often assumed to be the case in ITQ managed fisheries). In addition, profit frontiers (where firms with the maximum level of profit relative to inputs used are represented) may also be used.
There are two common techniques used to estimate such frontiers. Data envelopment analysis (DEA) involves the use of mathematical linear programming techniques to construct a non-parametric surface (or frontier) over the data, so that efficiencies of sampled firms can be

18 Fisheries Research Contract Report [Western Australia] No. 21, 2009
calculated relative to this surface. This non-parametric frontier is estimated so that it envelops all of the sample data points (that is, all data points will lie on or below the frontier). For a fishery, this frontier will represent where the most efficient firms or vessels in a fleet are in terms of the ratio of the inputs a firms uses relative to its output. Comparisons of where sampled vessels in the fleet are relative to that frontier can then be made to assess sector (fishery) level efficiency performance (Coelli et al. 1998).
The second commonly used technique is referred to as stochastic frontier analysis and involves the use of econometric6 estimation techniques (as opposed to mathematical programming techniques as used in DEA) to estimate a parametric frontier. The first authors to estimate a production frontier were Aigner and Chu (1968). Their production function incorporated a non-negative asymmetric error term, which indicated a distance from the frontier for a given firm (and the average distance for all sampled firms) (Coelli et al. 1998). The limitation with this approach is that a firm’s distance from the frontier is assumed to solely represent inefficiency. In reality, this distance could be influenced by sampling error and noise. The stochastic frontier addresses this problem by incorporating an additional stochastic error term to capture such noise (Coelli et al. 1998). An additional benefit associated with including this error term is that itallowsagreateramountofstatisticaltestingofthefinalfunction.GoodayandGaleano(2003,pg. 17) note that of the two frontier estimation approaches, ‘stochastic frontier analysis seems of more relevance to the analysis of fisheries as the impact of factors such as measurement error and fluctuations in environmental conditions can be incorporated more readily’.
Further reading
The reader is referred to Coelli et al. (1998) for a more detailed explanation and comparison of theproductivityandefficiencyanalysistechniquesoutlinedhere;GoodayandGaleano(2003)whoprovidesuchanoutlineintermsoftheanalysisoffisheryeconomicperformance;Kompasand Che (2003) and Kirkley et al. (2004) for examples of stochastic frontier analysis as applied to the analysis of a fishery and to Färe et al. (2002) and Reid and Squires (2007) for an example of the application of DEA to fisheries.
Proxy economic indicators
Relevant to: Commercial sectors. Output:Providesanindicationofhowafisherymaybeperforming. Usefulness: Depends on indicator but may provide useful insights, particularly when other high cost methods cannot be used. Data: Various (depends on indicator). Time/cost: Low.
What is it?
‘Proxy economic indicators’ describe observable and quantifiable characteristics of a fishery that reveal information about the revenues, costs or profits and give some indication of the economic position of a fishery. Commercial net economic benefits and productivity indices (see above) are indicators of economic performance. However, both require significant amounts ofdata toestimate.Proxyeconomicindicatorsgenerallymakeuseofalreadyavailabledataor easily observable characteristics of a fishery that can provide useful information about
6 Econometricsmaybedefinedasthesocialscienceinwhichthetoolsofeconomictheory,mathematics,andstatisticalinferenceareappliedtotheanalysisofeconomicphenomena(Goldberger,(1964,pg.1).Econometricapproachesaregenerallyusedtoestimate economic relationships or functions between economic variables and other types of variables.

Fisheries Research Contract Report [Western Australia] No. 21, 2009 19
a fishery’s economic performance at a low cost. Such indicators can be a useful source of information when more costly evaluation techniques are not appropriate.
What indicators are available?
Rose et al. (2000) identify three basic indicators that should be referred to when analysing net economic return results for a commercial fishery. The first is the biological condition of the fish stock. For example, if a fish stock is overfished, future economic performance could be improved with a rebuilding of fish stocks, which would result in improvements in catch per unit effort. The second indicator is the capital structure of the fishery, or more specifically, the number of vessels operating in the fishery and the relative value of vessels outside the fishery. The third indicator is market conditions. For instance, fish price movements will have an important impact on the economic performance of a fishery.
For fisheries managed with licences or quota that are fully tradeable, Hundloe (2000) suggests that stability in the value (including sale and leasing price) of such entitlements provides a rough guide to the economic sustainability of a fishery. However, the relative value of a licence or quota will also be an indicator of a fishery’s current and expected economic performance (Newton et al. 2007). Hundloe (2000) also identifies the value of major capital items invested in the fishery as another key indicator. Where none of the above information is available, a range of indicators can be used together that are essentially derived from the breakdown of the key components of profits (Hundloe 2000). These indicators include the quantity of fish caught, the price per unit of fish and the prices of major cost items such as fuel, crew, bait and gear.
An additional proxy economic indicator identified by Newton et al. (2007) is the level of latent effort in a fishery, where latent effort can be defined as a ‘measure of the amount of inactive rights that could be used in the fishery at relatively short notice’ (Newton et al. 2007, pg. 19). A right can refer to a licence or permit in a limited entry fishery, an effort entitlement in an input managed fishery or a quota entitlement in an output managed fishery. As put by Newton et al. (2007), the level of unused effort reveals information about operators’ assessments of the fishery’s profitability. If the expected profits that could be realised from using a permit are high, then a permit is likely to be used. An important characteristic associated with high levels of latent effort in a fishery is that it likely to be associated with low net economic returns and will impede a fishery from attaining higher profits. This result occurs because any increased profits will eventually be diminished once latent effort is activated. For example, increased profits will be diminished following the purchase of new vessels using previously unused fishery entitlements (Newton et al. 2007).
All the proxy economic indicators discussed above relate to commercial uses of fishery resources. Two potential economic indicators associated with recreational fishing are recreational fishery participant numbers and recreational fisher expenditure. The former indicator is easily determined for recreational fisheriesmanagedwith licences; however, iflicences are not used, recreational fishery participant numbers may be difficult to determine. The latter indicator could be estimated using a simple survey. Such a survey could be easily conducted for a licensed recreational fishing sector as the identification of anglers has already been undertaken. A time series of the two indicators could be combined to reveal total recreational fishing expenditure per angler over time. However, this only gives an indicator of the economic costs associated with fishing and not the economic benefits and, therefore, net economic benefits associated with recreational use of fishery resources. As surveys are required to obtain information regarding recreational fisher expenditure, these surveys could also cover the perceived economic benefits gained through recreational fishing. This would require a modification of survey techniques and potentially analyses.

20 Fisheries Research Contract Report [Western Australia] No. 21, 2009
Newton, P., Wood, R., Galeano, D., Vieira, S. and Perry, R. (2007) Fishery Economic Status Report, ABARE Report 07.19 Prepared for the Fisheries Resources Research Fund, Canberra, October. Available at http://www.abare.gov.au/publications_html/fisheries/fisheries_07/fishstatus.pdf
The Australian Bureau of Agricultural and Resource Economics (ABARE) prepare an annual report that evaluates the economic status of all commercial fisheries managed by the Australian government. The purpose of this report is to provide an assessment of the performance of the relevant fishery management authority against the objective to maximise the net economic returns to the Australian community from the management of these fisheries.
A description of fishery location, catch volume, value and composition, management arrangements, biological status of fish stocks and fishery financial and economic performance is provided for each fishery. To assess economic performance, a range of economic indicators and tools are used. Estimates of latent effort and quota and licence values are relied upon in many cases to provide some indication of (potential) fishery economic performance, particularly for small low value fisheries.
For one quota-managed fishery, the authors compare actual catch to total allowable catch for each of the fishery’s quota managed species. The authors show that latent effort in the fishery has been high and suggest that this can be linked to the fishery’s historically poor economic performance.
3.3 Economic evaluation methods for non-market based uses and values
The evaluation methods that follow can be used to evaluate the economic benefits associated with non-commercial uses/values of fishery resources that are generally not associated with an observable market. These can include extractive uses (such as recreational fishing), non-extractive uses (such as diving) and non-uses (such as option values and existence values). The methods outlined here are either ‘revealed preference methods’ which are based on observable behaviour or ‘stated preference methods’ which are based on hypothetical behaviour.
Non-market economic valuation (revealed preference): travel cost method
Relevant to: Non-market users such as recreational fishers. Output: Net economic benefits associated with the use of a resource. Usefulness: Can be compared with the net economic benefit of the commercial sector so that allocation decisions between sectors can be undertaken. Data: Participationcostdata(e.g.travelcosts),participationrates,socialandeconomicdata relating to fishers. Requires survey data collection. Time/cost: High given large data requirements.
What is it?
The travel cost method (TCM), as defined by Chavez-Comparan and Fischer (2001, pg. 333), is ‘an indirect valuation method used to estimate the consumer surplus per fishing trip using the travel cost as a proxy for the price of the recreational activity’. For fishery evaluations, the method has most commonly been used to estimate the resource values of recreational anglers yet could also be used for other user groups (such as non-extractive users).

Fisheries Research Contract Report [Western Australia] No. 21, 2009 21
How is it done?
For recreational fishing, the method relies on the notion that recreational anglers will incur costs relating to travel and participation in a fishery and that such costs will determine an angler’s fisheryparticipation(ReichersandFedler,1996).Giventhisrelationship,thetechniqueutilisesinformation regarding both the quantity of fishing trips demanded by a recreational fisher and the price or cost of participating in the fishery to derive a fisher’s willingness to pay to participate. A demand curve for recreational fishing can then be formulated from which economic benefits can be estimated (Reichers and Fedler, 1996). This demand curve is calculated according to the rule that a recreational fisher will continue to participate in a fishery (measured by fishing trips) until the marginal benefit of the last trip equals its marginal cost (the additional cost incurred from undertaking an additional fishing trip) (Kerkvliet et al., 2002). The general form that a travel cost model takes is as follows:
Q = ƒ (TC, S, A, E)
Where Q = quantity demanded or the number of visits to the interview site. TC = round trip travel cost to site (including a value of travel time) S = price of substitute sites A = quality attributes of site E = socio-economic characteristics of angler (Reichers and Fedler, 1996).
This relationship shows that the demand for fishing trips will depend on the costs of fishing at the relevant site, the cost of fishing at other substitute sites, the quality attributes of the relevant site (such as ease of access, potential catch and so on) and the socio-economic characteristics of anglers.
In order to create such a model, primary data collection from resource users is generally required in accordance with the five variables identified by Reichers and Fedler (1996) in the equation presented above. Kerkvliet et al. (2002) use the TCM to value recreational fisheries intheYellowstoneNationalPark.Datacollectedbytheseauthorsincluded:
• numberofrecreationdays;
• travelcosts(acostpermiletravelled);
• on-sitecostswhileparticipating(suchasaccommodation);
• wagerateofrespondents(fortheopportunitycostoftime);
• catchrate(catchperhoursfishing);
• congestion(numberofanglersencounteredwhilefishing);
• rangeof social and economicvariables that help explaindemand, including age,maritalstatus, place of residence, gender and angling ability.
Benefits and limitations
The TCM is associated with some general limitations. For instance, the net economic benefit of a recreational fishery calculated with TCM generally relates to the net economic benefit of the entire recreational fishing experience. Thus to derive a value that represents the value of the fishery resource to the recreational sector for allocation purposes (that is, a net economic benefit per kilogram of fish caught), one must first determine what proportion of the net economic benefits is associated with a unit of fish caught. Issues also exist when considering what economic costs should be included in a TCM model (Chaves-Comparan and Fischer, 2001). Blamey (2002) points out that general expenditure items such as food and maintenance,
22 Fisheries Research Contract Report [Western Australia] No. 21, 2009
are costs that would be incurred even if an angler did not participate in a fishery. As a result, there is a question of whether such cost items should be included as a fishing trip cost in a travel cost model.
The basic travel cost method may be subject to limitations. According to Reichers and Fedler (1996), limitations may arise where travel distances of visitors are very similar, where trips involve multiple activities, multiple benefit types and/or multiple destinations among which it is difficult for respondents to partition their expenses and when individual trip behaviour does not reflect a change in value given minor changes in the resource.
Blamey (2002) discusses two limitations to the basic travel cost method. The first relate to the findings of Wetzel (1977) who shows that if the effects of overcrowding are not incorporated into a TCM demand function, economic value will be underestimated. Blamey (2002) suggests that such issues can be dealt with when collecting data from resource users by questioning respondents about the impact of overcrowding on their fishing activity or preferences. The second issue discussed by Blamey (2002) relates to substitute fishing sites and how they are dealt with in the TCM model. Although the impact of substitute fishing sites should already be reflected in the demand curve derived using TCM, Rosenthal (1987) has shown that including the travel costs of alternative substitute sites can improve the accuracy of the model.
For these reasons, multiple site travel cost models may often be used. This approach is based on the same logic as the basic TCM, but explicitly takes into account the existence of multiple sites and their attributes within the TCM derived demand curve for fishing. Some multiple site travel cost methods such as the hedonic travel cost model allow the economic value associated with specific site characteristic to be determined (Blamey, 2002). For an outline of the types of multiple site travel cost models available (including varying parameter models and the hedonic travel cost method) refer to Blamey (2002).

Fisheries Research Contract Report [Western Australia] No. 21, 2009 23
Examples of travel cost method in fisheries research
Chavez-Comparan, J.C. and Fischer, D.W. (2001) Economic valuation of the benefits of recreational fisheries in Manzanillo, Colima, Mexico, Tourism Economics, Vol. 7, No. 4, pp. 331-345.
This paper estimates the economic value of recreational fishing for billfish in Manzanillo, Mexico using both TCM and the contingent valuation method (CVM). At the time of the study, billfish were reserved for the recreational sector but commercial operators were requesting access. At the same time, supposed incidental catches by commercial operators were leading to conflicts between the two sectors. A reassessment of the current resource allocation was therefore required.
The TCM component of the study involved a mail out survey to recreational anglers identified through records held by the local sport fishing club. To estimate the demand curve for recreational fishing, it was assumed that anglers decisions regarding both the number of trips made to Manzanillo (throughout a year) and the number of days spent fishing per trip were based on their income, site quality and so on.
The final demand function was estimated using the ordinary least squares method and takes a semi-logarithmic functional form (which they note is the usual functional form used for TCM). The average daily consumer surplus associated with the Manzanillo recreational fishing experience is then estimated from the demand function. The final value derived, however, is not a resource use value but rather an experience value and is less relevant for allocation purposes (a use value is estimated by the authors using CVM).
Difficulties noted by the authors include problems associated with estimating the opportunity cost of time and site quality (a relative quality index based on a respondents comparison of the Manzanillo fishing experience to other visited sites is developed).
Shrestha, R.K., Seidl, A.F. and Moraes, A.S. (2002) Value of recreational fishing inn the Brazilian Pantanal: a travel cost analysis using cost data models, Ecological Economics, Vol. 42, pp. 289-299.
This paper uses the TCM to estimate the demand for and economic value of recreational fishing intheBrazilianPantanal,atropicalseasonalwetlandlocatedinthecentreofSouthAmerica.
Face-to-face surveys were undertaken with anglers while they had their catch weighed at mandatory catch weigh-in stations. Respondents were asked about their travel costs, reasons for choosing the fishing site and their demographic characteristics. More specific preference variables were also explored including whether the number and variety of fish species available influenced their site choice, whether the site was chosen due to proximity and whether non-consumptive use and non-use values associated with observing wildlife/environment were a motivation. It is shown that this latter factor is important. As a result, the authors suggest that management should focus more broadly on the ecosystem rather than the recreational fishery.
The authors test and compare various model forms for the estimation of recreational fishing demandusingTCMincludingnon-linear,Poissonandnegativebinomialcountdatamodels.

24 Fisheries Research Contract Report [Western Australia] No. 21, 2009
Non-market economic valuation (revealed preference): random utility modelling
Relevant to: Non-market users such as recreational fishers. Output: Net economic benefits associated with resource use. Usefulness: Can be compared with net economic benefits in commercial sector to make resource allocation decisions. Data: Participationcostdata(e.g.travelcosts),participationrates,socialandeconomicdata relating to fishers, fishing site characteristics. Requires survey data collection. Time/cost: High given large data requirements and complex analysis.
What is it?
Random utility modeling (RUM) is similar to TCM in that both techniques utilise trip and cost data to estimate economic value. RUM therefore requires the same data collection methods as the TCM. The difference between the two methods is that for TCM, an angler’s demand for recreational fishing at a site is estimated over time and assumed to be a function of trip cost. Recreational fishing is therefore treated as an activity that is demanded continuously through time (Blamey, 2002). In contrast, RUM treats the demand for recreational fishing as a series of discrete choices. That is, a decision is made for every trip in the form of a one off discrete choice between multiple fishing sites (Blamey, 2002). Each decision made by a user is based on the objective of maximising the expected benefits (or utility) from a fishing trip and will be dependent on the relative qualities of all sites available and the utility derived from the site (Sandefur et al., 1996). Using RUM therefore involves estimating the probability that an individual will visit a site given the characteristics of the site/s being evaluated, the characteristics of substitute sites as well as the characteristics of individual resource users which are likely to determine their preferences (Sandefur et al. 1996). As put by Sandefur et al. (1996, pg. 6), ‘[t]he better the characteristics of a site, the higher the probability that an individual will choose that site, and thus the higher the value of that site will be’.
How is it done?
Valuing a resource using RUM involves four main steps (Blamey 2002). These are:
i) defineallrelevantfishingsitesandtheirattributes;
ii) modeltheallocationoffishingtripstofishingsites;
iii)modelthefrequencyoffishingtripsoveraperiod,and;
iv) calculate the economic benefits for a given change in fishing opportunities.
The actual random utility model is estimated using what is known as the maximum likelihood method, whereby all the model’s coefficients on each of the independent variables are estimated together so as to maximise the likelihood that the sites/options chosen by individuals sampled will be predicted by the model (Sandefur, 1996). The estimated probabilities can then be used to determine the utility and the value or willingness to pay associated with different sites. As outlined by Sandefur (1996, pg. 8), ‘[t]hese WTP [willingness to pay] estimates should not be confused with a person’s WTP to take a recreation trip as estimated by travel-cost models. It is not the actual trip to a specific site that is being valued. Instead, it is the opportunity to have a site with specified characteristics among one’s menu of options’.

Fisheries Research Contract Report [Western Australia] No. 21, 2009 25
Benefits and limitations
Blamey (2002) notes that one of the main advantages of RUM is that it allows a specific site to be valued within a regional context, taking into account other substitute sites within a given region. RUM also allows specific characteristics of sites to be valued. This can be particularly relevant to policy makers where, for example, policy decisions are being made about access options for a range of recreational fishing sites with various observable characteristics (e.g. car parking, fish cleaning facilities, high catch rates and so on). It also allows the results for one site to be extrapolated to other sites with similar characteristics.
When compared to TCM, RUM is considered more relevant when individuals are inclined to swap between sites given variations in site characteristics, such as expected catch. It follows that TCM is preferred when individuals are likely to vary their demand (in terms of quantity of visits) for a site given a change to its characteristics instead of substituting to another site (Blamey, 2002).
Sandefur et al. (1996) argues that RUM has a number of advantages over traditional TCM. They state that relative to RUM, TCM fails to accurately model the decisions of recreational resource users as it does not take into account the factors that determine how an individual chooses betweenoptions.Putsimply,RUMmeasurestheinfluenceofarangeofsitecharacteristicsondecisions and should therefore be more accurate. RUM also allows a greater number of sites to be dealt with. However, the authors point out that RUM is more complex, requires more data and requires the use of relatively advanced estimation techniques. As a consequence, the technique will generally be associated with relatively higher funding and time requirements.
Due to the complex nature of the estimation techniques used for RUM, there is a large amount of literature that deals with some of the technical issues that may impact on the accuracy of random utility model. Such issues that have been explored using recreational fishing data includechoice set specification (i.e.which sitescanbe selected) (Feather,1994;Parsonsetal., 2000), site aggregation and spatial boundary definition (Parsons andNeedelman, 1992;ParsonsandHauber,1998),dealingwithunobservedsitecharacteristics(Murdock,2006)anddealingwithparticularlylargenumbersofsitesoroptions(ParsonsandKealy,1992).

26 Fisheries Research Contract Report [Western Australia] No. 21, 2009
Examples of random utility modelling in fisheries research
Greene, G., Moss, C.B. and Spreen, T.H. (1997) Demand for Recreational Fishing in Tampa Bay, Florida: A Random Utility Approach, Marine Resource Economics, Vol. 12, pp. 293-305.
In this paper, a demand function for recreational fishing in Tampa Bay, Florida is estimated. A nested multinomial logit random utility model is used in which the probability that an individual visits a site can be estimated given travel costs to all available sites within a region, angler’s demographic characteristics and site characteristics. Their modelling was based on data drawn from a variety of sources including a University of Florida research project, the Marine Recreational Fishing Statistics Survey (an annual nationwide survey which includes non-market valuation questions undertaken by the National Marine Fisheries Service) and phone and mail surveys.
The authors explain that most RUMs are multinomial logit models - models for which the dependent variable (i.e. site choice) is a nominal variable (a variable that can be ordered in any way) that consists of more than two categories. However, they note that multinomial logit models are limited when multiple dependent decisions are modelled. For example, when an angler’s decision to fish at “site A” or “site B” is dependent upon whether the angler has decided to “fish” or “not fish”. Consequently, the authors use what is referred to as a nested multinomial logit approach. This approach allows series of decisions to be modelled according to decision trees. By taking this approach, the decisions of individuals who choose to not participate in recreational fishing can also be modelled. The authors, therefore, are also able to estimate the value of recreationally fishing in Tampa Bay to these non-participants in terms of an option-value using survey data collected from such non-participants.
Kaoru, Y. (1995) Measuring marine recreation benefits of water quality improvements by the nested random utility model. Resource and Energy Economics, Vol. 17, pp. 119-136.
The author uses RUM to assess economic benefits to recreational anglers resulting from waterqualityimprovementsintheAlbemarle-Pamlicoestuary,NorthCarolina.Athree-levelnested RUM structure is used whereby the choice to participate is broken down into an ordered three decision level process. First, an angling party decides how long their fishing trip will be in terms of days. Then the decision is made as to which of the 5 regions in the Albemarle-PamlicoEstuarythepartywillvisit.Finally,thepartychoosesasite(boatrampsand/or marinas) within the chosen region.
To undertake the analysis, data were collected via an on site face-to-face angler survey for 35 differentsites.Pollutiondatasourcedfromalocalenvironmentalmonitoringagencywereused as a proxy of water quality and allowed the authors to assess how water quality impacts on angler’s choice of fishing location.
Different variables were modelled for the three decision levels. For the trip length decision, lodging cost and fishing party composition (i.e. family, friends and so on) are considered. For the choice of region, boat ownership, pollutant discharge in the area and a ratio of a region’s surface water to the respondent’s boat horsepower are used. For the final site decision, travel cost, catch rate, the type of boat ramp (private or public) and an indication of local pollution levels are assessed. The author is then able to evaluate the level of economic benefit to anglers that would occur under a range of water quality improvement scenarios.

Fisheries Research Contract Report [Western Australia] No. 21, 2009 27
Non-market economic valuation (stated preference method): contingent valuation method
Relevant to: Non-market users (e.g. recreational fishers) and non-users (e.g. public). Output: Net economic benefits associated with users and non-users of a resource. Usefulness: Output can be compared with net economic benefits in commercial sector to make allocation decisions and allows non-user values to be assessed. Data: Stated hypothetical values, behaviour and preferences of respondents, participation rates, social and economic data relating respondents. Requires survey data collection. Time/cost: High given data requirements.
What is it?
The contingent valuation method is a ‘method of estimating consumer surplus based on individual responses to contingent circumstances posited in hypothetical or experimental markets’ (Chavez-Comparan and Fischer, 2001, pg. 334). The objective of the CVM is to collect a stated value or willingness to pay and/or accept compensation that is attached to a particular hypothetical scenario or circumstance by survey respondents. This sample of stated values is then used to estimate the benefit that would arise for an entire population if that circumstance actually occurred.
How is it done?
Using recreational fishing as an example, survey respondents are asked to indicate their willingness to pay for a certain positive outcome such as an improvement in fishing success. Alternatively, respondents can also be asked for their willingness to accept compensation given a negative change, such as reduced catch rates. Blamey (2002) suggests that the latter approach is most appropriate when a person who has a clearly defined property right over the resource is likely to suffer a loss.
Correct questionnaire design is highly important given the hypothetical context of the questions that are asked. Imber et al. (1991) suggest that although questionaries will vary according to the characteristics of the evaluation being undertaken, there will typically be four parts to a CVM questionnaire. These include:
• ‘a comprehensive description of the amenity being valued and the hypothetical marketunder which the amenity is made available to the respondent’;
• ‘questionsdesignedtoelicitthedollarvaluesattachedtotherespondentspreferencesfordifferent levels of environmental amenity provision’;
• ‘questions on demographic variables such as age, income and education. Also included are questions about the respondent’s opinions, preferences, attitudes and use of the amenity’;and,
• ‘a set of focus statements designed to help frame the respondent’s valuation decision’ (Imber et al., 1991, pg. 8-9).
When using CVM to evaluate recreational fishing activity specifically, there are two possible question formats that are typically used. Under one approach, respondents are first asked a question, such as ‘How much extra would your fuel, bait and other costs have to have been today for you to have decided not to go fishing?’ (Blamey, 2002, pg. 136). Then a series of follow-up questions are asked in relation to the value of the fishing experience. These questions commonly revolve around the number of fish caught. The alternative approach simply involves

28 Fisheries Research Contract Report [Western Australia] No. 21, 2009
directly asking at the outset for a respondent’s willingness to pay for a specified change to their fishing experience.
Benefits and limitations
CVM has an advantage over most non-market valuation methods given that respondents’ willingness to pay can be derived directly during an interview rather than indirectly via estimation of demand equations (Blamey, 2002). Other advantages include that participation by respondents on-site is not required, several potential scenarios may be presented allowing for the comparison of different outcomes using relatively simple data analysis and further, both user and non-user values can potentially be obtained (Reichers and Fedler, 1996). This latter point implies that CVM is widely applicable to many types of stakeholder groups.
The disadvantages associated with CVM stem mainly from the hypothetical nature of the questions asked (Hoehn, 1987). Such problems can be addressed to some degree through careful considerationofsurveymethod,contentsandstructure.Gaininginputfromfocusgroupswhendesigning the survey questionnaire and undertaking pre-survey testing of the questionnaire will also assist in addressing such issues (Cantrell et al., 2004). However, the hypothetical context of the questions still means that any values estimated reflect what respondents say they would do and not what they would actually do in reality. Blamey (2002) identifies three sources of response bias that may occur in CVM evaluations:
• ‘respondent incentives’ to misrepresent their value. This misrepresentation may be caused by strategic bias if respondents believe they can influence the research outcomes or compliance biasifrespondentstrytopleasetheresearcher;
• ‘implied value cues’ where an individual’s stated goal is influenced by the content of the surveyquestionnaireorthefactthattheresearchisbeingperformed;
• ‘scenario misspecification’, which is either theoretical misspecification where the described scenario is not consistent with theory or the likely policy instruments, amenity misspecification where the respondent’s stated value relates to a different good and context misspecification where the respondent’s hypothetical market is incorrect.
Another problem associated with using CVM is that the researcher needs to ensure that respondents take into account the availability of substitute sites and activities when indicating their willingness to pay or willingness to accept compensation. Testing for this however is difficult (Blamey, 2002). Finally, a key issue is that the data requirements for CVM mean that such evaluations are costly and time intensive.

Fisheries Research Contract Report [Western Australia] No. 21, 2009 29
Examples of contingent valuation method in fisheries research
Wheeler, S. and Damania, R. (2001) Valuing New Zealand recreational fishing and an assessment of the validity of the contingent valuation estimates. The Australian Journal of Agricultural and Resource Economics, Vol. 45, No. 4, pp. 599-621.
Wheeler and Damania (2001) use CVM to estimate the value of recreational fishing in New Zealand. Their estimates are based on data collected via interviews at boat ramps. The key question used in their survey asked respondents if they were willing to pay an extra nominated amount for their trip and prompted respondents to ‘take-it-or-leave-it’. Respondents were then also questioned about their trip costs (such as bait, fuel, ice and so on). The following question would then be posited: ‘If it had cost you an extra $X on these items, would you have still gone fishing today?’.
Using the collected data, both marginal and average willingness to pay for five fish species are estimated. The authors show that recreational value is largely dependent on the motive for recreational fishing. If the motive to catch was for eating purposes, marginal economic values tended to be consistent with the market price of fish. If the fishing motive was simply the enjoyment of catching fish for recreational purposes, marginal values were higher. Furthermore if the fishing motive was enjoyment, values were shown to be higher for rare and larger species.
Cantrell, R.N., Garcia, M., Leung, P.S. and Ziemann, D. (2004) Recreational anglers’ willingness to pay for increased catch rates on Pacific threadfin (Polydactylus sexfilis) in Hawaii. Fisheries Research, Vol. 68, pp. 149-158.
CVM is used to assess the value to anglers of a stock enhancement program forPacificthreadfin in Hawaii. Accordingly, the objective of the paper was to estimate the economic value to anglers of catch rate improvements. Factors that influence willingness to pay for catch improvements were also assessed.
The authors use trip costs as the payment vehicle given that other forms of payment (such as licence fees paid to government) may have encouraged protest bids. Respondents were first asked to determine the cost of their most recent fishing trip. They were then asked if they would still have taken the trip if they had known the outcome (in terms of catch) ahead of time. If a respondent answered ‘yes’, they were then asked how much extra they would have been willing to spend on that trip (in terms of trip cost). If a respondent answered ‘no’, they were asked how much less they would have been willing to spend to have still gone. A second stage of the survey then described a stock re-enhancement program that aimed to improvecatchratesofPacificthreadfin.Respondentswerethenaskedhowmuchextratheywould be willing to pay for an additional catch of 1, 3, 9 and 11 average sized fish.

30 Fisheries Research Contract Report [Western Australia] No. 21, 2009
Arin, T. and Kramer, R.A. (2002) Divers’ willingness to pay to visit marine sanctuaries: an exploratory study. Ocean & Coastal Management, Vol. 45, pp. 171-183.
The authors use CVM to evaluate the willingness of tourists to pay for diving access to marine sanctuaries where fishing is banned in the Philippines. The willingness to payestimates allow the estimation of an optimal sanctuary entrance fee, the charging of which could raise funds to assist local communities to manage these local coral reef systems and prevent human induced degradation through fishing and tourism.
CVM data were collected via a face-to-face survey with divers on site. The survey collected a range of information regarding their social and economic characteristics, trip cost and trip characteristics. The key question asked was ‘How much would you be willing to pay as a daily, per person entrance fee to a marine sanctuary where fishing is prohibited, in addition to the other costs of the trip?”. Respondents were provided with a range of payment options and could also declare some other amount.
Using the collected data, the authors estimate a model of demand for diving and estimate the maximum willingness to pay to dive in a marine sanctuary. This maximum willingness to pay is defined as the point where a respondent is indifferent between paying to dive and not paying and not diving. The authors also analyse how social and economic factors and trip characteristics influence respondent willingness to pay.
Non-market economic valuation (stated preference): choice modelling
Relevant to: Non-market users (e.g. recreational fishers) and non-users (e.g. public). Output: Net economic benefits/value to users and non-users. Usefulness: Output can be compared with net economic benefits in commercial sector to make resource allocation decisions and allows non-user values to be assessed. Data: Respondent hypothetical choice data, social and economic data relating to respondents. Requires focus groups and survey data collection. Time/cost: High given large data and participation requirements and complexities associated with questionnaire design and data analysis.
What is it?
Choice modelling is a technique that was developed from conjoint analysis — a form of statistical analysis that has traditionally been used for marketing research purposes to analyse the attributes of different marketable goods (Blamey, 2002). Choice modelling has similarities to CVM, in that respondents are asked to reveal their preferences under hypothetical scenarios. For choice modelling, however, respondents are required to make a sequence of multiple hypothetical choices as opposed to one, in CVM (Bennett, 1999).
How is it done?
Typically, six to eight choice sets are presented. A respondent is then required to choose between a status quo scenario and a number of other alternative proposed scenarios. Both the status quo scenario and all alternative scenarios have defined attributes (or environmental conditions). Examples of attributes provided by Bennett (1999) include the ‘number of endangered species present’, ‘the area of healthy vegetation remaining’ and ‘the number of visitors per annum’ with each attribute being associated with a range of predefined levels that vary between alternative scenarios. For example, for the ‘number of endangered species present’ attribute, predefined levels could be ‘5 species’, ‘10 species’ and ‘15 species’. Each

Fisheries Research Contract Report [Western Australia] No. 21, 2009 31
choice set, its scenarios and attribute levels are determined by the research using experimental design processes (Bennett, 1999).
The technique draws on random utility theory (Wattage et al., 2005) and involves the modelling of respondents choices between alternative scenarios based on the observed choices of a sample of a stakeholder population to a choice modelling questionnaire (Bennett, 1999). The final model allows the researcher to estimate the probability scenario selection by a member of the stakeholder population. As put by Bennet (1999, pg. 3) ‘it is possible to infer peoples’ willingness to give up some amount of an attribute in order to achieve more of another’. To derive economic value (willingness to pay) for different attributes, the researcher can specify one of the attributes in terms of a dollar cost which can then be used to derive a willingness to pay for all other attributes (Bennett, 1999). Bennett (1999) describes the following steps to undertaking a choice modelling evaluation:
• Establishtheissue;
• Definetheresearchdesign;
• Definetheattributes;
• Definethelevel;
• Designthequestionnaire;
• Compiletheexperimentaldesign;
• Surveytherespondents;
• Prepareandanalysethedata;
• Analysetheresults.
The time and cost of a choice modelling evaluation are largely dependent on the data collection method used. Bennett (2005) states that a minimum of 2-3 months is required for primary data collection via mail survey (normally appropriate for a broader scope study of a state-wide issue for example) while 1-2 months should be sufficient for data collection via face-to-face survey interviews (normally relevant to the investigation of localised issues). Regarding cost, Bennett (2005) suggests a budget of at least AU$100 000 for a commercially commissioned study of a statewide issue.
Benefits and limitations
A key issue for any choice modelling exercise relates to questionnaire design. Blamey et al. (1997) identify a number of relevant questions. These include whether causal relations exist among attributes and the level of disaggregation with which attributes are specified. For example, impacts on specific species could be cited or impacts on wildlife as a whole could be investigated. In addition, questions exist as to whether the selection of attributes should be made according to the specified requirements of government, researchers or stakeholders and whether policy labels should be used for different alternative scenarios. Other issues for questionnaire design as identified by Blamey et al. (1999) are the information needs of respondents, cognitive burden for respondents, ambivalence on the part of the respondent, perceived plausibility and perceived bias.
Morrison et al. (1997) explore the role of using focus groups to address some of these issues and to assist with questionnaire design. They argue that ‘focus groups are a vital part of any choice modelling application. They are useful for determining which attributes should be

32 Fisheries Research Contract Report [Western Australia] No. 21, 2009
included in questionnaires, for trialling alternative questionnaire formats and for detecting the existence of bias or other problems’ (Morrison et al. 1997, pg. 27).
Rolfe and Bennett (2000) test the affects of varying questionnaire framing on the respondents’ choices. Framing refers to the ‘context in which the hypothetical scenarios and tradeoffs are put to respondents’ (Rolfe and Bennett, 2000, pg. v). They show that framing environmental options in a regional context instead of in a general context caused problems for respondents and influenced the results.
As identified by Bennett (1999), choice modelling is associated with a number of distinct advantages over other non-market valuation methods and in particular CVM. Its primary advantage is that it allows the values of different attributes to be estimated allowing for the impacts of a relatively wider range of policy options to be considered in comparison to CVM. Similarly argued by Blamey (2002), choice modelling provides researchers and policy makers with a greater flexibility to test different policy scenarios or options. In addition, the methods enables researchers to gain some understanding of what impact different scenarios will have on a stakeholder groups. Like CVM, the method allows both use and non-use values to be estimated (Bennett, 1999).
Choice modelling is also subject to some of the same issues as CVM, particularly issues relevant to the hypothetical nature of the approach and the potential for response biases. Additionally, the use of choice modelling may be particularly costly given that the technique requires a high degree of technical skill and experience (Bennett, 1999) and large sample sizes (often in excess of 1000).

Fisheries Research Contract Report [Western Australia] No. 21, 2009 33
Examples of choice modelling in fisheries research
Wattage, P., Mardle, S. and Pascoe, S. (2005) Evaluation of the importance of fisheries management objectives using choice-experiments. Ecological Economics, Vol. 55, pp. 85-95.
Wattage et al. (2005) use choice modelling to evaluate the importance of various fisheries management objectives to different stakeholder groups for fisheries in the English Channel. The authors undertake a survey of 23 distinct stakeholder groups. Shown in the table below are the three management objectives and their various levels, with each level describing the potential characteristics. Respondents were asked to select their preferred level for each objective.
Management objective
Level I Level II Level III Level IV
1. Conserve the fishery and marine environments
Increase sustainable yields of commercial species
Decrease bycatch of non-commercial species
Improve quality of the marine environment
–
2. Improve the fishery socio-economic structure
Maintain direct fishery employment
Maintain fisheries-related regional employment
Increase profit in the fisheries
Increase labour and safety conditions in the fishery
3. Reduce conflict within the fishery (i.e. allocation)
Between inshore/offshore fishermen
Between towed/fixed fishing gear
Between different geographical groups
–
ModifiedfromWattageetal.(2005,pg.90).
The authors show that the most preferred scenario or combination of management objective levels is to have increasing sustainable yields, maintain regional employment and reduce conflict between towed and fixed gears. The analysis is taken further by performing a weighted analysis of the results whereby the authors weight the responses of stakeholders according to their role in the management process (rather than assuming that each respondent’s views are equally important). The authors don’t use the technique to determine economic value but note that it could be done and further, that their approach ‘provides the opportunity to elicitadeeperunderstandingofdifferentlevelsofmanagementobjectivesthatwouldhelpto achieve efficient fisheries management options’ (Wattage et al., 2005, pg. 93).

34 Fisheries Research Contract Report [Western Australia] No. 21, 2009
Eggert, H. and Olsson, B. (2004) Heterogenous preferences for marine amenities: a choice experiment applied to water quality. Working Papers in Economics, no. 126, Göteborg University, School of Business, Economics and Law. Available at: http://gupea.ub.gu.se/dspace/bitstream/2077/2834/1/gunwpe0126.pdf
The authors use choice modelling to investigate the preferences and values of residents on theSwedishwestcoastwithregardtowaterqualityimprovements.Preferencesandvalueswere investigated in terms of three attributes: fish stock levels, bathing (swimming) water quality and biodiversity levels. These benefits represent both use and non-use values.
Data collection for the choice experiment was carried out via a mail survey. The survey first introduced respondents to the three attributes and their associated cost levels. The means to attaining an improvement was then described as the payment of an annual user fee. Respondents were also provided with a fact sheet that provided more details about each of the attributes. Four choice sets were then provided to each respondent with each choice set containing three alternatives, one of which would be a status quo alternative (no change) while the other two alternatives would involve some form of improvement at some level of cost. The attributes and alternatives are presented in the table below. The results of their investigation showed that the objectives with greatest priority were to first prevent further depletion of biodiversity and then to improve Swedish cod stocks.
Attribute Description Levels
Bathing water quality (%) Frequency of west-coast sites violating the quality standard
12, 10, 5
Biodiversity Biological diversity or ecosystem balance, where today’s level is medium
Low, Medium, High
Cod stock (kg) Catch per trawling hour with a research vessel
2, 25, 100
Cost (SEK) The total cost for an individual alternative
0, 120, 240, 600, 960, 1800
Eggert and Olsson (2004).
Oh, C., Ditton, R.B., Gentner, B. and Riechers, R. (2005) A Stated Preference Choice Approach to Understanding Angler Preferences for Management Options, Human Dimensions of Wildlife, Vol. 10, No. 3, pp.173 -186.
The authors use choice modelling to investigate the decisions anglers make between hypothetical fishing trips given fishing regulation changes, their fishing expectations and trip costs. Based on this analysis, the authors try to understand the preferences of anglers for various fishing trip attributes (including a range of management controls), their willingness to make tradeoffs between attributes and their willingness to pay for different combinations of choice attributes.
Respondents were asked to make choices that involved ranking various management schemes. The management controls or policy attributes considered related to bag limits, minimum size limits, maximum size limits and the allowance to retain big fish. The authors modelled angler preferences regarding management settings and how their preferences change when their expectations in terms of average fish size, catch probability and travel cost change.

Fisheries Research Contract Report [Western Australia] No. 21, 2009 35
Non-market economic valuation (revealed preference): other conjoint techniques – contingent rating, contingent ranking and paired comparison
Relevant to: Non-market users (e.g. recreational fishers) and non-users (e.g. public). Output: Net economic benefits to users and non-users. Usefulness: Output can be compared with net economic benefits in commercial sector to make allocation decisions. Methods can be used to provide non-user values. Not as reliable as CVM and choice modelling. Data: Respondent hypothetical choice data, social and economic data relating to respondents. Requires focus groups and survey data collection. Time/cost: High given data and participation requirements and complexities associated with questionnaire design.
A number of other conjoint analysis techniques exist that can be used to evaluate different scenarios and associated attributes in a similar way to choice modelling. Such methods include ‘contingent ranking’, ‘contingent rating’ and ‘paired comparisons’. Morrison et al. (1996) perform a comparison of these other conjoint techniques to choice modelling and CVM. They point out a number of limitations associated with these other conjoint techniques.
Contingent ranking is an approach that requires respondents to rank a series of options presentedinindividualchoicesetsfrommosttoleastpreferred(Blamey,2002;Morrisonetal.,1996). This technique is based on random utility theory. However, Morrison et al. (1996) note that the technique violates a number of theoretical assumptions. They also show that contingent ranking applications are likely to be prone to the same biases that commonly occur in CVM evaluations. Yet, as contingent rating requires that respondents consider one option at a time and assign each option a rating or score (Morrison et al., 1996), this technique may be less prone to biases than CVM. In contrast, this technique may have a weaker theoretical basis and suffer from estimation bias (Morrison et al., 1996).
The paired comparison technique requires that respondents rate the difference between two choice alternatives by providing a score (Morrison et al., 1996). According to Morrison et al. (1996), the technique suffers from the same limitations as contingent rating.
All three of the techniques just described are at a disadvantage in comparison to CVM and choice modelling in that they can only estimate relative values (as opposed to stand alone values) for different attributes or scenarios (Morrison et al., 1996). The authors conclude that when compared to CVM, out of the conjoint techniques discussed, choice modelling offers the most potential as an alternative to CVM that can provide useful and valid estimates of economic value.
Method: Non-market economic valuation: combined approaches
Relevant to: Non-market users (e.g. recreational sector). Output: Net economic benefits to non-market resource users. Usefulness: Output can be compared with commercial net economic benefits. Can be advantageous compared to using either a stated or revealed preference method alone. Data: Stated hypothetical data, revealed preference and behaviour data, participation rates, and social and economic data relating to respondents. Requires survey data collection. Time/cost: High given large data requirements.

36 Fisheries Research Contract Report [Western Australia] No. 21, 2009
Both revealed preference techniques and stated preference techniques are associated with different advantages. Consequently, there can be an advantage to combining different aspects of the two types of technique when undertaking a non-market valuation. For example, given an individual’s current behaviour, a researcher could predict how future behaviour or demand for an activity would change as a result of change in some aspect of an activity, such as its cost. The predicted shift in demand associated with this hypothetical change could then be used to estimate change in consumer surplus. For recreational fisheries, this could involve combining revealed preference data regarding current participation with hypothetical stated preference data regarding participation behaviour or likely response under altered circumstances or management policies. The advantage of this approach is that the use of the TCM can be extended more fully to cover a wider range of potential management scenarios than is otherwise possible with use of the standard TCM. The main weaknesses occur as a result of the same hypothetical response biases prevalent in the use of CVM (Blamey, 2002).
3.4 Other non-specific economic evaluation methods
Economic valuation: benefit transfer
Relevant to: Any stakeholder. Output: Net economic benefits. Usefulness: Easy to perform but not very reliable in most cases. Data: Previousstudyofasimilarfishery/stakeholdergroup. Time/cost: Low.
Benefit transfer essentially involves the assumption that the net economic value of one fishery calculated in a previous study is equivalent to that of the current fishery as a result of similarities between the two fisheries. It therefore follows that no primary data collection is required for this method – an obvious advantage where funding and time are limited. The reliability of the technique is dependent on the validity of the assumed similarities between fisheries. The assumption can only be deemed reliable to some degree when the following holds true:
• Thereissimilarityintheobjectsbeingvalued;
• Thereissimilarityinpopulations;and
• Theoriginalstudyundertakenwasaccurate.
Benefit transfer is an advantageous technique to use when the performance of a proper valuation study is not feasible given time or budget constraints. However, the appropriateness of the technique will ultimately be determined by whether the three factors described above hold true and the potential cost associated with an incorrect evaluation (Blamey, 2002).
For an example of how benefit transfer can be used for the evaluation of a recreational fishing sectorthereaderisreferredtoGaleanoetal.(2004)whousethemethodtoestimatethevalueof recreational fishing in the Australian eastern tuna and billfish fishery.

Fisheries Research Contract Report [Western Australia] No. 21, 2009 37
Bioeconomic modelling
Relevant to: The use of a fishery resource by any sector. Output: Net economic benefits under different scenarios. Usefulness: Can determine what management settings are economically optimal as well as how changes to a fishery’s operating environment will impact on fishery profitability. Data: Very data intensive. Requires biological, economic, catch and effort/participation data. Time/cost: High given large data requirements and complexity.
What is it?
Bioeconomic models are generally considered to be tools rather than an evaluation methods (Newton et al., 2007). Bioeconomic models are similar to biological population models in that the aim of both is to provide a simplified version of a very complex system of relationships. In biological population models, the relationship of a stock biomass to variables, such as fish reproduction rates and natural fishing mortality, may be captured. Bioeconomic models can be thought of as an extension of these biological population models in that the economic and management characteristics of the fishery are imposed on the biological relationships of the systembeingmodelled(GoodayandGaleano,2003).Suchmodelscanthenbeusedtopredictthe impact on fishery profitability that is likely to result from a change in some variable (or multiple variables) such as fishery catch, effort and biomass levels.
There are many definitions for the terms ‘bioeconomic’ and ‘bioeconometric’ modelling in the literature. In defining bioeconomic modelling, Knowler (2002, pg. 163) states that ‘[b]ioeconomic modelling in fisheries integrates economic and biological influences with the goal of assisting natural resource managers in determining appropriate levels of stock and catch’. Seijo et al. (1998) describes the process of bioeconomic modelling in terms of a system simulation approach which is a ‘problem solving process through which particular time solutions of a mathematical model are arrived at, based on specific assumptions regarding input variables, parameters and causal relationships between them’. While Smith (2008, pg. 2) defines a bioeconometric model as ‘a structural model that econometrically estimates one or more parameters of a bioeconomic system. Structural in this context means that the model includes the main causal forcings in the system, both biological and economic. To qualify as bioeconometrics, we require explicit models of the population dynamics, economic behaviour, and a link between the two’.Finally,DannandPascoe(1994),indefiningwhatabioeconomicmodel is, provide a diagrammatical depiction of the key variables that must be accounted for in any bioeconomic model of a commercial fishing sector (Figure 2).

38 Fisheries Research Contract Report [Western Australia] No. 21, 2009
Catch
Effort
MANAGEMENT
FLEET
C
Fishing mortality reduces stock in next period
Naturalmortalityand growth
STOCK
PROFITS
Fixed costs
PriceInputcontrols
Variable costs
Catchquotas
Catch-effortfunctions
Figure 2. Diagrammatical depiction of a bio-economic model of a commercial fishing sector.
Adapted from Dann and Pascoe (1994).
Smith (2008) describes three categories of bioeconomic models. The first, which he refers to as an ‘equilibrium bioeconometric model’, involves imposing a steady state equilibrium in the model estimation process – that is, the system (or fishery) will always naturally move to some point given the incentives provided to fishery operators within the system7. The focus of such a model is on how changes in different variables, such as fish prices, will impact on where that equilibrium occurs in a given period. The two other approaches the author refers to are models that represent a dynamic system that is not in equilibrium. The first of these are referred to as ‘dynamically decoupled bioeconometric models’. Decoupling refers to the approach of estimating the economic and biological parameters separately, with the parameters from each component then being combined for the final bioeconomic simulation. Often this may involve taking relevant biological parameters from a previously undertaken biological population study. Smith (2008, pg. 5) notes that ‘[p]utting the models together requires some type of calibration that links a biological state (e.g. the fish stock) with an economic state (e.g. fishing effort)’. It follows that the third type of bioeconomic model is the ‘dynamically coupled bioeconometric model’ in which the biological and economic parameters are estimated jointly. The author notes that this approach ‘has the virtue of consistent estimation if the observed fisheries data are truly a reflection of endogenous biological and economic processes. The drawback is that the scope of the bioeconomic model is limited by the availability of fisher-dependent data’ (Smith, 2008, pg. 5).
7 Forexample,inanopenaccessfishery,theequilibriumpointiswhereeconomicprofitsinthefisheryarezerosothatthereisnoincentiveforvesselstoexitorenterthefishery—apointreferredtoasopenaccessequilibrium.

Fisheries Research Contract Report [Western Australia] No. 21, 2009 39
Key features of dynamic bioeconomic models are the use of discount rates and optimal control theory. The use of a discount rate allows economic returns that are received in the present period to be valued relative to the economic returns that could be received in the future. A positive discount rate will mean that fish caught now are more highly valued relative to their future value as it suggests that returns (revenue) from current catches can be invested elsewhere for a positive return (a rate of return equivalent to the discount rate). The discount rate can therefore be used to calculate the optimal level of biomass where the net present value of the fishery resource will be maximised (taking into account the value of net economic returns in future periods) assuming that an appropriate discount rate is known.
Optimal control theory, as defined by Loehle (2006, pg. 957), is a ‘branch of mathematics and engineering that identifies optimal control policies for dynamic systems’. The use of optimal control theory in dynamic fishery bioeconomic models allows the optimal path towards the optimal biomass over time to be determined given constraints in the system such as the discount rate, the stock demography (i.e. age structure, sex ratio), fishery revenue and costs. The reader is referred to Clark (1985), Hannesson (1993) and Eggert (1998) for an outline of the theory behind dynamic fishery bioeconomic models and fishery bioeconomic modelling in general. In addition, Loelhe (2006), Cliff and Vincent (1973) and Cohen (1987) undertake further explanation of optimal control theory in fishery bioeconomic models.
How is it done?
Seijo et al. (1998) describe the following steps to constructing fishery bioeconomic models (what they refer to as system simulation):
a. ‘A clear definition of fishery information needs’;
b. ‘Fishery characterization, in terms of resource and fishing effort dynamics, ecological and technological interdependencies and management instrument;
c. ‘Mathematical modelling of the fishery components or subsystems’;
d. ‘Data collection, from both primary and secondary sources, needed to estimate parameters and fit equations of the mathematical model.
e. ‘Development of a computer model to solve numerically the mathematical model;
f. ‘Stability and sensitivity analyses for the computer model;
g. ‘Model validation’;
h. ‘Evaluation of the bioeconomic impacts of alternative management strategies’.
The data needs for a fishery bioeconomic model are significant. A general description of the data required includes (but is not limited to):
• stockmortalityandgrowth;
• pricesreceivedforlandedfish;
• fishpriceelasticity;
• fisheryeffortdata;
• fisherycostdata(bothvariableandfixed)(GoodayandGaleano,2003).

40 Fisheries Research Contract Report [Western Australia] No. 21, 2009
Benefits and limitations
It should be remembered that bioeconomic models are an attempt to simplify a very complex system and that model accuracy may decrease with higher degrees of simplification and higher degrees of system complexity. Therefore, when model results feed into policy, caution should be exercised and acknowledgement of the assumptions as well as reasons for use and model-building, such as data-limitations or a focus on a particular issue, should be critically analysed. Indeed, Smith (2008, pg. 21) notes that ‘small differences in [a model’s] parameter estimates donotjusthavelargeeffectsonbenefit-costratios;theycanchangethenatureoftheshort-and long-run dynamics and thus can change the nature and the relative urgency of a policy intervention’.Thesameresultswillnotnecessarilyoccurinallstudies;however,theresearchershould be aware of the potential for increased uncertainty when using simplified models (S.J. Metcalf, pers. comm.). In line with this comment from Smith (2008), it may be best to run bioeconomic models under a range of assumptions to test how sensitive model results are to the various assumptions that are made in the model.
The construction of a bioeconomic model requires large amounts of resources in terms of data, time, expertise and funding. For many fisheries, the data requirements to construct a bioeconomic model are likely to exceed the data that are currently available. In many cases, the cost of constructing a bioeconomic model may outweigh the potential benefits from having a model and may therefore be difficult to justify. This may of particular relevance when dealing with small or low value fisheries.
Examples of bioeconomic modelling in fisheries research
Massey, D.M., Newbold, S.C. and Gentner, B. (2006) Valuing water quality changes using a bioeconomic model of a coastal recreational fishery, Journal of Environmental Economics and Management, Vol. 52, pp. 482-500.
The authors construct a structural bioeconomic model in three stages. The first stage involves a fish population model to investigate the effect of water quality on the abundance and reproduction of summer flounder on the Atlantic coast. The second stage is based on a catch model that predicts the effect of water quality and flounder abundance on the catch rates of recreational anglers in the same region. The third stage is a recreation demand model that estimates the relationship between catch rates and recreational angler demand (or economic value) and uses stated preference (conjoint-choice modelling) data. Accordingly, the authors are able to model the impact of water quality changes on the economic benefits going to recreational anglers targeting summer flounder.

Fisheries Research Contract Report [Western Australia] No. 21, 2009 41
Kulmala, S., Laukkanen, M. and Michielsens, C. (2008) Reconciling economic and biological modelling of migratory fish stocks: Optimal management of the Atlantic salmon fishery in the Baltic Sea, Ecological Economics, Vol. 64 pp. 716-728.
This paper presents a bioeconomic dynamic optimisation model of Atlantic salmon in the Baltic Sea that encompasses five separate fisheries that all harvest the stock (including a recreational fishery). The objective of the paper is to develop a tool that fishery managers can use to provide guidelines for decision-making given the biological and economic characteristics of the stock and the fisheries harvesting it for any given period.
The model incorporates the migratory patterns of Atlantic salmon in the Baltic Sea, the stock’s age structure dynamics, reproduction uncertainty and the different economic and harvesting characteristics of five fisheries. Using the model, the authors are able to estimate optimal catch and catch allocation between the fisheries. Their results suggest that net benefits from the salmon fishery could increase substantially with a reallocation to the recreational fishery.
Dann, T. and Pascoe, S. (1994) A Bioeconomic Model of the Northern Prawn Fishery, ABARE Research Report 94.13, Canberra.
The authors develop a bioeconomic model of the northern prawn fishery, a trawl fishery, located in the northern waters of Australia. The model is able to estimate optimal fleet size and fishing effort according to an objective function and given biological, economic and management constraints. The authors test the effects on fishery profitability of previously introduced management restrictions by running the model on the basis of gear configurations before and after the restrictions were introduced. The authors also assess the impact on catch and profits of different levels of prawn harvest. It is noted that the model could be easily adopted to provide timely fishery management advice.
The reader is also referred to the following examples of bioeconomic modelling research focussed on commercial fisheries in Australia:
• Thesouthernbluefintunafishery-Kennedy(1999),Caoetal.(2001);
• Thenorthernprawnfishery-DannandPascoe(1994),ChapmanandBeare(2001);
• TheTasmanianrocklobsterfishery-CampbellandHall(1988);
• Theorangeroughy-Campbelletal.(1993);
• Thewesternrocklobsterfishery-WallaceandLindner(1998);
• TheTorresStraitprawnfishery-Reidetal.(1993).

42 Fisheries Research Contract Report [Western Australia] No. 21, 2009
Regional economic impact assessment methods
Relevant to: Regions. Output: Economic activity generated by a sector (or fishery). Usefulness: Providesanunderstandingoftheeconomiclinksofasectortoothersectorsina region/s and the distribution of economic activity. Data: Methods of modelling economic impacts can be data intensive. Multiplier analysis often uses input-output tables. Time/cost: High given data requirements although using existing models (e.g. input-output tables) can reduce cost for economic impact analysis.
What is it?
A regional economic impact estimation method includes any technique in which a model is used to understand and simplify an economy (at the local, regional, national or international level) to determine the impact that a sector (e.g. a commercial fishery) has on the economy of the region. Such approaches deal only with economic activity and not net economic benefits. Consequently, such approaches don’t provide the information necessary for making resource allocation decisions under an objective of maximising net economic benefits.
Economic impact assessment (EIA) using economic multipliers is one such technique that is commonly used to assess the economic impact of fishery sectors.
How is it done?
SuchEIAsoftenincorporatethreeclassesofimpacts.UsinganEIAforacommercialfishery;‘primary’ or ‘direct impacts’ relate to expenditures made directly by fishery participants to perform their fishing activity (such as expenditure on fuel, fishing gear, bait and other inputs). These impacts are essentially the additional economic activity that directly results from increased output in the fishing sector. This type of impact is collected directly from fishery participants via industry/sector economic surveys focused on fishery related expenditure8. ‘Indirect’ or ‘secondary impacts’ relate to additional spending by firms that produce the goods or services demanded by the fishery in question (for example, demand for bait results in expenditure by bait suppliers on packaging and so on). Finally, ‘induced’ impacts take into account the indirect effects of fishery output on household demand and income due to employment in the fishery.
To determine the magnitude of these indirect and induced impacts, input-output tables are commonly used. Input-output tables are constructed using demand data and model how economic activity in one sector of an economy or region directly and indirectly impacts economic activity in other sectors of the economy or region (Storey and Allen, 1993). From these tables, economic multipliers can be calculated that quantify the magnitude of the economic linkages or impacts. These multipliers can then be applied to the direct impact of a sector (e.g. a sector’s output) to quantify the indirect and induced economic impact of that sector in dollar terms. Such economic multiplier analysis, for example, could be used to assess how a change in a fishery’s output would impact demand, employment and income in other sectorsofaneconomyorregion(PropstandGavrilis,1987;RiechersandFedler,1996).
Benefits and limitations
EIAs do not provide guidance on how to maximise net economic benefits from the use of
8 Some studies such as Carlsen and Wood (2004) and Wood and Hughes (2006) limit their analysis to this direct expenditure component.

Fisheries Research Contract Report [Western Australia] No. 21, 2009 43
fishery resources. In this regard, EIAs and other regional economic activity based methods are distinct from the economic methods previously discussed in this report. EIAs and other regional activity methods are focused on the distributional characteristics of resource allocations rather than the net economic benefits associated with resource allocations. As a result, such methods are more aligned with the methods discussed in the social section of this report. Indeed, a fishery that has a large impact on economic activity within a region will not necessarily be associated with highneteconomicbenefits.Todemonstrate;anovercapitalisedandoverfishedfisherywouldbeassociated with relatively low net economic benefits or profitability. However, the fishery may still continue to have a relatively large impact on output, employment, income and consumption in a region given the excessive number of boats and fishers employed in the fishery.
Policy decisions that are guided by the objective of maintaining economic activity withinone region or sector are likely to be made at the expense of economic activity within another region or sector. Where this is the case, it will also be the case that the use of resources in the latter region/sector is associated with higher net economic benefits. Therefore, the objective of maintaining economic activity within a region can be inconsistent with an objective of maximising net economic benefits and can be problematic. The reader is referred to Kompas (2005, pg. 154) who uses the collapse of Canada’s Atlantic ground fisheries in the early 1990s to exemplify how policy aimed at maintaining economic activity (in particular, employment) above the point where net economic benefits are maximised can lead to ‘disastrous’ consequences. However, EIAs and other regional economic activity evaluations do have a role to play in informing objective-based policy decisions by allowing the expected impacts of policy changes on economic activity to be managed and accounted for.
Use of economic multipliers derived from input-output tables can be associated with a number of limitations. First of all, creating an input-output table is quite costly. Consequently, most EIA studies focused on fisheries use pre-existing input-output tables. This, however, may not be an option for regional areas where relevant data is not readily available. The use of pre-existing tables can also be problematic given that the economic relationships depicted in such tables canchangeconsiderablywithtime(BRS2005).Additionally,asnotedbyPropstandGavrilis(1987), multipliers derived from a pre-existing input-output table will only be as good as the data thatwasusedduringconstruction.PropstandGavrilis (1987)alsodescribemultipliersas having a ‘deceptive simplicity’, given that multipliers are a simple number that describe complex interactions within an economy. Similarly, the authors describe multipliers as being an average of averages, which may exhibit variation between regions, sectors and cases. They therefore recommend that studies should present EIA findings together with structural analyses of the economy, short- and long-term forecasts of changes to impacts, comparative analyses as well as feasibility and sensitivity analyses. Overall, the authors recommend caution when using these multipliers to draw conclusions or make management decisions.
Additional approaches
Other approaches to analysing regional economic impacts include integrated modelling through complex econometric based regional models and computable general equilibrium modelling using broader and more complex economy-wide models. However, both types of models require a significant amount of data and expertise and are therefore costly and time consuming to create. Therefore, while a pre-existing integrated or general equilibrium model can provide low-cost, yet useful insights into the economic impacts of a change in fishing activity or management, the cost of constructing such a model would outweigh the benefits of doing so in most cases. As a result, these two types of model are not discussed here.
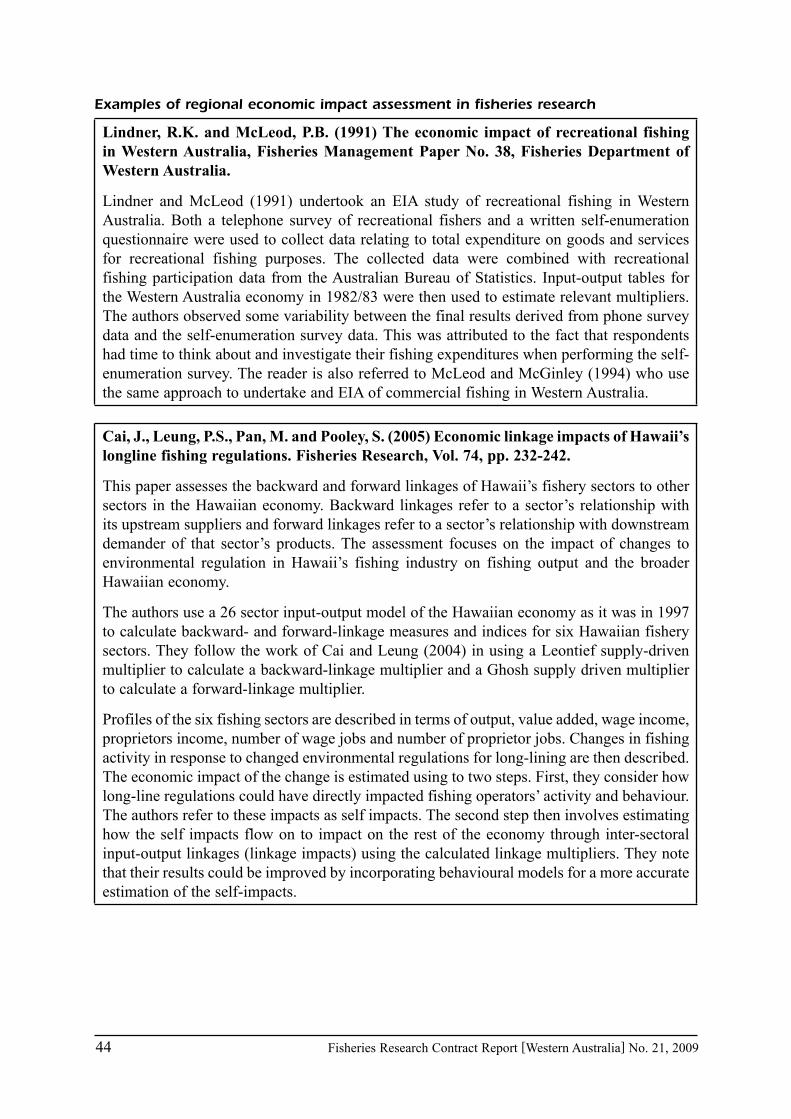
44 Fisheries Research Contract Report [Western Australia] No. 21, 2009
Examples of regional economic impact assessment in fisheries research
Lindner, R.K. and McLeod, P.B. (1991) The economic impact of recreational fishing in Western Australia, Fisheries Management Paper No. 38, Fisheries Department of Western Australia.
Lindner and McLeod (1991) undertook an EIA study of recreational fishing in Western Australia. Both a telephone survey of recreational fishers and a written self-enumeration questionnaire were used to collect data relating to total expenditure on goods and services for recreational fishing purposes. The collected data were combined with recreational fishing participation data from the Australian Bureau of Statistics. Input-output tables for the Western Australia economy in 1982/83 were then used to estimate relevant multipliers. The authors observed some variability between the final results derived from phone survey data and the self-enumeration survey data. This was attributed to the fact that respondents had time to think about and investigate their fishing expenditures when performing the self-enumerationsurvey.ThereaderisalsoreferredtoMcLeodandMcGinley(1994)whousethe same approach to undertake and EIA of commercial fishing in Western Australia.
Cai, J., Leung, P.S., Pan, M. and Pooley, S. (2005) Economic linkage impacts of Hawaii’s longline fishing regulations. Fisheries Research, Vol. 74, pp. 232-242.
This paper assesses the backward and forward linkages of Hawaii’s fishery sectors to other sectors in the Hawaiian economy. Backward linkages refer to a sector’s relationship with its upstream suppliers and forward linkages refer to a sector’s relationship with downstream demander of that sector’s products. The assessment focuses on the impact of changes to environmental regulation in Hawaii’s fishing industry on fishing output and the broader Hawaiian economy.
The authors use a 26 sector input-output model of the Hawaiian economy as it was in 1997 to calculate backward- and forward-linkage measures and indices for six Hawaiian fishery sectors. They follow the work of Cai and Leung (2004) in using a Leontief supply-driven multipliertocalculateabackward-linkagemultiplierandaGhoshsupplydrivenmultiplierto calculate a forward-linkage multiplier.
Profilesofthesixfishingsectorsaredescribedintermsofoutput,valueadded,wageincome,proprietors income, number of wage jobs and number of proprietor jobs. Changes in fishing activity in response to changed environmental regulations for long-lining are then described. The economic impact of the change is estimated using to two steps. First, they consider how long-line regulations could have directly impacted fishing operators’ activity and behaviour. The authors refer to these impacts as self impacts. The second step then involves estimating how the self impacts flow on to impact on the rest of the economy through inter-sectoral input-output linkages (linkage impacts) using the calculated linkage multipliers. They note that their results could be improved by incorporating behavioural models for a more accurate estimation of the self-impacts.

Fisheries Research Contract Report [Western Australia] No. 21, 2009 45
4.0 Social evaluation methods
4.1 Introduction
Social science evaluation methods can be used to examine a variety of social dimensions of fishing. Such evaluations, for example, may identify how different stakeholders are dependent on or linked to a resource in terms of a wide range of factors including people’s way of life (how they live, work and interact with each other), their culture (their norms and traditions), their community (institutions and structures) and their values, attitudes and beliefs (Coakes, 1999).
The information generated through social science studies can provide fisheries managers with a better understanding of who has an interest in a fishery and how they interact with, understand, depend on and/or value that fishery. Social evaluations have become particularly relevant to fishery management given the increased demands from stakeholder groups to have a role in the decision making process (Coakes, 1999).
A brief background on social science approaches, their methods and limitations is shown in this section, followed by a description of different approaches to social evaluations, focusing on three levels:
• Conceptualframeworkscommonlyusedforsocialevaluation;
• Typesofinformationoftencollected,andhowtheyaretypicallycollectedandanalysed;and
• Examplesof theuseofdifferentdata collectionandanalysismethods inprevious socialevaluation studies in the fisheries sector.
It should be noted that while the evaluations and methods outlined here allow collection of social information that can inform fishery management, social information and evaluation needs are difficult to identify without predefined social policy objectives for fisheries management. Similarly, having predefined objectives will enhance the ability of policy makers to use social information to guide rather than inform fishery policy making.
4.2 Background
Social science is, broadly speaking, the study of human groups and individuals, social systems, social institutions and social behaviour. It can be defined as ‘the branch of science that studies society and the relationships of individuals within a society.’9
Within this broad definition, social sciences are commonly broken down into a multitude of different fields, including economics, geography, history, political science, psychology, social studies, and sociology.
Social science research may involve any one of a wide range of data collection and analysis methods, including (but not limited to):
• Qualitativeanalysisofprimarydatae.g.usinginterviews,focusgroupsorsurveystocollectdata directly from individuals and groups. Data are typically presented using description, ratherthannumericalanalysis;
9 URL: http:// http://wordnet.princeton.edu/perl/webwn?s=social%20science Accessed 21/02/2008

46 Fisheries Research Contract Report [Western Australia] No. 21, 2009
• Qualitative analysis of secondary data, e.g. analysing historical records and accounts toexaminethehistoryandcultureofanareaoranindustry;
• Qualitative and quantitative surveys of particular groups, usingmail, phone, internet orface-to-face surveys. Quantitative data is typically presented using numerical analyses of howmanypeoplehaveparticularcharacteristics;
• QuantitativeandqualitativeanalysisofstatisticaldatafromsourcessuchastheAustralianBureauofStatistics;and
• Quantitativemodellingwhichattemptstorepresentsomeaspectofhumansocietyanditsbehaviour.
In recent years, social science techniques have shifted to incorporate more participatory techniques in which a range of methods are used to improve public participation in decision makingorresearch.Participatorytechniquesmayincludepublicmeetings,askingforwrittensubmissions and developing community consultative or advisory groups. Such techniques differ from other social science methods as data collection and analysis as well as final decision-making processes are influenced by a wider range of people and not controlled solely by the researcher or decision maker.
Social science data can help marine resource managers better understand how individuals and groups are responding to their management activities, what the impacts of their actions are on different groups, and how different people perceive issues related to marine resources. The use of social science data by marine resource managers, therefore, has the potential to improve marine resource management. Understanding more about how different people and groups perceive, behave and interact in particular situations, and how they are likely to respond to changes, has clear benefits for decision makers. This understanding may allow the identification of the likely outcomes of the implementation of new forms of management and policy. In the fisheries context, social sciences can assist decision makers in many situations, for example:
• Monitoring perceptions of fisheries related issues can help fisheries managers identify how values regarding marine resources are changing over time. Such perceptions can have implications for the acceptability of fisheries management approaches, people’s understandings of marine related issues, potential strategies to influence perceptions and the effectiveness of such strategies.
• Studyinghowpeopleuse marine resources and the factors influencing their behaviour can help decision makers identify the effectiveness as well as any unforeseen perverse effects of management strategies. In addition, knowledge of the use of marine resources may assist the design of management strategies for which human behaviour must be considered. For example, studies of the ways people respond to closure of a fishing area can help identify the different behaviours that will occur. Some people may choose to concentratefishinginanalternativearea;othersmayreducetheirfishingactivities;stillothers may choose to fish illegally.
• Studying thesocial impacts of change in fisheries management on the lives of different stakeholders can help managers identify improved strategies for maximising positive and minimising negative impacts.
There has been increasing interest in the use of social science data to inform fisheries management in recent years (see Townsley 1998, Kaplan and McCay 2004). The use of social
Fisheries Research Contract Report [Western Australia] No. 21, 2009 47
impact assessment (SIA) has, in particular, gained considerable attention. SIA uses a wide range of social science methods and tools, and can include all of the methods discussed in this document. The development of guidelines for SIA of fisheries management actions in the US by the National Marine Fisheries Service (NMFS) has been particularly influential in establishing SIA as a key part of fisheries policy and management (NMFS, 2001).
There are many challenges to achieving productive and useable outcomes from use of social science data. Key limitations that must be acknowledged include:
• Socialsystemsarenotstatic,unchangingentities.Peoplelearnfromexperience,andchangehow they respond to situations as a result of this learning. This means that people may not respond to a situation such as closure of a fishery in the same way over time – having learned from experience with one closure, they may behave differently when another closure occurs. Behaviour and responses will be influenced by many factors, including many that are exogenous to (not influenced by) fishery managers and decision makers. For example, if social values shift to make fishing a less socially acceptable activity, closure of an area to fishing may lead to a reduction in overall fishing effort. Alternatively, if recreational fishing is increasing in popularity, large increases in fishing effort in ‘open’ areas may occur in response to the closure of another area. The dynamic nature of human behaviour and response means that it is only possible to predict how people will respond to a limited extent.
• Demonstratingcausalrelationshipsisverydifficult(and,manyargue,impossible)insocialscience as a result of the complexity of human behaviour and relationships. This complexity can create very practical difficulties when trying to undertake activities such as social impact assessment, as it can be difficult to identify the extent to which a fisheries management decision impacted someone versus the multiple other changes that were influencing the person at the same time. For example, if a fishing business loses 30% of turnover after new types of management controls were introduced, was this a result of the controls, or of other factorssuchasmarketchanges,orchangesinhowthefishermanagedtheirbusiness?
• Oversimplifyingsocialrelationshipsandinteractionscanleadtopoorrecommendations.It can be tempting to respond to the complexity of social life through oversimplification. For example, modelling the interaction of only one or two social variables can lead to the production of models that are not particularly useful in informing real-life decisions. Caution is needed when considering the use of modelling or examination of only limited variables, particularly when trying to understand human behaviour and the impacts of management decisions.
• Socialsciencecanbeusedtoidentifythedifferentvalues,moralsandethicspeoplebelieveare appropriate with regard to marine resources. It cannot, however, provide a way of choosing which values, morals or ethics are ‘right’ – it is not a substitute or ‘way out’ of making these challenging decisions.
• Goodsocialsciencedatacanbeexpensivetogenerate.Inadequateinvestmentleadstopoorresults – for example, a poorly designed survey is unlikely to generate useful information. It is better to carefully choose a few areas to examine well, rather than spreading resources too widely and achieving meaningless results.
Recognising these important limitations can lead to a more realistic assessment of the potential for social science data to contribute to fisheries management. Social science cannot make decisions for managers that relate to values and ethics, but can usefully inform about the perceptions of different groups relating to particular values and ethics. It cannot definitively

48 Fisheries Research Contract Report [Western Australia] No. 21, 2009
predict behaviour, but can provide a guide to some typical ways different groups may respond to a particular situation. It cannot provide causal explanations of impact but can identify the possible ways a particular management decision will impact different people.
4.3 Conceptual frameworks used for social science studies
Two conceptual frameworks are often used in social studies of the fisheries sector: ‘social assessment’, and ‘social impact assessment’10. These frameworks are different approaches to understanding the social dimensions of fishing and can involve the use of multiple approaches to data collection and analysis. Each technique is briefly described below, with a focus on what the approach is and the types of information that might be collected as part of it.
Social assessment
A social assessment (SA) can be defined as an assessment or ‘snapshot’ of the social characteristics and relationships relevant to a given sector or activity (such as fishing), at a particular point in time. Undertaking a SA normally requires that the researcher first identifies and defines those stakeholder groups that have links to a given fishery or marine resource, through having some form of dependence on the resource, influence over it, or an interest in it. Then the researcher assesses and describes the social characteristics of some or all of these stakeholder groups, how these characteristics are impacted on or dependent on a given activity, and how these social characteristics influence the social wellbeing of stakeholders.
Schirmer and Casey (2005) provide an in-depth guide to performing SAs specifically for fisheries. As such, their recommended approach to undertaking a SA of a fishery is summarised below.
As identified by Schirmer and Casey (2005), the first key step to performing a social assessment is the planning phase during which the goals and scope of the assessment are set. Unlike in economic evaluations, where there is generally one key focus of an evaluation (net economic benefit or economic efficiency), social evaluations assume that the notion of social welfare or wellbeing cannot be expressed with one aggregate measure. Rather, it can encompass a wide range of factors that contribute to the social wellbeing of stakeholder groups and communities.
GiventhataSAmayencompassawiderangeoffactors,itfollowsthatthefirststageofaSAis to define the scope and objectives of the particular issue, in order to identify the focus of data collection and analysis. The definition of scope must also take into account time and funding constraints. Once defined, the scope of the assessment will determine how relevant stakeholder groups will be identified, what social characteristics will be focussed on, the data needs of the assessment, the data collection methods to be used and finally the type of data analysis methods to be used (Schirmer and Casey, 2005).
There are some key issues that need to be addressed following the planning phase. The first issue involves the question of who should be undertaking a given SA. The answer largely depends on the methods that are being used and the budget and funding constraints of the project. If specialised methods are being used then specialised and experienced researchers are likely to be required (Schirmer and Casey, 2005).
10 The term social assessment may also be used to refer to SIA, but, as dealt with by Schirmer and Casey (2005), is not done so here.

Fisheries Research Contract Report [Western Australia] No. 21, 2009 49
The level of stakeholder participation in a social assessment is another key issue that may have a significant influence on the accuracy and reliability of a SA results. Increased stakeholder participation in many cases will improve the results of a SA. However, increased stakeholder participation will generally require a greater amount of funding and time. Stakeholder participation can occur during the initial planning phase through establishment of stakeholder advisory groups to guide the research the data collection phase. This guidance is achieved through the involvement of stakeholders in collecting and analysing data and following the completion of the SA through the presentation of results (Schirmer and Casey, 2005).
As discussed above, a SA may focus on assessing the relationships of a number of stakeholder groups to a given fishery or marine resource. Box 2 indicates the range of stakeholders that a SA may focus on (Schirmer and Casey, 2005).
Box 2. Data that can be used to identify who should be assessed in a social assessment. Taken from Schirmer and Casey (2005).
Commercial fishers• Licencedata• Fishreceivers• Surveysofknownfishers(toidentifyunknownfishers)
Recreational fishers• Licencedata• Observingorinterceptingatrecreationalfishinglocations• Randomsurveyofgeneralpopulation
Fishing related businesses• Directories(suchastelephonedirectories)• Surveysoffishersandknownfishingrelatedbusinesses• Observation
Communities where fishing occurs• Surveysoffishers• Fisherylicence,catchandeffortdata• Geographicalproximitytoareaswhereactivityisidentifiedtooccur
For each stakeholder group, a range of information may be required, again depending on the goals and objectives of the SA. Schirmer and Casey (2005) identify six key types of social data that a fishery SA is likely to focus on. These include:
• Historyofrelationshiptofishing;
• Socialprofiles;
• Qualityoflife;
• Socialcapital;
• Values,attitudesandbeliefs;and
• Spatialdata.

50 Fisheries Research Contract Report [Western Australia] No. 21, 2009
Social impact assessment
Social impact assessments (SIA) aim to assess the likely impact of a proposed change to a practice, policy or program, such as proposed changes to fisheries management regulations or declaration of aMarine ProtectedAreas, on the welfare of different stakeholders.Asdefined by Schirmer and Casey (2005, p. 45), SIAs of fisheries can ‘identify which fishing communities would potentially be impacted by [a] proposed change and the types of impact’, ‘develop scenarios of potential impact’, ‘analyse the costs and benefits of the proposed change’ and be used ‘to develop mitigation strategies that address negative impacts predicted in the different scenarios’.
The broad range of issues that can be covered in a SIA means that it is difficult to describe a framework or guide for the performance of SIA (Fenton et. al., 2001). Ideally, SIA should be undertaken as part of informing and assisting the design of a planned intervention, rather than ‘after the fact’ when the planned policy or program has already been implemented. Yet, in reality, SIA is often undertaken in circumstances where it plays a lesser role in determining the nature of the planned change.
SIA is commonly conceptualised as involving the following stages, each of which may utilise a wide range of approaches to involving stakeholders and collecting and analysing data (Coakes 1999, Vanclay 2003):
• Scopingtheissue,whichcommonlyinvolves:
- IdentifyinginterestedandaffectedstakeholdersandinvolvingthemintheSIA;
- Documentingandanalysingthelocalcontextandtheplannedintervention;
• Collectingbaselinedataonsocialcharacteristicsofkeygroupsandcommunities(similartosocial assessment), which can be used as a basis for predicting and assessing impacts. This mayincludeunderstandinglocalculturesandvalues;
• Scopingthepotentialimpactsofthechange,includingbothdirectandindirect/cumulativeimpacts(ICGSIA,1994);
• Evaluatingandrefiningalternativestothechange(oftenincludinga‘nodevelopment’option);
• Developingapproachestomitigateimpacts;
• Monitoringimpactsofthechangeasitisimplementedandfurtherdevelopingstrategiestomitigate impacts.
Taylor et al. (2003) points out that the impact prediction stage will always be based on a theoretical framework that may be explicitly defined in some cases or implicitly assumed in others. A theoretical framework is a set of ideas or assumptions that are drawn upon by the researcher to make predictions about how an impact will occur and how stakeholders will respond to it. Becker (2003, pg. 130) also discuss the use of theories to predict the future behaviour of individual stakeholders. They state that such theories should incorporate the following information:
(a)thepastbehaviourofactors(individuals);
(b)theirpreferences;
(c)theirresources;
(d)theconstraintsthatconfrontthem;

Fisheries Research Contract Report [Western Australia] No. 21, 2009 51
(e)theoptionstheyhavefortheirbehaviour;and
(f) their future behaviour.
Yet, such factors will also be affected by social processes (Van Schooten et al., 2003). Impact prediction, therefore, also requires an understanding of potentially relevant and important social processes. Examples of social processes are listed in Box 4. Both Taylor et al. (2003) and Baines et al. (2003) point out that comparative case study material may also assist with the formation of a theoretical framework and the prediction of impacts.
Box 3. Potential social impacts that should be considered when performing SIAs. Adapted from Van Schooten et. al. (2003).
Health and social wellbeing
Death, nutrition, actual physical health, perceived health, aspirations, autonomy.
Quality of the living environment
Leisure and recreation opportunities and facilities, environmental amenity value/aesthetic quality, adequacy of physical infrastructure, adequacy of social infrastructure, personal safety, crime and violence.
Economic impacts and material well-being
Workload, standard of living, economic prosperity and resilience, income, asset values, employment, replacement costs of environmental functions, economic dependency and burden of national debt.
Cultural impacts
Change in cultural values, cultural integrity, experience of being culturally marginalised, natural and cultural heritage.
Family and community impacts
Alterations in family structure, obligations to family members, social networks, community identification and connection, community cohesion, social differentiation and inequity and social tension and violence.
Institutional, legal, political and equity impacts
Functioning of government agencies, integrity of government, tenure of legal rights, subsidiarity, human rights, participation in decision-making, access to legal procedures and to legal advice and impact equity.
Gender relations
Personal autonomy of women, gendered division of production-oriented labour, gender-based control over, and access to, resources.

52 Fisheries Research Contract Report [Western Australia] No. 21, 2009
Box 4. Categories of social change processes and examples. Taken from Van Schooten et al. (2003).
Demographic processes
Processesrelatedtonaturalbirthanddeathrate,in-migration,out-migration,resettlement,displacement/dispossession, rural to urban migration and urban to rural migration.
Economic processes
Waged labour, conversion and diversification of economic activities, impoverishment, inflation, currency exchange fluctuation (devaluation), concentration of economic activity and economic globalisation.
Geographic processes
Conversion and diversification of land use, urban sprawl, urbanisation, gentrification, enhanced transport and rural accessibility and physical splintering.
Institutional and legal processes
Institutional globalisation and centralisation, decentralisation and privatisation.
Emancipatory and empowerment processes
Democratisation, marginalisation and exclusion and capacity building.
Socio-cultural processes
Social globalisation, segregation, social disintegration, cultural differentiation and deviant social behaviour.
What has been provided here is a general outline of the stages of a SIA. More often than not, the methods used in a SIA, will be determined by and similar to what is used in the initial SA stage of the SIA. The difference is that rather than taking a snapshot of current social characteristics as occurs in a SA, the results derived from the SA are used to forecast the potential impacts of likely changes to current settings. One particular technique commonly used in SIA to forecast impacts is scenario planning.
Scenario planning involves the prediction of how different scenarios will impact on stakeholders, communities and regions. This approach to SIA requires that the researcher identify all possible scenarios and then provide a narration for each possible scenario including itslikelyimpactsandpotentialmitigationandmanagementresponses.Participatoryprocessesare often used in scenario planning, with scenarios workshopped with stakeholders who can identify likely impacts, mitigation and management strategies. O’Brien (2002) provides an excellent overview of scenario planning and identifies a number of central steps to such planning techniques. These include:
• definingafocalissueorquestion;
• assessingthepre-determinedandlesscertainelementsofthefuture;
• creatingasetofscenarioswhichareplausible,coherentpicturesofapossiblefuture;and
• developingnarrativesfromthepresenttothosepossiblefutures(O’Brien,2002,pp.1-2).
Through the thorough identification of different potential scenarios, the full range of potential impacts (social or other) that might eventuate as a result of a policy change can be explored.

Fisheries Research Contract Report [Western Australia] No. 21, 2009 53
4.4 Types of data commonly collected and analysed
As discussed previously, a wide range of data may be collected and analysed as part of social evaluations, whether they take the form of a SA or SIA, or any other type of social research. Table 1 summarises types of data commonly collected, and the range of methods often used tocollectthesedata;thefollowingsectionthendescribeseachmethodinmoredetail.Table2 highlights key information needs identified in a recent workshop in Western Australia on ecologically based fisheries management, and methods/resources used in social science to respond to each.

54 Fisheries Research Contract Report [Western Australia] No. 21, 2009
Table 1. Information needs and data collection methods.
Type of data/information Data collection methods
‘Profiling’ stakeholder groups or communitiesThis refers to developing a contextual understanding of key groups or communities using both qualitative and quantitative data. It may take the form of a qualitative description or quantitative statistics (see below) or a combination of both, or development of a comprehensive history of fishing in a region11.
Document & media analysisQualitative interviewsGroup interactionsQuantitative surveysSocio-demographic statistics
Indicators (statistical profile of groups/communities)A more specific type of profiling, this involves using statistical data to identify key attributes of a particular social group or community. Social indicators are essentially any measurable quantitative variable that can be linked to the condition of some social factor or characteristic (Fredline et al., 2006). Schirmer and Casey (2005, pp 22-23) suggest the following may be useful social indicators for fishing communities: education level; years participating in fishing; generations of family involved in fishing; fishing methods/licences held/equipment; length of residence in current hometown; household spending profile; ethnic characteristics; number participating in relevant fishing sector; number of people dependent on those employed or participating; median age; gender; income. A different range of data may be useful for profiling communities dependent on fishing.
Socio-demographic statistics such as ABS, previous surveysQuantitative surveys
Values, attitudes & beliefsIt is often essential to understand how different people and groups perceive, value and understand a particular issue (e.g. acceptability of use of particular marine resources)
Qualitative interviewsGroup interactionsQuantitative surveys
Quality of lifeQuality of life is a broad term taken to represent overall wellbeing and can include physical, mental, social, economic and spiritual wellbeing (Schirmer and Casey, 2005). It can be measured in terms of an individual subject’s own perception of their wellbeing, or via assumed indicators of quality of life, although caution is needed when using the latter. Aspects of quality of life may include overall life satisfaction; work satisfaction; fishing activity satisfaction; physical and mental health; and community life/social capital.
Qualitative interviewsGroup interactionsQuantitative surveysSocio-demographic statistics
Social capitalGrafton (2005, p. 754) defines social capital as ‘an all-encompassing term for the norms and the social networks that facilitate co-operation among individuals and between groups of individuals’. Social capital often focuses on understanding trust and trust-worthiness, civic engagement and co-operation, and social networks. High social capital may reduce fisheries monitoring costs, improve decision-making and assist adaptive capacity of fishers (Grafton, 2005)12.
Qualitative interviewsGroup interactionsQuantitative surveys
Geographic and spatial information e.g. dependence on resourceMethods such as Town Resource Cluster analysis, or GIS analyses, are used to identify the spatial linkages between human communities and the resources they depend on.
Quantitative surveysSocio-demographic statistics
11 For an example of how historical information can be used in fisheries studies, see Sepez et al. (2005) and Norman et al. (2006) who collect and presenthistoricalinformationfornumerousAlaskanfishingcommunitieslinkedtoNorthPacificfisheriesandUSAcommunitieslinkedtoWestCoastandNorthPacificfisheriesrespectively.Foreachofthefishingcommunitiesprofiledanindepthoverviewisprovidedofvariousaspectsofthe historical development of the relevant fishing communities. Topics covered include early settlement, historical prevalence of indigenous popula-tions, immigration from other countries and the development of alternative key industries. The historical development of fisheries in terms of boat numbers, species caught and methods used are also discussed. Other examples of SAs where historical information are used include Brooks et al. (2001) who assess the social contributions of charter fishing to St Helens in Tasmania and Coakes et al. (2001) who provide a brief account of the historical development of commercial fishing in Lakes Entrance in Victoria.
12 Social capital is a relatively new idea and area of research. As a result, the concept’s definition and methods of measurement are still beingdeveloped.ForfurtherdetailonsocialcapitalthereaderisreferredtoGlaeseretal.(2000)whodealwiththemeasurementoftrust, Sobel (2002) who looks at the definition of social capital and looks back on previous work done and Knack and Keefer (1997) and TempleandJohnson(1998)bothofwhichlookattheeconomicbenefitsofsocialcapital.WorkbyGrafton(2005)andPaldam(2000)aregoodsourcesofdetailedinformationonsocialcapital,itsdefinition,benefitsandmeasurement.SchirmerandPickworth(2005)useda series of measures of social capital to study the South Australian Marine Scalefish Fishery, providing an application of social capital measurement in the fishing sector.

Fisheries Research Contract Report [Western Australia] No. 21, 2009 55
Table 2. Information needs of fisheries stakeholders identified in EBFM workshop, 2-3 July 2008, WA.
Question/ Issue raised Methods used, resources required and comments on effective ways of addressing issues
What does the community want (in terms of their values and objectives) from marine resources? For example, does the community hold the same values for imported seafood as domestically sourced seafood? What are the expectations of recreational fishers? How do different parts of the community and regions differ? What do key stakeholders want and expect from the government?
Methods: Qualitative data collection; interviews and focus groups; surveys. Commonly qualitative interviews/focus groups used initially to provide context/background for quantitative survey design.
Key issues: Often there is no opportunity to repeat surveys over time, and people’s values and perceptions do shift over time. Always ensure experts are used to design and deliver surveys. Further information: See sections on different methods.
What are the factors that influence the community’s objectives and goals? This issue links into communication and extension area).
In depth qualitative surveys can be used to uncover actual objectives and ideas. Cheaper to undertake qualitative survey and then input into a quantitative survey. Can only unpack the issue to a limited extent.
How do you trade off between different targets/goals? Environment, social, cultural and economic.
What are the values of trade-offs? Can rank with comparative trade-offs. Difficult to rank if using both qualitative and quantitative information, although Bayesian approaches being used address this to some extent e.g. Coastal Land and Assessment Management (CLAM) Tool. Other tools that can be used are citizen’s juries, where people are presented with the relevant information by experts. Conflict resolution techniques and processes may be more needed here than specific social research (e.g. alternative dispute resolution); social science role in addressing conflict is to provide data needed to help resolve disputes.
What are acceptable decision-making processes?
Follow decision-making process and then use focus groups and interviews with participants to go through their experience from process to understand if process is acceptable. Much research needed to understand what role media plays in influencing decisions – results have shown mixed outcomes.Many statistical techniques available.Can use socio-demographic surveys to identify whether different views reflect different backgrounds.
What is the level of family engagement and dependency on fishing?
Undertake survey of fishers, commercial or recreational. Different sectors likely to be dependent in different ways. Survey may be cheaper if good licence (recreational or commercial) records available, as fishers are easily identifiable.
What is the non-extractive value of ‘fish’ and marine resources (and how does it fit into the EBFM framework)?
Qualitative or quantitative methods available – similar to those used to identify how different people value and perceive fishing.
Impact of change (tourism and development) in regional communities)?
More difficult to gauge. A range of methods – e.g. ABS statistics. See section on Social Impact Assessment in this document. Note that people’s perceptions of impacts are as important as the impacts, as perceptions drive how a person responds to a change, and hence the actual impact.

56 Fisheries Research Contract Report [Western Australia] No. 21, 2009
Question/ Issue raised Methods used, resources required and comments on effective ways of addressing issues
Key factors that enable a community to adapt to change (adaptive capacity).
A range of social science studies are currently being undertaken examining how best to measure adaptive capacity; a wide range of qualitative and quantitative methods are being used.
How dependent are communities on recreational fishers?
To answer this question, it is necessary to define what is meant by dependence and then design the best way to measure it, e.g. via qualitative or quantitative surveys. Include direct and indirect effects; economic input output studies are sometimes used. Be aware that dependence may vary seasonally.
What is the value of education/ enforcement/other approaches to change behaviour or comply with rules?
A range of research can be designed to answer this question. Different approaches can be used e.g. scenarios/role playing to identify how people respond to different cues; potential for secondary analysis using data on compliance; or for use of surveys.
How will fishers respond to management change?
See section on Social Impact Assessment in this document.
What are the benefits and costs of shifting to aquaculture for the commercial fishing sector?
See sections on Social Assessment and Social Impact Assessment in this document.
What are the most effective communication or extension strategies to maximise take-up of change?
A wide range of evaluation methods are used, and can incorporate use of documentary analysis, qualitative interviews, group interactions or surveys. See sections on each of these methods in this document for further information.
Cultural objectives and Indigenous uses of fishing resources.
Anthropological methods such as participant observation and meaningful community consultative and participatory methods are needed to adequately consult and work with Indigenous communities. Traditional social science data collection methods such as surveys are often inappropriate.
What is the cultural, heritage and intrinsic value of a local fishing industry? Access to fresh local produce and fishing ports.
A wide range of social science methods can be used to identify this, including documentary analysis, qualitative interviews, group interactions or surveys. See sections on each of these methods in this document for further information.
What are the existing social objectives of management of the different sectors (within both the commercial and recreational sectors).
A range of methods can be used to uncover these, including consultative processes through to formal surveys.
Understanding external influences. This refers to understanding how external influences such as changes in petrol prices or influx of ‘seachangers’ to coastal communities are influencing fishing. This is perhaps easiest to study by surveying fishers to ask them how external influences are impacting them; this can then provide data enabling monitoring of the external influences as an indicator of fisher wellbeing, as the study of fishers will have identified links between changes in external influences and impacts on fishers.
How to enhance consultation mechanisms?
A range of information is available on appropriate consultative approaches; these should be consulted and staff well trained.

Fisheries Research Contract Report [Western Australia] No. 21, 2009 57
Question/ Issue raised Methods used, resources required and comments on effective ways of addressing issues
What is the impact of different pressures on behaviour?
Well designed quantitative surveys and qualitative interviews can explore this issue. See relevant sections on social science methods for more information.
What is the spatial/temporal scale to be used?
This varies by situation and can only be identified in the context of a particular fisheries problem.
How do we get timely and effective information in place for management decisions?
Clear policies are needed which identify likely management information needs early enough to ensure data can be gathered and made available, and that regular monitoring of social issues is put in place where ongoing data are likely to be needed.
How can social science data be used in decision-making?
Social science research must be accompanied by clear policies identifying the goals and objectives of policy and other decision makers, which can provide strategic direction for the interpretation and use of social science data.
4.5 Examples of different methods used in social evaluation of fisheries
As described above, a number of different social science methods may be used as part of anysocialassessmentorsocial impactassessment;anddataonagivensocialdimensionofa fishery can often be gathered and analysed using a range of methods. For example, ‘social impact assessment’ can variously involve conducting interviews, focus groups, reviewing media articles, analysing statistics, or surveying a population. While variants of ‘social assessment’ and ‘social impact assessment’ are often used in fisheries-related social science, they form part of a family of social science methods, all of which may be useful.
Therefore, rather than use the ‘SA’ or ‘SIA’ label, this section investigates the usefulness of each data-gathering method typically used in social science separately. When each is discussed, its potential usefulness for gathering data to inform achieving each objective/management need is described.
This section provides an overview of a number of different data collection methods and how they can be used in social science studies in the fishing sector, focusing on:
• Mediaanalysis;
• Documentanalysis;
• Qualitativeinterviews;
• Groupinteractions(focusgroups,workshops);
• Quantitativesamplesurveys;
• Demographicandotherstatistics(secondaryquantitativedata);
• Modellinganddecisionsupportsystems;
• Mixed method studies, giving examples of combining methods to obtain an in-depth;understanding of particular social issues or characteristics.
For each data type, an explanation is provided of its importance, how it can be used, its advantages and disadvantages and what methods are normally used to collect relevant data and analyse the

58 Fisheries Research Contract Report [Western Australia] No. 21, 2009
collected data. At least one example from the literature relevant to fisheries is then provided for each data type that demonstrates how the methods can be used in a fisheries context.
Media analysis
Relevant to: Those with an interest in how fisheries issues are discussed in the media. Output: Document and understand perceptions and values as reported in the media, and how they may have changed. Usefulness: Allows comparisons of media representations with the views of people expressed through other mechanisms such as surveys. Data: Various media reports. Time/cost: Relatively low.
Media analysis is a useful method for identifying publicly reported perceptions about marine resource management, and for documenting changes in public concerns and perceptions. It is generally used in conjunction with the collection of other social data, to enable comparison of media representations with the views of people expressed through mechanisms such as surveys.
What is it?
Media analysis refers to analysing media articles to identify how their reporting of particular issues changes over time. Media analysis is often used to better understand how the media has influenced public perceptions over time and to document the changing values regarding particular issues. Some argue this can assist the prediction of the likely public perceptions about an issue, as the media is believed to have an important influence on public perceptions, although the extent of influence is sometimes debated. Others argue that changes in the media are likely to reflect substantive shifts in public perceptions. In reality, it is likely that media reports influence public perceptions and that public perceptions play a role in influencing what is reported in the media.
How is it done?
Media analysis ranges from qualitative documentation of the content of articles to quantitative analysis of the number of times a particular perspective or view has been reported over a period of time.
Planning and costing
Media analysis can be relatively low cost. When planning, it is essential to identify two factors:
• Which media sources are most relevant and how accessible these are. Can articles beaccessed in electronic format, enabling easy search for key words, or would a hard copy havetobescanned(resultinginmuchhighercost);and
• Purposeoftheanalysis.Isaqualitativeunderstandingofmediarepresentationrequired,oraquantitative documentation of the number of times reports reflecting a particular perspective occur?Thecostofstafftimetoanalysereportswilldependontheissuesbeingexamined.

Fisheries Research Contract Report [Western Australia] No. 21, 2009 59
Benefits and limitations
Media analysis is a useful way of understanding publicly communicated messages about marine resources. It gives some indication of public perceptions about issues, can be undertaken relatively quickly, and is reasonably low cost.
Caution is needed, however, in interpreting media analysis. In particular:
• Mediareportsareofteninfluencedbyparticularformsofbiasthatneedtobeunderstoodandexaminedaspartoftheanalysis;
• Notalleventsorperceptionsarereportedinthemedia,andmediareportsaloneshouldnotbe relied on to document history of particular events. The limitations of media coverage of issues must be understood when studying how the media have represented a particular issue;
• Thelinksbetweenpublicperceptionsandmediareportsarestronglydebated.Whilemostagree there is a link, the nature and direction of the link is not agreed.
Examples of media analysis in fisheries research
Compas, E., Clarke, B., Cutler, C. and Daish, K. (2007) Murky Water: Media Reporting of Marine Protected Areas in South Australia. Marine Policy. Vol. 31, pp. 691-697.
The research and findings presented in this paper are based on an analysis of the media coverage on the development of the Encounter Marine ProtectedArea (MPA) in SouthAustralia. The research is based on the assumption that the media has a significant role in educating the public about environmental policy and management so as to assist them to participate in pubic consultation.
Qualitative and quantitative analysis of five newspapers was undertaken. The newspapers were selected due to their close proximity to the case study site. Keywords were used to find articles related to the topic, which were analysed to assess the date of publication, opinion stated(i.e.fororagainsttheMPA),andthethemescommunicatedinthearticle.
The findings conclude that the media is more interested in portraying contested opinions than providing facts on the policy process or marine ecology. These results suggest that the media may hamper the policy formation process by their failure to provide the information requiredforthepublictoprovidefeedbackonthedraftMPAzoningproposal.

60 Fisheries Research Contract Report [Western Australia] No. 21, 2009
Sullivan, K.M. (1999) Fishing in the Media: Mainstream Print News and the Commercial Fishing Industry in Texas. Culture & Agriculture. Vol. 21, No. 3, pp. 31-43.
This paper presents the results of ethnographic fieldwork focussing on analysis of two newspapers to investigate the media’s portrayal of commercial fisheries harvesters in the Galveston Bay area, Texas. The researchwas based on the idea that themedia plays animportant role in influencing public perception of, and therefore public pressure for, more stringent management of commercial fishing.
Research involved locating, via a keyword search, all articles and editorials on commercial fishing over an eight-year period (1987-1994). The location and type of article was recorded, thenarrangedchronologicallyandcounted.Peoplequoted,andphotoswerealsoanalysed.The conclusions mapped the changing use of print news coverage, and outlined issues of representation and the political, economic and power relations between and within parties.
Research such as this is important because public opinion can help to shape policy, and so it is necessary to understand how media affects this opinion.
Document analysis/desktop review
Relevant to: Any stakeholder group. Output: Typically construct a history of an event or issue, and/or identify the ranges of perspectives expressed about that issue. Usefulness: An easy approach to gaining an in depth understanding about a particular issue and can assist with consultation. Data: Any kind of documentation. Time/cost: Relatively low.
Document analysis can be useful when there is a need to better understand current knowledge about a particular issue through reviewing recent research, and when the policies, perspectives and interactions of groups regarding particular marine resource management issues need to be better understood. It is commonly used in community consultation processes to better understand the history of interactions of stakeholders, as historical cooperation or conflict is likely to influence how groups interact in a consultation process and the positions they adopt. The knowledge developed can be used to inform development of improved consultation strategies.
What is it?
Document analysis refers to analysing documentary evidence, typically to construct a history of an event or issue, and/or to identify the ranges of perspectives expressed about that issue. Also called secondary data analysis or desktop review, as it typically involves no direct contact with people to gather data from them, it may include any kind of documentary, or in some cases, video, documentation of events and perspectives. For example, books, newspapers, organisational reports, results of previous research studies, Hansard transcripts and other sources may be reviewed.
How is it done?
Document analysis typically involves qualitative analysis of the documents relevant to the topic being studied. Qualitative analysis can use many techniques, but often involves developing a history or timeline of events from different perspectives, and coding data into thematic coding categories, which may for example identify the groups of themes or perspectives held by particular groups to assist their comparison.

Fisheries Research Contract Report [Western Australia] No. 21, 2009 61
Planning and costing
Documentanalysisistypicallyalow-costmethodofanalysingsocialdata.Planningdocumentanalysis requires identification of two factors.
• Whatisbeingexamined,overwhattimeframe
• Accessibilityofdocuments
Cost will vary based on these factors, as different analyses will require varying amounts of time.
Benefits and limitations
Document analysis is a useful way of reviewing what is currently known about a particular issue, and the history of that issue. It can be undertaken relatively quickly, and is reasonably low cost.
The usefulness of document analysis depends largely on the type and amount of documentary evidence available for analysis. If little documentation is available, or the documentation available is heavily biased to one particular perspective out of many, documentary analysis will have limited value. It is essential to clearly document gaps in documentary evidence and other limitations to ensure these are clearly understood.
Examples of document analysis in fisheries research
Delaney, A.E., McLay, H.A., van Densen, W.L.T. (2007) Influences of Discourse
On Decision-Making in EU Fisheries Management: The Case of North Sea Cod (Gadus morhua). ICES Journal of Marine Science. Vol. 64, pp. 804-810.
This paper provides an example of how social science research can be used to assess factors that may influence policy. Whilst public participation in resource management (including fisheries) is now expected, this study looks at whether stakeholders are able to influence decision-making and policy through public debate.
Research was conducted in the European Union in Denmark, the Netherlands, UK, France and Norway, focusing on stakeholders involved in the North Sea cod fishery. Discourse analysis was undertaken to examine the public debate as recorded through mediums such as national newspapers, minutes from meetings, newsletters and interviews with key informants. Semi-structured interviews conducted with managers were also analysed to gauge their knowledge of the public debate.
The study found that, whilst public debate has not influenced year-to-year decision-making, it may have influenced the attitude of people involved in the management system more generally.

62 Fisheries Research Contract Report [Western Australia] No. 21, 2009
Jennings, S.F. and Lockie, S. (2002) Application of stakeholder analysis and social mapping for coastal zone management in Australia, in: Gomes, F.V. et al. (Ed.) (2002). Littoral 2002: 6th International Symposium Proceedings: a multi-disciplinary Symposium on Coastal Zone Research, Management and Planning, Porto, 22-26 September 2002: Vol. 1. pp. 285-294. URL:http://www.io-warnemuende.de/homepages/schernewski/Littoral2000/docs/vol1/Littoral2002_33.pdf 23/01/08.
This paper used two participatory social research tools, social mapping and stakeholder analysis, to assess the values, interests, aspirations and attitudes of different stakeholder groupsaffectedbycoastalzonemanagementinthePortCurtiscatchment,Queensland.
The first step in the research involved interviews and document analysis to gain an understanding of the stakeholders’ views. The information gathered was used to create ‘socialmaps’;visual representationsofstakeholders’ relationshipswitheachother.Thesemaps provided a basis for discussion between stakeholders. The second step involved the identification, with stakeholders, of strategies to reduce conflict in relation to management decisions.
The research found that conflict often arises in situations where opportunities for discussion and negotiation between different groups do not exist. Discussion and negotiation leads to the prevention of conflict, and encourages collective action in an environment of diverse views. Reduced stakeholder conflict leads to improved coastal zone management, thus illustrating how social science can be used to improve decision-making.
Qualitative interviews
Relevant to: Any stakeholder group. Output: Providesanunderstandingofhowandwhypeopleactinparticularways. Usefulness: Providespolicymakerswithinformationaboutwhycertainactionsorperceptions occur and allows policy makers to respond to the causes of these actions or perceptions. Data: Qualitative data regarding perceptions and behaviour are collected. Time/cost: Relatively high.
Qualitative interviews with individuals are a key method for gathering data that helps explainhumanbehaviourandperceptions.Gatheringqualitativedatavia interviewsenablesdevelopment of understanding of how and why people have chosen to act in particular ways, whereas quantitative surveys do not enable this type of understanding to be developed.
What is it?
Qualitative interviews are interviews, undertaken face to face, by phone or, sometimes, online through a conversational medium such as instant messaging. They may be semi-structured or unstructured. Semi-structured interviews discuss a pre-set list of topics, with in-depth discussion allowed for each topic. Unstructured interviews have less structure, with a general topic used to start discussion. Interviews may be recorded by taking notes, audio recording, or video recording. Interviews are commonly transcribed and analysed using qualitative analysis techniques such as coding.
How is it done?
Interviews typically follow a process of:

Fisheries Research Contract Report [Western Australia] No. 21, 2009 63
• Identifyinghowpeopletointerviewwillbechosen.Thismaybebasedontheirexperiencewith a particular issue, with ‘key informants’ who have in-depth knowledge or experience ofteninterviewed,orbasedonrandomlysamplingaparticularpopulation;
• Decidinginterviewquestions;
• Interviewingthesample;
• Analysinginterviewdata.
Insomecases,interviewsarestructuredsotheycanelicitbothqualitativeandquantitativedata;see the ‘examples’ section for example of how this has been done in some studies on fisheries-related topics.
Planning and costing
Interviews can be high cost and time consuming, but the cost depends on how many people are interviewed and the extent of data analysis (for example, whether interviews are transcribed wordforwordorifinsteadnotesaretakenduringtheinterview).Planninginterviewsrequiresdecisions regarding the:
• Purposeoftheinterviewsandhenceinterviewtopics;
• Samplingapproachforinterviewingandtotalnumberofpeopletobeinterviewed;
• Analysisapproachtobeused.
Benefits and limitations
Interviews are one of the best approaches to explaining human behaviour and perceptions. Whereas quantitative data can tell you how many people behaved a particular way, or hold a particular perception, qualitative interviews enable an exploration of why people may act or perceive an issue in a particular way. This explanation is necessary in designing good policies, as it enables policy makers to specifically respond to the triggers and causes of particular actions or perceptions, instead of making assumptions about why these have occurred.
The key limitation of interviews is that it is usually not possible to interview enough people to obtain a statistically significant sample. Therefore it is difficult to know if the people interviewed have been ‘representative enough’ to provide useful explanations of behaviour and perceptions. For this reason, many researchers combine qualitative data collection in interviews with surveys that identify what proportion of a particular population act in particular ways or hold specific perceptions.

64 Fisheries Research Contract Report [Western Australia] No. 21, 2009
Examples of use of qualitative interviews in fisheries research
Silvano, R.A.M. and Begossib, A. (2005) Local knowledge on a Cosmopolitan Fish Ethnoecology of Pomatomus saltatrix (Pomatomidae) in Brazil and Australia. Fisheries Research, Vol. 71, pp. 43–59.
This paper reports ethnographical research conducted with Australian Indigenous and Brazilian caiçaras fishers who fish for a migratory fish. Interviews were conducted with the fishers using standardized questionnaires. Quantitative analysis was carried out by assessing the percentage of interviewees that mentioned a certain answer to the questions asked. Qualitative analysis was carried out by comparing citations by Brazilian and Australian fishers. The information provided by the fishers was compared to scientific data.
The study found that the fishers’ knowledge was similar to the scientific knowledge (which is limited), suggesting that local knowledge can be used in management policies. It was also found that this form of research may lead to increased dialogue between fishers and scientists, thus increasing the body of knowledge, as well as the fishers political and cultural strength. The findings support the use of co-management schemes which, if put into place, would change the current, management policy.
Rossiter, T. and Stead, S. (2003) Days at Sea: From the Fisher’s Mouths, Marine Policy. Vol. 27, pp. 281-288.
This paper presents the findings of a study focussing on fishing regulations in the European Union, and the Northeast of Scotland. Fifty fishers were interviewed using semi-structured questions to ascertain their understanding of the issues facing the fishing industry, which is considered to be in a critical state, and their ideas as to how regulation and management should be altered to increase the sustainability of the industry. The fishers’ responses were comparedtotheCommonFisheriesPolicy(or“Roadmap”)(2002)outlinedbytheEuropeanCommission. Overall, there were many similarities between the two.
The fishers usually suggested that regulation should be altered from a quota-based system to an effort (days at sea) system. They felt that the later system would be easier to regulate and monitor, and would thus increase compliance. The study suggests that including the people affected by policy is beneficial because they know the problems associated with previous policy decisions from their experience in working under them. Consultation counteracts the problem that the people writing policy frequently lack an understanding of the fishing industry, which affects their ability to develop good policy (pg.283). However, results should be used with care considering that the fishers tended to look at the pros of effort based fishing and ignore the cons.
There was no discussion as to whether the study findings have been considered by management during the decision-making process. However, the Scottish government website presents ‘A Sustainable Framework for Scottish Sea Fisheries’, which includes mention of effort-based management systems as one of many tools for management: ‘A Sustainable Framework for Scottish Sea Fisheries’. Accessed at:
http://www.scotland.gov.uk/Publications/2005/07/07105456/55094
Last updated: 7 July 2005. Accessed on: 19 December 2007. Scotland.

Fisheries Research Contract Report [Western Australia] No. 21, 2009 65
Christensen, A. and Raakjaer, J. (2006) Fishermen’s Tactical and Strategic decisions: A Case Study of Danish Demersal Fisheries. Fisheries Research Vol. 81, pp. 258-267.
The focus of this paper was on the different strategies and tactics used by fishers in Denmark, and how management and regulations affect behaviour. The research involved in-depth interviews carried out two to three times with 16 fishermen over a couple of months. Balance sheets were also analysed. A survey was then written based on the interview responses to allow for the validation and generalisation of the interview responses. Statistical analysis was then carried out on the decision-making processes of fishers. The study found that there is a difference between the intention of policy and the result because fishers change their practises to minimise the impact of new policy. These results suggest that more flexible management is necessary. The paper reports that the European Commission has begun to change its management policy and has introduced effort control measures (days at sea). These changes may have been influenced by earlier social science based research, such as that by Rossiter and Stead (2003) (see above), and suggests that social science can be used to advocate for changes in policy.
Schumann, S. (2007) Co-management and ‘‘Consciousness’’: Fishers’ Assimilation of Management Principles in Chile. Marine Policy Vol. 31, pp. 101–111.
This paper presents research carried out in Chile to assess the social benefits that resulted from the establishment of a new Management Area system that required fishers to work with marine biologists.
Open-ended surveys were carried out at thirteen ports. Interview participation was based on opportunity, i.e. fishers who were at the port when the interviewer was present. The questions focused on the experiences of fishers involved in the management of the area and their work with the biologists. Responses were assessed using qualitative analysis to find the ideas that emerged from interviews. In addition, quantitative analyses were used to find the percentage of responses within general groups such as positive and negative responses. This is a useful example of the combination of qualitative and quantitative social data collection in which qualitative interviews were combined with quantitative analyses. The study examined why the new Management Area system has been successful. It was found that the reasons for success were different to the expected reasons. These findings suggest that research is important to assess the social outcomes of policy in order to generate understanding of why policy is successful. The knowledge can then be used in future policy and decision-making.

66 Fisheries Research Contract Report [Western Australia] No. 21, 2009
Taylor, N. and Buckenham, B. (2003) Social Impacts of Marine Reserves in New Zealand, Science for Conservation. No. 217. Published by New Zealand Department of Conservation.
The paper presents the background, methods, findings and implementation of research carried out by the New Zealand Department of Conservation. Multiple research methods were used to assess the social impacts relating to the development of marine reserves as well as the human impacts on these reserves. These impacts were related to multiple uses of marine parks, including tourism and recreation, fishing industries and Maori culture.
Initial research involved the review of related literature, which formed a background to later research based on three case studies. The case study-related methods included surveys completed by local businesses, and semi structured interviews conducted with residents, business operators, commercial fishers and key informants such as field officers working with the Department of Conservation. The interviews used a list of 26 key words as prompts and assisted the use of computerised content analysis.
The initial results of the research were presented at several meetings and workshops that allowed for the discussion of the findings and, in the workshops, the development of strategies and guidelines for the future implementation of marine reserves. The use of these strategies and guidelines will ensure the direct impact of social science research on policy and decision-making.
Group interactions: Focus groups, group interviews, workshops
Relevant to: Any stakeholder group. Output: Providesanunderstandingofhowandwhypeopleactinparticularways. Usefulness: Information is collected relatively quickly and provides policy makers with information about why certain actions or perceptions occur and allows policy makers to respond to the causes of these actions or perceptions. Data: Qualitative data and information are collected regarding group perceptions and views and factors that influence individuals’ behaviours. Time/cost: Medium to high – less expensive than undertaking multiple individual interviews.
Focus groups, group interviews and workshops are useful ways of gaining a rapid understanding of the views held by a number of people. Similarly to qualitative interviews, they are a key method for gathering data that helps explain human behaviour and perceptions. Gatheringqualitative data via these ‘group interaction’ methods can provide an understanding of how and why people have chosen to act in particular ways.
These methods enable interaction amongst participants, and hence are useful ways to generate new ideas and possible solutions to problems that are acceptable to a range of stakeholders and groups.
What is it?
Focus groups, group interviews and workshops are all forms of group interaction. Definitions of each differ, and their format may often be very similar if not identical. In general, the distinctions made between the three terms is that:
• Focusgroupsgenerallyinvolvegatheringpeoplewhohavesimilarcharacteristicstogether

Fisheries Research Contract Report [Western Australia] No. 21, 2009 67
to comment on or discuss a particular issue. The similarity may be that the people involved all come from the same industry, same locality, gender/age groups, or they may be chosen for some other similar characteristic. A focus group will usually only be brought together on a single occasion, although in some cases repeated focus groups may be undertaken with thesamegroupofpeople;
• Groupinterviewsaretypicallychosentoincludepeoplewhomayhaveadiversityofviewsabout a particular subject. For example, the participants may all come from the same region but are chosen to reflect the diversity of ages, occupations, and other relevant characteristics of the population of that region. Similarly to focus groups, a group interview is usually undertakenonce;
• Workshops usually refer to bringing peoplewith expertise on a particular topic or issuetogether to actively work on that issue for a period of time. The objective is often to arrive at results or recommendations for moving forward. A workshop may be a ‘one-off’ event, or a series of workshops may be held on a particular issue.
How is it done?
Group interactions have traditionally been held as face-to-face meetings. However, use isincreasingly being made of online forums or websites such as ‘Second Life’ to hold virtual group meetings. The former is still preferred, and reduces the chance of misunderstandings as participants are able to better understand each other’s contributions when they can observe body language and hear how a person said something, as well as what they said. Interacting via written word only has a higher probability of leading to misunderstandings as the ‘tone’ in which something was said is more difficult to interpret.
Face-to-face group interactions typically involve meeting for a period of time – anything from 1-2 hours to several days – to discuss a particular topic. Many group interactions are guided by trained facilitators to ensure the process is a positive experience for all. This is particularly important in conflict situations. Interactions may be recorded by taking notes, audio or video recording, with these notes/recordings then analysed.
Planning and costing
Groupinteractionsareoftenalessexpensiveoptionthanindividualinterviews.Costswillvarydepending on decisions made when planning the interaction, including:
• Whetheratrainedfacilitatorispaidtoruntheinteraction;
• Whetherparticipantsarepaidorhavetheircostscoveredtoattendthefocusgroup/groupinterview/workshop;
• Numberofparticipants;
• Extent of preparation required. For example preparation of data to be discussed at theinteraction;
• Extentofsubsequentanalysisofdata.Forexample,costsofaworkshopwillbehigherifalldiscussions are recorded and fully transcribed than if analysis is based on notes taken at the workshop.
Benefits and limitations
The benefits and limitations of group interactions are similar to those of individual interviews. Groupinteractionsareveryvaluableinhelpingtoexplainhumanbehaviourandperceptions.

68 Fisheries Research Contract Report [Western Australia] No. 21, 2009
They are also commonly used to generate new, shared solutions and strategies about an issue of common interest to the group of people who are interacting.
The key limitations of group interactions are, firstly, that it is usually not possible to include enough people to obtain a statistically significant sample. Therefore it is difficult to know if the people interviewed have been ‘representative enough’ to provide useful explanations of behaviour and perceptions. Secondly, group interactions have the potential to exacerbate existing or contribute to new tensions between different individuals and groups if not facilitated skilfully, especially when sensitive or contentious issues are discussed.
Examples of use of group interactions in fisheries research
Bennett, E. (2007) Gender, Fisheries and Development, Marine Policy. Vol. 29, pp. 451-259.
This paper focuses on issues relating to gender, such as the role of women and equity, in the fishing sector in West Africa, within the broader focus of the developing world. The paper outlines these issues before discussing the results of a workshop held in Benin. The workshop, entitled ‘Room toManoeuvre:Gender andCoping Strategies in the FisheriesSector’ brought together 14 participants from Europe and Africa representing fisheries organisations, universities, research, administration, development and non-government organisations. Discussion was carried out using a framework based on the Sustainable Livelihoods Approach, which encourages an holistic approach, including human, social, physical, natural and financial capital.
The research was designed to discuss the multiple issues surrounding gender in the fishing sector, and the role of policy in improving gender issues such as equity and development. The social science approach was valuable because it led to a number of possible policy interventions related to the underlying ‘deep-rooted’ causes of problems, rather than the immediate challenge (or ‘symptom’). The paper does not state whether the suggested interventions were used to improve policy.
Bennett, E., Neiland, A., Anang, E., Bannerman, P., Rahman, A.A., Huq, S., Bhuiya, S., Day, M., Fulford-Gardiner, M. and Clerveaux, W. (2001) Towards a Better Understanding of Conflict Management in Tropical Fisheries: Evidence from Ghana, Bangladesh and the Caribbean. Marine Policy. Vol. 25, Issue 5, pp. 365-376.
This paper focuses on conflict and natural resource management and suggests that institutional failure may be a key cause of conflict. Three case studies are used to compare fishing-related conflictinGhana,BangladeshandTurksandCaicosIslands.Fieldworkasconductedinanumber of villages with different fishing-related characteristics. Data collection methods combined semi-structured questionnaires, focus group discussions, and contextual and conflict map building. These were conducted in the local language once workshops had been held to discuss the local meaning of key words such as ‘conflict’. Responses were analysed to produce a list of potential causes of conflict.
The results show the significance of institutional failure as a factor in fisheries conflict. Whilst this paper may not have immediately affected policy making, it provides suggestions as to how policy makers can work responsibly to reduce conflict. These results support other papers that advocate the need for policy makers to understand the potential impacts that their decisions have on individuals, and for increased information flow between governments and communities.

Fisheries Research Contract Report [Western Australia] No. 21, 2009 69
Jimenez-Badillo, L. (2008) Management challenges of small-scale fishing communities in a protected reef system of Veracruz, Gulf of Mexico. Fisheries Management and Ecology. Vol. 15, pp. 19-26.
Levels of compliance to fisheries-based management policies are affected by the social and demographic issues faced by fishers. This paper used a range of social science methods, consisting of field observation, structured questionnaire interview, and key informant and focus group discussions to examine the social and economic characteristics of fishers in the Veracruz Reef system national park. Two areas, Veracruz and Anton Lizardo, were compared.
The results of studies such as this one assist decision makers to predict how fishers will respond to management policies by outlining the social and economic issues which they face. For example, it was found that many fishers had no opportunities for alternative income sources other than fishing. Issues such as this must be taken into account when designing management processes to enable a balance between social and environmental issues. The paper advocates for the use of co-management for government, stakeholders and fishers to share decision-making processes and management functions.
Quantitative sample surveys
Relevant to: Any stakeholder group. Output: Providesanunderstandingoftheproportionofapopulationthatholdparticularviews or undertakes particular actions. Usefulness: Provideusefulinformationenablinganunderstandingofthedistributionof particular characteristics across a defined population and how widespread different perceptions, behaviours and characteristics are. Data: Quantitative data is collected. Time/cost: Medium to high but depends on which survey method is used.
Quantitative sample surveys are important tools that can be used to understand the proportion of a population that holds a particular view or undertakes a particular action. To be effective, however, they need to be well designed and implemented –quantitative surveys often fail due to a lack of professionalism in their design and implementation, which can easily result in a low response rate to the survey, or data that have limited usefulness.
Quantitative surveys are used in many circumstances to gather important social information. They are particularly commonly used as a tool in social impact assessment, perceptions studies, and increasingly in community consultation processes to ensure that the views of the entire population are known on an issue.
What is it?
Quantitative sample surveys are surveys that target a statistically significant sample of a defined populationofpeople (for example, commercial fishersoperating in aparticular fishery; theadult population of a particular town or region, recreational fishers in a defined region). They typically ask questions designed so that the responses can be analysed numerically to produce statistics on the proportion of the sample that have particular characteristics. For example, they may ask respondents to tick ‘yes/no’ questions that ask about activities they have/haven’t undertaken, or to rate the strength of their feelings about a topic on a scale of one to five.

70 Fisheries Research Contract Report [Western Australia] No. 21, 2009
When sample surveys achieve a statistically significant response rate, it is possible to extrapolate from the survey results to identify the characteristics of the total population from which the sample was drawn. This means that a well-designed sample will enable valid conclusions to be drawn about the characteristics of a much larger population.
How is it done?
Quantitative sample surveys take the forms of questions asked of a carefully designed sample of people. Typically the process involves designing questions, carefully selecting an appropriate sample, delivering the survey, entering and analysing data.
Surveys may be delivered in various ways, including:
• Face-to-facesurveys. These are expensive compared to other survey modes, but reduce potential for misinterpretation of questions. It can be difficult to specifically target an exact sample, and the location and time chosen for face-to-face surveying may bias the sampleachieved;
• Mailsurveys. These are the lowest cost survey option after internet and email surveys. It is possible to target surveys to a very specific sample. However, response rates are typically low (20% or less) unless measures are taken to improve response rate such as providing a payment for those who complete the survey, sending reminders to complete the survey up to six times, and providing toll-free phone numbers survey recipients can call for assistance when completing the survey. Mail surveys take longer than some other options such as phonesurveys;
• Phonesurveys. These are mid-range in terms of cost, and enable rapid survey of people, with data able to be entered into a form as people are surveyed on the phone. It can be challenging to achieve a representative sample, and response is affected by factors such as thetimeofdayatwhichphonecallsaremade;
• Internetandemailsurveys. Internet and email surveys are becoming increasingly popular. They are very low cost and can be easily designed, particularly using online survey instruments such as those available from <http://www.surveymonkey.com>. The key difficulty is that it is often difficult or impossible to establish a valid sample frame and to select the sample desired, and results cannot always be extrapolated to the rest of the population being sampled.
Planning and costing
Well designed surveys cost a reasonable amount, but are often surprisingly cost effective, especially when compared to the cost of undertaking time intensive data collection using methods such as individual interviews. They cannot, however, gather the same types of information as some of the qualitative methods described above. The cost of a survey will vary depending on:
• Surveydeliverymethodused;
• Numberofpeoplesurveyed;
• Number and type of questions asked. It takes less time to analyse ‘close ended’ questions in which people tick a box or rate their opinion on a scale, than to analyse ‘open ended questions’ in which respondents provide written answers which then have to be categorised toenablenumericalanalysis;
• Type of analysis to be undertaken.

Fisheries Research Contract Report [Western Australia] No. 21, 2009 71
Benefits and limitations
Quantitative surveys can provide useful information enabling an understanding of the distribution of particular characteristics across a defined population. For example, whereas qualitative work could identify that some fishers have increased income following a management change, use of quantitative surveys can enable quantification of how many and which types of fishers have benefited. Quantitative surveys provide an understanding of how widespread different perceptions,behavioursandcharacteristicsare–howmanypeopletypicallybelievethatMPAsareausefulmanagementtool?Aretheymorelikelytobeyoungorold?ArerecreationalfishersmoreorlesslikelythanothergroupstobeinfavourofproposedorexistingMPAs?
Quantitative surveys also have important limitations. In particular:
• Quantitative surveys have limited explanatory power. For example, while it is possible to analyse survey data to identify if women are statistically significantly more likely than men tohold theview thatMPAshavepositivebenefits, the causesof this correlationarenotidentifiable based on survey data. While regression analysis can construct explanations in which many factors explain a particular outcome, this should not be confused with providing a causal relationship. Qualitative work is a useful, and sometimes easier, way of exploring whypeoplebehaveorperceivethewaytheydo;
• Quantitative surveys require considerable skill to design and implement well. Question design, delivery methods and analysis are all areas in which specialists spend years developing skills, yet it is common for inexperienced staff members to be asked to deliver a quantitative survey which then achieves poor results. Common pitfalls include poor question design, poor sample design, and little use of techniques known to improve response rates. For example, a poorly designed question may result in one respondent interpreting the question in one way, while another respondent interpreted the question as referring to something different.

72 Fisheries Research Contract Report [Western Australia] No. 21, 2009
Examples of use of quantitative sample surveys in fisheries research
Steel, B., Lovrich, N., Lach, D., Fomenko, V. (2005) Correlates and Consequences of Public Knowledge Concerning Oceans Fisheries Management. Coastal Management. Vol. 33, pp. 37-51.
This paper outlines the need for a method to assess the link between public knowledge on oceans and support of measures taken by policy makers to restore oceans. The study used amail andphone survey toover3000PacificNorthwestUScitizens.The researchwasdeemednecessarybecausea report issuedby thePewOceanCommissionsuggestedthat increased public knowledge about ocean-related issues, particularly related to policy, will lead to increased public support for policy designed to restore and protect oceans. The research examined whether this occurs and determined the best sources of policy-relevant knowledge.
Levels of knowledge were examined by asking questions relating to the marine environment. In addition to the use of multiple-choice questions, respondents were also asked to indicate from a list of words, those they did and did not know the meaning of. Respondents were also asked how often they used media such as television, the internet or newspapers in order to examine the success of media sources in providing knowledge to the public.
This research is significant because it suggests that increased knowledge is correlated with increased support for measures and policies to restore oceans. However, the research did not study the correlation between support for a policy and actual behaviour.
Stewart et al. (2006) The Demise of the Small Fisher? A Profile of Exiters From the NZ Fishery, Marine Policy. Vol. 30, pp. 328-340.
Research conducted for this paper profiled the fishers who have exited the New Zealand (NZ) fishing industry since the introduction of the NZ quota management system (QMS) in 1986. The research involved the development of a questionnaire, which had been refined through a focus group involving people exiting the fishery. The questionnaire responses were analysed to create a profile of pre-exit involvement, the process of exit, and post-exit employment. In doing so, the researchers were interested in analysing the impact of the QMS on fishers.
The results found that the impacts had not been particularly harmful to fishers as 97% of fishers who chose to exit the industry found employment before, or promptly after their exit. Whilst there was no mention of policy implications, the research was useful to measure the impacts of policy using a variety of indicators, and, had the results been more negative, would have suggested that the social issues of QMS required further attention by policy makers.

Fisheries Research Contract Report [Western Australia] No. 21, 2009 73
Arlinghaus, R. (2006) Understanding Recreational Angling Participation in Germany: Preparing for Demographic Change. Vol. 11, pp. 229-240.
A number of factors affect the management of recreational fishing practises and how management decisions to increase or decrease fishing are valued. These factors include social, ecological and environmental benefits and costs. Proactive decision-making isrequired in order to anticipate and minimise costs, and this calls for an understanding of why people fish, and who these people are.
The research examined the demographic, social, economic and geographic (access to a place to fish) constructs of fishing through a household screening survey conducted over the telephone aspartofalargernationalsurveyinGermany.Theinitialsurveyaskedwhethertherewereany anglers in the household and whether they could be interviewed at a later date. Statistical analysis was then completed to assess which factors affected the likelihood of an individual beinganangler.Generalpredictionsoffuturedemographic,socialandeconomicchangesinGermanywerethenusedtocreateatentativepredictionoffutureanglingparticipation.Theseresults can be used to assist decision-making and management by fisheries.
Finn, K.L. and Loomis, D.K. (2001) The Importance of Catch Motives to Recreational Anglers: The Effects of Catch Satiation and Deprivation. Human Dimensions of Wildlife Vol. 6, pp. 173-187.
The management of recreational anglers’ behaviour requires an understanding of their motivation to fish. Fisheries management requires a balance between the sustainable use of the resource, with sufficient income from the sale of fishing licenses, equipment related taxes, and general expenditure to fund the management of the resource. Social science research assists managers to predict anglers’ responses to future management changes, and therefore assists decision and policy making because managers partially control the opportunities for anglers to catch their preferred fish.
The research presented in this paper involved a questionnaire completed by Massachusetts freshwater anglers. License receipts were used to identify anglers and a questionnaire was sent to a random selection of anglers via mail. The questionnaire provided scenarios outlining different fishing experiences depending on motivations regarding the size, number, and species of fish caught and the previous success in terms of these same motivations. The group was divided into three and each group was sent identical copies of 8 scenarios so a total of 24 scenarios were tested. Respondents were asked to indicate on a 7-point Likert-type scale, the importance of each motivation. The use of the scenarios allowed for a controlled experiment and analysis was carried out using a repeated measures ANOVA procedure.

74 Fisheries Research Contract Report [Western Australia] No. 21, 2009
Franco de Camargo, S.A. and Petrere Jr, M. (2001) Social and Financial Aspects of the Artisanal Fisheries of Middle São Francisco River, Minas Gerais, Brazil. Fisheries Management and Ecology. Vol. 8, pp. 163-171.
This study, carried out in fisheries on the São Francisco River, Brazil, examined fisher behaviour and practises, and the impact of these factors on the fishers’ income. No data related to these issues existed prior to the study. The research aimed to examine the financial and ecological status of the fishery in order to assist planning decisions, as well as to assess the implementation of regulations at the local scale.
Data were collected during 109 interviews with professional fishers using a structured questionnaire. Interviews took place over a year the extended time frame in which to collect data allowed for some changes to be made, and the questionnaire was shortened to emphasis the questions relating to fishing activity. These changes were required as many of the fishers during the earlier interviews did not answer all the questions.
Data were analysed using an analysis of covariance to find that assess values and behaviour that contributed the most significantly to the fishers’ total income. The information can be used to assist decision-making as, at the time of research, there was ongoing debate between commercial and sport fishers concerning management decisions.
Aslin H.J. and Byron I.G. (2003) Community perceptions of fishing: implications for industry image, marketing and sustainability. Fisheries Research and Development Corporation Project No. 2001/309. FRDC, Canberra.
Aslin and Byron (2003) assess the perceptions, knowledge and attitudes of the Australian public towards the Australian fishing industry. Their assessment was based on a literature review, a series of focus groups and a telephone survey. The literature review focussed on similar works to assist with the development of telephone survey questions. The main purpose of the focus groups was to familiarise the researcher with the research focus and also to help determine what survey questions would be most appropriate to gather the required information. The telephone survey was then used to collect the information regarding public perceptions.
Fisheries Research Contract Report [Western Australia] No. 21, 2009 75
Sutton S.G. (2006). An Assessment of the Social Characteristics of Queensland’s Recreational Fishers. CRC Reef Research Centre Technical Report No. 65. CRC Reef Research Centre, Townsville.
Sutton (2006) assesses the social values of recreational fishers in Queensland as part of a social assessment of this sector. The social values assessed by the author include:
• Theintrinsicvalueoffisheriesresources;
• Bequestandexistencevalues;
• Researchandeducationalvalues;
• Aestheticandspiritualvalues;and,
• Subsistencevalues(Sutton,2006,p.36).
A series of thirty statements were presented to survey respondents with respondents required to score each statement according to a five point scale which ranged from strongly disagree to strongly agree. The scores of statements were then used to assess the importance of each of the above five values. Examples of the statements presented included:
• ‘Even if I didn’t fish, it would still be important for me to know that healthy fish populations exist’;
• ‘We should do everything we can today to ensure that future generations inherit healthy recreational fisheries’;
• ‘The value of aquatic environments exists only in the human mind; without people, aquatic environments have no value’.
Scores were then aggregated across the sample to determine what statements were most likely to reflect the views of recreational fishers in Queensland.

76 Fisheries Research Contract Report [Western Australia] No. 21, 2009
Fisheries specific survey approach: Town Resource Cluster analysis
Quantitative surveys form an important part of ‘Town Resource Cluster’ (TRC) analysis, a conceptual approach to understanding social and economic dependence on resources such as fisheries. TRC analysis as defined by Coakes et. al. (2001,pg.4)isessentially;
‘a methodological framework for examining the social impacts of changes in resource use or management in a regional planning context’ and ‘provides a framework in which existing assessment techniques may be usefully included and embedded’.
As a social assessment technique, it is essentially trying to solve the problem of defining distinct spatial units and the level at which SA should take place within a region. Indeed, as Fenton et al. (2001)pointout;
‘without a locationally and spatially distinct unit that defines the social environment, any attempt to understand social and community processes and changes, particularly in the context of NRM, will be fragmented and disparate’.
• Asasocialassessmenttechnique,TRCanalysishasthreekeyobjectives:
• toidentifytownresourceclusters;
• toassesstherelationshipsthatexistbetweenTRCsandspatialareasofnaturalresource;and,
• todescribevarioussocialaspectsandcharacteristicsofidentifiedTRCs.
In order to identify TRCs, measures of inter-town dependency can be used. Such measures can be based on the location of business expenditure, employee expenditure, employee residential expenditure, social infrastructure and facilities and social networks. The appropriate values for such measures can be attained via surveys and interviews of those business owners and workers directly involved in the resource production activity (Fenton et al., 2001). Once this has been done, whatever SA process or method is chosen can be applied according to the identified TRCs within the region.
Thus, TRC analysis, by taking into account the relationships and ‘mutual interdependencies’ between communities, allows the identification of distinct socially defined spatial units (TRCs). These spatial units provide the researcher with a basis on which the social aspects (and potential social impacts of future changes in policy) relevant to individual TRCs can be understood.
Fenton and Marshall (2001a) use TRC analysis as part of a social assessment of Queensland’s commercial fishery. To undertake the analysis, they use a variety of social and demographic data relating to both boat owners and crew that were collected via two separate telephone surveys. Their first survey focussed on boat owners and collected data on the characteristics and locations of fishing operations and expenditure and the socio-demographic characteristics of boat operators and their families. The second smaller survey aimed to collect similar comparable socio-demographic characteristics for the crew of boats identified. The authors use this information to identify TRCs according to the geographical distribution of social and economic activity associated with boat owners and crew. Based on the specified TRCs the authors provide a social and demographic profile of the industry and employment characteristics of the entire Queensland commercial fishery. They make a link between TRC and its fishery resource use by providing a visual representation of the spatial characteristics of resource use. They also show the degree of interdependence between TRCs and also the degree of activity within TRCs relative to their dependence on other TRCs.

Fisheries Research Contract Report [Western Australia] No. 21, 2009 77
Analysis of demographic and other statistics
Relevant to: Any stakeholder group. Output: The characteristics of particular groups involved in using marine resources, or the communities in which groups such as commercial fishers live. Usefulness: May help identify stakeholder characteristics that fisheries managers need to consider. Data: Secondary data may be used if available. If not, quantitative surveys may be required. Time/cost: Relatively low depending on data availability.
Analysing available statistical data can be a useful tool to help inform managers and policy makers about the social environment in which marine management activities are taking place.
What is it?
Demographic and other ‘secondary’ (i.e. already existing) statistics are analysed to identify what they can reveal about either the characteristics of particular groups involved in using marine resources, or the communities in which groups such as commercial fishers live. For example, demographic analysis may be used to profile key statistics of communities that are highly dependent on commercial fishing as one of their industries. This may help in identifying whether these communities have particular characteristics fisheries managers need to be aware of, such as low levels of literacy, a rapidly ageing population, or high turnover in population.
How is it done?
The first step in analysing statistical data is to identify what data are likely to be useful, and how they will be used. Then available data are identified, analysed and utilised. The key issue is usually data availability. Relatively little reliable data is collected on social characteristics of fishers and those dependent on fishing; it is often necessary to design and undertake aquantitative survey to generate statistical data.
Planning and costing
The key step in planning is to understand how and why statistical data will be collated and analysed. A common mistake made is to profile characteristics of fishers without first identifying how that data will be used. This can result in the waste of a considerable investment of money. Costing is often reasonably low, depending on the cost of access to available data.
Benefits and limitations
The key benefits of using statistics that are already available is that it costs less than gathering data through interviews, group interactions, or surveys.
The key limitation is that data that have been gathered may not be detailed enough, or may not meet the needs for which you wish to use it.
In Australia, limited social statistics are available on commercial fishers, and almost none on other marine users that relate directly to their use of marine resources. Data on the former are collected by the ABS through their Census of Population and Housing, undertaken in August once every five years. It asks people about their occupation, and hence data on fishers, deckhands and those employed in seafood processing can be accessed. Detailed data can be accessed only for a fee, however. The data are sometimes patchy – for example, if a fishery does not operate during August, many fishers will be recorded as unemployed, rather than as working in the fishing sector.

78 Fisheries Research Contract Report [Western Australia] No. 21, 2009
Other sources of useful statistics include licence data that in some cases includes information on date of birth (allowing analysis of demographic characteristics) or other information about the fisher and their business.
Examples of demographic and social statistics analysis
Larcombe, J., Brooks, K., Charalambou, C., Fenton, M. and Fisher, M. (2005) Marine Matters: Atlas of marine activities and coastal communities in Australia’s South East Marine Region. Bureau of Rural Sciences, Canberra
‘Marine matters’ provides a profile of the demographic characteristics of communities around coastal Australia, which are likely to be dependent on fishing and marine resource activities.
Gardner, S., Tonts, M. and Elrick, C. (2006) A Socioeconomic Analysis and Description of the Marine Industries of Australia’s South-west Marine Region, Institute for Regional Development, University of Western Australia, report for the Department of the Environment & Water Resources, Canberra
<www.environment.gov.au/coasts/mbp/south-west>.
This report describes and analyses the main commercial marine users active in the South-west Marine Region (SWMR), focusing on ports, shipping, ship and boat building, oil and gas, marine tourism, commercial and recreational fishing, and aquaculture. Statistical analysis of historical activity was used to analyse expected growth and change and key pressures.
Modelling approaches and decision support systems
Relevant to: Any stakeholder group affected by a policy decision that is to be made. Output: Typically models the impacts of policy changes. Usefulness: Only as good as the data and assumptions that the model is based on. Data: Data requirements vary according to model complexity but can cover a wide range of variables. Time/cost: Varies according to model complexity.
Many social science projects involve attempting to establish a model or decision support system (DSS) intended to provide a decision aid for managers of a resource such as a fishery. These have a history of being developed and then rarely used in practice to inform ‘real life’ management of a resource.
What is it and how is it done?
A model or DSS is generally developed in the form of a piece of software in which a dynamic set of actions and responses can be modelled. This modelling may for example aim to predict the likely impacts on population of a decision to change access to commercial and recreational fishing in an area. The model/DSS would be constructed to include all the variables believed likely to influence population, and rules which specify the nature of the links between fishing activities and population levels. In the final models, different types of change could be input and the model would predict changes in population as determined by the data and rules used to construct the model. One of the most common decision support system approaches is multi-criteria analysis (MCA), which is described in more detail in the example box on the following pages.

Fisheries Research Contract Report [Western Australia] No. 21, 2009 79
Planning and costing
Models and DSS range from the simple to the highly complex. Therefore the costing will vary considerably and it is not possible to provide a ‘ballpark’ estimate of likely costs.
Planningamodel/DSSshouldinvolvecarefullyidentifyingwhetherenoughknowledgeoftherelationshipsbetweenkeyvariablesexiststobuildausefulmodel/DSS;andwhetherthedataneeded to populate the model/DSS are available or can be generated. The data collection methods discussed in other sections could all be used to generate data for modelling processes.
Benefits and limitations
Models and decision support systems are only as good as the data and the assumptions they are based on. If based on high quality data, and on assumptions about human behaviour that are realistic and useful, models and DSSs can be useful tools. If high quality data is not available to utilise, models and DSS are likely to be of limited use. Similarly, if modelling some aspect of a social system requires considerably oversimplifying human interactions, it is questionable how useful the model will be in assisting the work of marine resource managers who have to focus on the ‘real world’ consequences of their decisions.
Examples of mixed method studies
While the sections above have focused on demonstrating the use of particular data collection approaches as part of fisheries studies, it is common to use multiple methods in any given study as a way of gaining a more holistic understanding of the social dimensions of the fishing-related issues being examined. Below are some examples of use of multiple methods, including examples of social profiling, measuring community values, and measuring quality of life.

80 Fisheries Research Contract Report [Western Australia] No. 21, 2009
Use of multiple methods to develop a social profile of a fishing community:
Sepez et al. (2005) profile numerous fishing communities in Alaska that are dependent onNorthPacificfisheries.Theobjectiveoftheirstudywasto“compile disparate sources of information in order to produce a document that could serve as a baseline of data for policy analysts and decision makers and a starting point for social scientists conducting more complex analytical research” (Sepez et al. 2005,p.4).Giventhelargescopeoftheirassessment, the authors select communities to be profiled based on eight key indicators related to the location of commercial fisheries landings, registered homeports and fishery participants (crew, permit holders and vessel owners). Their profile of each selected community is largely narrative although a number of indicators are discussed including employment, population structure and racial and ethnic structure. Each profile is divided into three sections. People and Place looks at the current and historical conditions that prevailed in a community and also provides information on geographic location and demographic characteristics. Under Infrastructure, the authors provide an account of the economic, governmental and physical infrastructure that are available to support fishing and the community in general. Finally, the section titled Involvement in North Pacific Fisheries dealswiththenatureanddegreeofinvolvementacommunityhasinNorthPacificfisheries.That is, what fisheries are relevant to each community and how many individuals participate in the fishery and so on.
Other examples of social profiling of fishing communities include Norman et al. (no date) who undertake a study linked to the work of Sepez et al. (2005) that focuses on fishing communities in the USA. Fenton and Marshall (2001a, 2001b and 2001c) present social profiling results for the commercial, harvest and charter fishing sectors of Queensland. In a linked study, Sutton (2006) profile the social characteristics of the Queensland recreational fishing sector.
Assessing quality of life using multiple methods: an Australian example
Schirmer and Pickworth (2005) assess the quality of life of participants in the SouthAustralian Marine Scalefish Fishery. They collect their data via both a mail questionnaire survey and a series of qualitative workshops with fishery participants. They assess quality of life in general, in terms of participants’ responses regarding their attachment to the community, availability of services (school, health, banks and so on) and time spent with family and friends. The quality of fisher working life is also assessed. Factors covered here include enjoyment of work tasks performed, the work environment and also issues surrounding fishery management. Health problems and perceived risks are also dealt with.

Fisheries Research Contract Report [Western Australia] No. 21, 2009 81
Example of a decision support system: multi-criteria analysis
Multi-criteria analysis (MCA) is typically used for the evaluation of a range of different policy proposal options (or the different characteristics of policy proposals). The method can be defined as a ‘set of procedures designed to help decision makers choose between alternativeplansoroptionsinsituationswheretherearemultipleobjectives’ (RAC, 1992). It is an approach that is suited to supporting decision making when a number of stakeholder groups are involved that hold multiple and varying objectives. The technique relies on the identification of a set of criteria that are relevant to the social goals of a policy. These criteria are then used as a guide for the assessment and weighing-up of the different policy options available. The assessment of options against these criteria normally involves the assigning of scores to different options or alternatively the actual ranking of options according to the least and most preferred options. The methods that are actually used to perform MCA can range from simple graphical methods to complex mathematical modelling (RAC, 1992).
The RAC (1992) outline the following steps to performing a MCA evaluation:
1) Specify the alternatives: What are the policy alternatives (will often require consultation with public, interest groups, policy makers and experts)
2) Specify the criteria: What are the multiple objectives (e.g. economic wellbeing, environmentalqualityandqualityoflife)?
3) Scoring the alternatives according to each of the identified criteria: What consequence will each policy alternative have for each of the different objective criteria? Scoringmethods vary but should be comparable across criteria.
4) Assign weights to each of the criteria: What is the relative importance of each of the criteriagivensociety’spreferences?Canusehypotheticalpreferences,opinionpolldata,focus group research results, expert opinions or other.
5) Evaluate the alternatives: A mathematical procedure is used to rank all of the alternative policy options given the above information.
6) Present the results.
Villa et al. (2002) use MCA to guide the planning of marine protected areas in marine reserves in Italy. Their application of multi-criteria analysis is unique in that it combines geographical information systems (GIS) analysis withMCA to perform what they term“spatial MCA”.TheirassessmentusesGIStomapthecharacteristicsofdifferentareas(suchas environmental, biological and use type) in the reserve and uses the design priorities as identifiedintheMCAtodeterminewhereMPAsshouldexistandwhatlevelsofprotectionshouldbeassigned toeachMPA.Assuch, fivedifferentmapsareconstructed that showthe importance and contribution of different areas in the marine reserve to the value of the coastalandmarineenvironments,ofcommercialexploitationofresources;ofrecreationalactivities; and of ease of access. To construct the maps, the authors specify a series ofvariables for each of the above values that are used to score an area’s contribution to that value. Each variable was assigned a priority weight that reflected the relative importance and contribution of each variable to that value. Each priority weight was determined according to the viewpoints of the decision-makers that were involved in the zoning process.
MCA has a range of strengths and weaknesses. Strengths include (RAC 1991, p. 10) that

82 Fisheries Research Contract Report [Western Australia] No. 21, 2009
it provides structure for decision making while still being flexible, provides an approach to complex problems, enables incorporation of different points of view, is amenable to sensitivity analysis, does not require monetary values to be assigned, and can identify data gaps. Weaknesses include (RAC 1991, p. 10) that some data have limited comparability, there are a variety of evaluation methods available, the methods can remain a ‘black box’ to decision makers, MCA can create a false sense of objectivity resulting from definition of explicit weights, data availability is problematic and can data collection can be resource intensive, and methods are incorporating uncertainty are not well developed.
Using multiple methods to assess stakeholder values: Citizen Values Assessment
One method that has been developed for the assessment of stakeholder values is citizen values assessment (CVA). CVA is essentially a predefined approach to assessing the values that citizens (or stakeholders) attach to the qualities of their living environment. As outlined by Stolp et al. (2002), the technique is used for the assessment of the values of citizens in an area that might be affected by a proposed activity such as a massive road works project. However, the approach can also be relevant to the assessment of values that stakeholders attach to fishery resources and communities.
CVA has four key phases. The first phase involves defining the problem being researched and identifying the relevant stakeholder groups that will need to be interviewed. The second phase is a preliminary qualitative study in which the researcher aims to gain an understanding of the connection that stakeholders have to an area (or activity). It follows that the key stakeholder values are identified in this phase. The third phase then involves a quantitative survey in which the key values identified in the second phase are validated and the relative importance of each value is determined. This third phase results in a citizen value profile or assessment matrix that lists all the identified values that are relevant to the aims of the CVA. The fourth phase involves the translation of the citizen value profile intoevaluationcriteria.Giventhattheresearcherhasanunderstandingofwhatstakeholdergroups value about the current characteristics of an area (or activity) they can get an idea of how a proposed policy will impact on those characteristics and therefore the values of stakeholders (Stolp et al., 2002).

Fisheries Research Contract Report [Western Australia] No. 21, 2009 83
5.0 References
Fisheries management in Western AustraliaFletcher, W.J., Chesson, J., Fisher, M., Sainsbury, K.J., Hundloe, T., Smith, A.D.M. and Whitworth,
B. (2002). National ESD reporting framework for Australian fisheries: The ‘how to’ guide for wild capture fisheries. FRDC project 2000/145, ESD Reporting and Assessment Subprogram, Fisheries Research and Development Corporation, Canberra.
Economic evaluationsAigner, D.J. and Chu, S.F. (1968). ‘On estimating the industry production function’, American
Economic Review, Vol. 58, pp. 826–39.
Arin, T. and Kramer, R.A. (2002). Divers’ willingness to pay to visit marine sanctuaries: an exploratory study. Ocean and Coastal Management, Vol. 45, pp. 171-183.
Bennett, J. (2005). Choice Modelling, a step-by-step guide, Economics Techniques Series: Fact sheet No.1,QueenslandGovernment,EnvironmentalProtectionAgency.
Bennett, J.W. (1999). Some fundamentals of environmental choice modelling. Choice modelling research reports, research report No. 11, School of Economics and Management, University College, The University of New South Wales, Canberra.
Blamey, R.K., Rolfe, J.C., Bennett, J.W. and Morrison, M.D. (1997). Environmental Choice Modelling: Issues and Qualitative Insights, Research Report No. 4, Department of Economics and Management, ADFA, Canberra.
Blamey, R., Gordon, J., and Chapman, R. (1999) ChoiceModelling:Assessing the EnvironmentalValues of Water Supply Options. Australian Journal of Agricultural and Resource Economics. Vol. 3., Iss. 3, pp. 337-357.
Blamey, R. (2002). ‘The Recreational Sector’, in Hundloe, T. (ed.), Valuing Fisheries: an economic framework,UniversityofQueenslandPress,Australia,pp.113-165.
Cai, J. and Leung, P. (2004). LinkageMeasures: a Revisit and a SuggestedAlternative. EconomicSystems Research. Vol. 16, Iss. 1, pp. 63-83.
Cai, J.,Leung,P.S.,Pan,M.andPooley,S. (2005).Economic linkage impactsofHawaii’s longlinefishing regulations. Fisheries Research, Vol. 74, pp. 232-242.
Campbell, H.F. and Hall, S.R. (1988). A Bioeconomic Analysis of the Tasmanian Rock Lobster Fishery, 1947–84, Technical Report 28, Department of Sea Fisheries, Tasmania.
Campbell, H.F. Hand, A.J. and Smith, A.D.M. (1993). ‘A bioeconomic model for the management of orange roughy stocks’, Marine Resource Economics, vol. 8, pp. 155–72.
Cantrell, R.N., Garcia,M., Leung, P.S. and Ziemann, D. (2004). Recreational anglers’ willingnessto pay for increased catch rates on Pacific threadfin (Polydactylus sexfilis) inHawaii. FisheriesResearch, Vol. 68, pp. 149-158.
Cao, L., Hafi, A. and Klijn, N. (2001). Specification of length of planning period and terminal value of fish stock, ABARE conference paper 01.7 presented at the 45th Annual Conference of the Australian Agricultural and Resource Economics Society, Adelaide, 23–25 January.
Carlsen, J. and Wood, D. (2004). Assessment of the economic value of recreation and tourism in Western Australia’s national parks and forests. Report for Sustainable Tourism CRC. GoldCoast, Australia. Available at: http://www.crctourism.com.au/WMS/Upload/Resources/bookshop/Carlsen68008_WAnationalParksFINAL.pdf

84 Fisheries Research Contract Report [Western Australia] No. 21, 2009
Chapman, L. and Beare, S. (2001). Economic Impact of the Northern Prawn FisheryAmendmentManagementPlan,ReportfortheFisheriesResourcesResearchFund,ABARE,Canberra.
Chavez-Comparan, J.C. and Fischer, D.W. (2001). Economic valuation of the benefits of recreational fisheries in Manzanillo, Colima, Mexico, Tourism Economics, Vol. 7, No. 4, pp. 331-345.
Clark, C.W. (1985). Bioeconomic Modelling and Fisheries Management, John Wiley and Sons, New York.
Cliff,E.M.andVincent,T.L.(1973).AnOptimalPolicyforaFishHarvest,JournalofOptimizationTheory and Applications, Vol. 12, No. 5, pp. 485-496.
Coelli, T., Rao, D.S.P. and Battese, G.E. (1998). An Introduction to Efficiency and ProductivityAnalysis,KluwerAcademicPublishers,Boston.
Cohen, Y. (1987). ‘A Review of Harvest Theory and Applications of Optimal Control Theory in Fisheries Management’, Canadian Journal of Fisheries and Aquatic Sciences, Vol. 44 (Suppl. 2), pp. 75-83.
Dann, T. and Pascoe, S. (1994). A Bioeconomic Model of the Northern Prawn Fishery, ABAREResearch Report 94.13, Canberra.
Eggert H (1998). Bioeconomic analysis and management. Environmental and resource economics, Vol. 11, no. 3-4, pg. 399.
Eggert, H. and Olsson, B. (2004). Heterogeneous preferences for marine amenities: a choice experiment appliedtowaterquality.WorkingPapers inEconomics,No.126,GöteborgUniversity,SchoolofBusiness, Economics and Law. Available at:
http://gupea.ub.gu.se/dspace/bitstream/2077/2834/1/gunwpe0126.pdf
Färe, R., Grosskopf, S., Kirkley, J. and Squires, D. (2002). Data envelopment analysis (DEA): aframework for assessing capacity in fisheries when data are limited, International Institute for FisheriesandTrade(IIFET)2000Proceedings,11pp.
Feather,P.M.(1994).SamplingandAggregationissuesinrandomutilitymodelestimation.AmericanJournal of Agricultural Economics, Vol. 26, No. 4, pp. 772-780.
Felthoven,R.G.andPaul,C.J.M.(2004).DirectionsforProductivityMeasurementinFisheries,MarinePolicy,Vol.28,No.2,pp.161-169.
Galeano,D.,Langenkamp,D.,Levantis,C.,Shafron,W.andRedmond,I.(2004).EconomicValueofCharter and Recreational Fishing in Australia’s Eastern Tuna and Billfish Fishery, ABARE eReport 04.10PreparedfortheFisheriesResourcesResearchFund,Canberra,July.Availableat:http://www.abareconomics.com/publications_html/fisheries/fisheries_04/er04_recfish.pdf
Goldberger,A.S.(1964).EconometricTheory,Wiley,NewYork.
Gooday, P. and Galeano, D. (2003). Fisheries management: a framework for assessing economicperformance, ABARE eReport 03.7, Prepared for the Fisheries Resources Research Fund,Canberra.
Greene,G.,Moss, C.B. and Spreen,T.H. (1997). Demand for Recreational Fishing inTampaBay,Florida: A Random Utility Approach, Marine Resource Economics, Vol 12, pp. 293-305.
Grosskopf, S. (1993). Efficiency and Productivity. In Fried, H.O., Lovell,A.K. and Schmidt, S.S.(eds.), The measurement of productivity efficiency: Techniques and applications. New York, Oxford, TorontoandMelbourne,OxfordUniversityPress,pp.160-94.
Hannesson, R. (1993). Bioeconomic Analysis of Fisheries, Fishing News Books, Oxford.
Hoehn, J.P. (1987). Contingent Valuation in Fisheries Management: The Design of SatisfactoryContingent Valuation Formats. American Fisheries Society, Vol. 116, pp. 412-419.

Fisheries Research Contract Report [Western Australia] No. 21, 2009 85
Holland,P. (2002).TheCommercialSector. In:Hundloe,T. (2002).ValuingFisheries:aneconomicframework,pp.81-112,UniversityofQueenslandPress,Australia.
Hundloe, J.T. (2000). Economic performance indicators for fisheries. Marine and Freshwater Resources, Vol. 51, pp. 485-91.
Imber, D., Stevenson, G. and Wilks, L. (1991). A Contingent Valuation Survey of the KakaduConservationZone.RACResearchPaperNo.3,AGPS,Canberra.
Jin, D., Thunberg, E., Kite-Powell, H. and Blake, K. (2002). Total Factors Productivity Change inthe New England Groundfish Fishery: 1964-1993, Journal of Environmental Economics andManagement, Vol. 4, pp. 540-556.
Katz,M.L.andRosen,H.S.(1998).Microeconomics(thirdedition),Irwin/McGraw-Hill.
Kaoru, Y. (1995). Measuring marine recreation benefits of water quality improvements by the nested random utility model. Resource and Energy Economics, Vol. 17, pp. 119-136.
Kennedy, J.O.S. (1999). A dynamic model of cooperative and non-cooperative harvesting of southern bluefin tuna with an open access fringe, Paper presented at theWorld Conference on NaturalResource Modelling, Saint Mary’s University, Halifax, Canada, 23–25 June.
Kerkvliet,J.,Nowell,C.andLowe,S.(2002).TheEconomicValueoftheGreaterYellowstone’sBlue-Ribbon Fishery. North American Journal of Fisheries Management, Vol. 22, pp. 418-424.
Kirkley, J., Paul, C.J.M, Cunningham, S. and Catanzano, J. (2004). Embodied and DisembodiedTechnical Change in Fisheries: An Analysis of the Sete Trawl Fishery, 1985-1999, Environmental and Resource Economics, Vol. 29, pp. 191-217.
Knowler D. (2002). A Review of selected bioeconomic models with environmental influences in Fisheries. Journal of Bioeconomics, Vol. 4, pp. 163-181.
Kompas, T. (2005). ‘Fisheries Management: Economic Efficiency and the Concept of ‘Maximum Economic Yield’’, Australian Commodities, Vol. 12, No. 1: pp. 152-60. Available at:
[http://www.crawford.anu.edu.au/pdf/staff/tom_kompas/KompasT_03.pdf].
Kompas, T. and Che, T.N. (2003). ‘Efficiency gains and cost reductions from Individual Transferrable Quotas:astochasticfrontierfortheAustralianSouthEastfishery’,JournalofProductivityAnalysis,Vol. 23, pp. 285-307.
Kulmala, S., Laukkanen, M. and Michielsens, C. (2008). Reconciling economic and biological modelling of migratory fish stocks: Optimal management of the Atlantic salmon fishery in the Baltic Sea, Ecological Economics, Vol. 64 pp. 716-728.
Lindner, R.K. and McLeod, P.B. (1991). The economic impact of recreational fishing inWesternAustralia,FisheriesManagementPaperNo.38,FisheriesDepartmentofWesternAustralia.
Loelhe, C. (2006). Control theory and the management of ecosystems, Journal of Applied Ecology, Vol. 43, pp. 957-966.
Massey, D.M., Newbold, S.C. and Gentner, B. (2006). Valuing water quality changes using abioeconomic model of a coastal recreational fishery, Journal of Environmental Economics and Management, Vol. 52, pp. 482-500.
McLeod,P.andMcGinley,C.(1994).Economicimpactstudy,commercialfishinginWesternAustralia.PreparedbyEconomicResearchAssociates.FisheriesManagementPaper61.Availableat[http://www.fish.wa.gov.au/docs/mp/mp061/fmp061.pdf].
McLeod, P. and Nicholls, J. (2004a). A Socio-economic valuation of resource allocation optionsbetween recreational and commercial sectors, Part I:AGeneral theoretical framework. FisheriesResearchandDevelopmentCorporation,ProjectNo.2001/065,EconomicResearchAssociates.
- (2004b). A Socio-economic valuation of resource allocation options between recreational and

86 Fisheries Research Contract Report [Western Australia] No. 21, 2009
commercialsectors,PartII:TheWesternAustralianCockburnSoundManagedCrabFishery.FisheriesResearchandDevelopmentCorporation,ProjectNo.2001/065,EconomicResearchAssociates.
- (2004c). A Socio-economic valuation of resource allocation options between recreational and commercial sectors,Part III:ThePerthAbaloneFisheryCaseStudyWesternAustralia.FisheriesResearchandDevelopmentCorporation,ProjectNo.2001/065,EconomicResearchAssociates.
- (2004d). A Socio-economic valuation of resource allocation options between recreational and commercialsectors,PartIV:TheWestCoastWetlineFisheryCaseStudy.FisheriesResearchandDevelopmentCorporation,ProjectNo.2001/065,EconomicResearchAssociates.
Morrison, M.D., Blamey, R.K., Bennett, J.W. and Louviere, J.J. (1996). A comparison of stated preference techniques for estimating environmental values. Choice modelling research reports, research report No. 1, School of Economics and Management, University College, The University of New South Wales, Canberra.
Morrison, M.D., Bennett, J.W. and Blamey, R.K. (1997). Designing choice modelling surveys using focus groups: results from the Macquarie Marshes and Gwydir Wetlands case studies. Choicemodelling research reports, research report no. 5, School of Economics and Management, University College, The University of New South Wales, Canberra.
Murdock, J. (2006). Handling unobserved site characteristics in random utility models of recreation demand. Journal of Environmental Economics and Management, Vol. 51, pp. 1-25.
Newton,P.,Wood,R.,Galeano,D.,Vieira,S.andPerry,R.(2007).FisheryEconomicStatusReport,ABAREReport07.19PreparedfortheFisheriesResourcesResearchFund,Canberra,October.
Newton,P.andWood,R.(2008).Analysisofproductivitytrendsinthegillnet,hookandtrapsector,Australian Bureau of Agricultural and Resource Economics, unpublished draft report.
Oh,C,Ditton,R.B.,Gentner,B. andRiechers,R. (2005).AStatedPreferenceChoiceApproach toUnderstandingAnglerPreferencesforManagementOptions,HumanDimensionsofWildlife,Vol.10, No. 3, pp.173 -186.
Parsons,G.R.andHauber,A.B. (1998).SpatialBoundariesandChoiceSetDefinition inaRandomUtility Model of Recreation Demand. Land Economics, Vol. 74, No. 1, pp. 32-48.
Parsons,G.R.andKealy,M.J.(1992).Randomlydrawnopportunitysetsinarandomutilitymodeloflake recreation. Land Economics, Vol. 68, no. 1, pp. 93-106.
Parsons,G.R.andNeedelman,M.S.(1992).Siteaggregationinarandomutilitymodelofrecreation.Land Economics, Vol. 68. No. 4, pp 418-433.
Parsons,G.R.,Plantinga,A.J.andBoyle,K.J.(2000).NarrowChoiceSetsinaRandomUtilityModelof Recreation Demand, Land Economics, Vol. 76, No. 1, pp. 86-99.
Perman, P., Ma,Y., McGilvray, J. and Common,M. (1999). Natural Resource and EnvironmentalEconomics,London,PrenticeHall.
Propst,D.B.andGavrilis,D.G.(1987).RoleofEconomicImpactAssessmentProceduresinRecreationalFisheries Management, Transactions in the American Fisheries Society, Vol. 116, pp. 450-460.
Reichers, R.K. and Fedler, A.J. (1996). An overview of the economic impact and value of recreational fisheries. American Fisheries Society Symposium, Vol. 16, 245-250.
Reid,C.,Collins,P.andBattaglene,T. (1993).TorresStraitPrawnFishery:AnEconomicAnalysis,ABARE Research Report 93.15, Canberra.
Reid, C. and Squires, D. (2007). Measuring fishing capacity in tuna fisheries: Data Envelopment Analysis, industry surveys and data collection. In Bayliff, W.H. and Majkowski, J. (eds.), ‘Methodological Workshop on the Management of Tuna Fishing Capacity: stock status, data envelopment analysis, industry surveys and management options’, Food and Agricultural Organisation of the United Nations, Rome. Available at: ftp://ftp.fao.org/docrep/fao/010/a1338e/a1338e07.pdf .

Fisheries Research Contract Report [Western Australia] No. 21, 2009 87
Rogers,M.(1998).TheDefinitionandMeasurementofProductivity,MelbourneInstituteWorkingPaper9/98, Melbourne Institute of Applied Economic and Social Research, University of Melbourne.
Rolfe, J.C. and Bennett, J.W. (2000). Testing for framing factors in environmental choice modelling. Choice modelling research reports, research report no. 13, School of Economics and Management, University College, The University of New South Wales, Canberra.
Rose,R.,Stubbs,M.,Gooday,P.andCox,A.(2000).EconomicPerformanceIndicatorsforfisheries.International Institute of Fisheries Economics and Trade 2000 Conference, Oregon State University, Corvallis, Oregon, 1-14 July 2000.
Rosenthal, D.H. (1987). The necessity for substitute prices in recreation demand analyses. American Journal of Agricultural Economics, Vol. 69, No. 4, pp. 828-37.
Sandefur, R.A., Johnson, F.R. and Fowler, R.B. (1996). An Introduction to the random utility model, TERGeneralWorkingPaperNo.G-9602,TriangleEconomicResearch.
Seijo, J.C., Defeo, O. and Salas, S. (1998). Fisheries bioeconomics. Theory, modelling and management. FAO Fisheries Technical Paper. No.368. Rome, FAO. 108 pp.Available at http://www.fao.org/docrep/003/W6914E/W6914E00.HTM
Shrestha, R.K., Seidl, A.F. and Moraes, A.S. (2002). Value of recreational fishing inn the Brazilian Pantanal:atravelcostanalysisusingcostdatamodels,EcologicalEconomics,Vol.42,pp.289-299.
Smith, D.M. (2008). Bioeconometrics: Empirical Modelling of Bioeconomic Systems, Marine Resource Economics, Vol. 23, No. 1, pp. 1-24.
Storey,D.A.andAllen,P.G.(1993).EconomicimpactofmarinerecreationalfishinginMassachusetts.North American Journal of Fisheries Management, Vol. 13, pp. 698-708.
Vieira, S. and Hohnen, L. (2007). Australian Fisheries Surveys Report 2007: Results for Selected Fisheries, 2004-05 and 2005-06,ABAREReport Prepared for the FisheriesResourcesResearchFund, Canberra, October.
Vieira, S., Wood, R. and Causer, T. (2008). Australian Fisheries Surveys Report 2008: Results for Selected Fisheries, 2005-06 and 2006-07,ABARE Report Prepared for the Fisheries ResourcesResearch Fund, Canberra, October. Available at:
http://www.abare.gov.au/publications_html/fisheries/fisheries_08/08_AFSurveys.pdf
Wallace, I.R. and Lindner, K. (1998). ‘Mathematical programming models for the management of the western rock lobster fishery’, in Fraser,R.W. (ed.), Research Profile:Agricultural andResourceEconomics at The University of Western Australia in 1998, Uniprint, University of Western Australia,Perth,pp.137–47.
Wattage,P.,Mardle,S.andPascoe,S.(2005).Evaluationoftheimportanceoffisheriesmanagementobjectives using choice-experiments. Ecological Economics, Vol. 55, pp. 85-95.
Wetzel, J.N. (1977). Estimating the benefits of recreation under conditions of congestion. Journal of Environmental Economics and Management, Vol. 4, pp. 239-46.
Wheeler, S. and Damania, R. (2001). Valuing New Zealand recreational fishing and an assessment of the validity of the contingent valuation estimates. The Australian Journal of Agricultural and Resource Economics, Vol. 45, No. 4, pp. 599-621.
Wood, D. and Hughes, M. (2006). Tourism accommodation and economic contributions on the NingalooCoastofWesternAustralia.TourismandHospitalityPlanningand Development. Vol. 3, No. 2, pp. 77-88.

88 Fisheries Research Contract Report [Western Australia] No. 21, 2009
Social evaluationsArlinghaus,R. (2006).UnderstandingRecreationalAnglingParticipation inGermany:Preparing for
Demographic Change. Vol. 11, pp. 229-240.
Aslin H.J. and Byron I.G. (2003). Community perceptions of fishing: implications for industryimage,marketingandsustainability.FisheriesResearchandDevelopmentCorporationProjectNo.2001/309. FRDC, Canberra.
Baines, J., McClintock, W., Taylor, N. and Buckenham, B. (2003). Using local knowledge. In Becker, H. and Vanclay, F. (eds). The International Handbook of Social Impact Assessment, Cheltenham (UK): Edward Elgar, pp. 26-41.
Becker, H. (2003). Theory formation and application in social impact assessment. In Becker, H. and Vanclay, F. (eds). The International Handbook of Social Impact Assessment, Cheltenham (UK): Edward Elgar, pp. 129-142.
Bennett,E.(2007).Gender,FisheriesandDevelopment,MarinePolicy.Vol.29,pp.451-259.
Bennett, E.,Neiland,A.,Anang, E.,Bannerman, P.,Rahman,A.A.,Huq, S.,Bhuiya, S.,Day,M.,Fulford-Gardiner, M. and Clerveaux, W. (2001). Towards a Better Understanding of Conflict ManagementinTropicalFisheries:EvidencefromGhana,BangladeshandtheCaribbean.MarinePolicy.Vol.25,Issue5,pp.365-376.
Brooks,K.,Charalambou,C.,Coakes,S.,Gabriel,M.andRoberts,(2001).TheRightBait…SocialContributions of Tourism Fishing Charter Operations to St Helens, Tasmania, Bureau of Rural Sciences, Department of Agriculture, Fisheries and Forestry – Australia.
Christensen, A. and Raakjaer, J. (2006). Fishermen’s Tactical and Strategic decisions: A Case Study of Danish Demersal Fisheries. Fisheries Research Vol. 81 pp. 258-267.
Coakes,S. (1999).Social ImpactAssessment:aPolicyMaker’sGuide toDevelopingSocial ImpactAssessmentPrograms.BureauofRuralSciences,Canberra.
Coakes,S.,Fenton,D.M.andGabriel,M.(2001).MarineMatters;SocialContributionsofMarineUsesto the Communities in South East Region of Australia, Bureau of Rural Sciences, Department of Agriculture, Fisheries and Forestry – Australia.
Compas, E., Clarke, B., Cutler, C. and Daish, K. (2007). Murky Water: Media Reporting of Marine ProtectedAreasinSouthAustralia.MarinePolicy.Vol.31,pp.691-697.
Delaney, A.E., McLay, H.A. and van Densen, W.L.T. (2007). Influences of Discourse On Decision-MakinginEUFisheriesManagement:TheCaseofNorthSeaCod(Gadusmorhua).ICESJournalof Marine Science. Vol. 64, pp. 804-810.
Fenton,D.M.andMarshall,N.A.(2001a).AGuidetotheFishersofQueensland.PartA:TRCAnalysisand Social Profiles of Queensland’s commercial Fishing Industry. CRC Reef Research CentreTechnical Report No. 36, CRC Reef Research Centre, Townsville, Australia.
Fenton,D.M.andMarshall,N.A.(2001b).AGuidetotheFishersofQueensland.PartB:TRCAnalysisandSocialProfilesofQueensland’sharvestindustry.CRCReefResearchCentreTechnicalReportNo. 37, CRC Reef Research Centre, Townsville, Australia.
Fenton,D.M.andMarshall,N.A.(2001c).AGuidetotheFishersofQueensland.PartC:TRCAnalysisandSocialProfilesofQueensland’sCharterFishingIndustry.CRCReefResearchCentreTechnicalReport No. 38, CRC Reef Research Centre, Townsville, Australia.
Fenton,D.,Marshall,N.andEdgar,S.G.(2001).AGuidetotheCommercialFishersofQueensland- TRC Analysis and Social Profiles of Queenslands Commercial Fishing Industry, CRC ReefResearch Centre
Finn, K.L. and Loomis, D.K. (2001). The Importance of Catch Motives to Recreational Anglers: The Effects of Catch Satiation and Deprivation. Human Dimensions of Wildlife. Vol. 6, pp. 173-187.

Fisheries Research Contract Report [Western Australia] No. 21, 2009 89
Franco de Camargo, S.A. and Petrere Jr,M. (2001). Social and FinancialAspects of theArtisanalFisheriesofMiddleSãoFranciscoRiver,MinasGerais,Brazil.FisheriesManagementandEcology.Vol. 8, pp. 163-171.
Fredline, L., Deery, M. and Jago, L. (2006). Development of a scale to assess the social impact of tourismwithincommunities.SustainableTourismPtyLtd,Australia.
Gardner,S.,Tonts,M.,andElrick,C.(2006).ASocioeconomicAnalysisandDescriptionoftheMarineIndustries of Australia’s South-west Marine Region, Institute for Regional Development, University of Western Australia, report for the Department of the Environment and Water Resources, Canberra, <www.environment.gov.au/coasts/mbp/south-west>.
Glaeser,E.L.,Laibson,D.I., Scheinkman, J.A. andSoutter,C.L. (2000).Measuring trust.QuarterlyJournal of Economics. Vol. 115, pp. 811–46.
Grafton,R.Q.(2005).Socialcapitalandfisheriesgovernance,OceanandCoastalManagement,Vol.48, pp. 753-766.
InterorganizationalCommitteeonPrinciplesandGuidelinesforSocialImpactAssessment(ICPGSIA)(2003).PrinciplesandguidelinesforsocialimpactassessmentintheUSA,ImpactAssessmentandProjectAppraisal,Vol.21,No.3,pp.231–250.
Jimenez-Badillo, L. (2008). Management challenges of small-scale fishing communities in a protected reefsystemofVeracruz,GulfofMexico.FisheriesManagementandEcology.Vo.15,pp.19-26.
Jennings, S.F. and Lockie, S. (2002). Application of stakeholder analysis and social mapping for coastal zonemanagementinAustralia,in:Gomes,F.V.,Taveira,P.anddasNeves,L.(Eds.)Littoral2002:6thInternationalSymposiumProceedings:amulti-disciplinarySymposiumonCoastalZoneResearch,Management and Planning, Porto, Vol. 1., pp. 285-294. URL: http://www.io-warnemuende.de/homepages/schernewski/Littoral2000/docs/vol1/Littoral2002_33.pdf 23/01/08.
Kaplan, I.M. and McCay, B.J. (2004). Cooperative Research, Co-management and the Social Dimension onFisheriesScienceandManagement.MarinePolicy.Vol.28,pp.257-258.
Knack,S.,Keefer,P.(1997).Doessocialcapitalhaveaneconomicpayoff?Across-countryinvestigation.Quarterly Journal of Economics. Vol. 112, No. 4, pp. 1252–88.
Larcombe, J., Brooks, K., Charalambou, C., Fenton, M. and Fisher, M. (2005). Marine Matters: Atlas of marine activities and coastal communities in Australia’s South East Marine Region. Bureau of Rural Sciences, Canberra.
NationalMarineFisheriesService(NMFS)(2001).GuidelinesforAssessmentoftheSocialImpactofFishery Management Actions. Appendix 2(g) Accessed at: http://www.nmfs.noaa.gov/sfa/reg_svcs/social_impact_assess.htm Last updated: March 2001. Date Accessed: 19 December 2007.
Norman,K.,Sepez,J.,Lazrus,H.,Milne,N.,Package,C.,Russell,S.,Grant,K.,Petersen,R.,Primo,J.,Styles,M.,Tilt,B.andVaccaro,I.(2006).CommunityProfilesforWestCoastandNorthPacificFisheries - Washington, Oregon, California, and other U.S. States. Socioeconomics Program,Northwest Fisheries Science Center and the Economics and Social Sciences Research Program,Alaska Fisheries Science Center. Available at [http://www.nwfsc.noaa.gov/research/divisions/sd/communityprofiles/index.cfm].
O’Brien,P.(2002).ScenarioPlanning:Astrategictool.BureauofRuralSciences,Canberra.
Paldam,M. (2000).Socialcapital:oneormany?Definitionandmeasurement.JournalofEconomicSurveys. Vol. 14, pp. 629–53.
Resource Assessment Commission (RAC) (1992). Multi-criteria Analysis as a Resource Assessment Tool. Research paper, No. 6, Commonwealth of Australia, Canberra.
Rossiter, T. and Stead, S. (2003). Days at Sea: From the Fisher’sMouths,Marine Policy.Vol. 27,pp.281-288.

90 Fisheries Research Contract Report [Western Australia] No. 21, 2009
Schirmer,J.andPickworth,J.(2005a).AsocialassessmentoftheMarineScalefishFisheryofSouthAustralia. Case study report for FRDC Project 2003/056A social assessment handbook for useby Australian fisheries managers in ESD assessment and monitoring. Bureau of Rural Sciences, Canberra.
Schirmer, J. and Casey, A.M. (2005). Social assessment handbook: a guide to methods and approaches for assessing the social sustainability of fisheries in Australia. Fisheries Research and Development Corporation ESD Reporting and Assessment Subprogram Publication No. 7. Bureau of RuralSciences, Canberra.
Schumann, S. (2007). Co-management and ‘‘Consciousness’’: Fishers’ Assimilation of Management PrinciplesinChile.MarinePolicy.Vol.31,pp.101–111.
Sepez,J.A.,Tilt,B.D.,Package,C.L.,Lazrus,H.M.andVaccaro, I. (2005).CommunityprofilesforNorthPacificfisheries-Alaska.U.S.Dept.Commerce,NOAATech.Memo.NMFS-AFSC-160,552pp. Available at [http://www.afsc.noaa.gov/Publications/AFSC-TM/NOAA-TM-AFSC-160/NOAA-TM-AFSC-160.pdf].
Silvano, R.A.M. and Begossib, A. (2005). Local knowledge on a Cosmopolitan Fish Ethnoecology of Pomatomus saltatrix (Pomatomidae) inBrazil andAustralia.Fisheries Research, Vol. 71, pp. 43–59.
Sobel J. (1997). Can we trust social capital. Journal of Economic Literature. Vol. 40, No. 1, pp. 139–54.
Steel, B., Lovrich, N., Lach, D. and Fomenko, V. (2005). Correlates and Consequences of PublicKnowledge Concerning Oceans Fisheries Management. Coastal Management. Vol. 33, pp. 37-51.
Stewart,J.,Walshe,K.andMoodie,B.(2006).TheDemiseoftheSmallFisher?AProfileofExitersFromtheNZFishery,MarinePolicy.Vol.30,pp.328-340.
Stolp,A.,Groen,W, vanVliet, J. andVanclay, F. (2002). Citizen values assessment: incorporatingcitizens’ value judgements in environmental impact assessment, ImpactAssessment and ProjectAppraisal,Vol.20,No.1,pp.11–23,BeechTreePublishing,Guildford,UnitedKingdom.
Sullivan,K.M. (1999). Fishing in theMedia:Mainstream PrintNews and theCommercial FishingIndustry in Texas. Culture and Agriculture. Vol 21, No. 3, pp. 31-43.
Sutton,S.G.(2006).AnAssessmentoftheSocialCharacteristicsofQueensland’sRecreationalFishers.CRC Reef Research Centre Technical Report No. 65. CRC Reef Research Centre, Townsville.
Taylor, N. and Buckenham, B. (2003). Social Impacts of Marine Reserves in New Zealand, Science for Conservation.No.217.PublishedbyNewZealandDepartmentofConservation.
Taylor,N.,Goodrich,C.Fitzgerald,G.andMcClintock,W.(2003).Undertakinglongitudinalresearch.In Becker, H. and Vanclay, F. (Eds). The International Handbook of Social Impact Assessment, Cheltenham (UK): Edward Elgar, pp. 13-25.
Temple, J. and Johnson, P.A. (1998). Social capability and economic growth. Quarterly Journal ofEconomics. Vol. 113, pp. 965–90.
Townsley,P.(1998).SocialIssuesinFisheries,FAO Fisheries Technical Paper No. 375. Accessed at: http://www.fao.org/docrep/003/W8623E/w8623e00.HTM Date accessed on: 21/12/08
Van Schooten, M., Vanclay, F. and Slootweg, R. (2003). Conceptualizing social change processes and social impacts. In Becker, H. and Vanclay, F. (Eds). The International Handbook of Social Impact Assessment, Cheltenham (UK): Edward Elgar, pp. 74-91.
Vanclay, F. (2003). International principles for Social Impact Assessment. Impact Assessment and ProjectAppraisal. Vol. 21, pp. 5-11.
Villa,F.,Tunesi,L.andAgardy,T.(2002).ZoningMarineProtectedAreas throughspatialmultiple-criteria analysis: the case of the Asinara Island National Marine Reserve of Italy. Conservation Biology, Vol. 16, No. 2.