social connections and incentives in the workplace ...uctpimr/research/social connections.pdf ·...
TRANSCRIPT

http://www.econometricsociety.org/
Econometrica, Vol. 77, No. 4 (July, 2009), 1047–1094
SOCIAL CONNECTIONS AND INCENTIVES IN THE WORKPLACE:EVIDENCE FROM PERSONNEL DATA
ORIANA BANDIERALondon School of Economics and Political Science, London WC2A 2AE, U.K.
IWAN BARANKAYThe Wharton School, University of Pennsylvania, Philadelphia, PA 19104, U.S.A.
IMRAN RASULUniversity College London, London WC1E 6BT, U.K.
The copyright to this Article is held by the Econometric Society. It may be downloaded,printed and reproduced only for educational or research purposes, including use in coursepacks. No downloading or copying may be done for any commercial purpose without theexplicit permission of the Econometric Society. For such commercial purposes contactthe Office of the Econometric Society (contact information may be found at the websitehttp://www.econometricsociety.org or in the back cover of Econometrica). This statement mustthe included on all copies of this Article that are made available electronically or in any otherformat.

Econometrica, Vol. 77, No. 4 (July, 2009), 1047–1094
SOCIAL CONNECTIONS AND INCENTIVES IN THE WORKPLACE:EVIDENCE FROM PERSONNEL DATA
BY ORIANA BANDIERA, IWAN BARANKAY, AND IMRAN RASUL1
We present evidence on the effect of social connections between workers and man-agers on productivity in the workplace. To evaluate whether the existence of social con-nections is beneficial to the firm’s overall performance, we explore how the effects ofsocial connections vary with the strength of managerial incentives and worker’s ability.To do so, we combine panel data on individual worker’s productivity from personnelrecords with a natural field experiment in which we engineered an exogenous changein managerial incentives, from fixed wages to bonuses based on the average produc-tivity of the workers managed. We find that when managers are paid fixed wages, theyfavor workers to whom they are socially connected irrespective of the worker’s abil-ity, but when they are paid performance bonuses, they target their effort toward highability workers irrespective of whether they are socially connected to them or not. Al-though social connections increase the performance of connected workers, we find thatfavoring connected workers is detrimental for the firm’s overall performance.
KEYWORDS: Favoritism, managerial incentives, natural field experiment.
1. INTRODUCTION
THIS PAPER EXPLORES the effects of social relationships between individualswithin a firm on the productivity of individuals and on the firm’s overall per-formance. The idea that human relations affect behavior in the workplace hasbeen long discussed in the sociology literature (Mayo (1933), Barnard (1938),Roethlisberger and Dickson (1939), and Roy (1952)). Economists have joinedthis debate relatively recently, due both to the burgeoning theoretical literatureon how social relations and social preferences matter for economic behavior,in general, and to the increasing availability of personnel data, in particular.
In the context of firms, much of the literature—theoretical and empirical—has studied the effect of social relations within a single tier of the firm hierar-chy, such as among managers or among workers.2 However, it is reasonable to
1Financial support from the ESRC is gratefully acknowledged. We thank a co-editor, threeanonymous referees, Simon Burgess, Arnaud Chevalier, Paul Grout, Costas Meghir, AntonioMerlo, Paul Oyer, Torsten Persson, Canice Prendergast, Kathryn Shaw, David Stromberg, JohnVan Reenen, Fabrizio Zilibotti, and numerous seminar and conference participants for commentsand suggestions that have helped improve the paper. Brandon R. Halcott provided excellent re-search assistance. We thank all those involved in providing the data. This paper has been screenedto ensure no confidential information is revealed. All errors remain our own.
2Lazear (1989), Kandel and Lazear (1992), and Rotemberg (1994) developed models incor-porating social concerns into the analysis of behavior within firms. While they emphasized thatindividuals have social concerns for others at the same tier of the firm hierarchy, their analysis isequally applicable across tiers of the hierarchy. Bewley (1999) offered extensive evidence frominterviews with managers arguing that concerns over fair outcomes for workers and the moraleof employees are important determinants of their behavior.
© 2009 The Econometric Society DOI: 10.3982/ECTA6496

1048 O. BANDIERA, I. BARANKAY, AND I. RASUL
expect that such social connections might also span across layers of the hierar-chy, in particular between managers and their subordinates, and this is likely tohave important consequences for individual and firm performance, the optimaldesign of compensation schemes, and the structure of organizations (Prender-gast and Topel (1996)).3
In general, social connections between managers and workers can help orharm firm performance. On the one hand, social connections may be benefi-cial to firm performance if they allow managers to provide nonmonetary in-centives to workers or help reduce informational asymmetries within the firm.On the other hand, managers may display favoritism toward workers they aresocially connected with, and this might be detrimental to the firm’s overall per-formance.4
In this paper, we present evidence on whether the existence of social con-nections between workers and managers affects the performance of connectedworkers and that of the firm as a whole. The firm we study is a leading producerof soft fruit in the United Kingdom. We focus on the behavior of individuals attwo tiers of the firm hierarchy—workers and managers. The main task of theworkers is to pick fruit, whereas managers are responsible for logistics. Two keyfeatures of this setting are that workers are paid piece rates and that manage-rial effort is complementary to worker effort and can be targeted to individualworkers. Taken together, these features imply managers can significantly influ-ence a worker’s productivity and hence his earnings.
Managers and workers are all hired for one fruit picking season. They areuniversity students from eight Eastern European countries and are thus of sim-ilar ages and backgrounds. In addition, they live on the farm site for the entireduration of their stay. Both features increase the likelihood of managers andworkers forming strong social connections with each other.
To measure social connections we exploit three sources of similarity betweenmanagers and workers—whether they are of the same nationality, whether theylive in close proximity to each other on the farm, and whether they arrived ata similar time on the farm. Our underlying assumption is that individuals aremore likely to befriend others if they are of the same nationality, if they areneighbors, or if they share early experiences in a new workplace.
To identify the effect of social connections we exploit two sources of vari-ation. First, the organization of the workplace is such that the allocation of
3A related theoretical literature emphasizes the inefficiencies that arise from collusion be-tween managers and workers (Tirole (1986), Kofman and Lawarrée (1993)) influence activitiesand other forms of rent seeking behavior by workers (Milgrom (1988), Milgrom and Roberts(1990)).
4Both the positive and negative effects of social connections have been stressed in the orga-nizational behavior and sociology literatures. Examples of such work includes that on the effectof manager–subordinate similarity on subjective outcomes such as performance evaluations andjob satisfaction (Tsui and O’Reilly (1989), Thomas (1990), Wesolowski and Mossholder (1997)),and on how social networks within-firm influence within-firm promotions (Podolny and Baron(1997)).

SOCIAL CONNECTIONS AND INCENTIVES 1049
workers to managers changes on a daily basis. We exploit this variation to iden-tify the effect of social connections from the comparison of the performanceof a given worker on days when he is socially connected to his manager anddays when he is not. Exploiting the within worker variation allows us to sepa-rate the effect of social connections from the effect of unobservable individualtraits, such as ability, that make workers more likely to befriend managers andto have higher performance regardless of their connections.
Similarly, as we observe the same manager managing both workers she issocially connected to and workers she is not connected to, we are also able tocontrol for time invariant sources of unobserved manager heterogeneity thataffect the productivity of connected and unconnected workers alike, such astheir management style or motivational skills.5
Second, we designed and implemented a field experiment to exogenouslyvary the strength of managerial incentives. In the experiment we changed themanagerial compensation scheme from fixed wages to the same level of fixedwages plus a performance bonus that is increasing in the average productivityof the workers on the field that day. Workers were paid according to the samecompensation scheme—piece rates—throughout.
The experiment allows us to identify whether and how the effect of socialconnections between the same managers and workers changes once managersare given performance pay, and thus provides an ideal counterfactual to assessthe effect of social connections on the overall firm’s performance. To be pre-cise, if the managers’ behavior toward connected workers changes once theirinterests are more closely aligned with the firm’s, their previous behavior un-der fixed wages could have not been maximizing the firm’s average productiv-ity. We provide further evidence on this issue by quantifying the net effect ofsocial connections on the firm’s overall performance.
Our main findings are as follows. First, when managers are paid fixed wages,the productivity of a given worker is 9% higher when he is socially connected tohis manager, relative to when he is not, all else equal. As workers are paid piecerates, this translates into the same proportionate change in earnings. Second,when managers are paid performance bonuses that tie their pay to the averageproductivity of workers they manage, being socially connected to the managerhas no effect on workers’ productivity.
Third, the introduction of managerial performance pay significantly de-creases the productivity of low ability workers when they are connected to theirmanager relative to when they were connected to their manager and she waspaid a fixed wage. The introduction of managerial performance pay increasesthe productivity of high ability workers, especially when they are not connected
5Our empirical strategy is informed by the evidence that individual “styles” of managers af-fect firm performance over and above firm level characteristics themselves (Bertrand and Schoar(2003), Malmendier and Tate (2005)).

1050 O. BANDIERA, I. BARANKAY, AND I. RASUL
to their managers. These findings indicate that when managers face low pow-ered incentives, they favor the workers they are socially connected to, regard-less of the workers’ ability. In contrast, when they face high powered incentives,managers favor high ability workers regardless of the workers’ connection sta-tus.
Fourth, an increase in the level of social connections between managers andworkers has a detrimental effect on the firms’ average productivity when man-agers are paid fixed wages and has no effect when managers are paid perfor-mance bonuses. In this setting, social connections are therefore detrimentalfor the firm because their existence distorts the allocation of managerial effortin favor of lower ability workers.
To the best of our knowledge, this paper is the first to provide quantita-tive evidence on the productivity effect of social connections across tiers ofthe firm hierarchy. The paper builds on our earlier findings on the effects ofthe introduction of high powered managerial incentives in the same setting(Bandiera, Barankay, and Rasul (2007)). The earlier paper focuses on the al-location of managerial effort under performance pay, irrespective of the socialconnections within the firm. The current paper provides novel evidence on theimportance of social connections in a firm setting, a previously unexplored de-terminant of managers’ behavior.
The paper contributes to the growing empirical evidence on the interplaybetween social networks and individual and firm performance. This literaturehas explored how the response of workers to incentives depends on their so-cial connections with their co-workers at the same tier of the firm hierarchy(Bandiera, Barankay, and Rasul (2005)), and how the demographic differ-ences between managers and their subordinates affect the subordinates’ rateof quits, dismissals and promotions (Giuliano, Levine, and Leonard (2005)).6�7
Our paper also relates to the literature on employee and employer discrimi-nation (Becker (1957)), and in particular to the findings of Black and Strahan(2001), who exploited a deregulation in product markets to show that whencompetition is low, firms favor male over female employees, both in terms ofwages and promotion prospects.
6Another branch of this literature has explored the effects of the CEO or managerial boardof firms being socially connected to those outside of the firm, such as local politicians and bu-reaucrats (Bertrand, Kramarz, Schoar, and Thesmar (2005), Kramarz and Thesmar (2005), Mianand Khwaja (2005)). In nonfirm settings, Garicano, Palacios, and Prendergast (2005) presentedevidence from soccer matches on how referees favor home teams in order to satisfy the crowds inthe stadium. Laband and Piette (1994) showed that journal editors use professional contacts toidentify high impact papers. In that context, favoritism thus reduces informational asymmetriesand is efficiency enhancing in the market for scientific knowledge.
7Fehr and Fischbacher (2002) provided an overview of the laboratory evidence on social pref-erences in workplace environments. One branch of this stems from Akerlof (1982) and Akerlofand Yellen (1988), who viewed the labor relation as a partial gift exchange. A separate branch ofthis experimental literature presents evidence that workers care about their pay relative to otherworkers (Charness and Kuhn (2005)).

SOCIAL CONNECTIONS AND INCENTIVES 1051
Finally, it is important to stress from the outset that as in all the studies usingdetailed data from one particular firm, precision comes at the cost of general-ity. In the last section we highlight the key characteristics of this workplace anddiscuss the external validity of our findings.
The paper is organized as follows. Section 2 describes our context and ex-perimental research design. Section 3 develops a theoretical framework tohighlight the central forces at play when social connections can have poten-tially positive and negative effects on worker productivity. Section 4 describesthe data and the identification strategy. Section 5 presents the main results onthe effect of social connections on worker productivity under each manager-ial incentive scheme. Section 6 then explores whether there are heterogeneouseffects of social connections across workers of different ability to derive im-plications for the firm’s overall productivity. Section 7 concludes. Proofs andfurther robustness checks are given in the Appendix.
2. THE CONTEXT AND EXPERIMENTAL DESIGN
2.1. Context
We analyze the behavior of managers and workers in the fruit picking divi-sion of a leading U.K. producer of soft fruit during the 2003 season. Workersand managers are hired from eight countries in Eastern Europe on seasonalcontracts that last between three and six months.8 To be recruited, individualsmust be full-time university students and have at least one year remaining be-fore graduation. Two features of the work environment increase the likelihoodof individuals forming strong social connections to each other: (i) workers andmanagers are of similar ages and have similar socioeconomic backgrounds;(ii) they live and work on the farm site for the entire duration of their stay,which on average is 100 days.
The workers’ primary task is to pick fruit. They typically pick on two or threedifferent fields each day. At the start of a field-day the manager allocates eachworker to a row of fruit to be picked. Once a worker clears this row, the man-ager is responsible for reallocating the worker to another row within the field.This process continues until all fruit within the field is picked. As each workerpicks on his own row, his productivity is independent of the efforts of otherworkers on the same field-day, so that there are no complementarities betweenworkers arising from the production technology. Workers do not choose howmany hours to work—all workers are present on the field-day for the numberof hours it takes to pick all the available fruit. Once a field is picked, work-ers and managers move on to other fields. As explained below, the match of
8Their work permit allows them to work on other U.K. farms subject to the approval of thepermit agency. Their outside option to employment at the farm is therefore to return home orto move to another farm during the season. Few workers are hired for consecutive seasons andworkers are not typically hired from the local labor market.

1052 O. BANDIERA, I. BARANKAY, AND I. RASUL
workers to managers can change across fields on the same day. The only choicevariable of workers is how much effort to exert into picking.9
Workers are paid a piece rate per kilogram of fruit picked. Each worker’s payis thus related to his productivity, which is an increasing function of his effort,the quantity of fruit available on the rows he is assigned, and the managerialeffort targeted toward him.
Managers are each assigned a group of around 20 workers, and their taskis to monitor the quality of fruit picking and to organize the field logisticsfor this group. Managers on the same field focus on their assigned group ofworkers and work independently of each other. Managers control quality onthree dimensions—that all ripe fruit is picked, that fruit is not damaged, andthat fruit is correctly classified by size. Field logistics include the allocation ofworkers to rows and organizing the movement of fruit from the field to thepackaging plant.10
The key choice variables of each manager are the allocation of workers torows and the allocation of effort among her workers. Managers are responsiblefor allocating workers to rows at the start of the field-day and for reallocatingworkers to new rows once they have finished picking the row they were orig-inally assigned. How the manager matches workers to rows is important be-cause there is considerable variation in the quantity of fruit across rows withina field. Some of this is due to the natural variation in fruit quantity on differentplants. This variation also stems from some rows being closer to pillars thatsupport the plastic covering over the field. Rows close to pillars are harder topick, air circulation is worse, and hence heat tends to accumulate. These fac-tors reduce the marginal productivity of worker’s effort in these rows, otherthings equal.
The manager chooses how to allocate her effort across workers along twodimensions. First, if several workers finish picking their rows at the same time,the manager has to decide who to reallocate to a new row first. Second, workersplace the fruit they have picked into crates. Once these are full, managers haveto ensure that new empty crates are provided to workers and that full crates areremoved from the field and shipped to the packaging plant. If several workerssimultaneously fill their crates, the manager chooses who to help first. In thisenvironment, managerial effort is therefore complementary to worker’s effort.
The effort costs to the manager are considerable because the workers she isresponsible for are dispersed over a large area. The median field size is such
9Work is offered on a casual basis with no daily guarantee of employment. In practice, man-agers manage each day, and workers are engaged in picking tasks every other day. On other daysworkers are asked to perform nonpicking tasks such as planting or weeding, or may be left un-employed for the day. Over the season, individuals are not observed moving across tiers of thehierarchy from picking tasks to managerial tasks or vice versa.
10A separate group of individuals, called field runners, are responsible for physically movingfruit from the field to the packaging plant. They do not themselves pick fruit nor do they manageworkers.

SOCIAL CONNECTIONS AND INCENTIVES 1053
that each manager has to cover an area of around one hectare. To ensure sheis aware of which workers need to be reallocated to new rows and which needtheir crates replaced, managers need to continuously walk around the field.11
Social connections between managers and workers can have two effects.First, if a manager is concerned about the pay of the workers she is sociallyconnected to, she can allocate more of her effort toward them, thus increas-ing their productivity and their earnings. The effect of managerial effort onworker productivity can be substantial. Assuming that workers pick at a con-stant speed, if the manager slacks for 5 minutes every hour and a worker is leftto wait for a new crate for the same time, his productivity would be 5/60 = 8%lower. Second, a manager might be better informed about the ability or skills ofworkers she is socially connected to or be able to exert stronger social pressureon them to work hard, both of which generate a difference in the allocation ofmanagerial effort between connected and unconnected workers.12
We now discuss the two features of this work environment that allow us toassess whether social connections shape the managers’ effort allocation choiceand, as a consequence, workers’ earnings, and how this depends on the com-pensation scheme in place for managers.
2.2. Key Feature 1: Natural Variation
The production technology is such that the demand and supply of pickinglabor varies across field-days. On any given field-day the demand for labordepends on the size of the field, on the orders received from supermarkets forthe specific variety of fruit grown on that field, and on the number of plants thathave reached maturity. This varies over time and declines during the life cycleof the field. The supply of labor depends on the demand for picking labor onother fields, which varies for the same reasons, and the demand for nonpickingtasks such as planting and weeding.13
Due to this natural variation, the number of workers and managers varieswithin the same field across different days and across different fields withinthe same day. Importantly for our study, this also implies that the same workercan be supervised by different managers on different field-days. In particular,a worker can be supervised by a manager he is socially connected to on some
11The disposition of plants in the field is such that it is not practical for workers to retain astock of empty crates.
12In principle, a manager could boost connected workers’ productivity by letting them slack onquality, namely by allowing connected workers to leave hard to reach fruits on the plants. In prac-tice, however, this is unlikely to be the case for two reasons. First, damaged or misclassified fruitis identified at the packing stage of the production process. The monitoring system in place thenallows senior management to attribute fruit quality to individual managers. Second, a permanentemployee of the farm checks that no ripe fruit is left on the plants at the end of each day.
13The fruit is planted some years in advance, so the quantity of fruit to be picked is given. Theorder in which fields are picked is decided at the start of the season.

1054 O. BANDIERA, I. BARANKAY, AND I. RASUL
field-days and by another manager that he is not socially connected to on oth-ers.
Managers and workers are allocated to fields by a higher tier permanentemployee of the farm, who we refer to as the chief operating officer (COO).14
2.3. Key Feature 2: The Experimental Research Design
We designed and implemented a field experiment in which we exogenouslychanged the compensation scheme of the managers and the COO. At the startof the 2003 season, the managers and the COO were paid a fixed wage. Midwaythrough the 2003 season, we added a performance bonus to the same levelof fixed wages. The experiment left the compensation scheme of the workersunchanged—workers were paid piece rates throughout the 2003 season.15
The bonus payment was awarded on field f and day t if the workers’ aver-age productivity on the field-day, Yft , exceeded an exogenously fixed thresh-old Y ∗. Conditional on reaching the threshold, the total monetary value of thebonus payment available to the managers, B(Yft), increases at an increasingrate in the average field-day productivity. The personnel software does not al-low the exact match between workers and managers within the field-day to berecorded, but it does record the identity of all the managers and all the work-ers on the field-day. Each manager then obtains an equal share of the bonuspayment generated on the field-day. If there are Mft managers present, eachobtains a payment of (1/Mft)B(Y ft).16
14Section 4 makes precise the underlying assumptions that allow us to exploit this source ofvariation to identify the effects of social connections in the workplace. In the Appendix we presentevidence in support of these identifying assumptions.
15The change was announced to the COO and managers a week in advance of the actualchange. During this week, we spent time going through numerical examples with managementto make sure they understood how the performance bonus would be calculated. Workers werenot informed of the change in managerial compensation, but given that managers and workerslive on the farm, they are likely to have understood the change over time.
16The bonus payment schedule is piecewise linear:
B(Yft)=
⎧⎪⎪⎨⎪⎪⎩
0 if Y ∗ >Yft ,a1 + b1Yft if Y ∗ + c1 >Yft ≥ Y ∗,a2 + b2Yft if Y ∗ + c2 >Yft ≥ Y ∗ + c1,a3 + b3Yft if Yft > Y ∗ + c2,
where ai , bi , and ci are constants such that a3 < a2 < a1, b3 > b2 > b1, c2 > c1. This reflects thefact that the marginal cost of supplying managerial effort is increasing. The parameters ai , bi , andci are set such that B(Y ft) is a continuous and convex function. The values of ai , bi , ci , and Y ∗
cannot be provided due to confidentiality. Finally, we note that since the bonus payment is sharedby all managers on a field, free-riding might reduce the strength of incentives. Three features ofthis context make free-riding unlikely: (i) there are between two and four managers on most field-days; (ii) managers can monitor each other on the field; (iii) managers interact repeatedly bothon and off the field.

SOCIAL CONNECTIONS AND INCENTIVES 1055
The daily bonus payment that accrues to the COO for any given fieldis 1.5 times that which accrues to a manager on the field. Moreover, sincethe COO is responsible for every field operated on a given day, his bonusequals the sum across all fields operated that day and is therefore equal to1�5
∑f (1/Mft)B(Y ft).
The introduction of the bonus might affect managers’ behavior throughthree channels: (i) because they now have a stake in the firm’s productivity,(ii) because the COO might exert more pressure to maximize his bonus pay-ments, and (iii) because of increased competition for managerial jobs. Indeed,given that the quantity of fruit to be picked is constant, if the introduction ofthe bonus increases productivity, the demand for picking and managerial la-bor might fall as fewer workers are needed to pick the same amount. All threechannels lead managers to take actions that increase the firm’s productivity.
Finally, to avoid multitasking concerns (Holmstrom and Milgrom (1991)),the performance bonus was not awarded if the quality of fruit pickingdeclined.17
The fraction of field-days on which the bonus was earned varies from 20 to50% across managers. The ex post monetary value of the performance bonusto managers is substantial. Averaged across all field-days worked under thebonus, managerial hourly earnings increased by 7%. Conditional on obtainingthe bonus, managerial hourly earnings increased by 25%. The true expectedhourly earnings increase to managers of the performance bonus lies betweenthese bounds.18�19
To identify whether managers allocate more effort to workers they are so-cially connected to, we compare the productivity of the same worker on field-days in which he is socially connected to his manager and his productivity onfield-days in which he is not socially connected to his manager. We exploit theexogenous variation in managerial incentives our research design provides toidentify whether the effects of social connections depend on the managerial in-
17Quality is defined along two dimensions: (i) the quantity of damaged fruit; (ii) classificationas either suitable for market or supermarket, largely based on the size of each fruit. If the per-centage of damaged or misclassified fruit rose by more than 2% from a preestablished norm, thenthe bonus was not awarded.
18Given that (i) managers are from Eastern Europe, (ii) their base pay is 20% higher thanthe U.K. minimum wage, and (iii) most individuals save earnings to spend later in their homecountry, these increases in hourly earnings translate into large increases in real income. As ofJanuary 2003, gross monthly earnings at the U.K. minimum wage (€1105) are 5 times as high asat the minimum wage in Poland (€201), where 40% of managers come from, and almost 20 timeshigher than in Bulgaria (€56), where 30% of managers come from.
19The managers were unaware they were taking part in an experiment and that the data wouldbe used for scientific research. As such, our experiment is a natural field experiment according tothe taxonomy of Harrison and List (2004). The managers were, however, aware that productivitydata were recorded and kept by the farm owner, and that the data would be analyzed to improvethe firms’ overall efficiency.

1056 O. BANDIERA, I. BARANKAY, AND I. RASUL
centive scheme in place. The comparison allows us to establish whether socialconnections are beneficial or detrimental to the firm’s overall performance asexplained in the next section.
3. THEORETICAL FRAMEWORK
We present a simple theoretical framework to illustrate the effect of socialconnections on the level and allocation of managerial effort across workers,and on firm productivity. The framework illustrates that the existence of socialconnections weakly increases managerial effort, but also changes the allocationof effort in favor of workers the manager is socially connected to. The net effecton the firm’s aggregate productivity is ambiguous. The framework makes pre-cise how we can sign the allocation effect by exploiting the exogenous changein the strength of managerial incentives.
3.1. Technology and Incentives
We assume production requires one manager and two workers in any givenfield. Workers pick fruit and the manager organizes logistics for each worker.The manager chooses her level of effort and how to allocate it between theworkers. To make matters concrete, the managerial effort directed toward aworker can be thought of as the effort devoted to ensure he is allocated a newrow of fruit as soon as he is done picking the current one or the effort devotedto ensure he does not have to wait for his crates to be replaced.
For simplicity and without loss of generality, we do not model workers’ ef-fort choices. Also, for simplicity we assume the manager’s effort targeted to-ward worker i affects worker i alone. The output of worker i is then givenby yi = θikimi, where θi measures his innate ability, mi is the managerial efforttargeted toward him, and ki > 0 is a measure of the strength of the complemen-tarity between the manager’s and worker’s efforts. We assume the two workershave ability levels θ and 1, with θ > 1, and index them with subscripts h and lfor high and low ability, respectively.20
Managerial effort takes two values, high (m = m > 1) and low (m = 1). Thedisutility of effort to the manager, C(m), equals 0 if effort is low and is greaterthan 0 if effort is high.21
20The qualitative results are unchanged if we allow workers to also choose effort. The quali-tative results are also unchanged if we allow mi to have a positive spillover effect on the outputof the nontargeted worker j, as long as the direct effect of mj on the productivity of worker j issufficiently stronger than the effect of mi on j.
21The assumption reflects the fact that in our setting the manager’s cost of effort depends ontotal effort rather than on the identity of the workers targeted. Namely the cost of moving aroundthe field to identify which crates to replace and which workers to reallocate does not depend onthe ability of the worker who gets reallocated.

SOCIAL CONNECTIONS AND INCENTIVES 1057
The productivity of worker i is measured as the kilograms of fruit picked perhour. As all workers in the field work for the same time, we normalize hoursto 1 so output and productivity coincide. Total output is
∑i yi as there are no
spillovers across workers or complementarities in production.As in our empirical setting, we assume worker i’s pay, pW
i , equals his pro-ductivity, yi, to reflect the fact that workers are paid piece rates, and hencetheir earnings are a linear function of their productivity. The manager’s com-pensation schedule is pM = f + bY , where f is a fixed wage and Y = ∑
i yi isthe aggregate output of her subordinates. The parameter b ≥ 0 captures thestrength of managerial incentives, namely the variable component of manage-rial pay which is linearly related to aggregate worker productivity.
3.2. Social Connections
Social connections can affect in reduced form both agents’ preferences andthe production technology. To capture the first channel, we follow Prendergastand Topel (1996) in assuming the manager’s utility depends on her pay and thepay of her subordinates, that is,
uM = pM +∑i∈(h�l)
σipWi �(1)
where σi measures the social connection between the manager and worker i.We assume that σi = σ > 0 if worker i is connected to the manager while σi = 0if he is not. These preferences can be seen to represent managers’ altruismtoward their subordinates, but also as the reduced form of a model in whichthe manager cares about the connected workers’ earnings because she receiveskickbacks from them.22
If social connections ameliorate the moral hazard problem between themanager and workers, or if they help foster cooperation or improve commu-nication between managers and workers, they affect workers’ productivity di-rectly. To capture this second channel, we assume the strength of the com-plementarity between managerial and worker effort depends on their socialconnections. That is, given worker i’s productivity, yi = θikimi, we assumeki = k > 1 if worker i is connected to the manager (σi = σ), while ki = 1 ifhe is not (σi = 0).
22We focus on whether managers and workers are socially connected or not, rather than onthe strength of the social connection. What matters for the analysis is that managers may beconnected to a greater extent to some workers than to others. We also focus on the case in whichσ ≥ 0. A negative weight could be interpreted as the manager being spiteful toward the worker.

1058 O. BANDIERA, I. BARANKAY, AND I. RASUL
3.3. The Manager’s Effort and Allocation Choices
The manager chooses (mh�ml), namely how much effort to allocate to thehigh and low ability worker, to maximize her utility, as given in (1). Substitutingfor the manager’s and workers’ pay, the manager’s problem is
maxmh�ml
(b+ σh)θk(σh)mh + (b+ σl)k(σl)ml −C(mh +ml)�(2)
The two propositions below describe the effect of social connections on man-agerial effort and, hence, on the firm’s productivity, respectively. All proofs aregiven in the Appendix.
PROPOSITION 1: Social connections weakly increase the level of managerialeffort and might alter the allocation of effort in favor of the worker the manager issocially connected to.
The existence of social connections implies σi > 0 and k(σi) > 1. Thus so-cial connections raise the marginal benefit of effort both because the man-ager internalizes the effect of her effort on the connected worker earnings andbecause the marginal effect of managerial effort on worker’s productivity ishigher when the manager and the worker are socially connected. Other thingsequal, social connections therefore have an unambiguous effect on the levelof effort, namely a manager is more likely to choose m = m, when she is so-cially connected to one or both workers. This follows immediately from thefact that since both the production and the cost of effort functions are linearin (mh�ml), and there are no spillovers across workers, the manager’s utilityfunction (2) is linear in (mh�ml). This implies that, regardless of the level ofeffort chosen, the manager will target only the worker who yields the highestmarginal benefit.23
Social connections, however, affect the allocation of managerial effort. In-deed, the marginal benefit of targeting worker i is equal to (b+σi)k(σi); thus,other things being equal, the manager is more likely to target worker i if σi > 0and k(σi) > 0. Therefore, social connections also have an allocation effect onmanagerial effort. In the Appendix we show that (i) if the manager is con-nected to the high ability worker, she always targets him; (ii) if the manager isconnected to the low ability worker, there exists a set of parameters for whichshe targets her effort toward him.
In this second case, social connections distort the allocation of managerialeffort toward low ability workers and might therefore be detrimental to thefirm overall. Whether social connections are beneficial or detrimental for the
23The manager chooses m if and only if {max[θkh(b+σh)�kl(b+σl)]}(m− 1) > c. The right-hand side is increasing in (σh�σl). In a model with continuous managerial effort and convex costs,the effect of social connections on managerial effort would be strictly positive.

SOCIAL CONNECTIONS AND INCENTIVES 1059
firm in this case depends on the sign and relative magnitude of the level andallocation effects as described in the following result.
PROPOSITION 2: If the manager is connected to the high ability worker, socialconnections have an unambiguously positive effect on the firm’s productivity. If themanager is connected only to the low ability worker, the effect of social connec-tions on the firm’s productivity is ambiguous. It is more likely to be negative if thecomplementarity with the connected worker is low or if the difference in workers’ability is large.
To summarize, the existence of social connections has both a level effectand an allocation effect on managerial effort. As the firm’s productivity is in-creasing in managerial effort and social connections weakly increase effort, thelevel effect of social connections is always weakly positive. The sign of the al-location effect is, however, ambiguous. If the manager is connected only to thehigh ability worker, she targets him and the allocation effect is positive. In theAppendix we provide the precise conditions under which if the manager is con-nected only to the low ability worker, she targets him and the allocation effectis negative.24
3.4. Testing for a Negative Allocation Effect
The framework above makes precise that social connections can be detri-mental for the firm only if their existence distorts the allocation of managerialeffort in favor of low ability workers who are connected to managers. We nowshow that an exogenous change in the strength of managerial incentives b canbe used to test whether the allocation effect is negative. The test relies on twosources of variation: the variation in the strength of managerial incentives andthe variation in social connections. The first stems from the fact that the pro-ductivity of the same workers is measured both when managerial incentives arelow powered (fixed wage) and when they are high powered (bonus scheme).The second stems from the fact that the productivity of the same workers isobserved both on field-days when they are socially connected to managers andon field-days in which they are not while their co-workers are.
An increase in b increases both the marginal benefit of effort and the relativeweight the manager places on productivity vis-à-vis the utility of the connectedworkers. Increasing b can thus affect both the level and the allocation of man-agerial effort. Our empirical test is then based on a revealed preference argu-ment: if the manager changes her effort allocation from the low to the highability worker when she has a larger stake in the firm’s productivity, namely
24Note that since manager’s pay is increasing in productivity, social connections affect the wagebill. Thus even if social connections increase the firm’s productivity, they might reduce the firm’sprofits.

1060 O. BANDIERA, I. BARANKAY, AND I. RASUL
when the performance bonus is in place, the allocation of managerial effortacross workers under the wage regime could have not been maximizing pro-ductivity. The test then consists of measuring the effect of social connectionson connected workers of different ability by managerial incentive scheme andtesting whether the manager reallocates effort from low to high ability workersas a result of the increase in the strength of her incentives, b.
If the allocation effect is indeed detrimental to productivity, the allocationof effort should depend on the managerial incentive scheme as follows. First,when the manager is paid a fixed wage, she should target connected workersregardless of their ability. Hence, the productivity of both low and high abilityworkers should be higher when they are connected to their manager comparedto when they are not. Second, when the manager is paid performance bonuses,she should target high ability workers regardless of their connections. Hencethe introduction of the bonus should (i) strictly increase the productivity of highability workers on field-days in which they are not connected and (ii) strictlydecrease the productivity of the low ability workers on field-days in which theyare connected.
Finding evidence consistent with these predictions would provide supportfor the hypothesis that social connections have a negative allocation effect onproductivity against the joint alternative hypotheses that the allocation effectis nonnegative or that the increase in b is not sufficiently large to change man-agerial behavior. Finally, we present evidence on the net effect of social con-nections on productivity by incentive scheme. This allows us to gauge whetherany beneficial levels effect of social connections on managerial effort morethan offset the distortionary effects they have on the allocation of managerialeffort.
4. DATA AND DESCRIPTIVES
4.1. Data Sources
Our primary data source is the firm’s personnel records. These contain threetypes of information. First, they list each worker’s productivity on every field-day they pick fruit. Productivity is defined as the kilograms of fruit pickedper hour and is electronically recorded with little measurement error. Second,while they do not contain information on the exact worker–manager match,the data identify all the workers and managers present on each field-day. Onmost field-days there are between 40 and 80 workers, and between 2 and 4managers, so we are able to build a measure of the probability that a givenworker–manager pair is matched. Finally, the personnel records contain infor-mation on each individual’s nationality, date of arrival, and accommodationlocation on the farm, which we use to measure social connections as describedbelow.
Throughout, we analyze data on the main fruit type and focus on the mainfarm site during the peak picking season from May 1st until August 31st 2003.

SOCIAL CONNECTIONS AND INCENTIVES 1061
As part of our experimental design, the change in managerial incentives oc-curred midway through the peak season—June 27th—so there are 43 days inthe prebonus period and 51 days postbonus. To ensure that changes in fieldcomposition do not drive the results, we focus on fields that were picked atleast one week either side of the change in managerial incentives. Note thata given field is not picked on every day and more than one field is picked onany given day. To ensure our estimates are not contaminated by changes in thecomposition of the workforce over the season, we restrict the sample to indi-viduals who work at least one week either side of the change in managerialincentives. The final sample then contains 10,148 worker-field-day productiv-ity observations from 241 field-days. This covers 144 workers, 10 managers, 13fields, and 94 days.25
4.2. Measuring Social Connections
We measure social connections between managers and workers along threedimensions: nationality, time of arrival on the farm, and the location on thefarm where individuals reside during the season.
The first measure defines a worker and manager to be connected if they areof the same nationality, based on the assumption that people are more likely tobefriend others who come from the same country and share the same mothertongue. As individuals are hired from eight Eastern European countries, weobserve considerable variation along this dimension.26
The second measure of social connections is based on the time that indi-viduals arrive on the farm. This varies across individuals for reasons that areexogenous to the worker’s performance, such as their university term dates intheir home countries and the date on which their work permit is issued. On ar-rival, individuals are consecutively assigned a worker number and then attendan induction program with others who have arrived at a similar time. Hencethe first group of people that each individual is exposed to, and may form so-cial ties with, are those who arrive on a similar date. If two individuals havea worker number within the same 10 digit window, we define the two to besocially connected through their arrival cohort.
The third measure of social connections is based on the geographic locationwhere individuals live during their stay on the farm. Each worker lives in acaravan with up to five others, and each caravan is assigned a unique number.On the main farm site, caravans are arranged around a communal space and
25Fields are located on two sites on the farm, of which we only use the largest for the analysis asfruit in the smaller site began to ripen only after the introduction of the managerial performancebonus scheme.
26Among workers, the most common nationalities are Polish (35%), followed by Ukrainian(29%) and Bulgarian (10%). Among managers, 40% are Polish, 30% are Bulgarian, and theothers are Lithuanian.

1062 O. BANDIERA, I. BARANKAY, AND I. RASUL
numbered consecutively from 1 to 46. We define two individuals to be sociallyconnected through their living site if they live within five caravan numbers ofeach other. The underlying assumption is that individuals are more likely toform social ties with their neighbors.27
While we do not have direct information on the social relations betweenmanagers and workers, we can provide evidence that the three measures ofsimilarity—nationality, arrival cohort, and neighborhood—are predictors offriendship in this setting. In 2004, that is one year after the season we analyzehere, we administered a worker survey to workers in the same farm to collectinformation about friendship links. Using those data, in Bandiera, Barankay,and Rasul (2009) we found that the odds of a worker j to be named as a friendby another worker i if they are of the same nationality is 14.7 times larger thanthe odds of worker j being named by i if they are of different nationalities.The corresponding figures for arrival cohort and geographical neighborhoodare 14.3 and 9.7. These odds are all significantly different from 1, and the re-sults are robust to conditioning on a host of other controls for the similarity inobservables between workers.
Based on these three criteria of similarity, most workers are connected to atleast one manager along at least one dimension. Of the 10,148 worker-field-day observations in our sample, 8884 correspond to workers who are sociallyconnected to managers. We therefore identify the causal effect of social con-nections on worker performance from the observed within worker variation inproductivity. In other words, instead of comparing the productivity of workerswho are connected to the productivity of workers who are not, we identify theeffect of social connections by comparing the productivity of the same workeron field-days in which he is connected to his manager, to his productivity onfield-days in which he is not connected. Since workers who are never connectedto any manager do not contribute to these estimates, we restrict the sample tothe 8884 worker-field-day observations of workers who are socially connectedto at least one manager on the farm.28
To measure whether a worker is connected to his manager on any given field-day we first define cij = 1 if worker i and manager j are connected along anydimension and = 0 otherwise. Second, we note that while each worker is as-signed to only one manager, we do not know the exact match of workers tomanagers within the field. On most field-days there are between 2 and 4 man-agers and between 40 and 80 workers present. Given Mft managers present onthe field-day, we can compute the probability that worker i is connected to hismanager as the share of managers worker i is connected to on the field-day,
27There are no opportunities for workers themselves to choose their caravan or worker num-bers.
28Unconnected workers are, however, not significantly different from connected workers onobservables such as age, gender, and previous work experience.

SOCIAL CONNECTIONS AND INCENTIVES 1063
Cif t = (∑
j cij)/Mft , where the summation in the numerator is over all man-agers j on field-day f t.29
4.3. Descriptives
Table I reports descriptive statistics for our variable of interest Cif t , the shareof managers on field-day f t that are socially connected to worker i. The firstrow shows that, on average, the share is .425 when managers are paid fixedwages and .412 when managers are paid performance bonuses. The fact thatthe shares are almost identical under the two compensation schemes suggeststhat the process by which managers and workers are allocated to fields is or-thogonal to the compensation scheme in place.
The empirical analysis exploits the variation in social connections within aworker over time. Table I shows that, reassuringly, at least one-third of theoverall variation in social connections arises from variation within a worker
TABLE I
DESCRIPTIVES ON THE SOCIAL CONNECTIVITY BETWEEN WORKERS AND MANAGERS BYMANAGERIAL INCENTIVE SCHEMEa
Managerial Incentive Scheme
Share of Managers Fixed Wages Performance Bonus
Connected to i (Cif t) .425 .412(.297) (.300)[.196] [.154]
Who are the same nationality as i .304 .285(.344) (.319)[.145] [.111]
Who are in the same living area as i .139 .138(.116) (.172)[.167] [.138]
Who are from the same arrival cohort as i .038 .056(.076) (.101)[.079] [.074]
aAll variables are defined at the worker-field-day level. Means, standard deviation between workers is in paren-theses, and standard deviation within worker is in brackets. A manager and worker are defined to be resident in thesame living area if they live within five caravans from each other on the farm. A manager and worker are defined tobe in the same arrival cohort if they have identification numbers within the same 10 digit window. A manager andgiven worker i are defined to be connected if they are either of the same nationality, live in the same area, or arein the same arrival cohort. The sample is restricted to the 129 workers who work for at least one week under bothincentive schemes and are connected to at least one manager on at least one dimension. On average, each worker isobserved picking on 41 field-days when managers are paid fixed wages and 30 field-days when managers are paid aperformance bonus. Overall there are 5137 worker-field-day observations when managers are paid fixed wages, and3747 worker-field-day observations when managers are paid a performance bonus.
29The median number of managers and workers is 3 and 59, respectively. Field-days with lessthan 4 managers account for 83% of the sample.
1064 O. BANDIERA, I. BARANKAY, AND I. RASUL
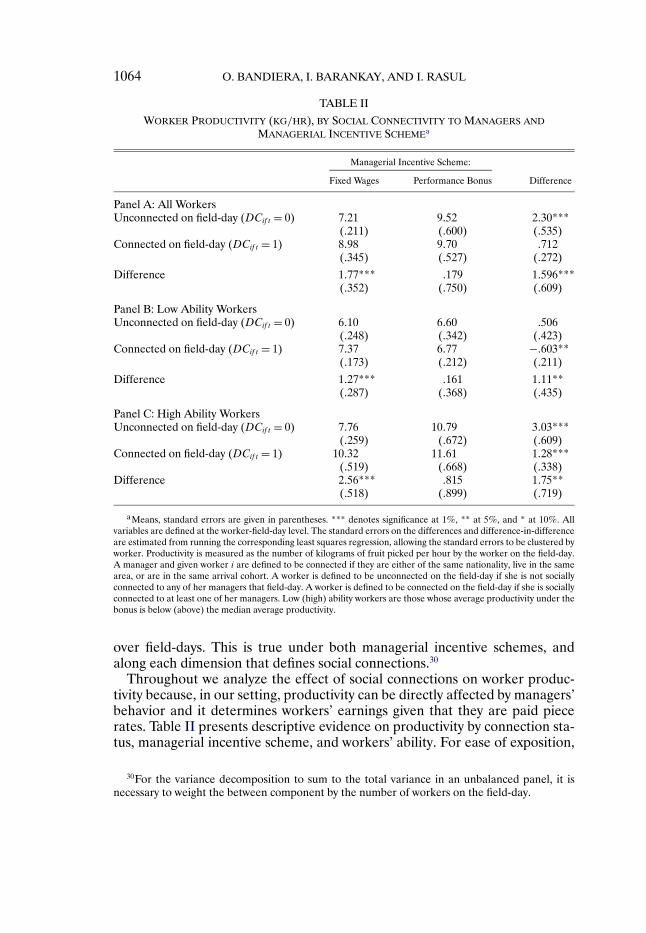
TABLE II
WORKER PRODUCTIVITY (KG/HR), BY SOCIAL CONNECTIVITY TO MANAGERS ANDMANAGERIAL INCENTIVE SCHEMEa
Managerial Incentive Scheme:
Fixed Wages Performance Bonus Difference
Panel A: All WorkersUnconnected on field-day (DCif t = 0) 7�21 9�52 2�30***
(�211) (�600) (�535)Connected on field-day (DCif t = 1) 8�98 9�70 �712
(�345) (�527) (�272)
Difference 1�77*** �179 1�596***(�352) (�750) (�609)
Panel B: Low Ability WorkersUnconnected on field-day (DCif t = 0) 6�10 6�60 �506
(�248) (�342) (�423)Connected on field-day (DCif t = 1) 7�37 6�77 −�603**
(�173) (�212) (�211)
Difference 1�27*** �161 1�11**(�287) (�368) (�435)
Panel C: High Ability WorkersUnconnected on field-day (DCif t = 0) 7�76 10�79 3�03***
(�259) (�672) (�609)Connected on field-day (DCif t = 1) 10�32 11�61 1�28***
(�519) (�668) (�338)Difference 2�56*** �815 1�75**
(�518) (�899) (�719)
aMeans, standard errors are given in parentheses. *** denotes significance at 1%, ** at 5%, and * at 10%. Allvariables are defined at the worker-field-day level. The standard errors on the differences and difference-in-differenceare estimated from running the corresponding least squares regression, allowing the standard errors to be clustered byworker. Productivity is measured as the number of kilograms of fruit picked per hour by the worker on the field-day.A manager and given worker i are defined to be connected if they are either of the same nationality, live in the samearea, or are in the same arrival cohort. A worker is defined to be unconnected on the field-day if she is not sociallyconnected to any of her managers that field-day. A worker is defined to be connected on the field-day if she is sociallyconnected to at least one of her managers. Low (high) ability workers are those whose average productivity under thebonus is below (above) the median average productivity.
over field-days. This is true under both managerial incentive schemes, andalong each dimension that defines social connections.30
Throughout we analyze the effect of social connections on worker produc-tivity because, in our setting, productivity can be directly affected by managers’behavior and it determines workers’ earnings given that they are paid piecerates. Table II presents descriptive evidence on productivity by connection sta-tus, managerial incentive scheme, and workers’ ability. For ease of exposition,
30For the variance decomposition to sum to the total variance in an unbalanced panel, it isnecessary to weight the between component by the number of workers on the field-day.

SOCIAL CONNECTIONS AND INCENTIVES 1065
we employ a discrete measure of social connections, DCift , which is equal to 1if worker i is connected to at least one manager on field-day f t and equal to 0otherwise. To analyze whether the effect of connections differs by workers’ability, we rank workers according their average productivity when managersare paid bonuses and use the median to split them into two ability groups.31
Panel A of Table II pools all workers and illustrates that when managersare paid fixed wages, worker productivity is 7.21 kg/hr when workers are un-connected and rises significantly to 8.98 kg/hr when workers are managed byindividuals they are socially connected to. In contrast, when managers are paidbonuses, the average worker’s productivity is no different on field-days when heis socially connected to field-days when he is socially unconnected. The uncon-ditional difference-in-difference in workers’ productivity by their social con-nections to managers and across managerial incentive scheme is 1.59 kg/hr,and is significantly different from zero. As workers are paid piece rates, differ-ences in worker productivity by social connectivity to managers and managerialincentive scheme translate into similar differences in worker earnings. This isquantitatively important both in percentage terms and in absolute terms whenaggregated over the season.32
As highlighted by the theoretical framework in Section 3, the evidence inpanel A is consistent with two interpretations of managers’ behavior followingthe introduction of the bonus: either managers exert more effort and targetall workers regardless of their connection status, or managers exert more ef-fort and reallocate it from connected workers toward high ability workers tomaximize average productivity. To distinguish between these interpretations,panels B and C provide evidence on the effect of social connections on work-ers who are below and above the median level of ability, respectively. Threepoints are of note.
First, when managers are paid fixed wages, the first data column in pan-els B and C shows that social connections increase worker productivity for bothgroups, suggesting that managers target connected workers regardless of theirability level.
Second, panel B shows that the introduction of the bonus does not affectthe productivity of low ability workers in days in which they are not connected,
31The theoretical framework makes clear that the probability of social connections affectingthe managers’ allocation decisions is decreasing in the strength of managerial incentives. Thus ifsocial connections affect productivity only when managers are paid fixed wages, the productivityunder the bonus better reflects a worker’s true ability. It is important to note that there is littlechurning of workers in this ranking—the rank correlation between workers’ average productivitywhen managers are paid wages and when managers are paid bonuses is .69.
32The average worker picks on two to three fields per day and stays on the farm for 100 days.A back of the envelope calculation suggests that over the course of a season, a worker wouldearn £500 more if managers were always paid a fixed wage and workers were always managedby individuals they are socially connected to. Given that workers in our sample live in EasternEurope and much of their earnings are saved to spend in their home country, the real value ofthese differences is substantial.

1066 O. BANDIERA, I. BARANKAY, AND I. RASUL
while it reduces their productivity by around 8% on connected field-days. Thisis consistent with the view that managers target low ability connected workerswhen paid fixed wages, but stop engaging in such behavior when paid bonuses.Consequently, the productivity of low ability workers when managed by thosethey are connected to significantly falls as managers interests become morealigned with those of the firm.
Third, panel C shows the introduction of managerial performance bonusesincreases the productivity of high ability workers both on field-days in whichthey are unconnected and on field-days in which they are connected. The ef-fect on unconnected field-days is more than twice as large as the effect onconnected field-days, and the difference-in-difference is positive and preciselyestimated. This indicates that the introduction of the bonus increases the pro-ductivity of high ability workers because managers’ efforts are both higher andmore likely to be targeted toward them.
Overall, the evidence in Table II indicates that managers target connectedworkers irrespective of their ability when paid fixed wages, whereas they re-allocate their efforts in favor of high ability workers when paid performancebonuses irrespective of whether they are socially connected to them or not.This suggests that social connections distort the allocation of managerial effortacross workers and that this effect is detrimental to the firm’s productivity asmanagers stop targeting connected workers when their interests become moreclosely aligned with the firms’.
In the remainder of the paper, we present formal evidence to shed light onwhether these descriptive results are robust to controlling for other determi-nants of productivity. In doing so, we make precise the underlying identifyingassumptions required to interpret this evidence as causal and present evidencein support of these identifying assumptions.
5. SOCIAL CONNECTIONS AND WORKER PRODUCTIVITY
5.1. Methodology
The empirical analysis proceeds in two stages. First, we estimate the effectof social connections on the average worker by managerial incentive scheme.Next, we allow the effect of social connections and managerial incentives todiffer across workers. To identify whether social connections affect worker’sproductivity and how this depends on the managerial compensation scheme inplace, we estimate the panel data regression
yif t = αi + λf + γ0(1 −Bt)×Cif t + γ1(Bt ×Cif t)+ ρBt(3)
+∑k
∑d∈Nk
τkd(Bt ×Dk
id)+∑s∈Mft
μsSsf t
+ δXif t +ηZft +ϕt + uif t�

SOCIAL CONNECTIONS AND INCENTIVES 1067
where yif t is worker i’s log productivity on field f and day t. The worker fixedeffects αi account for permanent productivity differences across workers, suchas those arising from innate ability or motivation, and the field fixed effects λf
capture permanent productivity differences across fields, such as those arisingfrom soil quality.33
Cif t is the log of the share of managers worker i is socially connected to onthe field-day. Bt is a dummy variable equal to 1 after the performance bonusis introduced (June 27th) and equal to 0 otherwise. The parameters of inter-est throughout are γ0, which measures the effect of social connections whenmanagers are paid a fixed wage, and γ1, which measures the effect of socialconnections when managers are paid performance bonuses. The null hypothe-sis is that social connections do not affect productivity, so γ0 = γ1 = 0.
Since connectivity is defined along the lines of nationality, living site, andarrival cohort, γ0 and γ1 might be biased if, for example, the introduction ofthe bonus has different effects on workers of different nationalities. This is be-cause the connection measure Cif t would then also be picking up any differen-tial effect of the performance bonus by worker nationality. Obviously, similarconcerns arise if workers are differentially affected on the basis of their livingsite or time of arrival on the farm once managerial performance bonuses areintroduced. To address these concerns, we control for a set of interactions be-tween the performance bonus dummy Bt and the complete set of nationality,arrival cohort, and living site dummies.
To do so we define a dummy variable Dkid = 1 if worker i is of type d along di-
mension k and = 0 otherwise, and Nk denotes the total number of types alongdimension k. For example, when k is nationality, Dk
id = 1 when the worker is ofnationality d, and Nk = 8 as this is the number of different nationalities in ourdata. These interactions flexibly control for any heterogenous effect on workersof the change in managerial incentives along these dimensions. Hence we esti-mate the effect of the within worker variation in social connectivity conditionalon any heterogeneous effects between workers that may arise as managers re-spond to the introduction of performance bonuses along other margins apartfrom those arising from social connections with their subordinates.Ssf t is a dummy equal to 1 if manager s works on field f on day t and equal to
0 otherwise, and Mft is the set of managers who work on the field-day. Hence∑s∈Mft
μsSsf t in (3) corresponds to a full set of manager dummies. These con-trol for time invariant traits of each manager, such as their ability to motivateworkers and their management style, that affect the performance of managedworkers. These allow us to address the concern that there are unobservable
33If this specification is estimated only with worker fixed effects, they explain 25% of the vari-ation in worker productivity, suggesting there is considerable heterogeneity across workers. Esti-mating the specification conditional on only field fixed effects explains 11% of the overall varia-tion. Estimating the specification conditional only on manager fixed effects explains 3.5% of theoverall variation.

1068 O. BANDIERA, I. BARANKAY, AND I. RASUL
managers’ characteristics that drive both their social connections and the per-formance of their subordinates.Xift is the worker’s picking experience, defined as the cumulative number of
field-days they have picked fruit on the farm. Zft captures time-varying fieldcharacteristics. This includes the field’s life cycle, defined as the nth day thefield is picked divided by the total number of days the field is picked over theseason. This captures the natural within field trend in productivity as fieldsdeplete over time. We also include a time trend t to capture learning by farmmanagement and any aggregate trends in productivity.34
We also note that the social connections between a worker and his managersare unlikely to be identically and independently distributed within a workerover field-days. We therefore adopt a conservative strategy in estimating stan-dard errors and allow the disturbance terms uif t to be clustered by workerthroughout.35
The parameters of interest (γ0�γ1) identify the causal effect of social con-nections on worker productivity under each managerial incentive scheme bycomparing the productivity of a given worker on field-days when he is sociallyconnected to his manager to his productivity on field-days when he is uncon-nected. The validity of the identification strategy and the causal interpreta-tion given to the results relies on two key assumptions. The first is that unob-served determinants of workers’ allocation to managers are orthogonal to themanagerial incentive scheme in place. The second is that any effect of socialconnections on individual productivity that is unrelated to the managerial in-centive scheme in place remains unchanged over time. We provide detailedevidence in support of both of these identifying assumptions in Section 5.3.
5.2. Baseline Results
Table III presents estimates of our baseline specification (3). In column 1we measure social connections with the dummy variable DCift that equals 1 ifworker i is connected to any of the managers in field-day f t and equals to 0otherwise. This is the variable used for the previous descriptive evidence in Ta-ble II. The results show that the pattern of unconditional differences in workerproductivity by social connections and managerial incentive scheme is robustto conditioning on a rich set of determinants of worker productivity. In par-ticular, column 1 shows that when managers are paid a fixed wage, the aver-age worker has significantly higher productivity on field-days on which he is
34As fields are operated on at different parts of the season and not all workers pick each day,the effects of the field life cycle and workers’ picking experience can be separately identified fromthat of the time trend. The average field life cycle is not significantly different under the twomanagerial compensation schemes.
35Clustering the disturbance terms uif t by field-day—say because workers on the same field-day face common productivity shocks—leads to the standard errors on the parameters of interest,γ0 and γ1, being considerably smaller than those we report.

SOC
IAL
CO
NN
EC
TIO
NS
AN
DIN
CE
NT
IVE
S1069
TABLE III
SOCIAL CONNECTIONS AND MANAGERIAL INCENTIVESa
2. Share of 3. Heterogeneous1. Any Managers Managers Effects of the 4. Field-Date
Connected To Connected To Bonus on Workers Fixed Effects
Any managers connected to i, �049**fixed wages for managers (DCif t) (�019)
Any managers connected to i, �016performance bonus for managers (DCif t) (�032)
Share of managers connected to i, �158*** �143*** �106**fixed wages for managers (Cif t) (�040) (�040) (�045)
Share of managers connected to i, −�083 −�079 −�060performance bonus for managers (Cif t) (�088) (�088) (�061)
Difference-in-difference estimate �033 �241*** �222** �167**(�034) (�095) (�096) (�075)
Interactions of nationality × performance bonus dummy Yes [.147] Yes [.042] No NoInteractions of living site × performance bonus dummy Yes [.000] Yes [.000] No NoInteractions of arrival cohort × performance bonus dummy Yes [.000] Yes [.000] No NoInteractions of worker fixed effect × performance bonus dummy No No Yes [.000] Yes [.000]Field-date fixed effects No No No Yes
Adjusted R-squared �4355 �4361 �4479 �5817Number of observations (worker-field-day) 8884 8884 8884 8884
aDependent variable = log of worker’s productivity (kilograms picked per hour on the field-day). *** denotes significance at 1%, ** at 5%, and * at 10%. In columns 1 to 3 thestandard errors allow for clustering at the worker level. In column 4 standard errors are clustered at the field-date level. All specifications control for worker, field, and managerfixed effects. The other controls included in specifications 1 to 3 include the managerial performance bonus dummy, the worker’s picking experience, the field life cycle, a timetrend, and interactions between the performance bonus dummy and the worker’s nationality, arrival cohort, and living site. The field life cycle is defined as the nth day the fieldis picked divided by the total number of days the field is picked over the season. In column 4 these interactions are replaced by interactions of the worker fixed effect and theperformance bonus dummy, and a series of field-date fixed effects and hence the field life cycle and time trend are dropped from this specification. All continuous variables arein logarithms. A manager and given worker i are defined to be connected if they are either of the same nationality, live in the same area, or are in the same arrival cohort. Allsample workers are connected to at least one manager on at least one field-day and work at least one week under each incentive scheme. In column 1 a worker is defined to beunconnected on the field-day if she is not socially connected to any of her managers that field-day, and the worker is defined to be connected on the field-day if she is sociallyconnected to at least one of her managers. The difference-in-difference estimate is the difference in the effect of social connections on worker productivity by managerial incentivescheme. At the foot of each column we report the p-value on the F -test on the joint significance of the interaction terms with the performance bonus dummy.

1070 O. BANDIERA, I. BARANKAY, AND I. RASUL
socially connected to his managers (γ0 > 0). When managers are paid perfor-mance bonuses, there is no effect on the average worker’s productivity of beingsocially connected to her managers on the field-day (γ1 = 0).
The magnitude of γ0 implies that when managers are paid a fixed wage, beingconnected to at least one manager on the field, increases productivity by 5%for the average worker, whereas there is no such effect when managers are paidperformance bonuses, although the difference in the effects is not statisticallysignificant.
In column 2 we measure social connections by the share of managers onfield-day f t that are connected to worker i by either nationality, living site, orarrival cohort. Compared to the dummy variable DCift , this is a more precisemeasure as it distinguishes between field-days in which a worker is more likelyto be connected to his manager. The pattern of coefficients is the same as incolumn 1 but the implied magnitude of the effect is larger. Evaluating at themean, the magnitude of γ0 implies that when managers are paid a fixed wage,the productivity of a worker on field-days when he is socially connected to allthe managers on the field relative to his productivity on field-days when he issocially unconnected to managers will be .642 kg/hr higher, other things beingequal. Relative to a baseline average worker productivity of 7.21 kg/hr whenmanagers are paid fixed wages and workers are not connected, this representsa 9% increase of productivity on connected days. Since workers are paid piecerates based on productivity, earnings increase by the same percentage.36�37
Taken together, this pattern of results suggests the effect of social connec-tions in the workplace is for managers to favor workers they are connected towhen their incentives are low powered. At the foot of columns 1 and 2 we re-port the implied difference-in-difference estimate, (γ0 − γ1). In line with thedescriptive evidence, this is positive in both cases and significantly different
36The difference between the estimated γ0 parameters in columns 1 and 2 lends support tothe idea that managers and workers do not choose who they work with, even within a field-day.Namely, if managers favor socially connected workers and workers could sort across managerswithin the field, workers should assign themselves to a manager they are socially connected to ifsuch a manager were present. In that case, however, the effect of being connected to one managershould be no different than being connected to two or more. The fact that the implied effect ofbeing connected to all managers (from column 2) is almost double the effect of being connectedto at least one (from column 1) indicates that workers cannot assign themselves to a managerwho they are connected to.
37While these baseline results focus on the effects of social connections on worker productiv-ity, we also explored whether the strength of social ties between a worker and his managers affectworker productivity. We can define the strength of the social tie as the number of dimensionsalong which the two are connected,
∑k DCk
if t . We find that a worker’s productivity is monotoni-cally increasing in the number of dimensions along which he is connected to his managers whenhis managers are paid a fixed wage and that there is no such effect under performance bonuses.However, these results should be interpreted with caution because, given that each dimension ofconnectivity is orthogonal to the others, there are only 5% of observations from which the effectsof being connected along strictly more than one dimension can be identified.

SOCIAL CONNECTIONS AND INCENTIVES 1071
from zero at the 1% significance level when using the continuous measure ofsocial connections.
The pattern of coefficients helps rule out three alternative hypotheses ofwhy social connections may matter in this workplace. First, if workers were al-ways assigned to socially connected managers when productivity on the fieldis exogenously higher, connections should have the same positive effect un-der both schemes, that is, γ0 = γ1 > 0. Second, when they are on the field-daywith managers they are socially connected to, if workers prefer to socialize withtheir managers, connections should have the same negative effect under bothschemes, that is, γ0 = γ1 < 0. Third, the pattern of coefficients allows us torule out the hypothesis that the effect of social connections is driven by work-ers’ rather than managers’ behavior. Indeed, if workers were to internalize theeffect of their effort on their manager’s pay when socially connected to her,we would observe workers exerting more effort when this actually affects themanager’s pay, namely when the manager is paid the performance bonus, thatis γ0 = 0 < γ1.
A concern with these results is that the difference-in-difference estimate ofsocial connections might be picking up heterogeneous effects of the managerialbonus scheme across workers that are unrelated to workers’ social connections.To account for this, we introduce a complete set of interactions between eachworker’s fixed effect and the performance bonus dummy. This flexibly capturesany differential effects across workers of the change in managerial incentives.The result, reported in column 3, shows that the magnitude and significance ofthe parameters of interest are similar to those in the baseline estimates.38
Finally, we address the concern that there may exist field-day factors thatcreate a spurious correlation between social connections and productivity. Forexample, managers might lobby the COO to be allocated workers they are con-nected to on field-days when productivity is exogenously higher. Also, the ef-fect of social connections might depend on the field-day piece rate, which ison average lower when managers are paid performance bonuses as shown inBandiera, Barankay, and Rasul (2007). To address this concern, the final spec-ification includes field-day fixed effects. The effects of social connections Cif t
under each managerial incentive scheme are then identified off the variationacross workers in the same field-day in the level of their social connectionsin deviation from the workers’ average level of social connections under eachmanagerial compensation scheme. The result in column 4 shows the previousresults to be robust to conditioning on factors that vary across field-days, suchas managers lobbying for workers, field conditions, the hours worked on thefield-day, or the level of the piece rate for workers.39
38The results are robust to controlling for a complete set of worker-field dummies that allowthe productivity of each worker to differ across fields.
39To ensure the estimates do not capture the effect of the composition of the workforce chang-ing over the season, throughout we restrict the sample to workers who work at least one week

1072 O. BANDIERA, I. BARANKAY, AND I. RASUL
5.3. Evidence in Support of the Identifying Assumptions
We have identified the causal effect of social connections on worker produc-tivity under each managerial incentive scheme by comparing the productivityof a given worker on field-days when he is socially connected to his managerto his productivity on field-days when he is unconnected. The validity of theidentification strategy and the causal interpretation given to the results relieson two assumptions.
The first is that unobserved determinants of workers’ allocation to managersare orthogonal to the managerial incentive scheme in place. As discussed inSection 2.2, the within worker variation in social connections is exogenous tothe behavior of workers and managers because the allocation of individuals tofields is determined by the COO, based on the demand for labor for pickingand nonpicking tasks across fields. Nevertheless, workers’ allocation to man-agers might still depend on factors that affect performance and are observableto the COO. Alternatively, workers and managers might engage in behaviorsto influence their assignment to each other.
To provide support for this identifying assumption, the Appendix presentsevidence that the allocation rules do not change with the change in managerialincentives. We show that (i) compared to workers who are not connected toany manager, connected workers are equally likely to be selected to pick or tobe selected to work on any task as opposed to stay unemployed on a given day,regardless of the incentive scheme in place; (ii) field-day and worker-field-dayspecific determinants of productivity do not predict the level of social connec-tions Cif t differentially under the two managerial incentive schemes; (iii) allmanagers are equally likely to be assigned connected workers under both in-centive schemes; (iv) we exploit the fact that some dimensions of connectivity,such as nationality, are more easily observable to the COO than others, such astime of arrival. If the COO systematically assigns workers to managers on thebasis of their connections, we should find the effect of social connections to bemostly driven by dimensions that are easier to observe. We find no evidence tosupport this assertion.
The second underlying identifying assumption is that the effect of social con-nections on individual productivity does not change over time for reasons otherthan the change in managerial incentives. This ensures that there are no time-varying unobservables that (i) are correlated with the introduction of the bonusand (ii) determine the effect of social connections on productivity.
The Appendix shows two pieces of evidence in support of this assumption.First we show that the effect of social connections does not depend on thetime of the season, the field life cycle or the workers’ tenure. Rather, the effect
either side of the change in managerial incentives. The results are robust to less conservativesample definitions, namely to including all workers on payroll or only workers who have workedat least one day either side of the change in managerial incentives.

SOCIAL CONNECTIONS AND INCENTIVES 1073
of social connections changes discontinuously when the bonus is introduced.40
Second, we analyze the effect of a placebo bonus on productivity in a differentseason (2004) and in different fields within the 2003 season, neither of whichwere subject to the introduction of managerial performance pay. Reassuringly,the effect of connections on productivity does not change with the introduc-tion of the placebo bonus, suggesting the effect of social connections does notchange spuriously at a specific point in time or in the field life cycle that hap-pens to coincide with the introduction of the performance bonus in 2003.
6. THE EFFECT OF SOCIAL CONNECTIONS ON THE FIRM’S PERFORMANCE
We have presented evidence that the average worker benefits from beingconnected to his manager—in terms of his productivity and hence earnings—only when managers are subject to low powered incentives. In contrast, thereare no such benefits to being socially connected to managers when they arepaid performance bonuses. As highlighted by the theoretical framework inSection 3, two interpretations on managerial behavior are consistent with thefindings.
First it might be that when managers are paid wages, they only devote ef-fort to connected workers, whereas when they are paid bonuses they increasethe overall level of effort and devote some to every worker. Second, it mightbe that when managers are paid wages, they only devote effort to connectedworkers, whereas when they are paid bonuses they reallocate their, possiblyhigher, effort toward high ability workers irrespective of whether they are so-cially connected to them or not.
Distinguishing between these interpretations is key to assess the effect of so-cial connections on the firm’s overall productivity. If the data support the firstinterpretation, the implication is that social connections do not distort the al-location of managerial effort and have a positive effect on firm’s productivitybecause they increase managerial effort. To the contrary, if the data supportthe second interpretation, the interpretation is that social connections lead toa misallocation of managerial effort that decreases the firm’s productivity. Thetheoretical framework makes clear that such an allocation effect might reducethe firm’s productivity when the manager is connected to low ability workersand targets them instead of the high ability workers. To assess whether this isthe case, we proceed in two stages. In Section 6.1 we assess whether the alloca-tion effect is negative, namely we estimate the effect of social connections onconnected workers of different ability by managerial incentive scheme and wetest whether the manager reallocates effort from low to high ability workers
40A related concern is that the overall effect of social connections through time might maskheterogeneous effects for the three different components of the connection measure. Furtherspecifications, not reported for reasons of space, reveal that the effect of each component doesnot vary with time and changes discontinuously when bonuses are introduced.

1074 O. BANDIERA, I. BARANKAY, AND I. RASUL
as a result of the increase in the strength of her incentives. In Section 6.2 wepresent evidence on the overall effect of social connections on the firm’s per-formance, so as to assess whether the positive incentive effect prevails over the(possibly) negative allocation effect.
6.1. The Allocation Effect
6.1.1. Quantile Regression Estimates
To explore whether the effects of social connections are heterogeneousacross workers, we use quantile regression methods to estimate the conditionaldistribution of the log of productivity of worker i on field f on day t, yif t , at dif-ferent quantiles, θ. We therefore estimate the specification
Quantθ(yif t |·) = αθBt +βθCif t + γθ(Bt ×Cif t)+ λθf(4)
+∑s∈Mft
μθsSsf t + δθXif t +ηθZft +ϕθt�
where all variables are as previously defined and bootstrapped standard errorsbased on 1000 replications are calculated throughout. The effect of the man-agerial performance bonus on unconnected field-days at the θth conditionalquantile of log worker productivity is measured by αθ. The corresponding ef-fect on connected field-days is given by αθ + γθCif t . Since the connection vari-able Cif t is continuous, we define worker i to be connected on field-day f t whenthe share of managers he is connected to is higher than a given threshold, Cif t ,and we experiment with alternative values of the threshold. The effect of socialconnections when managers are paid fixed wages and bonuses is captured byβθ and βθ + γθ, respectively.
The estimates of αθ and (αθ + γθCif t) at different conditional quantiles ofworker productivity allow us to distinguish between the two interpretationsgiven above. Indeed, if social connections do not distort the allocation of ef-fort but rather the manager targets connected workers before the bonus andexerts additional effort to target all workers after the bonus, we should observethe effect of the bonus to be nonnegative and stronger on field-days when theworker is not connected, that is, αθ > αθ + γθCif t ≥ 0 for all θ.
In contrast, if social connections distort the allocation of effort and this isdetrimental to the firm’s productivity, we should observe that managers real-locate effort from low ability workers when connected to high ability workersregardless of their connection status. This implies (i) the introduction of thebonus strictly decreases the productivity of workers in the left tail of the pro-ductivity distribution on field-days in which they are connected and has no ef-fect when they are not connected, namely αθ +γθCif t < 0 and αθ = 0 for low θ;(ii) the introduction of the bonus strictly increases the productivity of work-ers in the right tail of the productivity distribution on field-days in which they

SOCIAL CONNECTIONS AND INCENTIVES 1075
TABLE IV
QUANTILE REGRESSION ESTIMATESa
Quantile of Worker Productivity
10th 25th 50th 75th 90th
Performance bonus −�093 �001 �100** �214*** .312***for managers (αθ) (�078) (�037) (�034) (�040) (.041)
Share of managers �013 �074** �144*** �272*** .392***connected to i (βθ) (�067) (�032) (�030) (�036) (.037)
Performance bonus for −�228** −�175*** −�179*** −�168*** −.233***managers × share of (�104) (�050) (�047) (�057) (.060)managers connectedto i (γθ)
Implied effect of performance −�166** −�055* �042 �160*** .237***bonus for managers on (�069) (�033) (�031) (�035) (.035)connected field-days(αθ + γθCif t) (evaluatedat mean of Cif t)
Number of observations 8884 8884 8884 8884 8884(worker-field-day)
aDependent variable = log of worker’s productivity (kilograms picked per hour on the field-day). *** denotessignificance at 1%, ** at 5%, and * at 10%. Standard errors are reported in parentheses. All specifications control forfield and manager fixed effects. The other controls included in each specification are the worker’s picking experience,the field life cycle, and a time trend. The field life cycle is defined as the nth day the field is picked divided by the totalnumber of days the field is picked over the season. All continuous variables are in logarithms. A manager and givenworker i are defined to be connected if they are either of the same nationality, live in the same area, or are in the samearrival cohort. The implied effect of the bonus on connected days is computed assuming that the share of managersthe worker is connected to is at the sample mean.
are not connected and has a weakly positive effect when they are connected,namely αθ > αθ + γθCif t ≥ 0 for high θ.
Table IV reports the estimates of αθ, βθ, γθ, and αθ + γθCif t from specifica-tion (4) at various quantiles, and is where Cif t is set at the sample mean. Twopoints are of note. First, the effect of the managerial bonus on unconnectedfield-days, αθ, is zero at the bottom two quantiles, and is positive and increas-ing in θ for the top quantiles. Second, the effect of the managerial bonus onconnected field-days, αθ + γθCif t , is negative and significant in the first twoquantiles, and is positive and significant in the last two quantiles.41
Taken together, these results provide evidence against the interpretation thatafter the introduction of the bonus, managers exert extra effort and target all
41As the effect of the bonus on both connected and unconnected field-days is increasing in θ,the evidence is not consistent with the hypothesis that workers work harder to increase the prob-ability of being selected to pick once the bonus is introduced. If such “rat race” effects wereresponsible for the productivity increase, we should observe workers at the margin of being se-lected to be most affected.

1076 O. BANDIERA, I. BARANKAY, AND I. RASUL
workers regardless of their connection status. Rather the data suggest the in-troduction of the bonus strictly decreases the productivity of workers in the lefttail of the productivity distribution on field-days in which they are connectedand has no effect when they are not connected. The findings unambiguouslyprovide support to the interpretation that social connections distort the allo-cation of effort when managers are paid fixed wages and that this allocationeffect is detrimental for the firm’s productivity.42
6.1.2. Fixed Effects Estimates
To complement the quantile regression evidence, we estimate the produc-tivity effect of social connections, of the managerial bonus, and of their in-teraction, individually for each worker. To do so, we estimate the panel dataspecification
yif t =129∑i=1
ΛiftDi + λf + ρXif t +ηZft +ϕt +∑s∈Mft
μsSsf t + uif t�(5)
where Di equals 1 for worker i, and is 0 otherwise, and all other variables are aspreviously defined. To explore heterogeneous effects across workers, we define
Λift = αi[DCift × (1 −Bt)] +βi[DCift ×Bt](6)
+ γi[(1 −Bt)× (1 −DCift)] + δi[Bt × (1 −DCift)]�For each worker we therefore estimate four parameters that capture his resid-ual productivity on field-days when he is (i) connected and managers are paidwages (αi); (ii) connected and managers are paid bonuses (βi); (iii) uncon-nected and managers are paid fixed wages (γi); (iv) unconnected and managersare paid bonuses (δi). Figure 1 shows the kernel density estimates of the fourestimates of residual productivity.
Panels (a) and (b) show the effect of being socially connected to managersfor a given managerial compensation scheme. Panel (a) shows that when man-agers are paid fixed wages, the entire distribution of conditional productivityshifts to the right on field-days in which workers are connected compared towhen they are not connected. The p-value of the Kolmogorov–Smirnov testfor the null of equality of distributions is .01.
Panel (b) shows that when managers are paid performance bonuses, the dis-tributions of conditional productivity on connected and unconnected field-daysoverlap. In this case, the Kolmogorov–Smirnov test fails to reject the null at
42The results are qualitatively unchanged if we set the threshold Cif t to (i) the sample minimumof Cif t , so that a worker is defined to be connected as long as he is connected to one of themanagers; (ii) the sample maximum of Cif t , so that a worker is defined to be connected only if heis connected to all managers on the field-day.
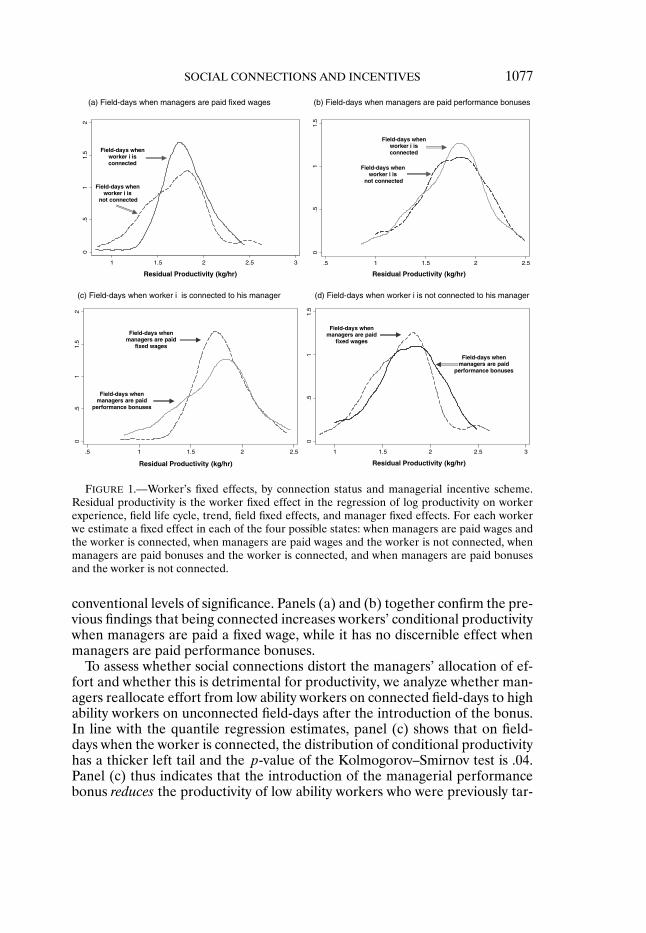
SOCIAL CONNECTIONS AND INCENTIVES 1077
FIGURE 1.—Worker’s fixed effects, by connection status and managerial incentive scheme.Residual productivity is the worker fixed effect in the regression of log productivity on workerexperience, field life cycle, trend, field fixed effects, and manager fixed effects. For each workerwe estimate a fixed effect in each of the four possible states: when managers are paid wages andthe worker is connected, when managers are paid wages and the worker is not connected, whenmanagers are paid bonuses and the worker is connected, and when managers are paid bonusesand the worker is not connected.
conventional levels of significance. Panels (a) and (b) together confirm the pre-vious findings that being connected increases workers’ conditional productivitywhen managers are paid a fixed wage, while it has no discernible effect whenmanagers are paid performance bonuses.
To assess whether social connections distort the managers’ allocation of ef-fort and whether this is detrimental for productivity, we analyze whether man-agers reallocate effort from low ability workers on connected field-days to highability workers on unconnected field-days after the introduction of the bonus.In line with the quantile regression estimates, panel (c) shows that on field-days when the worker is connected, the distribution of conditional productivityhas a thicker left tail and the p-value of the Kolmogorov–Smirnov test is .04.Panel (c) thus indicates that the introduction of the managerial performancebonus reduces the productivity of low ability workers who were previously tar-

1078 O. BANDIERA, I. BARANKAY, AND I. RASUL
geted when managers were paid wages. Note also that on field-days when theworker is connected, the distribution of conditional productivity has a highervariance when managers are paid bonuses compared to when they are paidfixed wages. This illustrates that social connections reduce the variation in pro-ductivity naturally arising from differences in worker ability when managersare paid fixed wages but not when they are paid bonuses.
Finally, panel (d) illustrates the effect of the introduction of the bonus on un-connected field-days. In line with the previous estimates, on unconnected field-days the distribution of conditional productivity has a thicker right tail whenmanagers are paid bonuses compared to when they are paid fixed wages—the p-value of the Kolmogorov–Smirnov test is .06. This is consistent with theintroduction of the bonus increasing the productivity of high ability workerswho were previously untargeted on field-days when they were unconnectedand managers were paid wages.
Overall, panels (c) and (d) are in line with the quantile regressions resultsand provide support to the interpretation that when managers are paid fixedwages, they favor connected workers and that this allocation of managerialeffort is detrimental for the firm’s overall productivity.
6.1.3. Further Evidence
The balance of evidence indicates that following the introduction of thebonus, managers reallocate effort from low ability connected workers to highability unconnected workers, rather than devoting more effort toward all work-ers. This is consistent with the characteristics of the production technology inour setting. Indeed, as each manager is responsible for 20 workers distributedover one hectare, it is often impossible for her to target her effort toward allworkers simultaneously. The technology is such that managerial effort is a rivalgood in that if the manager decides to target her effort toward one worker, shenecessarily does so at the expense of another worker.
A testable implication of this property is that if favors are rival, the effectof social connections on the productivity of worker i should be smaller whenthe share of his co-workers who are also connected to managers increases. Inshort, if few workers are connected, the manager can devote all of her time tofavor them. If more workers are connected, the manager needs to spread herfavors more thinly. To check for this, we reestimated our baseline specification(3), allowing the effect of social connections on the productivity of worker ion field-day f t to vary with the share of workers who are also connected toa manager on field-day f t. We find that when managers are paid fixed wages,social connections increase the productivity of a connected worker by 15% ifone-quarter of the workers on the field are also connected, by 7% if half ofthe workers on the field are also connected, and have no effect if more thantwo-thirds of the workers on the field are also connected. In line with previousevidence, neither the connection status of worker i nor the share of connected

SOCIAL CONNECTIONS AND INCENTIVES 1079
workers on the same field-day affect productivity after the introduction of man-agerial performance pay.
6.2. The Overall Effect on Average Field-Day Productivity
The evidence above indicates that when managers are paid fixed wages, so-cial connections distort the allocation of managerial effort in favor of con-nected workers at the expense of high ability workers. This, together with thefact that when they are paid performance bonuses they allocate effort to highability workers only, indicates that the allocation effect is detrimental for thefirm’s performance. We now present evidence on the overall effect of socialconnections, namely we investigate whether the extent to which social connec-tion increase managerial effort is sufficient to overcome the negative alloca-tion effect. To do so, we aggregate the data at the field-day level and estimatea specification analogous to (3):
yf t = κ0(1 −Bt)× Cf t + κ1(Bt × Cf t)+ ρBt(7)
+∑s∈Mft
μsSsf t +ηZft +ϕt + λf + uif t�
where yf t is the log of the average productivity on field-day f t, Cf t is the shareof managers worker i is socially connected to, averaged across all workers onfield-day f t, Bt is a dummy variable equal to 1 after the performance bonus isintroduced (June 27th) and equal to 0 otherwise,
∑s∈Mft
μsSsf t is a full set ofmanagers dummies, Zft is the field-life cycle, and t is a time trend, as in thebaseline specification (3). The parameters of interest are κ0, which measuresthe effect of social connections on average productivity when managers arepaid a fixed wage, and κ1, which measures the effect of social connections whenmanagers are paid performance bonuses. The findings, reported in Table V, in-dicate that the overall effect of social connections is negative when managersare paid fixed wages and is zero when they are paid performance bonuses. Anincrease in average social connections by 1 standard deviation reduces averageproductivity by 8% unconditionally and by 5% in the full conditional specifica-tion (7) when mangers are paid fixed wages. The effect of social connectionsunder the bonus is small and not significantly different than zero. Given ourprevious finding that the allocation effect is negative when managers are paidwages and is zero when they are paid bonuses, the results in Table V imply thatthe effect of social connections on managerial effort might be positive, albeitnot very large, in the fixed wage regime only. The next section discusses howthe finding that social connections are detrimental to the overall firm produc-tivity might depend on specific features of the context we study.

1080 O. BANDIERA, I. BARANKAY, AND I. RASUL
TABLE V
THE EFFECT OF SOCIAL CONNECTIONS ON AVERAGE PRODUCTIVITY
3. Time1. Unconditional 2. Managers FE Controls 4. Field FE
Average connections (Cif t), −�779*** −�544** −�675*** −�535**fixed wages for managers (�201) (�255) (�238) (�250)
Average connections (Cif t), �206 �149 �122 �031performance bonus (�509) (�529) (�484) (�480)for managers
Manager fixed effects No Yes Yes YesTime controls No No Yes YesField fixed effects No No No YesAdjusted R-squared �944 �943 �948 �909Number of observations 241 241 241 241
(field-day)
aDependent variable = log of average field-day productivity (kilograms picked per hour on the field-day). *** de-notes significance at 1%, ** at 5%, and * at 10%. AR(1) regression estimates are reported. Panel corrected standarderrors are calculated using a Prais–Winsten (AR(1)) regression, allowing the error terms to be field specific het-eroskedastic, and contemporaneously correlated across fields. The autocorrelation process is assumed to be specificto each field. Each field-day observation is weighted by the log of the number of workers present. All specificationscontrol for the bonus dummy that is equal to 1 when the managerial performance bonus scheme is in place and equalto 0 otherwise. The dependent variable is the log of the average productivity at the field-day level. The average connec-tion variable is computed as the average of the social connection measure for all workers on the field-day. A managerand given worker i are defined to be connected if they are either of the same nationality, live in the same area, or arein the same arrival cohort. Time controls included in columns 3 and 4 are a linear time trend and the field life cycle,defined as the nth day the field is picked divided by the total number of days the field is picked over the season.
7. DISCUSSION
We have provided evidence on the interplay between social connections, in-centives, and productivity within a firm. We show that in a setting where man-agerial effort can be targeted to affect the productivity and earnings of individ-ual workers, the existence of social connections between individuals at differ-ent tiers of the firm hierarchy affects individual and firm performance.
We find that managers target connected workers, but only when their mon-etary incentives are low powered. After the introduction of managerial per-formance pay, managers stop favoring low ability workers they are sociallyconnected to and target their effort toward high ability workers instead. Theresults indicate that while social connections can increase the productivity ofconnected workers, their effect on the allocation of managerial effort is detri-mental for the firm’s productivity overall under the fixed wage regime.
Our results bring new evidence to the small but growing literature that high-lights the importance of social relationships in the workplace. Our findingsindicate that managerial behavior is shaped by both social connections withsubordinates and monetary incentives. Both factors are key to explaining thesuccess of existing incentive structures and to guide the design of optimal com-pensation schemes for both workers and managers.

SOCIAL CONNECTIONS AND INCENTIVES 1081
The use of detailed personnel data combined with the purely exogenous vari-ation created by our natural field experiment allows us to precisely identify thecausal effect of social connections between workers and managers on the per-formance of individual workers and on the firm’s performance overall. Preci-sion, however, inevitably comes at the cost of a loss of generality, because thefirm we study, as any other, has unique features that shape social connectionsbetween workers and managers, and their effect on productivity. The followingfeatures of this work environment are particularly noteworthy for the externalvalidity of this study.
First, there are two characteristics of this firm that have opposite effects onthe probability that social connections form and are strong enough to affectbehavior. On the one hand, the fact that managers and workers are of similarages and backgrounds, and live on the farm site for the entire duration of theirstay increase the likelihood that they form strong social connections with oneanother. On the other hand, as managers and workers are employed on shortterm seasonal contracts, this might prevent the formation of meaningful long-run social ties relative to other settings.
Second, in our setting all the actions managers can take to help connectedworkers—allocating them to better rows, reallocating them quickly to newrows, providing them with new crates as soon as needed—are costlessly ob-served by others on the field. To the extent that favoritism is disapproved of byunconnected workers, the fact that these actions are observable by all workersreduce managers’ ability to favor their friends. We thus expect the effect of so-cial connections and favoritism to be stronger in settings where favoritism canbe more easily disguised.
Third, the specific form that the effects of social connections take dependson the technology and incentive schemes in the workplace. In our contextworkers are paid piece rates and managers can undertake actions that improvethe productivity and hence earnings of connected workers. In other contexts inwhich workers are paid fixed wages, social connections might be exploited to al-low subordinates to slack, allocating subordinates to more desirable positions,or helping subordinates be promoted. Moreover, in our context workers’ pro-ductivity is precisely measured, so there is also no scope for managers to showfavoritism through subjective evaluations of workers. In general, managers willhave more margins along which to favor workers and all such activities willaffect the firm’s overall performance.
Perhaps the most important consideration is that in other settings, the al-locative effect of social connections on managerial effort might be beneficial.As emphasized throughout, social connections can reduce informational asym-metries, facilitate joint problem solving, and provide managers the ability tomotivate workers through social rewards and punishments. In our context, thetasks workers undertake are relatively simple and so any potential benefits thatsocial connections have for problem solving or improved communication moregenerally, are likely to be small. In other settings, the productivity enhancing

1082 O. BANDIERA, I. BARANKAY, AND I. RASUL
effects of social connections might dominate the inefficiency due to favoritism.For example Ichniowski and Shaw (2005) presented evidence from steel fin-ishing lines—a relatively complex task that involves problem solving—of suchpositive effects of improved communication within and between tiers of thefirm hierarchy.43
The fact that managers devote effort to increase the productivity of con-nected workers, even when they are paid fixed wages, suggests that social con-nections between managers and workers can provide an alternative, and possi-bly cheaper, mechanism to the provision of monetary incentives. It may thus bein a firm’s best interests to foster social ties between management and workers.Indeed many firms are observed devoting resources toward such bonding exer-cises. On a related note, the fact that managers behave as if they derive utilityfrom helping connected workers implies that being socially connected to theirsubordinates lowers the managers’ participation constraint and thus the firm’swage bill may be reduced. However, this strategy may be suboptimal if it leadsto the self-selection of lower quality managers to the firm over time.44
More generally, our findings provide support for the idea that interplays be-tween social relationships and incentives within firms need to be taken intoaccount in order to understand how individuals respond to a given set of in-centives and to understand the optimal set of incentives within an organiza-tion. Differences in the social organization of the workplace might thereforeexplain part of the productivity differences among otherwise observationallysimilar firms.
APPENDIX
A.1. Proofs
PROOF OF PROPOSITION 1: As the manager’s payoff function (b + σh) ×θk(σh)mh + (b + σl)k(σl)ml − C(mh + ml) is linear in (mh�ml), the man-ager will target only the worker that yields the highest marginal benefit.45 The
43Related work, Nagin, Rebitzer, Sanders, and Taylor (2002) presented evidence from a fieldexperiment in a call center that exogenously varied the probability that employees would be mon-itored by managers. Their results suggest that management’s “perceived empathy and fairness”in dealing with employees may play an important role in reducing workplace opportunism. Otherbeneficial effects of social capital within firms have also been discussed in the sociology litera-ture. These include potentially better hiring outcomes through the use of referrals by currentemployees (Fernandez, Castillo, and Moore (2000)).
44Social connections within firms are just one alternative to using monetary incentives tosolve agency problems. There is a growing theoretical and empirical literature on the relation-ship between intrinsic and extrinsic motivation (Frey and Oberholzer-Gee (1997), Kreps (1997),Bénabou and Tirole (2003)).
45This property would of course be retained if workers also chose their effort level. The analysiswould however be more cumbersome as the worker’s effort level would depend on the manager’sand vice versa.

SOCIAL CONNECTIONS AND INCENTIVES 1083
manager chooses m if and only if {max[θkh(b + σh)�kl(b + σl)]}(m − 1) > c.The right-hand side is increasing in (σh�σl), which proves the first part of theproposition, that the existence of social connections weakly increases the levelof managerial effort.
The manager allocates her effort to worker i if and only if (b+ σi)θk(σi) ≥(b+ σj)k(σj). There are two cases to consider. If σh = σ and σl ∈ {σ�0}, thatis, if the manager is socially connected to both workers or only the high abil-ity worker, she targets the high ability worker for all other parameter values.If σh = 0 < σl = σ , that is, if the manager is connected only to the low abilityworker, she targets the high ability worker if and only if k < bθ
b+σ. This proves
the second part of the proposition, that there exists a part of the parameterspace in which the existence of social connections alters the allocation of man-agerial effort in favor of the worker the manager is connected to. Q.E.D.
PROOF OF PROPOSITION 2: As m is weakly increasing in (σh�σl) and thefirm’s average productivity, 1
2(θk(σh)mh + k(σl)ml), is increasing in m, thelevels effect of social connections is weakly positive.
For any given level of effort, if σh = σ and σl ∈ {σ�0}, then the managertargets the high ability worker only and the allocation effect is positive as pro-ductivity is equal to θkmh > θmh. This proves the first part of the propositionthat if the manager is connected to the high ability worker, the effect of socialconnections on the firm’s productivity is unambiguously positive.
If σh = 0 <σl = σ and bθb+σ
< k < θ, the allocation effect is negative, namelythe manager targets the low ability worker although targeting the high abil-ity worker would yield higher output.46 The net effect of the existence of so-cial connections on the firm’s productivity then depends on the balance be-tween the levels effect and the allocation effect. If m(σh = 0�σl = 0)=m(σh =0�σl = σ), namely if the manager chooses the same level of effort regardless ofsocial connections, the allocation effect dominates and the effect of social con-nections is unambiguously negative. If m(σh = 0�σl = 0) <m(σh = 0�σl = σ),the firm’s productivity is equal to θ when σh = 0�σl = 0 and equal to km whenσh = 0�σl = σ . This proves the second part of the proposition that if the man-ager is connected only to the low ability worker and targets him, social connec-tions reduce firm’s productivity if k< θ
m. Q.E.D.
A.2. Identification: The COO’s Allocation Algorithm
We present evidence in support of the first identifying assumption that theallocation algorithm used by the COO to assign workers to tasks and work-ers to managers does not change with the introduction of managerial perfor-mance bonuses. We proceed in four steps. First, we compare the allocation of
46Total output is equal to θm when the manager is not connected to either worker and is equalto km when she is connected to the low ability worker. Thus, for any level of m, output is lowerwhen the manager is connected.

1084 O. BANDIERA, I. BARANKAY, AND I. RASUL
the connected workers we focus on for our main analysis to the allocation ofunconnected workers. Second, we analyze the determinants of the level of so-cial connections Cif t and test whether their effect changes after the change inincentive scheme. Third, we test whether the COO is more likely to assign con-nected workers to some managers rather than others and whether this changesafter the change in incentive scheme. Finally, we exploit the fact that somedimensions of connectivity, such as nationality, are more easily observable tothe COO than others, such as time of arrival. If such sorting biases the esti-mates, we should find the effect of social connections to be mostly driven bydimensions that are easier to observe.
A.2.1. Connected versus Unconnected Workers
We estimate the probability of a given worker being selected into employ-ment by the COO while controlling for farm level variables that affect the prob-ability of being hired independently of the incentive scheme in place. Thesefarm level variables measure the supply and demand of labor.
We measure labor supply using personnel records on the number of workersavailable for hire on the farm on any given day. We measure the demand forlabor using the total daily fruit yield on each site on the farm. The total yieldis orthogonal to the incentive scheme as it is determined by planting decisionstaken one or two years earlier. Fields are located on two sites, of which we usethe largest for the analysis as fruit in the smaller site begins to ripen only afterthe introduction of the performance bonus scheme. However, as both sites hireworkers from the same pool, we control for yields in each site separately. Wethen estimate the following conditional logit model, where observations aregrouped by worker:
Pr(pit = 1)=Λ(Bt�Bt ×Ci�XDt �X
St �Xit)�(8)
pit = 1 if worker i is selected by the COO to pick on day t on the main siteand = 0 if they are assigned to nonpicking tasks. Bt is the performance bonusdummy, Ci is a dummy variable equal to 1 if worker i is socially connected toany of the managers along any dimension of nationality, arrival cohort, and liv-ing site, and equal to 0 otherwise. XD
t and XSt proxy the demand and supply of
labor on day t. To allow for workers’ previous performance to affect their prob-ability of being selected, Xit measures worker i’s productivity on the last dayshe picked, in percentage deviation from the mean productivity on that day, toremove the effects of factors that determine the productivity of all workers andare beyond the worker’s control.47
47We first take the deviation of the worker’s productivity from the field average productivity oneach field he picked on the day he was last selected to pick, and then calculate a weighted averageof this across all fields he worked on where the weights are based on the number of pickers onthe field.

SOCIAL CONNECTIONS AND INCENTIVES 1085
TABLE A.I
SOCIAL CONNECTIONS, MANAGERIAL INCENTIVES, AND THE COO’S ALLOCATIONALGORITHMa
Probability of Being Probability of BeingSelected to Pickb Unemployedc
Performance bonus for managers 1�34 2�04*(�495) (�764)
Performance bonus for managers × �524 �605worker i is socially connected (�214) (�253)
Total yield in site 1 2�24*** �802***(�153) (�057)
Total yield in site 2 �883*** �800***(�036) (�032)
Number of workers available to pick fruit �380*** 1�83***(�037) (�178)
Worker i’s previous deviation from 1�16* 1�07mean productivity (�091) (�107)
Log-likelihood −5186.8 −3208.5Number of observations (worker-day) 15,551 9808
aStandard errors are given in parentheses, clustered by worker. *** denotes that the log odds ratio is significantlydifferent from 1 at 1%, ** at 5%, and * at 10% levels. Conditional logit estimates are reported where observationsare grouped by worker. All continuous variables are divided by their standard deviations so that one unit increase canbe interpreted as increase by one standard deviation. A manager and given worker i are defined to be connected ifthey are either of the same nationality, live in the same area, or are in the same arrival cohort. “Total yield” on the siteis the total kilograms of the fruit picked on the site-day. The “number of workers available to pick fruit” is the totalnumber of individuals that are on the farm that day and are available for fruit picking. “Worker i’s previous deviationfrom mean productivity” is defined on the last day the worker was selected to pick. We first take the deviation of theworker’s productivity from the field average productivity on each field he picked on the day he was last selected topick, and then calculate a weighted average of this across all fields he worked on where the weights are based on thenumber of pickers on the field. Worker i is defined to be unemployed on day t if she is present on the farm but is notassigned to any paid tasks.
bDependent variable = 1 if worker i is chosen to pick on day t in main site, =0 if worker is assigned to nonpickingtasks.
cDependent variable = 1 if worker i is unemployed on day t , =0 if assigned to nonpicking tasks.
All continuous variables are divided by their standard deviations so that oneunit increase can be interpreted as an increase of 1 standard deviation. Wereport odds ratios throughout; standard errors are calculated using the deltamethod.
Data column 1 of Table A.I shows that, other things being equal, there isno differential effect on socially connected or unconnected workers of beingselected to pick fruit after the introduction of the managerial performancebonus. Namely, the coefficient is not significantly different from 1. The othercoefficients show that, as expected, workers are more likely to be assigned tofruit picking tasks on days in which the fields on the main site bear more fruit(namely, the coefficient of XD
t is significantly larger than 1) and on days inwhich they face less competition from other workers (namely, the coefficientof XS
t is significantly smaller than 1).
1086 O. BANDIERA, I. BARANKAY, AND I. RASUL
Conditional on not being selected to pick on the main site on a given day,a worker can either be assigned to other tasks on the main site, to work onthe other site, or be left unemployed for the day. The next specification checkswhether the assignment of workers to nonpicking tasks varies differentially bysocially connected and unconnected workers when the performance bonus isintroduced. The result in data column 2 again shows there to be no such dif-ferential effect of the COO’s decision across workers based on their socialconnection to managers. The pattern of other coefficients confirms that theintroduction of the bonus scheme significantly raises the probability of beingunemployed. As expected, the probability of being unemployed for the day islower when yields are higher and when the stock of available workers is lower.
A.2.2. Determinants of Social Connections
To provide evidence that field-day and worker-field-day specific determi-nants of productivity do not predict the level of social connections Cif t dif-ferently under the two managerial incentive schemes, we estimate regressionsof the form
Cif t = αi + λf + υBt + [(φ0 +φ1Bt)×Xift](9)
+ [(ϕ0 +ϕ1Bt)×Zft] +∑s∈Mft
μsSsf t + uif t�
where Bt is the bonus dummy, Xift captures worker i’s time-varying charac-teristics, and Zft captures several time-varying field characteristics, such as thefield life cycle, a time trend, worker’s tenure on the farm, the number of work-ers on the field, the number of managers on the field, the total man hoursworked on the field, and the total kilos of fruit picked. Our identifying assump-tion requires φ1 = ϕ1 = 0. It is reassuring that we fail to reject the null of zerocoefficients in all cases.48
A.2.3. The Allocation of Workers to Managers
Finally, we present evidence on whether managers can influence the compo-sition of the group of workers they are allocated to and, in particular, whether
48Three other pieces of evidence also suggest that farm operations do not change over thetwo halves of the season. First, the ratio of workers to managers does not change significantly,remaining at 20 throughout. Second, at the field-day level, the average share of workers who aresocially connected to managers does not change significantly over the two halves of the season,neither does the variation in this share between fields on the same day. This suggests workers donot become sorted into fields by social connections over time. Third, using the estimated workerfixed effect from (3), αi , as a measure of a worker’s ability, we find that groups of workers on thefield-day are equally heterogeneous before and after the change in managerial incentives. Hencethere is no evidence the COO sorts workers differently by ability into fields postbonus.

SOCIAL CONNECTIONS AND INCENTIVES 1087
the composition of workers they are assigned differs after the change in man-agerial incentives. To begin with we note that Table I indicates that workersare equally likely to be connected to managers under both schemes. This is in-consistent with the hypothesis that managers can affect the share of connectedworkers in their group and choose a different share after the introduction ofthe bonus. To provide further evidence on this point we test whether somemanagers are significantly more likely to be assigned connected workers andwhether this changes after the introduction of the bonus. Note that since somenationalities are more numerous than others, some managers are mechani-cally connected to more workers. However, we are interested in establishingwhether different managers are more or less likely to be assigned to workersthey are connected to, regardless of the total number of workers they are con-nected to. To do so, we construct a data set at the manager-field-day level andestimate the following,
Zsft =∑s∈Mft
μsSsf t +∑s∈Mft
vs(Ssf t ×Bt)+ ζsf t�(10)
where Zmft is the log of the ratio of the number of workers connected to man-ager m present on field-day f t over the total number of workers connected tomanager m who are working on day t. The numerator thus represents the num-ber of connected workers the manager is assigned to, whereas the denominatoris the number of workers the managers could have potentially been assignedto on day t. All other controls are as previously defined.
We test two hypotheses: (i) H0 :μs = 0 for all s, namely all managers areequally likely to be assigned connected workers when they are paid fixed wages,and (ii) H0 :vs = 0 for all s, namely the allocation does not change after theintroduction of the bonus. The p-values for these hypotheses are .64 and .94,respectively, so we cannot reject either hypothesis. Hence there is no evidencethe COO treats managers differently before and after the bonus or that somemanagers are more able to be allocated to connected workers while others arenot.
A.2.4. Observability of Social Connections
A final check on whether the COO intentionally sorts managers and workersinto fields on the basis of their social connections is based on the intuition thatsome dimensions of connectivity, such as nationality, are more easily observ-able to the COO than others, such as time of arrival. If such sorting biases theestimates, we should find the effect of social connections to be mostly drivenby dimensions that are easier to observe.
In Table A.II we estimate a specification analogous to (3) that separatelycontrols for each dimension of social connectivity. To compare the magnitudesof the coefficients, we consider the implied effect on worker productivity ofa 1 standard deviation increase in each of the connectivity measures from its

1088 O. BANDIERA, I. BARANKAY, AND I. RASUL
TABLE A.II
SOCIAL CONNECTIONS AND MANAGERIAL INCENTIVES
Type of Social Connection
Share of managers of same nationality as i, �162***fixed wages for managers (�045)
Share of managers of same nationality as i, −�075performance bonus for managers (�134)
Share of managers living in same area as i, �087*fixed wages for managers (�049)
Share of managers living in same area as i, −�070performance bonus for managers (�071)
Share of managers of same arrival cohort as i, �309***fixed wages for managers (�088)
Share of managers of same arrival cohort as i, −�079performance bonus for managers (�142)
Interactions of nationality × performance bonus dummy Yes [.068]Interactions of living site × performance bonus dummy Yes [.000]Interactions of arrival cohort × performance bonus dummy Yes [.000]Interactions of worker fixed effect × performance bonus dummy NoField-date fixed effects NoAdjusted R-squared .4366Number of observations (worker-field-day) 8884
aDependent variable = log of worker’s productivity (kilograms picked per hour on the field-day). *** denotessignificance at 1%, ** at 5%, and * at 10%. Standard errors are reported in parentheses and allow for clustering atthe worker level. All specifications control for worker, field, and manager fixed effects. The other controls includethe managerial performance bonus dummy, the worker’s picking experience, the field life cycle, a time trend, andinteractions between the performance bonus dummy and the worker’s nationality, arrival cohort, and living site. Thefield life cycle is defined as the nth day the field is picked divided by the total number of days the field is picked overthe season. All continuous variables are in logarithms. At the foot of the column we report the p-value on the F -teston the joint significance on the interaction terms with the performance bonus dummy.
mean. We find that when managers are paid a fixed wage, the productivity ofa given worker is 4.6%, 1.5%, and 3.3% higher when the share of managershe is connected to by nationality, living site, and arrival cohort, respectively,is 1 standard deviation higher. The magnitude of the effect is thus similar fordimensions that can be observed—nationality—and for dimensions that can-not be easily observed—arrival cohort. If we compare the effect of the samechange across different connection measures, the magnitude of the effect isactually the largest for the dimension that is least observable—arrival cohort.This provides further evidence against the hypothesis that the COO sorts man-agers and workers into fields on the basis of their social connections. Finally,social connections along any dimension do not affect worker productivity whenmanagers are paid a performance bonus.49
49We chose to measure social connections along the dimensions of nationality, living site, andtime of arrival in order to capture social links that form for different reasons and, indeed, the

SOCIAL CONNECTIONS AND INCENTIVES 1089
A.3. Identification: Time Effects
We now present evidence in support of the second identifying assumptionthat any effect of social connections on individual productivity unrelated tothe managerial incentive scheme in place remains unchanged over time. If not,then in the baseline specification (3), γ0 and γ1 may simply pick up that theeffect of social connections naturally dies out over time, rather than becausemanagers change their behavior when they are paid performance bonuses. Forexample, managers may initially favor some workers in order to befriend them.Similarly workers may initially work hard under some managers in order tobefriend them. This would explain the pattern of coefficients we find in thedata and then suggest social connections do not distort managerial effort inthe long run.
In Table A.III we analyze whether the effects of social connections on workerproductivity naturally disappear over time. In column 1 we split both the pre-and postperformance bonus periods into halves and allow the effect of connec-tions to change within the pre- and postbonus periods. Intuitively, if the effectof social connections were naturally declining over time, we would expect itto be higher in the first half of the prebonus period than in the second half,and again higher in the first half of the postbonus period than in the secondhalf. Column 1 shows that, in contrast, there is no change in the effect of so-cial connections within each period. Rather, the effect of social connectionson worker productivity disappears discontinuously with the introduction of theperformance bonus for managers.
A second concern is that γ0 and γ1 might pick up that later in the field lifecycle there is less variation in the fruit available across different rows and somanagers have no means by which to favor connected workers, even thoughthey prefer to do so. To check for this, in column 2 we allow the effect of socialconnections to vary with a field specific time trend—the field life cycle. We donot find statistically significant evidence that the effect of social connectionsdiminishes within a field over time.
A third time related concern is that the true social ties between a workerand his managers are measured with error using Cif t which is based on threeparticular dimensions. This measurement error is nonclassical because it in-creases over time if workers learn they are better off being socially connectedto managers and so invest more into forming social ties with managers overtime, irrespective of whether they are of the same nationality, living site, andarrival cohort. If so, we should find the effect of Cif t to diminish with the timethe worker has spent on the farm. In column 3 we allow the effect of socialconnections to vary with a worker specific time trend—the number of days theworker has been present on the farm. There is no significant evidence of sucheffects, although the interaction terms are not precisely estimated.
correlation among the three measures is very low. In line with this we find their estimated effecton productivity to be the same, regardless of whether they are included together or one at a time.

1090O
.BA
ND
IER
A,I.B
AR
AN
KA
Y,A
ND
I.RA
SUL
TABLE A.III
ROBUSTNESS OF RESULTS TO TIME EFFECTSa
1. Farm 2. Field 3. Worker 4. Placebo Bonus 5. PlaceboSpecific Specific Specific Based on Field Bonus Based on
Time Trend Time Trend Time Trend Life Cycle 2004 Season
Share of managers connected to i, �165*** �188*** �269***fixed wages for managers (�043) (�067) (�094)
Share of managers connected to i, −�037 −�003 �345performance bonus for managers (�092) (�116) (�511)
Share of managers connected to i, −�018fixed wages for managers × (�076)2nd quarter dummy (31st May)
Share of managers connected to i, −�133performance bonus for managers × (�099)4th quarter dummy (29th July)
Share of managers connected to i, −�089fixed wages for managers × field life cycle (�141)
Share of managers connected to i, −�249performance bonus for managers × field life (�200)cycle
Share of managers connected to i, −�047fixed wages for managers × (�035)days on farm for worker i
Share of managers connected to i, −�109performance bonus for managers × (�132)days on farm for worker i
Share of managers connected to i, −�087placebo bonus based on field life cycle = 0 (�081)
Share of managers connected to i, −�033placebo bonus based on field life cycle = 1 (�138)
(Continues)

SOC
IAL
CO
NN
EC
TIO
NS
AN
DIN
CE
NT
IVE
S1091
TABLE A.III—Continued
1. Farm 2. Field 3. Worker 4. Placebo Bonus 5. PlaceboSpecific Specific Specific Based on Field Bonus Based on
Time Trend Time Trend Time Trend Life Cycle 2004 Season
Share of managers connected to i, �201*placebo bonus 2004 = 0 (�109)
Share of managers connected to i, �215***placebo bonus 2004 = 1 (�033)
Interactions of nationality × Yes Yes Yes Yes Yesperformance bonus dummy
Interactions of living site × Yes Yes Yes Yes Yesperformance bonus dummy
Interactions of arrival cohort × Yes Yes Yes Yes Yesperformance bonus dummy
Adjusted R-squared .4374 .4524 .4368 .6260 .4532Number of observations (worker-field-day) 8884 8884 8884 1584 2692
aDependent variable = log of worker’s productivity (kilograms picked per hour on the field-day). *** denotes significance at 1%, ** at 5%, and * at 10%. Standard errors arereported in parentheses and allow for clustering at the worker level. All specifications control for worker, field, and manager fixed effects. The other controls included in eachspecification are the managerial performance bonus dummy, the worker’s picking experience, the field life cycle, and a time trend. The field life cycle is defined as the nth daythe field is picked divided by the total number of days the field is picked over the season. All continuous variables are in logarithms. A manager and given worker i are definedto be connected if they are either of the same nationality, live in the same area, or are in the same arrival cohort. All sample workers are connected to at least one manager onat least one field-day and work at least one week under each incentive scheme. In column 1 the 2nd quarter dummy is defined to be equal to 0 before May 31st and equal to 1thereafter. The 4th quarter dummy is defined to be equal to 0 before July 29th and equal to 1 thereafter. These dummy variables split the pre- and postbonus periods equally intotwo halves. In column 3 the days on the farm for a worker are defined as the number of days elapsed since the worker first arrived on the farm. In column 4 the placebo bonusdummy based on the field life cycle is defined to be 0 if the field is less than .53 of the way though its life cycle, and 1 otherwise. In this column the sample is restricted to fields thatare only operated in the period when managers are paid a performance bonus (after June 27th). In column 5, the sample covers the same period of time (May 1st to Aug 31st)in the following year—2004—when managers were paid wages throughout. The placebo bonus is equal to 1 after June 27, 2004. The interaction terms at the foot of the table aredefined with respect to the placebo bonus dummy variable in columns 4 and 5.
1092 O. BANDIERA, I. BARANKAY, AND I. RASUL
Overall, the evidence in columns 1–3 indicates that the effect of social con-nections does not decline smoothly with time, field specific trends, or workerspecific trends. Rather there is a discontinuous effect of social connections onworker performance at the time when managerial performance bonuses wereintroduced. Given that we had full control over the timing of this change, ourexperimental research design ensures that the exact date on which the man-agerial incentive schemes changed is uncorrelated with any determinants ofindividual productivity.
To provide further support, columns 4 and 5 report the results of two placebotests. Column 4 uses fields that were picked only after the introduction of thebonus and are therefore excluded from our main sample. Given that in oursample the bonus is introduced when the average (and median) field is halfthe way through its life cycle, we define a placebo bonus dummy to be equalto 0 if the field is in the first half of its life cycle and equal to 1 if it is in thesecond half. The results in column 4 indicate that social connections have noeffect on worker productivity either side of the placebo dummy, thus ruling outthat our previous results were due to the effect of social connections naturallydisappearing once fields have reached half of their life cycle.
Column 5 uses data from the same tasks in the same farm one year later,namely in 2004, when the managers were paid fixed wages throughout the sea-son. We define the placebo bonus dummy to be equal to 0 before the datebonuses were introduced in 2003 (June 27th) and equal to 1 thereafter. Allvariables are defined as in (3) and the sample is selected according to the samecriteria.50 It is reassuring that column 5 shows that the effect of social connec-tions during the entire 2004 season is of similar magnitude to the effect beforethe introduction of the bonus in 2003. In other words, in 2004 when managersare paid fixed wages throughout the season, they appear to allocate more efforttoward connected workers throughout the season.
REFERENCES
AKERLOF, G. A. (1982): “Labor Contracts as a Partial Gift Exchange,” Quarterly Journal of Eco-nomics, 97, 543–569. [1050]
AKERLOF, G. A., AND J. L. YELLEN (1988): “Fairness and Unemployment,” American EconomicReview Papers and Proceedings, 78, 44–49. [1050]
BANDIERA, O., I. BARANKAY, AND I. RASUL (2005): “Social Preferences and the Response toIncentives: Evidence From Personnel Data,” Quarterly Journal of Economics, 120, 917–962.[1050]
(2007): “Incentives for Managers and Inequality Among Workers: Evidence From aFirm Level Experiment,” Quarterly Journal of Economics, 122, 729–774. [1050,1071]
(2008): “Social Capital in the Workplace: Evidence on Its Formation and Conse-quences,” Labor Economics, 15, 724–748. [1062]
50Namely, we select workers that work at least one week on either side of the placebo bonusand fields that are operated for at least one week either side. We restrict the sample to the peakpicking season (May 1 to August 31) and to the main site.

SOCIAL CONNECTIONS AND INCENTIVES 1093
BARNARD, C. (1938): The Functions of the Executive. Cambridge, MA: Harvard University Press.[1047]
BECKER, G. S. (1957): The Economics of Discrimination. Chicago: University of Chicago Press.[1050]
BÉNABOU, R., AND J. TIROLE (2003): “Intrinsic and Extrinsic Motivation,” Review of EconomicStudies, 70, 489–520. [1082]
BERTRAND, M., AND A. SCHOAR (2003): “Managing With Style: The Effect of Managers on FirmPolicies,” Quarterly Journal of Economics, 118, 1169–1208. [1049]
BERTRAND, M., F. KRAMARZ, A. SCHOAR, AND D. THESMAR (2005): “Politically ConnectedCEOs and Corporate Outcomes: Evidence From France,” Mimeo, University of Chicago.[1050]
BEWLEY, T. F. (1999): Why Wages Don’t Fall During a Recession. Cambridge, MA: Harvard Uni-versity Press. [1047]
BLACK, S. E., AND P. STRAHAN (2001): “The Division of Spoils: Rent Sharing and Discriminationin a Regulated Industry,” American Economic Review, 91, 814–831. [1050]
CHARNESS, G., AND P. KUHN (2005): “Pay Inequality, Pay Secrecy, and Effort: Theory and Evi-dence,” Mimeo, University of California, Santa Barbara. [1050]
FEHR, E., AND U. FISCHBACHER (2002): “Why Social Preferences Matter—The Impact of Non-Selfish Motives on Competition, Cooperation and Incentives,” Economic Journal, 112, C1–C33.[1050]
FERNANDEZ, R. M., E. J. CASTILLO, AND P. MOORE (2000): “Social Capital at Work: Networksand Employment at a Phone Center,” American Journal of Sociology, 105, 1288–1356. [1082]
FREY, B. S., AND F. OBERHOLZER-GEE (1997): “The Cost of Price Incentives: An EmpiricalAnalysis of Motivation Crowding-Out,” American Economic Review, 87, 746–755. [1082]
GARICANO, L., I. PALACIOS, AND C. PRENDERGAST (2005): “Favoritism Under Social Pressure,”Review of Economics and Statistics, 87, 208–216. [1050]
GIULIANO, L., D. I. LEVINE, AND J. LEONARD (2005): “Do Race, Gender, and Age DifferencesAffect Manager-Employee Relations? An Analysis of Quits, Dismissals, and Promotions at aLarge Retail Firm,” Mimeo, University of California, Berkeley. [1050]
HARRISON, G., AND J. LIST (2004): “Field Experiments,” Journal of Economic Literature, 152,1009–1055. [1055]
HOLMSTROM, B., AND P. MILGROM (1991): “Multitask Principal–Agent Analyses: Incentive Con-tracts, Asset Ownership, and Job Design,” Journal of Law, Economics and Organization, 7,24–52. [1055]
ICHNIOWSKI, C., AND K. L. SHAW (2005): “Connective Capital: Building Problem-Solving Net-works Within Firms,” Mimeo, Stanford University. [1082]
KANDEL, E., AND E. LAZEAR (1992): “Peer Pressure and Partnerships,” Journal of Political Econ-omy, 100, 801–813. [1047]
KOFMAN, F., AND J. LAWARREE (1993): “Collusion in Hierarchical Agency,” Econometrica, 61,629–656. [1048]
KRAMARZ, F., AND D. THESMAR (2005): “Social Networks in the Boardroom,” Discussion Pa-per 5496, CEPR. [1050]
KREPS, D. M. (1997): “The Interaction Between Norms and Economic Incentives: IntrinsicMotivation and Extrinsic Incentives,” American Economic Review Papers and Proceedings, 87,359–364. [1082]
LABAND, D. N., AND M. J. PIETTE (1994): “Favoritism versus Search for Good Papers: Empir-ical Evidence Regarding the Behavior of Journal Editors,” Journal of Political Economy, 102,194–203. [1050]
LAZEAR, E. P. (1989): “Pay Equality and Industrial Politics,” Journal of Political Economy, 97,561–580. [1047]
MALMENDIER, U., AND G. TATE (2005): “CEO Overconfidence and Corporate Investment,”Journal of Finance, 60, 2661–2700. [1049]
MAYO, E. (1933): The Human Problems of an Industrial Civilization. New York: Macmillan. [1047]

1094 O. BANDIERA, I. BARANKAY, AND I. RASUL
MIAN, A. R., AND A. I. KHWAJA (2005): “Do Lenders Favor Politically Connected Firms? RentProvision in an Emerging Financial Market,” Quarterly Journal of Economics, 120, 1371–1411.[1050]
MILGROM, P. R. (1988): “Employment Contracts, Influence Activities, and Efficient OrganizationDesign,” Journal of Political Economy, 96, 42–60. [1048]
MILGROM, P. R., AND J. ROBERTS (1990): “The Efficiency of Equity in Organizational DecisionProcesses,” American Economic Review Papers and Proceedings, 80, 154–159. [1048]
NAGIN, D., J. B. REBITZER, S. SANDERS, AND L. J. TAYLOR (2002): “Monitoring, Motivation, andManagement: The Determinants of Opportunistic Behavior in a Field Experiment,” AmericanEconomic Review, 92, 850–873. [1082]
PODOLNY, J. M., AND J. N. BARON (1997): “Resources and Relationships: Social Networks andMobility in the Workplace,” American Sociological Review, 62, 673–693. [1048]
PRENDERGAST, C., AND R. H. TOPEL (1996): “Favoritism in Organizations,” Journal of PoliticalEconomy, 104, 958–978. [1048,1057]
ROETHLISBERGER, F. J., AND W. DICKSON (1939): Management and the Worker. Cambridge: Har-vard University Press. [1047]
ROTEMBERG, J. J. (1994): “Human Relations in the Workplace,” Journal of Political Economy,102, 684–717. [1047]
ROY, D. (1952): “Quota Restriction and Goldbricking in a Machine Shop,” American Journal ofSociology, 57, 427–442. [1047]
TIROLE, J. (1986): “Hierarchies and Bureaucracies: On the Role of Collusion in Organizations,”Journal of Law, Economics and Organizations, 2, 181–214. [1048]
THOMAS, D. A. (1990): “The Impact of Race on Managers’ Experiences of Developmental Rela-tionships,” Journal of Organizational Behavior, 11, 479–492. [1048]
TSUI, A. S., AND C. A. OREILLY (1989): “Beyond Simple Demographic Effects: The Importanceof Relational Demography in Superior-Subordinate Dyads,” Academy of Management Journal,32, 402–423. [1048]
WESOLOWSKI, M. A., AND K. W. MOSSHOLDER (1997): “Relational Demography in Supervisor-Subordinate Dyads: Impact on Subordinate Job Satisfaction, Burnout, and Perceived Proce-dural Justice,” Journal of Organizational Behavior, 18, 351–362. [1048]
Dept. of Economics, London School of Economics and Political Science,Houghton Street, London WC2A 2AE, U.K.; [email protected],
The Wharton School, University of Pennsylvania, 3620 Locust Walk, Philadel-phia, PA 19104, U.S.A.; [email protected],
andDept. of Economics, University College London, Drayton House, 30 Gordon
Street, London WC1E 6BT, U.K.; [email protected].
Manuscript received May, 2006; final revision received December, 2008.