social development - national treasury
TRANSCRIPT
345
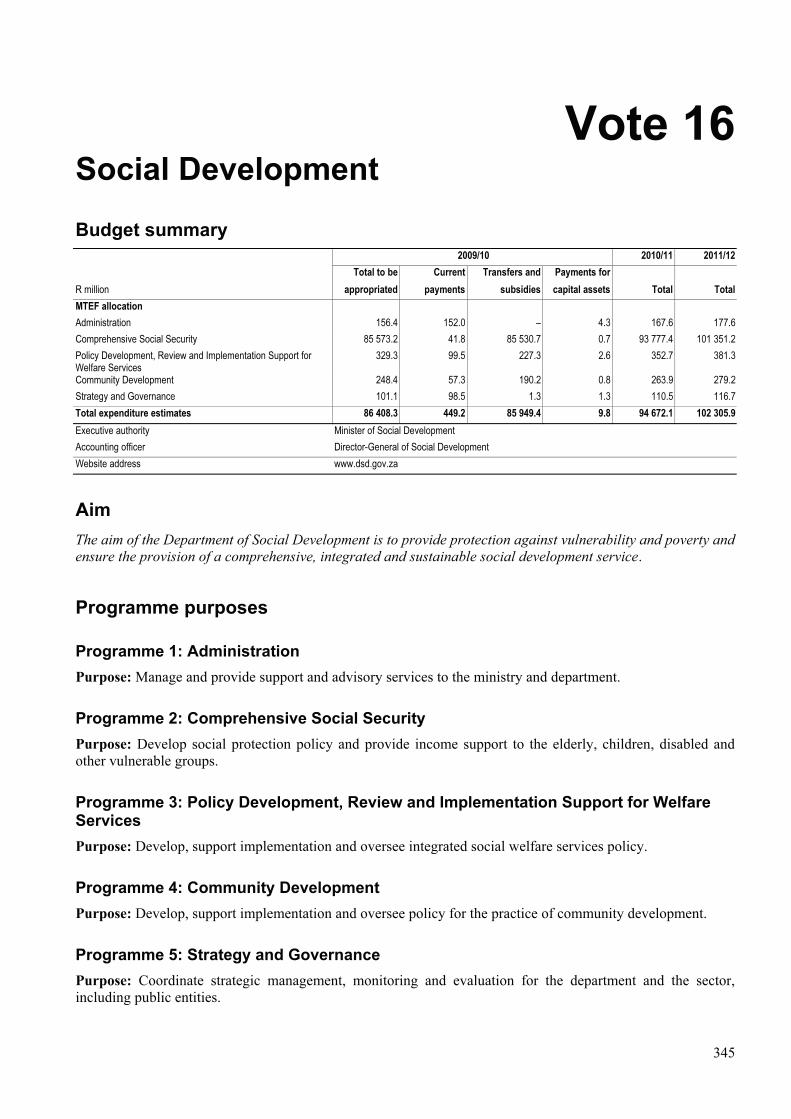
Vote 16 Social Development
Budget summary
2009/10 2010/11 2011/12
Total to be Current Transfers and Payments for
R million appropriated payments subsidies capital assets Total Total
MTEF allocation
Administration 156.4 152.0 – 4.3 167.6 177.6
Comprehensive Social Security 85 573.2 41.8 85 530.7 0.7 93 777.4 101 351.2
Policy Development, Review and Implementation Support for Welfare Services
329.3 99.5 227.3 2.6 352.7 381.3
Community Development 248.4 57.3 190.2 0.8 263.9 279.2
Strategy and Governance 101.1 98.5 1.3 1.3 110.5 116.7
Total expenditure estimates 86 408.3 449.2 85 949.4 9.8 94 672.1 102 305.9
Executive authority Minister of Social Development
Accounting officer Director-General of Social Development
Website address www.dsd.gov.za
Aim
The aim of the Department of Social Development is to provide protection against vulnerability and poverty and
ensure the provision of a comprehensive, integrated and sustainable social development service.
Programme purposes
Programme 1: Administration
Purpose: Manage and provide support and advisory services to the ministry and department.
Programme 2: Comprehensive Social Security
Purpose: Develop social protection policy and provide income support to the elderly, children, disabled and
other vulnerable groups.
Programme 3: Policy Development, Review and Implementation Support for Welfare Services
Purpose: Develop, support implementation and oversee integrated social welfare services policy.
Programme 4: Community Development
Purpose: Develop, support implementation and oversee policy for the practice of community development.
Programme 5: Strategy and Governance
Purpose: Coordinate strategic management, monitoring and evaluation for the department and the sector,
including public entities.

2009 Estimates of National Expenditure
346
Strategic overview: 2005/06 – 2011/12
The Department of Social Development continues to give effect to its constitutional mandate by providing
leadership in developing, implementing and monitoring social policy and related anti-poverty strategies to
respond more effectively to the material and social needs of the poor, vulnerable and marginalised members of
society. These objectives are underpinned by a range of legislation and policy documents.
Strategic and operational priorities
Over the medium term, the department will focus on the following key priorities: tackling poverty; promoting
the development of youth and social cohesion; strengthening links between civil society and communities;
improving governance and institutional development; and promoting regional and international solidarity and
support.
Key activities
Extending social assistance
While current social assistance policies provide for children in poor households, the disabled and the elderly,
further efforts are required to address vulnerability in other groups such as the youth, caregivers and the
unemployed.
To ensure the sustainability of the social assistance system, the department intends to develop policy proposals
that will foster greater responsibility and self-reliance, and link social safety net benefits to training and
employment.
Access to nutritious food
Current high inflation means that the poor are less able to access adequate, nutritious food. To mitigate the
impact of this, the department is participating in the integrated food security and nutrition task team led by the
Department of Agriculture. The community food bank concept, as a mechanism to improve access to adequate
and nutritious food, is being explored.
Social cooperatives
The main objective of social cooperatives is to create employment for disadvantaged and vulnerable groups
through the provision of social services. A 2008 report on building sustainable livelihoods concluded that, apart
from early childhood development and home community based care, there are other gaps in social service
delivery that could be used to pilot social cooperatives. Examples are waste removal and the provision of water,
mainly in rural areas. The department is currently developing a concept document and guidelines for
establishing and managing social cooperatives.
Quality developmental welfare services
Meeting the ongoing need to provide quality developmental social welfare services will be further addressed
through skills development and the development of policies, norms and standards, and appropriate processes
and systems to support service delivery.
Key legislative developments
The department aims to develop and finalise the following legislation over the medium term: the Prevention of
and Treatment for Substance Abuse Bill; the Social Service Professions Act (1978); the Nonprofit Organisations
Act (1997); the Social Assistance Amendment Bill: and new legislation for the social and disaster relief
disbursements and services provided by the department.

Vote 16: Social Development
347
Improving working conditions
The department will continue to implement programmes and strategies to improve the working conditions of
social service professionals and professionalise community development practice and youth work. This will
ensure that these two categories of professionals are guided by specific codes of conduct.
Community development practitioners
Standardising the education and training of community development practitioners is at an advanced stage. This
will lead to the registration of community development unit standards and qualifications at national
qualifications framework levels 4 to 6. Guidelines for community development practice will also be developed
in 2009/10 to guide practitioners and ensure improved and efficient service delivery.
Social security
Since its election to the Bureau of the International Social Security Association, the department has taken up
significant responsibilities in the arena of international social security policy development. The department’s
representatives fill the deputy chair positions of two of the bureau’s subcommittees. The department will
coordinate the activities of the Southern African regional office until 2010, when South Africa will host the
association’s 29th general assembly meeting and the second World Social Security Forum. The department has
also identified the need to undertake benchmark social security policy research in Africa rather than Latin
America, an initiative aimed at developing African based research.
In line with the social security service delivery model, the Independent Tribunal for Social Assistance Appeals
is being established as a specialised quasi judicial business enterprise. Its main function will be to provide
appeals services to social assistance grant applicants who would like to appeal against a decision by the South
African Social Security Agency. The backlog of cases dates from 2004. Most have been inherited from the
provinces following the transfer of the social assistance function. Urgent interventions are required, as well as
medium to long term solutions.
Selected performance and operations indicators
Table 16.1 Social Development
Indicator Programme Past Current Projections
2005/06 2006/07 2007/08 2008/09 2009/10 2010/11 2011/12
Total number of old age grant beneficiaries Comprehensive Social Security 2.1 million 2.2 million 2.2 million 2.3 million 2.5 million 2.6 million 2.7 million
Total number of war veterans grant beneficiaries
Comprehensive Social Security 3 343 2 832 2 340 1 649 1 386 1 164 977
Total number of disability grant beneficiaries Comprehensive Social Security 1.3 million 1.4 million 1.4 million 1.4 million 1.4 million 1.4 million 1.4 million
Total number of child support grant beneficiaries
Comprehensive Social Security 7 million 7.9 million 8.2 million 9.1 million 9.7 million 9.9 million 10.1 million
Total number of foster care grant beneficiaries Comprehensive Social Security 312 614 400 503 443 191 487 510 536 260 589 886 648 873
Total number of care dependency grant beneficiaries
Comprehensive Social Security 88 889 94 263 98 631 105 909 110 145 114 552 119 133
Total number of registered early childhood development sites captured on the national database
Policy Development, Review and Implementation Support for Welfare Services
– 8 000 9 726 10 755 16 276 23 639 26 000
Total number of social work scholarships awarded
Community Development – – 983 2 900 5 250 5 625 6 125
2009 Estimates of National Expenditure
348
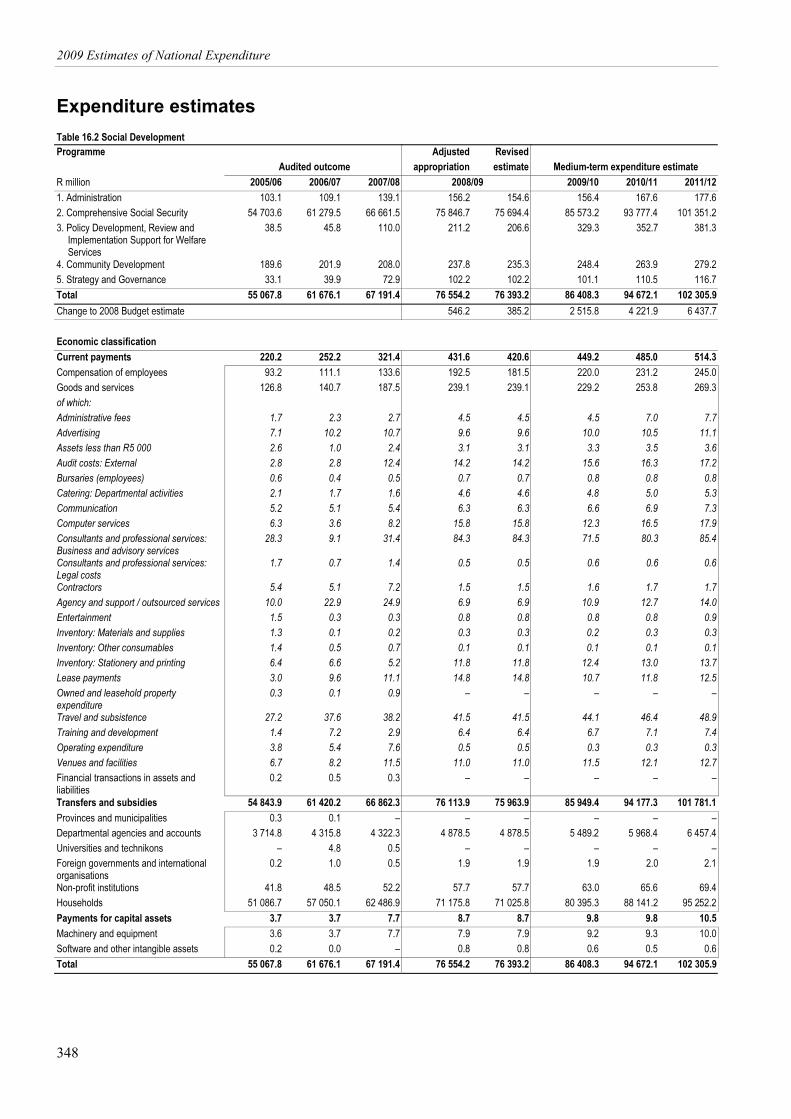
Expenditure estimates
Table 16.2 Social Development
Programme Adjusted Revised
Audited outcome appropriation estimate Medium-term expenditure estimate
R million 2005/06 2006/07 2007/08 2008/09 2009/10 2010/11 2011/12
1. Administration 103.1 109.1 139.1 156.2 154.6 156.4 167.6 177.6
2. Comprehensive Social Security 54 703.6 61 279.5 66 661.5 75 846.7 75 694.4 85 573.2 93 777.4 101 351.2
3. Policy Development, Review and Implementation Support for Welfare Services
38.5 45.8 110.0 211.2 206.6 329.3 352.7 381.3
4. Community Development 189.6 201.9 208.0 237.8 235.3 248.4 263.9 279.2
5. Strategy and Governance 33.1 39.9 72.9 102.2 102.2 101.1 110.5 116.7
Total 55 067.8 61 676.1 67 191.4 76 554.2 76 393.2 86 408.3 94 672.1 102 305.9
Change to 2008 Budget estimate 546.2 385.2 2 515.8 4 221.9 6 437.7
Economic classification
Current payments 220.2 252.2 321.4 431.6 420.6 449.2 485.0 514.3
Compensation of employees 93.2 111.1 133.6 192.5 181.5 220.0 231.2 245.0
Goods and services 126.8 140.7 187.5 239.1 239.1 229.2 253.8 269.3
of which:
Administrative fees 1.7 2.3 2.7 4.5 4.5 4.5 7.0 7.7
Advertising 7.1 10.2 10.7 9.6 9.6 10.0 10.5 11.1
Assets less than R5 000 2.6 1.0 2.4 3.1 3.1 3.3 3.5 3.6
Audit costs: External 2.8 2.8 12.4 14.2 14.2 15.6 16.3 17.2
Bursaries (employees) 0.6 0.4 0.5 0.7 0.7 0.8 0.8 0.8
Catering: Departmental activities 2.1 1.7 1.6 4.6 4.6 4.8 5.0 5.3
Communication 5.2 5.1 5.4 6.3 6.3 6.6 6.9 7.3
Computer services 6.3 3.6 8.2 15.8 15.8 12.3 16.5 17.9
Consultants and professional services: Business and advisory services
28.3 9.1 31.4 84.3 84.3 71.5 80.3 85.4
Consultants and professional services: Legal costs
1.7 0.7 1.4 0.5 0.5 0.6 0.6 0.6
Contractors 5.4 5.1 7.2 1.5 1.5 1.6 1.7 1.7
Agency and support / outsourced services 10.0 22.9 24.9 6.9 6.9 10.9 12.7 14.0
Entertainment 1.5 0.3 0.3 0.8 0.8 0.8 0.8 0.9
Inventory: Materials and supplies 1.3 0.1 0.2 0.3 0.3 0.2 0.3 0.3
Inventory: Other consumables 1.4 0.5 0.7 0.1 0.1 0.1 0.1 0.1
Inventory: Stationery and printing 6.4 6.6 5.2 11.8 11.8 12.4 13.0 13.7
Lease payments 3.0 9.6 11.1 14.8 14.8 10.7 11.8 12.5
Owned and leasehold property expenditure
0.3 0.1 0.9 – – – – –
Travel and subsistence 27.2 37.6 38.2 41.5 41.5 44.1 46.4 48.9
Training and development 1.4 7.2 2.9 6.4 6.4 6.7 7.1 7.4
Operating expenditure 3.8 5.4 7.6 0.5 0.5 0.3 0.3 0.3
Venues and facilities 6.7 8.2 11.5 11.0 11.0 11.5 12.1 12.7
Financial transactions in assets and liabilities
0.2 0.5 0.3 – – – – –
Transfers and subsidies 54 843.9 61 420.2 66 862.3 76 113.9 75 963.9 85 949.4 94 177.3 101 781.1
Provinces and municipalities 0.3 0.1 – – – – – –
Departmental agencies and accounts 3 714.8 4 315.8 4 322.3 4 878.5 4 878.5 5 489.2 5 968.4 6 457.4
Universities and technikons – 4.8 0.5 – – – – –
Foreign governments and international organisations
0.2 1.0 0.5 1.9 1.9 1.9 2.0 2.1
Non-profit institutions 41.8 48.5 52.2 57.7 57.7 63.0 65.6 69.4
Households 51 086.7 57 050.1 62 486.9 71 175.8 71 025.8 80 395.3 88 141.2 95 252.2
Payments for capital assets 3.7 3.7 7.7 8.7 8.7 9.8 9.8 10.5
Machinery and equipment 3.6 3.7 7.7 7.9 7.9 9.2 9.3 10.0
Software and other intangible assets 0.2 0.0 – 0.8 0.8 0.6 0.5 0.6
Total 55 067.8 61 676.1 67 191.4 76 554.2 76 393.2 86 408.3 94 672.1 102 305.9
Vote 16: Social Development
349
Expenditure trends
Total expenditure grew from R55.1 billion in 2005/06 to R76.6 billion in 2008/09, at an average annual rate of
11.6 per cent, and is expected to increase to R102.3 billion in 2011/12, at an average annual rate of
10.1 per cent. The provision for social assistance constitutes the largest portion of the department’s budget,
approximately 93 per cent (R80.4 billion) in 2009/10. Other large transfers in 2009/10 include R5.1 billion to
the South African Social Security Agency for grant administration, R144.8 million to the National Development
Agency, R210 million for social work bursaries and R41 million to loveLife. Total transfers in 2009/10 amount
to 99.5 per cent of the department’s budget, leaving an operational budget of around R458 million in 2009/10,
growing to R524.8 million in 2011/12 at an average annual rate of 7 per cent over the MTEF period.
Expenditure on compensation of employees is expected to increase from R192.5 million in 2008/09 to
R245 million in 2011/12 at an average annual rate of 8.4 per cent. The department intends to fill all currently
funded vacancies during 2009/10, with a view to consolidating functions and reviewing current business
processes as part of a comprehensive human capital strategy for the national and provincial departments. This
strategy will inform future changes to the organisational structure of the department.
Additional allocations over the MTEF period include:
• R10 million per year to establish an appeals tribunal in terms of the South African Social Security Agency
Act (2004) and the Social Assistance Act (2004)
• R2.3 billion in 2009/10, R3.8 billion in 2010/11 and R5.9 billion in 2011/12 for inflation adjustments to the
social assistance grants, the age equalisation of the old age pension, and revisions to the means tests
• R6.8 million in 2009/10, R7.1 million in 2010/11 and R7.4 million in 2011/12 for the shortfall in
compensation of employees for salary increases following the 2007 Public Service Coordinating Bargaining
Council resolution
• R255.3 million in 2009/10, R388 million in 2010/11 and R319.1 million in 2011/12 to the South African
Social Security Agency to augment the handling fees budget, implement an anti-fraud strategy, and for
salary increases following the 2007 resolution.
Savings and reprioritisation
Efficiency savings of R212.4 million have been identified over the MTEF period under the following items:
R56.7 million in goods and services and R155.7 million in transfers to public entities.
The department is currently reviewing its operational systems to facilitate improved service delivery and
operations and to accommodate the decrease in the baseline allocations for the department’s operations over the
MTEF period. This includes streamlining its business processes to reduce costs related to travelling, hosting
meetings and workshops, and outsourced professional services.
Departmental receipts
As a policy making department, the Department of Social Development does not generate income. The major
revenue item relates to interest earned on social assistance transfer funds deposited into the bank accounts of
cash payment contractors before they are disbursed to beneficiaries. Other departmental receipts include interest
on debt, cancellation of uncashed cheques, parking fees for senior managers, recoveries of private telephone
expenses, and breach of study contracts.
The major once-off revenue item of R865 million in 2006/07 was made up of interest earned on social
assistance transfers and unspent conditional grant funding on social assistance transfers to provinces.

2009 Estimates of National Expenditure
350
Table 16.3 Departmental receipts
Adjusted Revised
Audited outcome estimate estimate Medium-term receipts estimate
R thousand 2005/06 2006/07 2007/08 2008/09 2009/10 2010/11 2011/12
Departmental receipts 304 865 273 236 957 2 394 116 163 173 185
Sales of goods and services produced by department
63 82 84 92 77 28 30 35
Interest, dividends and rent on land 45 22 622 9 821 2 210 10 30 32 35
Sales of capital assets 181 – – – – – – –
Financial transactions in assets and liabilities 15 842 569 227 052 92 29 105 111 115
Total 304 865 273 236 957 2 394 116 163 173 185
Programme 1: Administration
Expenditure estimates
Table 16.4 Administration
Subprogramme Adjusted
Audited outcome appropriation Medium-term expenditure estimate
R million 2005/06 2006/07 2007/08 2008/09 2009/10 2010/11 2011/12
Minister1 1.4 1.1 1.2 1.0 1.7 1.8 1.9
Deputy Minister1 1.4 0.9 0.9 0.8 1.4 1.5 1.6
Management 6.1 6.7 6.6 5.4 6.4 6.7 7.4
Corporate Services 86.2 92.2 121.5 138.7 135.0 145.2 152.8
Property Management 8.1 8.2 8.9 10.1 11.2 12.3 13.1
Government Motor Transport – – – 0.1 0.7 0.0 0.8
Total 103.1 109.1 139.1 156.2 156.4 167.6 177.6
Change to 2008 Budget estimate 7.0 (2.4) (3.3) (1.7)
1. From 2008/09, the current payments relating to the total remuneration package of political office bearers are shown, before this, only salary and car allowance are included. Administrative and other subprogramme expenditure may in addition include payments for capital assets as well as transfers and subsidies.
Economic classification
Current payments 101.4 107.1 136.0 153.2 152.0 163.5 173.1
Compensation of employees 40.6 52.8 58.8 71.1 82.3 86.9 92.1
Goods and services 60.7 54.0 77.0 82.1 69.7 76.6 81.0
of which:
Administrative fees 0.3 0.8 1.1 0.6 0.6 0.6 0.7
Advertising 1.5 1.4 1.1 1.6 1.7 1.8 1.9
Assets less than R5 000 1.4 0.1 1.4 1.6 1.7 1.7 1.8
Audit costs: External 2.8 2.8 12.4 14.2 15.6 16.3 17.2
Bursaries (employees) 0.4 0.4 0.5 0.6 0.6 0.6 0.7
Catering: Departmental activities 0.9 0.3 0.3 0.7 0.7 0.8 0.8
Communication 4.9 4.4 5.0 4.9 5.2 5.4 5.7
Computer services 5.4 2.3 3.6 9.2 5.4 9.3 10.3
Consultants and professional services: Business and advisory services
8.1 – 7.2 11.9 6.2 5.7 5.8
Consultants and professional services: Legal costs
1.4 0.0 – 0.1 0.1 0.1 0.1
Contractors 2.5 3.0 2.5 0.5 0.5 0.5 0.5
Agency and support / outsourced services 5.0 6.2 6.4 1.0 1.1 1.1 1.2
Entertainment 1.2 0.1 0.2 0.7 0.7 0.8 0.8
Inventory: Materials and supplies 1.2 0.1 0.2 0.7 0.1 0.1 0.1
Inventory: Other consumables 1.4 0.5 0.6 – – – –
Inventory: Stationery and printing 2.9 2.1 1.3 3.0 3.1 3.3 3.4
Lease payments 1.1 9.4 9.6 14.5 10.4 11.4 12.1
Travel and subsistence 12.6 15.6 15.6 11.8 11.5 12.2 12.9
Training and development 0.7 1.1 1.2 2.5 2.6 2.7 2.9
Operating expenditure 2.3 1.9 4.3 0.4 0.1 0.1 0.1
Venues and facilities 2.3 1.2 2.1 1.7 1.8 1.9 2.0
Financial transactions in assets and liabilities
0.2 0.4 0.2 – – – –

Vote 16: Social Development
351
Table 16.4 Administration (continued)
Adjusted
Audited outcome appropriation Medium-term expenditure estimate
R million 2005/06 2006/07 2007/08 2008/09 2009/10 2010/11 2011/12
Transfers and subsidies 0.1 0.0 – – – – –
Provinces and municipalities 0.1 0.0 – – – – –
Departmental agencies and accounts 0.0 – – – – – –
Payments for capital assets 1.6 1.9 3.1 3.0 4.3 4.1 4.5
Machinery and equipment 1.5 1.9 3.1 2.6 4.0 3.7 4.1
Software and other intangible assets 0.1 – – 0.4 0.4 0.4 0.4
Total 103.1 109.1 139.1 156.2 156.4 167.6 177.6
Expenditure trends
Expenditure grew at an average annual rate of 14.8 per cent between 2005/06 and 2008/09 and is projected to
increase at an average annual rate of 4.4 per cent between 2008/09 and 2011/12. Expenditure covers, among
others: the progressive improvement of the department’s management and operational capacity; the increased
demand for litigation management and administration in line with the Social Assistance Act (2004); and the
devolution of accommodation funds from the Department of Public Works from 2009/10 (R11.2 million in
2009/10, R12.3 million in 2010/11, and R13.1 million in 2011/12).
Programme 2: Comprehensive Social Security
• Administration.
• Social Assistance provides for developing and reviewing social assistance policies and legislation. Funding
is based on the operational requirements of the subprogramme and research planned over the MTEF period.
• Social Insurance provides for developing policies and legislation for contributory income support related to
employment based risks and other contingencies. Funding is based on the operational requirements of the
subprogramme and research planned over the MTEF period.
• Policy Implementation Support supports the establishment of institutional arrangements and service
delivery. Funding is based on the operational requirements of the subprogramme.
• Social Assistance Transfers provides for social assistance transfers to households. Funding is based on the
projected number of social grant beneficiaries.
• SASSA provides for the transfer payment to the South African Social Security Agency for the operational
costs of the agency. Funding is based on the projected number of social grant beneficiaries and the agency’s
operational requirements.
• SASSA MIS provides for the transfer payment to the agency for the establishment of a management
information system. Funding is earmarked for establishing the registry and archiving management
information system.
• International Social Security contributes to regional and international social security policy developments.
Funding is based on the operational requirements of the unit and membership fees to international
organisations.
Objectives and measures
• Reduce poverty and vulnerability by diminishing people’s exposure to risk and increasing their capacity to
protect themselves against life cycle hazards and shocks that threaten their livelihood by:
• providing social assistance to all eligible beneficiaries over the MTEF period
– introducing a new legislative framework for social and disaster relief in 2009
– determining the extent of vulnerability among youth, caregivers of social assistance beneficiaries, and
unemployed adults, and developing options for addressing this by 2011
– developing options for a mandatory system of retirement provision by 2009.
2009 Estimates of National Expenditure
352
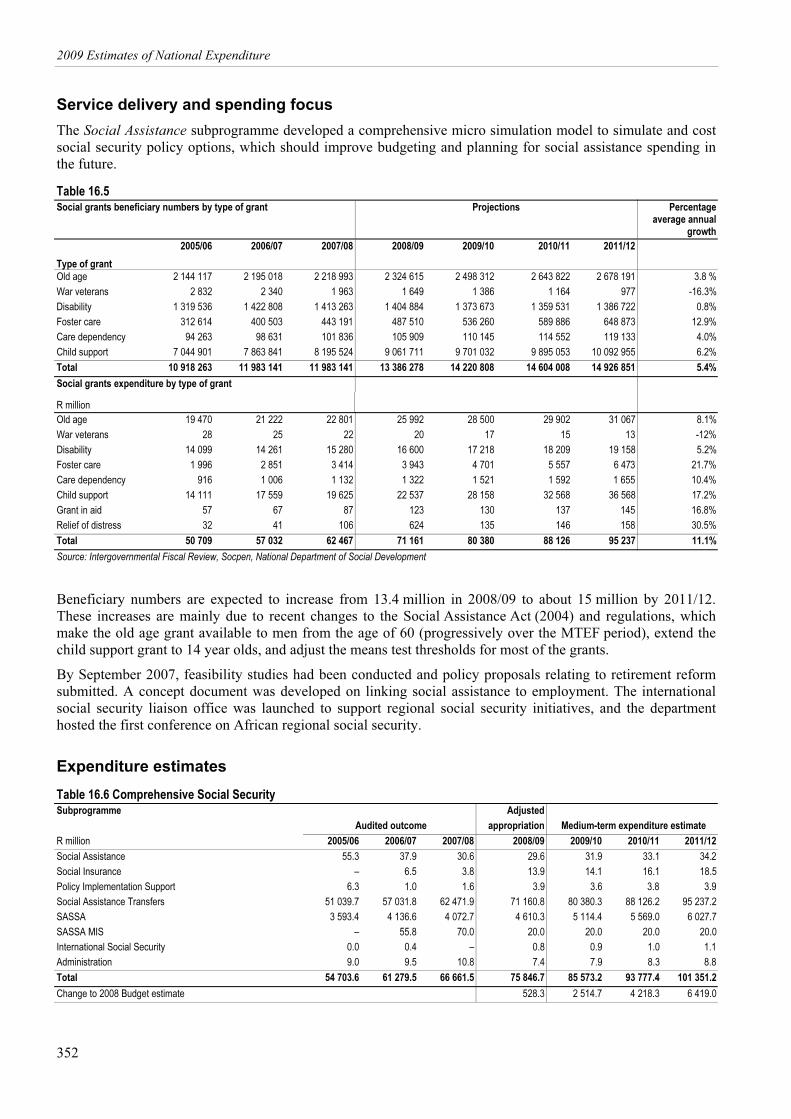
Service delivery and spending focus
The Social Assistance subprogramme developed a comprehensive micro simulation model to simulate and cost
social security policy options, which should improve budgeting and planning for social assistance spending in
the future.
Table 16.5
Social grants beneficiary numbers by type of grant Projections Percentage average annual
growth
2005/06 2006/07 2007/08 2008/09 2009/10 2010/11 2011/12
Type of grant
Old age 2 144 117 2 195 018 2 218 993 2 324 615 2 498 312 2 643 822 2 678 191 3.8 %
War veterans 2 832 2 340 1 963 1 649 1 386 1 164 977 -16.3%
Disability 1 319 536 1 422 808 1 413 263 1 404 884 1 373 673 1 359 531 1 386 722 0.8%
Foster care 312 614 400 503 443 191 487 510 536 260 589 886 648 873 12.9%
Care dependency 94 263 98 631 101 836 105 909 110 145 114 552 119 133 4.0%
Child support 7 044 901 7 863 841 8 195 524 9 061 711 9 701 032 9 895 053 10 092 955 6.2%
Total 10 918 263 11 983 141 11 983 141 13 386 278 14 220 808 14 604 008 14 926 851 5.4%
Social grants expenditure by type of grant
R million
Old age 19 470 21 222 22 801 25 992 28 500 29 902 31 067 8.1%
War veterans 28 25 22 20 17 15 13 -12%
Disability 14 099 14 261 15 280 16 600 17 218 18 209 19 158 5.2%
Foster care 1 996 2 851 3 414 3 943 4 701 5 557 6 473 21.7%
Care dependency 916 1 006 1 132 1 322 1 521 1 592 1 655 10.4%
Child support 14 111 17 559 19 625 22 537 28 158 32 568 36 568 17.2%
Grant in aid 57 67 87 123 130 137 145 16.8%
Relief of distress 32 41 106 624 135 146 158 30.5%
Total 50 709 57 032 62 467 71 161 80 380 88 126 95 237 11.1%
Source: Intergovernmental Fiscal Review, Socpen, National Department of Social Development
Beneficiary numbers are expected to increase from 13.4 million in 2008/09 to about 15 million by 2011/12.
These increases are mainly due to recent changes to the Social Assistance Act (2004) and regulations, which
make the old age grant available to men from the age of 60 (progressively over the MTEF period), extend the
child support grant to 14 year olds, and adjust the means test thresholds for most of the grants.
By September 2007, feasibility studies had been conducted and policy proposals relating to retirement reform
submitted. A concept document was developed on linking social assistance to employment. The international
social security liaison office was launched to support regional social security initiatives, and the department
hosted the first conference on African regional social security.
Expenditure estimates
Table 16.6 Comprehensive Social Security
Subprogramme Adjusted
Audited outcome appropriation Medium-term expenditure estimate
R million 2005/06 2006/07 2007/08 2008/09 2009/10 2010/11 2011/12
Social Assistance 55.3 37.9 30.6 29.6 31.9 33.1 34.2
Social Insurance – 6.5 3.8 13.9 14.1 16.1 18.5
Policy Implementation Support 6.3 1.0 1.6 3.9 3.6 3.8 3.9
Social Assistance Transfers 51 039.7 57 031.8 62 471.9 71 160.8 80 380.3 88 126.2 95 237.2
SASSA 3 593.4 4 136.6 4 072.7 4 610.3 5 114.4 5 569.0 6 027.7
SASSA MIS – 55.8 70.0 20.0 20.0 20.0 20.0
International Social Security 0.0 0.4 – 0.8 0.9 1.0 1.1
Administration 9.0 9.5 10.8 7.4 7.9 8.3 8.8
Total 54 703.6 61 279.5 66 661.5 75 846.7 85 573.2 93 777.4 101 351.2
Change to 2008 Budget estimate 528.3 2 514.7 4 218.3 6 419.0
Vote 16: Social Development
353
Table 16.6 Comprehensive Social Security (continued)
Adjusted
Audited outcome appropriation Medium-term expenditure estimate
R million 2005/06 2006/07 2007/08 2008/09 2009/10 2010/11 2011/12
Economic classification
Current payments 23.0 36.1 31.4 39.2 41.8 45.6 49.5
Compensation of employees 7.7 9.0 10.0 16.1 17.6 18.4 19.5
Goods and services 15.3 27.1 21.3 23.1 24.2 27.1 30.0
of which:
Administrative fees 0.4 0.5 0.2 0.1 0.5 0.7 0.9
Advertising 0.1 3.7 2.9 0.1 0.1 0.1 0.1
Assets less than R5 000 0.2 0.1 0.1 1.0 1.1 1.1 1.2
Catering: Departmental activities 0.1 0.0 0.2 0.6 0.6 0.7 0.7
Computer services 0.8 1.3 0.5 – – – –
Consultants and professional services: Business and advisory services
6.5 2.3 7.4 15.9 16.2 18.4 20.7
Consultants and professional services: Legal costs 0.0 0.0 0.5 – – – –
Contractors 1.4 0.1 0.3 0.0 0.0 0.0 0.0
Agency and support / outsourced services 2.8 10.1 2.5 – – – –
Inventory: Stationery and printing 0.4 0.5 0.5 0.5 0.5 0.5 0.5
Owned and leasehold property expenditure 0.0 – 0.4 – – – –
Travel and subsistence 1.2 2.4 2.9 3.3 3.5 3.7 3.9
Training and development 0.2 5.1 0.5 0.5 0.5 0.5 0.6
Operating expenditure 0.0 0.2 0.4 0.1 0.1 0.1 0.1
Venues and facilities 0.9 0.5 1.9 0.7 0.8 0.8 0.8
Financial transactions in assets and liabilities 0.0 0.0 0.1 – – – –
Transfers and subsidies 54 680.1 61 243.3 66 629.6 75 806.9 85 530.7 93 731.1 101 300.9
Provinces and municipalities 0.1 0.0 – – – – –
Departmental agencies and accounts 3 593.4 4 192.4 4 142.7 4 630.3 5 134.4 5 589.0 6 047.7
Foreign governments and international organisations – 0.8 – 0.8 0.9 1.0 1.1
Households 51 086.7 57 050.1 62 486.9 71 175.8 80 395.3 88 141.2 95 252.2
Payments for capital assets 0.5 0.1 0.5 0.6 0.7 0.7 0.8
Machinery and equipment 0.5 0.1 0.5 0.6 0.7 0.7 0.7
Software and other intangible assets – – – 0.1 0.0 0.0 0.0
Total 54 703.6 61 279.5 66 661.5 75 846.7 85 573.2 93 777.4 101 351.2
Details of selected transfers and subsidies
Departmental agencies and accounts
Departmental agencies (non-business entities)
Current 3 593.4 4 192.4 4 142.7 4 630.3 5 134.4 5 589.0 6 047.7
South African Social Security Agency (SASSA) 3 593.4 4 136.6 4 072.7 4 610.3 5 114.4 5 569.0 6 027.7
South African Social Security Agency (MIS) – 55.8 70.0 20.0 20.0 20.0 20.0
Foreign governments and international organisations
Current – 0.8 – 0.8 0.9 1.0 1.1
International Social Security Association – 0.8 – 0.8 0.9 1.0 1.1
Households
Social benefits
Current 51 039.7 57 037.1 62 471.9 71 160.8 80 380.3 88 126.2 95 237.2
Social assistance transfers 51 039.7 57 037.1 62 471.9 71 160.8 80 380.3 88 126.2 95 237.2
Households
Other transfers to households
Current 47.0 13.0 14.9 15.0 15.0 15.0 15.0
Disaster relief fund 42.0 10.0 10.0 – – – –
Social relief fund 5.0 3.0 4.9 15.0 15.0 15.0 15.0
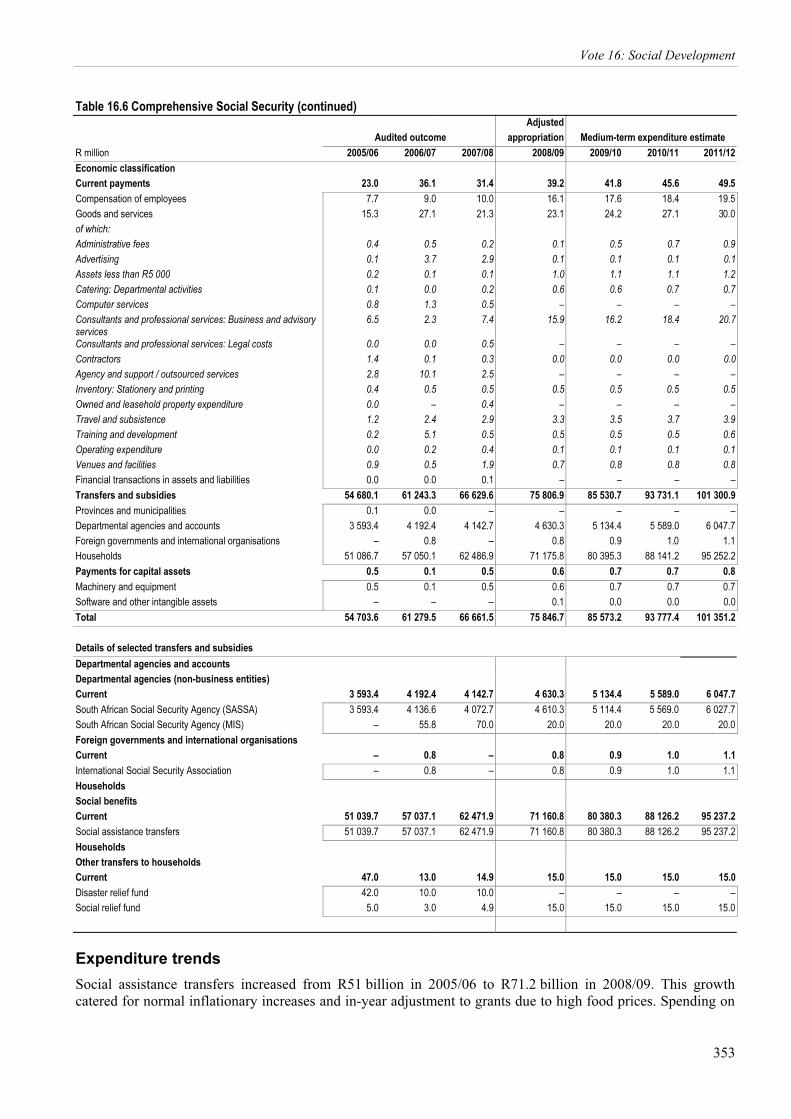
Expenditure trends
Social assistance transfers increased from R51 billion in 2005/06 to R71.2 billion in 2008/09. This growth
catered for normal inflationary increases and in-year adjustment to grants due to high food prices. Spending on

2009 Estimates of National Expenditure
354
the old age grant grew from R19.5 billion in 2005/06 to R26.4 billion in 2008/09, representing an increase of
R6.9 billion. Spending on the old age grants constitutes the largest portion of the budget in 2008/9
(R26.4 billion), followed closely by the child support grant at R21.6 billion and the disability grant at
R17.7 billion.
Overall, spending on social assistance grants is projected to grow by an average annual 10.2 per cent over the
MTEF period to reach R95.2 billion in 2011/12. This is mainly due to inflation adjustments, the extension of the
child support grant to the qualifying age of 15, the equalisation of the old age pension for men, and adjustments
to the means tests for all grants. An additional R12 billion is allocated over the MTEF period to cater for these
interventions.
The budget of the South African Social Security Agency increases by an average annual 9.3 per cent over the
MTEF period to cater for the operationalisation of the institution and the increase in delivery costs due to an
increase in the number of eligible beneficiaries.
Public entities
South African Social Security Agency
Strategic overview: 2005/06 – 2011/12
The South African Social Security Agency derives its mandate from the South African Social Security Agency
Act (2004), which is to administer and pay social assistance grants to eligible beneficiaries.
The agency identified the following key priorities over the medium term:
• continuation of institutional reforms, which includes projects related to the restructuring of the organisation
to produce a more streamlined and efficient entity
• reforms and improvements to benefit grants administration and payment services by introducing new policy
and regulatory initiatives and revised financial and administrative processes
• fraud prevention and detection
• implementation of social assistance legislation and policy, with particular emphasis on the disability
management initiatives.
The South African Social Security Agency provides administration and management services for grants, from
application to payment, and is systematically moving towards expanding its services to include referral services
to other social welfare institutions. Over the medium term, the agency will aim to improve social grants service
delivery and administrative stability, while at the same time promoting and implementing social security
reforms, as directed by the minister and the interministerial committee on social security reform. The agency
will thus focus on increasing access to social grants, improving social grants administration and payments, and
implementing improved systems for applying the different means tests for the different social grants.
The existing structural and operational challenges relating to the current cash payment system of social grants
will be reviewed, with the aim of developing a more cost effective service through partnerships with other
government institutions such as the South African Post Office, and private parties such as banks and private
payment service providers.
The improved grant application process project has been initiated and is set to resolve challenges related to
processing grant applications across the agency’s regions. The project aims to improve service delivery by
streamlining the current process to ensure that all application processes across the regions are standardised.
The integrated community registration outreach programme, aimed at promoting accessibility to grants by
eligible beneficiaries in remote areas, has been initiated. Since its launch in May 2007, about
112 000 beneficiaries, mainly from rural communities, have been able to access services through its mobile
units.
Vote 16: Social Development
355
Further improvements are planned, which will include the rollout of a registry and archiving management
information system across all provinces. This will improve controls, as demonstrated in Eastern Cape, which
has achieved significant improvements in its audit reports.
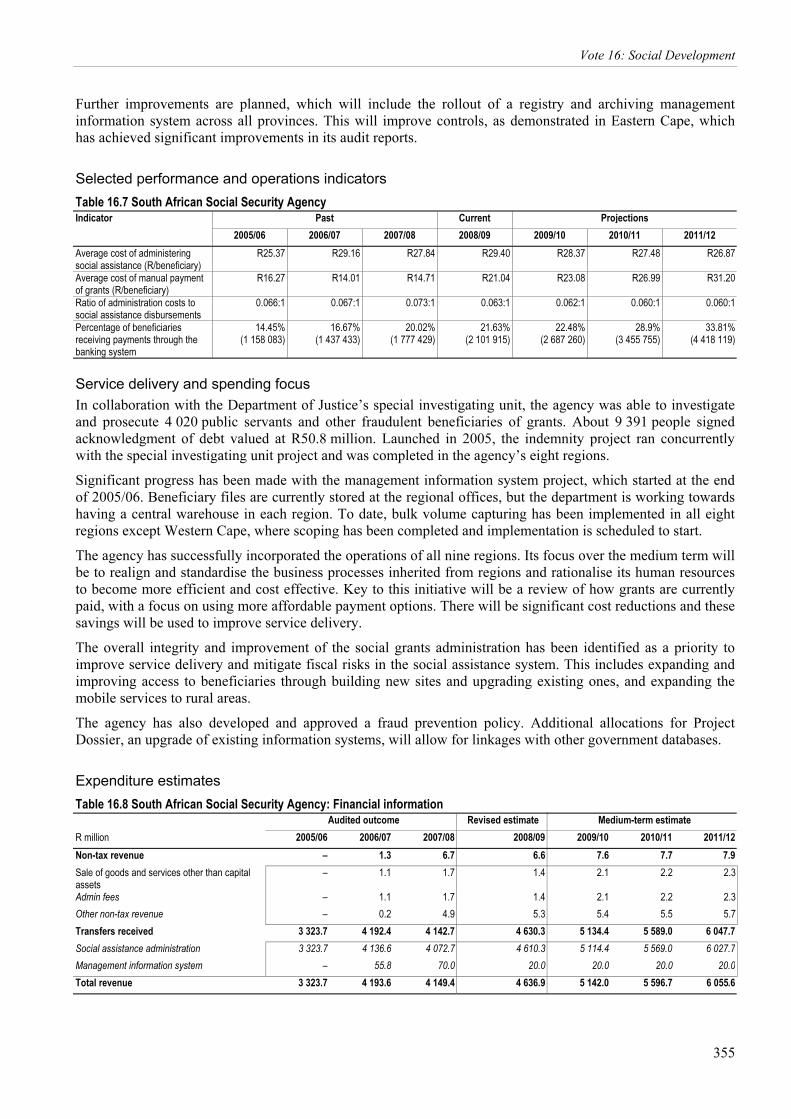
Selected performance and operations indicators
Table 16.7 South African Social Security Agency Indicator Past Current Projections
2005/06 2006/07 2007/08 2008/09 2009/10 2010/11 2011/12
Average cost of administering social assistance (R/beneficiary)
R25.37 R29.16 R27.84 R29.40 R28.37 R27.48 R26.87
Average cost of manual payment of grants (R/beneficiary)
R16.27 R14.01 R14.71 R21.04 R23.08 R26.99 R31.20
Ratio of administration costs to social assistance disbursements
0.066:1 0.067:1 0.073:1 0.063:1 0.062:1 0.060:1 0.060:1
Percentage of beneficiaries receiving payments through the banking system
14.45% (1 158 083)
16.67%(1 437 433)
20.02%(1 777 429)
21.63%(2 101 915)
22.48% (2 687 260)
28.9%(3 455 755)
33.81%(4 418 119)
Service delivery and spending focus
In collaboration with the Department of Justice’s special investigating unit, the agency was able to investigate
and prosecute 4 020 public servants and other fraudulent beneficiaries of grants. About 9 391 people signed
acknowledgment of debt valued at R50.8 million. Launched in 2005, the indemnity project ran concurrently
with the special investigating unit project and was completed in the agency’s eight regions.
Significant progress has been made with the management information system project, which started at the end
of 2005/06. Beneficiary files are currently stored at the regional offices, but the department is working towards
having a central warehouse in each region. To date, bulk volume capturing has been implemented in all eight
regions except Western Cape, where scoping has been completed and implementation is scheduled to start.
The agency has successfully incorporated the operations of all nine regions. Its focus over the medium term will
be to realign and standardise the business processes inherited from regions and rationalise its human resources
to become more efficient and cost effective. Key to this initiative will be a review of how grants are currently
paid, with a focus on using more affordable payment options. There will be significant cost reductions and these
savings will be used to improve service delivery.
The overall integrity and improvement of the social grants administration has been identified as a priority to
improve service delivery and mitigate fiscal risks in the social assistance system. This includes expanding and
improving access to beneficiaries through building new sites and upgrading existing ones, and expanding the
mobile services to rural areas.
The agency has also developed and approved a fraud prevention policy. Additional allocations for Project
Dossier, an upgrade of existing information systems, will allow for linkages with other government databases.
Expenditure estimates
Table 16.8 South African Social Security Agency: Financial information
Audited outcome Revised estimate Medium-term estimate
R million 2005/06 2006/07 2007/08 2008/09 2009/10 2010/11 2011/12
Non-tax revenue – 1.3 6.7 6.6 7.6 7.7 7.9
Sale of goods and services other than capital assets
– 1.1 1.7 1.4 2.1 2.2 2.3
Admin fees – 1.1 1.7 1.4 2.1 2.2 2.3
Other non-tax revenue – 0.2 4.9 5.3 5.4 5.5 5.7
Transfers received 3 323.7 4 192.4 4 142.7 4 630.3 5 134.4 5 589.0 6 047.7
Social assistance administration 3 323.7 4 136.6 4 072.7 4 610.3 5 114.4 5 569.0 6 027.7
Management information system – 55.8 70.0 20.0 20.0 20.0 20.0
Total revenue 3 323.7 4 193.6 4 149.4 4 636.9 5 142.0 5 596.7 6 055.6

2009 Estimates of National Expenditure
356
Table 16.8 South African Social Security Agency: Financial information (continued)
Audited outcome Revised estimate Medium-term estimate
R million 2005/06 2006/07 2007/08 2008/09 2009/10 2010/11 2011/12
Current expense 3 090.8 3 655.6 4 440.7 4 492.3 4 845.3 5 362.2 5 808.1
Compensation of employees 570.7 710.7 1 079.7 1 355.6 1 407.8 1 595.5 1 708.7
Goods and services 2 520.1 2 944.9 3 361.0 3 136.6 3 437.5 3 766.7 4 099.4
of which:
Payment contractors 2 131.3 2 015.1 2 189.9 2 486.0 2 687.5 2 956.2 3 133.5
Consultants, contractors and special services 170.0 175.4 183.1 148.8 101.0 107.0 113.5
Travel and subsistence 57.0 80.8 109.0 111.3 61.9 67.7 70.8
Other 161.8 673.6 878.9 390.6 587.1 635.7 781.6
Transfers and subsidies 0.6 1.4 1.3 9.7 15.8 17.0 18.1
Provinces and municipalities 0.6 0.5 0.1 0.0 – – –
Other government agencies – – – 8.0 15.1 16.2 17.3
Households – 0.9 1.2 1.6 0.7 0.8 0.8
Payments for capital assets 232.2 162.2 108.9 135.0 280.9 217.5 229.3
Buildings and other fixed structures 145.1 100.1 – – – – –
Machinery and equipment 87.2 57.1 107.8 80.7 222.2 155.6 164.0
Software and other intangible assets – 5.0 1.0 54.3 58.7 61.9 65.3
Total expense 3 323.7 3 819.2 4 550.9 4 636.9 5 142.0 5 596.7 6 055.6
Surplus / (deficit) – 374.5 (401.5) – – – –
Expenditure trends
The agency’s budget allocation for 2007/08 was R4.1 billion and approval was obtained to retain an
accumulated surplus of R374.5 million for claims against the agency and outstanding commitments. The agency
overspent by R26 million, resulting in total expenditure of R4.6 billion.
R4.6 billion is allocated to the 2008/09 administration budget, an increase of 11.8 per cent on the 2007/08 main
appropriation, excluding the surplus from the previous year. The payment to the cash payment contractors
accounts for approximately 53 per cent of the administration budget, followed by compensation of employees at
approximately 29 per cent, and 18 per cent for other operational expenditure.
Over the medium term, the administration budget increases by 11 per cent from R4.6 billion in 2008/09 to
R5.1 billion in 2009/10. It grows by a further 9.8 per cent to R5.6 billion in 2010/11, and 7.1 per cent to
R6 billion in 2011/12.
Programme 3: Policy Development, Review and Implementation Support for Welfare Services
• Administration.
• Service Standards coordinates overarching policies, legislation and norms and standards for social welfare
services delivered by both government and the non-government sector.
• Substance Abuse and Central Drug Authority develops, supports and monitors the implementation of
policies, legislation and norms and standards for substance abuse.
• Older Persons develops, supports and monitors the implementation of policies, legislation and norms and
standards for social welfare services to older people.
• People with Disabilities develops, supports and monitors the implementation of policies, legislation and
norms and standards for social welfare services to people with disabilities.
• Children develops, supports and monitors the implementation of policies, legislation and norms and
standards for social welfare services to children.
• Families develops, supports and monitors the implementation of policies, legislation and programmes to
strengthen families.

Vote 16: Social Development
357
• Victim Empowerment develops, supports and monitors the implementation of policies, legislation and
programmes to empower victims of crime and violence.
• Social Crime Prevention develops, supports and monitors the implementation of policies, legislation and
programmes to protect, empower and support child, youth and adult offenders in the criminal justice system.
• Service Provider Support and Management provides management and support to national councils and
other professional bodies, and administers payments to these institutions.
• Contributions and Affiliations to Other Bodies provides for transfers to international federations and
organisations.
Funding for all subprogrammes, except the Contributions and Affiliations to other Bodies subprogramme,
relates to operational requirements. Funding for the Contributions and Affiliations to other Bodies
subprogramme is based on membership fees.
Objectives and measures
• Improve welfare service delivery by developing, piloting and implementing norms and standards for
delivering social welfare services by 2009/10.
• Reduce substance abuse by developing regulations for substance abuse by 2010/11.
• Transform services to older people by developing service delivery guidelines by 2010/11.
• Protect and promote the rights of people with disabilities by:
– facilitating the development and implementation of policies, legislation and strategies on disability by
2011/12
– developing programmes for residential facilities by 2011/12.
• Improve the protection and care of children by facilitating the implementation of the Children’s Act (2005)
as amended, in 2009/10, through developing policies, strategies and programmes to promote children’s
rights.
• Empower families by developing an integrated plan for implementing the family policy by 2009/10 and
minimum norms and standards by 2010/11.
• Protect people affected by violence and crime by:
– developing a shelter strategy and an integrated plan for implementing the victim empowerment policy
by 2009/10
– developing guidelines on dealing with human trafficking, rape, domestic violence and violent crimes by
2009/10.
• Strengthen probation services, social crime prevention and integrated child justice services by developing a
social crime prevention strategy and diversion accreditation framework by 2009/10.
• Improve welfare service delivery by:
– providing adequate funding to national bodies over the MTEF period
– amending the Social Service Professions Bill and finalising the policy on social services by 2009/10.
Service delivery and spending focus
The business plan for the rollout of phase 2 and 3 of the norms and standards development process has been
approved. Provincial visits have been made to introduce the business plan, and programme management
structures have been set up to facilitate implementation. Completion is scheduled for 2009/10.
8 681 students were reached through career fairs in 2007/08. 983 bursaries were awarded in 2007/08 and 1 917
in 2008/09. The number of bursaries is expected to increase to over 3 000 in 2009/10, with about 515 graduate
placements expected in 2009, depending on results.
In 2008/09, the following activities were conducted: 12 Ke Moja drug abuse awareness ambassadors were
appointed; a mini drug master plan was developed and implemented; training workshops on the implementation
of the national drug master plan were held in Gauteng, KwaZulu-Natal, Western Cape, Limpopo and Free State;
and 200 service providers were reached. The Prevention of and Treatment of Substance Abuse Bill will be
finalised in 2009.

2009 Estimates of National Expenditure
358
To meet the ongoing need for quality welfare services, the department will promote skills development and
complete the development of norms and standards in 2009. The department aims to develop and finalise the
following legislation over the medium term: the Prevention of and Treatment for Substance Abuse Bill and
regulations, and amendments to the Social Service Professions Act (1978) and the
Nonprofit Organisations Act (1997).
Expenditure estimates
Table 16.9 Policy Development, Review and Implementation Support for Welfare Services
Subprogramme Adjusted
Audited outcome appropriation Medium-term expenditure estimate
R million 2005/06 2006/07 2007/08 2008/09 2009/10 2010/11 2011/12
Service Standards 2.8 5.2 55.7 124.0 226.6 244.2 266.2
Substance Abuse and Central Drug Authority 3.8 5.8 9.5 12.7 13.3 13.6 15.0
Older Persons 3.6 4.7 5.0 5.9 7.3 7.7 8.1
People with Disabilities 1.8 3.3 3.6 4.7 4.9 5.2 5.5
Children 9.5 10.9 13.2 22.7 24.3 26.3 27.7
Families 3.2 3.5 2.6 6.0 6.5 6.8 7.2
Victim Empowerment 3.9 2.2 4.0 5.5 6.0 6.3 6.6
Social Crime Prevention 1.5 1.3 4.2 6.9 7.6 8.0 8.4
Service Provider Support and Management 5.3 6.2 8.7 13.6 22.4 23.7 25.0
Contributions and Affiliations to Other Bodies 0.1 0.0 0.3 0.2 0.2 0.2 0.2
Administration 3.0 2.9 3.2 8.9 10.2 10.8 11.3
Total 38.5 45.8 110.0 211.2 329.3 352.7 381.3
Change to 2008 Budget estimate 4.3 1.1 4.8 (57.0)
Economic classification
Current payments 32.6 37.6 50.8 86.2 99.5 105.7 112.9
Compensation of employees 16.9 18.3 22.9 41.0 47.0 49.2 52.2
Goods and services 15.7 19.3 27.9 45.2 52.4 56.5 60.7
of which:
Administrative fees 0.3 0.1 0.2 0.7 1.4 2.2 2.9
Advertising 1.7 1.0 2.1 5.4 5.7 6.0 6.3
Assets less than R5 000 0.6 0.4 0.2 0.1 0.1 0.1 0.1
Catering: Departmental activities 0.7 0.7 0.7 2.3 2.4 2.5 2.6
Communication 0.2 0.5 0.1 0.4 0.5 0.5 0.5
Consultants and professional services: Business and advisory services
– 0.3 4.2 10.9 11.1 11.0 11.7
Consultants and professional services: Legal costs 0.2 0.5 0.7 – – – –
Contractors 0.9 0.9 1.5 0.1 0.1 0.1 0.1
Agency and support / outsourced services 1.6 2.5 3.1 5.9 9.8 11.6 12.9
Inventory: Stationery and printing 1.2 1.7 2.0 5.6 5.9 6.2 6.5
Lease payments 1.7 – 1.3 0.0 0.0 0.0 0.0
Travel and subsistence 4.0 6.0 6.3 9.4 10.7 11.3 11.8
Training and development 0.2 0.3 0.4 1.4 1.4 1.5 1.6
Operating expenditure 0.8 1.5 1.9 – – – –
Venues and facilities 1.6 2.7 3.3 3.0 3.1 3.3 3.5
Financial transactions in assets and liabilities 0.0 0.0 0.0 – – – –
Transfers and subsidies 5.5 7.7 58.5 122.4 227.3 244.3 265.4
Provinces and municipalities 0.1 0.0 – – – – –
Departmental agencies and accounts – – 50.0 111.9 210.0 226.0 246.0
Foreign governments and international organisations 0.1 0.0 0.3 0.4 0.2 0.2 0.2
Non-profit institutions 5.3 7.6 8.2 10.1 17.1 18.1 19.2

Vote 16: Social Development
359
Table 16.9 Policy Development, Review and Implementation Support for Welfare Services (continued)
Adjusted
Audited outcome appropriation Medium-term expenditure estimate
R million 2005/06 2006/07 2007/08 2008/09 2009/10 2010/11 2011/12
Payments for capital assets 0.5 0.6 0.7 2.6 2.6 2.8 3.0
Machinery and equipment 0.4 0.6 0.7 2.4 2.5 2.7 2.9
Software and other intangible assets 0.1 – – 0.2 0.1 0.1 0.1
Total 38.5 45.8 110.0 211.2 329.3 352.7 381.3
Details of selected transfers and subsidies
Departmental agencies and accounts
Departmental agencies (non-business entities)
Current – – 50.0 111.9 210.0 226.0 246.0
National Student Financial Aid Scheme – – 50.0 111.9 210.0 226.0 246.0
Non-profit institutions
Current 5.3 6.2 7.5 10.0 17.1 18.1 19.2
National Councils 5.3 6.2 7.5 8.5 17.1 18.1 19.2
Association of South African Social Work Educators Institutions – – – 1.5 – – –
Expenditure trends
Expenditure grew from R38.5 million in 2005/06 to R211 million in 2008/09 at an average annual rate of
76.3 per cent, and is expected to increase to R381.3 million in 2011/12 at an average annual rate of
21.8 per cent. The strong growth is mainly due to the introduction and rapid expansion of the social work
scholarships in 2007/08 and increased funding for personnel to strengthen capacity and provide leadership on
provincial welfare service delivery.
To align the budget and programme structure with the department’s strategic objectives, the HIV and AIDS
subprogramme, previously under this programme, has been moved to the Community Development programme.
Programme 4: Community Development
• Administration.
• Sustainable Livelihoods develops and provides support for the implementation of programmes, strategies
and tools for sustainable livelihoods, and manages service delivery partners.
• Community Development Policy and Service Standards develops and facilitates the implementation of
policies, guidelines, norms and standards to ensure the effective and efficient delivery of community
development services.
• Youth develops and facilitates the implementation of policies, legislation and programmes to protect
vulnerable youth.
• Non-Profit Organisations facilitates the implementation of the Nonprofit Organisations Act (1997) and
provides programmes and tools for empowering non-profit organisations.
• HIV and AIDS develops, supports and monitors the implementation of policies, programmes and guidelines
to prevent and mitigate the impact of HIV and AIDS in line with the 2007 to 2011 national strategic plan for
HIV and AIDS and sexually transmitted infections. The HIV and AIDS subprogramme has been moved to
the Community Development programme to align the budget and programme structure with the
department’s strategic objectives.
• National Development Agency provides for and oversees the transfer to the National Development Agency.
• Contributions and Affiliations to Other Bodies provides for contributions to international federations and
organisations.
Funding for the first seven subprogrammes relates to operational requirements. Funding for the National
Development Agency subprogramme is based on grant funding for community development projects
administered by the agency. Funding for the Contributions and Affiliations to Other Bodies subprogramme is
based on membership fees.

2009 Estimates of National Expenditure
360
Objectives and measures
• Protect and empower vulnerable youth by:
– auditing youth services by March 2010
– researching the type, dimensions and impact of poverty on vulnerable youth by March 2011
– overseeing the implementation of the Masupatsela youth pioneer programme, which recruits, trains and
absorbs unemployed and out-of-school youth in their local communities, over the MTEF period.
• Strengthen the capacity of practitioners and communities to achieve sustainable livelihoods by:
– completing and launching the sustainable livelihoods toolkit for community development practitioners
by March 2010
– training 100 community development practitioners to use the sustainable livelihoods toolkit by March
2010.
– developing implementation guidelines for social cooperatives by March 2012.
• Improve community food security by:
– developing a concept document on community food banks by March 2010
– facilitating the establishment of 2 community food banks by March 2011 and 3 by March 2012.
• Improve community development practice by:
– developing a national community development policy framework by March 2011
– producing a discussion document on the professionalisation of community development practice by
March 2010
– producing a skills development plan by March 2010.
• Ensure efficiency in the non-profit organisation registration facility by:
– registering all non-profit organisations within 2 months of receiving applications by March 2010
– drafting amendments to the Nonprofit Organisations Act (1997) and preparing cost estimates by
March 2010
– developing a reference manual on good governance by March 2011.
• Reduce vulnerability to HIV infection and mitigate the impact by:
– developing guidelines to promote behaviour change by 2009/10
– monitoring the implementation of loveLife during 2009/10
– strengthening the capacity of home community based care organisations and developing systems and
processes for monitoring their compliance with norms and standards by 2011/12.
Service delivery and spending focus
Following extensive consultation with community development stakeholders, a base document on community
development, outlining the need for a community development policy framework, was developed in December
2007. The department will continue to coordinate the development of this framework to streamline and integrate
community development activities across government departments and civil society.
A scoping exercise of community development unit standards and qualifications at National Qualification
Framework levels 4 to 6 was conducted in consultation with the South African Qualifications Authority and the
Standards Generating Body. The department aims to improve the community development practice and
strengthen the capacity of community development practitioners. This requires standardising community
development education and training and professionalising the practice.
6 799 non-profit organisations were registered in terms of the Nonprofit Organisations Act (1997)
within 2 months of applications being received, increasing the total number of registered organisations to
54 059. 333 community development practitioners and 43 programme managers in all provinces were trained on
non-profit organisation governance and the requirements for registering a non-profit organisation. The
registration process was analysed, and a standard procedure manual was developed in the second quarter of
2008/09.
The Masupatsela youth pioneer programme, which emanated from the cooperation agreement signed between
Cuba and South Africa in September 2007, was conceptualised and approved in November 2007. This
programme, aimed at instilling in young people a strong sense of patriotism, will be implemented at the

Vote 16: Social Development
361
provincial level over the MTEF period. The department monitor the implementation and strengthen areas where
gaps are identified.
A strategy on behaviour change for the prevention of HIV and AIDS was developed in July 2008. During
2007/08, 1 500 home and community based care organisations were funded and 2.1 million orphans and
vulnerable children received counselling and support through these organisations. 847 child care forums and
407 drop-in centres were established and supported. During the first half of 2008/09, 1 304 home and
community based care organisations were funded and 619 598 orphans and vulnerable children received support
through these organisations. 135 home and community based care organisations have been trained, mentored
and monitored under the management capacity building programme for these organisations. A study on child
headed households has also been completed.
Expenditure estimates
Table 16.10 Community Development
Subprogramme Adjusted
Audited outcome appropriation Medium-term expenditure estimate
R million 2005/06 2006/07 2007/08 2008/09 2009/10 2010/11 2011/12
Sustainable Livelihood 10.9 10.6 6.8 9.4 8.6 8.8 9.3
Community Development Service Standards 3.2 4.6 3.9 6.9 8.4 8.8 9.4
Registration and Institutional Capacity Building of NPOs 3.3 4.2 6.7 9.8 12.7 13.4 13.2
Youth 1.5 3.0 4.6 7.8 5.4 5.7 6.1
HIV and AIDS 43.6 50.1 51.3 61.1 61.5 66.3 69.8
National Development Agency 121.5 123.0 129.2 136.3 144.8 153.5 163.7
Contributions and Affiliations to Other Bodies – – – 0.4 0.4 0.5 0.5
Administration 5.6 6.2 5.5 6.1 6.5 6.9 7.2
Total 189.6 201.9 208.0 237.8 248.4 263.9 279.2
Change to 2008 Budget estimate (2.2) (2.0) (2.2) 73.1
Economic classification
Current payments 30.6 37.6 34.7 52.5 57.3 62.5 64.9
Compensation of employees 16.4 16.5 18.7 28.3 30.3 32.0 33.8
Goods and services 14.2 21.1 16.0 24.2 27.1 30.5 31.2
of which:
Administrative fees 0.1 – 0.2 1.1 1.2 2.1 1.3
Advertising 2.6 2.6 3.6 1.0 1.1 1.1 1.2
Consultants and professional services: Business and advisory services
2.2 5.9 2.8 8.3 9.5 11.2 11.8
Contractors 0.3 0.3 0.7 0.9 0.9 1.0 1.0
Agency and support / outsourced services 0.4 1.2 1.6 – – – –
Inventory: Stationery and printing 0.9 1.2 0.3 1.4 1.5 1.6 1.7
Lease payments 0.2 0.2 0.1 0.2 0.2 0.2 0.2
Travel and subsistence 6.2 7.5 4.7 7.4 8.1 8.6 9.0
Training and development 0.2 0.3 0.1 0.7 0.8 0.8 0.8
Venues and facilities 0.4 1.3 0.6 2.7 2.8 3.0 3.1
Financial transactions in assets and liabilities 0.0 0.1 0.0 – – – –
Transfers and subsidies 158.0 163.8 172.6 184.3 190.2 200.5 213.4
Provinces and municipalities 0.1 0.0 – – – – –
Departmental agencies and accounts 121.5 123.0 129.2 136.3 144.8 153.5 163.7
Universities and technikons – – 0.5 – – – –
Foreign governments and international organisations – – – 0.4 0.4 0.5 0.5
Non-profit institutions 36.5 40.7 43.0 47.6 45.0 46.6 49.2
Payments for capital assets 0.9 0.4 0.6 1.1 0.8 0.8 0.9
Machinery and equipment 0.9 0.4 0.6 1.1 0.8 0.8 0.9
Software and other intangible assets 0.0 0.0 – – – – –
Total 189.6 201.9 208.0 237.8 248.4 263.9 279.2
2009 Estimates of National Expenditure
362
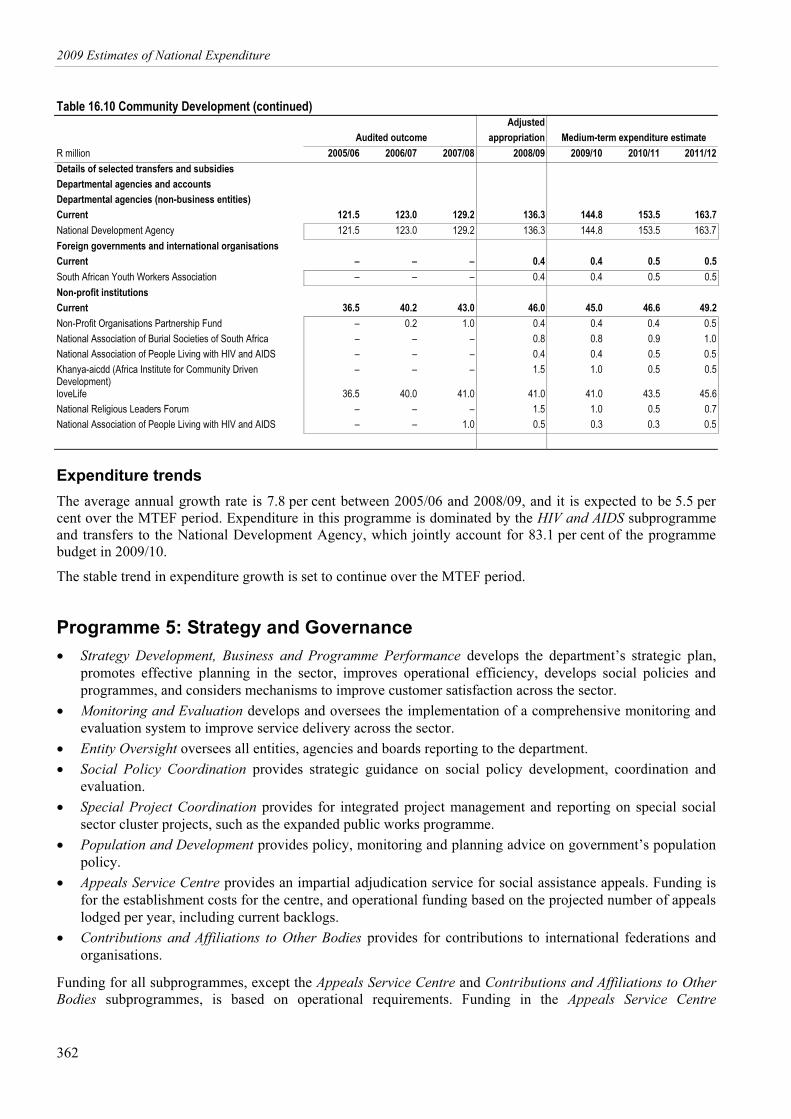
Table 16.10 Community Development (continued)
Adjusted
Audited outcome appropriation Medium-term expenditure estimate
R million 2005/06 2006/07 2007/08 2008/09 2009/10 2010/11 2011/12
Details of selected transfers and subsidies
Departmental agencies and accounts
Departmental agencies (non-business entities)
Current 121.5 123.0 129.2 136.3 144.8 153.5 163.7
National Development Agency 121.5 123.0 129.2 136.3 144.8 153.5 163.7
Foreign governments and international organisations
Current – – – 0.4 0.4 0.5 0.5
South African Youth Workers Association – – – 0.4 0.4 0.5 0.5
Non-profit institutions
Current 36.5 40.2 43.0 46.0 45.0 46.6 49.2
Non-Profit Organisations Partnership Fund – 0.2 1.0 0.4 0.4 0.4 0.5
National Association of Burial Societies of South Africa – – – 0.8 0.8 0.9 1.0
National Association of People Living with HIV and AIDS – – – 0.4 0.4 0.5 0.5
Khanya-aicdd (Africa Institute for Community Driven Development)
– – – 1.5 1.0 0.5 0.5
loveLife 36.5 40.0 41.0 41.0 41.0 43.5 45.6
National Religious Leaders Forum – – – 1.5 1.0 0.5 0.7
National Association of People Living with HIV and AIDS – – 1.0 0.5 0.3 0.3 0.5
Expenditure trends
The average annual growth rate is 7.8 per cent between 2005/06 and 2008/09, and it is expected to be 5.5 per
cent over the MTEF period. Expenditure in this programme is dominated by the HIV and AIDS subprogramme
and transfers to the National Development Agency, which jointly account for 83.1 per cent of the programme
budget in 2009/10.
The stable trend in expenditure growth is set to continue over the MTEF period.
Programme 5: Strategy and Governance
• Strategy Development, Business and Programme Performance develops the department’s strategic plan,
promotes effective planning in the sector, improves operational efficiency, develops social policies and
programmes, and considers mechanisms to improve customer satisfaction across the sector.
• Monitoring and Evaluation develops and oversees the implementation of a comprehensive monitoring and
evaluation system to improve service delivery across the sector.
• Entity Oversight oversees all entities, agencies and boards reporting to the department.
• Social Policy Coordination provides strategic guidance on social policy development, coordination and
evaluation.
• Special Project Coordination provides for integrated project management and reporting on special social
sector cluster projects, such as the expanded public works programme.
• Population and Development provides policy, monitoring and planning advice on government’s population
policy.
• Appeals Service Centre provides an impartial adjudication service for social assistance appeals. Funding is
for the establishment costs for the centre, and operational funding based on the projected number of appeals
lodged per year, including current backlogs.
• Contributions and Affiliations to Other Bodies provides for contributions to international federations and
organisations.
Funding for all subprogrammes, except the Appeals Service Centre and Contributions and Affiliations to Other
Bodies subprogrammes, is based on operational requirements. Funding in the Appeals Service Centre
Vote 16: Social Development
363
subprogramme includes the establishment costs for the tribunal and operational funding, and is based on the
number of appeals per year, including existing backlogs. Funding for the Contributions and Affiliations to Other
Bodies subprogramme is based on membership fees.
Objectives and measures
• Improve planning and service delivery in the social development sector by:
– revising and finalising the department’s strategic plan by January each year
– providing ongoing assistance to provincial departments with strategic planning processes
– developing a customer centred service delivery model by 2010.
• Improve accountability and promote service delivery across the sector by:
– implementing a comprehensive monitoring and evaluation system
– conducting annual performance analyses and departmental reviews, and submitting quarterly reports to
the minister within 6 weeks of the end of every quarter
– coordinating quarterly performance review meetings, and conducting 3 programme evaluations per
year.
• Improve corporate governance of public entities, bodies and boards by:
– developing and rolling out a performance management framework by March 2010
– conducting quarterly performance assessments of public entities.
• Integrate population trends and dynamics into departmental planning by:
– developing the 5-year population and development strategy by March 2010
– producing an annual publication of research reports on population trends and dynamics.
• Ensure fairness in the grant application process by:
– operationalising the appeals tribunal by July 2009
– eliminating all backlogs by March 2011.
Service delivery and spending focus
The department developed and tabled its 3-year strategic plan in 2007/08. A sector planning handbook was
finalised to guide the sector and promote strategic planning for improved outcomes. A customer care and local
front office model was approved by the forum for ministers and members of provincial executive councils. A
gender mainstreaming programme was implemented and the gender policy initiated. A short term immovable
asset management plan and business process improvement plan were also completed.
To monitor the implementation of the department’s strategy, an institutional performance monitoring framework
was developed. A web based electronic system was developed to facilitate online reporting and accelerate the
turnaround times of the submission of performance reports. Following the training of users, the system will be
fully implemented in 2009/10. Quarterly reports, annual reports and performance measurement reports were
completed on time and submitted to the relevant authorities in line with the department’s performance
guidelines.
A study to further investigate the potential of the expanded public works programme in the social sector, beyond
the two pilot areas of early childhood development and home and community based care, was completed in
May 2007. The study recommended expansion into 13 new areas, with the potential to create 500 000 work
opportunities. The framework to integrate expanded public works programme principles into these areas was
also developed in May 2007. 147 000 work opportunities were created against the initial target of 150 000 for
the first 4 and a half years, as set out in the social sector plan.
The department developed an appeals enterprise support mechanism, aimed at overseeing activities such as case
management, pre-assessment, and secretariat and related administrative support. Medical assessment
mechanisms were developed for adjudicating care dependency and disability social grants. Staff were recruited
for the Independent Tribunal for Social Assistance Appeals, and members were enlisted and appointed to serve
on the panel. An estimated backlog of more than 50 000 appeals will be a key focus area over the MTEF period.

2009 Estimates of National Expenditure
364
Expenditure estimates
Table 16.11 Strategy and Governance
Subprogramme Adjusted
Audited outcome appropriation Medium-term expenditure estimate
R million 2005/06 2006/07 2007/08 2008/09 2009/10 2010/11 2011/12
Strategy Development, Business and Programme Performance – 3.6 14.7 11.0 6.8 7.2 7.6
Monitoring and Evaluation 15.6 2.6 9.9 16.0 11.5 14.3 15.6
Entity Oversight – 0.7 3.8 17.0 15.5 18.6 20.1
Social Policy Coordination – 5.2 2.2 2.9 5.2 5.4 5.8
Special Projects Coordination – – 4.8 5.7 7.1 7.3 6.9
Appeals Service Centre – – 1.1 25.6 31.0 32.5 33.9
Population Research 14.7 20.7 33.9 20.1 20.0 21.0 22.2
Contributions and Affiliations to Other Bodies 0.1 0.2 0.5 0.3 0.3 0.4 0.4
Administration 2.6 6.9 2.0 3.5 3.6 3.8 4.1
Total 33.1 39.9 72.9 102.2 101.1 110.5 116.7
Change to 2008 Budget estimate 8.8 4.5 4.2 4.3
Economic classification
Current payments 32.6 33.8 68.6 100.5 98.5 107.8 113.8
Compensation of employees 11.7 14.6 23.2 35.9 42.8 44.7 47.4
Goods and services 20.9 19.2 45.4 64.5 55.7 63.1 66.4
of which:
Administrative fees 0.6 0.9 1.0 2.1 0.8 1.4 1.8
Advertising 1.2 1.4 1.0 1.4 1.5 1.6 1.6
Assets less than R5 000 0.2 0.4 0.5 0.3 0.4 0.4 0.4
Catering: Departmental activities 0.2 0.4 0.2 0.7 0.8 0.8 0.8
Communication 0.0 0.1 0.1 0.6 0.6 0.7 0.7
Computer services 0.0 – 4.1 6.4 6.7 7.1 7.4
Consultants and professional services: Business and advisory services
11.4 0.5 9.7 37.3 28.5 34.0 35.5
Contractors 0.3 0.7 2.3 0.0 0.1 0.1 0.1
Agency and support / outsourced services 0.2 3.0 11.3 – – – –
Inventory: Stationery and printing 1.0 1.0 1.1 1.3 1.4 1.4 1.5
Travel and subsistence 3.1 6.1 8.7 9.7 10.2 10.7 11.2
Training and development 0.1 0.4 0.8 1.3 1.4 1.5 1.5
Operating expenditure 0.5 1.5 0.8 0.0 0.0 0.0 0.0
Venues and facilities 1.5 2.6 3.6 2.8 3.0 3.1 3.3
Financial transactions in assets and liabilities – – 0.0 – – – –
Transfers and subsidies 0.2 5.4 1.6 0.3 1.3 1.4 1.4
Provinces and municipalities 0.0 0.0 – – – – –
Departmental agencies and accounts – 0.4 0.4 – – – –
Universities and technikons – 4.8 – – – – –
Foreign governments and international organisations 0.1 0.2 0.2 0.3 0.3 0.4 0.4
Non-profit institutions – 0.1 1.1 – 1.0 1.0 1.0
Payments for capital assets 0.3 0.6 2.8 1.4 1.3 1.4 1.5
Machinery and equipment 0.3 0.6 2.8 1.3 1.2 1.3 1.4
Software and other intangible assets – – – 0.2 0.1 0.1 0.1
Total 33.1 39.9 72.9 102.2 101.1 110.5 116.7
Details of selected transfers and subsidies
Universities and technikons
Current – 4.8 – – – – –
University of Pretoria – 4.8 – – – – –
Expenditure trends
Expenditure grew at an average annual rate of 45.7 per cent between 2005/06 and 2008/09, mainly as a result of
additional allocations of R20 million in 2007/08 and R30 million in 2008/09 to establish an inspectorate. This is
supplemented with additional allocations of R7 million in 2008/09, R10 million in 2009/10 and R13 million in

Vote 16: Social Development
365
2010/11 to strengthen the department’s regulatory and oversight functions for the South African Social Security
Agency and facilitate the establishment of key social security institutions.
An additional R30 million is allocated over the MTEF period to increase the capacity of the appeals tribunal
(R10 million, R10 million, and R10 million).
A once-off allocation was made to the University of Pretoria in 2006/07 to establish a partnership for economic
research on social protection.

2009 Estimates of National Expenditure
366
Additional tables
Table 16.A Summary of expenditure trends and estimates per programme and economic classification
Programme Appropriation Audited Appropriation Revised
Main Adjusted outcome Main Additional Adjusted estimate
R million 2007/08 2007/08 2008/09 2008/09
1. Administration 134.8 135.2 139.1 149.2 7.0 156.2 154.6
2. Comprehensive Social Security 66 638.8 66 637.3 66 661.5 75 318.4 528.3 75 846.7 75 694.4
3. Policy Development, Review and Implementation Support for Welfare Services
140.7 138.3 110.0 207.0 4.3 211.2 206.6
4. Community Development 229.9 223.9 208.0 240.0 (2.2) 237.8 235.3
5. Strategy and Governance 87.9 94.4 72.9 93.4 8.8 102.2 102.2
Total 67 232.1 67 229.1 67 191.4 76 008.0 546.2 76 554.2 76 393.2
Economic classification
Current payments 389.8 385.4 321.4 422.6 8.9 431.6 420.6
Compensation of employees 169.4 169.4 133.6 196.7 (4.2) 192.5 181.5
Goods and services 220.5 216.0 187.5 226.0 13.1 239.1 239.1
Financial transactions in assets and liabilities – – 0.3 – – – –
Transfers and subsidies 66 832.8 66 834.3 66 862.3 75 576.6 537.2 76 113.9 75 963.9
Departmental agencies and accounts 4 321.9 4 321.9 4 322.3 4 779.1 99.4 4 878.5 4 878.5
Universities and technikons – – 0.5 – – – –
Foreign governments and international organisations
1.3 1.3 0.5 1.5 0.4 1.9 1.9
Non-profit institutions 48.9 50.3 52.2 55.1 2.7 57.7 57.7
Households 62 460.8 62 460.8 62 486.9 70 741.0 434.8 71 175.8 71 025.8
Payments for capital assets 9.5 9.5 7.7 8.7 – 8.7 8.7
Machinery and equipment 8.3 8.3 7.7 7.9 – 7.9 7.9
Software and intangible assets 1.1 1.1 – 0.8 – 0.8 0.8
Total 67 232.1 67 229.1 67 191.4 76 008.0 546.2 76 554.2 76 393.2
Table 16.B Summary of personnel numbers and compensation of employees
Adjusted
Audited outcome appropriation Medium-term expenditure estimate
2005/06 2006/07 2007/08 2008/09 2009/10 2010/11 2011/12
Permanent and full time contract employees
Compensation (R million) 78.3 107.6 129.2 187.2 214.0 224.7 238.0
Unit cost (R million) 0.2 0.2 0.2 0.3 0.3 0.3 0.3
Personnel numbers (head count) 372 466 619 684 719 750 750
Part time and temporary contract employees
Compensation (R million) 12.6 1.4 2.0 2.5 2.8 3.0 3.3
Unit cost (R million) 0.2 0.1 0.1 0.1 0.1 0.1 0.1
Personnel numbers (head count) 69 15 20 25 40 40 40
Interns
Compensation of interns (R million) 2.4 2.0 2.4 2.9 3.1 3.4 3.6
Unit cost (R million) 0.0 0.0 0.0 0.0 0.0 0.0 0.0
Number of interns 74 55 65 75 80 85 85
Total for department
Compensation (R million) 93.2 111.1 133.6 192.5 220.0 231.2 245.0
Unit cost (R million) 0.2 0.2 0.2 0.2 0.3 0.3 0.3
Personnel numbers (head count) 515 536 704 784 839 875 875
Vote 16: Social Development
367
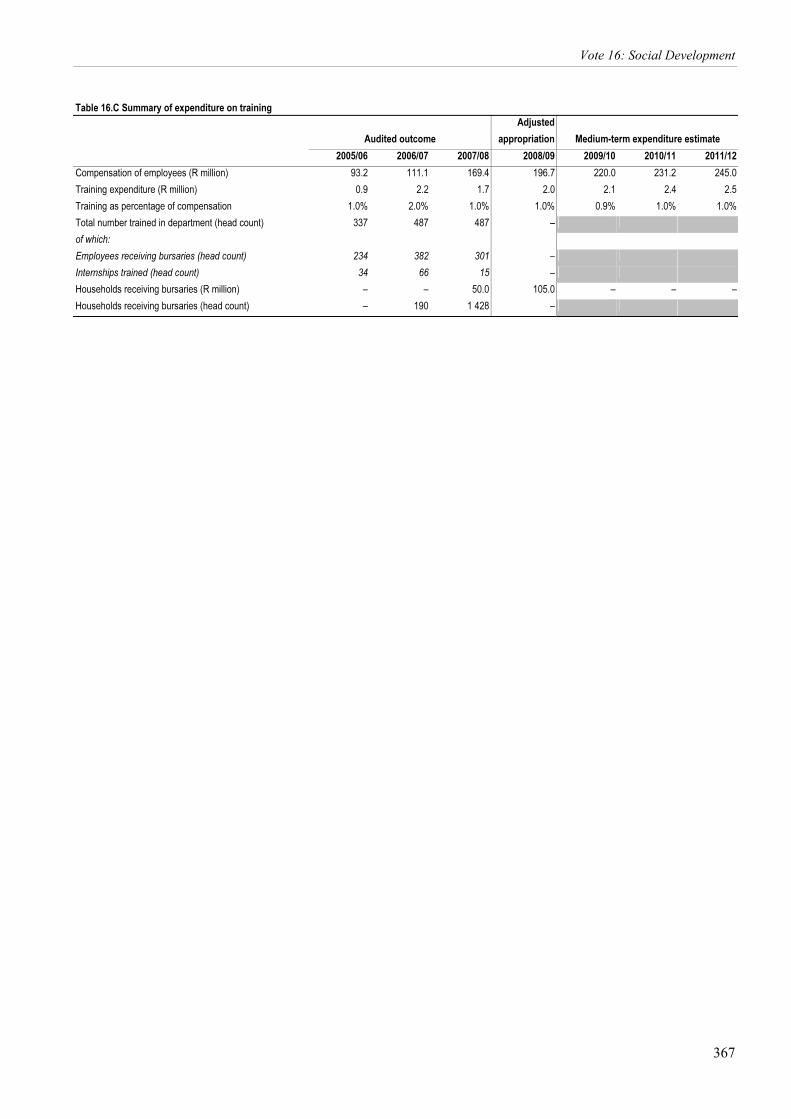
Table 16.C Summary of expenditure on training
Adjusted
Audited outcome appropriation Medium-term expenditure estimate
2005/06 2006/07 2007/08 2008/09 2009/10 2010/11 2011/12
Compensation of employees (R million) 93.2 111.1 169.4 196.7 220.0 231.2 245.0
Training expenditure (R million) 0.9 2.2 1.7 2.0 2.1 2.4 2.5
Training as percentage of compensation 1.0% 2.0% 1.0% 1.0% 0.9% 1.0% 1.0%
Total number trained in department (head count) 337 487 487 –
of which:
Employees receiving bursaries (head count) 234 382 301 –
Internships trained (head count) 34 66 15 –
Households receiving bursaries (R million) – – 50.0 105.0 – – –
Households receiving bursaries (head count) – 190 1 428 –

368
Tab
le 1
6.D
Su
mm
ary
of
do
no
r fu
nd
ing
Do
no
r P
roje
ct
Dep
artm
enta
l p
rog
ram
me
nam
e
Am
ou
nt
com
mit
ted
M
ain
eco
no
mic
cl
assi
fica
tio
n
Sp
end
ing
fo
cus
Au
dit
ed o
utc
om
e
Est
imat
e M
ediu
m-t
erm
exp
end
itu
re e
stim
ate
R th
ousa
nd
2
005/
06
200
6/07
2
007/
08
200
8/09
2
009/
10
201
0/11
2
011/
12
Fo
reig
n
In c
ash
Uni
ted
Kin
gdom
D
epar
tmen
t for
In
tern
atio
nal
Dev
elop
men
t
Str
engt
heni
ng
anal
ytic
al c
apac
ity
for
evid
ence
bas
ed
deci
sion
mak
ing
Str
ateg
y an
d G
over
nanc
e
5
2 71
7 G
oods
and
ser
vice
s S
tren
gthe
ning
an
alyt
ical
cap
acity
for
evid
ence
bas
ed
deci
sion
mak
ing
10 6
79
2 0
22
9 2
97
1
8 51
9
8
000
4 2
00
–
Can
adia
n In
tern
atio
nal
Dev
elop
men
t A
genc
y
Chi
ld p
rote
ctio
n su
rvei
llanc
e pr
ojec
t
Pol
icy
Dev
elop
men
t, R
evie
w a
nd
Impl
emen
tatio
n S
uppo
rt fo
r W
elfa
re
Ser
vice
s
30
500
Goo
ds a
nd s
ervi
ces
Res
earc
h st
udy
on
child
abu
se, n
egle
ct
and
expl
oita
tion
–
–
–
1 40
4
8
105
10 3
91
10
600
Uni
ted
Nat
ions
C
hild
ren’
s F
und
Cos
ting
a na
tiona
l po
licy
fram
ewor
k on
pre
vent
ion
of
child
abu
se
Pol
icy
Dev
elop
men
t, R
evie
w a
nd
Impl
emen
tatio
n S
uppo
rt fo
r W
elfa
re
Ser
vice
s
3
82
Goo
ds a
nd s
ervi
ces
Cos
ted
natio
nal p
olic
y fr
amew
ork
on
negl
ecte
d an
d ab
used
ch
ildre
n
–
–
3
82
–
–
–
–
In k
ind
Japa
n In
tern
atio
nal
Coo
pera
tion
Age
ncy
Est
ablis
hing
a
mon
itorin
g an
d ev
alua
tion
syst
em
for
hom
e co
mm
unity
bas
ed
care
Pol
icy
Dev
elop
men
t, R
evie
w a
nd
Impl
emen
tatio
n S
uppo
rt fo
r W
elfa
re
Ser
vice
s
9 0
00
Goo
ds a
nd s
ervi
ces
Com
preh
ensi
ve
mon
itorin
g an
d ev
alua
tion
syst
em fo
r co
mpr
ehen
sive
hom
e co
mm
unity
bas
ed c
are
impl
emen
ted
at a
ll le
vels
of g
over
nmen
t
–
1 2
19
2 7
72
1 0
71
4 14
7 –
–
Eur
opea
n C
omm
issi
on
Ass
istin
g th
e vi
ctim
em
pow
erm
ent
prog
ram
me
Pol
icy
Dev
elop
men
t, R
evie
w a
nd
Impl
emen
tatio
n S
uppo
rt fo
r W
elfa
re
Ser
vice
s
2
64 3
30
Goo
ds a
nd s
ervi
ces
Impr
ovin
g th
e im
plem
enta
tion
of th
e vi
ctim
em
pow
erm
ent
prog
ram
me
–
–
–
–
–
–
–
Uni
ted
Nat
ions
O
ffice
on
Dru
gs
and
Crim
e
Est
ablis
hing
a o
ne-
stop
cen
tre
–M
itche
lls P
lain
Pol
icy
Dev
elop
men
t, R
evie
w a
nd
Impl
emen
tatio
n S
uppo
rt fo
r W
elfa
re
Ser
vice
s
4
900
Goo
ds a
nd s
ervi
ces
Est
ablis
hing
a o
ne-
stop
cen
tre
to
coun
tera
ct v
iole
nce
–
–
4 9
00
–
–
–
–
Uni
ted
Nat
ions
O
ffice
on
Dru
gs
and
Crim
e
Est
ablis
hing
a o
ne-
stop
cen
tre
–G
aute
ng a
nd N
orth
W
est
Pol
icy
Dev
elop
men
t, R
evie
w a
nd
Impl
emen
tatio
n S
uppo
rt fo
r W
elfa
re
Ser
vice
s
14
434
Goo
ds a
nd s
ervi
ces
Est
ablis
hing
a o
ne-
stop
cen
tre
to
coun
tera
ct v
iole
nce
–
–
–
–
–
–
–
To
tal
376
263
10
679
3 2
41
17 3
51
2
0 99
4
2
0 25
2
14
591
10 6
00
2009 Estimates of National Expenditure