vote 3 - national treasury
TRANSCRIPT

Vote 3
Department of Transport, Safety & Liaison __________________________________________________________________________________
To be approved by Vote in 2017/18 R388 899 000
Responsible MEC MEC for Transport, Safety & Liaison
Administering Department Transport, Safety & Liaison
Accounting Officer Head of Department: Transport, Safety &Liaison
1. Overview
Core functions and responsibilities of the department
To promote subsidies transportation for the community as well as ensuring safety on our roads users
through effective traffic law enforcement and effectively overseeing the functions of the South African
police services (SAPS).
Vision
A leader in the creation and co-ordination of safe, secure and sustainable transport and policing
sytems for a crime-free Northern Cape Province
Mission
To enable safe and secure environment and mobility, for the community of the Northern Cape,
through:
Good corporate governance, management, administration and support;
Establishing and supporting community safety partnerships;
Monitoring and oversight of the police;
Facilitating and coordinating social crime prevention and road safety programmes;
Educating, enforcing and administering road traffic legislation;
Liaison with all relevant stakeholders, role-players and clients, pertaining policing, safety and
security;
Regulated and integrated transport modes which are economically and environmentally……….
sustainable.
Acts, Rules and Regulations
The authority and function of the department is entrenched in the following policies and legislation:
The Constitution of the Republic of South Africa Act, 1996 (Act No. 108 of 1996);
National Land Transport Act No. 5 of 2009;
National Road Traffic Act No. 93 of 1996;
Administrative Adjudication of Road Traffic Offences Act No. 46 of 1998;
Preferential Procurement Policy Framework Act 5, 2001 and its Regulations;
Basic Conditions of Employment Act;
Public Service Act, 2001;
Employment Equity Act 55 of 1998;
Public Service Regulations;
Skills Development Act and Levy Act;
Labour Relations Act 1995, Act 66 of 1995;
Criminal Procedure Act 51 of 1977;
Public Finance Management Act 1 of 1999 as amended and treasury regulations;
South African Police Act 1995 and regulations;

National Crime prevention Strategy, 1999 and
Civilian Secretariat Act of 2011.
1.1 Aligning departmental budgets to achieve government’s prescribed outcomes
Priorities as outlined in the National Development Plan as well as outcomes as per Medium Term
Strategic Framework (MTSF) are firmly entrenched within departmental activities.
The department contributes primarily towards Outcomes 3, 4 and 6, with secondary contributions to
Outcome 1.
NDP PRIORITY MTSF OUTCOME KEY DEPARTMENTAL ACTIVITIES
Chapter 12: Building
Safer Communities
Outcome 3:
All People in South Africa are
and feel safe
Conduct research to influence policy
changes and community safety
Monitor and evaluate SAPS conduct to
enhance service delivery
Implement an integrated Provincial
Crime Prevention Strategy
Implement Stop Violence against Chil-
dren, Youth and Women Programmes
Promote community police relations
through proper assessment of community
safety structures
Chapter 3: Economy
and Employment
Chapter 6: An Inte-
grated and Inclusive
Rural Economy
Outcome 4:
Decent Employment through
Inclusive economic growth
Implementation of Public Transport
Plans from district- and local municipali-
ties.
Implementation of Expanded Public
Works Programme
Chapter 4: Economic
Infrastructure
Outcome 6:
An efficient, competitive and
responsive economic infra-
structure network
The inclusion of the two key Transport
Infrastructure Projects (Development of
Port Nolloth Bay and the De Aar Ware-
house) in the National Infrastructure Plan
Reduction in accidents and fatalities per
annum
2. Review of the current financial year (2016/17)
The department managed to achieve the following for the period ended December 2016:
Provisioning of Effective Support Services:
The department continues to improve on the quality of support services rendered, with the aim of
providing an enabling environment, for service delivery. To this effect the following key administra-
tive achievements for the period include:
A marked improvement in the departmental audit outcome from a previous qualified, to an un-
qualified audit opinion for the 2015/16 financial year;
The payment of service providers within an average of two weeks;
The extension of the departmental bursary allocation to include external bursary holders.
Implementation of the Civilian Secretariat:
The Provincial Crime Prevention Strategy was reviewed within October 2016;
A district manager for the Civilian Oversight function, within the Namakwa district, was
appointed; this appointment will improve the oversight and monitoring function of the South
African Police Service within the Namakwa District;
The flag ship crime prevention programmes i.e. Prevention of Violence against Women and
Children, Anti-Substance Abuse programme as well as the Youth Crime Prevention programme,
are implemented throughout the province;
The Department continues with its oversight responsibility, as to the services delivered by the
South African Police Service. This is achieved by various means, including monitoring tool
assessments, community surveys, research on crime trends and investigations into service
delivery complaints against SAPS;
In order to ensure improvement, engagements are held between SAPS and Departmental
Management to discuss findings and agree on corrective actions to be taken;
In order to combat the scourge of Gender Based Violence, Domestic Violence compliance audits
are done at police stations.
Provisioning of Safe and Cost Effective Transport:
The department provides transport to 25 096 scholars, an increase of 1 103 scholars from the
23 993 transported within 2015/16 financial year;
Seven (7) public transport routes continued to be subsidized from the Public Transport Operators
Grant;
Eight (8) Integrated Transport Plans were finalized within the 2016/17 financial year;
The back-log of applications for operating license permits, has been finalized.
Stringent Law Enforcement Activities:
One thousand, one hundred and eighty seven (1 187) speed operations, as well as eight hundred
and forty five (845) drunken driving operations were conducted by traffic officials;
In the process one hundred and thirty thousand and sixty six (130 066) inspected;

3. Outlook for the coming financial year (2017/18)
The focus of the 2017 Medium Term Expenditure Framework (MTEF) will be to intensify existing
programmes that will give effect to the long term strategic priorities of the department. In order to
enhance the departmental skills base, the 2017/18 skills development budget is decentralised per pro-
gramme. This would enable programme specific training interventions and precisely focusing on law
enforcement:
Five (5) officials will be trained as new traffic officers within 2017/18;
Provincial revenue collection will be improved, with the continuation of the process to transfer
the motor vehicle license collection function to the South African Post Office (SAPO);
Twenty (20) of the police stations with highest crime rates will be continually monitored and
assessed to ensure compliance to service delivery standards;
The department would continue to coordinate the recently reviewed Provincial Crime Prevention
Strategy, with the emphasis being on an integrated crime prevention approach;
Social Crime Prevention programmes, specifically anti-substance abuse campaigns, targeting the
youth, will continue to be implemented;
Community involvement in crime prevention initiatives is a key element to ensure a crime free
society, the department will therefore continue to ensure the effective functioning of community
policing forums;
Additional funding amount of R2.5 million for the 2017/18 financial year, was secured for the
departmental EPWP Programme. This would enable the appointment of more volunteers;
Department will continue to support municipalities with the development of Integrated Transport
Plans (ITP), seven (7) municipalities will be assisted;
Completed ITP’s would enable the expansion of the Public Transport Operators Grant initiatives
to previously unserved areas;
The safety of commuters continues to be of pivotal importance, hence the public transport inspec-
torate will continue with road worthy inspections of all public transport operators;
In the province fifty one per cent (51%) of commuters, travel making use of public transport i.e.
taxis. The department will therefore ensure that within 2017/18 financial year , through the effi-
cient and effective operations of the public regulating entity that no back-log exists in respect of
awarding operator licenses;
A prerequisite for industrialisation is the existence of a cost effective transport and the logistical
system. To this effect the department will continue in its efforts to ensure that the fruition of the
development of the Port Nolloth/ Boegoe Bay, as well as the De Aar Warehouse Project, to boost
the economy of the Northern Cape;
The cost to the economy and society at large of road accidents are immeasurable, therefore within
2017/18 the focus of law enforcement would continue to be geared towards combatting the two
main contributors to road accidents i.e. speeding and drunken driving.
4. Reprioritisation
Reprioritisation was done across programmes and economic classification with funding being moved
from slow spending sub-programmes and non-core spending items towards funding pressures budget
for compensation of employees for appointment of critical posts.
In order to improve the functioning of district offices and traffic stations, funding amounting to
R2 million was reprioritised for infrastructure development over the MTEF. The first project will be
the renovation of the office building within Springbok office; Traffic stations will be prioritised as
from 2018/19.
The human resource within Transport Regulations is inadequate to provide services 24 hours a day,
seven days a week. An amount of R0.500 million was therefore prioritised in order to augment the
existing pressure on overtime for traffic officials.
Reprioritization came into fruition by allocating no/low increases to non-essential expenditure items.
Included in the reprioritization, is funding to the value of R2.290 million, within 2017/18, moved
from goods and services towards compensation of employees. This movement is to make provision
for officials directly responsible for the coordination of the scholar transport.
5. Procurement
The department’s 2017/18 procurement will mainly focus on the day-to-day purchases with within a
monetary value of less than R0.500 million. To ensure the availability of working tools an amount of
R3 million across the MTEF, was reprioritised in order to procure vehicles for traffic officials; cali-
bration of the traffic equipment, uniforms for traffic officials, training interventions, bulk printing and
computer equipment.
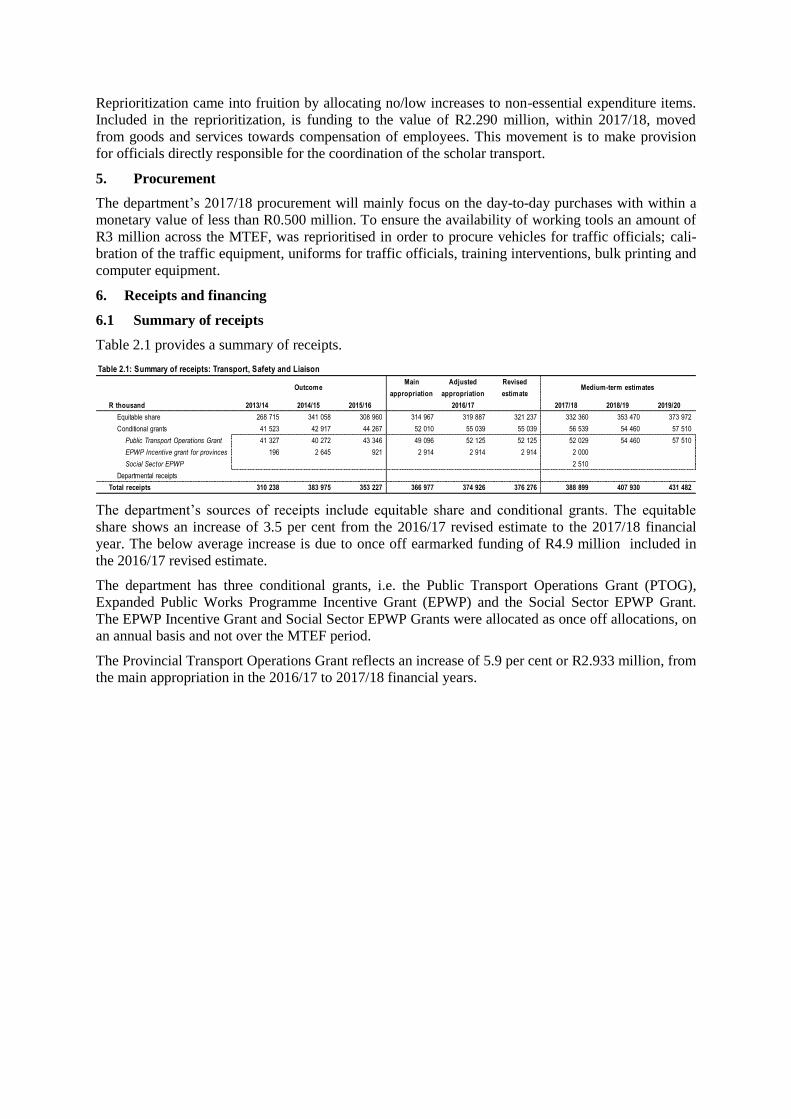
6. Receipts and financing
6.1 Summary of receipts
Table 2.1 provides a summary of receipts.
Table 2.1: Summary of receipts: Transport, Safety and Liaison
OutcomeMain
appropriation
Adjusted
appropriation
Revised
estimateMedium-term estimates
R thousand 2013/14 2014/15 2015/16 2017/18 2018/19 2019/20
Equitable share 268 715 341 058 308 960 314 967 319 887 321 237 332 360 353 470 373 972
Conditional grants 41 523 42 917 44 267 52 010 55 039 55 039 56 539 54 460 57 510
Public Transport Operations Grant 41 327 40 272 43 346 49 096 52 125 52 125 52 029 54 460 57 510
EPWP Incentive grant for provinces 196 2 645 921 2 914 2 914 2 914 2 000
Social Sector EPWP 2 510
Departmental receipts
Total receipts 310 238 383 975 353 227 366 977 374 926 376 276 388 899 407 930 431 482
2016/17
The department’s sources of receipts include equitable share and conditional grants. The equitable
share shows an increase of 3.5 per cent from the 2016/17 revised estimate to the 2017/18 financial
year. The below average increase is due to once off earmarked funding of R4.9 million included in
the 2016/17 revised estimate.
The department has three conditional grants, i.e. the Public Transport Operations Grant (PTOG),
Expanded Public Works Programme Incentive Grant (EPWP) and the Social Sector EPWP Grant.
The EPWP Incentive Grant and Social Sector EPWP Grants were allocated as once off allocations, on
an annual basis and not over the MTEF period.
The Provincial Transport Operations Grant reflects an increase of 5.9 per cent or R2.933 million, from
the main appropriation in the 2016/17 to 2017/18 financial years.

6.2 Departmental receipts
Table 2.2 provides summary of departmental receipts collection.
Table 2.2 : Summary of departmental receipts collection
OutcomeMain
appropriation
Adjusted
appropriation
Revised
estimateMedium-term estimates
R thousand 2013/14 2014/15 2015/16 2017/18 2018/19 2019/20
Tax receipts 135 586 148 621 162 190 178 292 178 292 178 292 212 000 225 324 239 071
Casino tax es – – – – – – – – –
Horse racing tax es – – – – – – – – –
Liquor licences – – – – – – – – –
Motor v ehicle licences 135 586 148 621 162 190 178 292 178 292 178 292 212 000 225 324 239 071
Sales of goods and serv ices other than capital
assets
17 123 13 872 14 531 15 947 15 947 22 264 16 990 17 925 18 872
Transfers receiv ed – – – – – – – – –
Fines, penalties and forfeits 2 664 2 123 2 213 2 223 2 223 2 223 2 358 2 490 2 590
Interest, div idends and rent on land – – – – – – – – –
Sales of capital assets – – 250 – – – – – –
Transactions in financial assets and liabilities 2 880 6 579 4 875 117 117 351 123 129 134
Total departmental receipts 158 253 171 195 184 059 196 579 196 579 203 130 231 471 245 868 260 667
2016/17
The budget grows from R15.948 million in 2016/17 to R16.990 million in 2017/18 financial period.
This growth is because of inflationary factors as projected over the MTEF. The bulk of the depart-
ment’s own revenue is generated from Tax receipts i.e. registration and the renewal of motor vehicle
licenses. It constitutes more than 96 per cent of the department’s own receipts estimated in 2017/18
financial period.
The motor vehicle license budget has increased from R178.292 million in 2016/17 to R212 million in
2017/18 financial year. This is an increase of 18.9 per cent from the 2016/17 revised estimate to the
2017/18 financial year budget. The increase is due to expected tariff increase of 10 per cent for all
types of vehicles. Furthermore, the total number of live vehicle population in the province, informed
the budget.
The function of renewal of motor vehicle licensing, currently performed by municipalities will be
transferred to the South African Post Office at the beginning of the 2017/18 financial year due to the
challenges experienced with municipalities. The department is projecting to collect all the revenue
budgeted for, under this item.
Sales of goods and services other than capital assets consists of amongst others sales of personalised
and specific number plates, abnormal loads, operating licenses, learners and drivers licenses. Revenue
generated from this item is dependent on a wide range of statistics such as population of individuals,
businesses and the sale of personalized and specialized number plates.
The budget for the item fines, penalties and forfeits estimated on collection from traffic fines charged
to the road users who are contravening the road traffic laws. The budget for this item is showing a
minimal increase over the 2017 MTEF due to the uncertain nature, as plans are afoot for the depart-
ment to promote road safety awareness in an attempt to reduce road traffic offences.
Financial transactions in assets and liabilities consist of accrued revenue, which is the collection of
outstanding motor vehicle licenses fees, previously collected by New Integrated Credit Solutions
(NICS) on behalf of the department as well as the recoveries of staff debts. The slow growth under
this item is attributed to the difficulty in budgeting for this item, due to its uncertain nature.
6.3 Donor funding
The department does not receive any foreign donations.
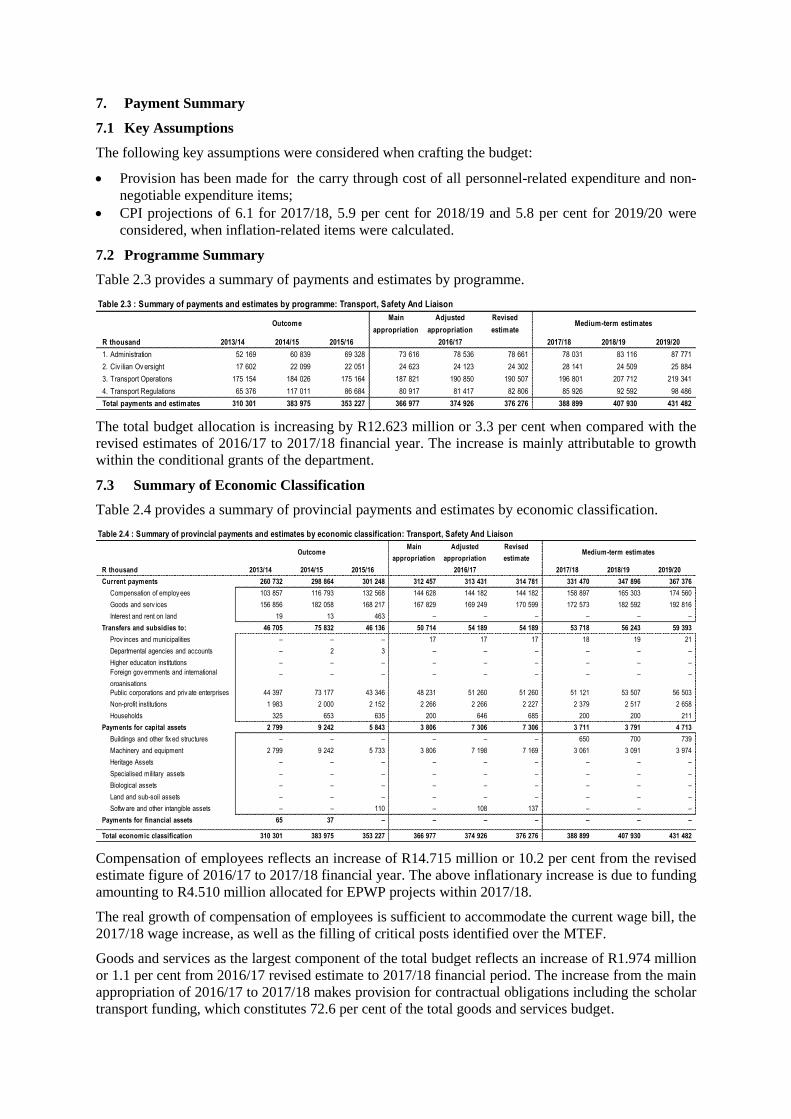
7. Payment Summary
7.1 Key Assumptions
The following key assumptions were considered when crafting the budget:
Provision has been made for the carry through cost of all personnel-related expenditure and non-
negotiable expenditure items;
CPI projections of 6.1 for 2017/18, 5.9 per cent for 2018/19 and 5.8 per cent for 2019/20 were
considered, when inflation-related items were calculated.
7.2 Programme Summary
Table 2.3 provides a summary of payments and estimates by programme.
Table 2.3 : Summary of payments and estimates by programme: Transport, Safety And Liaison
OutcomeMain
appropriation
Adjusted
appropriation
Revised
estimateMedium-term estimates
R thousand 2013/14 2014/15 2015/16 2017/18 2018/19 2019/20
1. Administration 52 169 60 839 69 328 73 616 78 536 78 661 78 031 83 116 87 771
2. Civ ilian Ov ersight 17 602 22 099 22 051 24 623 24 123 24 302 28 141 24 509 25 884
3. Transport Operations 175 154 184 026 175 164 187 821 190 850 190 507 196 801 207 712 219 341
4. Transport Regulations 65 376 117 011 86 684 80 917 81 417 82 806 85 926 92 592 98 486
Total payments and estimates 310 301 383 975 353 227 366 977 374 926 376 276 388 899 407 930 431 482
2016/17
The total budget allocation is increasing by R12.623 million or 3.3 per cent when compared with the
revised estimates of 2016/17 to 2017/18 financial year. The increase is mainly attributable to growth
within the conditional grants of the department.
7.3 Summary of Economic Classification
Table 2.4 provides a summary of provincial payments and estimates by economic classification.
Table 2.4 : Summary of provincial payments and estimates by economic classification: Transport, Safety And Liaison
OutcomeMain
appropriation
Adjusted
appropriation
Revised
estimateMedium-term estimates
R thousand 2013/14 2014/15 2015/16 2017/18 2018/19 2019/20
Current payments 260 732 298 864 301 248 312 457 313 431 314 781 331 470 347 896 367 376
Compensation of employ ees 103 857 116 793 132 568 144 628 144 182 144 182 158 897 165 303 174 560
Goods and serv ices 156 856 182 058 168 217 167 829 169 249 170 599 172 573 182 592 192 816
Interest and rent on land 19 13 463 – – – – – –
Transfers and subsidies to: 46 705 75 832 46 136 50 714 54 189 54 189 53 718 56 243 59 393
Prov inces and municipalities – – – 17 17 17 18 19 21
Departmental agencies and accounts – 2 3 – – – – – –
Higher education institutions – – – – – – – – –
Foreign gov ernments and international
organisations
– – – – – – – – –
Public corporations and priv ate enterprises 44 397 73 177 43 346 48 231 51 260 51 260 51 121 53 507 56 503
Non-profit institutions 1 983 2 000 2 152 2 266 2 266 2 227 2 379 2 517 2 658
Households 325 653 635 200 646 685 200 200 211
Payments for capital assets 2 799 9 242 5 843 3 806 7 306 7 306 3 711 3 791 4 713
Buildings and other fix ed structures – – – – – – 650 700 739
Machinery and equipment 2 799 9 242 5 733 3 806 7 198 7 169 3 061 3 091 3 974
Heritage Assets – – – – – – – – –
Specialised military assets – – – – – – – – –
Biological assets – – – – – – – – –
Land and sub-soil assets – – – – – – – – –
Softw are and other intangible assets – – 110 – 108 137 – – –
Payments for financial assets 65 37 – – – – – – –
Total economic classification 310 301 383 975 353 227 366 977 374 926 376 276 388 899 407 930 431 482
2016/17
Compensation of employees reflects an increase of R14.715 million or 10.2 per cent from the revised
estimate figure of 2016/17 to 2017/18 financial year. The above inflationary increase is due to funding
amounting to R4.510 million allocated for EPWP projects within 2017/18.
The real growth of compensation of employees is sufficient to accommodate the current wage bill, the
2017/18 wage increase, as well as the filling of critical posts identified over the MTEF.
Goods and services as the largest component of the total budget reflects an increase of R1.974 million
or 1.1 per cent from 2016/17 revised estimate to 2017/18 financial period. The increase from the main
appropriation of 2016/17 to 2017/18 makes provision for contractual obligations including the scholar
transport funding, which constitutes 72.6 per cent of the total goods and services budget.
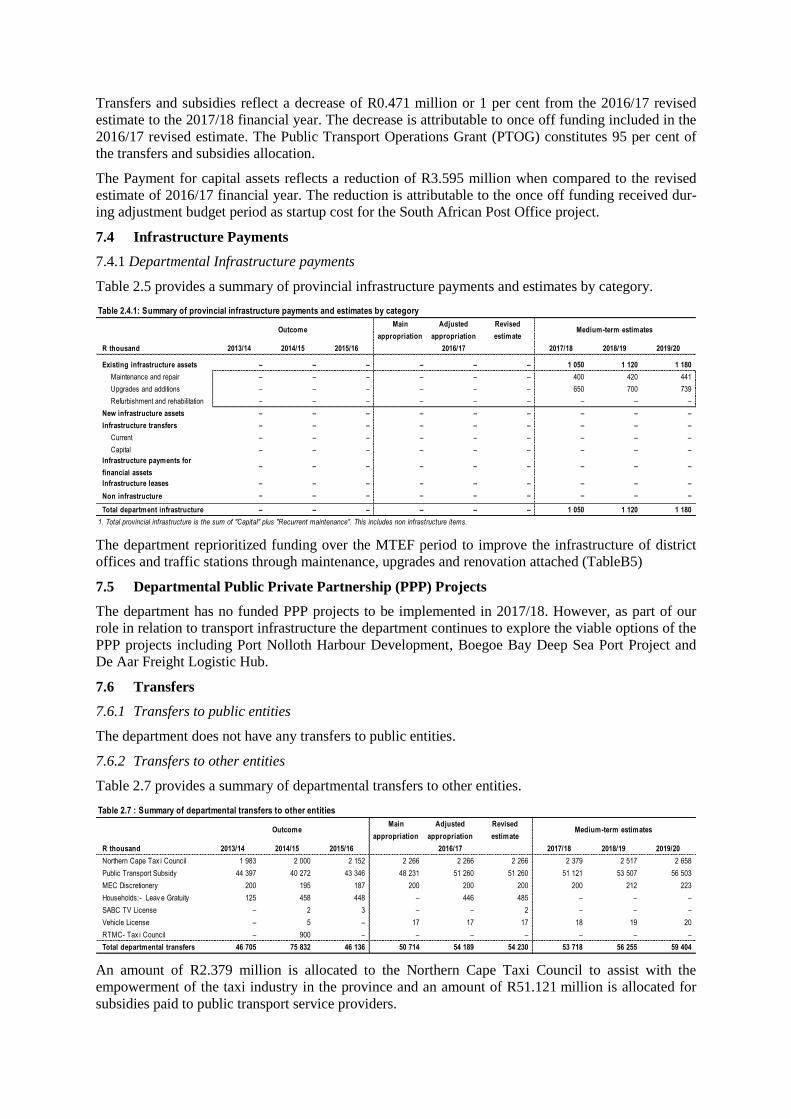
Transfers and subsidies reflect a decrease of R0.471 million or 1 per cent from the 2016/17 revised
estimate to the 2017/18 financial year. The decrease is attributable to once off funding included in the
2016/17 revised estimate. The Public Transport Operations Grant (PTOG) constitutes 95 per cent of
the transfers and subsidies allocation.
The Payment for capital assets reflects a reduction of R3.595 million when compared to the revised
estimate of 2016/17 financial year. The reduction is attributable to the once off funding received dur-
ing adjustment budget period as startup cost for the South African Post Office project.
7.4 Infrastructure Payments
7.4.1 Departmental Infrastructure payments
Table 2.5 provides a summary of provincial infrastructure payments and estimates by category.
Table 2.4.1: Summary of provincial infrastructure payments and estimates by category
OutcomeMain
appropriation
Adjusted
appropriation
Revised
estimateMedium-term estimates
R thousand 2013/14 2014/15 2015/16 2017/18 2018/19 2019/20
Existing infrastructure assets – – – – – – 1 050 1 120 1 180
Maintenance and repair – – – – – – 400 420 441
Upgrades and additions – – – – – – 650 700 739
Refurbishment and rehabilitation – – – – – – – – –
New infrastructure assets – – – – – – – – –
Infrastructure transfers – – – – – – – – –
Current – – – – – – – – –
Capital – – – – – – – – –
Infrastructure payments for
financial assets– – – – – – – – –
Infrastructure leases – – – – – – – – –
Non infrastructure – – – – – – – – –
Total department infrastructure – – – – – – 1 050 1 120 1 180
1. Total provincial infrastructure is the sum of "Capital" plus "Recurrent maintenance". This includes non infrastructure items.
2016/17
The department reprioritized funding over the MTEF period to improve the infrastructure of district
offices and traffic stations through maintenance, upgrades and renovation attached (TableB5)
7.5 Departmental Public Private Partnership (PPP) Projects
The department has no funded PPP projects to be implemented in 2017/18. However, as part of our
role in relation to transport infrastructure the department continues to explore the viable options of the
PPP projects including Port Nolloth Harbour Development, Boegoe Bay Deep Sea Port Project and
De Aar Freight Logistic Hub.
7.6 Transfers
7.6.1 Transfers to public entities
The department does not have any transfers to public entities.
7.6.2 Transfers to other entities
Table 2.7 provides a summary of departmental transfers to other entities.
Table 2.7 : Summary of departmental transfers to other entities
OutcomeMain
appropriation
Adjusted
appropriation
Revised
estimateMedium-term estimates
R thousand 2013/14 2014/15 2015/16 2017/18 2018/19 2019/20
Northern Cape Tax i Council 1 983 2 000 2 152 2 266 2 266 2 266 2 379 2 517 2 658
Public Transport Subsidy 44 397 40 272 43 346 48 231 51 260 51 260 51 121 53 507 56 503
MEC Discretionery 200 195 187 200 200 200 200 212 223
Households:- Leav e Gratuity 125 458 448 – 446 485 – – –
SABC TV License – 2 3 – – 2 – – –
Vehicle License – 5 – 17 17 17 18 19 20
RTMC- Tax i Council – 900 – – – – – – –
Total departmental transfers 46 705 75 832 46 136 50 714 54 189 54 230 53 718 56 255 59 404
2016/17
An amount of R2.379 million is allocated to the Northern Cape Taxi Council to assist with the
empowerment of the taxi industry in the province and an amount of R51.121 million is allocated for
subsidies paid to public transport service providers.

7.6.3 Transfers to local government
Table 2.8 provides a summary of departmental transfers to local government by category.
Table 2.8 : Summary of departmental transfers to local government by category
OutcomeMain
appropriation
Adjusted
appropriation
Revised
estimateMedium-term estimates
R thousand 2013/14 2014/15 2015/16 2017/18 2018/19 2019/20
Category A – – – – – – – – –
Category B 14 9 16 17 17 17 18 19 20
Category C – 38 – – – – – – –
Unallocated – – – – – – – – –
Total departmental transfers 14 47 16 17 17 17 18 19 20
2016/17
These transfers relates to the renewal of motor vehicle licences for the departmental owned fleet as
well as to rates and taxes paid to municipalities.
8. Receipts and retentions
The department does not retain revenue collected
9. Programme description
Programme 1: Administration
9.1 Description and objectives
To provide strategic, finance, organisational and administrative support services to the line functions
of the department.
Sub-programme objectives
Office of the MEC
Render advisory, secretary, administrative and office support services for the office of the MEC.
Management
To render overall management and support of the department.
Financial Management
To ensure departmental financial compliance through financial management services over the five
year period.
Corporate services
To ensure the overall corporate support and provisioning of human capital.
Table 2.10.1 provides a summary of payments and estimates by sub programme.
Table 2.10.1 : Summary of payments and estimates by sub-programme: Administration
OutcomeMain
appropriation
Adjusted
appropriation
Revised
estimateMedium-term estimates
R thousand 2013/14 2014/15 2015/16 2017/18 2018/19 2019/20
1. Office Of The Mec 9 010 10 106 9 342 10 190 10 190 10 168 10 478 11 183 11 811
2. Management 4 731 6 512 5 859 6 141 6 141 5 885 7 201 7 629 8 056
3. Financial Management 16 124 18 288 22 100 22 694 27 614 28 053 23 684 25 273 26 687
4. Corporate Serv ices 22 304 25 933 32 027 34 591 34 591 34 555 36 668 39 031 41 217
Total payments and estimates 52 169 60 839 69 328 73 616 78 536 78 661 78 031 83 116 87 771
2016/17
The programme experience a decline of R0.630 million or 1 per cent from the revised estimate of the
2016/17 financial year to the 2017/18 financial year. The decrease is due to once off funding of
R4.920 million, allocated within 2016/17 revised estimate.

Table 2.12.1 provides summary of payments and estimates by economic classification.
Table 2.12.1 : Summary of payments and estimates by economic classification: Administration
OutcomeMain
appropriation
Adjusted
appropriation
Revised
estimateMedium-term estimates
R thousand 2013/14 2014/15 2015/16 2017/18 2018/19 2019/20
Current payments 51 221 58 363 67 485 71 170 72 250 72 375 76 245 81 227 85 776
Compensation of employ ees 30 111 33 959 43 162 47 884 47 544 47 895 51 554 55 081 58 167
Goods and serv ices 21 091 24 391 24 313 23 286 24 706 24 480 24 691 26 146 27 609
Interest and rent on land 19 13 10 – – – – – –
Transfers and subsidies to: 173 225 250 200 540 540 200 200 211
Prov inces and municipalities – – – – – – – – –
Departmental agencies and accounts – 1 3 – – – – – –
Higher education institutions – – – – – – – – –
Foreign gov ernments and international
organisations
– – – – – – – – –
Public corporations and priv ate enterprises 7 – – – – – – – –
Non-profit institutions – – – – – – – – –
Households 166 224 247 200 540 540 200 200 211
Payments for capital assets 775 2 250 1 593 2 246 5 746 5 746 1 586 1 689 1 784
Buildings and other fix ed structures – – – – – – – – –
Machinery and equipment 775 2 250 1 494 2 246 5 638 5 615 1 586 1 689 1 784
Heritage Assets – – – – – – – – –
Specialised military assets – – – – – – – – –
Biological assets – – – – – – – – –
Land and sub-soil assets – – – – – – – – –
Softw are and other intangible assets – – 99 – 108 131 – – –
Payments for financial assets – 1 – – – – – – –
Total economic classification 52 169 60 839 69 328 73 616 78 536 78 661 78 031 83 116 87 771
2016/17
The increase of R3.659 million or 7.6 per cent of R47.895 million revised estimates for 2016/17
amount of compensation of employees is mainly attributed to ICS, filling of critical vacant posts and
funding required sustaining the newly established Risk Management Unit.
Goods and services growth from the revised estimate of the 2016/17 financial year towards the
2017/18 financial year is R0.211 million. The low expenditure is due to extensive reprioritisation, as
well as the decentralisation of the training allocation towards other programmes including contractual
obligations.
The payment for capital assets reflects a decrease of R4.029 million between the revised estimate of
2016/17 and 2017/18 MTEF year due to the once off capital received during the 2016/17 adjustment
appropriations.
Programme 2: Civilian Secretariat
Description and objective
The purpose of this programme is to:
Hold provincial law enforcement agencies accountable, with regard to policing activities; provide an
integrated social crime prevention management framework to facilitate safer communities.
Sub-Programme objectives
Policy and Research is to conduct research on policing, to influence policy changes.
Monitoring and Evaluation is to monitor police conduct, transformation and community complaints,
against members of the police service, in the province.
Safety Promotion is to provide integrated social crime prevention interventions, for safer
communities.
Community Police Relations is to provide for the participation and involvement of communities in
social crime prevention initiatives, and to further strengthen relations between communities and po-
lice.

Table 2.10.2 provides a summary of payments and estimates by sub programme.
Table 2.10.2 : Summary of payments and estimates by sub-programme: Civilian Oversight
OutcomeMain
appropriation
Adjusted
appropriation
Revised
estimateMedium-term estimates
R thousand 2013/14 2014/15 2015/16 2017/18 2018/19 2019/20
1. Programme Support 6 913 7 215 9 870 10 838 10 338 10 907 12 496 12 625 13 331
2. Policy And Research 1 832 2 119 2 410 2 590 2 590 2 585 2 612 2 790 2 947
3. Monitoring And Ev aluation 2 345 2 316 1 508 1 722 1 722 1 681 2 479 2 646 2 796
4. Safety Promotion 4 756 4 338 4 552 3 458 3 458 4 067 3 706 3 954 4 175
5. Community Police Relations 1 756 6 111 3 711 6 015 6 015 5 062 6 848 2 494 2 635
Total payments and estimates 17 602 22 099 22 051 24 623 24 123 24 302 28 141 24 509 25 884
2016/17
The programme reflects an increase of R3.839 million or 15.9 per cent from the 2016/17 revised esti-
mate to the 2017/18 financial year. The increase is due to the EPWP grant funding of R4.510 million,
within 2017/18, allocated within the sub-programme Community Police Relations.
Table 2.12.2 provides a summary of payments and estimates by economic classification.
Table 2.12.2 : Summary of payments and estimates by economic classification: Civilian Oversight
OutcomeMain
appropriation
Adjusted
appropriation
Revised
estimateMedium-term estimates
R thousand 2013/14 2014/15 2015/16 2017/18 2018/19 2019/20
Current payments 16 757 21 412 21 230 23 812 23 747 23 926 27 188 24 189 25 545
Compensation of employ ees 13 616 17 132 17 530 20 357 20 292 20 471 23 602 20 392 21 534
Goods and serv ices 3 141 4 280 3 700 3 455 3 455 3 455 3 586 3 797 4 011
Interest and rent on land – – – – – – – – –
Transfers and subsidies to: – 50 – – 65 65 – – –
Prov inces and municipalities – – – – – – – – –
Departmental agencies and accounts – – – – – – – – –
Higher education institutions – – – – – – – – –
Foreign gov ernments and international
organisations
– – – – – – – – –
Public corporations and priv ate enterprises – – – – – – – – –
Non-profit institutions – – – – – – – – –
Households – 50 – – 65 65 – – –
Payments for capital assets 845 632 821 811 311 311 953 320 339
Buildings and other fix ed structures – – – – – – 650 – –
Machinery and equipment 845 632 821 811 311 305 303 320 339
Heritage Assets – – – – – – – – –
Specialised military assets – – – – – – – – –
Biological assets – – – – – – – – –
Land and sub-soil assets – – – – – – – – –
Softw are and other intangible assets – – – – – 6 – – –
Payments for financial assets – 5 – – – – – – –
Total economic classification 17 602 22 099 22 051 24 623 24 123 24 302 28 141 24 509 25 884
2016/17
Compensation of employees indicates an increase of R3.131 million or 15.9 per cent between the
2016/17 revised estimate and the 2017/18 financial year. The increase is influenced by the EPWP
Grant (R2 million) and Social Sector EPWP Grant (R2.510 million).
When factoring out conditional grant funding of R2.914 million within 2016/17 and R4.510 million
within 2017/18 are excluded, the increase within compensation of employees amounts to
R1.535 million or 8.7 per cent. The above inflationary increase is for the filling of critical vacancies,
specifically the district manager ZF Mgcawu and the provincial manager Monitoring and Evaluation.
Goods and services increased with an amount of R0.131 million or 3.8 per cent. The low increase is
part of the process to realign funds with operational expectations. Capital funding increases by R0.642
million as a result of the reprioritization of R0.750 million for infrastructure within the 2017/18.

Service delivery measures
Safety and Liaison
Programme / Subprogramme / Performance Measures
2017-18 2018-19 2019-20
QUARTERLY OUTPUTS
Programme 2: Civilian Oversight
2.2 Policy and Research
Number of Community Safety Research Conducted 8 8 8
2.3 Monitoring and Evaluation
Number of management reports compiled on service delivery complaints
against SAPS
4 4 4
Number of reports compiled on implementation of IPID recommendations by
SAPS
4 4 4
Number of police stations monitored and reports compiled 20 20 20
Number of Domestic Violence Act (DVA) Compliance Reports compiled 4 4 4
Number of reports on Monitoring and Evaluation Special Projects compiled 1 1 1
2.4 Social Crime Prevention
Number of crime prevention programmes implemented 4 4 4
2.5 Community Police Relations
Number of functional CPFs assessed 30 45 60
Number of functional CSFs assessed 5 7 10
ANNUAL OUTPUTS
Programme 2: Civilian Oversight
2.2 Policy and Research
Number of research reports on special projects compiled 1 1 1
2.3 Monitoring and Evaluation
Number of reports on the implementation of National Monitoring Tool
recommendations compiled
4 4 4
Estimated Annual Targets
Programme 3: Transport Operations
Description and objective
The purpose of this programme is to plan, regulate and facilitate the provision of public- and freight
transport services and infrastructure, through own provincial resources, cooperation with national- and
local authorities, as well as the private sector, in order to enhance the mobility of all communities,
particularly those currently with limited access to transport.
Sub-Programme objectives
Public Transport Services is to provide an affordable and accessible transport service to communi-
ties.
Transport Safety and Compliance is to promote and improve safety on the public transport system
and to enforce compliance with public transport legislation and regulations as well as the liaison and
coordination of provincial safety and compliance initiatives.
Transport Systems is to provide an integrated transport system, coordination and capacitation of
municipalities in relation to transport.
Infrastructure Operations is to manage public infrastructure terminals.
Operator Licence and Permits is to manage and control the registering of transport operators and
the issuing of all licences and permits required in terms of legislation.

Table 2.10.3 provides a summary of payments and estimates by sub programme.
Table 2.10.3 : Summary of payments and estimates by sub-programme: Transport Operations
OutcomeMain
appropriation
Adjusted
appropriation
Revised
estimateMedium-term estimates
R thousand 2013/14 2014/15 2015/16 2017/18 2018/19 2019/20
1. Programmesupport 3 394 2 113 4 947 1 691 1 691 1 809 1 842 1 944 2 052
2. Public Transport Serv ices 153 729 154 426 157 770 174 257 177 286 177 342 183 483 193 575 204 415
3. Transport Safety And Compliance 2 416 4 412 1 088 865 865 865 992 1 051 1 110
4. Transport Sy stems 4 181 1 662 3 179 2 953 2 953 2 607 2 574 2 721 2 873
5. Infrastructure Operations 6 359 17 914 2 504 1 945 1 945 1 820 2 007 2 150 2 269
6. Operator Licence And Permits 5 075 3 499 5 676 6 110 6 110 6 064 5 903 6 270 6 622
Total payments and estimates 175 154 184 026 175 164 187 821 190 850 190 507 196 801 207 712 219 341
2016/17
The programme reflects budget growth of R6.294 million or 3.3 per cent of the revised estimate of
2016/17. The funding for this programme includes the Public Transport Operations Grant amounting
to R52.029 million.
Table 2.12.3 provides a summary of payments and estimates by economic classification.
Table 2.12.3 : Summary of payments and estimates by economic classification: Transport Operations
OutcomeMain
appropriation
Adjusted
appropriation
Revised
estimateMedium-term estimates
R thousand 2013/14 2014/15 2015/16 2017/18 2018/19 2019/20
Current payments 128 516 140 498 129 329 137 181 137 181 136 877 143 129 151 521 160 003
Compensation of employ ees 7 906 8 144 11 010 10 503 10 503 9 973 12 669 13 524 14 281
Goods and serv ices 120 610 132 354 117 883 126 678 126 678 126 904 130 460 137 997 145 722
Interest and rent on land – – 436 – – – – – –
Transfers and subsidies to: 46 437 43 295 45 539 50 503 53 532 53 493 53 507 56 031 59 169
Prov inces and municipalities – – – 6 6 6 7 7 8
Departmental agencies and accounts – – – – – – – – –
Higher education institutions – – – – – – – – –
Foreign gov ernments and international
organisations
– – – – – – – – –
Public corporations and priv ate enterprises 44 390 41 177 43 346 48 231 51 260 51 260 51 121 53 507 56 503
Non-profit institutions 1 983 2 000 2 152 2 266 2 266 2 227 2 379 2 517 2 658
Households 64 118 41 – – – – – –
Payments for capital assets 201 233 296 137 137 137 165 159 169
Buildings and other fix ed structures – – – – – – – – –
Machinery and equipment 201 233 285 137 137 137 165 159 169
Heritage Assets – – – – – – – – –
Specialised military assets – – – – – – – – –
Biological assets – – – – – – – – –
Land and sub-soil assets – – – – – – – – –
Softw are and other intangible assets – – 11 – – – – – –
Payments for financial assets – – – – – – – – –
Total economic classification 175 154 184 026 175 164 187 821 190 850 190 507 196 801 207 712 219 341
2016/17
Compensation of employees increases by R2.726 million as the results of the realignment of funds for
officials within scholar transport. Included in the goods and services line item budget is a total budget
of R125.310 million in respect of scholar transport.
The allocation under transfers and subsidies make provision for public corporations and private enter-
prises relating to the Public Transport Operators Grant. The transfer portion of the grant reflects an
increase of R2.890 million for the 2017/18 financial year.

Service delivery measures
Safety and Liaison
Programme / Subprogramme / Performance Measures
2017-18 2018-19 2019-20
QUARTERLY OUTPUTS
Programme 3: Tranport Operations
3.2 Public Transport Services
Number of kilometers subsidised 1716501 1716501 1716501
Number of trips subsidized 40796 40796 40796
Number of Provincial Regulating Entity (PRE) hearings conducted 8 8 12
Number of learners subsidized with transport 24750 24750 24750
3.5 Infrastructure Operations
Number of Key Infrastructure Projects coordinated 2 2 2
Number of reports on the promotion of non-motorised transport submitted 4 4 4
ANNUAL OUTPUTS
Programme 3: Transport Operations
3.2 Public Transport Services
Number of routes subsidised 65 65 68
3.3 Transport Safety and Compliance
Number of comprehensive transport plans submitted 7 6 2
Estimated Annual Targets
Programme 4: Transport Regulation
Description and objective
The purpose of this Programme is to:
Ensure the provision of a safe road environment, through the regulation of traffic on public roads,
implementation of road safety campaigns and awareness programmes as well as registration and li-
censing of vehicles and drivers as well as Law Enforcement.
Sub-Programme objectives
Transport Administration and Licensing is to render services regarding the administration of appli-
cations, in terms of the National Road Traffic Act, 1996 (Act 93 of 1996);
Road Safety Education is to facilitate a safe transport system, by promoting road safety education
and awareness, for all modes of transport.
Law Enforcement is to maintain law and order for all modes of transport, by providing quality traffic
policing services, as stipulated by the relevant legislation;
Table 2.10.4 provides a summary of payments and estimates by sub- programme.
Table 2.10.4 : Summary of payments and estimates by sub-programme: Transport Regulations
OutcomeMain
appropriation
Adjusted
appropriation
Revised
estimateMedium-term estimates
R thousand 2013/14 2014/15 2015/16 2017/18 2018/19 2019/20
1. Programme Support 2 368 2 559 2 339 2 487 2 487 2 204 2 591 2 765 2 919
2. Traffic Administration And Licensing 7 199 7 505 8 390 9 052 8 852 9 198 9 270 9 894 10 448
3. Road Safety Education 2 300 5 215 2 910 2 879 3 079 3 017 2 936 3 129 3 305
4. Traffic Law Enforcement 53 509 101 732 73 045 66 499 66 999 68 387 71 129 76 804 81 814
Total payments and estimates 65 376 117 011 86 684 80 917 81 417 82 806 85 926 92 592 98 486
2016/17
The programme reflects growth of R3.120 million or 3.8 per cent from the 2016/17 revised estimate
to the 2017/18 financial year. The minimal growth is due to expenditure incurred for the escorting of
abnormal loads in 2016/17.

Table 2.12.4 provides summary of payments and estimates by economic classification.
Table 2.12.4 : Summary of payments and estimates by economic classification: Transport Regulations
OutcomeMain
appropriation
Adjusted
appropriation
Revised
estimateMedium-term estimates
R thousand 2013/14 2014/15 2015/16 2017/18 2018/19 2019/20
Current payments 64 238 78 591 83 204 80 294 80 253 81 603 84 908 90 958 96 052
Compensation of employ ees 52 224 57 558 60 866 65 884 65 843 65 843 71 072 76 306 80 578
Goods and serv ices 12 014 21 033 22 321 14 410 14 410 15 760 13 836 14 652 15 474
Interest and rent on land – – 17 – – – – – –
Transfers and subsidies to: 95 32 262 347 11 52 91 11 12 13
Prov inces and municipalities – – – 11 11 11 11 12 13
Departmental agencies and accounts – 1 – – – – – – –
Higher education institutions – – – – – – – – –
Foreign gov ernments and international
organisations
– – – – – – – – –
Public corporations and priv ate enterprises – 32 000 – – – – – – –
Non-profit institutions – – – – – – – – –
Households 95 261 347 – 41 80 – – –
Payments for capital assets 978 6 127 3 133 612 1 112 1 112 1 007 1 622 2 421
Buildings and other fix ed structures – – – – – – – 700 739
Machinery and equipment 978 6 127 3 133 612 1 112 1 112 1 007 922 1 682
Heritage Assets – – – – – – – – –
Specialised military assets – – – – – – – – –
Biological assets – – – – – – – – –
Land and sub-soil assets – – – – – – – – –
Softw are and other intangible assets – – – – – – – – –
Payments for financial assets 65 31 – – – – – – –
Total economic classification 65 376 117 011 86 684 80 917 81 417 82 806 85 926 92 592 98 486
2016/17
The 2017/18 budget for compensation of employees increased by R5.229 million or 8 per cent from
the 2016/17 revised estimate. The growth makes provision for ICS and overtime payments for traffic
officials whilst on standby.
The goods and services line item reflects a decrease as results of once off budget pressure projected in
the 2016/17 financial year. The remaining reduction is a reprioritization from goods and services to
capital funds in order to make provision for the procurement of vehicles for traffic officials.
The capital allocation makes provision for R3.088 million over the MTEF for the procurement of
vehicles, commencing with R0.750 million within 2017/18. There is also funding for infrastructure
projects within Transport Regulations as from the 2018/19 financial year.
Service delivery measures
Safety and Liaison
Programme / Subprogramme / Performance Measures
2017-18 2018-19 2019-20
QUARTERLY OUTPUTS
Programme 4: Transport Regulations
4.3 Road Safety Education
Number of road safety awareness programmes conducted 150 150 150
Number of schools involved in road safety education programmes 100 100 100
4.4 Law Enforcement
Number of speed operations conducted 1600 1620 1640
Number of vehicles weighed 40000 40000 40000
Number of drunken driving operations conducted. 1000 1000 1000
Number of vehicle stopped and checked 120000 120000 120000
ANNUAL OUTPUTS
Programme 4: Transport Regulations
4.2 Transport Administration and Licensing
Number of compliance inspections conducted 60 60 60
Estimated Annual Targets
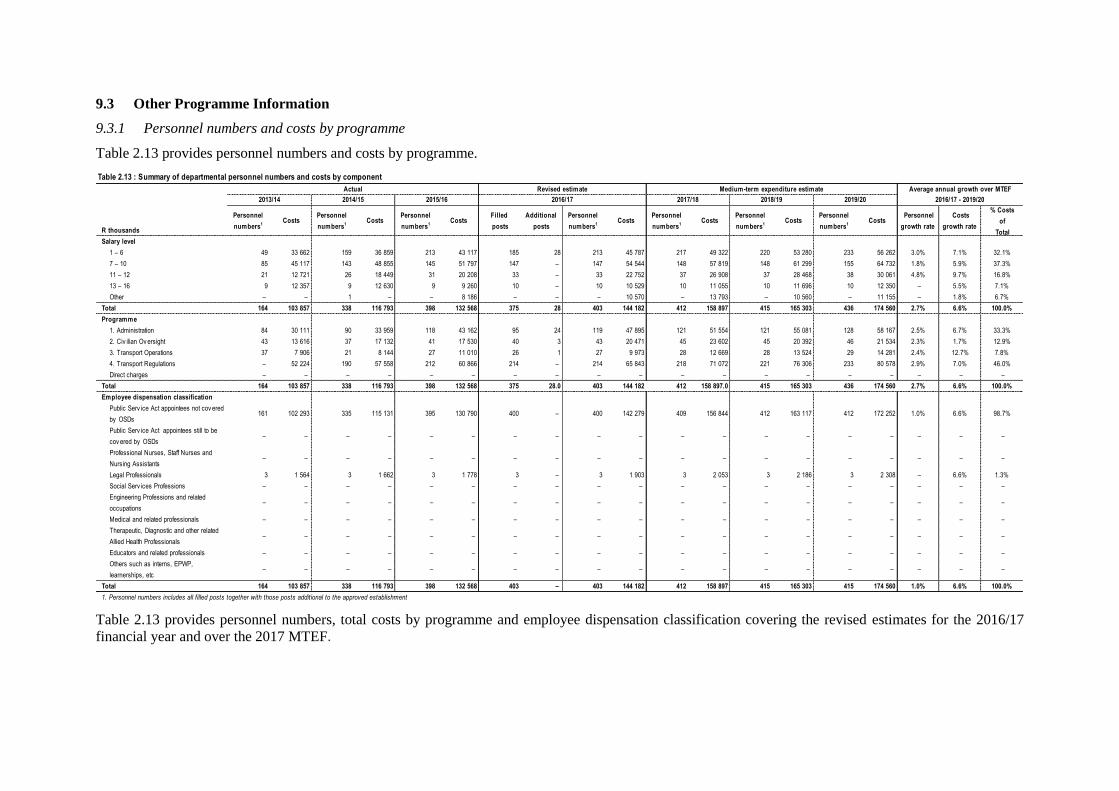
9.3 Other Programme Information
9.3.1 Personnel numbers and costs by programme
Table 2.13 provides personnel numbers and costs by programme.
Table 2.13 : Summary of departmental personnel numbers and costs by component
Actual Revised estimate Medium-term expenditure estimate
R thousands
Personnel
numbers1 Costs
Personnel
numbers1 Costs
Personnel
numbers1 Costs
Filled
posts
Additional
posts
Personnel
numbers1 Costs
Personnel
numbers1 Costs
Personnel
numbers1 Costs
Personnel
numbers1 Costs
Personnel
growth rate
Costs
growth rate
% Costs
of
Total
Salary level
1 – 6 49 33 662 159 36 859 213 43 117 185 28 213 45 787 217 49 322 220 53 280 233 56 262 3.0% 7.1% 32.1%
7 – 10 85 45 117 143 48 855 145 51 797 147 – 147 54 544 148 57 819 148 61 299 155 64 732 1.8% 5.9% 37.3%
11 – 12 21 12 721 26 18 449 31 20 208 33 – 33 22 752 37 26 908 37 28 468 38 30 061 4.8% 9.7% 16.8%
13 – 16 9 12 357 9 12 630 9 9 260 10 – 10 10 529 10 11 055 10 11 696 10 12 350 – 5.5% 7.1%
Other – – 1 – – 8 186 – – – 10 570 – 13 793 – 10 560 – 11 155 – 1.8% 6.7%
Total 164 103 857 338 116 793 398 132 568 375 28 403 144 182 412 158 897 415 165 303 436 174 560 2.7% 6.6% 100.0%
Programme
1. Administration 84 30 111 90 33 959 118 43 162 95 24 119 47 895 121 51 554 121 55 081 128 58 167 2.5% 6.7% 33.3%
2. Civ ilian Ov ersight 43 13 616 37 17 132 41 17 530 40 3 43 20 471 45 23 602 45 20 392 46 21 534 2.3% 1.7% 12.9%
3. Transport Operations 37 7 906 21 8 144 27 11 010 26 1 27 9 973 28 12 669 28 13 524 29 14 281 2.4% 12.7% 7.8%
4. Transport Regulations – 52 224 190 57 558 212 60 866 214 – 214 65 843 218 71 072 221 76 306 233 80 578 2.9% 7.0% 46.0%
Direct charges – – – – – – – – – – – – – – – – – – –
Total 164 103 857 338 116 793 398 132 568 375 28.0 403 144 182 412 158 897.0 415 165 303 436 174 560 2.7% 6.6% 100.0%
Employee dispensation classification
Public Serv ice Act appointees not cov ered
by OSDs161 102 293 335 115 131 395 130 790 400 – 400 142 279 409 156 844 412 163 117 412 172 252 1.0% 6.6% 98.7%
Public Serv ice Act appointees still to be
cov ered by OSDs – – – – – – – – – – – – – – – – – – –
Professional Nurses, Staff Nurses and
Nursing Assistants – – – – – – – – – – – – – – – – – – –
Legal Professionals 3 1 564 3 1 662 3 1 778 3 – 3 1 903 3 2 053 3 2 186 3 2 308 – 6.6% 1.3%
Social Serv ices Professions – – – – – – – – – – – – – – – – – – –
Engineering Professions and related
occupations – – – – – – – – – – – – – – – – – – –
Medical and related professionals – – – – – – – – – – – – – – – – – – –
Therapeutic, Diagnostic and other related
Allied Health Professionals – – – – – – – – – – – – – – – – – – –
Educators and related professionals – – – – – – – – – – – – – – – – – – –
Others such as interns, EPWP,
learnerships, etc – – – – – – – – – – – – – – – – – – –
Total 164 103 857 338 116 793 398 132 568 403 – 403 144 182 412 158 897 415 165 303 415 174 560 1.0% 6.6% 100.0%
1. Personnel numbers includes all filled posts together with those posts additional to the approved establishment
Average annual growth over MTEF
2013/14 2014/15 2015/16 2016/17 2017/18 2018/19 2019/20 2016/17 - 2019/20
Table 2.13 provides personnel numbers, total costs by programme and employee dispensation classification covering the revised estimates for the 2016/17
financial year and over the 2017 MTEF.

9.3.2 Training
Table 2.14 : Information on training: Transport, Safety And Liaison
OutcomeMain
appropriation
Adjusted
appropriation
Revised
estimateMedium-term estimates
R thousand 2013/14 2014/15 2015/16 2017/18 2018/19 2019/20
Number of staff 164 338 398 403 403 403 412 415 436
Number of personnel trained 104 130 114 164 164 164 172 181 191
of which
Male 43 68 47 87 87 87 91 96 101
Female 61 62 67 77 77 77 81 85 90
Number of training opportunities 51 21 64 46 46 46 48 51 54
of which
Tertiary – 20 – – – – – – –
Workshops 8 – 19 1 1 1 1 1 1
Seminars – 1 – – – – – – –
Other 43 – 45 45 45 45 47 50 53
Number of bursaries offered 41 59 47 49 49 49 51 54 57
Number of interns appointed – 9 – 20 20 20 20 20 20
Number of learnerships appointed 3 2 3 3 3 3 3 3 4
Number of day s spent on training – – – – – – – – –
Payments on training by programme
1. Administration 700 470 710 1 350 1 350 1 350 898 943 990
2. Civ ilian Ov ersight – 53 – – – – 82 86 91
3. Transport Operations 24 – – – – – 62 65 69
4. Transport Regulations 83 11 – – – – 500 525 554
Total payments on training 807 534 710 1 350 1 350 1 350 1 542 1 619 1 704
2016/17
Table above reflect the aggregate information on the number of persons trained, gender profile of per-
sons trained, number of bursaries awarded (both internally and externally) including interns, learner-
ships and the model of training. The table also depicts the departmental spending on training per pro-
gramme.
9.3.3 Reconciliation of structural changes
There are no changes on the structure of the department as from the 2016 MTEF.
Annexure
to Estimates of Provincial Revenue &
Expenditure
Vote3

Table B.1: Specification of receipts: Transport, Safety And Liaison
OutcomeMain
appropriation
Adjusted
appropriation
Revised
estimateMedium-term estimates
R thousand 2013/14 2014/15 2015/16 2017/18 2018/19 2019/20
Tax receipts 135 586 148 621 162 190 178 292 178 292 178 292 212 000 225 324 239 071
Casino tax es – – – – – – – – –
Horse racing tax es – – – – – – – – –
Liquor licences – – – – – – – – –
Motor v ehicle licences 135 586 148 621 162 190 178 292 178 292 178 292 212 000 225 324 239 071
Sales of goods and services other than capital assets 17 123 13 872 14 531 15 947 15 947 22 264 16 990 17 925 18 872
Sale of goods and serv ices produced by department (ex cluding capital assets) 17 123 13 872 14 531 15 947 15 947 22 264 16 990 17 925 18 872
Sales by market establishments – – – – – – – – –
Administrativ e fees 17 123 13 872 14 531 15 947 15 947 22 264 16 990 17 925 18 872
Other sales – – – – – – – – –
Of which
Health patient fees – – – – – – – – –
Other (Specify) – – – – – – – – –
Other (Specify) – – – – – – – – –
Other (Specify) – – – – – – – – –
Sales of scrap, w aste, arms and other used current goods (ex cluding capital assets) – – – – – – – – –
Transfers received from: – – – – – – – – –
Other gov ernmental units – – – – – – – – –
Higher education institutions – – – – – – – – –
Foreign gov ernments – – – – – – – – –
International organisations – – – – – – – – –
Public corporations and priv ate enterprises – – – – – – – – –
Households and non-profit institutions – – – – – – – – –
Fines, penalties and forfeits 2 664 2 123 2 213 2 223 2 223 2 223 2 358 2 490 2 590
Interest, dividends and rent on land – – – – – – – – –
Interest – – – – – – – – –
Div idends – – – – – – – – –
Rent on land – – – – – – – – –
Sales of capital assets – – 250 – – – – – –
Land and sub-soil assets – – – – – – – – –
Other capital assets – – 250 – – – – – –
Transactions in financial assets and liabilities 2 880 6 579 4 875 117 117 351 123 129 134
Total departmental receipts 158 253 171 195 184 059 196 579 196 579 203 130 231 471 245 868 260 667
2016/17

Table B.3: Payments and estimates by economic classification: Transport, Safety And Liaison
OutcomeMain
appropriation
Adjusted
appropriation
Revised
estimateMedium-term estimates
R thousand 2013/14 2014/15 2015/16 2017/18 2018/19 2019/20
Current payments 260 732 298 864 301 248 312 457 313 431 314 781 331 470 347 896 367 376
Compensation of employ ees 103 857 116 793 132 568 144 628 144 182 144 182 158 897 165 303 174 560
Salaries and w ages 89 671 101 519 114 302 129 366 128 920 125 252 140 018 145 189 153 317
Social contributions 14 186 15 274 18 266 15 262 15 262 18 930 18 879 20 115 21 243
Goods and serv ices 156 856 182 058 168 217 167 829 169 249 170 599 172 573 182 592 192 816
Administrative fees 677 1 079 979 731 841 1 109 961 979 1 035
Advertising 924 1 561 681 388 325 244 189 199 210
Minor assets 317 416 1 872 487 873 952 229 243 256
Audit cost: External 2 855 3 501 3 213 3 500 3 500 3 200 3 500 3 708 3 916
Bursaries: Employees 363 272 408 521 500 323 525 555 587
Catering: Departmental activities 1 611 2 588 609 575 719 1 060 719 799 844
Communication (G&S) 529 995 3 000 1 487 1 536 1 726 1 695 1 807 1 910
Computer services 1 349 1 745 5 107 4 113 3 913 4 077 4 802 5 084 5 368
Consultants and professional services: Business and advisory services 4 871 3 468 2 958 970 1 170 1 470 1 044 1 096 1 157
Infrastructure and planning -564 – – – – – – – –
Laboratory services – – – – – – – – –
Scientific and technological services – – – – – – – – –
Legal services 39 1 828 489 – – 150 – – –
Contractors 111 382 113 464 849 691 680 1 179 694 734 775
Agency and support / outsourced services 1 342 1 783 179 77 61 494 44 47 49
Entertainment 28 – – 20 – – – – –
Fleet services (including government motor transport) 53 1 149 5 098 5 334 5 546 5 913 6 398 6 685 7 059
Housing – – – – – – – – –
Inventory: Clothing material and accessories 52 – – – – – – – –
Inventory: Farming supplies – – – – – – – – –
Inventory: Food and food supplies 149 – – – – – – – –
Inventory: Fuel, oil and gas 495 – – – – – – – –
Inventory: Learner and teacher support material – – – – – – – – –
Inventory: Materials and supplies 260 – – – – – – – –
Inventory: Medical supplies 7 – – – – – – – –
Inventory: Medicine – – – – – – – – –
Medsas inventory interface – – – – – – – – –
Inventory: Other supplies 37 25 4 63 63 18 19 20 21
Consumable supplies 3 277 7 334 1 343 1 189 1 116 1 341 793 902 952
Consumable: Stationery,printing and office supplies 1 814 1 983 1 804 1 796 2 027 1 937 2 001 2 119 2 236
Operating leases 12 031 9 242 8 776 9 573 9 535 9 084 10 053 10 636 11 232
Property payments 1 415 1 568 2 997 1 582 1 582 1 319 1 325 1 412 1 490
Transport provided: Departmental activity 53 78 110 796 121 836 121 986 121 919 125 310 132 552 139 975
Travel and subsistence 7 651 23 694 11 000 9 843 10 160 10 118 9 669 10 248 10 824
Training and development 314 376 646 918 881 827 485 525 554
Operating payments 1 888 2 111 3 619 1 969 1 994 2 008 2 042 2 161 2 282
Venues and facilities 1 637 1 798 1 790 166 241 131 76 81 84
Rental and hiring – – – – – – – – –
Interest and rent on land 19 13 463 – – – – – –
Interest 19 13 463 – – – – – –
Rent on land – – – – – – – – –
Transfers and subsidies 46 705 75 832 46 136 50 714 54 189 54 189 53 718 56 243 59 393
Prov inces and municipalities – – – 17 17 17 18 19 21
Prov inces – – – – – – – – –
Prov incial Rev enue Funds – – – – – – – – –
Prov incial agencies and funds – – – – – – – – –
Municipalities – – – 17 17 17 18 19 21
Municipalities – – – 17 17 17 18 19 21
Municipal agencies and funds – – – – – – – – –
Departmental agencies and accounts – 2 3 – – – – – –
Social security funds – – – – – – – – –
Prov ide list of entities receiv ing transfers – 2 3 – – – – – –
Higher education institutions – – – – – – – – –
Foreign gov ernments and international organisations – – – – – – – – –
Public corporations and priv ate enterprises 44 397 73 177 43 346 48 231 51 260 51 260 51 121 53 507 56 503
Public corporations – 32 900 – – – – – – –
Subsidies on production – – – – – – – – –
Other transfers – 32 900 – – – – – – –
Priv ate enterprises 44 397 40 277 43 346 48 231 51 260 51 260 51 121 53 507 56 503
Subsidies on production 41 397 40 277 43 346 48 231 51 260 51 260 51 121 53 507 56 503
Other transfers 3 000 – – – – – – – –
Non-profit institutions 1 983 2 000 2 152 2 266 2 266 2 227 2 379 2 517 2 658
Households 325 653 635 200 646 685 200 200 211
Social benefits 221 458 448 – 446 485 – – –
Other transfers to households 104 195 187 200 200 200 200 200 211
Payments for capital assets 2 799 9 242 5 843 3 806 7 306 7 306 3 711 3 791 4 713
Buildings and other fix ed structures – – – – – – 650 700 739
Buildings – – – – – – 650 700 739
Other fix ed structures – – – – – – – – –
Machinery and equipment 2 799 9 242 5 733 3 806 7 198 7 169 3 061 3 091 3 974
Transport equipment – 5 326 – 1 200 750 750 750 793 1 545
Other machinery and equipment 2 799 3 916 5 733 2 606 6 448 6 419 2 311 2 298 2 429
Heritage Assets – – – – – – – – –
Specialised military assets – – – – – – – – –
Biological assets – – – – – – – – –
Land and sub-soil assets – – – – – – – – –
Softw are and other intangible assets – – 110 – 108 137 – – –
Payments for financial assets 65 37 – – – – – – –
Total economic classification 310 301 383 975 353 227 366 977 374 926 376 276 388 899 407 930 431 482
2016/17

Table B.3.1: Payments and estimates by economic classification: Administration
OutcomeMain
appropriation
Adjusted
appropriation
Revised
estimateMedium-term estimates
R thousand 2013/14 2014/15 2015/16 2017/18 2018/19 2019/20
Current payments 51 221 58 363 67 485 71 170 72 250 72 375 76 245 81 227 85 776
Compensation of employ ees 30 111 33 959 43 162 47 884 47 544 47 895 51 554 55 081 58 167
Salaries and w ages 27 447 29 732 37 980 44 355 44 015 42 445 46 124 49 308 52 069
Social contributions 2 664 4 227 5 182 3 529 3 529 5 450 5 430 5 773 6 098
Goods and serv ices 21 091 24 391 24 313 23 286 24 706 24 480 24 691 26 146 27 609
Administrative fees 216 377 345 216 316 466 484 512 541
Advertising 248 442 276 184 116 63 96 101 107
Minor assets 79 236 174 148 546 462 153 162 171
Audit cost: External 2 855 3 501 3 213 3 500 3 500 3 200 3 500 3 708 3 916
Bursaries: Employees 60 189 293 521 500 323 525 555 587
Catering: Departmental activities 248 114 129 71 211 266 227 240 254
Communication (G&S) 89 199 728 331 376 454 420 445 469
Computer services 410 772 1 556 2 984 2 984 3 153 3 832 4 058 4 285
Consultants and professional services: Business and advisory services 2 107 352 250 – – 157 – – –
Infrastructure and planning – – – – – – – – –
Laboratory services – – – – – – – – –
Scientific and technological services – – – – – – – – –
Legal services 39 1 647 411 – – – – – –
Contractors 102 457 187 1 1 118 2 2 2
Agency and support / outsourced services 757 1 020 90 55 39 49 41 44 46
Entertainment 15 – – 20 – – – – –
Fleet services (including government motor transport) 53 276 404 386 580 585 662 695 734
Housing – – – – – – – – –
Inventory: Clothing material and accessories 4 – – – – – – – –
Inventory: Farming supplies – – – – – – – – –
Inventory: Food and food supplies 36 – – – – – – – –
Inventory: Fuel, oil and gas 67 – – – – – – – –
Inventory: Learner and teacher support material – – – – – – – – –
Inventory: Materials and supplies 40 – – – – – – – –
Inventory: Medical supplies 6 – – – – – – – –
Inventory: Medicine – – – – – – – – –
Medsas inventory interface – – – – – – – – –
Inventory: Other supplies 18 – – – – – – – –
Consumable supplies 592 756 874 440 378 762 272 282 298
Consumable: Stationery,printing and office supplies 638 577 504 499 715 574 648 685 723
Operating leases 8 435 8 875 8 410 9 212 9 175 8 624 9 652 10 212 10 784
Property payments 992 1 215 1 397 343 343 421 360 381 402
Transport provided: Departmental activity – – – – 150 145 – – –
Travel and subsistence 2 554 2 812 3 927 3 140 3 450 3 383 3 023 3 211 3 391
Training and development 246 323 535 890 881 795 314 344 363
Operating payments 126 220 497 314 339 400 447 473 499
Venues and facilities 59 31 113 31 106 80 33 35 37
Rental and hiring – – – – – – – – –
Interest and rent on land 19 13 10 – – – – – –
Interest 19 13 10 – – – – – –
Rent on land – – – – – – – – –
Transfers and subsidies 173 225 250 200 540 540 200 200 211
Prov inces and municipalities – – – – – – – – –
Prov inces – – – – – – – – –
Prov incial Rev enue Funds – – – – – – – – –
Prov incial agencies and funds – – – – – – – – –
Municipalities – – – – – – – – –
Municipalities – – – – – – – – –
Municipal agencies and funds – – – – – – – – –
Departmental agencies and accounts – 1 3 – – – – – –
Social security funds – – – – – – – – –
Prov ide list of entities receiv ing transfers – 1 3 – – – – – –
Higher education institutions – – – – – – – – –
Foreign gov ernments and international organisations – – – – – – – – –
Public corporations and priv ate enterprises 7 – – – – – – – –
Public corporations – – – – – – – – –
Subsidies on production – – – – – – – – –
Other transfers – – – – – – – – –
Priv ate enterprises 7 – – – – – – – –
Subsidies on production 7 – – – – – – – –
Other transfers – – – – – – – – –
Non-profit institutions – – – – – – – – –
Households 166 224 247 200 540 540 200 200 211
Social benefits 62 29 60 – 340 340 – – –
Other transfers to households 104 195 187 200 200 200 200 200 211
Payments for capital assets 775 2 250 1 593 2 246 5 746 5 746 1 586 1 689 1 784
Buildings and other fix ed structures – – – – – – – – –
Buildings – – – – – – – – –
Other fix ed structures – – – – – – – – –
Machinery and equipment 775 2 250 1 494 2 246 5 638 5 615 1 586 1 689 1 784
Transport equipment – 1 155 – 1 200 – – – – –
Other machinery and equipment 775 1 095 1 494 1 046 5 638 5 615 1 586 1 689 1 784
Heritage Assets – – – – – – – – –
Specialised military assets – – – – – – – – –
Biological assets – – – – – – – – –
Land and sub-soil assets – – – – – – – – –
Softw are and other intangible assets – – 99 – 108 131 – – –
Payments for financial assets – 1 – – – – – – –
Total economic classification 52 169 60 839 69 328 73 616 78 536 78 661 78 031 83 116 87 771
2016/17

Table B.3.2: Payments and estimates by economic classification: Civilian Oversight
OutcomeMain
appropriation
Adjusted
appropriation
Revised
estimateMedium-term estimates
R thousand 2013/14 2014/15 2015/16 2017/18 2018/19 2019/20
Current payments 16 757 21 412 21 230 23 812 23 747 23 926 27 188 24 189 25 545
Compensation of employ ees 13 616 17 132 17 530 20 357 20 292 20 471 23 602 20 392 21 534
Salaries and w ages 11 196 15 061 15 326 17 649 17 584 18 137 20 642 17 256 18 222
Social contributions 2 420 2 071 2 204 2 708 2 708 2 334 2 960 3 137 3 312
Goods and serv ices 3 141 4 280 3 700 3 455 3 455 3 455 3 586 3 797 4 011
Administrative fees 87 91 103 131 141 109 107 114 121
Advertising 259 106 – 23 28 28 25 26 27
Minor assets 42 71 59 45 33 198 48 50 53
Audit cost: External – – – – – – – – –
Bursaries: Employees 56 11 94 – – – – – –
Catering: Departmental activities 427 440 102 443 447 412 347 367 388
Communication (G&S) 139 208 299 251 255 333 348 369 391
Computer services 9 13 877 – – – – – –
Consultants and professional services: Business and advisory services -437 – – – – 72 – – –
Infrastructure and planning – – – – – – – – –
Laboratory services – – – – – – – – –
Scientific and technological services – – – – – – – – –
Legal services – – – – – – – – –
Contractors 171 198 22 11 – 13 12 13 13
Agency and support / outsourced services 26 27 8 5 5 – – – –
Entertainment – – – – – – – – –
Fleet services (including government motor transport) – 417 605 644 662 525 688 728 769
Housing – – – – – – – – –
Inventory: Clothing material and accessories – – – – – – – – –
Inventory: Farming supplies – – – – – – – – –
Inventory: Food and food supplies 3 – – – – – – – –
Inventory: Fuel, oil and gas 286 – – – – – – – –
Inventory: Learner and teacher support material – – – – – – – – –
Inventory: Materials and supplies 174 – – – – – – – –
Inventory: Medical supplies – – – – – – – – –
Inventory: Medicine – – – – – – – – –
Medsas inventory interface – – – – – – – – –
Inventory: Other supplies – – – – – – – – –
Consumable supplies 33 685 29 82 71 121 71 75 79
Consumable: Stationery,printing and office supplies 189 123 98 161 176 128 135 144 153
Operating leases 399 25 122 124 123 158 162 172 182
Property payments 80 35 29 60 60 37 63 67 70
Transport provided: Departmental activity 6 21 8 – – 3 – – –
Travel and subsistence 489 1 214 1 150 1 273 1 280 1 231 1 346 1 424 1 504
Training and development – – – 28 – – 109 116 122
Operating payments 678 509 82 129 129 84 103 108 115
Venues and facilities 25 86 13 45 45 3 22 23 24
Rental and hiring – – – – – – – – –
Interest and rent on land – – – – – – – – –
Interest – – – – – – – – –
Rent on land – – – – – – – – –
Transfers and subsidies – 50 – – 65 65 – – –
Prov inces and municipalities – – – – – – – – –
Prov inces – – – – – – – – –
Prov incial Rev enue Funds – – – – – – – – –
Prov incial agencies and funds – – – – – – – – –
Municipalities – – – – – – – – –
Municipalities – – – – – – – – –
Municipal agencies and funds – – – – – – – – –
Departmental agencies and accounts – – – – – – – – –
Social security funds – – – – – – – – –
Prov ide list of entities receiv ing transfers – – – – – – – – –
Higher education institutions – – – – – – – – –
Foreign gov ernments and international organisations – – – – – – – – –
Public corporations and priv ate enterprises – – – – – – – – –
Public corporations – – – – – – – – –
Subsidies on production – – – – – – – – –
Other transfers – – – – – – – – –
Priv ate enterprises – – – – – – – – –
Subsidies on production – – – – – – – – –
Other transfers – – – – – – – – –
Non-profit institutions – – – – – – – – –
Households – 50 – – 65 65 – – –
Social benefits – 50 – – 65 65 – – –
Other transfers to households – – – – – – – – –
Payments for capital assets 845 632 821 811 311 311 953 320 339
Buildings and other fix ed structures – – – – – – 650 – –
Buildings – – – – – – 650 – –
Other fix ed structures – – – – – – – – –
Machinery and equipment 845 632 821 811 311 305 303 320 339
Transport equipment – – – – – – – – –
Other machinery and equipment 845 632 821 811 311 305 303 320 339
Heritage Assets – – – – – – – – –
Specialised military assets – – – – – – – – –
Biological assets – – – – – – – – –
Land and sub-soil assets – – – – – – – – –
Softw are and other intangible assets – – – – – 6 – – –
Payments for financial assets – 5 – – – – – – –
Total economic classification 17 602 22 099 22 051 24 623 24 123 24 302 28 141 24 509 25 884
2016/17

Table B.3.3: Payments and estimates by economic classification: Transport Operations
OutcomeMain
appropriation
Adjusted
appropriation
Revised
estimateMedium-term estimates
R thousand 2013/14 2014/15 2015/16 2017/18 2018/19 2019/20
Current payments 128 516 140 498 129 329 137 181 137 181 136 877 143 129 151 521 160 003
Compensation of employ ees 7 906 8 144 11 010 10 503 10 503 9 973 12 669 13 524 14 281
Salaries and w ages 7 212 7 134 9 612 9 363 9 363 8 638 10 849 11 577 12 225
Social contributions 694 1 010 1 398 1 140 1 140 1 335 1 820 1 947 2 056
Goods and serv ices 120 610 132 354 117 883 126 678 126 678 126 904 130 460 137 997 145 722
Administrative fees 176 136 222 159 159 176 128 135 142
Advertising 345 164 74 181 181 62 68 72 76
Minor assets 62 43 44 – – 164 – – –
Audit cost: External – – – – – – – – –
Bursaries: Employees 80 6 9 – – – – – –
Catering: Departmental activities 838 188 175 – – 320 120 127 134
Communication (G&S) 104 62 163 86 86 89 83 88 93
Computer services 52 151 875 – – – – – –
Consultants and professional services: Business and advisory services 3 201 2 666 985 970 970 969 1 044 1 096 1 157
Infrastructure and planning -564 – – – – – – – –
Laboratory services – – – – – – – – –
Scientific and technological services – – – – – – – – –
Legal services – 160 57 – – 150 – – –
Contractors 110 666 110 927 150 26 26 146 3 3 3
Agency and support / outsourced services 28 3 55 17 17 3 3 3 3
Entertainment 2 – – – – – – – –
Fleet services (including government motor transport) – 55 302 396 396 503 816 864 912
Housing – – – – – – – – –
Inventory: Clothing material and accessories 31 – – – – – – – –
Inventory: Farming supplies – – – – – – – – –
Inventory: Food and food supplies 32 – – – – – – – –
Inventory: Fuel, oil and gas 148 – – – – – – – –
Inventory: Learner and teacher support material – – – – – – – – –
Inventory: Materials and supplies 5 – – – – – – – –
Inventory: Medical supplies 1 – – – – – – – –
Inventory: Medicine – – – – – – – – –
Medsas inventory interface – – – – – – – – –
Inventory: Other supplies – – – – – – – – –
Consumable supplies 398 641 80 – – 35 – – –
Consumable: Stationery,printing and office supplies 110 194 282 40 40 175 133 140 147
Operating leases 457 31 27 23 23 58 24 25 26
Property payments – – – – – – – – –
Transport provided: Departmental activity – 32 110 599 121 836 121 836 121 768 125 310 132 552 139 975
Travel and subsistence 2 421 15 974 2 750 2 691 2 691 2 049 2 512 2 662 2 812
Training and development 62 12 9 – – 17 62 65 69
Operating payments 453 326 265 253 253 172 154 164 173
Venues and facilities 1 502 583 760 – – 48 – – –
Rental and hiring – – – – – – – – –
Interest and rent on land – – 436 – – – – – –
Interest – – 436 – – – – – –
Rent on land – – – – – – – – –
Transfers and subsidies 46 437 43 295 45 539 50 503 53 532 53 493 53 507 56 031 59 169
Prov inces and municipalities – – – 6 6 6 7 7 8
Prov inces – – – – – – – – –
Prov incial Rev enue Funds – – – – – – – – –
Prov incial agencies and funds – – – – – – – – –
Municipalities – – – 6 6 6 7 7 8
Municipalities – – – 6 6 6 7 7 8
Municipal agencies and funds – – – – – – – – –
Departmental agencies and accounts – – – – – – – – –
Social security funds – – – – – – – – –
Prov ide list of entities receiv ing transfers – – – – – – – – –
Higher education institutions – – – – – – – – –
Foreign gov ernments and international organisations – – – – – – – – –
Public corporations and priv ate enterprises 44 390 41 177 43 346 48 231 51 260 51 260 51 121 53 507 56 503
Public corporations – 900 – – – – – – –
Subsidies on production – – – – – – – – –
Other transfers – 900 – – – – – – –
Priv ate enterprises 44 390 40 277 43 346 48 231 51 260 51 260 51 121 53 507 56 503
Subsidies on production 41 390 40 277 43 346 48 231 51 260 51 260 51 121 53 507 56 503
Other transfers 3 000 – – – – – – – –
Non-profit institutions 1 983 2 000 2 152 2 266 2 266 2 227 2 379 2 517 2 658
Households 64 118 41 – – – – – –
Social benefits 64 118 41 – – – – – –
Other transfers to households – – – – – – – – –
Payments for capital assets 201 233 296 137 137 137 165 159 169
Buildings and other fix ed structures – – – – – – – – –
Buildings – – – – – – – – –
Other fix ed structures – – – – – – – – –
Machinery and equipment 201 233 285 137 137 137 165 159 169
Transport equipment – – – – – – – – –
Other machinery and equipment 201 233 285 137 137 137 165 159 169
Heritage Assets – – – – – – – – –
Specialised military assets – – – – – – – – –
Biological assets – – – – – – – – –
Land and sub-soil assets – – – – – – – – –
Softw are and other intangible assets – – 11 – – – – – –
Payments for financial assets – – – – – – – – –
Total economic classification 175 154 184 026 175 164 187 821 190 850 190 507 196 801 207 712 219 341
2016/17

Table B.3.4: Payments and estimates by economic classification: Transport Regulations
OutcomeMain
appropriation
Adjusted
appropriation
Revised
estimateMedium-term estimates
R thousand 2013/14 2014/15 2015/16 2017/18 2018/19 2019/20
Current payments 64 238 78 591 83 204 80 294 80 253 81 603 84 908 90 958 96 052
Compensation of employ ees 52 224 57 558 60 866 65 884 65 843 65 843 71 072 76 306 80 578
Salaries and w ages 43 816 49 592 51 384 57 999 57 958 56 032 62 403 67 048 70 801
Social contributions 8 408 7 966 9 482 7 885 7 885 9 811 8 669 9 258 9 777
Goods and serv ices 12 014 21 033 22 321 14 410 14 410 15 760 13 836 14 652 15 474
Administrative fees 198 475 309 225 225 358 242 218 231
Advertising 72 849 331 – – 91 – – –
Minor assets 134 66 1 595 294 294 128 28 30 32
Audit cost: External – – – – – – – – –
Bursaries: Employees 167 66 12 – – – – – –
Catering: Departmental activities 98 1 846 203 61 61 62 25 65 68
Communication (G&S) 197 526 1 810 819 819 850 844 906 957
Computer services 878 809 1 799 1 129 929 924 970 1 026 1 083
Consultants and professional services: Business and advisory services – 450 1 723 – 200 272 – – –
Infrastructure and planning – – – – – – – – –
Laboratory services – – – – – – – – –
Scientific and technological services – – – – – – – – –
Legal services – 21 21 – – – – – –
Contractors 443 1 882 490 653 653 902 677 717 757
Agency and support / outsourced services 531 733 26 – – 442 – – –
Entertainment 11 – – – – – – – –
Fleet services (including government motor transport) – 401 3 787 3 908 3 908 4 300 4 232 4 397 4 644
Housing – – – – – – – – –
Inventory: Clothing material and accessories 17 – – – – – – – –
Inventory: Farming supplies – – – – – – – – –
Inventory: Food and food supplies 78 – – – – – – – –
Inventory: Fuel, oil and gas -6 – – – – – – – –
Inventory: Learner and teacher support material – – – – – – – – –
Inventory: Materials and supplies 41 – – – – – – – –
Inventory: Medical supplies – – – – – – – – –
Inventory: Medicine – – – – – – – – –
Medsas inventory interface – – – – – – – – –
Inventory: Other supplies 19 25 4 63 63 18 19 20 21
Consumable supplies 2 254 5 252 360 667 667 423 450 545 575
Consumable: Stationery,printing and office supplies 877 1 089 920 1 096 1 096 1 060 1 085 1 149 1 213
Operating leases 2 740 311 217 214 214 244 215 227 240
Property payments 343 318 1 571 1 179 1 179 861 902 964 1 018
Transport provided: Departmental activity 47 25 189 – – 3 – – –
Travel and subsistence 2 187 3 694 3 173 2 739 2 739 3 455 2 788 2 951 3 117
Training and development 6 41 102 – – 15 – – –
Operating payments 631 1 056 2 775 1 273 1 273 1 352 1 338 1 415 1 495
Venues and facilities 51 1 098 904 90 90 – 21 22 23
Rental and hiring – – – – – – – – –
Interest and rent on land – – 17 – – – – – –
Interest – – 17 – – – – – –
Rent on land – – – – – – – – –
Transfers and subsidies 95 32 262 347 11 52 91 11 12 13
Prov inces and municipalities – – – 11 11 11 11 12 13
Prov inces – – – – – – – – –
Prov incial Rev enue Funds – – – – – – – – –
Prov incial agencies and funds – – – – – – – – –
Municipalities – – – 11 11 11 11 12 13
Municipalities – – – 11 11 11 11 12 13
Municipal agencies and funds – – – – – – – – –
Departmental agencies and accounts – 1 – – – – – – –
Social security funds – – – – – – – – –
Prov ide list of entities receiv ing transfers – 1 – – – – – – –
Higher education institutions – – – – – – – – –
Foreign gov ernments and international organisations – – – – – – – – –
Public corporations and priv ate enterprises – 32 000 – – – – – – –
Public corporations – 32 000 – – – – – – –
Subsidies on production – – – – – – – – –
Other transfers – 32 000 – – – – – – –
Priv ate enterprises – – – – – – – – –
Subsidies on production – – – – – – – – –
Other transfers – – – – – – – – –
Non-profit institutions – – – – – – – – –
Households 95 261 347 – 41 80 – – –
Social benefits 95 261 347 – 41 80 – – –
Other transfers to households – – – – – – – – –
Payments for capital assets 978 6 127 3 133 612 1 112 1 112 1 007 1 622 2 421
Buildings and other fix ed structures – – – – – – – 700 739
Buildings – – – – – – – 700 739
Other fix ed structures – – – – – – – – –
Machinery and equipment 978 6 127 3 133 612 1 112 1 112 1 007 922 1 682
Transport equipment – 4 171 – – 750 750 750 793 1 545
Other machinery and equipment 978 1 956 3 133 612 362 362 257 129 137
Heritage Assets – – – – – – – – –
Specialised military assets – – – – – – – – –
Biological assets – – – – – – – – –
Land and sub-soil assets – – – – – – – – –
Softw are and other intangible assets – – – – – – – – –
Payments for financial assets 65 31 – – – – – – –
Total economic classification 65 376 117 011 86 684 80 917 81 417 82 806 85 926 92 592 98 486
2016/17

Table B.4.1: Payments and estimates by economic classification: EPWP( Civilian Oversight)
OutcomeMain
appropriation
Adjusted
appropriation
Revised
estimateMedium-term estimates
R thousand 2013/14 2014/15 2015/16 2017/18 2018/19 2019/20
Current payments 196 2 645 921 2 914 2 914 2 914 4 510 – –
Compensation of employ ees 196 2 645 921 2 914 2 914 2 914 4 510 – –
Salaries and w ages 196 2 645 921 2 914 2 914 2 914 4 510
Social contributions
Goods and serv ices – – – – – – – – –
Administrative fees – – – – – – – – –
Advertising – – – – – – – – –
Minor assets – – – – – – – – –
Audit cost: External – – – – – – – – –
Bursaries: Employees – – – – – – – – –
Catering: Departmental activities – – – – – – – – –
Communication (G&S) – – – – – – – – –
Computer services – – – – – – – – –
Consultants and professional services: Business and advisory services – – – – – – – – –
Infrastructure and planning – – – – – – – – –
Laboratory services – – – – – – – – –
Scientific and technological services – – – – – – – – –
Legal services – – – – – – – – –
Contractors – – – – – – – – –
Agency and support / outsourced services – – – – – – – – –
Entertainment – – – – – – – – –
Fleet services (including government motor transport) – – – – – – – – –
Housing – – – – – – – – –
Inventory: Clothing material and accessories – – – – – – – – –
Inventory: Farming supplies – – – – – – – – –
Inventory: Food and food supplies – – – – – – – – –
Inventory: Fuel, oil and gas – – – – – – – – –
Inventory: Learner and teacher support material – – – – – – – – –
Inventory: Materials and supplies – – – – – – – – –
Inventory: Medical supplies – – – – – – – – –
Inventory: Medicine – – – – – – – – –
Medsas inventory interface – – – – – – – – –
Inventory: Other supplies – – – – – – – – –
Consumable supplies – – – – – – – – –
Consumable: Stationery,printing and office supplies – – – – – – – – –
Operating leases – – – – – – – – –
Property payments – – – – – – – – –
Transport provided: Departmental activity – – – – – – – – –
Travel and subsistence – – – – – – – – –
Training and development – – – – – – – – –
Operating payments – – – – – – – – –
Venues and facilities – – – – – – – – –
Rental and hiring – – – – – – – – –
Interest and rent on land – – – – – – – – –
Interest – – – – – – – –
Rent on land – – – – – – – – –
Transfers and subsidies – – – – – – – – –
Prov inces and municipalities – – – – – – – – –
Prov inces – – – – – – – – –
Prov incial Rev enue Funds – – – – – – – – –
Prov incial agencies and funds – – – – – – – – –
Municipalities – – – – – – – – –
Municipalities – – –
Municipal agencies and funds – – – – – – – – –
Departmental agencies and accounts – – – – – – – – –
Social security funds – – – – – – – – –
Prov ide list of entities receiv ing transfers – – – – – – – –
Higher education institutions – – – – – – – – –
Foreign gov ernments and international organisations – – – – – – – – –
Public corporations and priv ate enterprises – – – – – – – – –
Public corporations – – – – – – – – –
Subsidies on production – – – – – – – – –
Other transfers – – – – – – – –
Priv ate enterprises – – – – – – – – –
Subsidies on production – – – – – – – – –
Other transfers – – – – – – – – –
Non-profit institutions – – – – – – – – –
Households – – – – – – – – –
Social benefits – – – –
Other transfers to households – – – – – – – – –
Payments for capital assets – – – – – – – – –
Buildings and other fix ed structures – – – – – – – – –
Buildings – – – – – – –
Other fix ed structures – – – – – – – – –
Machinery and equipment – – – – – – – – –
Transport equipment
Other machinery and equipment
Heritage Assets – – – – – – – – –
Specialised military assets – – – – – – – – –
Biological assets – – – – – – – – –
Land and sub-soil assets – – – – – – – – –
Softw are and other intangible assets – – – – – – – – –
Payments for financial assets – – – – – – –
Total economic classification 196 2 645 921 2 914 2 914 2 914 4 510 – –
2016/17

Table B.4.2: Payments and estimates by economic classification: Public Transport Operations Grant( Transport operations)
OutcomeMain
appropriation
Adjusted
appropriation
Revised
estimateMedium-term estimates
R thousand 2013/14 2014/15 2015/16 2017/18 2018/19 2019/20
Current payments – – – – – – – – –
Compensation of employ ees – – – – – – – – –
Salaries and w ages
Social contributions
Goods and serv ices – – – – – – – – –
Administrative fees – – – – – – – – –
Advertising – – – – – – – – –
Minor assets – – – – – – – – –
Audit cost: External – – – – – – – – –
Bursaries: Employees – – – – – – – – –
Catering: Departmental activities – – – – – – – – –
Communication (G&S) – – – – – – – – –
Computer services – – – – – – – – –
Consultants and professional services: Business and advisory services – – – – – – – – –
Infrastructure and planning – – – – – – – – –
Laboratory services – – – – – – – – –
Scientific and technological services – – – – – – – – –
Legal services – – – – – – – – –
Contractors – – – – – – – – –
Agency and support / outsourced services – – – – – – – – –
Entertainment – – – – – – – – –
Fleet services (including government motor transport) – – – – – – – – –
Housing – – – – – – – – –
Inventory: Clothing material and accessories – – – – – – – – –
Inventory: Farming supplies – – – – – – – – –
Inventory: Food and food supplies – – – – – – – – –
Inventory: Fuel, oil and gas – – – – – – – – –
Inventory: Learner and teacher support material – – – – – – – – –
Inventory: Materials and supplies – – – – – – – – –
Inventory: Medical supplies – – – – – – – – –
Inventory: Medicine – – – – – – – – –
Medsas inventory interface – – – – – – – – –
Inventory: Other supplies – – – – – – – – –
Consumable supplies – – – – – – – – –
Consumable: Stationery,printing and office supplies – – – – – – – – –
Operating leases – – – – – – – – –
Property payments – – – – – – – – –
Transport provided: Departmental activity – – – – – – – – –
Travel and subsistence – – – – – – – – –
Training and development – – – – – – – – –
Operating payments – – – – – – – – –
Venues and facilities – – – – – – – – –
Rental and hiring – – – – – – – – –
Interest and rent on land – – – – – – – – –
Interest – – – – – – – –
Rent on land – – – – – – – – –
Transfers and subsidies 41 327 40 272 43 346 49 096 52 125 52 125 52 029 54 460 57 510
Prov inces and municipalities – – – – – – – – –
Prov inces – – – – – – – – –
Prov incial Rev enue Funds – – – – – – – – –
Prov incial agencies and funds – – – – – – – – –
Municipalities – – – – – – – – –
Municipalities – – –
Municipal agencies and funds – – – – – – – – –
Departmental agencies and accounts – – – – – – – – –
Social security funds – – – – – – – – –
Prov ide list of entities receiv ing transfers – – – – – – – –
Higher education institutions – – – – – – – – –
Foreign gov ernments and international organisations – – – – – – – – –
Public corporations and priv ate enterprises 41 327 40 272 43 346 49 096 52 125 52 125 52 029 54 460 57 510
Public corporations 41 327 40 272 43 346 49 096 52 125 52 125 52 029 54 460 57 510
Subsidies on production 41 327 40 272 43 346 49 096 52 125 52 125 52 029 54 460 57 510
Other transfers – – – – – – – –
Priv ate enterprises – – – – – – – – –
Subsidies on production – – – – – – – – –
Other transfers – – – – – – – – –
Non-profit institutions – – – – – – – – –
Households – – – – – – – – –
Social benefits – – – –
Other transfers to households – – – – – – – – –
Payments for capital assets – – – – – – – – –
Buildings and other fix ed structures – – – – – – – – –
Buildings – – – – – – –
Other fix ed structures – – – – – – – – –
Machinery and equipment – – – – – – – – –
Transport equipment
Other machinery and equipment
Heritage Assets – – – – – – – – –
Specialised military assets – – – – – – – – –
Biological assets – – – – – – – – –
Land and sub-soil assets – – – – – – – – –
Softw are and other intangible assets – – – – – – – – –
Payments for financial assets – – – – – – –
Total economic classification 41 327 40 272 43 346 49 096 52 125 52 125 52 029 54 460 57 510
2016/17

Table B.5: Transport, Safety And Liaison - Payments of infrastructure by category
No. Type of infrastructure Project duration Total available MTEF
Forward estimates
R thousands
Date: Start Date: Finish 2017/18 MTEF
2018/19
MTEF
2019/20
2. Upgrades and additions
1 Rennov ation Springbok Officce Tender Namakw a Office Buildings 01/042017 30/062017 Equatable Share Civ ilian Ov ersight – 700 – 650 – –
2 Rennov ation of Traffic Stations Concept Various Office Buildings 01/042018 30/062019 Equatable Share Transport Regulations – 1 511 – – 700 739
Total Upgrades and additions – 2 211 – 650 700 739
4. Maintenance and repairs
1 Maintenance and Repair 0 Various Office Buildings 01/042017 00/011900 Equatable Share Transport Regulations – 1 261 – 400 420 441
Total Maintenance and repairs – 1 261 – 400 420 441
Total Transport, Safety And Liaison Infrastructure – 3 472 – 1 050 1 120 1 180
Expenditure to
date from
previous years
Project name Project
Status
Source
of
funding
Budget
programme
name
Total project
cost
Municipality /
Region
Delivery
Mechnism
(Individual
project or
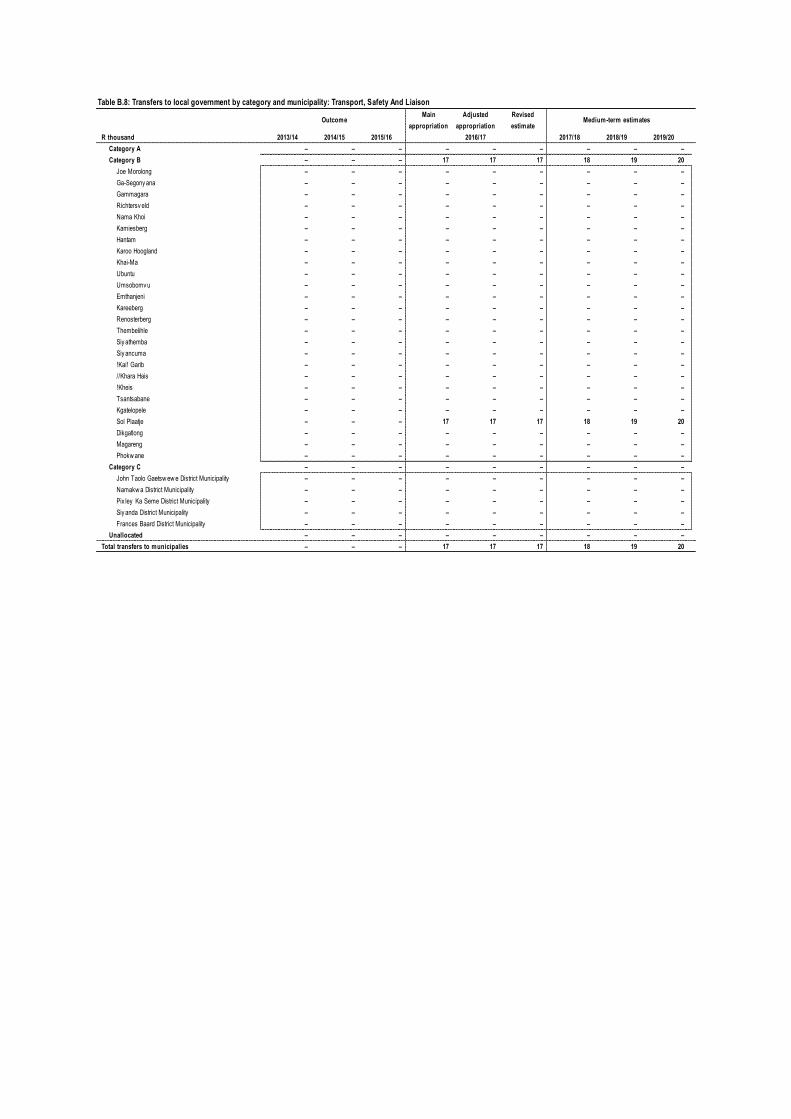
Table B.8: Transfers to local government by category and municipality: Transport, Safety And Liaison
OutcomeMain
appropriation
Adjusted
appropriation
Revised
estimateMedium-term estimates
R thousand 2013/14 2014/15 2015/16 2017/18 2018/19 2019/20
Category A – – – – – – – – –
Category B – – – 17 17 17 18 19 20
Joe Morolong – – – – – – – – –
Ga-Segony ana – – – – – – – – –
Gammagara – – – – – – – – –
Richtersv eld – – – – – – – – –
Nama Khoi – – – – – – – – –
Kamiesberg – – – – – – – – –
Hantam – – – – – – – – –
Karoo Hoogland – – – – – – – – –
Khai-Ma – – – – – – – – –
Ubuntu – – – – – – – – –
Umsobomv u – – – – – – – – –
Emthanjeni – – – – – – – – –
Kareeberg – – – – – – – – –
Renosterberg – – – – – – – – –
Thembelihle – – – – – – – – –
Siy athemba – – – – – – – – –
Siy ancuma – – – – – – – – –
!Kai! Garib – – – – – – – – –
//Khara Hais – – – – – – – – –
!Kheis – – – – – – – – –
Tsantsabane – – – – – – – – –
Kgatelopele – – – – – – – – –
Sol Plaatje – – – 17 17 17 18 19 20
Dikgatlong – – – – – – – – –
Magareng – – – – – – – – –
Phokw ane – – – – – – – – –
Category C – – – – – – – – –
John Taolo Gaetsw ew e District Municipality – – – – – – – – –
Namakw a District Municipality – – – – – – – – –
Pix ley Ka Seme District Municipality – – – – – – – – –
Siy anda District Municipality – – – – – – – – –
Frances Baard District Municipality – – – – – – – – –
Unallocated – – – – – – – – –
Total transfers to municipalies – – – 17 17 17 18 19 20
2016/17