vote 1 the presidency - treasury
TRANSCRIPT

N a t i o n a l T r e a s u r y
estimates of national expenditure
vote 1 The Presidency
National TreasuryDepartment:
REPUBLIC OF SOUTH AFRICA
national treasury
Final Budget 2012 Votes Covers_Print.indd 1 2012/02/20 9:07 AM

Estim
ates o
f Natio
na
l expen
ditu
re

Estimates of
National Expenditure
2012
National Treasury
Republic of South Africa
22 February 2012

ISBN: 978-0-621-40578-1
RP: 01/2012
The Estimates of National Expenditure 2012 e-publications are compiled with the latest available information from departmental and other sources. Some of this information is unaudited or subject to revision. The Estimates of National Expenditure e-publications for individual votes are available on www.treasury.gov.za. Compared to the abridged version of the Estimates of National Expenditure, these publications contain more comprehensive coverage of goods and services, transfers and subsidies, and public entities. Additional tables are included containing information on the main and adjusted appropriation, with revised spending estimates for the current financial year, on skills training, conditional grants to provinces and municipalities, public private partnerships and information on donor funding. Expenditure information at the level of service delivery is also included, where appropriate.

Foreword The current global economic context is characterised by high levels of uncertainty. Against this backdrop, South Africa’s development depends largely on government improving its level and quality of service delivery in support of the inclusive and equitable economic roadmap, as contained in the new growth path. The 2012 Budget is an important tool of government for giving effect to these objectives, and this Budget allocates resources to specific interventions that will be actioned over the period of the medium term expenditure framework (MTEF). Growth in spending focuses particularly on infrastructure development, job creation, enterprise support and the enhancement of local government delivery.
South Africa’s fiscal stance and public spending programmes are focused on long term structural transformation. Over the next three years of the MTEF period, government priorities will continue to be realised within a sustainable fiscal trajectory, which balances current needs with intergenerational equity. In line with this, spending baselines have undergone rigorous review, areas of inefficiency and lower priority have been identified, and funds have been redirected towards government’s key priorities, both new and existing. This has been done in recognition of the relationship between the composition of spending and fiscal sustainability over the long term. Here, the balance between consumption and investment is extremely important. Even the distribution of consumption spending between wages, goods and services and transfers is significant, as is the balance between the functional categories expenditure (such as education, health and economic services). Underspending on key priorities undermines the aims of the spending proposed within MTEF Budgets.
Since introducing the functional approach to budget decision-making in 2009, transparency and coordination in budgeting has been enhanced, largely due to the participation by the stakeholders responsible for delivery across all spheres of government. South African budget reforms, especially the intensified focus on budget trade-offs and the composition of expenditure, will lead to greater accountability and improved control.
It is not enough to demonstrate a change in the composition of budgeted expenditure; nor is it enough to pinpoint the specific actions required and proposed within the Budget. Success will only be achieved when we can demonstrate that a shift in the composition of actual expenditure has taken place, together with the achievement of improved delivery targets.
This year, the layout of this publication has been altered substantially. The focus is on linking more closely expenditure planned with targeted performance. Specific focus is on the outcomes to which institutions contribute and the output and other performance measures supporting them. The sections covering employee numbers, personnel budgets and the purpose and key activities of each subprogramme within a vote are now more prominent, giving expression to the budget and service delivery. This publication still indicates details per vote of the allocation of new monies, monies reprioritised between or within budget programmes, and Cabinet approved budget reductions over the period ahead. Compared to the abridged version of the Estimates of National Expenditure, the e-publications for each vote contain more comprehensive coverage of goods and services, transfers and subsidies, and public entities. Additional tables are included, containing information on: the main and adjusted appropriation, with revised spending estimates for the current financial year; skills training; conditional grants to provinces and municipalities; public private partnerships; and donor funding. Expenditure information at the level of service delivery is also included, where appropriate.
The expenditure estimates of departments are the outcome of a rigorous administrative and executive process. Treasury budget analysts, under the guidance of the Ministers’ Committee on the Budget, follow a wide-ranging intergovernmental consultative process, working closely with the policy and budget teams of departments and entities to ensure that government priorities are appropriately funded within the available resource envelope. The Treasury is grateful for the contribution of these teams. Appreciation is also due to the people in the Treasury team, who worked with great diligence to produce a high quality document that provides a comprehensive account of government’s spending and performance plans.
Lungisa Fuzile Director General: National Treasury


Introduction The Estimates of National Expenditure publications The Estimates of National Expenditure publications are important accountability documents, which set out the details in relation to planned expenditure and planned performance at the time of the tabling of the Budget. Estimates of National Expenditure publications continue to make a significant contribution to the changes relating to budgeting by programme. As part of these ongoing efforts, several changes have been made to the 2012 Estimates of National Expenditure publications. Departments still provide information on the key objectives of each subprogramme within a programme, and note the activities carried out, the number of personnel responsible for undertaking these activities and the funding allocations supporting this. This year in the 2012 publications, information on expenditure and performance is more closely linked under the ’expenditure trends’ section, with a brief discussion on the impact of budget allocations on the achievement of outputs over the seven-year period. In addition, an explanation of the personnel trends, per programme by salary level, over the seven years in relation to compensation of employees has also been included. Finally, information on Cabinet approved cost reduction measures and other budget reprioritisation has been included per programme.
The 2012 abridged Estimates of National Expenditure publication, and the separate Estimates of National Expenditure e-publications for each vote are the product of an extensive consultative review process of budgets and policy, and policy implementation by programme, and include the latest improvements in non-financial performance information. These publications provide the details of the spending estimates for the next three financial years (2012/13 to 2014/15), expenditure outcomes for the past three years (2008/09 to 2010/11) and revised estimates for the current financial year (2011/12). Information is provided on performance targets over the seven year period as well as changes in these, as they relate to trends in planned expenditure.
The e-publications for individual votes contain more comprehensive coverage of goods and services, transfers and subsidies, and public entities. Additional tables are included containing information on: the main and adjusted appropriation, with revised spending estimates for the current financial year; skills training; conditional grants to provinces and municipalities; public private partnerships; and donor funding. Expenditure information at the level of service delivery is also included, where appropriate.
A consolidated account, summarising the Estimates of National Expenditure publication information across votes, is provided in the form of a narrative and summary tables in the Introduction chapter, which is included in the front pages of the abridged version of the Estimates of National Expenditure. A write-up containing the explanation of the information that is contained in each section of the publications has also been included in the abridged version of the Estimates of National Expenditure. Like the separate Estimates of National Expenditure e-publications for each vote, the abridged Estimates of National Expenditure publication is also available on www.treasury.gov.za.


The Presidency
National Treasury Republic of South Africa

Contents
Budget summary ................................................................................................... 1
Aim ....................................................................................................................... 1
Programme purposes ........................................................................................... 1
Strategic overview: 2008/09 – 2014/15 ................................................................ 2
Selected performance indicators......................................................................... 3
Expenditure estimates .......................................................................................... 3
Personnel information .......................................................................................... 5
Departmental receipts .......................................................................................... 6
Programme 1: Administration .............................................................................. 6
Programme 2: National Planning ......................................................................... 8
Programme 3: National Youth Development Agency ....................................... 10
Programme 4: International Marketing and Communication ........................... 11
Public entities and other agencies ..................................................................... 11
Additional tables .................................................................................................. 20

1
Vote 1 The Presidency Budget summary
2012/13 2013/14 2014/15 R thousand
Total to be appropriated
Current payments
Transfers and subsidies
Payments for capital assets Total Total
MTEF allocation Administration 397 667 382 477 – 15 190 425 332 451 008National Planning 95 575 95 575 – – 89 537 94 909National Youth Development Agency 376 010 – 376 010 – 396 677 419 630International Marketing and Communication 148 779 – 148 779 – 156 962 166 380
Subtotal 1 018 031 478 052 524 789 15 190 1 068 508 1 131 927 Direct charge against the National Revenue Fund Salary of the President 2 658 2 658 – – 2 804 2 972
Total expenditure estimates 1 020 689 480 710 524 789 15 190 1 071 312 1 134 899 Executive authority Minister in the Presidency: Performance Monitoring and Evaluation as well as Administration Accounting officer Chief Operations Officer in the Presidency Website address www.thepresidency.gov.za
Aim Facilitate a common programme towards the achievement of the electoral mandate and the enhanced integrity of the State through considered planning, coordination, oversight, mobilisation and support.
Programme purposes Programme 1: Administration Purpose: Provide effective leadership, strategic management and administrative support services to the principals and the branches of the Presidency in fulfilment of the Presidency’s mission and mandate.
Programme 2: National Planning Purpose: Develop the country’s long term vision and national strategic plan and contribute towards better outcomes in government through better planning, better long term plans, more policy coherence and clear articulation of long term goals and aspirations.
Programme 3: National Youth Development Agency Purpose: Facilitate the transfer of funds to the National Youth Development Agency in order that the agency may initiate, implement, facilitate and monitor youth development interventions aimed at reducing youth unemployment and promoting social cohesion.
Programme 4: International Marketing and Communication Purpose: Facilitate the transfer of funds to Brand South Africa to develop and implement an international marketing and communication strategy for South Africa to contribute to job creation and poverty reduction, and attract inward investment, trade and tourism.
2012 Estimates of National Expenditure
2
Strategic overview: 2008/09 – 2014/15 The Presidency exists to service the president and the deputy president in the execution of their constitutional responsibilities and duties, as articulated in Chapter 5 of the Constitution. The Presidency’s strategic approach is premised on the functions of the president and the national executive. The strategic approach is also informed by the electoral mandate and programmes of the governing party. The role of the Presidency is to support the president and the deputy president in leading and galvanising the whole of government and society to implement the electoral programme; to serve as a centre for strategic coordination in government in implementing the programme to ensure that all energies and efforts are properly aligned; and to ensure that the programme is implemented and evaluate whether it is achieving its intended objectives.
Priorities over the medium term Monitoring the performance of government in priority areas The Presidency has prioritised intensifying the monitoring the performance of government to ensure that service delivery to citizens is improved. There will be increased engagement with ministers who coordinate the key outcomes and regular visits to provinces, municipalities and communities to monitor whether government is serving citizens the way it should.
Increased engagement in the international arena Also among the key priorities over the medium term is increasing South Africa’s leadership and engagement in the Southern African Development Community (SADC) region, the African continent, and in international bodies such as the G20, the United Nations (UN) Framework Convention on Climate Change and the Brazil-Russia-India-China-South Africa forum.
Work of the Presidential Infrastructure Coordination Commission At its lekgotla in July 2011, Cabinet decided to establish the Presidential Infrastructure Coordination Commission to spearhead and coordinate government’s infrastructure development programme. The commission is led by the president and its membership includes ministers, premiers and mayors of metropolitan municipalities. In the short to medium term, the Presidency will provide the necessary support to the president and deputy president to ensure that this critical priority receives the appropriate attention.
Vision 2030 and the national development plan The Presidency released the draft Vision 2030 and national development plan on 11 November 2011. The plan makes proposals on how to turn the identified challenges that combat South Africa in eliminating poverty and reducing inequality into effective solutions by examining global trends and government policy in greater detail. The national vision and long term development plan will result in a more effective state machinery that will be able to drive the implementation of key polices and facilitate the overall alignment of all government programmes in all spheres towards the successful delivery of the electoral mandate.
Over the medium term, the Presidency will prioritise the coordination and facilitation of far reaching public consultation and participation activities on Vision 2030 and the national development plan with a broad stakeholder base to intensely interrogate the plan with government. This will contribute to the refinement and enhancement of the draft long term vision and national development plan for South Africa. It is planned that the final outputs of this exercise will be tabled for Cabinet’s consideration and approval in the first year of the medium term.
Public Entities’ oversight In 2011, Cabinet decided to relocate Brand South Africa, formerly known as the International Marketing Council, from the Government Communication and Information System to the Presidency, and also shift the function of the presidential hotline from the Presidency to the Department of Performance Monitoring and Evaluation. Under this arrangement, the Presidency will provide an oversight role to Brand South Africa and the National Youth Development Agency.

Vote 1: The Presidency
3
Selected performance indicators Table 1.1 The Presidency Indicator Programme Past Current Projections
2008/09 2009/10 2010/11 2011/12 2012/13 2013/14 2014/15Vision 2030 and national development plan completed1,2
National Planning
– – – Diagnostic review initiated and conducted to inform the development of draft Vision 2030 and the national development plan
Draft Vision 2030 and national development plan released for public and stakeholder consultation. Vision 2030 and national development plan refined and approved by Cabinet
– –
Number of sector research reports with major and cross-cutting macro-social implications, developed per year1
National Planning
– – – – 6 research reports on employment, child poverty, climate change, food security, energy security and water security initiated
6 research reports on employment, child poverty, climate change, food security, energy security and water security finalised
5 policy research reports on predetermined sectors, selected from the thematic areas /sectors in the Green Paper on National Strategic Planning (education, health, long term defence capability, transport infrastructure, and spatial planning
Number of households surveyed on income, consumption and expenditure in the national income dynamics study3
National Planning
7 305 – 9 600 – 10 500 – –
1. New indicators introduced in 2011/12 and 2012/13, so reporting begins in these two years. 2. Targets for 2013/14 onwards will involve conducting a number of research reports, with major and cross-cutting macro-social implications, developed along the second
indicator to enhance the vision and national plan. 3. The national income dynamics survey is conducted every two years.
Expenditure estimates Table 1.2 The Presidency Programme
Audited outcome Adjusted
appropriation Revised estimate Medium-term expenditure estimate
R thousand 2008/09 2009/10 2010/11 2011/12 2012/13 2013/14 2014/15 Administration 257 495 286 926 340 124 394 763 399 763 397 667 425 332 451 008National Planning 21 887 40 288 49 446 85 102 80 102 95 575 89 537 94 909National Youth Development Agency 29 413 328 925 398 973 385 853 385 853 376 010 396 677 419 630International Marketing and Communication
139 722 161 381 170 113 140 089 140 089 148 779 156 962 166 380
Subtotal 448 517 817 520 958 656 1 005 807 1 005 807 1 018 031 1 068 508 1 131 927Direct charge against the National Revenue Fund
3 999 3 830 3 950 3 837 3 837 2 658 2 804 2 972
Salary of the President 2 107 2 100 2 107 2 531 2 531 2 658 2 804 2 972Salary of the Deputy President 1 892 1 730 1 843 1 306 1 306 – – –Total 452 516 821 350 962 606 1 009 644 1 009 644 1 020 689 1 071 312 1 134 899Change to 2011 Budget estimate 49 762 49 762 (20 624) (15 134) (16 734)

2012 Estimates of National Expenditure
4
Table 1.2 The Presidency (continued)
Audited outcome Adjusted
appropriation Revised estimate Medium-term expenditure estimate
R thousand 2008/09 2009/10 2010/11 2011/12 2012/13 2013/14 2014/15 Economic classification Current payments 270 364 318 551 381 221 474 873 474 873 480 710 501 725 531 983Compensation of employees 141 708 179 169 210 191 264 689 264 689 271 405 275 999 293 116Goods and services 128 656 139 382 171 030 210 184 210 184 209 305 225 726 238 867of which: Administrative fees 94 148 2 145 145 147 153 178Advertising 1 380 1 498 1 161 1 534 1 534 2 082 2 245 2 381Assets less than the capitalisation threshold
3 992 2 375 988 3 555 3 555 3 766 4 486 4 762
Audit cost: External 1 616 2 169 3 745 6 989 6 989 7 672 8 021 9 026Bursaries: Employees 1 182 819 456 2 364 2 364 2 544 2 974 3 188Catering: Departmental activities 3 259 2 810 2 302 3 342 3 342 3 492 5 181 5 500Communication 11 896 13 427 19 121 7 005 7 005 15 449 18 367 18 894Computer services 4 891 3 894 9 613 11 774 11 774 12 872 15 090 16 024Consultants and professional services: Business and advisory services
6 381 20 414 31 135 73 716 68 716 49 118 31 616 32 456
Consultants and professional services: Legal costs
10 131 11 582 6 289 20 835 20 835 5 223 6 109 6 837
Contractors 1 986 3 011 3 315 3 947 3 947 4 631 6 155 6 770Agency and support / outsourced services
14 475 12 237 14 892 12 977 12 977 13 828 15 713 15 964
Entertainment 52 107 82 271 271 405 470 612Fleet services (including government motor transport)
– 9 – – – – – –
Inventory: Food and food supplies 1 058 1 077 854 1 045 1 045 1 570 1 945 2 037Inventory: Materials and supplies – 130 393 30 30 72 88 97Inventory: Other consumables 1 416 1 086 1 187 838 838 1 592 2 906 3 383Inventory: Stationery and printing 3 299 3 360 4 279 3 907 3 907 5 771 6 778 7 019Lease payments 3 887 4 930 4 695 3 292 3 292 5 541 6 432 6 632Travel and subsistence 48 166 49 140 59 620 47 484 52 484 65 092 80 601 85 883Training and development – 346 1 016 940 940 1 602 2 278 2 660Operating expenditure 2 791 3 131 4 994 2 909 2 909 3 814 4 300 4 543Venues and facilities 6 704 1 682 891 1 285 1 285 3 022 3 818 4 021Transfers and subsidies 175 356 493 296 569 482 526 003 526 003 524 789 553 639 586 010Provinces and municipalities 2 3 2 – – – – –Departmental agencies and accounts 173 135 490 306 569 086 525 942 525 942 524 789 553 639 586 010Households 2 219 2 987 394 61 61 – – –Payments for capital assets 6 796 9 421 11 903 8 768 8 768 15 190 15 948 16 906Machinery and equipment 6 796 9 421 11 903 8 768 8 768 15 190 15 948 16 906Payments for financial assets – 82 – – – – – –Total 452 516 821 350 962 606 1 009 644 1 009 644 1 020 689 1 071 312 1 134 899
Expenditure trends Over the medium term, the spending focus will continue to be on providing support services to the president, deputy president, ministers and deputy minister in the execution of their duties. Spending is further informed by the activities of the National Planning Commission, the National Youth Development Agency and Brand South Africa, which was transferred from Government Communication and Information System in 2011/12.
Between 2008/09 to 2011/12, expenditure increased from R452.5 million to R1 billion, at an average annual rate of 30.7 per cent. This was mostly due to: growth in the transfer payment to the National Youth Development Agency as a result of the National Youth Commission merging with the Umsobomvu Youth Fund to form the National Youth Development Agency in 2009/10; increased capacity in the Administration programme to provide support to the president relating to mediation and participation on the continent and the world; and the

Vote 1: The Presidency
5
shifting of Brand South Africa from Government Communication and Information System to this vote in 2011/12.
Over the medium term, expenditure is projected to increase to R1.1 billion, at an average annual rate of 4 per cent. This is mainly due to additional funding of R5 million in 2012/13, R5.8 million in 2013/14 and R6.5 million in 2014/15 for improved conditions of service. Spending in the Administration programme is expected to increase from R394.8 million in 2011/12 to R451 million, at an average annual rate of 4.5 per cent, to provide for inflationary adjustments on compensation of employees and goods and services. The department also receives carry through costs of R148.8 million in 2012/13, R157 million in 2013/14 and R166.4 million in 2014/15 related to the function shift of Brand South Africa from the Government Communication and Information System in 2011/12.
R131.4 million is allocated over the MTEF period for the use of consultants to pay commissioners and for the national income dynamic study project.
Personnel information Table 1.3 Details of approved establishment and personnel numbers according to salary level1
Personnel post status as at 30 September 2011 Number of personnel posts filled / planned for on funded establishment Number of posts
on approved establishment
Number of funded
posts
Number of posts
additional to the
establishment Actual Mid-year2 Medium-term estimate
2008/09 2009/10 2010/11 2011/12 2012/13 2013/14 2014/15 Department 797 797 46 406 423 628 633 702 716 726Salary level 1 – 6 296 296 9 219 177 225 267 274 277 279Salary level 7 – 10 243 243 13 116 135 211 180 217 218 221Salary level 11 – 12 135 135 7 30 45 98 92 107 112 116Salary level 13 – 16 123 123 17 41 66 94 94 104 109 110Administration 717 717 41 396 413 604 610 656 664 669Salary level 1 – 6 286 286 9 216 174 225 266 267 269 270Salary level 7 – 10 228 228 13 115 134 205 176 206 206 208Salary level 11 – 12 115 115 6 29 44 93 88 99 102 104Salary level 13 – 16 88 88 13 36 61 81 80 84 87 87National Planning 80 80 5 10 10 24 23 46 52 57Salary level 1 – 6 10 10 – 3 3 – 1 7 8 9Salary level 7 – 10 15 15 – 1 1 6 4 11 12 13Salary level 11 – 12 20 20 1 1 1 5 4 8 10 12Salary level 13 – 16 35 35 4 5 5 13 14 20 22 231. Data has been provided by the department and may not necessarily reconcile with official government personnel data.2. As at 30 September 2011.
The Presidency had an establishment of 797 posts as at 30 September 2011. The number of filled posts grew from 406 in 2008/09 to 633 in 2011/12. Over the MTEF period, the number of filled posts is expected to increase to 726 due to the increased demand for capacity. There are 164 vacancies within the department, most of them in Administration programme. The ratio of support staff to line function staff is 1:6.

2012 Estimates of National Expenditure
6
Departmental receipts Table 1.4 Receipts
Audited outcome
Adjusted estimate
Revised estimate Medium-term receipts estimate
R thousand 2008/09 2009/10 2010/11 2011/12 2012/13 2013/14 2014/15 Departmental receipts 233 625 586 258 258 311 325 344Sales of goods and services produced by department
131 126 252 144 144 197 205 217
Sales by market establishments – – – 44 44 92 95 101of which: Rental dwellings – – – – – 46 46 50Rental parking: Covered and open – – – 44 44 46 49 51Administrative fees 78 – – – – – – –of which: Rental dwellings 63 – – – – – – –Rental parking: Covered and open 15 – – – – – – –Other sales 53 126 252 100 100 105 110 116of which: Services rendered: Commission - Insurance and garnishee
53 126 252 100 100 105 110 116
Sales of scrap, waste, arms and other used current goods
1 – – 6 6 – – –
of which: Sales: Waste paper 1 – – 6 6 – – –Interest, dividends and rent on land 4 14 16 8 8 9 10 11Interest 4 14 16 8 8 9 10 11Sales of capital assets – 308 140 – – – – –Transactions in financial assets and liabilities
97 177 178 100 100 105 110 116
Total 233 625 586 258 258 311 325 344
Departmental receipts consist mainly of recovered advances and debts, and receipts from renting out state property. Receipts increased from R233 000 in 2008/09 to R258 000 in 2011/12, at an average annual rate of 3.5 per cent, due to increases in parking rental and commission on insurance. Over the medium term, receipts are expected to increase to R344 000, at an average annual rate of 10.1 per cent, mainly due to inflationary increases in parking rental.
Programme 1: Administration Expenditure estimates Table 1.5 Administration Subprogramme
Audited outcome Adjusted
appropriation Medium-term expenditure estimate R thousand 2008/09 2009/10 2010/11 2011/12 2012/13 2013/14 2014/15 Ministry 19 940 18 563 33 704 31 472 31 953 33 104 35 126Management 166 990 198 399 215 645 233 022 267 718 284 821 302 782Support Services to President 25 982 25 870 35 675 38 033 36 516 40 199 42 509Support Services to Deputy President 24 584 24 154 27 033 36 060 37 971 41 655 42 889Cabinet Services 19 999 19 940 17 762 21 176 23 509 25 553 27 702Commission on State Owned Enterprises
– – 10 305 35 000 – – –
Total 257 495 286 926 340 124 394 763 397 667 425 332 451 008Change to 2011 Budget estimate 49 455 11 517 17 530 18 738

Vote 1: The Presidency
7
Table 1.5 Administration (continued)
Audited outcome Adjusted
appropriation Medium-term expenditure estimate R thousand 2008/09 2009/10 2010/11 2011/12 2012/13 2013/14 2014/15 Economic classification
Current payments 244 596 275 428 328 580 385 934 382 477 409 384 434 102Compensation of employees 125 933 160 936 187 545 226 656 231 973 232 601 247 089Goods and services 118 663 114 492 141 035 159 278 150 504 176 783 187 013of which: Administrative fees 94 148 2 145 147 153 178Advertising 1 370 1 378 1 161 1 434 1 993 2 046 2 151Assets less than the capitalisation threshold
3 882 2 349 986 2 815 3 061 3 242 3 442
Audit cost: External 1 616 2 169 3 745 6 989 7 672 8 021 9 026Bursaries: Employees 1 546 819 456 2 364 2 544 2 974 3 188Catering: Departmental activities 3 035 2 608 2 225 2 942 3 054 4 432 4 650Communication 11 590 12 959 18 326 5 856 14 362 16 637 17 071Computer services 4 891 3 894 9 612 10 774 11 767 13 394 14 159Consultants and professional services: Business and advisory services
2 070 1 779 11 465 39 716 5 606 7 228 7 488
Consultants and professional services: Legal costs
10 131 11 581 6 289 20 835 5 223 6 109 6 837
Contractors 1 985 2 036 3 312 3 537 4 122 5 338 5 855Agency and support / outsourced services
13 353 12 059 14 068 11 277 12 052 13 090 13 173
Entertainment 52 78 40 271 405 470 612Inventory: Food and food supplies 1 058 1 077 854 871 1 359 1 558 1 617Inventory: Materials and supplies – 128 300 30 72 88 97Inventory: Other consumables 1 415 1 086 1 187 578 1 287 2 427 2 833Inventory: Stationery and printing 3 000 3 205 4 094 3 744 5 534 6 449 6 506Lease payments 3 809 4 877 4 429 2 832 5 121 5 733 5 913Travel and subsistence 45 286 45 973 52 265 37 584 57 058 67 785 71 883Training and development – 323 998 840 1 513 2 079 2 423Operating expenditure 2 606 2 931 4 627 2 659 3 619 3 911 4 140Venues and facilities 5 874 1 035 594 1 185 2 933 3 619 3 771Transfers and subsidies 6 221 2 765 384 61 – – –Provinces and municipalities 2 3 2 – – – –Departmental agencies and accounts 4 000 – – – – – –Households 2 219 2 762 382 61 – – –Payments for capital assets 6 678 8 651 11 160 8 768 15 190 15 948 16 906Machinery and equipment 6 678 8 651 11 160 8 768 15 190 15 948 16 906Payments for financial assets – 82 – – – – –Total 257 495 286 926 340 124 394 763 397 667 425 332 451 008
Details of transfers and subsidies Departmental agencies and accounts Departmental agencies (non-business entities) Current 4 000 – – – – – –Isigodlo 3 000 – – – – – –South African Chapter of the Renaissance
1 000 – – – – – –
Households Social benefits Current 2 219 2 762 382 61 – – –Employee social benefits 2 219 2 762 382 61 – – –Provinces and municipalities Municipalities Municipal bank accounts Current 2 3 2 – – – –Municipal services 2 3 2 – – – –

2012 Estimates of National Expenditure
8
Expenditure trends Expenditure increased from R257.5 million in 2008/09 to R394.8 million in 2011/12, at an average annual rate of 15.3 per cent, due to an increase in spending on compensation of employees as a result of the filling of vacant posts. Between 2008/09 and 2011/12, spending on compensation of employees increased from R125.9 million to R226.7 million, at an average annual rate of 21.6 per cent, due to an increase in staff from 406 to 633.
Over the medium term, expenditure is expected to increase to R451 million, at an average annual rate of 4.5 per cent, to accommodate inflationary increases in spending on compensation of employees and goods and services. In addition, the Presidency receives additional funding of R25 million in 2012/13, R26.5 million in 2013/14 and R28.1 million in 2014/15 to increase its staff establishment in this programme. The presidential hotline was moved to the Department of Performance Monitoring and Evaluation in 2011/12. R38.5 million is allocated over the MTEF period for the use of consultants to provide legal services.
Programme 2: National Planning Objectives and measures • Improve long term planning and development to ensure the achievement of Vision 2030 by:
– producing a vision statement and a national development plan for the next 20 years, release it for public and stakeholder consultation and refine it and submit it for approval by Cabinet in 2012/13
– setting out the key challenges that South Africa faces in achieving government’s vision over the next 20 years and describing the key trade-offs that would have to be made on an ongoing basis
– advising on the sequencing of policies over the next 20 years to achieve government’s goals within its means.
• Manage risks to the national development plan by producing cross-cutting sectoral reports on a continuous basis that are likely to impact on the long term development trajectory.
• Enhance engagements at all levels by providing support and advice on communication, public participation and parliamentary liaison services through campaigns, workshops and conferences on a continuous basis as the national development plan is finalised.
Subprogrammes • Ministry oversees the development of the country’s long term vision and national strategic plan, and
contributes to improved outcomes in government through improved planning, improved long term plans, greater policy coherence and clearly articulated long term goals and aspirations. This subprogramme had a staff complement of 11 and a total budget of R62.1 million in 2011/12, of which 32 per cent was used for compensation of employees. Expenditure cuts over the medium term of R1.4 million have been identified on goods and services under consultants and professional services for business and advisory services.
• Research and Policy Services manages and facilitates research and policy processes on long term developmental issues, and provides technical support to the National Planning Commission. This entails: producing reports and discussion papers on identified cross cutting issues that affect long term development; translating sector plans to inform South Africa’s long term vision and national strategic plan; and providing advice to departments on areas in which the quality of policies, operational plans and implementation strategies need to be improved. This subprogramme had a staff complement of 9 and a total budget of R15.4 million in 2011/12, of which 80 per cent was used for compensation of employees. Expenditure cuts of R373 000 over the medium term have been identified in spending on goods and services for consultants and professional services that provide business and advisory services.
• Communication and Public Participation provides support services to the National Planning Commission and its secretariat. This entails providing financial management services, human resources management and development services, supply chain and logistical services, ICT services, legal advice, and contract management services. This subprogramme had a staff complement of 1 and a total budget of R7.6 million in 2011/12, of which 73 per cent was used for goods and services. Expenditure cuts of R146 000 over the medium term have been identified on compensation of employees.

Vote 1: The Presidency
9
Expenditure estimates Table 1.6 National Planning Subprogramme
Audited outcome Adjusted
appropriation Medium-term expenditure estimate R thousand 2008/09 2009/10 2010/11 2011/12 2012/13 2013/14 2014/15Ministry 21 887 40 288 47 658 62 144 50 804 60 604 64 246Research and Policy Services – – 1 723 15 367 38 020 20 498 21 730Communication and Public Participation
– – 65 7 591 6 751 8 435 8 933
Total 21 887 40 288 49 446 85 102 95 575 89 537 94 909Change to 2011 Budget estimate 1 280 (612) 613 650 Economic classification Current payments 21 769 39 293 48 691 85 102 95 575 89 537 94 909Compensation of employees 11 776 14 403 18 696 34 196 36 774 40 594 43 055Goods and services 9 993 24 890 29 995 50 906 58 801 48 943 51 854of which: Advertising 10 120 – 100 89 199 230Assets less than the capitalisation threshold
110 26 2 740 705 1 244 1 320
Bursaries: Employees (364) – – – – – –Catering: Departmental activities 224 202 77 400 438 749 850Communication 306 468 795 1 149 1 087 1 730 1 823Computer services – – 1 1 000 1 105 1 696 1 865Consultants and professional services: Business and advisory services
4 311 18 635 19 670 34 000 43 512 24 388 24 968
Consultants and professional services: Legal costs
– 1 – – – – –
Contractors 1 975 3 410 509 817 915Agency and support / outsourced services
1 122 178 824 1 700 1 776 2 623 2 791
Entertainment – 29 42 – – – –Fleet services (including government motor transport)
– 9 – – – – –
Inventory: Food and food supplies – – – 174 211 387 420Inventory: Materials and supplies – 2 93 – – – –Inventory: Other consumables 1 – – 260 305 479 550Inventory: Stationery and printing 299 155 185 163 237 329 513Lease payments 78 53 266 460 420 699 719Travel and subsistence 2 880 3 167 7 355 9 900 8 034 12 816 14 000Training and development – 23 18 100 89 199 237Operating expenditure 185 200 367 250 195 389 403Venues and facilities 830 647 297 100 89 199 250Transfers and subsidies – 225 12 – – – –Households – 225 12 – – – –Payments for capital assets 118 770 743 – – – –Machinery and equipment 118 770 743 – – – –Total 21 887 40 288 49 446 85 102 95 575 89 537 94 909
Details of transfers and subsidies Households Social benefits Current – 225 12 – – – –Employee social benefits – 225 12 – – – –

2012 Estimates of National Expenditure
10
Expenditure trends Expenditure increased from R21.9 million in 2008/09 to R85.1 million in 2011/12, at an average annual rate of 57.2 per cent, mainly for providing strategic support and advice to principals in the Presidency. The budget allocations over this period have had a direct and substantive impact on the National Planning Commission achieving its outputs. In 2011/12, the commission released and handed over of the draft national development plan and vision statement. The allocations also allowed the number of households surveyed on income, consumption and expenditure in the national income dynamics study to increase from 7 305 in 2008/09 to 9 600 in 2010/11.
Over the medium term, expenditure is expected to increase to R94.9 million, at an average annual rate of 3.7 per cent, mainly to provide for inflationary adjustments on compensation of employees and goods and services. The budget allocations will allow the number of households surveyed on income, consumption and expenditure in the national income dynamics study to increase from 9 600 in 2011/12 to 12 000 in 2014/15. The draft Vision 2030 and national development plan will be released for public and stakeholder comment in 2012/13 and will be refined and approved by Cabinet in the same period. Over the MTEF period, the commission will produce four research reports in 2012/13 and 2013/14, and five in 2014/15 on predetermined sectors selected from the thematic sectors in the Green Paper on National Strategic Planning.
R92.9 million is allocated over the MTEF period for consultants for the payment of commissioners and for the national income dynamic study project.
Programme 3: National Youth Development Agency Subprogramme • National Youth Development Agency transfers funds to the National Youth Development Agency, which
initiates, implements, facilitates and monitors youth development interventions aimed at reducing youth unemployment and promoting social cohesion.
Expenditure estimates Table 1.7 National Youth Development Agency Subprogramme
Audited outcome Adjusted
appropriation Medium-term expenditure estimate R thousand 2008/09 2009/10 2010/11 2011/12 2012/13 2013/14 2014/15National Youth Development Agency 29 413 328 925 398 973 385 853 376 010 396 677 419 630Total 29 413 328 925 398 973 385 853 376 010 396 677 419 630Change to 2011 Budget estimate – (29 136) (30 752) (33 445) Economic classification Transfers and subsidies 29 413 328 925 398 973 385 853 376 010 396 677 419 630Departmental agencies and accounts 29 413 328 925 398 973 385 853 376 010 396 677 419 630Total 29 413 328 925 398 973 385 853 376 010 396 677 419 630
Details of transfers and subsidies Departmental agencies and accounts Departmental agencies (non-business entities)
Current 29 413 328 925 398 973 385 853 376 010 396 677 419 630 National Youth Development Agency: Programmes promoting youth development 29 413 328 925 398 973 385 853 376 010 396 677 419 630
Expenditure trends The expenditure trends for this programme are discussed in more detail in the public entities section, as the programme is mainly for the transferring funds to the National Youth Development Agency.

Vote 1: The Presidency
11
Programme 4: International Marketing and Communication Subprogramme • Brand South Africa facilitates the transfer of funds to Brand South Africa (previously known as the
International Marketing Council of South Africa) for the agency to develop and implement a proactive marketing and communication strategy for South Africa, aimed at promoting South Africa and increasing the familiarity and knowledge of South Africa as a visible, world class and profitable business destination in targeted international trade, investment and tourism markets.
Expenditure estimates Table 1.8 International Marketing and Communication Subprogramme
Audited outcome Adjusted
appropriation Medium-term expenditure estimate R thousand 2008/09 2009/10 2010/11 2011/12 2012/13 2013/14 2014/15 Brand South Africa 139 722 161 381 170 113 140 089 148 779 156 962 166 380 Total 139 722 161 381 170 113 140 089 148 779 156 962 166 380
Economic classification Transfers and subsidies 139 722 161 381 170 113 140 089 148 779 156 962 166 380Departmental agencies and accounts 139 722 161 381 170 113 140 089 148 779 156 962 166 380Total 139 722 161 381 170 113 140 089 148 779 156 962 166 380
Details of transfers and subsidies Departmental agencies and accounts Departmental agencies (non-business entities) Current 139 722 161 381 170 113 140 089 148 779 156 962 166 380Brand South Africa 139 722 161 381 170 113 140 089 148 779 156 962 166 380
Expenditure trends The expenditure trends for this programme are discussed in more detail in the public entities section, as the programme is mainly for transferring funds to Brand South Africa, which was previously known as International Marketing Council of South Africa.
Public entities and other agencies National Youth Development Agency
Overview: 2008/09 – 2014/15 The National Youth Development Agency was established in 2009 in terms of the National Youth Development Agency Act (2008). Established through the merger of the National Youth Commission and the Umsobomvu Youth Fund, the organisation has absorbed all the activities, assets, liabilities, and staff of both organisations. The agency derives its mandate from the act, the 2009-2014 national youth policy and the 2006 draft integrated youth development strategy. Its main role is to initiate, implement, facilitate and monitor youth development interventions aimed at reducing youth unemployment and promoting social cohesion. To achieve this, the agency’s concrete responsibilities include: lobbying and advocating for the integration and mainstreaming of youth development in all spheres of government, the private sector and civil society; initiating, implementing, facilitating and coordinating youth development programmes; monitoring and evaluating youth development interventions; and mobilising the youth for active participation in civil society engagements.
Agency activities and interventions are also aligned with key national priorities such as those articulated in the Accelerated and Shared Growth Initiative for South Africa, the national youth development policy and framework, the expanded public works programme, the human resources development strategy, the national skills development strategy, the South African Qualifications Authority Act (1995) and the Broad Based Black Economic Empowerment Act (2003).

2012 Estimates of National Expenditure
12
Performance In the period under review, the agency created in excess of 18 000 jobs through various programmes such as individual and group micro loans, job placement programmes and the business support voucher programme. In addition, the total value of loans issued was R41.7 million. The loans were funded businesses owned by young people. 16 656 young people benefited from the agency’s entrepreneurship programmes in 2011/12, exceeding the target of 15 150. Through the agency’s education and skills programmes, 2 036 young people enrolled for the matric rewrite programme, which is viewed as a second chance for young people who ordinarily would not have been able to complete their national senior certificate.
Selected performance indicators Table 1.9 National Youth Development Agency Indicator Programme/Activity Past Current Projections
2008/09 2009/10 2010/11 2011/12 2012/13 2013/14 2014/15 Number of young people assisted through youth advisory centres per year
Provide assistance and interventions to young people coming through National Youth Development Agency walk in centres and access points
546 508 495 146 800 000 600 000 600 000 700 000 900 000
Number of young people accessing information through youth advisory centres (full service points, call centre interaction and kiosks) per year
Provide access to information regarding products and services of the National Youth Development Agency and referrals to other agencies
55 934 – – – – – –
Number of young people enrolled in entrepreneurship education programmes per year
Provide entrepreneurship education and support to young people
– 37 764 15 150 2 500 5 000 6 000 7 200
Number of young people acquiring skills through national youth service projects per year
Build a culture of community service among the youth
69 512 18 142 50 000 10 000 15 000 20 000 25 000
Number of young people provided with career guidance information and counselling in individual and group sessions and events per year
Provide career guidance services 1 750 – – – – – –
Number of loans issued per year Increase participation of young people in the economy
21 809 29 440 8 150 8 410 2 480 2 830 3 200
Number of jobs created or sustained through entrepreneurship programme interventions per year
Increase participation of young people in the economy
38 304 43 303 14 888 16 367 4 800 5 420 6 200
Programmes/activities/objectives Table 1.10 National Youth Development Agency
Revised Audited outcome estimate Medium-term estimate
R thousand 2008/09 2009/10 2010/11 2011/12 2012/13 2013/14 2014/15 To provide access to information regarding the agency's products and services and make referrals to other agencies
– – – 57 697 71 945 75 974 84 351
To provide career guidance services – 1 943 3 321 39 192 35 160 37 129 39 134To facilitate and implement education opportunities in order to improve access to quality education
– – – 19 176 17 905 18 908 19 929
To make youth development information and knowledge accessible and available to the public sector, private sector and civil society to inform policy development, planning, implementation and review of all of their programmes related to government priorities
– – – 103 867 92 305 97 474 101 295
To mobilise and leverage financial contributions from third parties to implement programmes outlined in the NYDA Act so as to increase the numbers of young people benefiting from youth development programmes in the country
– – – 28 989 25 933 27 385 28 864

Vote 1: The Presidency
13
Table 1.10 National Youth Development Agency (continued) Audited outcome estimate Medium-term estimate
R thousand 2008/09 2009/10 2010/11 2011/12 2012/13 2013/14 2014/15 To ensure compliance with all applicable statutes and policies 11 698 5 955 11 930 – – – –To lobby key stakeholders and institutions in the public, private and civic society sectors, including international donor agencies to work with, and support the work of Youth Development Initiatives
68 – – 136 934 126 671 133 406 139 610
To promote youth participation in sport, and arts and culture activities
– – – 14 565 13 024 13 754 14 497
Old targets 479 421 274 328 454 544 – – – –Total expense 491 187 282 226 469 795 400 419 382 942 404 028 427 678
The National Youth Development Agency had a total budget of R400.4 million in 2011/12, of which 34.2 per cent was used to lobby key stakeholders and institutions in the public, private and civic society sectors; and 25.9 per cent was used to make youth development information and knowledge accessible and available to the public sector, private sector and civil society to inform policy development, planning, implementation and review of all of their programmes related to government priorities.
Savings and cost effectiveness measures A Cabinet approved baseline cut of R29.1 million in 2012/13, R30.8 million in 2013/14 and R33.4 million in 2014/15 was effected, mainly on performance bonuses and funded vacant positions.
Expenditure estimates Table 1.11 National Youth Development Agency Statement of financial performance Revised
Audited outcome estimate Medium-term estimate R thousand 2008/09 2009/10 2010/11 2011/12 2012/13 2013/14 2014/15 Revenue Non-tax revenue 265 940 19 946 36 853 14 566 6 932 7 351 8 048Sale of goods and services other than capital assets
5 624 751 2 388 – – – –
of which: Administration fees 5 624 751 2 388 – – – –Other non-tax revenue 260 316 19 195 34 465 14 566 6 932 7 351 8 048Transfers received 31 060 280 883 434 479 385 853 376 010 396 677 419 630Total revenue 297 000 300 829 471 332 400 419 382 942 404 028 427 678Expenses Current expenses 491 187 280 283 466 474 400 419 382 942 404 028 427 678Compensation of employees 43 411 66 173 133 665 174 502 167 486 176 865 186 416Goods and services 436 010 208 155 320 879 209 778 202 359 213 333 226 685Depreciation 11 698 5 955 11 930 16 139 13 097 13 830 14 577Interest, dividends and rent on land 68 – – – – – –Transfers and subsidies – 1 943 3 321 – – – –Total expenses 491 187 282 226 469 795 400 419 382 942 404 028 427 678Surplus / (Deficit) (194 187) 18 603 1 537 – – – –Statement of financial position Carrying value of assets 46 820 43 449 36 234 62 181 65 084 68 150 71 381of which: Acquisition of assets 25 349 4 395 5 053 42 086 16 000 16 896 17 808Investments 40 079 12 670 9 345 9 345 9 345 9 345 9 345Inventory 154 11 – – – – –Loans 177 893 93 576 36 094 24 588 32 439 33 340 31 622Receivables and prepayments 35 009 2 881 5 233 5 233 5 233 5 233 5 233Cash and cash equivalents 28 890 24 371 40 762 16 320 5 566 1 599 87Total assets 328 845 176 958 127 668 117 667 117 667 117 667 117 667

2012 Estimates of National Expenditure
14
Table 1.11 National Youth Development Agency (continued) Statement of financial position Revised
Audited outcome estimate Medium-term estimateR thousand 2008/09 2009/10 2010/11 2011/12 2012/13 2013/14 2014/15 Accumulated surplus / (deficit) 243 561 78 686 80 223 80 223 80 223 80 223 80 223Finance lease 397 68 20 20 20 20 20Deferred income 334 1 040 874 874 874 874 874Trade and other payables 62 713 73 339 29 985 19 985 19 985 19 985 19 985Provisions 21 840 23 825 16 566 16 565 16 565 16 565 16 565Total equity and liabilities 328 845 176 958 127 668 117 667 117 667 117 667 117 667
Expenditure trends The spending focus over the MTEF period will be on youth development initiatives, including the provision of career guidance services, the facilitation of business and funding opportunities, and the facilitation and implementation of education opportunities so that more young people receive a quality education.
The main source of revenue for the agency is a transfer payment from the Presidency and interest income from bank deposits. Revenue increased from R297 million in 2008/09 to R400.4 million in 2011/12, at an average annual rate of 10.5 per cent, mainly due to the National Youth Commission merging with the Umsobomvu Youth Fund to form the agency in 2009/10. The increase is also due to a once-off allocation of R29 million in the same year for the 17th World Festival of Youth and Students, which was held in December 2010. Over the medium term, revenue is expected to increase to R427.7 million, at an average annual rate of 2.2 per cent.
Between 2008/09 and 2011/12, expenditure decreased from R491.2 million to R400.4 million, at an average annual rate of 6.6 per cent, due to the once-off allocation for the 17th World Festival of Youth and Students held in December 2010. Over the medium term, expenditure is expected to increase to R427.7 million, at an average annual rate of 2.2 per cent to provide for inflationary adjustments on goods and services. As a result, expenditure on goods and services is expected to increase from R209.8 million in 2011/12 to R226.7 million in 2014/15, at an average annual rate of 2.6 per cent.
The agency’s economic participation programme created 18 038 jobs for young people in 2011/12. These jobs were created through jobs placements, self-employment and funding youth businesses. This was done through the Proud to Serve campaign, the South African Football Association’s campaign and youth build projects. The micro finance subprogramme in the economic participation programme created 14 227 jobs. In 2010/11, the agency enrolled 2 036 young people to rewrite their matric exams as a pilot project in Gauteng, Western Cape, Eastern Cape and KwaZulu-Natal. The economic participation programme assisted in providing opportunities for youth to enhance entrepreneurship.

Vote 1: The Presidency
15
Personnel information Table 1.12 National Youth Development Agency
Personnel post status as at 30 September 2011 Number of personnel posts filled / planned for on funded establishmentNumber of
posts on approved
establishment
Number of funded posts
Number of vacant
posts Actual Mid-year1 Medium-term estimate
2008/09 2009/10 2010/11 2011/12 2012/13 2013/14 2014/15Executive board members
2 2 – – 2 2 2 2 2 2
Executive management 11 11 2 18 16 9 9 9 9 9Senior management 43 33 7 20 15 26 26 26 26 26Middle management 63 57 4 51 51 53 53 53 53 53Professionals 53 47 29 13 16 18 18 73 73 73Skilled 122 110 21 119 88 89 89 130 130 130Semi-skilled 199 191 2 133 215 189 189 189 189 189Very low skilled 7 7 2 7 6 5 5 18 18 18Total 500 458 67 361 409 391 391 500 500 500Compensation (R thousand)
43 411 66 173 133 675 174 502 167 486 176 865 186 416
Unit cost (R thousand) 120 162 342 446 335 354 3731. As at 30 September 2011.
The agency had an establishment of 500 posts as at 30 September 2011. The number of filled posts grew from 361 in 2008/09 to 391 in 2011/12. Over the MTEF period, the number of filled posts is expected to increase to 500, in line with the establishment. There are 42 vacancies within the agency, mostly in the skilled and senior management levels. The ratio of support staff to line staff is 1:2.
Brand South Africa
Overview 2008/09 – 2014/15 Previously known as the International Marketing Council of South Africa, Brand South Africa was established as a trust in 2002 and gazetted as a schedule 3A public entity in accordance with the Public Finance Management Act (1999) in October 2006. Its purpose is to develop and implement a proactive and coordinated international marketing and communication strategy for South Africa to contribute to job creation and poverty reduction and to attract inward investment, trade and tourism.
In 2008, the Minister in the Presidency initiated a strategic review of the council, which led to changes in the organisation’s mandate, business model, strategy, performance indicators and board of trustees. Among the changes is a new name, Brand South Africa, which is aligned with the new mandate. The council is currently trading as Brand South Africa and awaits the registration of the deed of trust to render it official.
Brand South Africa intends to approach the medium term goal and task of ensuring that South Africa is competitively positioned as a nation brand. Some nation brands have a sector specific driving focus. Australia and Malaysia are renowned tourism and investment destinations. Other nations’ brands are master plan or vision driven: Singapore, Korea, the United Arab Emirates and Dubai have strong overarching national visions. South Africa, on the other hand, has favoured a holistic model that includes investment, trade and tourism. This model requires the cooperation and collaboration of government, business and civil society.
Brand South Africa is organised into three major programmes. The administration provides organisational development and financial management, including overseeing: the governance, risk and compliance aspects of the organisation; developing human capital; and identifying and developing an appropriate resourcing model to augment government funding. The brand strategy development and management programme seeks to implement the nation brand’s positioning through all local stakeholders and in all key global markets to drive the competitiveness of South Africa. The reputation management programme aims to influence global and local perceptions that will drive the positive reputation of Brand South Africa over the long term.

2012 Estimates of National Expenditure
16
Performance In the period under review, the organisation increased the number of stakeholders trained for brand compliance from 9 in 2010/11 to 23 2011/12 departments, and trained 24 companies in 2011/12. It also improved on its international media reputation index from 55 in 2010/11 to 53 2011/12.
Selected performance indicators Table 1.13 Brand South Africa Indicator Activity/Objective/
Programme/ Project Past Current Projected
2008/09 2009/10 2010/11 2011/12 2012/13 2013/14 2014/15 Number of global publicity campaigns per year
Brand strategy development and management
– – – – – – –
Number of movable Bill Boards: Branded Taxis
Brand strategy development and management
120 150 – – – – –
Number of print adverts in major global publications
Brand strategy development and management
50 70 – – – – –
Number of TV spots Brand strategy development and management
600 700 – – – – –
Number of domestic publicity campaigns per year
Mass media advertising
– – – – – – –
Number of TV spots Mass media advertising
400 420 – – – – –
Number of radio spots Mass media advertising
2 921 19 690 420 – – – – –
Number of visits to the web portal per year 1
E-marketing 2 500 000 3 100 000 – – – – –
Number of South African story booklets produced per year:
Collaterals: the South African story
- English 25 000 10 000 – – – – –
- German 10 000 10 000 – – – – –
- Spanish 10 000 10 000 – – – – –
- French 10 000 10 000 – – – – –
- Arabic 10 000 10 000 – – – – –
- Portuguese 10 000 10 000 – – – – –
- Russian 10 000 10 000 – – – – –
- Mandarin 10 000 10 000 – – – – –
Brand ranking index 2 Brand strategy development and management
37 35 37 36 (31-35) (30-34) (29-33)
Media tenor reputation index Reputation management
45 50 55 53 (50-55) (50-55) (50-55)
World Economic Forum global competitive index :out of number of countries registered
Brand knowledge and performance: (Research)
(44 of 131) (45 of 131) 54 50 (45-55) (43-53) (41-53)
Number of stakeholders trained for brand compliance
Brand knowledge and performance: research
– – 9 departments 3 provinces
23 departments 9 provinces 24
companies
9 State Owned Entities
25 companies
25 companies
25 companies

Vote 1: The Presidency
17
Table 1.13 Brand South Africa (continued) Indicator Activity/ Objective/
Programme/ Project Past Current Projected
2008/09 2009/10 2010/11 2011/12 2012/13 2013/14 2014/15 International media reputation index
Reputation management
45 50 55 53 (50-55) (50-55) (50-55)
Domestic media reputation index
Reputation management
– – – 64 (55-65) (55-65) (55-65)
International Institute for Management Development competitiveness yearbook
Reputation management
53 5 58 59 (55-59) (54-58) (53-57)
Reputation ranking Brand strategy development and management
– – 55 55 56 57 56
Programmes/activities/objectives Table 1.14 Brand South Africa
Revised Audited outcome estimate Medium-term estimate
R thousand 2008/09 2009/10 2010/11 2011/12 2012/13 2013/14 2014/15 Brand strategy development and management
– 116 206 62 846 37 894 58 966 62 209 65 319
Reputation management – 21 131 24 178 24 400 62 957 74 220 79 069Brand knowledge and performance (research)
– 5 123 6 593 16 200 – – –
Stakeholder and partner alignment management
– 3 524 25 130 25 738 – – –
Mass media advertising 62 747 – – – – – –E-marketing 5 592 5 876 – – – – –Collaterals (SA story) 1 653 – – – – – –Research 4 221 – – – – – –Partnership 11 478 – – – – – –Other objectives 60 542 31 059 35 734 43 857 37 856 40 033 42 992Total expense 146 233 182 919 154 481 148 089 159 779 176 462 187 380
Brand South Africa had a total budget of R148.1 million in 2011/12, of which 29.6 per cent was used for other projects, 25.6 per cent for brand strategy development and management, 17.4 per cent for stakeholder and partner alignment management, 16.5 per cent for reputation management, and 10.9 per cent for brand knowledge and performance research.
Savings and cost effectiveness measures The entity does not foresee any major cost savings over the medium term.
Expenditure estimates Table 1.15 Brand South Africa Statement of financial performance Revised
Audited outcome estimate Medium-term estimate R thousand 2008/09 2009/10 2010/11 2011/12 2012/13 2013/14 2014/15 Revenue Non-tax revenue 5 372 32 981 8 945 8 000 11 000 19 500 21 000Other non-tax revenue 5 372 32 981 8 945 8 000 11 000 19 500 21 000Transfers received 139 722 161 381 170 113 140 089 148 779 156 962 166 380Total revenue 145 094 194 362 179 058 148 089 159 779 176 462 187 380

2012 Estimates of National Expenditure
18
Table 1.15 Brand South Africa (continued) Statement of financial performance Revised
Audited outcome estimate Medium-term estimate R thousand 2008/09 2009/10 2010/11 2011/12 2012/13 2013/14 2014/15 Expenses Current expenses 146 233 182 919 154 481 148 089 159 779 176 462 187 380Compensation of employees 14 564 16 008 18 339 27 841 29 233 30 694 32 229Goods and services 131 014 166 407 135 135 118 703 129 890 145 410 154 731Depreciation 655 504 1 007 1 545 656 358 420Total expenses 146 233 182 919 154 481 148 089 159 779 176 462 187 380Surplus / (Deficit) (1 139) 11 443 24 577 – – – –Statement of financial position Carrying value of assets 1 387 1 760 2 180 1 880 2 164 2 660 3 070of which: Acquisition of assets 598 1 146 1 427 1 245 940 854 830Receivables and prepayments 3 999 965 1 392 3 374 5 260 6 460 7 660Cash and cash equivalents 5 681 35 078 50 706 47 024 42 854 39 158 39 548Total assets 11 067 37 803 54 278 52 278 50 278 48 278 50 278Accumulated surplus / (deficit) 863 12 306 36 883 36 883 36 883 36 883 36 883Trade and other payables 7 817 24 014 16 707 14 707 12 707 10 707 12 707Provisions 2 386 1 482 688 688 688 688 688Total equity and liabilities 11 066 37 802 54 278 52 278 50 278 48 278 50 278
Expenditure trends The spending focus over the medium term will continue to be on building awareness and promoting a positive image of the South African brand, both domestically and internationally. Through its reputation management programme, the organisation will increase the international media reputation index to range between 50 and 55. The main source of revenue for Brand South Africa is a transfer payment from the Presidency. Revenue increased marginally from R145.1 million in 2008/09 to R148.1 million in 2011/12, at an average annual rate of 0.7 per cent.
Over the medium term, revenue is expected to increase to R187.4 million, at an average annual rate of 8.2 per cent. The increase over the latter period is mainly due to an increase in transfers received to provide for improved conditions of service.
Between 2008/09 and 2011/12, expenditure increased from R146.2 million to R148.1 million, at an average annual rate of 0.4 per cent, and is expected to increase to R187.4 million over the medium term, at an average annual rate of 8.2 per cent. The increase in both periods is mainly due to adjustments for improved conditions of service. Spending on consultants is projected at R5.3 million over the medium term for marketing and brand reputation.

Vote 1: The Presidency
19
Personnel information Table 1.16 Brand South Africa
Personnel post status as at 30 September 2011 Number of personnel posts filled / planned for on funded establishment Number
of posts on approved
establishment
Number of funded posts
Number of vacant
posts Actual Mid-year1 Medium-term estimate
2008/09 2009/10 2010/11 2011/12 2012/13 2013/14 2014/15 Executive management 5 5 – 6 5 4 5 6 6 6Senior management 6 6 1 4 2 6 8 12 12 12Middle management 2 2 1 – – – – – – –Professionals 9 9 – 17 10 2 2 13 13 13Skilled 15 15 4 – – – – – – –Semi-skilled – – – 2 2 12 13 2 2 2Very low skilled 2 2 – – – – – – – –Total 39 39 6 29 19 24 28 33 33 33Compensation (R thousand)
14 564 16 008 18 339 27 841 29 233 30 694 32 229
Unit cost (R thousand) 502 843 764 994 886 930 9771. As at 30 September 2011.
The entity had an establishment of 39 posts as at 30 September 2011. The number of filled posts fluctuated from 29 in 2008/09 to 28 in 2011/12. Over the MTEF period, the number of filled posts is expected to increase to 33. There are 11 vacancies within the entity, most of them in the stakeholder relations department. The ratio of support staff to line staff is 1:4, while the ratio of consultants to council staff is 1:4.8.

2012 Estimates of National Expenditure
20
Additional tables Table 1.A Summary of expenditure trends and estimates per programme and economic classification Programme Appropriation Audited Appropriation Revised
Main Adjusted outcome Main Additional Adjusted estimate R thousand 2010/11 2010/11 2011/12 2011/12Administration 283 549 318 903 340 124 338 543 56 220 394 763 399 763National Planning 48 708 49 044 49 446 83 822 1 280 85 102 80 102National Youth Development Agency 369 973 398 973 398 973 385 853 – 385 853 385 853International Marketing and Communication – – 170 113 140 089 – 140 089 140 089Subtotal 702 230 766 920 958 656 948 307 57 500 1 005 807 1 005 807Direct charge against the National Revenue Fund
4 550 4 550 3 950 4 810 (973) 3 837 3 837
Salary of the President 2 394 2 394 2 107 2 531 – 2 531 2 531Salary of the Deputy President 2 156 2 156 1 843 2 279 (973) 1 306 1 306Total 706 780 771 470 962 606 953 117 56 527 1 009 644 1 009 644
Economic classification Current payments 322 662 353 738 381 221 410 737 64 136 474 873 474 873Compensation of employees 205 930 209 506 210 191 233 451 31 238 264 689 264 689Goods and services 116 732 144 232 171 030 177 286 32 898 210 184 210 184Transfers and subsidies 371 943 401 057 569 482 527 912 (1 909) 526 003 526 003Provinces and municipalities – – 2 – – – –Departmental agencies and accounts 371 943 400 943 569 086 527 912 (1 970) 525 942 525 942Households – 114 394 – 61 61 61Payments for capital assets 12 175 16 675 11 903 14 468 (5 700) 8 768 8 768Machinery and equipment 12 175 16 675 11 903 14 468 (5 700) 8 768 8 768Total 706 780 771 470 962 606 953 117 56 527 1 009 644 1 009 644
Table 1.B Summary of expenditure on training
Adjusted Audited outcome appropriation Medium-term expenditure estimate 2008/09 2009/10 2010/11 2011/12 2012/13 2013/14 2014/15
Compensation of employees (R thousand) 141 708 181 928 209 506 260 852 243 749 271 135 287 979Training expenditure (R thousand) 1 414 1 874 2 091 2 608 2 437 2 711 2 880Training as percentage of compensation 1.0% 1.0% 1.0% 1.0% 1.0% 1.0% 1.0%Total number trained in department (headcount) 88 43 304 145 of which: Employees receiving bursaries (headcount) 60 52 44 60 Learnerships (headcount) 11 – – – Internships (headcount) 9 3 27 35

Vote 1: The Presidency
21
Table 1.C Summary of departmental public private partnership projects Project description: Phakisa World Project
annual unitary
fee Budgeted
at time of expenditure Medium-term expenditure estimate R thousand contract 2011/12 2012/13 2013/14 2014/15
Projects signed in terms of Treasury Regulation 16 – 18 337 19 621 21 387 21 387Public private partnership unitary charge1 – 18 337 19 621 21 387 21 387Total – 18 337 19 621 21 387 21 3871. Phavis fleet services public private partnership. Disclosure notes for this project can be viewed in the public private partnership table of the Department of Transport's chapter.
Disclosure notes for projects signed in terms of Treasury Regulation 16 Project name Phakisa World Brief description Phakisa fleet services - Transport Duration of public private partnership agreement 5 years Escalation index for unitary fee N/A Net present value of all payment obligations discounted at appropriate duration government bond yield
N/A
Variations and amendments to public private partnership agreement N/A Cost implications of variations and amendments N/A Significant contingent fiscal obligations including termination payments, guarantees, warranties and indemnities and maximum estimated value of such liabilities
N/A
22
2011 Estimates of National Expenditure
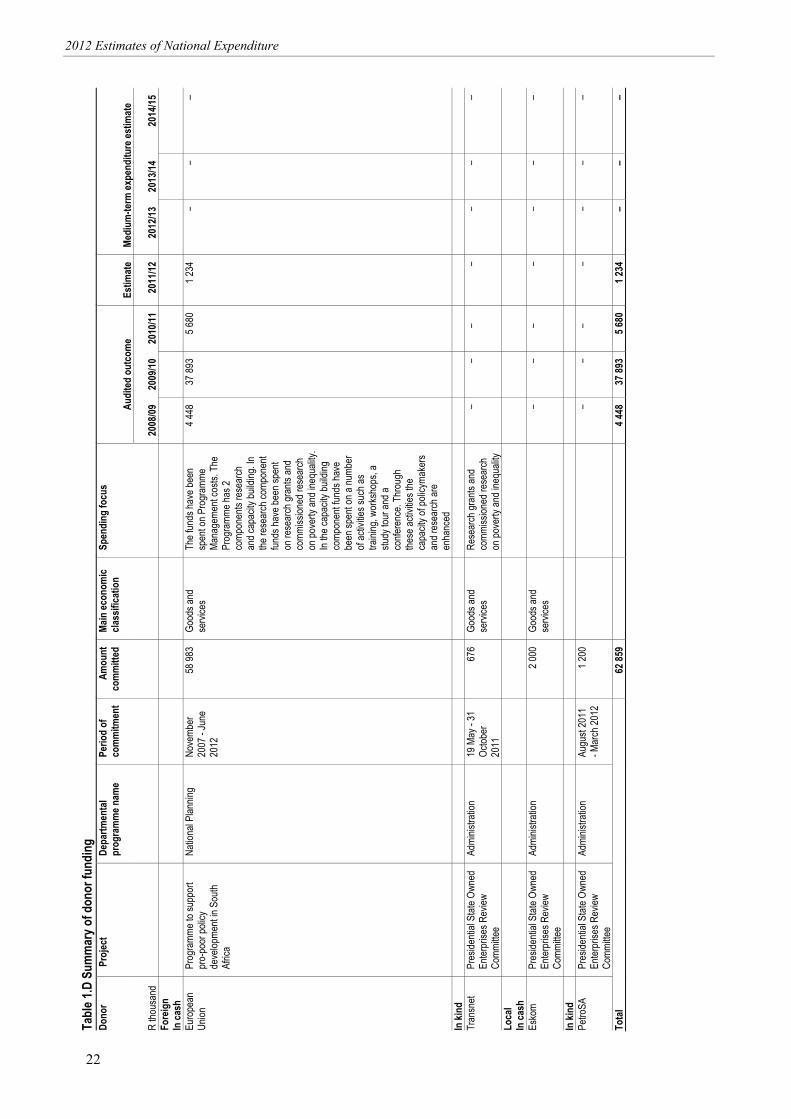
Tabl
e 1.D
Sum
mar
y of d
onor
fund
ing
Do
nor
Pro
ject
Depa
rtmen
tal
prog
ram
me n
ame
Perio
d of
co
mm
itmen
t Am
ount
co
mm
itted
Ma
in ec
onom
ic cla
ssifi
catio
n Sp
endi
ng fo
cus
Audi
ted
outc
ome
Estim
ate
Medi
um-te
rm ex
pend
iture
estim
ate
R tho
usan
d
20
08/09
20
09/10
20
10/11
20
11/12
20
12/13
20
13/14
20
14/15
Fo
reig
n
In
cash
Euro
pean
Un
ion
Prog
ramm
e to s
uppo
rt pr
o-po
or po
licy
deve
lopme
nt in
South
Af
rica
Natio
nal P
lannin
gNo
vemb
er
2007
- Ju
ne
2012
58 98
3Go
ods a
nd
servi
ces
The f
unds
have
been
sp
ent o
n Pro
gram
me
Mana
geme
nt co
sts. T
he
Prog
ramm
e has
2 co
mpon
ents
rese
arch
an
d cap
acity
build
ing. In
the
rese
arch
comp
onen
t fun
ds ha
ve be
en sp
ent
on re
sear
ch gr
ants
and
comm
ission
ed re
sear
ch
on po
verty
and i
nequ
ality.
In
the ca
pacit
y buil
ding
comp
onen
t fund
s hav
e be
en sp
ent o
n a nu
mber
of
activ
ities s
uch a
s tra
ining
, wor
ksho
ps, a
stu
dy to
ur an
d a
confe
renc
e. Th
roug
h the
se ac
tivitie
s the
ca
pacit
y of p
olicy
make
rs an
d res
earch
are
enha
nced
4 448
37 89
35 6
801 2
34 –
– –
In ki
nd
Tr
ansn
et
Pres
identi
al St
ate O
wned
En
terpr
ises R
eview
Co
mmitte
e
Admi
nistra
tion
19 M
ay -
31
Octob
er
2011
676
Good
s and
se
rvice
s Re
sear
ch gr
ants
and
comm
ission
ed re
sear
ch
on po
verty
and i
nequ
ality
– –
– –
– –
–
Loca
l
In
cash
Es
kom
Pres
identi
al St
ate O
wned
En
terpr
ises R
eview
Co
mmitte
e
Admi
nistra
tion
2 000
Good
s and
se
rvice
s –
– –
– –
– –
In ki
nd
Pe
troSA
Pr
eside
ntial
State
Own
ed
Enter
prise
s Rev
iew
Comm
ittee
Admi
nistra
tion
Augu
st 20
11
- Mar
ch 20
12
1 200
– –
– –
– –
–
Tota
l
62 85
94 4
4837
893
5 680
1 234
––
–
2012 Estimates of National Expenditure

Estim
ates o
f Natio
na
l expen
ditu
re

National TreasuryDepartment:
REPUBLIC OF SOUTH AFRICA
national treasury
N a t i o n a l T r e a s u r y
estimates of national expenditure
Private Bag X115, Pretoria, 0001, Tel: +27 12 395 6697, Fax: +27 12 315 5126