social exclusion and the future of cities - welcome to lse...
TRANSCRIPT
Social Exclusion and the Future of Cities
Anne PowerWilliam Julius Wilson
ContentsPoor Areas and Social Exclusion 1
Anne PowerThe State of American Cities 21
William Julius Wilson
CASEpaper 35 Centre for Analysis of Social ExclusionFebruary 2000 London School of Economics
Houghton StreetLondon WC2A 2AE
CASE enquiries – tel: 020 7955 6679

Centre for Analysis of Social Exclusion
The ESRC Research Centre for Analysis of Social Exclusion (CASE) wasestablished in October 1997 with funding from the Economic and SocialResearch Council. It is located within the Suntory and ToyotaInternational Centres for Economics and Related Disciplines (STICERD)at the London School of Economics and Political Science, and benefitsfrom support from STICERD. It is directed by Howard Glennerster, JohnHills, Kathleen Kiernan, Julian Le Grand, Anne Power and CarolPropper.
Our Discussion Paper series is available free of charge. We also producesummaries of our research in CASEbriefs, and reports from variousconferences and activities in CASEreports. To subscribe to theCASEpaper series, or for further information on the work of the Centreand our seminar series, please contact the Centre Administrator, JaneDickson, on:
Telephone: UK+20 7955 6679Fax: UK+20 7955 6951Email: [email protected] site: http://sticerd.lse.ac.uk/Case
Anne PowerWilliam Julius Wilson
All rights reserved. Short sections of text, not to exceed two paragraphs,may be quoted without explicit permission provided that full credit,including notice, is given to the source.
Editorial Note and Acknowledgements
These two papers were presented at the CASE/LSE Housing Seminar on“Social Exclusion and the Future of Cities”, kindly sponsored by theBroomleigh Housing Association, on 8th July 1999. Anne Power isDeputy Director of CASE and Professor of Social Policy at the LondonSchool of Economics. This revised version of her lecture is reproducedwith permission from the RSA Journal. This lecture was delivered to theRSA Midlands on 7th December 1999. William Julius Wilson is theMalcolm Wiener Professor of Social Policy and Director of theJoblessness and Urban Poverty Research Program at the MalcolmWiener Centre for Social Policy, John F. Kennedy School of Government,Harvard University. He was a visitor to CASE in June and July 1999.
Abstract
In both Britain and the United States, people have been moving awayfrom the inner cities to suburban developments, often leaving behindconcentrations of poverty and decaying neighbourhoods. Anne Power’spaper focuses on the British situation. As Britain comes to terms with theimplications of urban renaissance, a new way must be found of lookingat regeneration based on rebuilding urban neighbourhoods. The keypoints for the future are: limiting suburban land supply and creatinghigher density in depleted urban neighbourhoods; equalising theincentives to recycle old buildings and used land rather than greenfieldsites; improving public transport; managing neighbourhoods toencourage a social mix; and protecting green spaces. William JuliusWilson, looking at the American situation, addresses the rediscovery of“metropolitan solutions” as answers to the common problems ofAmerica’s cities and suburbs. This rediscovery reflects the recognitionthat metropolitan areas constitute the real competitive units in the neweconomy and that competitiveness requires a healthy urban core; thegrowing awareness that complex issues such as pollution and trafficcongestion cross boundaries and are immune to localised fixes; and theco-existence of persistent joblessness in the central cities and labourshortages in the suburbs.
1
Poor Areas and Social Exclusion
Anne Power
Social exclusion is about the inability of our society to keep all groupsand individuals within reach of what we expect as a society. It is aboutthe tendency to push vulnerable and difficult individuals into the leastpopular places, furthest away from our common aspirations. It meansthat some people feel excluded from the mainstream, as though they donot belong. For a long time this has meant that inner city areas, andsome large outlying council estates, increasingly vacated by people whocan find an alternative, became a receptacle for problems.
Social exclusion is almost entirely an urban problem. The 100 mostdeprived local authority areas in the country are all urban and the 20most deprived are all in major industrial conurbations and innerLondon. We have to start from where we are – cities concentrate andintensify social problems. The social exclusion agenda is an urbanagenda.
Cities are made up of neighbourhoods and their fortunes arelocked together. The success of cities depends on successfulneighbourhoods, and therefore the urban agenda – an attempt to reversethe urban exodus and overcome social exclusion – focuses onneighbourhoods as well as cities and regions. They are intrinsicallyinterconnected.
Neighbourhoods are physical areas within which people organisetheir lives, base a significant portion of their social time and thereforeconnect with the world outside the home. Urban neighbourhoodsusually cover around 2000 homes, 5000 people, a typical primary schoolcatchment. Neighbourhoods often have sharp boundaries, eitherphysical or atmospheric, but the layers of neighbourhood life are like anonion with a tight core and a loose outer skin.
Neighbourhoods have three interlocking aspects: the home andimmediate surroundings – the elements people pay as much as they canto secure; services such as shops and schools which reflect the socialcomposition of the neighbourhood; and the neighbourhoodenvironment, giving an intangible but powerful signal of who we areand how we should behave. Neighbourhoods offer a sense of familiarityand security to the people who live there, which counters fear of theunknown, even where the neighbourhood is poor, run-down orunpopular.
2
Neighbourhoods can break down if the three elements – home,services, environment – are disrupted to a point where securitydisintegrates. If decline is very rapid, then even the sense of familiaritycan go. It is the issue of neighbourhood breakdown and rescue thatconcerns government because school failure and crime – their top socialpreoccupations – are neighbourhood problems. Poor education andcrime fuel the movement outwards, creating large rifts in society andleaving much poorer neighbourhoods behind. It is this cleavage thatdrives the high political support for the Social Exclusion Unit’s daringattempt to “bring Britain together” (SEU, 1998). So complex is the taskthat the government had to set up eighteen policy action teams drawnfrom the very top of Whitehall and from residents in some of the poorestestates to dissect the multiple problem and draw them together. But“joining up” multiple, long running problems can compounddifficulties. And linking very poor areas to the mainstream has failed inthe past precisely because it is so difficult.
Area problems – people or place?
Will we succeed where the Americans have failed so disastrously?In America individual success is more important than area
conditions, with the consequent acceptance of appalling inner cityghettos, high levels of violence and many human casualties. A strongracial divide is tolerated in the belief that individuals can progress out ofghettos.
In Europe, including Britain, success is more commonly measuredby area improvement alongside individual progress. This seems a morelogical approach since there is little doubt that areas affect people as wellas people affecting areas. The strongest and simplest proof of theinteraction of people and areas lies in the very different cash values thatattach to near-identical properties in different types of area.
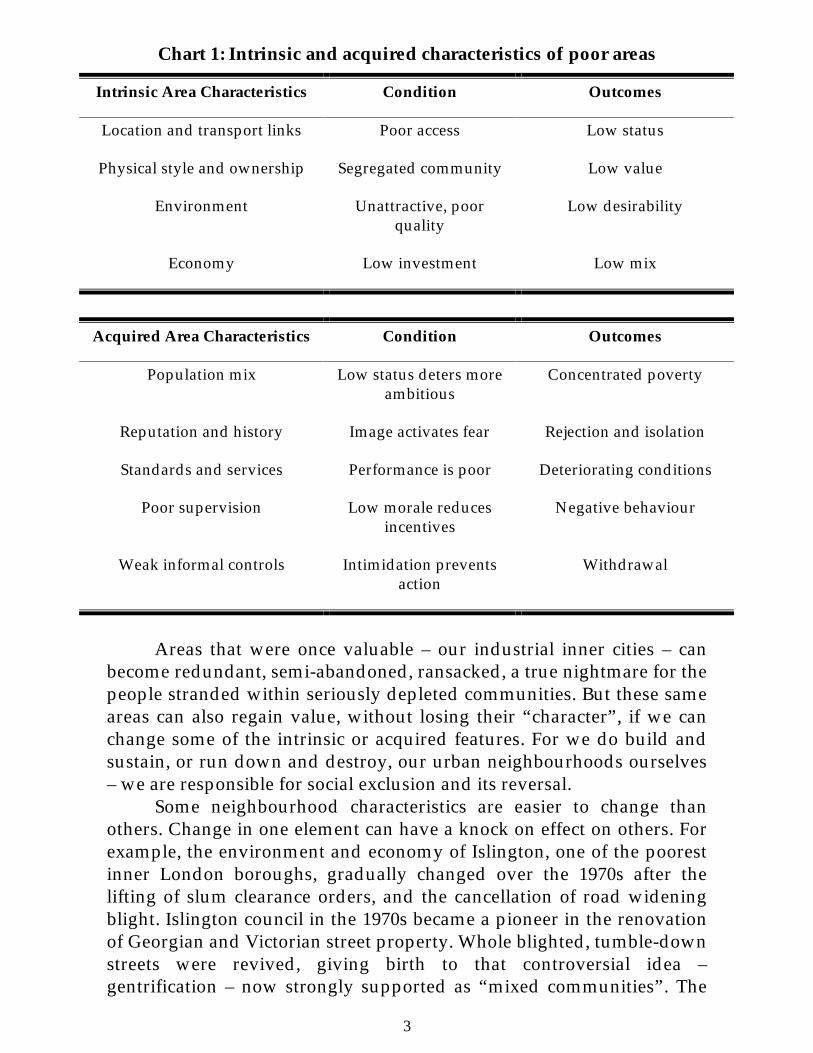
Property values are dictated by neighbours and neighbourhoods –in other words the character of an area influences our choice, as much aswho we are influences where we can choose to live. Some places areinherently difficult and unattractive to live in; this impacts strongly onpeople, determining who moves in, who stays and who moves out,creating people-based characteristics, alongside physical conditions.Chart 1 show this interaction of inherent and acquired areacharacteristics, making people and place equally important in thecreation of and struggle against social exclusion. Areas often have a mixof these characteristics, occasionally all the characteristics are clusteredtogether.
3
Chart 1: Intrinsic and acquired characteristics of poor areas
Intrinsic Area Characteristics Condition Outcomes
Location and transport links Poor access Low status
Physical style and ownership Segregated community Low value
Environment Unattractive, poorquality
Low desirability
Economy Low investment Low mix
Acquired Area Characteristics Condition Outcomes
Population mix Low status deters moreambitious
Concentrated poverty
Reputation and history Image activates fear Rejection and isolation
Standards and services Performance is poor Deteriorating conditions
Poor supervision Low morale reducesincentives
Negative behaviour
Weak informal controls Intimidation preventsaction
Withdrawal
Areas that were once valuable – our industrial inner cities – canbecome redundant, semi-abandoned, ransacked, a true nightmare for thepeople stranded within seriously depleted communities. But these sameareas can also regain value, without losing their “character”, if we canchange some of the intrinsic or acquired features. For we do build andsustain, or run down and destroy, our urban neighbourhoods ourselves– we are responsible for social exclusion and its reversal.
Some neighbourhood characteristics are easier to change thanothers. Change in one element can have a knock on effect on others. Forexample, the environment and economy of Islington, one of the poorestinner London boroughs, gradually changed over the 1970s after thelifting of slum clearance orders, and the cancellation of road wideningblight. Islington council in the 1970s became a pioneer in the renovationof Georgian and Victorian street property. Whole blighted, tumble-downstreets were revived, giving birth to that controversial idea –gentrification – now strongly supported as “mixed communities”. The
4
loss of light engineering was replaced by a booming service economy.Islington is still the 10th most deprived local authority in the country butit no longer has the intense concentrations of the poorestneighbourhoods that it had because area conditions have changed.
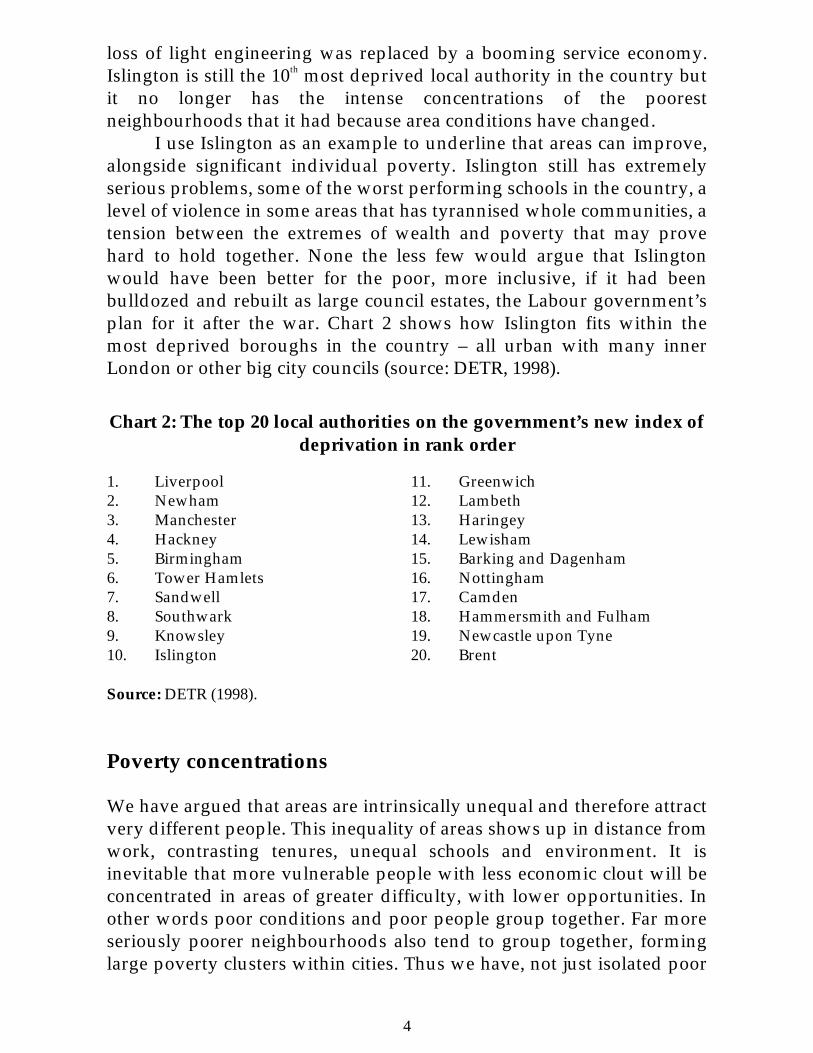
I use Islington as an example to underline that areas can improve,alongside significant individual poverty. Islington still has extremelyserious problems, some of the worst performing schools in the country, alevel of violence in some areas that has tyrannised whole communities, atension between the extremes of wealth and poverty that may provehard to hold together. None the less few would argue that Islingtonwould have been better for the poor, more inclusive, if it had beenbulldozed and rebuilt as large council estates, the Labour government’splan for it after the war. Chart 2 shows how Islington fits within themost deprived boroughs in the country – all urban with many innerLondon or other big city councils (source: DETR, 1998).
Chart 2: The top 20 local authorities on the government’s new index ofdeprivation in rank order
1. Liverpool2. Newham3. Manchester4. Hackney5. Birmingham6. Tower Hamlets7. Sandwell8. Southwark9. Knowsley10. Islington
11. Greenwich12. Lambeth13. Haringey14. Lewisham15. Barking and Dagenham16. Nottingham17. Camden18. Hammersmith and Fulham19. Newcastle upon Tyne20. Brent
Source: DETR (1998).
Poverty concentrations
We have argued that areas are intrinsically unequal and therefore attractvery different people. This inequality of areas shows up in distance fromwork, contrasting tenures, unequal schools and environment. It isinevitable that more vulnerable people with less economic clout will beconcentrated in areas of greater difficulty, with lower opportunities. Inother words poor conditions and poor people group together. Far moreseriously poorer neighbourhoods also tend to group together, forminglarge poverty clusters within cities. Thus we have, not just isolated poor

5
neighbourhoods, but whole swathes of cities dominated by exclusionaryproblems.
We have identified the 5% of wards with the highest levels ofworkless households and the highest concentrated deprivation, based onwhat the population as a whole believes is the minimum necessary toescape deprivation (Glennerster et al, 1999). The concentration of povertyand worklessness within the poorest areas is double the nationalaverage. Chart 3 shows this (Source: Glennerster et al., 1999). Thispattern is constantly substantiated in government research (DETR, 1998).Poor areas are much more deprived on all measures of deprivation thanother more popular areas.
There are strong regional differences in the concentrations ofpoverty. Extremely high concentrations in Merseyside and lowconcentrations in East Anglia indicate strong economic forces – anintrinsic characteristic – driving the concentrations within certainregions. The position of London is extremely important. In spite ofhaving 12 of the 20 most deprived boroughs in the country, its core andouter areas are so much more affluent than the country as a whole thatLondon overall does as well as Wales. One important factor is that inspite of big poverty concentrations in some parts of inner London, richand poor seem willing to live in close proximity if conditions are right.
Chart 3: The poorest wards in England and Wales
0
5
10
15
20
25
30
35
40
45
50
% work-poor households % deprived households
Poorest wards England and Wales

6
This is important. Chart 4 shows the regional concentrations of poverty(source: CASE, 1998).
The clustering of poverty areas is so strong in some cities that largecontinuous tracts of concentrated poverty develop. Only 40 of the 284highest poverty wards in the country are ‘lone’ wards within a localauthority. The rest are grouped in 51 “poverty clusters” within cities.Most areas of the country do not have any high poverty wards, thoughmost have smaller poorer neighbourhoods.
Clustering is by definition an urban problem. Our work showsthat 91% of the people living in poverty wards are concentrated in innercities, industrial and ex-industrial areas, inner London and ex-coalmining areas. Chart 5a underlines the large numbers of people groupedwithin poverty clusters, over quarter of a million in Liverpool. Chart 5bshows the proportion of some borough populations concentrated inpoverty clusters. In Tower Hamlets it reaches 57% (source: CASE, 1998).
Chart 4: Percentage regional population living in poverty wards
0
5
10
15
20
25
30
Merseyside
North East
North W
est
Yorkshire & Humberside
West Midlands
WalesLondon
East Midlands
South West
South East
Eastern

7
Chart 5: Examples of large clusters of poverty wards in continuoustracts
(a) Numbers of people in poverty cluster
0
50,000
100,000
150,000
200,000
250,000
300,000
Liverpool / Know sley Manchester Tow er Hamlets Hackney
Population of largest poverty cluster in borough
(b) Percentage of borough population in poverty cluster
0
10
20
30
40
50
60
Liverpool/Know sley Manchester Tow er Hamlets Hackney
% of total LA population in poverty w ards

8
The impact of poverty clusters in cities
Clusters of poverty matter because all the disadvantages associated withpoverty are more concentrated and more extensive, therefore escapebecomes more difficult. Large poverty clusters within cities often have along history and attract powerful stigma, making them hard to change.They work to limit people’s chances in many ways:� there are less obvious routes out, so more people feel trapped;� depression and low morale are more common, resulting in lower
levels of organisation and initiative and higher levels offrustration, aggression and other negative behaviour;
� parenting is more difficult because of this;� children’s social learning is heavily influenced by surroundings
and negative examples;� schools suffer from low expectations resulting in lower
performance and lower employment prospects; they also suffermore disruptive behaviour and higher pupil turnover;
� the high concentration of low-skilled people leads to intensecompetition for a shrinking pool of low-skill jobs, resulting inlower wages and often complete withdrawal from the labourmarket;
� the difficulties in accessing jobs help create high levels of earlyretirement, disability and economic inactivity;
� lower cash incomes affect shops and other services as well as homeconditions and ability to support extra activities.The larger and longer running the area problems, the stronger the
cumulative impact becomes, leading to the flight of those more able togo and gradual loss of control resulting from chronic instability. Tippinginto chaotic decline becomes more likely as the backbone of aneighbourhood weakens. This makes some areas subject to eventualabandonment (CASE, 1998).
These ‘clustering’ impacts on people’s life chances and onneighbourhood conditions have wider consequences. Being poor in anarea with many poor people and poor conditions generates a gradualloss of confidence in ‘the system’. In the largest poverty cluster inNewcastle for example, only one in ten people vote. In Hackney andLiverpool the performance of local government has been a source ofscandal over several decades. Area depletion leads to inadequatepolitical representation and reduced competition for the role ofCouncillor. This is now a serious problem in the poorest inner cityauthorities including inner London. Many conventional forms ofinvolvement do not operate. A sense of failure, rejection and shame over
9
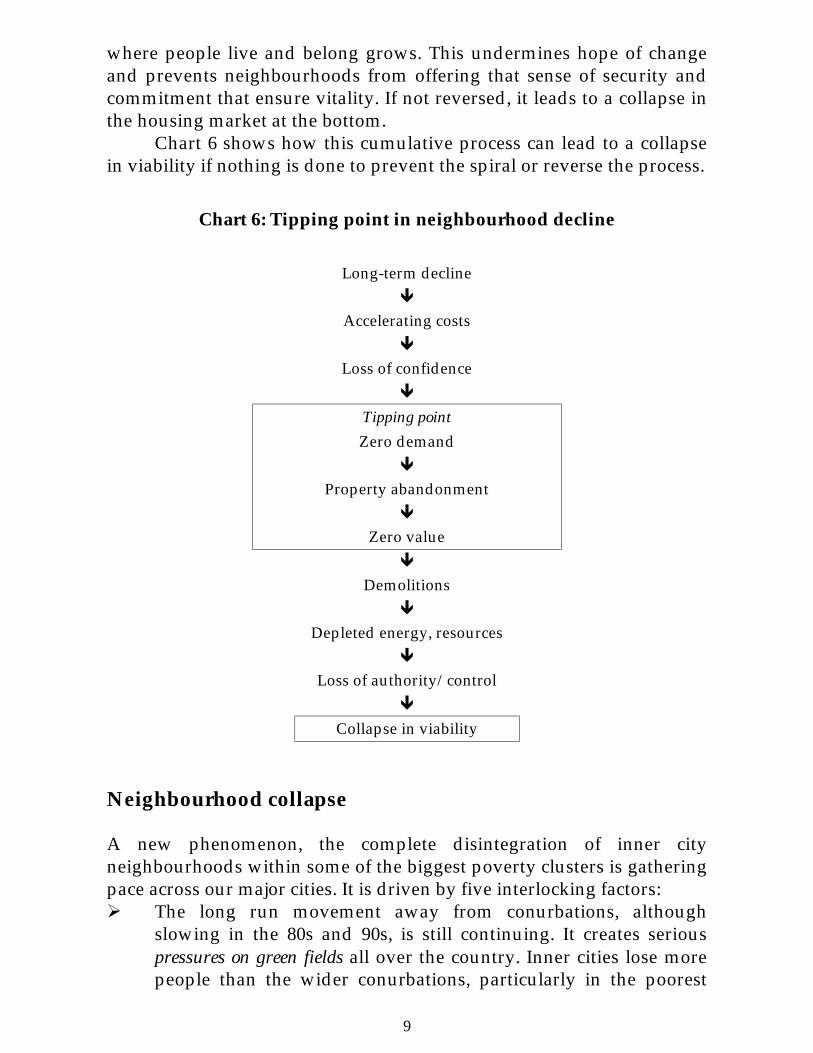
where people live and belong grows. This undermines hope of changeand prevents neighbourhoods from offering that sense of security andcommitment that ensure vitality. If not reversed, it leads to a collapse inthe housing market at the bottom.
Chart 6 shows how this cumulative process can lead to a collapsein viability if nothing is done to prevent the spiral or reverse the process.
Chart 6: Tipping point in neighbourhood decline
Long-term decline�
Accelerating costs
�
Loss of confidence�
Tipping point
Zero demand�
Property abandonment
�
Zero value
�
Demolitions
�
Depleted energy, resources�
Loss of authority/control
�
Collapse in viability
Neighbourhood collapse
A new phenomenon, the complete disintegration of inner cityneighbourhoods within some of the biggest poverty clusters is gatheringpace across our major cities. It is driven by five interlocking factors:� The long run movement away from conurbations, although
slowing in the 80s and 90s, is still continuing. It creates seriouspressures on green fields all over the country. Inner cities lose morepeople than the wider conurbations, particularly in the poorest

10
neighbourhoods. Whole streets and estates in towns of the NorthWest, North East, West Midlands, South Wales, Yorkshire,Humberside and Clydeside are emptying. But the migrationoutwards is selective.
� Cities have double the proportion of council housing and half theproportion of owner occupation compared with the nationalaverage. In the poorest neighbourhoods three-quarters or more ofhomes are for rent, compared with a third elsewhere. This helpsexplain many of the large poverty clusters. Demolition of large,unpopular, under-occupied council estates has accelerated in the90s, including in London. Large estates of social housing aredifficult to manage and often difficult to live in, particularly forfamilies with children. Council estates have become increasinglyunpopular and stigmatised as they became tied to slum rehousing,then became housing of last resort for people who might otherwisebecome homeless. By the 1980s, a vast stock of about 10,000 largecouncil estates – nearly 4 million homes – was seen as a fail-safe tohouse the poor in an increasingly unequal society. The low level ofmanagement and repair both reflect and help cause this negativeimage.
� Many people are unwilling to risk ownership in the most acutelydeclining areas, even when good quality houses with gardenscarry massive discounts under the Right to Buy for council tenants.The concentrated poverty prevents many from considering it sincethe resale value is often zero. Therefore few risk buying. In theareas where owner occupation is most needed to hold ontoaspiring households, there is too little real opportunity to buy.
� The collapse of major industries and the outward flow of newinvestment to the greener and more spacious city hinterland hasdevastated city job markets. In cities like Manchester, Glasgow andNewcastle, up to three-quarters of manual jobs have gone.Hackney has one of the highest unemployment rates in thecountry. A large population of low-skilled unemployed males istrapped, while women take up many of the new, often part-time,service jobs. Better off people leapfrog the city and commute in,rather than live within declining neighbourhoods. Neighbourhoodpolarisation then becomes extreme.
� The loss of traditional patterns of work, family and neighbourhoodhas fuelled the breakdown of social infrastructure. Educationalperformance in only one fifth the national average, while crime,and particularly violence can be four times higher (Power andTunstall, 1995). Truancy, disorder and youth disaffection

11
undermine efforts at improvement in schools (Power and Tunstall,1997). Security is minimal and most forms of guarding such ascaretaking have been cut or withdrawn.The live political debate on social exclusion constantly returns to
conditions within these poorest areas, because multiple problems are sohighly concentrated within them. The much higher incidence ofneighbourhood conflicts, anti-social behaviour, youth crime, streetdisorder, disrupted classrooms, shuttered shop-fronts and abandonedproperty in poorer neighbourhoods is reflected in much higher levels ofneighbourhood dissatisfaction (Urban Task Force, 1999). It follows thecollapse in confidence and informal controls.
An area can slide from marginal viability towards cumulativecollapse. It can happen in deprived areas of prospering cities such asLondon as well as in declining industrial areas, such as Manchester orNewcastle. It is a problem across cities world-wide as their fortunes riseand fall but it is most acute in older industrial cities, such as in Britain.The Crime and Disorder Act of 1998 proposed significant new powers torestrain anti-social behaviour and serious child offending, preciselybecause social conditions have disintegrated in some of the highestpoverty areas (Power and Mumford, 1999).
David Blunkett and Jack Straw have provoked considerablepolitical controversy around the new powers to evict families for anti-social behaviour. The truth is that social controls have broken down tosuch a point that only strong security and enforcement measures cancontain the fall-out. On their own, these powers are of courseinsufficient. But they do give a powerful signal to an intimidatedcommunity that the wider society cares. The Act also uses the law moreeven-handedly than in the past to protect vulnerable groups withinvulnerable areas from gross abuse, usually by criminals. It is animportant beginning to the process of inclusion and greater equality.

12
Abandonment
Within declining inner neighbourhoods we now experience acceleratingturnover of occupants and growing empty property; private withdrawaland growing empty spaces; trouble in the vacuum of collapsingdemand. Council tenants generally move less often than other people,but in cities they move more frequently and in the poorestneighbourhoods, most frequently of all. The instability can becomeunmanageable as chart 7 suggests (source: Power and Mumford, 1999).
In practice many estates are already so unpopular as to be non-viable. Only the very poor, the most vulnerable, move in to replace themore ambitious, more stable residents who feel forced to move in searchof greater security. Once abandonment gathers pace it affects all tenures.Some new housing association property has already been demolished incites in the North through a collapse in demand. Owner occupied streetsare also being demolished and some abandoned properties are takenover by private landlords, then let on 100% government subsidy throughhousing benefit. Chart 8a shows the accelerating pace of abandonmentover two years in 4 council estates in Newcastle and Manchester. Chart8b shows the extraordinary high levels of abandonment among privatelandlords and housing associations in the same neighbourhoods (Source:Power and Mumford, 1999).
Chart 7: Turnover rate in council housing creating severe management problems in the poorest neighbourhoods
0
10
20
30
40
50
60
Nation
al
Man
ches
ter
Newca
stle
Neighb
ourh
ood
A
Neighb
ourh
ood
B
Neighb
ourh
ood
C
Neighb
ourh
ood
D
Neighb
ouho
od E
% r
ate
turn
over
of t
enan
ts

13
Chart 8a: Rapidly accelerating abandonment in 4 small areas of council property in Newcastle and Manchester
0
5
10
15
20
25
30
35
40
Area 1 Area 2 Area 3 Area 4
% empty properties
1996 1997 1998
Chart 8b: Empty housing association and privately owned properties in Newcastle and Manchester
0
10
20
30
40
50
60
Private landlordow ner area 1
Private landlordow ned area 2
Private landlordarea 3
HousingAssociation 1
Housing Assocation2
% e
mpt
y
14
The land problem
The breakdown of inner city neighbourhoods is creating demand for adifferent type of housing in different types of neighbourhood, fuellingplanning pressures, building pressures and market supply. As a resultland is now being released ahead of demand, anticipating and helpingaccelerate the urban exodus while creating the ugly problem of sprawl.
There is an unsustainable triple process that results from acutearea decline:� thinning out the poorest inner city neighbourhoods which have
lost their original purpose;� depleting older cities more generally;� building outwards on green land at even higher environmental
cost to all.Hence the government’s focus on brown-field reuse, recycling emptyproperty and planning for real households rather than projections(SEU/DETR, 1999a).
Britain is extensively built up around all the major conurbations.The higher the land value, the more carefully we use it. Thus Londonproduces 85% of new units on brown-field sites because there is littlealternative given the distances and the green belt. This explains both thehigh levels of concentrated deprivation and the higher than averagelevel of social mixing in most parts of the capital. London is rapidlyexpanding its use of recycled sites and increasing its generally lowdensity to more sustainable levels. In contrast, Manchester, Birmingham,Newcastle, Glasgow and Liverpool have very large expanses of lowvalue brownfield sites but spread their new buildings into the suburbanand semi-rural hinterland, thus creating intense problems of sprawl, anddepopulation.
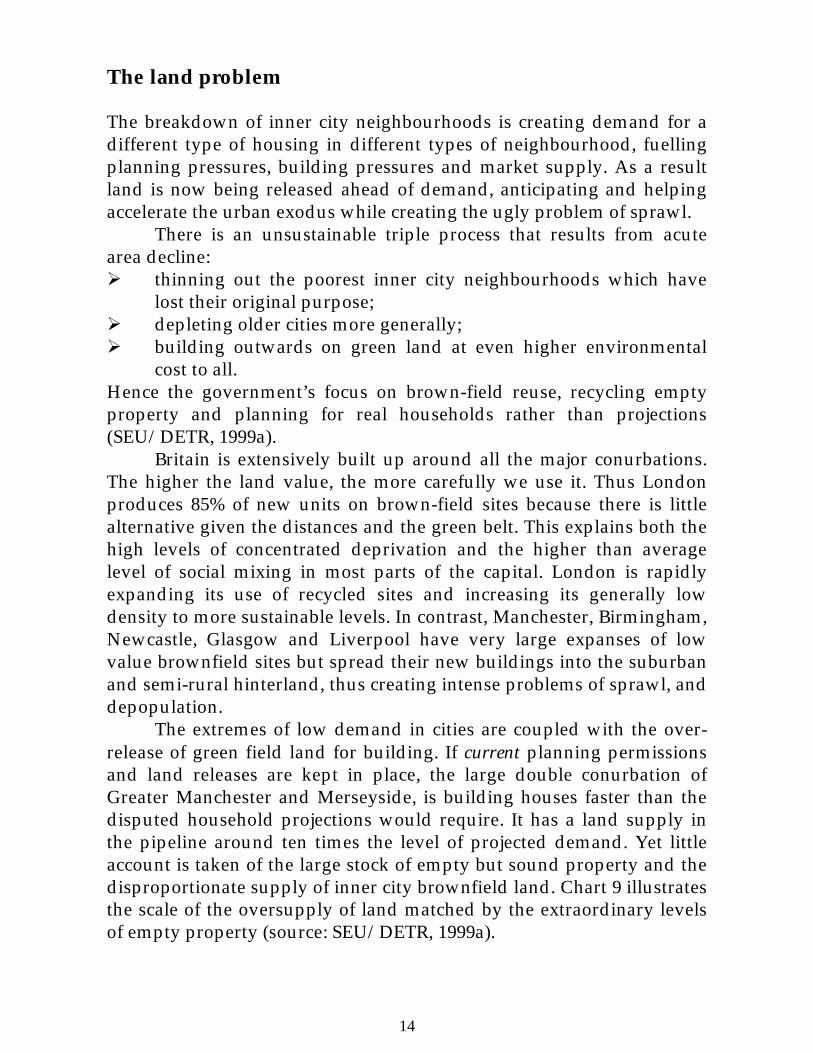
The extremes of low demand in cities are coupled with the over-release of green field land for building. If current planning permissionsand land releases are kept in place, the large double conurbation ofGreater Manchester and Merseyside, is building houses faster than thedisputed household projections would require. It has a land supply inthe pipeline around ten times the level of projected demand. Yet littleaccount is taken of the large stock of empty but sound property and thedisproportionate supply of inner city brownfield land. Chart 9 illustratesthe scale of the oversupply of land matched by the extraordinary levelsof empty property (source: SEU/DETR, 1999a).

15
Urban sprawl is gobbling up land far faster than we want, yet ourplanning system is wedded to mechanistic household projections, lowdensity and the over-release of land, trapped between the powerfullobbying forces of builders, aspiring families, housing providers, ruralprotectionists and urbanites. In our crowded country we continue tospill out of cities, while our depleted inner areas spiral. Therefore urbanproblems lock into the land problem. As long as people with choice canmove out relatively cheaply to safe havens of low density houses, we areunlikely to seek the avant-garde solutions we need to our urbanproblems or to attract sufficient urban pioneers back into the collapsinginner neighbourhoods.
It is an irony of wealthy societies that spreading out from citiesdestroys the two objectives that lower density aims to achieve – moremanageable cities through lower crowding; and easier access to thegreen lungs of the city, the countryside. In practice it results inimpoverished city neighbourhoods and low-density housingdevelopments in green fields. The Urban Task Force argued in its reportto the government this summer that we have no choice but to tackle theland problem and increase density as it affects city neighbourhoods andcountry villages alike.
City neighbourhoods can be too dense, particularly if they arepoor. But our poor neighbourhoods are now too empty, leaving themprey to insecurity, illegal activity and acute depletion of basic services. Ifwe raise our density to a moderate 50 houses per hectare, from our
Chart 9: Figures for housing provision based on household projections, actual building, current planning permissions and empty dwellings
0
5,000
10,000
15,000
20,000
25,000
30,000
35,000
East Lancashire Centre & West of GreaterManchester
Merseyside exclu. St Helens)
Forecast annual increase in householdsderived from Strucutre Plans or UDPs
Annual flow of new dwellings infered by localallocations in development plans
Total outstanding Planning Permissions (atvarious dates in 1998/99
Total vacant dwellings at 1 April 1998 (HIPreturns)
16
current average of less than 25, we will halve at a stroke our use of greenfield land, and begin to recreate a critical mass of people in urban areasthat will reinvigorate public transport, education and other services.Islington has around 100-200 homes per hectare and is lastingly popularas its property values show.
Higher densities work with sensitive, skilled, creative urbandesign. Lower densities often fail through lack of connection. Thegovernment chose Richard Rogers, the international architect, to headup the Urban Task Force, precisely because it recognises that thephysical and the social dynamics of areas go hand in hand.
Solutions
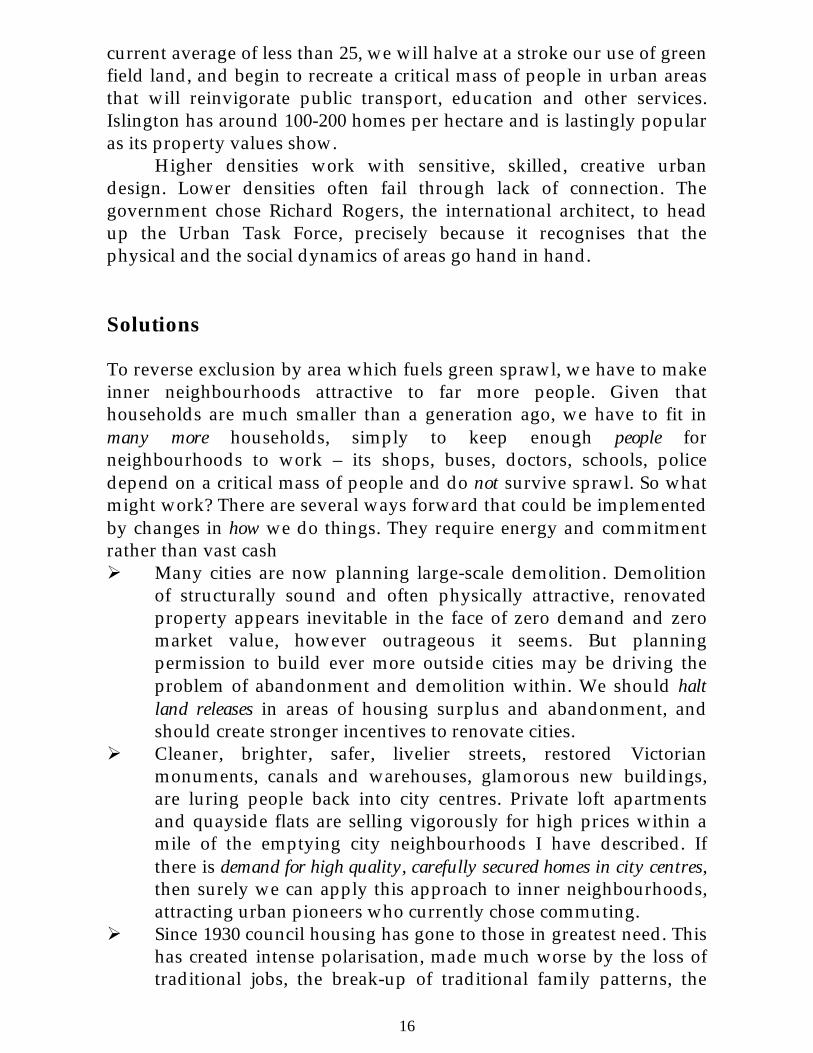
To reverse exclusion by area which fuels green sprawl, we have to makeinner neighbourhoods attractive to far more people. Given thathouseholds are much smaller than a generation ago, we have to fit inmany more households, simply to keep enough people forneighbourhoods to work – its shops, buses, doctors, schools, policedepend on a critical mass of people and do not survive sprawl. So whatmight work? There are several ways forward that could be implementedby changes in how we do things. They require energy and commitmentrather than vast cash� Many cities are now planning large-scale demolition. Demolition
of structurally sound and often physically attractive, renovatedproperty appears inevitable in the face of zero demand and zeromarket value, however outrageous it seems. But planningpermission to build ever more outside cities may be driving theproblem of abandonment and demolition within. We should haltland releases in areas of housing surplus and abandonment, andshould create stronger incentives to renovate cities.
� Cleaner, brighter, safer, livelier streets, restored Victorianmonuments, canals and warehouses, glamorous new buildings,are luring people back into city centres. Private loft apartmentsand quayside flats are selling vigorously for high prices within amile of the emptying city neighbourhoods I have described. Ifthere is demand for high quality, carefully secured homes in city centres,then surely we can apply this approach to inner neighbourhoods,attracting urban pioneers who currently chose commuting.
� Since 1930 council housing has gone to those in greatest need. Thishas created intense polarisation, made much worse by the loss oftraditional jobs, the break-up of traditional family patterns, the
17
rapid expansion of owner occupation and the increase ininequality in the 1980s. Is there a way of preventing ghettoisation?Maximising choice and freedom in council housing, attractingbroader income groups, encouraging family and social ties,increasing security and maintenance, breaking up one-class estatesinto more mixed areas, preventing racial concentrations in theworst estates, are all possible if we change the way council housing isowned, managed and let (Power, 1999).
� Many inner city neighbourhoods have high concentrations ofethnic minorities. These areas are crowded and under pressure;but they tend to be more entrepreneurial than many mainly whiteinner neighbourhoods. The future of cities depends on supportingand integrating minority communities within more vibrant, morepopular neighbourhoods, alongside the often collapsing whiteareas (Power and Mumford, 1999).
� Residents within acutely declining areas face an increasinglyprecarious future. Some argue for new clearances and a clean-sweep approach to regeneration. Many defend theirneighbourhoods and hang on for a better future. Clean sweepsolutions are immensely damaging to community ties, costly andtherefore impossible to implement in the several thousand acutelydeclining neighbourhoods. Holding onto people, developingmicro-initiatives within neighbourhoods, restoring, beautifying andupgrading cities is surely a more realistic vision than the large-scaledisruption of past and often current urban regenerationprogrammes (Trafford Hall, 1999).
� New Deal for Communities, the government’s neighbourhoodflagship, will help about 50 neighbourhoods – renewalprogrammes only ever target a tiny number at a time. We needpracticable fundable schemes across every town and city in Britain.The Social Exclusion Unit’s “strategy for neighbourhood renewal”should include neighbourhood “supremos” to trouble-shoot and sortproblems out from a local base. They need to be backed byneighbourhood wardens and supercaretakers to secure and sustainimproved conditions (SEU/DETR, 1999b; SEU/DETR, 2000).

18
The government set up the Urban Task Force and the SocialExclusion Unit at different stages in its thinking to propose solutions tothe acute problems of city and neighbourhood decline. As I argued atthe beginning, the future of cities and the future of neighbourhoods aretied together. We cannot win one battle without the other. The SocialExclusion Unit is working on bold solutions that would fit broadly withthe proposals I have outlined. They interlock strongly with the centralmeasures advocated by the Urban Task Force.
Chart 10 summarises some of the main themes and measurespresented by the Urban Task Force to the government. Will thegovernment be brave enough to adopt and implement them?

19
Chart 10: Will the government deliver an urban renaissance? – five key themes and measures from the Urban Task ForceOTECTING LAND
Government will miss its 60% brownfield buildingtarget unless we change how we design and recyclebuildings, neighbourhoods and open spaces.
• Limit green field land releases – stop green field development in low demand regionsand cities
• Increase density to retain population with smaller households• Co-ordinate land releases within regions to prevent over supply and city
depopulationCYCLING LAND AND BUILDINGS
Derelict, underused, contaminated land and empty,under-occupied buildings create hollow cities. Insecure,neglected environments fuel the urban exodus. Higherdensity around existing open spaces makes urban areasmore lively, attractive, secure and affordable.
• Design at moderate density to recycle more land and buildings and attract morepeople to cities – 50 units per hectare
• Increase incentives for recycling – equalise VAT on new build & renovation• Clean up all contaminated land by 2030• Expand urban design skills
BLIC AND PEDESTRIAN TRANSPORTCities are difficult to move around and live in. A hugeincrease in cars and plummeting journeys on foot, bycycle or bus have made urban neighbourhoods less safefor families, young and elderly households. Commutingmay create gridlock.
• Target 65% of transport spending on public, pedestrian and cycle journeys• Introduce 20 m.p.h. speed limits in residential neighbourhoods• Create Home Zones to give pedestrians full right of way and make streets safer for
children• Integrate environmental and transport plans with development plans
CIAL PROBLEMS AND URBAN MANAGEMENTOur cities are insecure, dirty, poor. Bad schools andinadequate policing drive people out. The bureaucraticand fragmented role of local authorities weakens urbanmanagement and regeneration. It makes joined upaction to improve towns and cities difficult. Councilestates dominate the poorer urban areas and needspecial measures.
• Strengthen the strategic and enforcement roles of local authorities• Open up council housing to a broader band of the population• Encourage mixed income, mixed use, integrated areas – attract private alongside
public investment• Create neighbourhood management for inner areas, backed by wardens and
supercaretakers• Invent new approaches to school, police & other social problems
VIRONMENTLand is scarce in our crowded island. Many find citiesand towns decayed, unattractive, congested. Specialprotections are vital. People want green and safeenvironments.
• Protect green and open spaces with special measures• Introduce environmental impact fees to minimise damage• Mandate energy and environmental ratings for all homes• Change the real cost of new development
20
References
CASE (1998), Persistent Poverty and Lifetime Inequality: The Evidence.Proceedings from a workshop held at HM Treasury, chaired byProfessor John Hills, CASEreport 5, London School of Economics,and HM Treasury Occasional Paper No.10
DETR (1998), Index of Local Deprivation. London: DETR
Glennerster, H, Lupton, R, Noden, P and Power, A (1999), Poverty, SocialExclusion and Neighbourhood: Studying the area bases of socialexclusion, CASEpaper 22, London School of Economics
Power, A (1999), Estates on the Edge. London: Routledge
Power, A and Mumford, K (1999), The Slow Death of Great Cities: Urbanabandonment or urban renaissance. York Joseph RowntreeFoundation
Power, A and Tunstall, R (1995), Swimming Against the Tide. York: JosephRowntree Foundation
Power, A and Tunstall, R (1997), Dangerous Disorder. York: JosephRowntree Foundation
SEU [Social Exclusion Unit] (1998), Bringing Britain Together: NationalStrategy for Neighbourhood Renewal. London: The Stationary Office
SEU/DETR (1999a), Unpopular Housing: National Strategy forNeighbourhood Renewal, Report of Policy Action Team 7. London:DETR
SEU/DETR (1999b), National Strategy for Neighbourhood Renewal – Reportof Policy Action Team 5: Housing Management. London: DETR
SEU/DETR (2000), National Strategy for Neighbourhood Renewal – Report ofPolicy Action Team 4: Neighbourhood Wardens. London: DETR(forthcoming)
Trafford Hall (1999), Annual Report. Chester: Trafford Hall
Urban Task Force (1999), Towards an Urban Renaissance. London: DETR
21
The State of American Cities
William Julius Wilson
I am very pleased to have the opportunity to address a topic that I amsure will receive increasing attention in the next century – the state ofAmerican cities. And one of the issues that will be repeatedlyemphasised is city-suburban co-operation. Why? Because “metropolitansolutions have been rediscovered as an answer to the common problemsof America’s cities and suburbs” (Katz, 1999: 1). There are three mainreasons for this rediscovery:(1) the recognition that metropolitan areas constitute the real
competitive units in the new economy;(2) the growing awareness that complex issues such as air quality and
traffic congestion cross political boundaries and are immune tolocalised fixes; and
(3) the co-existence of persistent joblessness in the central cities andlabour shortages in the suburbs (Katz, 1999).The major factor unifying the new push for metropolitan solutions
is the relentless decentralisation of economic and residential life in theUnited States. At the metropolitan fringe, shopping malls, housingsubdivisions, industrial clusters, and corporate offices grow at anincredible rate. Accordingly, in the new economy, rapidly developingsuburbs have become the locus of population growth, employmentgrowth, and wealth creation (Katz, 1999). The older areas – central citiesand inner-ring suburbs – are left behind with growing concentrations ofpoverty, particularly minority poverty, and “without the fiscal capacityto grapple with the consequences: joblessness, family fragmentation, andfailing schools” (Katz, 1999: 1).
Since 1960, the proportion of whites inside central cities hasdecreased steadily, while the proportion of minorities has grown. In1960, the U.S. population was evenly divided among cities, suburbs, andrural areas. By 1990, the proportion of residents living in both cities andrural areas had declined significantly so much so that the suburbscontained nearly half of the nation's population. Urban residents dippedto only 31 percent of the U.S. population by 1990. Urban areasexperienced their greatest population losses in the decade of the 1970s,when central city populations nation-wide barely grew and many large
22
cities suffered substantial declines in population (U.S. Department ofHousing and Urban Development, 1999).
But, things are beginning to change. Although 14 of the nation’s 30largest cities continued to lose residents during the 1990s, the rate ofdecline has been slower than in previous decades. For example, Detroitlost more than one-third of its residents during the 1970s and 1980s, butless than 3 percent from 1990 to 1996. Cleveland too lost more than one-third of its residents between 1970 and 1990 but experienced very slightpopulation declines since then. Chicago lost 18 percent of its populationfrom 1970 to 1990, but only 2.3 percent between 1990 and 1996.Moreover, six major central cities that experienced losses in the 1970sgained residents in the 1990s, including cities like New York, SanFrancisco and Seattle whose populations have been replenished bysignificant immigration in the 1980s and 1990s (U.S. Department ofHousing and Urban Development, 1999).
Between 1981 and 1996, more than 13 million immigrantscame to the United States – the most since the last greatimmigration waves at the turn of the 20th century (U.S.Department of Housing and Urban Development, 1999: 19).
Moreover, the relative rate of suburbanisation has slowed. From1970 to 1980, more than 95 percent of the total metropolitan growthnation-wide was in the suburbs. The suburban share of metropolitangrowth remains large, but by 1996 it had dipped to 77 percent (U.S.Department of Housing and Urban Development, 1999).
Nonetheless, despite the decline in population lost in the majorU.S. central cities and despite the slowing of suburbanisation, manysmall and mid-sized cities in the United States continue to be plaguedwith serious population lost, even though the overall U.S. populationgrew rapidly from 1980 to 1996. In the United States as a whole, aboutone in five central cities continues to suffer serious population loss and asubstantial majority of these are small or mid-sized cities, such as EastSt. Louis, Illinois, Gary, Indiana, Johnstown, Pennsylvania, Youngstown,Ohio, Wheeling, West Virginia, and St. Louis Missouri, cities whichrecorded population losses ranging from 22 to 30 percent from 1980 to1996.
Shrinking cities tend to have higher rates of poverty andunemployment than central cities with a growing or stablepopulation base(U.S. Department of Housing and UrbanDevelopment, 1999: 24).

23
The overall relative decline in the proportion of Americans livingin cities is related to changes in the employment base. Beginning in themid-1970s the employment balance between central cities and suburbsshifted markedly to the suburbs. Manufacturing is now over 70 percentsuburban; wholesale and retail trade is just under 70 percent. Since 1980,over two-thirds of employment growth has occurred outside the centralcity.
As jobs disappear, so does the city’s tax base, which, in large part,consists of commercial property – factories, office buildings, shoppingmalls, and other businesses. The movement of jobs to the suburbs goeshand in hand with the shift of the commercial tax. In the last severalyears, most central cities faced decreasing means to pay for the costs ofschools, welfare, police, and social services. The loss of fiscal capacityand wealth takes its toll over time. For example, six central cities in thestate of Ohio saw their share of the region’s taxable valuation fall from53 percent in 1948 to 22 percent in 1996, while the outer suburbs’ shareexploded from 32 percent to 61 percent during this period (Katz, 1999:4).
If declining opportunities for employment in the central cites havebeen notable, the growth of concentrated poverty has been even moredramatic. High-poverty neighbourhoods, in which at least 40 percent ofthe residents live in poverty, have grown at an alarming rate. Between1970 and 1990, the population in the high poverty metropolitanneighbourhoods – be they black ghettos, Latino barrios, or even whiteslums – grew by 92 percent. Eight million people now live in these high-poverty metropolitan areas, and nearly all the growth in poverty-impaired areas has occurred in central cities and inner-ring suburbs,which suffer from middle-class flight and commercial decay (Jargowsky,1997).
It is important to note that the increase in the number of residentsin high-poverty neighbourhoods – and especially in black ghettos, whichaccount for roughly half of all high-poverty areas – is strongly related tothe geographical spread of these neighbourhoods. In other words, thenumber of persons living in ghettos grew not because more peoplemoved into them, “but because the poverty spread to more and moreneighbourhoods”(Jargowsky, 1997: 35).
The exodus of the non-poor from mixed income areas was a majorfactor in the spread of ghettos during the 1970s.
The geographic spread of poverty neighbourhoods also has apowerful impact on the way others perceive the magnitude of theproblems of urban privation and decay. As middle-and working-class

24
citizens classify more and more city neighbourhoods as “dangerous”,the ghetto tracts fall into a seemingly irreversible isolation. How far outof the way will citizens drive to avoid these areas (Jargowsky, 1994)?
Finally, the increased concentrations of poverty have resulted inhigher taxes for the people and businesses that remain in cities. Risingtaxes increase the incentives of well-paid individuals and businesses toleave the city. As Bruce Katz of the Brookings Institution puts it:
the growing spatial isolation of the urban poor and thecontinued exodus of middle class families and low-skilledjobs to the outer fringes of metropolitan areas fuel apowerful dynamic of urban decline that is hard to break(Katz, 1999: 7).
The demographic changes in American cities are related to thecities declining influence in the determination of domestic policy, andthese changes contributed to the rise of the New Federalism. Beginningin 1980, the federal government drastically decreased its support forbasic urban programs. The Reagan and Bush administrations –proponents of the New Federalism, which insisted on localisedresponses to social problems – sharply cut federal spending on direct aidto cities, including general revenue sharing, urban mass transit, publicservice jobs and job training, compensatory education, social serviceblock grants, local public works, economic development assistance, andurban development action grants (Caraley, 1992). In 1980 the federalcontribution to city budgets was 18 percent; by 1990 it had dropped to6.4 percent.
In general, state governments have not compensated cities forthese cuts in direct federal aid. City governments have therefore had torely increasingly on local taxes. But as economic activity and wealthshifted increasingly to the suburbs, incomes in cities declined. Note thatin 1973 average per capita income between cities and suburbs wasnearly equal; by 1989 the average city income had dipped 16 percentbelow that of the suburbs (U.S. Department of Housing and UrbanDevelopment, 1997). With a declining tax base and loss of federal funds,many city governments experienced difficulty in raising sufficientrevenue to pay the cost for basic services. Cities often avoidedbankruptcy court by cutting services. For example, many public schoolswere unable to upgrade their facilities, attract talented administratorsand teachers, or even purchase new textbooks throughout the 1980s(U.S. Department of Housing and Urban Development, 1997).
25
As the social and political forces turned against the cities,businesses became more reluctant to invest in urban areas. All of thesesocial and economic changes have resulted in a decline in the quality ofurban life. Pollution has spread and services have fallen away. Andalthough violent crime and drug use and abuse have decline in the lastfew years, the city is still perceived by many as a dangerous place to live(U.S. Department of Housing and Urban Development, 1997). For allthese reasons many urban residents, especially those in the nation’slargest cities, moved, if they had the choice, to outlying sections ofmetropolitan areas.
From 1989 to 1996, more than twice as many upper- and middle-income households (7.4 million) left cities for suburbs, as did those thatmoved from suburbs to cities (3.5 million). The central cities in theUnited States have become the home of a growing proportion of thosewho make use of welfare, subsidised medical assistance, and other socialservices. The proportion of central city population who are poorincreased from 14.2 percent in 1970 to 19.6 percent in 1996 (Katz, 1999).Minorities are disproportionately represented among those withincomes below the officially designated poverty line
The political fragmentation of many metropolitan areas in theUnited States has contributed to the problems of joblessness and relatedsocial dislocations of the inner-city poor. As David Rusk (1993), theformer mayor of Albuquerque has pointed out, because the older citiesof the East and the Midwest were unable to expand territorially throughcity-county consolidation or annexation, they failed to reap such benefitsof suburban growth as the rise of shopping malls, offices, and industrialparks in new residential subdivisions. As areas in which poor minoritieslive in higher and higher concentration, these cities face an inevitabledownward spiral because they are not benefiting from suburbangrowth. Rusk argues, therefore, that neighbourhood revitalisationprograms, such as community development banks, non-profit inner-cityhousing developments, and enterprise zones, will not be able
to reverse the downward slide of inner cities” if they are notcarried out within “a framework of actions to bring downthe walls between city and suburb (Rusk, 1993: 121).
Efforts to promote city and suburban co-operation will not benefitcities alone. There is growing evidence that cities and suburbs areeconomically interdependent. For example, recent research indicatesthat the higher the ratio of city to suburb per capita income, the higherthe percent of metropolitan employment growth and income growth,

26
and the greater the increase in housing values. Moreover, researchreveals that improvements in central city capital stock also increasessuburban housing values suggesting, as one author put it, “thatsuburban residents may have an incentive to increase contributionstoward city infrastructure” (Gottlieb, 1998). Furthermore, researchindicates that the reduction of central city poverty is associated withincreases in metropolitan income growth, and that central city jobgrowth increases the value of suburban properties (Gottlieb, 1998).
In the global economy, metropolitan regions continue to competefor jobs. There is a growing awareness in the United States that in an eraof low transportation and information costs, high mobility and intenseglobal competition, a metropolitan region is at a severe competitivedisadvantage if it lacks a healthy urban core.
In a global economy, firms choose among regions – and thehealth of the central city is a key factor in deciding whichregion is best. Even firms that choose to relocate to thesuburbs will choose areas surrounding a vibrant central city(U.S. Department of Housing and Urban Development, 1999:19).
Metropolitan areas that will remain or become competitive arethose with a well-trained workforce, good schools, a concentration ofprofessional services, first-class hospitals, a major university andresearch centre, and an efficient transportation network to linkexecutives with other parts of the United States and with countriesaround the world. However, many of these elements cannot come solelyfrom suburbs. They require a viable central city (Bok, 1994). It isimportant for Americans to realise that city-suburban integration is thekey to the health of metropolitan regions and to the nation as a whole.
Bruce Katz and Jennifer Bradley have remarked that “so much ofthe unhappiness of the cities is also the unhappiness of the suburbs”(Katz and Bradley, 1999). The image of the metropolitan area is changingin the United States. The familiar perception of a beleaguered urban coresurrounded by prosperous suburbs is giving way to a new picture of themetropolitan area in which both urban and suburban communitiessuffer from rapid growth in places that are undeveloped and slowergrowth or even absolute decline in older areas. A growing number ofobservers now think about cities and suburbs as related, not antithetical,as comprising a single economic and social reality. This vision is calledmetropolitanism (Katz and Bradley, 1999).
27
The vision of metropolitanism recognises that the dichotomybetween cities and suburbs is frequently drawn too sharply, oftenleading one to overlook the new reality: namely, that suburbs today arenot an undifferentiated band of safe and prosperous white,communities. Indeed, there are two major kinds of suburbs. On the onehand, there are the older inner-suburbs frequently adjacent to the city.They feature crumbling tax bases, growing concentrations of poorchildren in the public schools, eroding job markets, population decline,crime, disinvestment and increasingly deserted commercial districts. Onthe other hand, there are the newer or outer suburbs. They are gainingeconomically, but they are “straining under sprawling growth, thatcreates traffic congestion, overcrowded schools, loss of open spaces, andother sprawl-related problems and a lack of affordable housing” (U.S.Department of Housing and Urban Development, 1999: 31). As Katz andBradley put it they are
choking on development, and in many cases the localgovernments cannot provide the services that residents needor demand (Katz and Bradley, 1999).
The vision of metropolitanism foresees a policy agenda thatchanges the rules of the development game, pools metropolitanresources, gives people access to all areas in the metropolis, and reformsgovernance (Katz and Bradley, 1999). Reforms put forward to achievethe objective of city-suburban co-operation range from proposals tocreate metropolitan governments to proposals for metropolitan tax basesharing, collaborative metropolitan planning, and the creation ofregional authorities to develop solutions to common problems ifcommunities fail to reach agreement.
Among the problems shared by many metropolises is a weakpublic transit system. A commitment to address this problem through aform of city-suburban collaboration would benefit residents of both thecity and the suburbs. Theoretically, everyone would benefit frommobility within the metropolitan areas, and inner-city residents wouldhave greater means to prevent high joblessness.
But, one factor that hinders mobility is urban sprawl. It isgenerally recognised that public investment in core infrastructureimprovements in roads, transit, sewers, and utilities are important forprivate investment. Indeed private investment relies heavily on coreinfrastructure maintenance and improvement (Richmond, 1997). But,what is not generally recognised is that core infrastructure investments,in turn, are dependent on factors of density and distance for their initial
28
feasibility and efficient operation. However, urban sprawl has madepublic investment in core infrastructure more costly and difficult. From1970 to 1990, the urbanised area of American metropolitan regionsexpanded from eight to fifteen times as fast as population growth(Richmond, 1997).
The strains that urban sprawl places on the core infrastructure arefelt in many ways. As industrial and residential development sprawlsacross an ever-broadening geographical area, more transportation costsand inefficiency are imposed on business, more urban minorities arefurther removed from access to jobs, and more pollution and destructionof natural resources occur over a wider area (Richmond, 1997).
Traffic congestion is a worsening problem as sprawl raises thenumber and length of automobile trips. Even minor suburban roadwayshave become channels for thousands of commuters to and from newoffice complexes, factories and shopping malls. Urban road congestionincreased by more than 22 percent between 1982 and 1994, and trafficcongestion grew worse in forty-two major metropolitan areas between1988 and 1994. In the fifty largest metropolitan areas travel delay andadded fuel consumption imposed excess costs of $51 billion in 1993, aincrease of 6 percent from 1992 (Katz, 1999).
Persistent traffic jams used to be a problem in a handful ofcities such as Los Angeles and New York. Now congestedfreeways are a national epidemic (U.S. Department ofHousing and Urban Development, 1999: 36).
Unfortunately, a severely inadequate public transit system in theUnited States not only increases reliance on automobiles, it also makes itdifficult for those without cars, particularly inner-city residents, to get tosuburban jobs. For example, after a one-hour transit commute, welfarerecipients in Boston accessed only 14 percent of the entry-level jobs inthe fast-growth areas in the metropolitan region. In the Atlantametropolitan area less than one-half of the entry level jobs are locatedwithin a quarter mile of a public transit system (U.S. Department ofHousing and Urban Development, 1999).
Racial and ethnic segregation, which restricts minority access tosuburban housing, exacerbated the situation. As a result, AfricanAmericans and Hispanics bear the brunt of employment losses due todiscrepancies in rates of central city and suburban job growth.Moreover, the problems of job mismatch are compounded by shortagesof affordable housing and high rentals in growing suburban areas withbetter job markers.

29
There are also significant fiscal costs associated with urban sprawl.Total spending on bridges, roads, sewers, and other public capitalescalates because of the high cost of extending existing networks andconstructing new systems. Road costs are 25 to 33 percent higher, utilitycosts 18 to 25 percent higher, and municipal and school district operate 3to 11percent higher in communities marked by sprawl than in those thatare sprawl free (U.S. Department of Housing and Urban Development,1999: 35).
However, “the costs of sprawl extend beyond fiscal disparities andracial and social separation. All families living in a region are affected astraffic congestion worsens, open space and farmland vanish, and a senseof community disappears” (Katz, 1999: 1). Even suburbanites see theadverse effects of sprawl on their own lives. Indeed, studies reveal thatan increasing number of both suburban and urban businesses andhouseholds recognise these costs and are interested in changing thepolicies that facilitate urban sprawl (Katz, 1999; U.S. Department ofHousing and Urban Development. 1999 1999).
It seems to me that an on-going public discussion of the effects ofurban sprawl on families, institutions, and neighbourhoods is animportant issue that could bring together groups not only from differentracial and ethnic backgrounds, but from different economic classbackgrounds as well.
I have discussed a vision of metropolitanism, a vision in which themetropolitan region is seen as comprising a single economic and socialreality. People who hold such a vision clearly see the advantages ofovercoming the city/suburban dichotomy. This is perhaps the best timeto promote such a vision in the United States. After years of steadyurban decline, the prolonged economy recovery has recently improvedsituations in central cities making them more attractive as partners inurban/suburban collaborations. Central-city unemployment hasdeclined dramatically from 8.6 percent in 1992 to 5.1 percent in 1998.And unemployment in the nation’s fifty largest cities fell from 8.6percent in 1992 to 4.9 percent in 1998, a decline that exceeded thedecreases in unemployment in the cities’ surrounding suburbs.
The positive effects of these changes are seen in even the mostdepressed parts of the city. A new study by the economists RichardFreeman and William M. Rogers of low-wage workers in 322metropolitan areas, reveals that black men aged 16 to 24 with a highschool education or less—including many with prison records – areemployed in greater numbers, earning larger paycheques andcommitting fewer crimes than in the early 1990s. Although far too many
30
of these young men are still jobless or in prison, the rise in legitimateemployment has accompanied a drop in criminal activity. Indeed, crimehas fallen most rapidly in regions with the sharpest declines injoblessness. (Freeman and Rogers, 1999; Nasar and Mitchell, 1999).Big cities are indeed becoming safer. The FBI crime index dropped 5.8percent between 1994 and 1997 for the nation as a whole, but crime felleven more in cities with a population of over one million, and thesteepest declines were the violent crimes of murder, rape, robbery, andaggravated assault. (U.S. Department of Housing and UrbanDevelopment, 1999: 21-22.).
Another positive sign, as stated previously, is the narrowing gapin population growth between the cities and suburbs. Finally, in manycities fiscal conditions have improved significantly over the past sixyears due to the economic recovery. Wall Street rating bonds issued tofinance infrastructure and other capital improvements in cities havebeen upgraded, a clear reflection of the cities’ improved fiscal outlook.The better rating bonds mean that cities pay investors a lower interestrate for the bonds they sell. The millions of dollars in added revenue canbe used for vital service and infrastructure improvements, investmentsin schools, and even tax cuts for businesses and residents (U.S.Department of Housing and Urban Development, 1999).
Promoters of the vision of metropolitanism need to take advantageof the improving situation in cities. They can advance a more positiveimage of cities as they work to bring about the integration of cities andsuburbs. The future of metropolitan regions in the U. S. as well as thesocial inclusion of its disadvantaged urban residents may very welldepend upon the success of their efforts.
31
References
Caraley, Demetrios (1992), “Washington Abandons the Cities”, PoliticalScience Quarterly, (Spring) 107: 1-30.
Freeman, Richard B. and William M. Rodgers III (1999), “Area EconomicConditions and the Labour Market Outcomes of Young Men in the1990s Expansion”, unpublished manuscript, Harvard University,Cambridge, MA.
Gottlieb, Paul D (1998), The Effects of Poverty on Metropolitan AreaEconomic Performance. A Research Report of the National League ofCities, June.
Jargowsky, Paul (1994), “Ghetto Poverty Among Blacks in the 1980s”,Journal of Policy Analysis and Management, 13: 288-310.
Jargowsky, Paul (1997), Poverty and Place: Ghettos, Barrios, and theAmerican City. New York: Russell Sage Foundation.
Katz, Bruce (1999), “Beyond City Limits: The Emergence of a NewMetropolitan Agenda”, unpublished manuscript, BrookingsInstitution, Washington, DC.
Katz, Bruce and Jennifer Bradley (1999), “Divided We Sprawl”, AtlanticMonthly, forthcoming.
Nasar, Sylvia and Kirsten B. Mitchell (1999), “Booming Job MarketDraws Young Black Men Into Fold”, The New York Times, May 23,pp.1 and 21.
Richmond, Henry R (1997), “Program Design: The American LandInstitute”, unpublished manuscript.
Rusk, David (1993), Cities Without Suburbs. Washington, DC: WoodrowWilson Center Press.
U.S. Department of Housing and Urban Development (1997), The State ofCities. Washington, DC: Government Printing Office.
U.S. Department of Housing and Urban Development (1999), The State ofCities. Washington, DC: Government Printing Office.