social implications of radical technology adoption within ... · considering a range of external...
TRANSCRIPT
Social Implications of Radical
Technology Adoption within the
Livestock Industry
A Design Investigation: Innovating Disruptive Technologies in
Traditional Marketplaces
Carl Behrendorff BA Design (Industrial)
Principal Supervisor:
Associate Professor Sam Bucolo
Associate Supervisor:
Dr. Evonne Miller
Industry Supervisor:
Mr. Alistair Brook
Landmark
School of Design
Faculty of Built Environment and Engineering
Submitted for:
Masters by Research
2011

Page | II
Keywords
Design
Design driven innovation
Disruptive innovation
Radical innovation
Design led innovation
Social acceptance of technology
Three-dimensional imaging
Livestock
Value chain
Objective livestock analysis

Page | III
Abstract
This thesis presents a design investigation into how traditional technology-orientated
markets can use design led innovation (DLI) strategies in order to achieve better market
penetration of disruptive products. In a review of the Australian livestock industry,
considering historical information and present-day trends, a lack of socio-cultural
consideration was identified in the design and implementation of products and systems,
previously been taken to market. Hence the adoption of these novel products has been
documented as extremely slow. Classical diffusion models have typically been used in
order to implement these products. However, this thesis poses that it is through the
strategic intent of design led innovation, where heavily technology-orientated markets
(such as the Australian livestock industry), can achieve better final adoption rates. By
considering a range of external factors (business models, technology and user needs),
rather than focusing design efforts solely on the technology, it is argued that using DLI
approach will lead to disruptive innovations being made easier to adopt in the Australian
livestock industry.
This thesis therefore explored two research questions:
1. What are the social inhibitors to the adoption of a new technology in the Australian livestock industry?
2. Can design be used to gain a significant feedback response to the proposed innovation?
In order to answer these questions, this thesis used a design led innovation approach to
investigate the livestock industry, centring on how design can be used early on in the
development of disruptive products being taken to market. This thesis used a three
stage data collection programme, combining methods of design thinking, co-design and
participatory design.
The first study found four key themes to the social barriers of technology adoption;
Social attitudes to innovation, Market monitoring, Attitude to 3D imaging and Online
processes. These themes were built upon through a design thinking/co-design approach
to create three ‘future scenarios’ to be tested in participant workshops. The analysis of
the data collection found four key socio-cultural barriers that inhibited the adoption of a
disruptive innovation in the Australian livestock industry. These were found to be a lack
of Education, a Culture of Innovation, a Lack of Engagement and Communication
barriers. This thesis recommends five key areas to be focused upon in the subsequent
design of a new product in the Australian livestock industry. These recommendations

Page | IV
are made to business and design managers looking to introduce disruptive innovations
in this industry. Moreover, the thesis presents three design implications relating to
stakeholder attitudes, practical constraints and technological restrictions of innovations
within the industry.

Page | V
Acknowledgements
To begin with, I would like to thank my principal supervisor and mentor, Associate
Professor Sam Bucolo: Throughout this project you’ve guided me and shown me the
direction and support I needed, and this is deeply appreciated. To my associate
supervisor, Dr Evonne Miller: Thank you for your input and thoughts on the analysis of
my results; I would have drowned without it.
To Mr Richard Norton and Mr Alistair Brook (Landmark): The professional support you
gave me and your trust in me has been greatly received and appreciated. To the
participants of this study: You all freely gave up your time with good spirit. Without you,
this research could not have been possible. Thank you.
To my friends and family who watched and supported me throughout the course of this
study: I could not have persisted without you. Finally, for the hours that you spent
reading my work and simply encouraging me and taking my mind off the work when
needed: Laura, you are the pillar of my life.
And for God who watches over us all.

Page | VI
Statement of Original Authorship
The work contained in this thesis has not been previously submitted for a degree or
diploma at any other higher education institution. To the best of my knowledge and
belief, the thesis contains no material previously published or written by another person
unless due reference is made.
Signature: ___________________________________
Date: ___________________________________

Page | VII
Contents
Keywords ........................................................................................................................II
Abstract .........................................................................................................................III
Acknowledgements ........................................................................................................ V
Statement of Original Authorship .................................................................................. VI
Chapter 1 Introduction .................................................................................................. 11
1.1 Background.................................................................................................... 11
1.2 Research Aim ................................................................................................ 12
1.3 Contribution to Knowledge ............................................................................ 13
1.4 Research Questions ...................................................................................... 14
1.5 Thesis Structure............................................................................................ 15
Chapter 2 Analysis of the Australian Livestock Industry ................................................ 17
2.1 Introduction................................................................................................... 17
2.2 Stakeholders throughout the Livestock Industry ............................................ 19
2.2.1 Local Sales Agents .................................................................................. 22
2.2.2 Summary of Australian Livestock Industry Stakeholders ......................... 25
2.3 Diffusion of Innovations ................................................................................. 25
2.3.1 Socio-Cultural Diffusion .......................................................................... 28
2.3.2 Approaches to Socio-cultural Diffusion ................................................... 31
2.3.3 Summary of Diffusion of Innovations...................................................... 33
2.4 Technology within the Livestock Industry ....................................................... 34
2.4.1 Genetic Gains Technologies .................................................................... 35
2.4.2 Livestock Assessment Technologies ........................................................ 38
2.4.3 Physical Technologies ............................................................................. 38
2.4.4 Online Technology ................................................................................. 40
2.4.5 Electronic Sales Markets ........................................................................ 41
2.4.6 Summary of Technology within the Livestock Industry ........................... 45
2.5 Adoption of Innovations ................................................................................ 45
2.5.1 Social Theories of Behavioural Control ................................................... 46
2.5.2 Social Inclinations of Adoption ............................................................... 47
2.5.3 Usefulness and Perceived Ease-of-use .................................................... 48
2.5.4 Physical Barriers to Adoption ................................................................. 49
2.5.5 Centralisation of Resources .................................................................... 50
2.6 Summary of Literature Review ....................................................................... 51

Page | VIII
2.6.1 Identified Gap in the Literature .............................................................. 51
2.6.2 Impact on Thesis .................................................................................... 52
Chapter 3 Disruptive Innovation ................................................................................... 53
3.1 Introduction .................................................................................................. 53
3.2 Defining ‘Disruptive Innovation’ ..................................................................... 55
3.3 Applying Disruptive Theory of Innovation ...................................................... 58
3.4 Disruption of the Australian Livestock Industry .............................................. 64
3.5 Contribution of Disruptive Innovation to This Thesis ...................................... 65
3.6 Proposed Disruptive Technology .................................................................... 66
Chapter 4 Design Led Innovation .................................................................................. 68
4.1 Introduction .................................................................................................. 68
4.2 Failure of Traditional Technology Diffusion Models ........................................ 69
4.3 Potential for Participatory Design .................................................................. 70
4.4 Disruptive Innovation .................................................................................... 71
4.5 Potential of Design Thinking .......................................................................... 72
4.6 Design Driven Innovation ............................................................................... 72
4.7 Design Led Innovation ................................................................................... 74
4.8 Summary ....................................................................................................... 76
Chapter 5 Research Design and Methodology ........................................................... 77
5.1 Introduction .................................................................................................. 77
5.2 Methodology ................................................................................................. 78
5.3 Participants and Research Techniques ........................................................... 79
5.4 Procedure ...................................................................................................... 80
5.5 Results Analysis ............................................................................................. 81
5.6 Ethical Considerations ................................................................................... 83
Chapter 6 Study 1 – Semi-structured Interviews ........................................................... 84
6.1 Introduction .................................................................................................. 84
6.2 Process .......................................................................................................... 84
6.3 Interview Data Analysis and Results ............................................................... 88
6.3.1 Results .......................................................................................................... 88
6.4 Discussion...................................................................................................... 99
6.5 Summary ..................................................................................................... 101
Chapter 7 Study 2: Scenario Development through Co-Design .................................... 102
7.1 Introduction ................................................................................................ 102

Page | IX
7.2 Process ........................................................................................................ 104
7.2.1 Study 2a: Observation Procedure ......................................................... 105
7.2.2 Study 2b: Co-Design Procedure ............................................................ 107
7.3 Results ......................................................................................................... 108
7.3.1 Study 2a: Observations......................................................................... 108
7.3.2: Study 2b: Co-Design ............................................................................. 109
7.4 Design Scenarios .......................................................................................... 110
7.4.1 Design Narrative .................................................................................. 110
7.4.2 Differentiation Scenario ....................................................................... 111
7.4.3 Efficiency Scenario ............................................................................... 114
7.4.4 Business Model Scenario ...................................................................... 116
7.5 Disscussion .................................................................................................. 119
7.6 Summary ..................................................................................................... 119
Chapter 8 Study 3: Testing the Proposed Designed Three-Dimensional Scenarios ....... 120
8.1 Introduction................................................................................................. 120
8.2 Process ........................................................................................................ 122
8.2.1 Participants and Procedure .................................................................. 122
8.3 Data Analysis ............................................................................................... 124
8.4 Findings ....................................................................................................... 124
8.4.1 Differentiation Scenario ....................................................................... 124
8.4.2 Efficiency Scenario ............................................................................... 127
8.4.3 Business Model Scenario ...................................................................... 129
8.5 Results ......................................................................................................... 132
8.5.1 Education as a Socio-Cultural Inhibiter ........................................................ 133
8.5.2 Culture of Innovation as a Socio-Cultural Inhibiter ...................................... 137
8.5.3 Lack of Engagement as a Socio-Cultural Inhibiter ........................................ 141
8.5.4 Communication as a Socio-Cultural Inhibiter ............................................... 143
8.6 Summary ..................................................................................................... 146
Chapter 9 Discussion and Overall Findings of Research ........................................ 147
9.1 Introduction................................................................................................. 147
9.2 Critique of Design Research Methodology.................................................... 149
9.2.1 Limitations .................................................................................................. 150
9.3 Outcomes of research .................................................................................. 151
9.3.1 Discussion of Socio-Cultural Inhibiters .................................................. 151

Page | X
9.3.2 Overall Findings from Socio-Cultural Inhibitors ..................................... 152
9.4 Summary ..................................................................................................... 159
Chapter 10 Recommendations and Conclusions ......................................................... 160
10.1 Introduction ................................................................................................ 160
10.2 Recommendations/Implications for the Australian Livestock Industry ......... 161
10.3 Final Words.............................................................................................. 162
10.3.1 Theoretical Implications ....................................................................... 162
10.3.2 Future Research ................................................................................... 163
10.3.3 Potential of Design Led Innovation in the Agricultural Industry ............ 163
References .................................................................................................................. 165
Appendices ................................................................................................................. 170
Appendix 1 – Participant Information Sheet ................................................................ 171
Appendix 2 – Observations ......................................................................................... 177
Glossary ...................................................................................................................... 187

Page | 11
Chapter 1 Introduction
1.1 Background
Innovation and design are vital for leaders and
managers to differentiate themselves from their
competition, both strategically and in terms of the
solutions they offer customers. Hence, ‘creativity’
is defined as the ability to perceive the world in
new ways, to find hidden patterns, to make
connections between seemingly unrelated phenomena, and to generate novel solutions
(Naiman, 2010). Innovation is the successful manipulation of these creative and novel
solutions; and this process carries these ideas through to new products, services or
business models. However, it is design which is the crucial next step between a creative
idea and an innovation. Hence, it is design which links these concepts, shaping ideas and
transforming them into attractive offerings for the benefit of all
stakeholders (Cox, 2005 ).
This thesis shows the use of design led innovation to explore how new technologies can
be socially accepted by industry stakeholders and, therefore, adopted throughout the
industry. From the literature review, it was found that previously the industries social
barriers to market were not considered in the development of new product offerings.
Furthermore design led thinking has not been used to address innovation in the
livestock context; subsequently, some innovations have not been completely adopted
industry-wide (for example, online transactions and RFID tagging). Therefore, the value
that this thesis presents is to not only propose a disruptive innovation to the industry,
but to also show how the use of a design led innovation strategy might better address its
social adoption.
Australia is heavily dependent on its agricultural industries with an industry wide gross
value of AU$41 849 billion in 2009 (ABS, 2010). This industry spans a vertical value chain,
encompassing a total of 136 000 individual businesses throughout the country; the
livestock industry represents 51.7% (covering beef and sheep) of these (ABS, 2008). As
1.1 Background
1.2 Research Aim
1.3 Contribution to
Knowledge
1.4 Research Questions
1.5 Thesis Structure
Page | 12
with any primary industry, the individual members or stakeholders are vital to the
overall success; without their input, crops or livestock cannot flourish.
Within the Australian livestock industry, these stakeholders have been traditionally
supported by sales agents who provide value added propositions, usually through
transactions or product/service support. With many stakeholders leaving the industry or
retiring (the average age of the producer is 58), foreseeably fewer stakeholders are to
remain active within the industry. Therefore, a need for increased productivity may be
required. This thesis explores the industry perceptions of a disruptive technology, using
a design led strategies in order to more thoroughlly address the industries latent and
percieved needs of a proposed technology and how it might benefit their business
operations.
The role of design is centred around the realisation of new products or services that
typically meet a human centred need. The use of design methodologies, therefore,
allows this thesis to employ different perspectives to previous design explorations
within the livestock industry. Therefore, the role of design in this thesis is to more
thoroughlly combine end users’ needs with competetive business models. These novel
approaches are generally described as ‘innovations’, where a particular technology or
process has been applied in a meaningful or value added manner. Therefore, the gap in
knowledge that this thesis fills, as identified through a review of literature within the
industry, has been identified as: the successful implementation of disruptive technology
within incremental markets (using design led innovation as the driver of the project).
Therefore, this thesis presents a novel, mixed methodology approach to the
implementation of a disruptive innovation within a technology-focused industry – the
Australian livestock industry.
1.2 Research Aim
By using a case study of the proposed technology and applying design led innovation
strategies this research aims to make recommendations to the development a disruptive
innovation in the Australian livestock industry. Moreover this thesis aims to guide
designers seeking to develop disruptive technologies in traditional marketplaces,
through a design led approach. Therefore in order to achieve these aims, this thesis
shows designers and business managers how to use varying processes amid design led

Page | 13
innovation strategies. These strategies aim to develop methods of deeper stakeholder
engagement, which are required to successfully develop a disruptive technology.
1.3 Contribution to Knowledge
The adoption of new innovations in the agricultural industry has previously been
documented by numerous authors (Burke, Nuthall, & McKinnon, 2004; Driedonks,
Gregor, Wassenaar, & VanHeck, 2005; Frank, 1997; Rogers, 1995), as further dicussed in
Chapter Two. This thesis differs from the forementioned body of work by contributing to
the ways in which designers can add value to this sector. Traditionally, innovations in
this industry have recorded slow diffusion rates and many technologies have failed.
Utilising design led innovation (Bucolo & Matthews, 2010) to address this problem, this
research seeks to understand the Australian livestock industry’s socio-cultural ideals
and subcultures so as to engage with stakeholders in a more meaningful manner. Design
led innovation is a strategic approach to the development of novel products.
Characteristically, it focuses on three specific areas: User Needs, Technology, and
Business Models. Typically, traditional design approaches fail to address these three
areas in the conceptual stages of development, for instance User Centred Design
(Bucolo & Matthews, 2010). To faciliate the study of these areas, this thesis employs a
mixed method approach, combining Design Thinking, Participatory Design and Human
Centred Design. The work outlined in this thesis builds upon the work of numerous
authors, and suggests the need for deeper stakeholder engagement in design (Bucolo &
Matthews, 2010, 2011; Christensen, 1997; Verganti, 2008).
Hence this thesis presents two main contributions to knowledge. Firstly the
documentation of employing a design led innovation strategy in the Australian livestock
industry has not been offered in literature before. Second to this, the documentation of
participatory methods of early stakeholder engagement and meaningful design
interaction is also presented in this thesis. This thesis fills these two gaps and presents
approaches for other designers and managers seeking to innovate in the Australian
livestock sector.

Page | 14
Contribution One: Role of design in the livestock industry
The use of design led innovation strategies offers a new approach/different perspective
to introducing radical ‘new to the world’ products in the livestock industry. The
approach taken in this thesis aims to engage potential innovation stakeholders in the
process of identifying potential latent gaps within the market place. The contribution of
this work is therefore in the use of a design led methodology, to innovate in the
livestock industry. Building upon this, the thesis will propose design solutions which are
both innovative and commercially advantageous, and that meet the specific needs of
this industry.
Contribution Two: Industry stakeholder engagement
The use of a participatory design methodology facilitates a deeper engagement between
researcher and participant. This approach allows the participant to actively co-design
the proposed innovation, effectively including the stakeholder in the development of
the proposed end product/system. Utilising this design method builds upon the
reviewed literature (Frank, 1997; Guerin, 2000), allowing real world stakeholders to
express concerns and propose solutions in the early design stages. Such a method has
not previously been applied or documented within the Australian livestock industry.
1.4 Research Questions
While other industries adopt technology in order to optimise business strategies and
add value to their products, the livestock industry has been slow in moving to accept
change (Frank, 1997). The significance of this research, then, is its analysis of ways in
which to bring the livestock value chain into the technological era. An example of
current technology within the livestock industry is Radio Frequency Identification (RFID)
tags for identification of livestock. This mandatory move has been widely accepted
throughout the industry as it has been an incremental change to the current practice;
however, many farmers still do not adhere to the standard and do not tag animals. This
research will aim to understand such reluctance to accept and adopt innovation, and
recommend steps to overcome this reluctance. The use of research questions shapes
and actively provides direction and scope to the study. The two questions which the
research addresses are:

Page | 15
1. What are the social barriers to the adoption of a new technology by the
Australian livestock industry?
2. Can design led innovation be used to gain significant feedback on the proposed
innovation?
1.5 Thesis Structure
This thesis is separated into 3 sections: Chapters Two to Four review past work, and
relevant design research theories are presented. The second section (Chapters Five to
Eight) details the field work and findings of the thesis, which are built upon the design
research theories covered in the earlier chapters. Lastly, the third section (Chapters Nine
and Ten) incorporate the thesis’ knowledge contribution and its implications for design.
A brief explanation of each chapter is also presented for the reader’s benefit.
Chapter Two examines literature from the livestock industry relating to the value chain
of the industry and an understanding of its stakeholders. This chapter also explores
contemporary technologies within the industries and the attitudes toward them. Lastly,
this section presents literature and examines the traditional methods for the adoption
of innovations that the livestock industry had previously employed.
The theory of disruptive innovation and radical product development is explained
throughout Chapter Three. This chapter explores a novel innovation in a disruptive
industry-wide change, hence outlining the disruptive potential of a proposed innovation
to the livestock industry. Building upon the theory presented within this third chapter,
three dimensional imaging will become the innovation to be explored through
engagement with industry stakeholders.
Chapter Four builds upon the information presented in the previous chapter. However,
the fourth chapter also introduces different design theories; it examines the proposed
use of a design led innovation (DLI) strategy to investigate the Australian livestock
industry. Furthering this, the chapter explains other design methods that will be
considered throughout the research methodology. These other approaches are:
Participatory Design, Design-Driven Innovation and Design Thinking.
Chapter Five documents the design research methodology of this thesis. In this section,
a rationale of the three stage format of the study is provided. Also, a justification of the

Page | 16
qualitative research methods and subsequent data analysis used is presented. As part of
the research methodology, a review of all participants has also been documented.
Chapter Six describes Study One, used to establish contextual attitudes held by a small
sample of stakeholders. These attitudes cover current products/innovations: use of the
internet as a tool, the argument between objective and subjective assessment of
livestock; and current developments concerning the livestock industry as a whole.
Chapter Seven presents Study Two, a design led process involving the researcher and
industry expert. Key learning’s identified in the previous chapters (2-4) are developed via
the participatory design approach. Within this process, a series of immersion
observations have been conducted to more thoroughly understand the culture of the
livestock industry. These observations have been utilised to test the validity of the co-
designed future proposals, which were expressed via a scenario/narrative approach. The
three detailed scenarios span differing segment of the value chain and are designed to
provoke engagement.
Chapter Eight presents Study Three, a series of workshops focusing on the perceptions
of the scenarios. The workshops were utilised to identify societal, technological and
practical attitudes of each of the seven identified sub sectors within the livestock
industry. Findings are drawn from a thematic analysis, and four socio-cultural inhibitors
are presented.
Chapter Nine presents a discussion and provides the overall findings of this thesis,
building upon the results presented in Chapters Six, Seven and Eight. The chapter
expands on the socio-cultural inhibitor themes found, and evaluates the design led
innovation strategy and the Participatory Design methodology used throughout the
workshops of Study Three.
Recommendations and conclusions are presented in Chapter Ten. A total of three
barriers to the adoption of a three dimensional imaging innovation is presented, in order
to understand and overcome issues surrounding the adoption. Examples of attitudinal,
practical and technological social barriers are discussed. Subsequent implications for the
livestock industry are put forward, both in relation to theoretical implications and
practical ways to overcome barriers to the future adoption of innovation in the industry.
The chapter closes with recommendations for future work in the area.

Page | 17
Chapter 2 Analysis of the Australian Livestock
Industry
2.1 Introduction
This chapter examines literature relating
to the agricultural livestock industry.
Within this review, information
surrounding the value chain and the
stakeholders who work within it are
provided. The review topics include:
current technologies and their
performances, social attitudes, and the
adoption patterns of past successful innovations. This chapter therefore directs the
research context of this thesis by identifying a research gap, creating a design scope, and
presenting a contextual background to the industry as depicted in figure 2.1.
Figure 2.1: Rationale for literature review
2.1 Introduction
2.2 Stakeholders in
Industry
2.3 Diffusion of Innovations
2.4 Technology in Industry
2.5 Adoption of Innovations
2.6 Summary of Literature
Review

Page | 18
The livestock industry is Australian agriculture’s largest with a gross value of AU$7.4
billion (National Farmers Federation, 2010), and second only to the wheat industry
which is valued at AU$5.2 billion. In terms of export, the Australian beef market is a
world leader in the global marketplace with an annual export value of AU$4 billion
(Meat and Livestock Australia, 2009). Domestically, the sale of these livestock (both
sheep and beef) has been facilitated through the use of saleyards scattered throughout
the country (Clarke & Jenkins, 1993).
The industry as a whole has been built upon a strong sense of tradition, being
established in the 1880s when nearly every settlement had its own set of saleyards and
animals were often killed in the backyard of the local butcher (Hassall, 2007). These
saleyards maintained a strong social identity, typically being built alongside local social
infrastructure. Hassall mentions that “On market day the women came to town, did
their shopping and met friends and relatives” (2007 p.3). Therefore, the saleyard was
the rural livestock industry’s icon, a place for both business and social interaction. Sales
would last the entire day, compared to the modern day where sales are finished in one
to two hours (Hassall, 2007).
Throughout the 1900s many of these saleyards closed down with the increase of
commuter networks such as road and rail expansions. Surviving saleyards prospered
upon major arterial connections and benefited greatly from prime location (Hassall,
2007). Throughout the last century, even though many livestock farming businesses
(stakeholders leaving the industry) have closed, the total number of saleyards has
actually remained relatively unchanged, with about two hundred of these still holding
regular livestock sales (Hassall, 2007). Hence the traditions of the ‘saleyard’ have
remained unchanged in this time and have influenced today’s modern exchange
markets.
Throughout Australia, Hassall (2007) identified that 40% of saleyards were located
throughout the state of New South Wales in 2007, with a remaining 60% scattered
throughout Queensland and Victoria. Within these, a total of 19 million sheep and 6
million beef cattle were sold in an ‘average’ year. Therefore, it can be seen that while
saleyards still maintain their traditional roles, they are still relevant to the culture of the
industry today, utilising modern methods and technologies. One example of this modern
extension of the ‘saleyard’ is the use of online auctions which are based on an Internet
trading model.

Page | 19
An online auction sale of livestock was introduced to the industry in the mid-1980s and
was portrayed to the public as “sales by description” (Clarke & Jenkins, 1993; Driedonks,
et al., 2005; Hassall, 2007). This newer method of sale has been marketed to farmers (or
stakeholders) as an easier, more cost effective and time saving sales channel than the
traditional saleyard method. Hassall (2007) states that the total number of stakeholders
using the most popular internet sales platform (AuctionsPlus) has reached 37 800 users
over the past decade. With the creation of this internet auction platform and the
vastness of the Australian livestock industry, this new sales channel may have the
potential to dramatically influence the manner in which livestock are currently bought
and sold. Some authors suggest that online trading may even have the potential to
replace the older, traditional saleyard system.
Next, this review presents theory on the diffusion of innovations and moves to the
contemporary literature on current technologies/innovations in the market. Lastly, this
chapter investigates theory on the adoption of innovations both within the agricultural
industry and beyond. Following the presentation of these four major themes of enquiry,
the identification of research gaps can be further documented. Finally, the implications
for the research direction of this thesis are then presented.
2.2 Stakeholders throughout the Livestock Industry
The Australian Bureau of Statistics (ABS, 2008) reported that from November 2008, a
total of 317 730 people were directly employed in the Australian agricultural industry.
Of that total, the livestock industry employed approximately 121 000 workers (Meat and
Livestock Australia, 2009) throughout Australia. Hence, within the context of this thesis,
it is important to understand these livestock stakeholders, as satisfying their market
needs is vital to the successful design of a disruptive innovation. In order to identify with
the stakeholders in the industry, Katz and Boland (2000) present the industry in six
segments in a value/supply chain, as seen in Figure 2.2. Importantly, it should be noted
that this figure was originally devised to describe the American beef industry; however,
the Australian livestock industry’s value chain operates in the same way.

Page | 20
Figure 2.2: Description of livestock value chain (Katz & Boland, 2000)
In Figure 2.3 it is seen that there are several distinct groups that exist and operate in the
value chain. Lamb and beef exist and operate in Australia using the same sectors. Katz
and Boland state:
“The industry includes breeding, feeding, and marketing livestock with the
eventual goal of processing and merchandising of retail product to consumers...
Each segment of production uses various biological and economic relationships
to efficiently generate a desirable product. In some cases, segments are in
competition with one another, and because of their different characteristics
they can be considered as separate segments within an industry.” (2000 p.6)
In order to establish a more structured understanding of the different sectors of the
livestock value chain, Table 2.1 provides a brief description [adapted from Katz and
Boland (2000)] to suit the Australian livestock context.
Seedstock
Producers Calf & Yearling
Feedlots
Processors
Retailers
Consumers
VERTICAL
SUPPLY
OF STOCK

Page | 21
Table 2.1: Description of individual sectors of the livestock value chain
Livestock Sectors
The seedstock
segment
Seedstock breeders are specialised livestock producers. This
segment is also known to consist of purebred or registered
breeders. The goal of this segment is to create various genetic
advances by breeding desirable traits into a particular line (or
progeny) of livestock to produce an animal more aligned to
consumer preferences. Stakeholders in this segment sell breeding
animals, semen and embryos to other ‘seedstockers’ and
commercial producers.
Pro
du
cers
Commercial
calving
segment
This sector maintains livestock herds with the aim of raising
offspring from birth to a weaning stage. The stock reared are the
main sources of income for the producer.
The
yearling-
stocker
segment
Stakeholders within this sector purchase weaned stock with the
aim of adding weight to the stock before they are sent to
feedlots, or directly to slaughter.
The feedlot segment
Feedlots are confinement orientated properties where stock is
fed ‘finishing’ rations before eventual slaughter. Within
Australian markets, feedlots are required to feed stock for a
minimum of one hundred days before they can be considered
‘grain-fed’ meat.
Processing segment
The processing segment comprises of the slaughter, cutting,
packaging and distribution of livestock (although distribution
sometimes occurs in the next step in the value chain).
The retail segment
This segment is the point of sale of the packed meat prepared in
the previous sector. Sales usually occur in supermarkets, butchers
and independent grocery stores.
The consumer
segment
For the livestock industry in Australia, the consumers are viewed
as the final part of the value chain. Consumer preferences and
purchasing habits typically influence the previous sectors of the
value chain, eventually influencing the Seedstock segment.

Page | 22
Explanation of Table 2.1
Table 2.1 describes the individual sectors of the livestock value chain. However one
important aspect of the Australian value chain that is missing in the representation in
Table 2.1, namely, the ‘local sales agents’. This is because local sales agents do not play a
direct role in the production of livestock in Australia. Instead, the role of ‘sales agent’
has been moulded and transformed into the traditional saleyard heritage, as earlier
described in this chapter. The next section describes these sales agent stakeholders.
2.2.1 Local Sales Agents
Madigan (2010) describes the sales agent very positively and summarises the livestock
industry as a ‘people person’ industry:
“While livestock industries revolve around livestock, it is in fact a people
business. Personalities abound and the relationship between agents and their
clients sometimes going back three and more generations is also unique. This is
an industry where a handshake is an agreement, where millions of dollars of
livestock are bought by dozens of buyers at a sale on a bid auction. It is an
industry where the “del credere” insurance guarantees payment.” (Madigan,
2010 p.1)
Sales agents have been an important aspect of the Australian livestock industry from the
mid-nineteenth century (Ville, 2005). As part of their role, this group of stakeholders
provides marketing support, and financial and technical services for the primary
producers described above. Ville describes this group of agents:
“Their (sales agents) success depends heavily upon the prevailing level of social
capital in a community, and their ability to enhance it with planned investments
that provides additional economic returns both to agents and to the rural
community.” (2005 p.1)
Ville continues to explain that social capital is found in the “development of shared
social norms and values based on cooperation, trust, reciprocity, and obligation” (2005
p.185). Given the historical or traditional nature of the industry, it seems as though the
sales agent can be viewed in a position of authority within the rural community, at least
in their area of expertise. However, even though this segment of the industry indeed
holds (or once held) this social capital (Ville, 2005), it is more important that their

Page | 23
opinions have the capacity to influence the opinions of stakeholders within the value
chain (ABC Rural News, 2006; Ville, 2005). Traditionally, these agents are the opinion
leaders of the industry and their recommendations are held in high regard by producers
(Driedonks, et al., 2005; Frank, 1995). One example of this is found in the development
of the use of radio frequency identification tags (which will be expanded upon in more
detail later in this chapter), where overall perception of the technology has been
influenced by local sales agents (ABC Premium News, 2005). Indeed, sales agents have
been documented to hold the ability to sway the opinions of their clients and local
community (Clarke & Jenkins, 1993; Driedonks, et al., 2005; Frank, 1995, 1997).
It is important to note that livestock agents operate as ‘go-betweens’ or ‘middle men’
and typically operate within the front portion of the value chain. The role of these sales
agents is therefore firmly based in the facilitation of stock transactions, both in beef
cattle and sheep (and also in other areas of livestock production). This group of
stakeholders acts as an intermediary and much of the movement of stock throughout
the industry is made possible by their work through, but not restricted to, the saleyard
system. These agents operate through more than 1200 local and national businesses
(Australian Livestock & Property Agents Association Limited, 2010) that act on behalf of
their clients (producers/graziers) to buy and sell livestock either directly from properties
or in the traditional selling mode at saleyards. The two largest Australian agricultural
agency companies are Elders and Landmark who are represented nationally; other small
businesses also operate within the saleyard systems, but none are as large as the
mentioned companies.
Given the historical and social importance of the sales agent sector (as outlined above),
the vertical value chain which does not include this sector may seem somewhat lacking.
Christensen and Rosenbloom (1995), therefore, suggest the use of a value network
(rather than a value chain) as a better tool for assessing stakeholders and value
exchange in a marketplace. The use of a value network, therefore, allows all value
exchanges to be documented and described. Figure 2.3 below depicts the value network
of the Australian livestock industry, as adapted from Driedonks (et al (2005).

Page | 24
Figure 2.3: Beef supply chain [adapted from (Driedonks, et al., 2005)]
As seen in Figure 2.3, producers are exposed to an array of breed societies, merchandise
(sold through agency businesses), government bodies and processes that are all intent
on providing a value added benefit to a producer’s business. Sales agents within the
value network predominately facilitate transactional relationships between livestock
producers and purchasers via whatever exchange method is deemed appropriate for the
client. The understanding of value network analysis is documented by Allee (2008) who
considers a way in which a company might take intangible assets and create a value
from them in a value network sense. Allee (2008) offers an effective framework for the
assessment of value networks, and the subsequent identification of gaps and the
opportunities within them. This process is later implemented in the development of
future scenarios in Chapters 4, 5 and 6.
Within this value network, a producer simply aims to sell their livestock to anyone who
will purchase it at an agreeable price. Buyers in this industry can be in the form of other

Page | 25
producers, feedlots, processors or live exporters. Usually, this process is assisted by
agents who act on behalf of the producers as market experts, and typically try to find
the best market (highest selling price) for each producer. This is the traditional “sales
model” of the livestock industry in Australia. Although other channels of sale have been
created (for example, online auctions) and have penetrated the market, the incumbent
agency system has proven to be the longest standing system in Australia (Driedonks, et
al., 2005).
2.2.2 Summary of Australian Livestock Industry Stakeholders
In the above section, segments of the Australian livestock industry have been presented
and described. In the context of this thesis, it is important to examine and critique each
segment of the value chain in order to understand how a disruptive innovation might be
placed in the market. Therefore, the next section examines how innovations (both
radical and incremental) are adopted within a market by its stakeholders. This adoption
of innovations is most famously described by Rogers (1995) in his theory of ‘the diffusion
of innovations’.
The diffusion theory was first applied to agriculture by Rogers (1995) with a review of
the Iowa hybrid corn seed adoption process in America. Since this first application of the
theory, the diffusion theory has been applied to many industries in various studies of the
adoption process of new innovations. Diffusion theory is explained and investigated
here because of its considerable success in its application to rural sociology (Gregor &
Jones, 1999).
2.3 Diffusion of Innovations
Innovations are described as ideas, products, systems or novel processes that are
presented to a user in a novel manner (Pease & Rowe, 2005; Rogers, 1995; Sunding &
Zilberman, 2000; Veil, 2010). Following on from this definition, Rogers defines diffusion
as “the process in which an innovation is communicated through certain channels over
time among the members of a social system” (Rogers, 1995 p.5). Therefore, the theory
of diffusion of innovations aims to explain the eventual dissemination of novel
innovations.

Page | 26
In his book, “The Diffusion of Innovations”, Rogers explains that the adoption pattern of
any innovation can be measured through the use of an S-curve, as seen in Figure 2.4.
When the innovation is first placed in the market, a small number of stakeholders adopt
and trial the product; this group has been categorised as “innovators” or early
“adopters”. Rogers explains that adoption levels then typically accelerate through the
market, before finally tapering off once the majority of stakeholders within the market
are using the innovation. As seen in Figure 2.5, Rogers divides the innovation adopters
into five main categories: Innovators, Early Adopters, Early Majority, Late Majority and
Laggards.
Figure 2.4: Rogers’ S-curve of innovation diffusion and penetration (Rogers, 1995)
Figure 2.5: Rogers’ model of adopter categories (Rogers, 1995)

Page | 27
The theory further outlines five key factors against which all innovations are measured
and assessed by potential users. These five attributes of innovations are: (1) Relative
advantage, (2) Compatibility, (3) Complexity, (4) Trialability and (5) Observability.
‘Relative advantage’ is defined as the degree to which an innovation is perceived as
better than the idea it replaces (Rogers, 1995). The greater the perceived advantage of a
particular innovation, then the faster the adoption rates are likely to be. Rogers (1995)
explains that the financial incentive of a new innovation for stakeholders is the greatest
expression of relative advantage. This is because an innovation is unlikely to be adopted
if the costs outweigh the relative benefits of its adoption.
‘Compatibility’ can be described as the extent to which the proposed innovation upholds
the existing social values, needs and experiences of the adopter (Rogers, 1995).
Therefore, if an innovation is perceived to be outside the social norm of the market,
adoption patterns will likely be lower. To combat this, innovations may first need to
diffuse a new set of values or needs in order to be successful.
In the theory of diffusion, ‘complexity’ refers to the degree of difficulty involved in
perceiving or comprehending an innovation, or to the need for training or additional
education before adoption or use. Indeed, it may simply pertain to the degree of clarity
of the innovation’s purpose. As Rogers (1995 p. 257) states, “Some innovations are clear
in their meaning to potential adopters while others are not”. Therefore, some technical
innovations may be far too advanced for application in a non-technical industry and,
therefore, be rejected by stakeholders.
‘Trialability’ is the degree to which an innovation can be trialled or tested before
purchase (Rogers, 1995). The theory states that if a stakeholder can see, feel, or operate
the innovation in order to understand it better, adoption is more likely.
The last innovation attribute, ‘Observability’, is the degree to which innovations are
visible to peers within the social system (Rogers, 1995). Simply put, if innovations are
visible to others, the likelihood of others adopting the innovation is higher. Conversely, if
an innovation is not visible, the adoption rate is likely to be lower.

Page | 28
Decision making process
Veil (2010) expands Rogers’ (Rogers, 1995) innovation attributes, suggesting that
innovations are also assessed and adopted via a decision-making process. The author
explains that “Adopters are influenced by (1) knowledge, (2) persuasion, (3) decision, (4)
implementation, and (5) confirmation during which stages individuals evaluate the
attributes of the innovation” (Veil, 2010 p.71). It can be seen that adopters of
innovations are affected by more than simply the attributes of the particular innovation
in query. This is because much of the adoption process is influenced by external and/or
social means of information, as the second category of the decision making process
suggests. Much research is focused on the importance of the livestock social system into
which an innovation is diffused (Frank, 1997; Lynch, Gregor, & Midmore, 2000; Pease &
Rowe, 2005; Rogers, 1995), suggesting that the social system may impede or aid
diffusion.
2.3.1 Socio-Cultural Diffusion
Stakeholders in the livestock value chain sit within a social system and, as explained
earlier in this chapter, the culture of the industry has been firmly steeped in a sense of
tradition. Rogers defines a social system as: “A set of interrelated units that are engaged
in joint problem solving to accomplish a common goal. The members or units of a social
system may be individuals, informal groups, organisations and/or subsystems” (Rogers,
1995 p.23). Furthermore, the diffusion theory emphasises the “Importance of the nature
of the social context and the communication processes involving the system” (Lynch, et
al., 2000 p.613). It appears that the diffusion of new technology greatly depends on the
opinion leaders within the social system.
Opinion leaders
Opinion leaders act as influential stakeholders and innovation pacesetters within a peer
or social group. These leaders are important for the diffusion of innovation as their
opinions and behaviour are noted by the remaining stakeholders; hence, innovation
diffusion may be accelerated because of positive perceptions from opinion leaders
(Rogers, 1995; Veil, 2010). Opinion leaders typically are seen to be highly educated, to
hold positive attitudes to innovation, to be reasonably wealthy and to hold a higher

Page | 29
social status than others who follow the opinion leaders (Veil, 2010). Not surprisingly,
opinion leaders have a higher perceived level of social leadership (Weir, 1999);
However, much literature written on the Australian livestock industry has documented
that previous innovations have been introduced based on socio-economic
understandings, rather than on socio-cultural considerations (Frank, 1997; Guerin,
2000).
Frank (1997) suggests that the ‘process of the adoption of innovations’ (Frank refers to
the diffusion of innovation in this way) in the livestock industry has been slower than
some technologists might have once thought. Frank argues the point that innovations
within the Australian livestock industry have been purely implemented based on
business-minded goals that are geared for profit (Frank, 1997). Within the business
world, it can be argued that increased profit is the point of new innovations, and the
reason that companies bother to introduce new innovations at all (Christensen, 1997).
Tonts suggests that, “While there is considerable debate regarding the processes that
lead to adoption, there is a general consensus that the application of new technologies
and practices is largely based on the desire of farmers to maximise economic returns.”
(Tonts, Yarwood, & Jones, 2010).
Frank (1997) rightly poses a different approach that companies should consider when
introducing technologies to farmers in the Australian market. He argues that companies
that attract stakeholders to innovations in the livestock industry with the promise that
they will save or make money, will ultimately fail. Frank is critical of this type of
extension management and points toward a better use of socio-cultural diffusion
theories. Through his study, Frank (1997) surmised that livestock stakeholders are more
likely to be interested in maintaining a satisfying ‘way of life’, rather than in becoming
more productive and/or efficient. Frank’s study (Adoption of innovation in the north
Queensland beef industry) found that north Queensland livestock stakeholders
perceived that adopting new technology to become more productive would ultimately
lead to more work to perform; this, in turn, would take away the farmers’ enjoyable way
of life. He explains: “Adoption behaviour in the north Queensland study was consistent
with the concept of appropriate technology for appropriate needs, rather than an
orientation towards high profitability” (Frank, 1997).

Page | 30
Frank (1997) summarises several primary assumptions about the non-adoption of
technology by Australian cattlemen and condenses these points into three main
statements:
Research has been based on values which are scientific and oriented towards
profit.
Technologists have assumed that practices are desirable and suitable for
adoption.
A new practice does not require modification of an individual’s self-image,
personality and/or social environment. (Frank, 1997 p. 350)
As previously mentioned, the failure to adopt a new practice or technology may have
been due to the misconception of the rural farmer’s mindset and values (Frank, 1997;
Guerin, 2000). Although, for some farmers, the economic incentive that a new
technology offers may be enough to persuade behavioural change, for the most part, it
is obvious that this is not enough. A newly designed innovation must contain an
economic incentive but it must also offer more than this: it needs to appeal to the
adopter in a social sense as well (Frank, 1997; Guerin, 2000; Rogers, 1995). An
innovation is fundamentally flawed if it does not consider this social aspect, and if
members of the livestock value chain are offered nothing more than a new way of doing
something they have done for years previously, often with their friends/partners.
Therefore, acknowledging the above mentioned assumptions is critical for the successful
diffusion of any disruptive innovation.
Frank (1997) identifies the historical problems of a lack of technology adoption within
the Australian livestock industry. As explained above, a major obstacle that companies
have faced is the difficulty of implementing technology change in a socially viable
context. Understanding and designing for this challenge is one identified key to
successful products or services in the industry. Therefore, in the context of this thesis,
Frank’s (1997) arguments have informed the design approach used (as later described in
Chapters Four and Five). However, Frank (1997) only goes as far as explaining the
reasoning behind “cattle men” deliberately not adopting new innovations. In spite of
this, Guerin (2000) builds upon Frank’s (1997) work and suggests numerous ways
companies might engage the industry’s stakeholders in meaningful approaches which
will, ultimately, lead to successful technology adoption.

Page | 31
2.3.2 Approaches to Socio-cultural Diffusion
Guerin (2000) explains the issues for commercial bodies and outlines strategies for these
entities to appropriately introduce novel change throughout the livestock industry. The
author also agrees with the wider literature that, “Innovations in the livestock industry
have simply not been adopted, even when the need for the innovation is clear” (Guerin,
2000 p.205). Guerin (2000) provides a good source of information for “extension
managers” (researchers, designers and the like) to apply strategies to better facilitate
adoption levels of novel innovation by stakeholders. In this study, Guerin (2000)
explains the barriers to market entry across three topics: (1) Constraints relating to the
land user and adoption, (2) Constraints related to the nature of the actual innovation
and its developers, and (3) Constraints relating to the communication and transfer
process. These are further expanded upon below.
Constraints on land-user and adoption
In his paper, Guerin (2000) identifies that extension managers must understand the
stakeholders’ personal goals and business objectives; noting that these “are often
unspoken and possibly even subconscious” (p.206). Coinciding with this are typically
negative experiences with other past innovations which can indiscriminately affect
stakeholder attitudes to the new innovation. Hence, Guerin (2000) suggests that the
attitude toward risk is also a determining factor for stakeholders’ adoption behaviour.
Lastly, the socio-economic environment in which stakeholders operate holds a large
amount of influence over them. Opinion leaders within the market “uphold or create
new social norms in a community, which influence the behaviour of other land users
(stakeholders)” (Guerin, 2000 p209). The author suggests that it is important to identify
these people and to gain their approval of new innovations. Anderson (1982) (as cited in
Guerin) explains that in the Australian livestock industry, the age bracket of 40–50 years
tends to be associated with the “progressive land user”; which is synonymous with the
term “opinion leader” throughout Guerin’s work. Therefore, extension managers should
seek out these types of stakeholders; however, other research (Guerin, 2000) has found
that typically early adopters (or opinion leaders) tended to be relatively younger, and
typically only having used their land for a smaller number of years. Thus, it seems that
the opinion leaders within the livestock industry may not necessarily fit a common
mould.

Page | 32
Constraints related to the nature of the actual innovation and its developers
In this section, Guerin suggests that an innovation and the manner in which it is
communicated to stakeholders can be a barrier to adoption. This may seem a confusing
statement, but as previously mentioned, stakeholders are typically affected by the
perceived complexity of a novel innovation (Guerin, 2000; Rogers, 1995). Guerin argues
that the manner in which the innovation is first explained by the extension manager can
also lead to misconceptions about it. Compounding this problem is the pure relevance of
the innovation to the stakeholder. Guerin (2000) explains that the perceived needs ‘gap’
between stakeholders and scientists is usually large, where scientists build a generalist
view of the innovation compared to the stakeholders’ very practical/individualistic
approach. Hence, the development and communication between designer and
stakeholder is a critical element of product innovation in the Livestock industry.
Constraints relating to the communication and transfer process of
innovations
Guerin’s (2000) study centres predominately his last identified section, constraints
relating to the communication and transfer process of innovations. Characteristically,
extension managers have usually aimed to introduce stakeholders to the novel
innovation through the use of field days and demonstrations. For this to occur, the
innovation must be at least to the prototype stage so that stakeholders can assess and
physically use the system. Guerin provides historical examples of how these field days
have previously worked; however, the purpose of these examples is to simply suggest
that field days may not prove to be a help to the adoption of innovations. Problems
arose from: (1) the lateness of stakeholder evaluation, (2) the role of the media, (3)
explanation of the innovation, and (4) the credibility of the actual extension manager. All
of these factors can potentially influence and lead to non-adoption. Guerin (2000)
therefore suggests that traditional diffusion models may be not appropriate within the
industry:
‘A limitation of the classical diffusion model is that it predicts that the majority
of land users would prefer to wait for an opinion leader to invest in and test an
innovation before these land users do so themselves. They do this in order to
avoid taking any risks that they may experience if they were to adopt
immediately.’ (Guerin, 2000 p.227)
Page | 33
As mentioned above, identifying these opinion leaders can be a difficult task as, at least
within the Australian livestock industry, opinion leaders do not fit a “common” mould.
Guerin (2000) suggests the adoption of a participatory approach, although falling short
of suggesting that design should be used as a tool within this approach.
Guerin (2000) provides a list of participatory suggestions that he argues can help
facilitate the successful adoption of new innovations:
Empathise with land users and their needs
Make recommendations that are feasible in the particular economic, technical
and social context
Have an overall knowledge of the environment and its management
(understand the “big picture”)
Maintain a practical approach to problem solving
Understand and work within the social norms of the land using community
Make recommendations visible
Have experience in the application of new practices
Be well informed on the latest developments in land management
Be accessible to the land user
Be unbiased, honest, trustworthy, maintain confidentially, and be reliable
Describe the opinion leader/early adopter/progressive producers.
(Guerin, 2000 p223-224)
2.3.3 Summary of Diffusion of Innovations
This section of the review has focused on the theory of diffusion and has identified
relevant critiques of the theory through literature. Frank (1997) identifies the need for a
deeper understanding of the livestock industry stakeholders; similarly, Guerin moves
this argument further, suggesting the adoption of a complementary participatory
method (Guerin, 2000) to the classical diffusion model explained by (Rogers, 1995) in
the ‘diffusion of innovations’. An appraisal of this participatory method will be further
developed in Chapter Four. However, within the context of this chapter, current
technologies have not yet been presented. The next section of this review, therefore,
explores different technologies and innovations that have previously been introduced to

Page | 34
the market and evaluates both their success and their implication for the industry’s
value chain.
2.4 Technology within the Livestock Industry
Technology in the Australian livestock industry is broadly diverse because of the nature
of the varying differences and specialisations of the value chain segments. Technological
advancements in the agricultural industry are classified into distinct categories:
mechanical, biological, chemical, agronomic, biotechnological, and informational types
of innovation (Sunding & Zilberman, 2000). However, more recently, innovations have
been designed using a systems approach, where multiple classifications (as listed above)
are integrated into the one innovation. For the purpose of this part of the chapter, a
review of past and current technologies will be presented and discussed according to
their impact throughout the value chain. To expand on these innovations, this chapter
also analyses the social implications of the adoption of these innovations and how
adoption will be influenced in the long term. The purpose of this section is to provide a
contextual understanding of the technological history of the industry. Therefore, it
identifies patterns of success and failure of technologies in the industry; these can
subsequently be used to guide future innovation efforts in the industry.
Innovations in the livestock industry are predominately ‘value adding’ and incremental
in nature (Boland, 2009). The latter is expanded upon in the next chapter; however, the
concept of value adding within the livestock industry “Is a movement that has created a
life of its own” (Boland, 2009). This concept is described thus: “Adding value is the
process of changing or transforming a product from its original state to a more valuable
state” (Boland, 2009). Parcell (2009) describes five ways of value adding innovations:
1. Producing and marketing real or perceived quality/premium attributes (or
characteristics) Reducing transaction costs
2. Bundling products
3. Producing and marketing a commodity that improves operating efficiency
somewhere up the supply chain
4. Producers owning assets somewhere up the supply chain for further commodity
processing.
(Parcell, et al., 2009 p1)

Page | 35
Livestock value adding throughout the industry applies to simple changes to transaction
processes, right the way through to advanced bundling of products or services related to
livestock. An example of a current value adding technology that is currently diffusing
into the livestock industry is the use of Estimated Breeding Values (EBVs) which is a
genetic enhancement tool used by seedstockers (Herefords Australia Limited, 2009).
2.4.1 Genetic Gains Technologies
The genetic attributes of livestock herds on the farm are vital to the continued success
and overall improved growth of a producer’s livestock. Producers can use Estimated
Breeding Values, with the assistance of seedstocker, in order to analyse and purchase
the most appropriate animals to add to their herds. In a genetic sense, it is important to
maintain certain traits of some breeds of animal; this is particularly due to certain
markets requiring different qualities. EBVs then are predominately used in the seedstock
segment of the market because it is a very specialised knowledge (Herefords Australia
Limited, 2009). The actual EBV assessment is purely based upon statistical evaluation
and is an average measure of traits within a specific breed of livestock. It is thought to
be objective in nature compared to an environmental measure of the stock (such as how
fat an animal is) which is thought to be subjective (Herefords Australia Limited, 2009).
HAL (2009), however, stresses that visual assessment based on EBV should also co-inside
with animal purchase before any transaction is made by the purchaser:
“In all situations, EBVs should be used in conjunction with visual assessment for
other traits of importance (such as structural soundness, temperament, fertility
etc). A recommended practice is to firstly select breeding stock based on EBVs
and to then select from this group to ensure that the final selections are
otherwise acceptable.” (Herefords Australia Limited, 2009, p1)
Another shortcoming of the system is that a species to species comparison cannot be
made; this is a large drawback for potential users (Herefords Australia Limited, 2009).
This in itself, however, is not a major concern for the farmers because of the
comparative reliability that some EBVs can provide. For instance, the averaging of the
particular breed eliminates outliers within the sample. The information provided to the
client is based on a positive-neutral-negative scale and allows for easy comparisons.
Some authors also stress that consideration of the structural integrity of an animals is
also an important factor when using EBVs (Byrne, 2009).

Page | 36
Alongside the genetic comparisons gauged through average assessments is the need to
maintain ‘structural soundness’, or how particular animals’ physical traits compare to
the remainder of its breed (Byrne, 2009). This is an important consideration for
producers due to the context of their farm and market potential. As seen in Figure 2.6
below, producers and other assessors can judge the physical attributes of livestock
based on an assessment card (Byrne, 2009). This judging card measures the front feet
claw set, front and rear feet angle, rear legs side view and rear leg hind view. This
assessment is a grade of an animal’s genetic traits, measured on a scale of 1-9. This
‘innovation’ is a subjective measure based on a review of individual animals.
Realistically, this card does not provide an objective measure of stock as it still requires
an assessment and interpretation by staff.

Page | 37
Figure 2.6: Assessment chart of structural soundness of beef cattle
as adapted from (Byrne, 2009)
The use of EBVs as a value adding technology provides producers with the potential to
raise the genetic profile of the farm’s herd and therefore produce, on average, a better
quality product for sale. When assessing the livestock (beef cattle or sheep), a live
muscle score or expected saleable meat yield is another technology that has potential to

Page | 38
change the manner in which livestock are sold and bought (Bergen, Miller, Mandell, &
Robertson, 2004; Brethour, 1999; Burke, et al., 2004).
2.4.2 Livestock Assessment Technologies
Live muscle scores aim to predict the potential meat yield of an animal before slaughter
(Bergen, et al., 2004). This has benefits of increased profits for farmers if their herd for
sale is of a better quality than others for sale. Simply, if an animal has more muscle at a
better quality, the animal is therefore worth more. Traditionally, livestock were sold in
dollars-per-head format (Hassall, 2007) which did not account for better or well-muscled
stock. Therefore, the implementation of using live muscle score may lead to a more
objective measure of livestock value, by being able to assess the quality of meat. Perry,
McKiernan and Yeates (1993) argue that an objective scoring assessment is required to
make this new innovation possible. Currently, an industry wide change of the selling
format from dollar/head to a cents/kilo format has tried to achieve a more objective
value measure. The implication of live muscle score on the value chain is therefore quite
high, so long as the technology can be proven – and even more so – trusted by
stakeholders (Perry, et al., 1993). It is thought that this system is fairer on the market
and, overall, the industry has responded well to the changes to the process.
2.4.3 Physical Technologies
Radio Frequency Identification or ‘RFID’ technology is currently being used in the
Australian livestock industry and the global cattle industry for identification and tracking
purposes. The use of RFID technology is currently focused on monitoring the quality and
safety of end product, and is to be used heavily in the processing sector of the value
chain (Ribeiro, Scavarda, & Batalha, 2010). In Australia the use of RFID has been branded
under the National Livestock Identification System (NLIS) and is operated by MLA (Meat
and Livestock Australia, 2010). NLIS is the Australian scheme for livestock identification
and traceability and is designed to operate as a permanent feature for every animal
born in Australia over its lifespan (Meat and Livestock Australia, 2010). The NLIS
program, therefore, endeavours to provide data for farmers and regulators from birth to
slaughter. This effectively traces product integrity and food safety, and gives feedback
on market data specific to the farmers’ needs. NLIS was first developed in 1996, and
implemented in 1999 as a means of saleyards and agents being able to update

Page | 39
ownership records of specific cattle from property to property (Bailey & Britt, 2000).
Erickson (2007 p.113) states that “RFID is a technology with a tremendous potential to
not only make business more efficient, but to actually improve people’s lives.” Indeed,
this statement is true; however, the accuracy of the technology has been questioned by
some people in the Australian livestock industry.
Although the Department of Primary Industries reported that the adoption of the NLIS
was proceeding well (ABC Regional News, 2006a), other groups from the industry have
shown reservations about the RFID technology. Saleyard operators have been required
to outlay up to $30000 for the scanning system and software (ABC Regional News,
2006b). This influences the embedded costs for the grazier, who needs to re-gain this
expenditure through the sale of the livestock. Each individual grazier must also pay an
on-going cost associated with continual purchase of tags for animals. The RFID system’s
accuracy is questionable, with one media report stating accuracy was recorded to be
30% in 2006 (ABC, 2006); in 2007, another source stated it had improved to 98% (ABC
Rural News, 2007). Given this fluctuation in reports, by the same Australian Broadcasting
Company, it seems that either the industry had, indeed, greatly improved or the source
of the newspaper reports may have been biased. Nevertheless, the RFID technology is
inexpensive and seems perfect for continuing livestock application for the long term.
Another current technology that RFID is being used for in the livestock industry is in the
sensor networks for pasture analysis (Wark et al., 2007). This technology is being used to
track the movements of cattle in a given pastured property. This innovation aims to
provide unknown data to researchers about the day to day activity and movements of
the individual animals and as a greater herd. This study also presents theory on livestock
being tracked and located on property where once a helicopter was used to find the
cattle for mustering purposes. Trevarthen (2007) also explains the potential use and
benefits of RFID technology in the dairy farm industry. The author tries to persuade
dairy farmers not only to use the innovation but to widen their use of RFID into their
farming operations, so as to provide positive benefits through superior farming
management practice.
The objective assessment of live animals is a topic of high research importance in the
industry. Bergen (2004) presents research the use of ultrasound, weight and linear
measurements to predict young bull carcass compositions, and explains the gap within
research on the industry: “Although many genetic improvement programs use

Page | 40
ultrasound data collected on young bulls, very little research has been conducted to
determine the ability of ultrasound measurements to evaluate carcass composition in
young bulls” (Bergen, et al., 2004 p.23-24). The author concedes that the technology is
limited by using only the 12/13th rib for assessment. Therefore, for further assessment,
the study implemented a linear measuring of the physical properties of each animal
using a proprietary ‘Isonification’ method.
Currently a farmer must push down on each lamb’s back, immediately behind the rib
cage, to feel for fat under the coat (Burke, et al., 2004). This process, called ‘palpation’,
is subjective and therefore an animal’s value, based on this type of inspection, is
debatable. Image assessment tools that have previously been used on salmon and pigs
were examined and evaluated within the context of sheep (Burke, et al., 2004).
Conclusions of the discussion point toward using the heart girth of the animal, as it can
be used as a reliable guide for estimating the weight of a wide range of animals (Burke,
et al., 2004). However, the authors conclude that “On the basis of this report it is not yet
feasible to say that we can use image analysis to predict the weight of sheep” (Burke, et
al., 2004 p.20). Burke et al. (2004) point toward the use of ultrasound combined with
the assessment of image processing; however, they concede that further research
would be needed.
2.4.4 Online Technology
As well as the tangible innovations documented earlier in this chapter, the Australian
livestock industry has also seen a rise of online-based, or computing innovations
(Driedonks, et al., 2005; Rolfe, Gregor, & Menzies, 2003). Historically, attitudes towards
computers and the internet have been documented as negative (Frank, 1997). However,
in recent years, the industry has seen a rise in the use of the computer in farm contexts.
In 2001 the proportion of farms using the Internet rose to 58%, from 40% in 1998 (Rolfe,
et al., 2003). Since this period, the industry has seen a steady growth of this percentage,
rising to 66% of farms using the internet and a computer (Australian Bureau of Statistics,
2008). Rolfe et al. (2003) report a positive correlation between farm size and the use of
a computer/Internet. Continuing on this point, the 2003 article suggests that the use of
information technology (i.e. computers/Internet) can lead to a focus on cost reduction,
which encourages overall innovation. Rolfe et al (2003) suggest that this therefore
means producers would be more likely to be attracted into adopting additional

Page | 41
productivity measures. The authors also continue to suggest that the adoption of
communication technologies such as the Internet may lead to increased ability to
market their products, potentially cutting out middle marketers and reducing costs.
Moreover, the article suggests that computers were more likely to be utilised in
accountancy or budgeting, rather than for production gains functions. Interestingly,
Rolfe et al., (2003) reported that the levels of value differed between the use of
computers and the use of the Internet, with the perceived value of the Internet being
lower than the perceived value of the computer:
“There was little support for the Internet helping to improve service, control
inventories, reduce costs, or differentiate services and only modest support for
the Internet helping to improve response time for goods ordered, or to improve
competitive advantage.” (Rolfe, et al., 2003 p 35)
These findings also concluded that the Internet did not rank very highly as electronic
communication for personal and social reasons, indicating an attitude that information
technology is merely to be used for business operations. The research also suggests that
“The benefits of computer use are moving from the cost minimisation phase towards
improved management and production phases. This will lead to computers being used
to achieve production gains” (Rolfe et al., 2003 p.40). However, the age of this research
(seven years old) must be considered in relation to its findings. There is a gap in recent
literature on the topic of internet adoption in the livestock industry. The paper also does
not consider the socio-cultural implications of the adoption of the Internet. Indeed, the
paper comments that many respondents pointed out that there were significant time
investments needed to learn how to use computers and, therefore, few benefits were to
be gained by adopting the innovation. However, given these findings, the opportunity
for the industry to move towards an online marketplace for livestock transactions could
be further explored.
2.4.5 Electronic Sales Markets
Gengatharn reports that “In the agricultural markets, although the benefits of e-markets
were well documented, most attempts at e-markets failed due to inadequacies or
immaturity of the technologies, inertia resulting from the large investments in existing
physical infrastructures, the reluctance by actors to embark on a new round of
organisational learning and the absence of a leader” (2006 p.25). The first attempt to

Page | 42
produce an online presence within the livestock industry was Computer Aided Livestock
Marketing (CALM) in the form of an electronic saleyard (Driedonks, et al., 2005). It ran as
a platform for the sale of beef cattle, sheep and pigs. Initially, this was funded and
operated by the Australian Meat and Livestock Corporation (AMLC) (Clarke & Jenkins,
1993). In its design, CALM was to:
Improve operational efficiency, by lowering the costs of sale and of transport,
and decreasing livestock stress and meat bruising
Improve market pricing efficiency, by increasing market information, and
enabling participation in the market by remote buyers
Improve meat quality and the match between product characteristics and
market demand, by enabling direct transport of livestock to abattoirs and
increasing feedback to producers. (Clarke & Jenkins, 1993 p.62)
CALM operated from 1987-1995 under ownership of AMLC where it ran at a loss for the
entirety of its operation due to poor adoption levels by stakeholders. This slow diffusion
of the system saw CALM sold and re-launched in 2000, and rebranded as AuctionsPlus
(Driedonks, et al., 2005). The potential for such an online environment where sellers
could interact with buyers seemed very attractive, but this system has only seen steady
gains in the past five years (Wignall & Jones, 2009).
In their studies of AuctionsPlus, (Courtney, 2009; Driedonks, et al., 2005) interviewed
experts, opinion leaders and farmers as to why they thought the electronic system had
not seen dramatic growth as was widely expected by researchers. Driedonks explains
that “The experts believed that usage of AuctionsPlus was just below or ‘on the edge’ of
critical mass” (2005 p.63); that is, short of where it has previously been found to be
necessary to sustain an operational business (Grieger, 2003). This critical mass is the
minimum defined mass of customers that any business must maintain to sustain
business growth and profitably. It was found that AuctionsPlus did not adequately
provide the social experience offered by saleyards or other selling modes (Clarke &
Jenkins, 1993; Driedonks, et al., 2005).
A successful example of a social business model extension within the livestock industry
was in the American market and is explained by Bailey et al. (1991). They present

Page | 43
research on an alternative approach to introducing a social aspect to online
marketplaces. Superior Livestock Auctions (SLA) utilised video footage of ‘for sale’ cattle.
Auctions were reported to be concluded within two minutes and achieved better net
returns for farmers: “By as much as $6.65-$23.52 per head” (Bailey, et al., 1991 p.472).
The added benefits included reduced costs with no need to truck cattle and pay saleyard
fees, and the animals are less stressed through less handling; this improves quality (the
same strategy currently employed by AuctionsPlus). Therefore, prices paid will be higher
through fewer health problems in the cattle. This implies that buyers will increase their
bids for better quality products (Bailey, et al., 1991). As the Superior Livestock auctions
began in an intranet form, the directors initiated the auctions in local hotel ballrooms, so
larger numbers of buyers could assemble and not worry about the technology
requirements for the auction (Superior Livestock Auction Inc, 2008). This created a social
aspect for the auctions, and a corresponding gradual acceptance of the method to the
point that SLA could conduct auctions via television with a partnership with a rural
television station in America. SLA report sales of 1.3 million head of cattle being sold via
the television broadcast system per year (Superior Livestock Auction Inc, 2008).
Online technologies in the livestock industry appear to take the form of marketplaces,
aimed at replacing the physical auctions and taking a percentage of market-share.
However, it seems that as long as the social dimension of local agents (who act with
influence over the market) exists, this online industry in Australia will not be supported
by stakeholders, to the extent that Superior Livestock Auctions is a success in the
American market. Driedonks et al. (2005 p.63) summarise the situation by suggesting:
“They (agents) often provide a very important social and commercial link between the
relatively isolated cattle producer, his industry group, and the outside world”. The
societal influencing factors that agents bring to the livestock market may be reason
toward the very slow diffusion rate of online marketplaces. Driedonks et al. (2005 p.64-
65) surmise that there are three distinct and apparent reasons for the non-adoption of
AuctionsPlus in Australia:
The nature of the cattle producers’ social system and its characteristic
communication channels – (Traditional saleyard auctions & Social aspect of
interaction)

Page | 44
The kind of innovation decision to be made and power distribution in the
industry –
(Most stock agents [non-owners] did not encourage adoption of the system)
Lack of critical mass – (lack of appropriate opinion leaders influencing the
remainder of the market to adopt).
AuctionsPlus, as one online environment in the livestock market, maintains a market
share of 0.7% of cattle sales and 2.3% of sheep sales; this amounts to balanced net
profits yearly (Wignall & Jones, 2009). Wignall and Jones (2009) report that these figures
have been steadily maintained over a decade, showing only small growth. Hence, the
diffusion of the online market place within the industry is occurring, albeit slowly. In her
thesis, Gengatharn (2006) lists the barriers to adoption of generic e-marketplaces in a
rural context:
The regional profile
The ownership of the platforms
The timing or development process
The resources required not only to develop the platform but also to train both
the rural stakeholder and businesses.
While Gengatharn’s (2006) thesis only discusses rural societies’ uptake of internet
trading systems within Western Australia – and these not within a livestock context – it
is, nevertheless, a very thorough source concerning the success of e-trading systems.
The success of an internet trading system is also affected by the developer’s recognition
of the market being entered into, its stakeholders, and the environmental factors within
the market. Gengatharn (2006 p.iv ) states: “As such, the development and
management of such platforms need to be viewed through a multi-focal lens, which
encompasses the cultural, social, economic and technical or system perspectives.” The
major findings when constructing online trading systems are listed to be:
Suitability of business type to Internet trading
Platform ownership structure and governance that engender trust and build
critical mass by including SMEs in the development and management process
Matching platform focus and structure with regional profile by leveraging
community ties and existing business relationships
Adopting a staged approach to platform development

Page | 45
Ensuring that benefits are understood by SMEs and promoting the platform
widely. (Gengatharen, 2006)
2.4.6 Summary of Technology within the Livestock Industry
The technology within the Australian livestock industry has usually been in the form of a
value-adding orientated innovation. This is true in the case of EBVs, RFID tagging and live
fat scoring processes which, in places, are still slowly being diffused into the market.
Typically, new products such as CALM (now AuctionsPlus) have also taken a very long
time to diffuse into the industry. Importantly, novel technologies in the livestock
industry have been made available throughout all sectors of the value chain, and similar
diffusion within these different sectors has been documented.
This section of this review is quite important to the greater context of the thesis, as
identifying the traits and qualities of successful and unsuccessful technologies is
obviously important to the future implementation of novel systems. This section
identifies the overall incremental nature of previous technologies introduced into the
market, and recognizes factors relevant to the subsequent adoption of these
technologies. However, although this section of this literature review deals specifically
with existing technologies and (briefly) the actual success or adoption of these, the
thesis has not yet presented literature on the actual process of innovation adoption.
Hence, this necessary information is explored in detail below.
2.5 Adoption of Innovations
The mere presence of a technology in a marketplace does not automatically lead to
adoption or uptake. The rate of adoption is defined as: “The relative speed with which
an innovation is adopted by members of a social system… It is generally measured as the
number of individuals who adopt a new idea in a specified period” Rogers (1995 p.211).
Therefore, understanding how this adoption process occurs and operates is the key to
the uptake of any innovation. As previously suggested, a perceived ‘better’ system (such
as AuctionsPlus) is not always what the members of the value chain want, or more
importantly, is not what they perceive to be needed. It is often hard for change to occur
by simply asking people to adopt a new process in place of an old one. Therefore,
introducing change over time, and in conjunction with previous processes (if available),
is preferred. Two theories of human behaviour – the Theory of Reasoned Action (TRA)

Page | 46
(Fishbein & Ajzen, 1975) and the Theory of Planned Behaviour (TPB) (Ajzen, 1991) can
help to both explain and aid the adoption process faced by graziers in the livestock
industry. They advocate appealing to the ‘social norm’ that is expected of them.
2.5.1 Social Theories of Behavioural Control
The Theory of Reasoned Action (TRA) and the Theory of Planned Behaviour (TPB) (Ajzen,
1991; Fishbein & Ajzen, 1975) have previously been used to understand and predict
socially noteworthy behaviours such as the adoption of new innovations (Fielding, Terry,
Masser, & Hogg, 2008); however, until recently, the social identity aspect of changed
behaviour has not been linked to these theories. The TPB states that people’s behaviour
is dependent on their intention to engage in such a behaviour and, therefore, is
subjected to influence on three sub levels: (1) Attitudes, (2) Subjective Norms and (3)
Perceived Behavioural Control (Fielding, et al., 2008). If an attitude to a particular
technology is positive, logic tells us that this technology will be adopted. The subjective
norm is based around the social pressure or influence of our peers. Perceived
behavioural control, then, describes the self’s own perceived ability to make a conscious
decision to balance these attitudes and social norms in order to choose/not to choose to
change behaviour (such as adopting technology). The use of TPB and social identity
theory (Fielding, et al., 2008) is an important step towards understanding the social
makeup of the livestock industry, which is heavily reliant on traditional and social
constructs:
“By adopting a social identity approach, it can be argued that if behaviours, for
example agricultural practices, are centrally linked to a social identity (e.g. rural
landholder), it will be the norms of that group that will influence behaviour
rather than the expectations and desires of generalised others.” (Fielding et al.
(2008 p.25)
In the case of the Australian livestock industry, it is important not to discount the effect
of ‘in-group’ perceptions (peers/farmers) and ‘out-group’’ (agents) influences. When the
in-group and out-group opinions vary, the social identity approach (Fielding, et al., 2008)
recognises that members within the groups react according to the power/status and the
perceived legitimacy and stability of the other group. If the in-group (farmers/value
chain) are negative to the recommendations of the out-group (agents, etc.), behaviour
will typically not be adopted as a protest against the power indifferences. Consequently,

Page | 47
the TPB and TRA need to include such outer influences in behavioural change
approaches. Consideration of the TPB and TRA may lead to a higher adoption rate in the
commercialisation of a new technology or system.
Perhaps with the inclusion of social pressure and influence, acknowledgement of the
TPB could provide more scope for the Australian livestock industry to promote the
uptake of innovation. Interestingly, Frank’s (1995) study of innovation adoption of North
Queensland beef farmers suggests that, when adoption took place, farmers were more
likely to adopt sets of innovations, rather than single innovations. A conclusions from
this finding was that innovation should be implemented in conjunction with existing
processes. Neither of the discussed models allows for multiple sets of adoption; rather,
they both focus primarily on the adoption of an individual innovation. Assessing this
multiple adoption seems a strong and valid issue for the Australian livestock market.
2.5.2 Social Inclinations of Adoption
In order for outer groups to implement change in the value chain of the livestock
industry, the understanding that change brings a new social dimension must be
managed and understood. Frank (1995) found that the characteristics of successful
graziers (Northern Queensland) were completely contrary to the typical characteristics
used for classifying adopter typology (Rogers’ categorising model). The out-group looks
upon the graziers’ failure to adapt to technology and regards them as ‘laggards’ – usually
seen to be a critical term. However, the assessment of the social hierarchy within the
farmer’s mind may be the reason for the non-adoption, rather than the failure to view
the economic opportunity that may come with innovation (Frank, 1995; Pease & Rowe,
2005). The economic reasoning behind innovation adoption, then, is not high on a social
acceptance model of technology: the farmer assesses the technology according to the
appropriateness of its merits in adjusting to a different social standing. Another method
that the farmer uses to evaluate adoption of a process or innovation is the assessment
of the perceived usefulness or ease-of-use of that system.

Page | 48
2.5.3 Usefulness and Perceived Ease-of-use
The technology acceptance model (TAM) was first conceived by Davis (1989) and
assumes that when a user is first presented with a new technology, they use two
approaches for evaluation: (1) Perceived usefulness and (2) Perceived ease-of-use. The
perceived usefulness of an innovation may be referred to as the “degree to which an
individual believes that using a particular system would enhance his or her job
performance” (Lynch, et al., 2000 p.611). Therefore, the usefulness of an innovation may
lay in the fact that it assists the performance of a rudimentary task – doing it more
quickly or improving the quality of the outcome. The second aspect of TAM is the
perception of ease-of-use that a person has of technology, in particular, of its adoption.
Rogers’ ‘Diffusion of Innovations’ uses “Relative Advantage” (1995 p.229) to describe
the effect of the TAM, although the term is construed towards a social advantage of
usefulness. Lynch et al. (2000 p.611) suggests that “Perceived usefulness was 50% more
influential on adoption over the ease-of-use”. This correlates well with Sinjaa et al.’s
(2004 p.1) study of African farmers’ technology perceptions: “Adoption depends on
users’ judgement of the value of the technology to them…Users will reject a technology
that is not relevant to their needs”. However, the fundamental flaw in the technology
acceptance model is that is does not allow for social influence on behaviour (Mathieson,
1991).
Mathieson (1991) compares both the TAM model and the TPB as tools to identify
reasons and approaches to adoption intentions. The study found that although the TAM
is relatively inexpensive compared to TPB, its results fall short of the information that
TPB is able to provide. Mathieson (1991) compares the two models by suggesting that:
“The information TPB furnishes is probably more useful during development and
post-implementation evaluation than the information TAM provides. TPB can
focus development efforts on specific problems. For example, while TAM
might show that respondents feel that a system is marginally useful, TPB would
show which of a set of outcomes was not being achieved. TAM would tell
developers that a system was not easy to use but would not identify other
issues that might prevent system use.” (Mathieson, 1991 p.187)

Page | 49
2.5.4 Physical Barriers to Adoption
In a rural context, farmers and members of the value chain often do not have complete
access to the same services as city dwellers. The causal effect of remoteness of dwelling
on adoption of innovations may be another factor in the non-adoption of technology.
Sunding and Zilberman (2000 p.43) found that “Regions that were farther away from a
focal point (major cities) had a lower diffusion rate in most time periods”. This may be
due to the fact that their remoteness means that they cannot operate under the same
social perceptions that other more connected farmers do. In lay terms, it is simply that
the very remote farmers cannot observe other farmers using innovations and therefore,
as discussed by Rogers (1995), they will not adopt the technology. Encouragingly,
however, an increasing rate of technology adoption throughout the industry at present
might be due to increased local media and national media sources that rural areas can
now access through the Internet and television.
As seen earlier, there is a significant body of literature on the subject of the adoption of
innovations of new processes. The early marketing theories of Planned Behaviour and
Reasoned Action (Ajzen, 1991; Fishbein & Ajzen, 1975) develop commercialisation
strategies for businesses to properly target their respective products at the right types
of customers. This is effective in the marketing of consumer products and brands that
have a low customer loyalty rate; however, as described at the beginning of this chapter,
the value chain of the livestock industry has a conservative history and the majority of
the industry seems to be loyal to traditional, more ‘social’ ways of operating. Therefore
in order for an innovation to succeed in the livestock industry, therefore, it must appeal
to a stakeholder in more of a social sense (Frank, 1997). Within the social acceptance
model of technology (Frank, 1997; Guerin, 2000), economic reasoning factors do not
rank highly in the reasoning of adoption in the Livestock industry. This is exemplified
when a producer judges a technology on its social acceptance and status. However to
simply not consider economic incentives in the development of innovations could then
be naïve as well, thus Frank and Guerin argue the need for both approaches when
innovating for a livestock context
Obviously then, a radical innovation must pose an economic incentive to a stakeholder
as well rank highly in the TAM model (Davis, 1989, 1993). In simple terms, a new radical
innovation must provide economic incentives, and a better and easier sequence of use
(than the product/process it replaces). Its social appeal is the last factor which pushes it
over the ‘adoption line’. However, it has been seen that social appeal is the major

Page | 50
influencing factor in innovation adoption; once this factor is acknowledged and
appropriately exploited, an innovation may be more likely to succeed within the market.
2.5.5 Centralisation of Resources
The Australian rural landscape has become more connected as technology and media
have begun to stretch across the industry, facilitating farmers’ communications. The
current trend to centralise the marketplace has also seen half the saleyards of Australia
close down (Courtney, 2009). The Central Tablelands Livestock Exchange (CTLX) is a
recently opened ‘super saleyard’ that amalgamated three local smaller saleyards to
cater for all sellers. Grieger (2003 p.282) defines a marketplace as: “A historically
evolved institution that allows customers & suppliers to meet at a certain place and at a
certain time in order to communicate and to announce buying or selling intentions,
which eventually match and may be settled.”
Interestingly, stakeholder attitudes to this new institution have been negatively affected
by their attachment to the three old saleyards. It is likely, moreover, that some sellers
may consider alternative and more cost effective approaches to marketing to avoid
having to travel further to market livestock. Therefore, the shift to online (and ironically)
completely centralised markets may soon be the response to the need to travel
increasing physical distances to sell stock. One new innovation within the Livestock
industry is described by McIntyre (2009).
An Australian Livestock library has been launched (2005) for all members within the
value chain of the livestock sector (McIntyre, 2009). This online database provides
stakeholders with information about the current trends and research in their field. This
resource is purely a reference point and acts as a free service to the market (McIntyre,
2009); nevertheless, it is a good example of the industry recognising that it needs a
higher degree of connectivity and access to information. The Livestock Library,
therefore, presents an opportunity for farmers to use its potential as they see fit; more
importantly, however, it is a step closer toward the industry becoming ‘technology
savvy’. The Livestock Library is not a commercial activity; as such, it is likely to gain
increasing popularity and use within the industry, because graziers do not feel pressure
to use it and no one is trying to sell them products/services.

Page | 51
2.6 Summary of Literature Review
This review of the Australian livestock industry covered a broad range of literature
describing the historical influences on the industry and how the industry came to be to
this present day. An evaluation of the stakeholders was presented and explained,
including an analysis of the local sales agents who have established a significant social
influence throughout the industry. The theory of the diffusion of innovations was
presented and critiqued by numerous authors. The social dimension of the adoption of
innovations was explored, and the original theory of diffusion expanded on. Following
this, a discussion of the technologies within the marketplace was presented and the
implications that these have had for the industry were put forward. Investigations of the
adoption of innovations were also presented, including the effect of the current
tendency for the industry to become more centralised as more technologies are slowly
adopted. Chapter Two presented a review of the livestock industry literature. To build
on this, Chapter Three presents the theory surrounding disruptive innovations.
2.6.1 Identified Gap in the Literature
Through the review of the livestock industry literature, certain gaps in knowledge have
been identified. Firstly, in the livestock industry literature, Guerin (2000) in his paper
“Overcoming the constraints to the adoption of sustainable land management practices
in Australia” details the need for researchers/designers to embrace a participatory
approach to the development of future technologies. The lack of a participatory
approach in the agricultural industry is, therefore, the first identified gap in the
literature.
Further to this point, the literature does not document the application of design
methodologies in the Australian livestock industry. While numerous authors (Frank,
1995, 1997; Guerin, 2000; Clarke & Jenkins, 1993; Driedonks et al, 2005; Rolfe, 2003)
document the failure of traditional approaches to innovating new technologies and
systems, there seems an opportunity for the use of design to better understand the
industry’s stakeholder needs. With the identification of this second gap in the literature,
it is argued that using participatory design approaches to develop novel processes and
technology in the livestock industry could facilitate their later adoption.

Page | 52
2.6.2 Impact on Thesis
The identification of the two above mentioned gaps in the knowledge within the
Australian livestock industry has certain implications for the work of this thesis. The
most significant implication is that, in the past, innovations which are ground breaking
or disruptive in nature have been very unsuccessful in the industry. Therefore, this thesis
investigates the application of a disruptive technology in the industry, utilising proven
design methodologies. Its contribution to knowledge lays in the documentation of how
design led innovation can be used to engage industry participants. As a foundation to
this documentation, it is important to explain disruptive innovations (Chapter Three)
and the design methodologies (Chapter Four) that are used (in the context of this thesis)
to engage the stakeholders of the Australian livestock industry.

Page | 53
Chapter 3 Disruptive Innovation
3.1 Introduction
Chapter two introduced the Australian
livestock industry and the current literature
written about it, in order to contextualise the
work of this thesis. Chapter Three moves
away from the livestock focus and instead
considering both design and traditional
business management theories of new
product development. In this way, this
chapter looks to combine livestock industry
issues with business and design literature in
order to propose design disruptive products
for the technology focused Australian
agricultural industry. Firstly the chapter presents literature on traditional new product
development.
New product development
The process of designing novel products and/or services in any market is called ‘new
product development’ (Cooper, 2006). Traditionally, new products or innovations have
been described and categorised into three differing clusters, as outlined in Table 3.1.
3.1 Introduction
3.2 Defining Disruptive
Innovation
3.3 Applying Disruptive
Theory
3.4 Disruption of
Livestock Market
3.5 Contribution of
Disruptive
Innovation to Thesis
3.6 Proposed Disruptive
Technology

Page | 54
Table 3.1: Product Classification Matrix
Source: Adapted from (Wheelwright & Clark, 1992)
The product classification matrix (Table 3.1) illustrates new products or innovations
traditionally classified as: Breakthrough, Platform Products or Incremental Products.
Incremental products typically consist of products that represent cost reduction,
improvements to existing product lines, or that address well identified needs using
existing technologies. Platform products or ‘architectural’ products aim to establish a
base architecture for the next generation of a new product or process. However,
Breakthrough products differ from the two previous categories in that products which
fall into this group are novel in process or technology; they employ novel core processes
and combine this with a novel product form. These Breakthrough innovations are risky
ventures; however, the return on investment is much higher than for the other two
categories, especially if the product needs to establish its own market.
This traditional product classification matrix (Table 3.1) has not proven to be effective in
the application of new products in the Australian livestock industry. This ultimately
comes down to a multitude of reasons, but most significantly, the matrix does not cater
for external factors; for instance, it does not include a social dimension which (as
discussed in Chapter Two) is quite important for the livestock industry.
In Chapter Two, the literature reviewed and summarised previous innovations that were
designed according to traditional market-orientated needs. Some of these innovations

Page | 55
have been primarily driven through new processes and technologies that have come
about through market need. This continual incremental innovation cycle will, however,
not drive the industry into the future: it is only through ground breaking innovation that
the agricultural industry can move forward. Christensen (1997) details the potential of
what he calls ‘disruptive innovations’ and argues that new markets can be formed even
where the mainstream market does not have a direct benefit/need. Christensen’s (1997)
book ‘The Innovators’ Dilemma’ focuses on the Breakthrough innovation product
category, and argues that disruptive innovation can have significant success with
appropriate design strategy.
3.2 Defining ‘Disruptive Innovation’
A disruptive innovation falls within the Breakthrough category of ‘a novel process or
innovation’. However, a disruptive innovation differs from Wheelwright & Clark’s (1992)
categorisation of the category in that a disruptive innovation has no market to sell into.
More accurately, these innovations hold no perceived value in a contemporary
mainstream market in which they are applied. In fact, Christensen (1997) describes a
disruptive innovation as being of poor performance and having no competitive reason to
be used by the mass market. Alternatively, Daneels provides an accurate definition of
disruptive innovation as: “ a technology that changes the bases of competition by
changing the performance metrics along which firms compete” (2004 p.249).
On initial reflection, a reader may simply reject this theory on the assumption that to
design for disruption is a path with no end. However, a deeper understanding of
disruptive innovations will illustrate that the niche of disruptive technology is its
application to a small market, where its perceived ‘weaknesses’ (from the mainstream
perspective) are in fact ‘positive’ attributes to users in the smaller market (hence the
change of metrics, as Daneels describes above). Christensen (1997) describes this
segment of the market as the least demanding. Therefore, targeting the replacement of
a lower performing technology for these least demanding users is the first step in the
disruption of an incumbent market. Over time, the technology is developed and the
needs of more demanding users begin to be met; typically, the market expands and then
acquires the incumbent market share and the disruptive innovation is diffused into the
mass market (Rogers, 1995).

Page | 56
In order to understand the process of disruption of a mass market, it is important to be
aware of a product’s lifecycle, as seen in Figure 3.1. The conventional technology S-curve
depicts the traditional path that a product’s base technology follows in its life cycle.
Importantly, there are two apparent levels (the blue and green lines) that represent a
consumer’s need for product performance. In every market there are customers that
require the highest level of product performance and others that only need a lesser
degree of service from the product. This s-curve encompasses all three of the product
category groups, as categorised in Table 3.1. It is important to add that Christensen
(1997) states that nearly all technologies/innovations are disruptive in their first market
implementation. Hence, the ‘first technology’ (as viewed in Figure 3.1), may be a
disruptive innovation or the ‘breakthrough’ product/service.
Figure 3.1: Adapted conventional technology S-curve (Christensen, 1997)
As time continues, a company may implement additional ‘platform’ products to
supplement the initial disruptive innovation and to ‘boost’ their market share. Following
this process, other ‘incremental’ products are added to the product family to draw the
maximum market value from the first disruptive innovation. This process continues and
other secondary companies usually enter the market to obtain a share of the new
markets value. Therefore, a challenge for companies is to know when to implement the
new ‘sustaining technology’. Christensen provides an example of this in the
development of USB devices (which, when first introduced, disrupted the floppy disc
market) from 128mb to 60G platforms, to the (soon to come) three dimensional data

Page | 57
storage devices which are currently being researched and developed (Christensen, 1997;
Cumpston et al., 1999).
We have seen that once a disruptive innovation has been introduced to market,
companies are likely to try to maintain a high share in the market and introduce
sustaining innovations (‘platform’/’incremental’ products) to hold the innovation afloat.
However, the process of the ‘first disruption’ has not thoroughly been explored. In order
to comprehend the process of disruption, Christensen (1997) uses a three step
innovation disruption graph as seen in Figure 3.2 (below).
The first graph (#1) within Figure 3.2 indicates the growth of a given technology as the
straight line, with the parallel hashed line representing the market requirements/needs.
Christensen (1997) points out that any given technology usually over services the
market, put simply its capability is often more than the markets need or what it
perceives itself to require. However despite this, he also demonstrates that (typically)
the disruptive innovation does not meet the mainstream markets requirements (market
requirements are represented in the second graph by the X) and, therefore, most
companies choose to dismiss the technology immediately. Therefore, a company must
recognise the smaller niche market and target innovations to these markets in order to
develop the technology until, as seen in the third graph, the diffusion over time of the
disruptive innovation is accepted by, and excels in, the mass market. Sainio &
Puumalainen (2007) report that most companies will generally choose not do this
because of the negative appeal of disruptive innovations: “Since the new technology
may be viewed objectively as crude, it leads to the belief that it will find only limited
application” (Sainio & Puumalainen, 2007 p.1327).
However, as previously mentioned, this initial shortcoming is supplemented by
implementation of the technology in a smaller niche market, where its perceived
crudeness or limitations become the technology’s strong points and are what drives the
success of the innovation.

Page | 58
Figure 3.2: Adapted innovation disruption graph (Christensen, 1997)
The innovation may effectively ‘cannibalise’ (an explanation of this term will be
presented further in this chapter) the old technology; however, as long as the company
can control this phase, it stands to secure a larger market share than before. Christensen
(1997) warns against the company then becoming complacent about its market and the
need to continually add sustaining technologies to uphold the company as a market
leader. He suggests that this complacency is very common and that it is astonishing how
an entrant company (typical of those introducing a disruptive technology) allows other
entrants to eventually replace them as the new incumbent company.
3.3 Applying Disruptive Theory of Innovation
Chapter Three has so far presented the theory of disruptive innovation. This section
aims to build upon this knowledge in order to present ways to apply a disruptive
innovation. It outlines the practical approaches that a company may follow in order to
successfully innovate radical innovations. Christensen (1997) presents four key
principles in the theory of disruptive innovation (Table 3.2) and explains that these four
factors are the main reasons why strong companies fail in any particular industry.

Page | 59
Table 3.2 Four principles of disruptive innovation
Principle Implication of Principle
Principle
1
Companies depend on customers
and investors for resources/new
ideas
The large companies often listen only
to what their customers want and this
strategy is deemed to be smart. But
often customers do not know what
they need.
Principle
2
Small markets don’t solve the
growth needs of large companies
Companies must continually look to
bigger markets in order to satisfy
shareholders.
Principle
3
Markets that don’t exist can’t be
analysed
Large companies cannot afford to take
risks in small unidentified markets.
Principle
4
Technology supply may not equal
market demand
If a company does identify a new
market, often the supply of the
technological components means it is
just not viable for that company to
enter it. Therefore a disruptive
technology which is flexible enough
can fill the small market need and
eventually overtake the incumbents
market share.
Christensen identifies that successful companies are built upon ‘smart’ business
strategies and work to create continued wealth in their markets. However, continuing to
work with the same principles that helped them to continually grow, Christensen
explains, ultimately causes a company to fail. This is because a company needs to
continually grow and increase profits; however, this takes them to a point where
investing in small markets is no longer viable. Therefore, when these small markets
develop into bigger ones, it is too late for the incumbent company to act and it cannot
compete with these new companies. Christensen (1997) argues that it is an intelligent
business strategy to consider disruptive technologies to move a company forward into

Page | 60
new markets. In “The Innovators’ Dilemma”, Christensen lists four steps to addressing
the successful implementation of radical innovations:
1. Give responsibility for disruptive technologies to organisations whose customers
need them so that resources will flow to them
2. Set up a separate organisation small enough to get excited by small gains
3. Plan for failure. Don’t bet all your resources on being right the first time. Think
of your efforts at commercialising a disruptive technology as learning
opportunities - Make revisions as you gather data
4. Don’t count on breakthroughs. Move ahead early and find the market for the
current attributes of the technology. You will find it outside the current
mainstream market. You will also find that the attributes that make disruptive
technologies unattractive to mainstream markets are the attributes on which
the new markets will be built.
These four steps guide large companies in the innovating process of radical
technologies/processes. Typically, these large companies are well established, with a
vast array of product families and well defined target consumer bases. However, the
nature of a disruptive innovation is that these innovations, based on a novel technology,
have the potential to displace a company’s existing product families; effectively
destroying an existing market share. Hence disruption of an existing market seems a
risky approach for an incumbent company. This approach is termed ‘cannibalisation’
which was earlier introduced but not further explained. Christensen (1997) poses the
theory that a company must embrace this cannibalisation in order to survive the threat
of new disruptive innovation, both from internal and external sources.
Company survival through cannibalisation
“The Innovator’s Dilemma” (Christensen, 1997) details a strategic plan to maintain a
competitive company whilst developing disruptive innovations. Here the concept of not
listening/ignoring customers’ wishes is explored in order to apply the theory; this is to
challenge the old practice of listening to customers and providing them with what they
want, as previously mentioned. An example of not listening to customers was
exemplified by the Sony ‘Walkman’ product development, where there was no
perceived need in the marketplace, yet the company ignored their customer feedback of
the product and developed it anyway (Assink, 2006). Both Assink (2006) and Christensen
Page | 61
(1997) conclude that a company’s ingrained business model might be the source of
failure to create disruptive innovations, in that the ‘smart’ strategies that managers of
these companies employ, ultimately lead to their demise. Large companies are run upon
strict operational guidelines that have made them successful. To deviate from these
operating systems seems to be bad business judgement; after all, the company became
successful based on these principles. Herein lies the problem of using disruptive
innovations. Christensen explains that the only way to prevent competition from
attacking a company’s product line is for the incumbent to do it themselves.
Christensen explains that companies find it obviously hard to disrupt themselves as it
simply does not make financial sense. However, at the end of the day, it is better for a
company to erode its own market than to have a small entrant competitor do it for
them. Therefore, Christensen justifies that this is a step that large companies must take
in order to remain at the top of the marketplace. This gives the parent company
controlling rights over the new entrant and, if business succeeds/fails, the company can
always step in and take control of the business.
As seen above, the theory of disruptive innovation can be used as a powerful tool for
companies and designers to remain at the front of their market. The theory is now more
closely examined and alternative opinions are presented.
Examining Disruption Innovation
The theory of disruptive innovation is not a widely known/studied business strategy
theory, even though “The Innovators’ Dilemma” (Christensen, 1997) was published over
a decade ago. This theory of disruption also lacks critical practical application in the
design world, as the theory of disruptive innovation has traditionally been applied to
management theory. In reviewing disruptive innovation, Markides (2006) argues that
the term ‘disruption’ has been applied too broadly throughout the literature where the
same term is applied to different types of innovation. Markides uses this example:
“A disruptive technological innovation is a fundamentally different phenomenon
from a disruptive business-model innovation as well as a disruptive product
innovation: These innovations arise in different ways, have different competitive
effects, and require different responses from incumbents.” (Markides, 2006 p.19)
Page | 62
This response to the generalisation of the term ‘disruptive innovation’ is well explained
and quite valid. Indeed, it is pointless to apply the same term to different types of
innovation if it is only for the sake of ease. Markides examines the point that business-
model disruption is different to the disruption of markets via radical product
innovations, and argues that each case poses radically diverse challenges for the
established firm.
Christensen recommends that an existing firm can avoid succumbing to smaller, new
entrant companies by literally starting their own smaller niche or off-shoot company.
However, Markides (2006) interestingly takes a negative stance on the issues of creating
a start-up entrant to implement radical innovations, arguing that “The available
literature on business-model innovation does not support such an extreme position”
(Markides, 2006 p.21). Instead, his argument suggests that the business-model
innovation usually adapts quickly to the new entrant/s and that the new entrant takes a
percentage of the market but never really replaces the traditional way of business.
Markides (2006 p.21) offers examples of this – low cost air travel and Internet
banking/brokerage – claiming that these two industries had not captured more than
20% of the market from the year 1995 (to the time written). Markides does not expect
that either industry will grow to ever take a full 100% of the market. Therefore, the
article aims to prove that businesses indeed have other options than to invest capital
into a project that is not economically sound. However, Markides (2006) later concedes
that, in fact, there are three distinct times when a company must do as Christensen
(1997) suggests and develop an alternative brand to meet competition:
When they enter a new market where entrenched competitors have first-mover
advantages (e.g., Canon entering the copier market). In such a case, the new
entrant must attack by breaking the rules).
When their current strategy or business model is clearly inappropriate and the
firm is facing a crisis (e.g., Kresge introducing the discount retail concept in the
1960s and renaming itself K-Mart).
When they are attempting to scale up a new-to-the-world product to make it
attractive to the mass market. (Markides, 2006 p.22)
Thus Markides (2006) in fact acknowledges Christensen’s (1997) approach and
understands its reasoning; however, he presents an argument that is somewhat more
rounded. In his understanding, Markides reflects on certain industries that do not

Page | 63
necessarily need disruptive innovations to maintain growth, but still rely on producing
new products. For instance, Hollywood movies are continually trying to achieve new
storylines but exist within different business parameters. Markides simply builds the
argument that Christensen’s principles of disruptive innovation are not suited to all
types of businesses. Markides argument surmises that not only can new
products/technologies be disruptive and establish new markets, but that novel
approaches to how existing business is conducted can lead down the same path. This is
the ultimate principle of a design led innovation strategy which this thesis utilizes and
which is presented in Chapter Four.
Complementing business model innovation with radical disruptive
innovation
The literature presented above argued that business model disruption is dramatically
different to purely radical product/technological innovative disruption. This being so,
the application of the two forms of disruption presents great opportunity for designers
to engage in a novel implementation of a new product with a strong business model to
support it (usually in the form of a service supporting the product). Examples of business
model innovation and radical new product development innovation listed earlier show
that, indeed, this is quite relevant; indeed, arguments about the application of these
two innovations in real scenarios reveal that there is an emerging trend that companies
should not separate the two, as Markides (2006) recommends to do.
There are not many examples of disruptive innovations including a radical business
model working together to create a new market space. This may be due to the difficult
nature of positioning the innovation in the first instance; and managers may simply want
to test the market. However, as the literature has shown, novel innovation which also
includes a radical business model often captures the market’s attention. An example of
this approach was in the creation of the Apple ‘iTunes’ service. The IPod was certainly
not the first portable music player on the market; however, it integrated the new
technology with an innovative business model to capture the market’s attention. While
previous portable music devices failed to offer a seamless user experience, they also
failed in a social capacity – a capacity in which the ‘iTunes’ model succeeded. Therefore,
it is recommended that a disruptive innovation also include a radical business model to
achieve a strong value adding service for potential customers.

Page | 64
Sainio & Puumalainen (2007) conclude that business model and technology innovations
go hand in hand, and that companies should not change one without changing the other
to suit and complement. In other words, a disruptive innovation can be in the form of
both a business model and new to the world product. For the purpose of this thesis, we
will employ a design led innovation strategy (as explained further in Chapter Four) in the
design of a disruptive technology and a novel business model. Before presenting
literature on design led innovation, this next section introduces the disruptive potential
of a proposed innovation to be applied within the Australian livestock industry.
3.4 Disruption of the Australian Livestock Industry
The Australian livestock industry has enjoyed a rich history and is firmly established as a
major market in the Australian economy. As presented in Chapter Two, many
innovations have been introduced within the industry for a range of different
applications. However, many of these innovations, no matter how seemingly beneficial
to the industry they appear, ultimately fail. Figure 3.3 (below) presents a timeline of
various technologies/processes and business models that have been introduced to the
market over the last 40+ years. Literature presented in Chapter Two points to a lack of
an intimate understanding of the social constructs unique to the industry (Frank, 1995,
1997).
Figure 3.3: Estimated timeline (1965 to 2010) of current technologies
In implementing a disruptive technology, Linton (2009) acknowledges the need for a
social and technical approach to be considered. This seems very relevant to the past
failures of innovations and technologies in the livestock industry which have been
attributed to a lack of social acceptance. Indeed, Linton (2009 p.736) states:

Page | 65
“Tremendous value can be created through the exploitation of social innovations.”
Contemporary examples within the livestock industry are apparent in the shortcomings
of the online auction web services that have failed to disrupt the market and are not
truly socially accepted (Clarke & Jenkins, 1993; Courtney, 2009; Driedonks, et al., 2005).
This is quite significant in that implementing a socially accepted disruptive technology,
combined with a novel business model, could lead to a transformation of the traditional
transaction methods of stakeholders.
The traditional transaction methods currently used in the livestock industry are
documented to be ‘old fashioned' and, at times, detrimental to the livestock being sold
(Courtney, 2009). Additionally, producers within the value chain pay a premium price
simply to sell their livestock. These fees are paid to the sales agents who act as
mediators between the selling and purchasing parties. Adding to this, producers must
also ship their livestock to the saleyard at their own cost. Potentially, the stock could be
purchased by the seller's neighbour and be re-shipped to their original location.
Essentially, the livestock are double-handled and this ‘traditional’ process is both time
consuming for the humans involved and stressful for the animals on the ground.
Courtney (2009) explains that the farmers ‘social element’ is what continues to drive the
traditional use of saleyard orientated livestock exchanges. Therefore, it may be seen
that maintaining a social component of any disruptive technology to be applied to the
industry is an important aspect. Linton (2009) suggests implementation of a disruptive
technology on a social level, with consideration given to addressing the external factors
of social behaviour. If this does not occur, there may be too many barriers to adoption
for a famer/organisation to overcome to reap the benefits of the innovation.
3.5 Contribution of Disruptive Innovation to This Thesis
This thesis aims to understand the social barriers to the implementation of disruptive
innovations within a technology focused industry. In order to do this, the Australian
livestock industry (which has been documented to be a technology focused industry) is
examined in relation to the application of a disruptive innovation. After a review of
livestock/business/social-theory literature, this thesis aims to develop strategies for
designers to more easily develop disruptive innovations for technology centred
industries. To further test the theory of disruptive innovations, a proposed technology is

Page | 66
proposed and tested in this thesis by in the application within a design led case study.
This innovation is used in a value proposition and presented to stakeholders through
experiments outlined in Chapters Five, Six and Seven. However, Chapter Four first
presents the theory behind a design led innovation strategy, which is used throughout
this case study.
Chapter Four presents and argues the benefits and implications of a variety of design
methodologies (such as Participatory Design, Human-Centred Design, Design Thinking)
compared to the approaches which the livestock industry has traditionally used (such as
the classical diffusion model, technology focused extension, late stage stakeholder
engagement).
3.6 Proposed Disruptive Technology
The proposed innovation for the purpose of this thesis can be described as ‘three
dimensional imaging’, specifically, of real-life livestock. Three dimensional imaging in its
proposed form within the industry being tested may be disruptive to the contemporary
market. The innovation aims to fill a market niche gap by identifying stakeholders within
the value chain who are not serviced by current processes or are not satisfied with
them. Three dimensional imaging presents stakeholders with timesaving benefits,
increased communication abilities, efficiency gains and a novel marketing approach
(amongst other value adding benefits).
The potential that three dimensional imaging has is quite broad within the Australian
livestock context. Utilising a novel product and a complementary novel business
model/service, three dimensional imaging has the potential to disrupt the traditional
sales/marketing system of the contemporary market by providing a ‘do it yourself’ (DIY)
mechanism.
Three dimensional imaging refers to a proposed innovation that digitally models
individual livestock (or herds) for the purposes of tracking growth patterns, general
statistics/information and also for providing in-depth digital models for the purpose of
sale. Figure 3.4 depicts how each of these images might be composed.

Page | 67
Figure 3.4: Possible composition of three-dimensional imaging of proposed
technology
The proposed three dimensional imaging technology has not yet been applied to this
industry; however, this thesis’ theoretic analysis develops an understanding of what the
perceived value added advantage of such an innovation would be to the industry.
Further to this, the thesis explores how to design new products, facilitate acceptance
and develop strategies to assist further innovation of radical products within the
industry. Throughout the remaining chapters, when the proposed innovation is referred
to, it will be in relation to three dimensional imaging in a general sense, as Figure 3.4
suggests. The remaining chapters, therefore, are concerned with the investigation of this
technological case study and the social barriers that need to be overcome in order to
successfully diffuse this radical concept within the livestock industry.

Page | 68
Chapter 4 Design Led Innovation
4.1 Introduction
To date, the adoption of new
products and services within the
Australian livestock industry has
been quite slow (Frank, 1997;
Guerin, 2000). The industry is
not recognised as being a
heavily design orientated one;
instead, the industry is quite
technology focused in its
approach to innovation. This
focus on utilising technology to
fill latent user needs has traditionally brought about incremental innovation solutions to
on farm problems. Hence, as previously stated, innovations throughout this industry are
predominately ‘value adding’ in nature (Boland, 2009). As mentioned above, Parcell
(2009) described five techniques for the industry to value add innovations (See Chapter
Two). These five techniques have traditionally been looked to as methods that
companies use to produce new product offerings. However, innovations in the industry
have been slow to diffuse. Therefore, it is argued that the use of a design led innovation
approach might be applicable to the successful design of the proposed disruptive
innovation.
Through chapter two it was found that the Australian livestock industry has been purely
technology driven and subsequently product launches have floundered in the industry
thus far. Building upon this, chapter three described the theory of disruptive innovation
and argued that companies should look to innovate through disruptive channels in order
to grow into new markets. This then leads to on-going dominance of any particular
industry market. However as alluded to throughout this thesis, companies cannot simply
invest in technology and hope for end users to adopt a product from these efforts.
Importantly it is through the use of design led innovation strategies as presented in this
4.1 Introduction
4.2 Failure of Traditional
Industry Approaches
4.3 Potential for Participatory
Design
4.4 Disruptive Innovation
4.5 Potential of Design Thinking
4.6 Design Driven
Innovation
4.7 Design Led Innovation

Page | 69
chapter where the development of new products should be driven from. Therefore
chapter four links the theory presented throughout chapters two and three through the
use of design.
Design led innovation establishes a different way of thinking about strategic business
management (Brown, 2008; Bucolo & Matthews, 2011; Cox, 2005 ; Verganti, 2008).
Using design led innovation, this thesis aims to document the amalgamation of various
design strategies (Participatory Design, Human Centred Design and Design Thinking).
The contribution of this thesis is in the novel application of design led innovation within
the Australian livestock industry context, and a collaborating company from within this
industry was engaged in the research. Moreover, this thesis examines methods to
incorporate design research into a technology focused company through the integration
of a Participatory approach and Design Thinking, effectively finding a mid-ground for
companies to engage end users from multiple perspectives – typically, across user
needs, business requirements and technology demands (Bucolo & Matthews, 2011).
Classical diffusion models (which the industry previously used to address innovation)
typically looked to opinion leaders as the main driver of novel technologies (Guerin,
2000). However, the Australian livestock industries end users (farmers) have not been
credited with being keen to adopt new and innovative processes on the
recommendation of these opinion leaders. Compounding this issue is the fact that
companies need to create a product/service that is able to comply with the sociological
structures of this ‘traditional industry’. To address this sociological determinant,
companies have (again) historically used the classical diffusion model (Guerin, 2000) and
targeted opinion leaders to communicate their novel solutions to the market.
4.2 Failure of Traditional Technology Diffusion Models
The contemporary Australian livestock market has been through, and continues to go
through, a period of technological change. As urban society continues to embrace
technology, the livestock industry is faced with a choice to remain loyal to their
traditional past processes or to embrace novel approaches. However, the average age of
stakeholders in the industry is currently 58 and the tasks that technology is trying to
replace have been the tasks that these industry stakeholders have managed to do

Page | 70
without its help. Therefore, designing for this end user may require a different attitude
than that what has previously occurred in the industry.
Innovations are documented to be ideas, products/systems or novel processes that are
presented to a user in a novel manner (Pease & Rowe, 2005; Rogers, 1995). Following on
from this definition, Rogers defines diffusion as “the process in which an innovation is
communicated through certain channels over time among the members of a social
system” (1995 p.5). However, it is seen that this system does not aid a company in
engaging its end users. The practice of a company labelling their end users, selling to
early adopters, and then leaving products to diffuse into the market has proven to be
ineffective in the livestock industry of Australia. Much research on this issue – why
Australian livestock end users do not typically embrace novel innovation – has been
documented (as previously discussed in the review of the literature).
Hence, the failure of companies’ innovation of new value adding products and services
can be attributed to a multitude of reasons. The obvious reason is that these companies
did not consider the end user in their strategic design directions something which Frank
(1997) was able to document thoroughly.
Frank (1997) and Guerin (2000) point toward the proper consideration of end users in
the Australian livestock industry; moreover, the consideration of establishing an
intimate understanding of the end user through a participatory means. This intimate
appreciation can lead to the identification of new value propositions. These value
propositions can be identified through the implementation of varying design tools. The
first tool involves the direction engagement of industry stakeholders; this process is
called Participatory Design (PD).
4.3 Potential for Participatory Design
PD began within the Scandinavian countries as an approach to engage end users early
on within the human-computer interface (HCI) body of research. Recently, the
application of this HCI approach has moved into other fields, for example, design
research. However, the use of a Participatory Design approach within the livestock
industry has not been widely explored (Frank, 1997; Guerin, 2000). The advantages of
the PD method are that researchers (or designers) can associate more closely with real
stakeholders (end users) at an early stage of design exploration. Importantly, due to the

Page | 71
nature of the PD method, this allows rapid realisation of social meanings and the
attitudes to innovations held by stakeholder participants.
Depending on the PD methodology, it may not differ from traditional UCD tools, in that
designers still focus squarely on the user needs alone, as opposed to the business needs
as well. These distinctive UCD tools, such as observations, focus on the subsequent
evaluation of product features or incremental user needs (Bucolo & Matthews, 2011).
Ultimately, the main limitation of PD is that it takes more than simply engaging end
users to design a novel, successful product which has potential to ‘change the game’.
Design led innovation, therefore, has the potential to drive disruptive innovations and
lead companies towards the creation of new markets.
4.4 Disruptive Innovation
Christensen advises that it is smart for companies to invest in disruptive innovations, to
become the market leaders within the industry. However, due to the theoretical nature
of disruptive innovations, it is difficult for these companies to use a UCD (User Centred
Design) approach to design a system – “Since the new technology may be viewed
objectively as crude, it leads to the belief that it will find only limited application” (Sainio
& Puumalainen, 2007 p.1327). Therefore, the problem for companies is two-fold. Firstly,
the enterprises wish to engage their end users more effectively (and this is currently
occurring through the use of design). However, on the other hand, companies need to
look towards implementing disruptive innovations to lead their growth into the future.
Design can be applied within the context of disruptive innovation as designers have the
ability to conceive a range of future solutions to a given problem. Design brings a
different way of tackling problems to generate novel solutions. A more accurate
labelling of this process is ‘Design Thinking’, where both user needs are evaluated
(HCD/PD) and technology capacity is focused upon (Disruptive Innovation). Design
thinking combines a third dimension in this equation: value propositions are fully
exploited through meaningful business opportunities. Designers must communicate this
to the companies they work with from the outset of a new project; more importantly,
designers must do this visually – through the use of future scenarios detailing all three of
the above mentioned standpoints.

Page | 72
4.5 Potential of Design Thinking
Design thinking is an approach which looks to marry the gap between business strategy
and designers. Brown proposes that “Design thinking is a discipline that uses the
designer sensibility and methods to match people needs with what is technologically
feasible and what a viable business strategy can convert into customer value and market
opportunity” (2008).
Traditionally, design has been treated as a downstream development process: what
design thinking embraces is engaging the designer on the project from the outset. This
design driven innovation strategy is the essence of design thinking. Brown (2008) says
that the advantage of this approach is strategic, compared to the traditional use of
designers; design thinking creates dramatic new forms of value to the end users. This
occurs because, at the earliest stage of the project, designers must collaborate with the
end users of the product or service. Hence, the advantage of design thinking is that it
can suggest creative alternatives to the assumptions made in developed
societies/markets. Design thinking is a tool for imagining experiences as well as giving
them a desirable form. However, before a company (or a designer) can add form to
potential user experiences, they must consider the meaning behind what a potential
design solution may be for the end user. As Verganti (Verganti, 2008) explains, this is the
essence of design driven innovation.
4.6 Design Driven Innovation
Focusing on the associated meaning of a product is a theory explained by Verganti
(2008) and documented in a design-driven strategy. This strategy suggests designers
should not only think about the role a new technology plays in novel innovations, but
also about the fact that the attached meaning is quite important to its overall success.
Hence, innovations that radically redefine what a product means for a customer are
likely to be more successful, as they are differentiated from the competition.
Unfortunately, this design-driven approach cannot be found through users’ insights:
“The socio-cultural context in which they (consumers) are currently immersed makes
them inclined to interpretations that are in line with what is happening today. Radical
changes in meanings instead ask for radical changes in socio-cultural models, and this is

Page | 73
something that might be understood (and affected) only by looking at long-term
phenomena with a broader perspective” (Verganti, 2008 p.438).
Verganti (2008) suggests that “a reason why design-driven innovation has largely
remained unexplored is that its processes are hard to detect when one applies the
typical methods of scientific investigation in product development, such as analyses of
phases, organisational structures, or problem-solving tools” (p.438). These typical
methods of scientific approach are depicted in Figure 4.1 as a “market pull approach”
(that is, listening to exactly what consumers ask for), or as traditional UCD. Figure 4.1
also displays radical improvement based on technological gains, which is heavily
associated with disruptive innovation (Christensen, 1997).
Figure 4.1: Innovation strategies [adapted from (Verganti, 2008)]
However, it is seen that design-driven innovation strategies focus on the meaning of the
novel system as the market driver, over the technological components of the project.
This thesis poses that the innovation must sit in the right hand side (the green oval) of
the graph. Design driven innovation, however, does not discount the end user; it simply

Page | 74
considers more than the end users’ perceived needs. More accurately, what companies
can take away from design-driven, design thinking is that there needs to be
consideration from a number of different sources when designing for end users; namely,
consideration of technology, user needs and business viability/value (Refer to Figure
4.2).
4.7 Design Led Innovation
Up until now this thesis has presented literature on various design and business
theories. However, the purpose of this thesis is to address the lack of design being
applied in the Australian livestock industry. A design led innovation (DLI) strategy is used
to address this issue. In this approach, DLI can use various tools to apply strategic design
methods. Hence, the practical approaches of both PD and design thinking will be used in
applying a disruptive technology in the industry.
Figure 4.2 depicts the overlap of three considerations which designers should exploit in
the design of any novel product. Design led innovations, therefore, exist within the
triangular overlap of all three standpoints: when one standpoint changes, consideration
to the effect on the others is also given. Companies can gain value from this approach in
that design strategies can be applied very early on in a project. As a result, they can save
time and money; more importantly, they are able to drive the project, not from one of
these standpoints, but from all three simultaneously. Thus, the final design solution is
not presented as an artefact in isolation, but as an integrated product/service which
anticipates future user needs, builds future proposals and encourages feedback (Bucolo
& Matthews, 2011).

Page | 75
Figure 4.2: Three considerations of design led innovation
[adapted from (Bucolo & Matthews, 2011)]
What Figure 4.2 allows is for a company to use design led innovation more effectively by
targeting each of these three factors. Typically, a company will first obtain a piece of
technology, or identify a latent user need and then look for a technology to service that
need. However, what design thinking argues is that it is dangerous to simply combine
any two of these factors (as has been documented in the Australian Livestock industry
with its slow diffusion levels). Designers and companies must also consider a value
proposition in terms of a business strategy. The most notable examples of companies
doing this are Apple with its iPod/iTunes system and Nike with its fitness pedometer
being linked to an internet service, thus catering to the added value needs of their end
users.
The major point of this conceptual model is the co-development of these future
scenarios (visually) which is informed, and indeed facilitated, by all stakeholders of the
system. Significantly, internal (design, engineering, marketing, management) and
external (existing users, future customers, supply chain workers, manufacturing, etc.)
stakeholders are engaged to deliver success in this process. The outcome is that all
stakeholder conversations/workshops are grounded through the use of a common visual
language (Bucolo & Matthews, 2011).

Page | 76
4.8 Summary
Design led innovation is a strategic link between business’ with technological capabilities
and the end users whom they wish to benefit with a product or service. As proven in the
Australian livestock industry, without the proper consideration to business, end users
and the technology; more than likely product offerings fail in the market. Hence this
thesis aims to present a case study (through a three stage study) where the use of the
above mentioned design led innovation strategies are the driver for the project. The
process of how traditional, technology driven companies can then engage with their end
users from the starting point of the project is the key outcome of this work. Therefore
this thesis aims to explore and investigate these processes and how they can be
practically applied in industry using design.
The true value of design is in its ability to create and construct novel ideas and
approaches for innovative solutions whilst being able to think in two minds; in the small
scale of how a product works and the larger scale of what the value of the product
offering really is. This process is described as design thinking (Brown, 2008). Building
upon Verganti’s (2008) design driven model and the tri-consideration of technology
(Bucolo & Matthews, 2011), user needs and viable business alternatives, the case study
presents the tools used for a large Australian agribusiness to engage with end users in
ways which have not previously been tested in their company and/or industry.

Page | 77
Chapter 5 Research Design and Methodology
5.1 Introduction
This chapter describes the design and methods
used throughout this research thesis. It presents
the participants of the three studies and the
procedures used throughout. The chapter also
explains the data analysis used to analyse the
three studies’ chronological ordering system. The
data analysis of each study is crucial to the next, as
findings from each study inform the exact
progression of the project. Figure 5.1 depicts this
systematic approach in a visual flow diagram in the three stage study format.
Figure 5.1: Design research flow chart
5.1 Introduction
5.2 Methodology
5.3 Participants &
Research
Techniques
5.4 Procedure
5.5 Results Analysis
5.6 Ethical
Considerations
Page | 78
5.2 Methodology
The use of a designed and well-crafted research methodology is critical to successfully
addressing this thesis’ research aims and questions, as presented in Section 1.3 and 1.4.
As this investigation analyses the social barriers to technological innovation in the
Australian livestock industry, a qualitative method has been employed. Qualitative
research is exploratory in nature, therefore enabling researchers to access their
attitudes and opinions in a data rich manner. Moreover, this method allows fast and
widespread access to stakeholders throughout the industry. The qualitative method
enables researchers to collect data in broad terms to find knowledge when little is
known on the topic (Liamputtong & Ezzy, 2005). Therefore, in this three stage data
collection process, the qualitative method was implemented.
However, as in the case of most qualitative research, repeatability and reliability of
results is of concern to researchers. Therefore, to counteract this problem in the
methodology, the use of triangulation of results is implemented. Triangulation in this
thesis aims to clarify participants’ meanings (as identified by researchers in data
analysis) by comparing the differing ways in which the information about the same topic
has been described. Therefore, triangulation provides an alternative to one dimensional
data validation (Turner and Turner, 2009).
As this thesis is a design investigation of social barriers to technological innovation, a
design led innovation (DLI) strategy is the main driver of the three stage study. Within
the process of DLI the utilization of Design Thinking (DT), as a tool and Participatory
Design (PD) as a design methodology (combined with HCD) are used (as previously
justified in Chapter Four). Given the mixed methodology of the study, Table 5.1
describes the exact 'implementation' of each method in the three stages of data
collection.
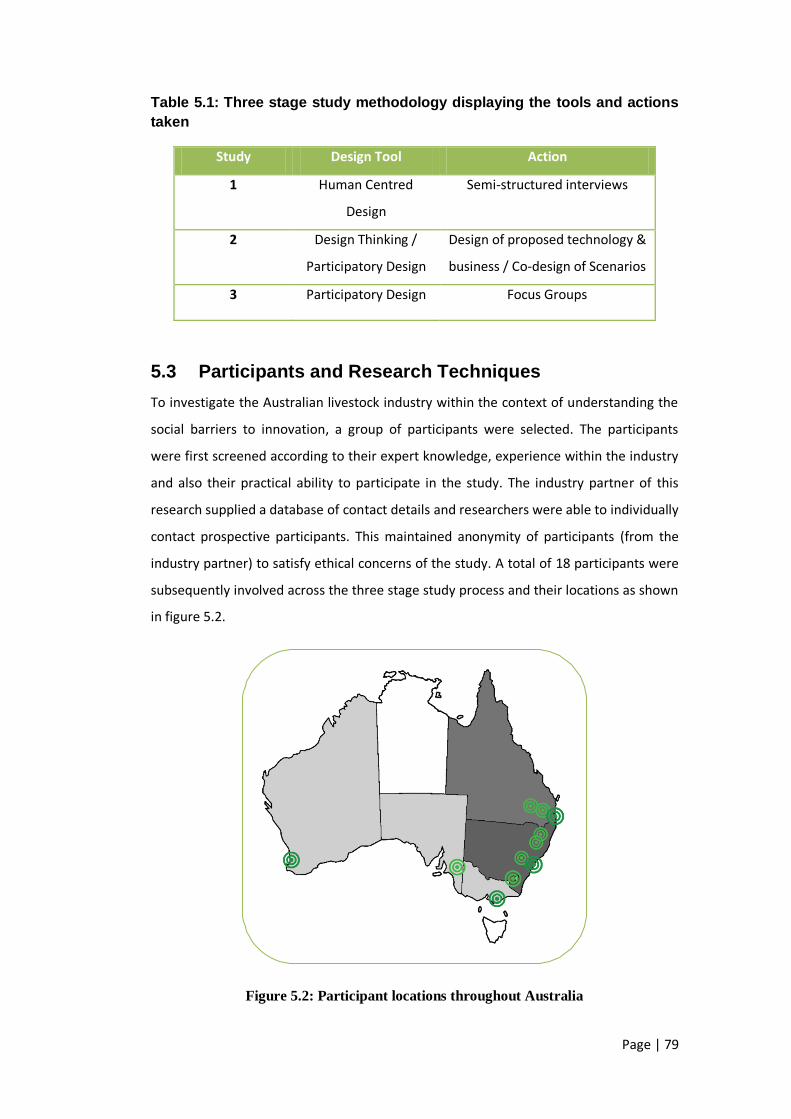
Page | 79
Table 5.1: Three stage study methodology displaying the tools and actions
taken
Study Design Tool Action
1 Human Centred
Design
Semi-structured interviews
2 Design Thinking /
Participatory Design
Design of proposed technology &
business / Co-design of Scenarios
3 Participatory Design Focus Groups
5.3 Participants and Research Techniques
To investigate the Australian livestock industry within the context of understanding the
social barriers to innovation, a group of participants were selected. The participants
were first screened according to their expert knowledge, experience within the industry
and also their practical ability to participate in the study. The industry partner of this
research supplied a database of contact details and researchers were able to individually
contact prospective participants. This maintained anonymity of participants (from the
industry partner) to satisfy ethical concerns of the study. A total of 18 participants were
subsequently involved across the three stage study process and their locations as shown
in figure 5.2.
Figure 5.2: Participant locations throughout Australia

Page | 80
A total of three research techniques were used in the three stage study, as per the
design led innovation model referred to in chapter four; Semi-structured interviews, Co-
design and Focus Groups (as described above in Table 5.1). For each of these stages
participants were asked to fill in the studies participant information sheet (refer to
appendix 1). Initially, six semi-structured interviews were used to identify contemporary
and contextual issues surrounding the Australian livestock industry. Then, in line with
the research technique, the two remaining studies – the co-design and observations
(second study), and the focus groups of industry stakeholders (third study) – were
carried out based on the principles and key learning’s from the initial study. Importantly,
the first and third studies were digitally voice recorded and later transcribed for later
thematic data analysis.
5.4 Procedure
The use of a design led innovation strategy demands a thorough knowledge of industry
but – more importantly – of stakeholder opinions. The first stage of the study was
determined to engage key industry stakeholders through a semi-structured interview
process. As the first research technique, the interview drew upon knowledge learnt from
the relevant literature and asked questions surrounding the knowledge gap (as
identified in Chapter Two). These open-ended questions related to:
The industry’s supply chain and how it specifically operates for the individual
Ensuring a supply of livestock to businesses
Communication within the industry (both personal and business)
Perceptions of using technology for the assessment of livestock
The usefulness of three dimensional imaging in the proposed innovation
Attitudes to the current processes of transactions in the livestock industry
Attitudes to the future of the industry and future predictions.
Using a semi-structured interview allowed the researcher to channel the topic of
conversation in appropriate directions, but also afforded the participant the chance to
explain, and be critical of, certain topics.
The second stage of data collection was in the form of a co-design of three creative
scenarios. These were based upon the learnings from the initial stage. The co-design
took place throughout a half-day workshop with a key industry expert. The first aspect
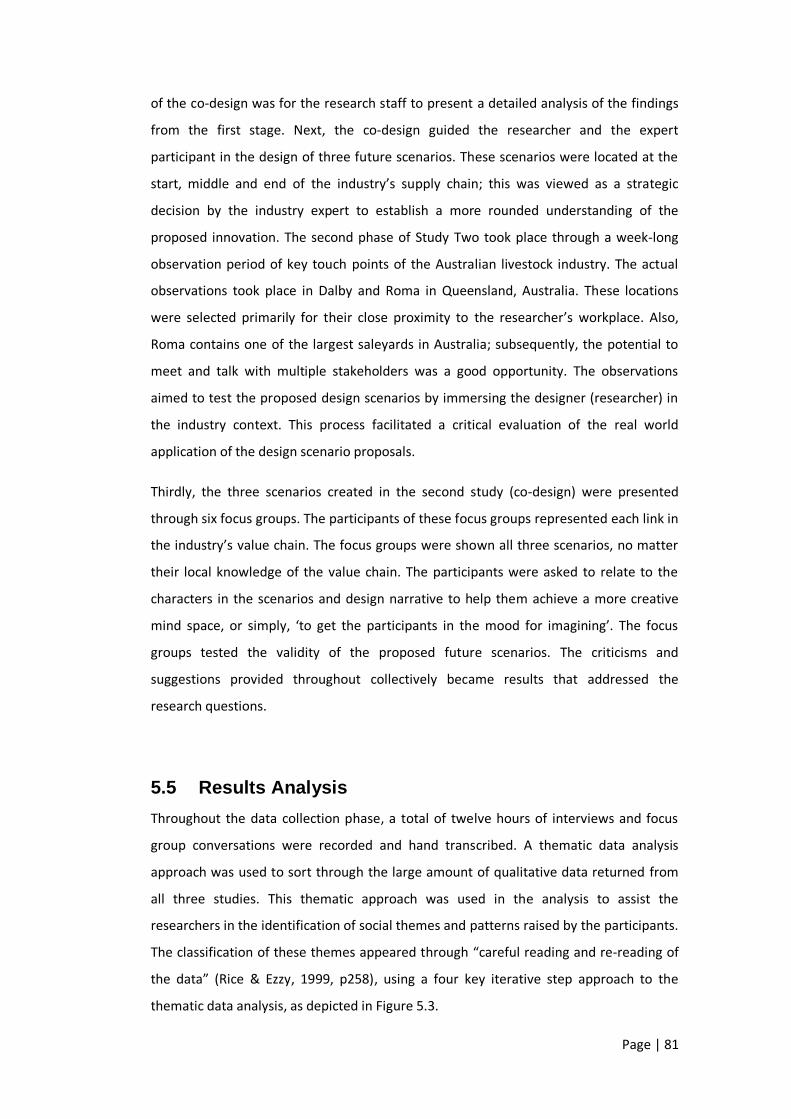
Page | 81
of the co-design was for the research staff to present a detailed analysis of the findings
from the first stage. Next, the co-design guided the researcher and the expert
participant in the design of three future scenarios. These scenarios were located at the
start, middle and end of the industry’s supply chain; this was viewed as a strategic
decision by the industry expert to establish a more rounded understanding of the
proposed innovation. The second phase of Study Two took place through a week-long
observation period of key touch points of the Australian livestock industry. The actual
observations took place in Dalby and Roma in Queensland, Australia. These locations
were selected primarily for their close proximity to the researcher’s workplace. Also,
Roma contains one of the largest saleyards in Australia; subsequently, the potential to
meet and talk with multiple stakeholders was a good opportunity. The observations
aimed to test the proposed design scenarios by immersing the designer (researcher) in
the industry context. This process facilitated a critical evaluation of the real world
application of the design scenario proposals.
Thirdly, the three scenarios created in the second study (co-design) were presented
through six focus groups. The participants of these focus groups represented each link in
the industry’s value chain. The focus groups were shown all three scenarios, no matter
their local knowledge of the value chain. The participants were asked to relate to the
characters in the scenarios and design narrative to help them achieve a more creative
mind space, or simply, ‘to get the participants in the mood for imagining’. The focus
groups tested the validity of the proposed future scenarios. The criticisms and
suggestions provided throughout collectively became results that addressed the
research questions.
5.5 Results Analysis
Throughout the data collection phase, a total of twelve hours of interviews and focus
group conversations were recorded and hand transcribed. A thematic data analysis
approach was used to sort through the large amount of qualitative data returned from
all three studies. This thematic approach was used in the analysis to assist the
researchers in the identification of social themes and patterns raised by the participants.
The classification of these themes appeared through “careful reading and re-reading of
the data” (Rice & Ezzy, 1999, p258), using a four key iterative step approach to the
thematic data analysis, as depicted in Figure 5.3.

Page | 82
Figure 5.3: Four key iterative step approach (Rice & Ezzy, 1999)
The systemic process of data analysis (as presented by Figure 5.3) works to ensure that
this qualitative methodology can be repeated and, more importantly, re-evaluated. The
constant review of themes and sub-themes stemming from the data is an important way
for researchers to justify work done. Helping to achieve this triangulation of themes
between like participants and non-like participants ensures the rigor of the findings.
From the data resulting from the first study, it was found that the proposed innovation
had the potential to be an advantageous tool for many stakeholders throughout the
industry. Interestingly, the six participants recommended the innovation be applied to a
different industry sector than the one they personally represented. For example, after
triangulation of the results, it was found that a participant from the seedstock sector
might recommend the technology for the processing sector, and vice versa. It seemed as
though the participants were keen for technological innovation in the industry, but
perhaps not in their own sector.
As Study Two’s first step was a constructive design task no key learnings were found. In
the second observation step of the study, researchers engaged with the industry across
various key touch points of the value chain. The main purpose of the week was to allow

Page | 83
the researchers a time to literally engage in the industry and learn how each of the
social elements work. The observations found that the scenarios were indeed a
projection of what the industry might be like in the next ten to fifteen years.
Lastly, the proposed future scenarios were conducted via focus groups which where
voice recorded and later transcribed. The results of the focus groups were generally well
received across the industry segments. As with many inquiries into new products, the
participant responses were also broad, providing both positive and negative feedback to
the researchers. A full and thorough analysis of results can be found in Chapters Six,
Seven and Eight.
5.6 Ethical Considerations
As this study investigated the perceptions and social phenomena of human participants,
the understanding and compliance to ethical standards was important. In order to
commence the research, a low risk ethical approval form was submitted. Subsequently,
the University Research Ethics Committee of the Queensland University of Technology
granted ethical clearance to conduct the three studies.

Page | 84
Chapter 6 Study 1 – Semi-structured Interviews
6.1 Introduction
This chapter describes the study and
presents the findings generated through
the use of a design led innovation
process, as discussed in Chapter Four.
Moreover this chapter presents the first
study conducted in this research; a
small scale study, designed to establish rigor and to provide a contextual background to
the overall research (as outlined in Chapters Seven and Eight).
As literature presented in Chapter Two revealed, the understanding of the social
constructs in the Australian livestock industry is critical to the success of innovations.
Thus, this study was used to establish contemporary understandings relating to the
social attitudes held by a small sample of livestock stakeholders. Therefore, it provides
the first steps toward obtaining stakeholder insights about the proposed innovation. It
investigated a ‘snap shot’ of the Australian livestock industry to establish firstly, the
societal implications of the proposed innovation and, secondly, whether a design led
innovation strategy would be an appropriate means to drive innovation in this industry.
Establishing these preliminary results lead to the development of future scenarios,
which are presented later in Chapter Eight.
6.2 Process
To explore how members of the Australian livestock value chain perceive new
technologies, a preliminary study comprising of six interviews was conducted with key
stakeholders from the industry. The nature of the livestock value chain is quite broad
and encompasses many different types of technologies, services and business
operations to provide producers with the most effective product to sell. Therefore,
6.1 Introduction
6.2 Process
6.3 Interview Data
Analysis and Results
6.4 Discussion
6.5 Summary
Page | 85
understanding the social perceptions of each of these components is important to the
context of this thesis.
From the literature reviewed on the assessment of livestock, the methodology of Study
One was designed to explore the current industry perceptions of technological
innovations (Of particular interest was the attitude towards objective livestock analysis).
To explore these perceptions, a total of 24 prompting questions were asked to guide the
conversation through seven key areas of interest:
1. Participants’ supply chain
2. Current spending
3. Communication and feedback
4. Objective technology
5. Three dimensional images
6. Traditional selling modes versus contemporary modes
7. Comments for future trends.
Table 6.1 further details the rationale of the semi-structured interviews:

Page | 86
Table 6.1: The rationale for the semi-structured interviews
Interview participants
The participants in this study were identified as key opinion leaders in the industry. They
collectively worked in different areas of the industry value network and were located
throughout the country. There were six interviews carried out across the seedstock
segment and internal Landmark general division managers. All had differing opinions on
innovation and, due to their widespread locations and specific portfolios, were able to
show different perspectives. Table 6.2 includes a more detailed description of each
Objective To identify relevant themes associated with the Australian
livestock industry’s ability to adopt technology and issues
within the value network
Setting Participants were all contacted via email and
teleconferenced.
Time allowance 40-60 minutes
Method Semi-structured interviews
Data Collection Note taking and recording of interviews
Interview Each participant was asked a sequence of questions
surrounding the study’s themes taken from a literature
review:
Do you see value in implementing technology which allows
for objective livestock analysis?
Are livestock bought through saleyards any better or worse
than those bought via online channels?
Is communication and feedback an integral part of the
business?
Would an exact three-dimensional image provide value for
your clients in assessing the attractiveness of purchasable
animals?
Data analysis means Thematic theory approach
Participants Six participants

Page | 87
participant. These people were chosen to gauge a wide-reaching preliminary study
response, but also to allow convenient access for timely turnaround of results.
More than twenty-three participant details were provided by Landmark; however, for
the purpose of this study, a smaller sample was required. Therefore, a random sampling
methodology was used to create a ‘snapshot’ of the industry’s value chain. Also
participants’ availability and scheduling affected the participant sample. Participants
were recruited by telephone and later sent a participation form via email. Participants
were located in rural and high density urban settings in Western Australia, Victoria, New
South Wales and Queensland. Interviews were performed and recorded via Skype and
teleconference phone call. The general content of the questions ranged from questions
about topical issues playing out in the industry at the present point in time, to logistical
questions about what the proposed technology might mean for them.
Table 6.2: Participant description
Participant Background Experience (years)
P1 Online Auctions 40+
P2 Producer/Seedstock 25+
P3 Sale Agent 40+
P4 Breed Society 30+
P5 Sale Agent/Export 40+
P6 Landmark Innovation
Manager
15+
The limitation of using the above mentioned methodology, however, was the lack of
visuals able to be shown to help participants understand the proposed innovation.
Conveying the potential of the proposed innovation in the livestock industry over the
telephone was found to be difficult. Subsequently, the participants had to imagine for
themselves the direct outcomes of the innovation.

Page | 88
6.3 Interview Data Analysis and Results
The rationale of the study was to gain a quick and rich understanding of the
stakeholders’ attitudes to innovation and their perception of a proposed innovation.
Noting the differences between each segment within the industry (Refer to Chapter
Two, Figure 2.2), and how each segment might be potentially affected by the
development of a radical innovation was important. These differences were then used
to build future scenarios based on the learning’s gained in this first study. In order to
compare findings, each interview was digitally recorded, transcribed and coded using a
thematic approach. The transcription was performed by Reporters Ink, a local audio
transcription service provider.
As previously mentioned in Chapter Five, the analysis of the raw data (transcriptions)
was carried out by thematic analysis, searching for key themes in the findings. The
emergent themes became the categories for analysis; they were reviewed, refined and
named into main themes and sub-themes (Liamputtong & Ezzy, 2005). To illustrate
participants’ viewpoints, direct quotes are utilised throughout the results to illustrate
the validity of these themes.
6.3.1 Results
The key principle of this first study was to provide rigor to the research, based on the
knowledge identified through Chapters Two and Three. Study One identified four major
themes in the thematic analysis of the raw data, as presented in Figure 6.1.

Page | 89
Figure 6.1: Four thematic themes
Social attitude to innovation
Figure 6.2: Social Attitude to Innovation
Innovation in the livestock industry was generally talked about in positive terms by all
members of the study. The idea that research and development would be able to add

Page | 90
value to the industry as a whole was very much understood. One participant
acknowledged this saying: “We have to continually push the bar on product
development; otherwise we get left behind (P2)”. Another participant was recorded
mentioning: “Oh, I think it will be going leaps and bounds. You know, I think with the
technology today, people are wanting this. As the younger generation come through,
they are wanting - they are more computer focused” (P1). It was seen that innovations
to the business model, and on a technology platform, would be a good thing for the
industry if it meant added value to the producers. More importantly, such innovation
must be seen by the producers to be cost-effective for them to adopt it. Technologies
were consistently talked about in dollar terms, not added value potential. P1 lamented
the cost of contemporary innovations in the current livestock industry when questioned
about three-dimensional images:
“We can take videos of cattle now, you know. We can take photos. Moving
videos/images of cattle which I do myself, you can do that now. Look, it's the
cost - the first thing they ask, ‘What is it going to cost?” (P1)
P1 in the above instance showed a willingness to use innovation/technology as a means
to value add to his livestock transaction business. However, the cost of using the
technology was a strong factor in the overall choice to implement it. His assessment of
the three dimensional imaging proposal within the study was that producers would not
want to outlay a large upfront cost, when they could currently sell stock using traditional
methods. The notion that producers were cost minded was differently described by P5:
“I don't think farmers are frightened of spending more money if they can see a
value in it. You know, you pay for what you get. I don't think the farming
community is that naive that it's always looking at the lowest cost option.” (P5)
Therefore, it seems as though the cost of the innovation is a subjective measure towards
the end adoption of a disruptive innovation. Naturally, some stakeholders within the
livestock industry will be drawn to cost as a reason to adopt or reject an innovation.
However, as P5 states, lowering the cost of an innovation to achieve a higher adoption
rate may be naive.
A current innovation in the industry relating to the distribution and sale of livestock is an
online transaction mechanism, AuctionsPlus (amongst others). The participants
recognised the strengths and praised the system on the whole:
Page | 91
“There's probably better ways that are coming into the system, all-a
AuctionsPlus (P3) and AuctionsPlus has got lots of obvious benefits over and
above the saleyard system and I think we will see more and more cattle sold
through that means, particularly when it's associated with good product
description.” (P4)
The need to trust the system was shown. The same participant made a good point:
“I have been a little bit surprised that it hasn't actually taken off more than what
it has, but it's probably a bit of time and a bit of generational change that's
required, but I certainly think it's worthwhile persisting... There will always be
that element amongst producers - some producers, that they enjoy the saleyard
experience, if you like. A lot of them judge their eyes much better than they
judge numbers on a piece of paper. But as we see the younger generation
farmers come through, they are very busy in their businesses doing lots of
things, obviously lots of reasons why they would be more inclined in the future
to use more systems like AuctionsPlus.” (P4)
Currently, the average age of the Australian farmer is 58 years old and, based on this,
the adoption of innovation has typically been documented as being quite slow (Frank,
1997). The opinion leaders identified and interviewed in this study thought, on the
whole, that innovation was a positive thing for the livestock industry. However, as
previously identified in Chapter Two, innovating radical innovations does not guarantee
end adoption behaviour (Frank, 1997).
P3 raised an interesting proposition relating to the innovation of the radical technology
proposed in the study and related it to his own specific sector within the industry:
“We (sales agents) have been satisfied in a price taking business, not in a price
making business… Rather than me making 100 calls, if I had a system where
one/two of them ring me because they have got something that suits what I
want, they are doing the work, not you… We have probably got to get out of the
set where we are just traditional agents.” (P3)
The participant was describing an automated marketing system that allows his clients to
contact him – a system that could easily be incorporated in a three-dimensional
objective solution.
Page | 92
The study’s participants recognised a need to innovate and grow both their own
businesses and the industry as a whole. This was both in terms of working to develop
better livestock and utilising technology to value add other areas of their work.
Unfortunately (and this was typical of all stakeholders), their physical time constraints
were a factor that typically prevented this ideal situation from occurring: “We don't
invest a lot of time. We can't, we haven't got the funds to invest a lot of time on that
side of it” (P5).
However, the same participant also suggested that, “We always look for new
opportunities to develop income streams and that sort of thing. So, yeah, very much
involved in that…” These two statements were both in relation to improving the clients’
product; however, the first statement was in context of the pre-sale and the second
statement describes the transaction phase. In comparison, these two statements
perhaps seem disjointed; that the participant did not have the ‘time’ to work to improve
the client’s livestock herd, but was more intent on finding a new transaction model for
selling his client’s product. This is an interesting finding, in that the participant did
understand that gradually helping to improve the client’s stock would mean increased
dollar output from the transaction, but his perception was that he was simply too busy
to bother.
This assessment was also mirrored by another participant acknowledging the fact that
all his work was based around the transaction and not around the improvement of the
client’s product: “Yes, always (look to improve the clients stock), but no one listens to
you” (P5). The attitude to innovation and improvement then is somewhat split. Some
people within the study were actively trying to innovate within their powers and use
new technology and systems to do so, whereas others were keen to maximise their
transaction schedule. P3 understood that if you were to do more work with the client in
the pre-sale phase, the producer would be more likely to choose to sell through you in
the transaction phase.
The attitude to innovation on the surface was very positive. However, through the
interviews, it became apparent that often innovation comes second to the traditional
‘work’ that a participant needed to do, specifically the work of a livestock agent.
Livestock agents in the study were very focused on the transaction work of the client
relationship. However, the seedstock participants realised the value-gain they could
achieve through focusing on the pre-sale relationships.
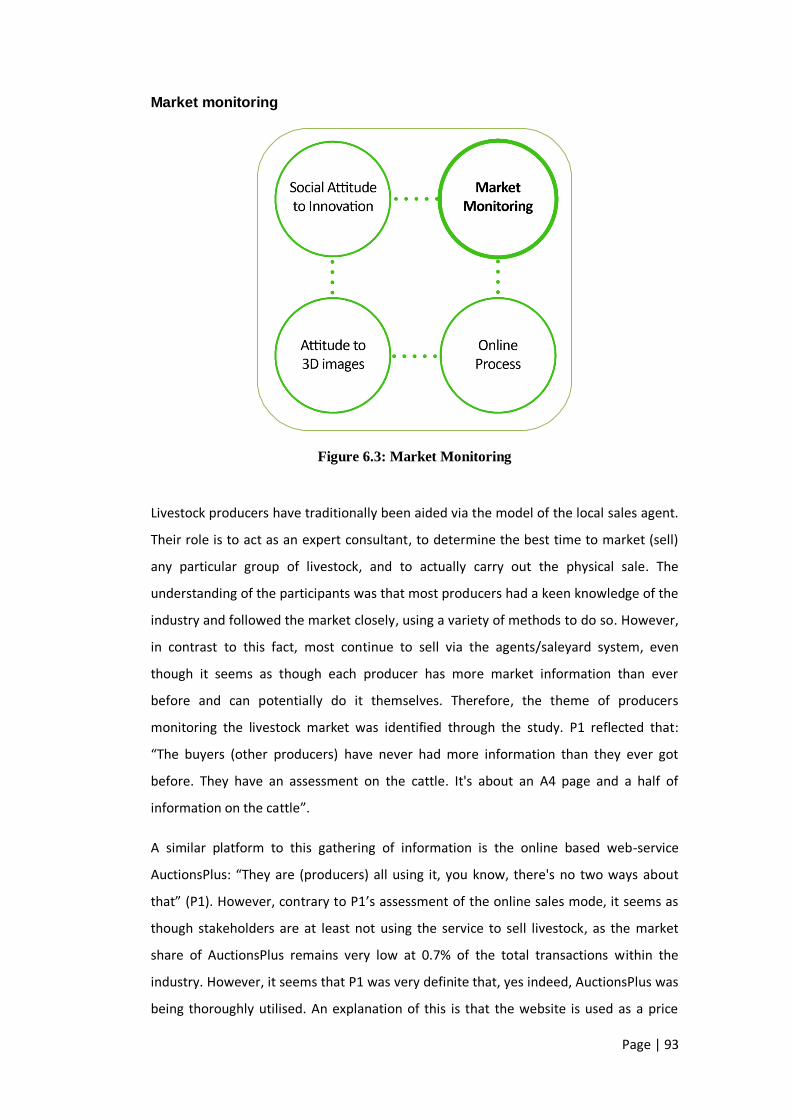
Page | 93
Market monitoring
Figure 6.3: Market Monitoring
Livestock producers have traditionally been aided via the model of the local sales agent.
Their role is to act as an expert consultant, to determine the best time to market (sell)
any particular group of livestock, and to actually carry out the physical sale. The
understanding of the participants was that most producers had a keen knowledge of the
industry and followed the market closely, using a variety of methods to do so. However,
in contrast to this fact, most continue to sell via the agents/saleyard system, even
though it seems as though each producer has more market information than ever
before and can potentially do it themselves. Therefore, the theme of producers
monitoring the livestock market was identified through the study. P1 reflected that:
“The buyers (other producers) have never had more information than they ever got
before. They have an assessment on the cattle. It's about an A4 page and a half of
information on the cattle”.
A similar platform to this gathering of information is the online based web-service
AuctionsPlus: “They are (producers) all using it, you know, there's no two ways about
that” (P1). However, contrary to P1’s assessment of the online sales mode, it seems as
though stakeholders are at least not using the service to sell livestock, as the market
share of AuctionsPlus remains very low at 0.7% of the total transactions within the
industry. However, it seems that P1 was very definite that, yes indeed, AuctionsPlus was
being thoroughly utilised. An explanation of this is that the website is used as a price

Page | 94
gauge, and when prices online rise, perhaps the stakeholders choose to sell the livestock
via other transaction methods.
Knowing the market conditions is obviously an important determinant of success in
relation to selling product. When asked how they (the participants) would try to sell 100
head of cattle, the answers were, however, seemingly different from each of the
participants. “I would definitely be trying to sell it direct” said P2. However, P3
commented:
“Look, every mechanism of how you sell your cattle has got some advantage to
other people: Saleyards are immediate and they are sold; online auction means
that you can control your destiny a little bit because you don't have to be
completely influenced by the market conditions at any one time. You have
people that sell cattle to processors… You know, it suits their program.”
P3 explains the point that each producer has a preference for their mode of sales
transaction. They are influenced by external factors when choosing the mode of sale;
tradition, environment or convenience may influence this decision. Given this, it was
also evident that all participants felt as though the Internet was widely used as a
“reference tool” to monitor market conditions. This is facilitated through Meat and
Livestock Australia (MLA) market reports, Agri-business websites and AuctionsPlus.
Throughout the study, it began to appear that, indeed, producers had exactly the same
information about marketing their livestock as the local sales agents themselves. This
point was made bluntly clearer by P3:
“People do not need to use sales agents to sell cattle. Every day I say that to
myself… they can do it themselves. With that in the back of your mind, you have
to look for other ways to make a quid. The other ways to make a quid is the way
that a person needs you, which is with a feedlot product, with some extra skill,
all-a measuring objective carcasses live (value adding services). People come to
us because they want to. But if we are going to be traditional agents, they can
do that themselves.” (P3)
Hence the notion that sales agents have become a value adding service is increasingly
more evident. This is compared to the historical context where all livestock where sold
throughout the saleyard system and, therefore. Local sales agents were depended on.

Page | 95
Whether a three-dimensional service can prove to add more value to the producer will
be tested later in Chapter Six.
The theme of market monitoring appeared in the fact that 22 000 hits were recorded in
just one day for an online catalogue (which actually had no specific purchasing abilities).
It seems now that producers have the ability to operate without agent involvement. The
question is now: How does a producer connect with the extensive range of industry
contacts and buyers who need the livestock? At the moment there is one particular
service called Newmarket that has attempted to fulfil this function of the industry with
social networking approaches; however, it has not succeeded.
Attitude towards three-dimensional images
Figure 6.4: Attitude to 3D images
The collective impression from the study of three-dimensional imaging as part of an
objective analysis tool was positive. However, the understanding of what a system of
three-dimensional images might do, or even of how it might work, was not completely
grasped. This may have been due to the explanation of the method, a lack of visuals, or
the communication medium being used to elicit this information. Nevertheless, the
notion of using a completely automated tool was thought to be a valuable source of
innovation. P2 describes the three dimensional technology by saying: “I think any of
those tools are certainly worth incorporating in a system, yeah, you do that but you are

Page | 96
also giving them all of the information that they need to do it on their own as well. And
that's eliminating all static out of it.” This statement was in reference to providing clients
with tools and information to help and add value to producers’ operations. The point of
enabling the producer to use the technology themselves was high on the agenda of this
particular participant.
Upon asking the participants about subjective and objective assessment, most
responded that objective assessment is the new trend, for a number of reasons: “Our
whole livestock business has been subjectively measured for a very long time. That's not
good enough anymore” (P3). This point is driven by the influence of technology and the
need to create higher and better efficiencies within the industry. The need to create a
more effective manner of assessment is being pushed by producers wanting and
needing to know more about the product they are producing: “So by knowing the
history of the beast from when it's born can help people make a more accurate
judgment. So I think the industry… is that people want to know more” (P3).
One solution that has come about through the need to improve efficiencies and provide
an easier management tool is Electronic Breeding Values (EBVs). The participant
stakeholders thought that integration of a three-dimensional image would give this
current technology more merit as it currently is not visually based: “If it's three-
dimensional, they can relate to that better than just numbers. A lot of people can relate
to it better than just numbers on a piece of paper. I think that, yes, there's a good
chance that it will actually add to the system” (P4). Another participant related to this
scenario quite well, commenting that:
“I have done it myself, when I was a producing, you can buy an animal - you
know, select an animal on EBVs and he's the worst bloody looking bull in the
yard but he's got the best figures. So you need to balance that with visual traits
as well. That's when it gets interesting.” (P5)
The use of three-dimensional imaging seemed to fit quite well into the participants’
perception of the seedstock industry: “If we use such a system, three-dimensional
system, to scan animals when they are in a pen- amongst their contemporaries, in a
contemporary group of animals, so we can get valid comparisons of how one animal
measures up compared to another one, I think we can use that information” (P4). The
participant continued mentioning that, “Bull buyers for example like to do a fair bit of

Page | 97
homework using the Internet before they turn up at the bull sale, look at the animals
and buy them. Certainly won't replace the sales system but I think it will be a strong
complement” (P4). The thought process was that it could save on time and allow the
buyers to inspect each animal before actually arriving at the sale.
The overriding factor of the study was that the industry stakeholders realised the need
to become objective and automated in every function of livestock production and
selling: “I think most of our members expect us to be very objective in whatever we do,
yes” (P4). “If it's automated, then, yes, absolutely, it's probably got a lot of merit
because you know that you are getting the pick of the pick; whereas if you are not, if it's
not automated and it's up to human error, then is it credible?” (P5). The use of a three-
dimensional system was thought to be an effective and objective tool in the assessment
of livestock; importantly, the system should be automated and take out the human-
error which sometimes exists in the industry.
Online process
Figure 6.5: Online Process
The perception of the Internet by stakeholders was generally positive and closely linked
to a three-dimensional imaging innovation. Interestingly, the idea of using one without
the other was not ever considered by the participants. However, when discussing an
online process, the participants were immediately drawn to AuctionsPlus as an Internet

Page | 98
marketing tool; this may be due to the brand’s marketing and other factors. The
participants seemed to think of AuctionsPlus immediately when the term ‘Internet’ was
brought up. With this connection, came a varying array of opinions. Some participants
were quite positive about the system; yet others could see its relevance, but still refused
to take advantage of it. The main benefit of the Internet (AuctionsPlus) was its inherent
capabilities: “Well, I suppose the big one now is - the biggest one is the exposure and
the competition that's generated through AuctionsPlus” (P1). This sentiment was
mirrored by all participants: the fact that they could reach a wider audience.
The negative associations with the online process were found to be within the
functionality of the system: “Auctions Plus can be very time consuming” (P3). This was
the main reason for non-adoption of the tool. Others commented that it would take five
days to sell via the system, preferring the immediacy of the traditional saleyards system.
However, the integration of a three-dimensional tool into the online process was viewed
as a way to value-add to the site: “Angus sales are usually associated with a fair bit of
information on estimated breeding values and various bits of information and that part
sells well to Internet facilities, like on-line catalogues and things (AuctionsPlus). So I
think we will see more and more of that into the future when buyers of those cattle”
(P4).
Throughout the study, the participants all assessed online transactions in a similar
manner. While all participants agreed that using the internet to sell livestock meant an
increased scope of buyers, it became obvious that the Internet’s capabilities were not
effectively exploited because only sales agents had the ability to sell stock for clients on
the AuctionsPlus platform. However, P3 was able to envisage a system which worked as
an automated tool, based on an e-marketing platform: “If you can put an order out for a
thousand bullocks to 5000 people, there's a special price because the market, where
there's a shortage of process, they might throw a market price out there to attract some
cattle quickly. Bang. The easiest way to do it is to push one button and talk to 100 clients
or 1,000 clients” (P3). However, he reflected later that his business operation does not
currently do this.
Other participants mentioned that their operations were indeed utilising this online type
of tool, but considered it to be more as a complementary effort to the physical auction
that it was describing:

Page | 99
“We assisted them with that sale by putting an on-line catalogue on the system
and that on-line sale catalogue, web based catalogue had 22,000 visits in the
first day and it was live and in total it was about 38,000 visits to that sale
catalogue.” (P4)
Therefore, it can be assumed that producers in the industry do in fact use the Internet to
assess the market and monitor its movement; however, participants that were spoken
to throughout the study appeared to believe that using the Internet to sell livestock did
not offer any ‘attractive’ value over other methods.
6.4 Discussion
The study found that the application of the proposed innovation would indeed be
disruptive to the incumbent marketing approaches in the industry. The specific purpose
of this study, however, was to identify the socio-cultural issues surrounding the
innovation of a three dimensional technology in the current climate of the livestock
industry. The four themes identified in the study drew out these deeper social and
cultural issues in the industry.
In the same evaluation, it was important to establish a basis to apply a design led
innovation strategy to further progress this work. The findings were promising for the
use of this approach as it was identified that business strategy, end user needs and user
needs could be applied in this context. Indeed, value adding to the technology’s appeal
is vital in some form or another. In the use of a design led strategy and subsequent
design thinking method, it is possible to identify these potential scenarios.
In relation to the actual proposed innovation, the participants agreed that the overall
implications may be disruptive to the traditional industry. Figure 6.6 depicts the
proposed innovation in the disruptive innovation model, as described in Chapter Three.

Page | 100
Figure 6.6: Proposed disruption of livestock transactional modes
As shown above in Figure 6.6, the proposed innovation was found to hold disruptive
potential in the way livestock are currently bought and sold. As previously presented in
Chapter Two, literature has already identified the need to consider a social approach to
the application of innovations in the livestock industry. Moreover, as Study 1 found, the
proposed innovation inherently holds a disruptive potential within this market.
Therefore, the contribution that this thesis provides builds on previous literature and
addresses the slow diffusion of novel innovations in the Australian livestock industry.
The approach of using a design led innovation strategy in order to successfully
implement disruptive innovations in this industry is the key to this work, as previous
literature has identified the important nature of considering social factors in the
development of a novel product or system. These social factors have been identified in
the context of this thesis as the major themes described above: attitude to innovations,
marketing monitoring, attitudes to three-dimensional imaging and openness to online
environments. Therefore, this preliminary study has identified the social and cultural
factors that may need to be addressed to facilitate the successful adoption of the
proposed innovation.

Page | 101
6.5 Summary
Chapter Six outlined the first study of this thesis, a preliminary interviewing of six key
industry stakeholders. The overall aim of the study was to firstly determine the socio-
cultural barriers to adopting an innovation and, subsequently, to evaluate the
appropriateness of using a design led innovation strategy to further progress the
development of this research in the area. As literature has suggested the use of design
as a means to create novel solutions in the livestock industry, this small scale study
allowed the researchers to test the viability of this suggestion. The results found four
key social elements which should be deeply considered in the subsequent design of the
proposed disruptive innovation. These results will be further applied in Chapter Seven
through the process of a co-design experiment with an industry expert.

Page | 102
Chapter 7 Study 2: Scenario Development through
Co-Design
7.1 Introduction
As identified in Chapter Six, stakeholders
displayed a generally positive attitude
towards innovation and to how three-
dimensional imaging might impact the
livestock industry. Therefore, the
challenges expanded upon in this
chapter surround the value and use of novel, potentially disruptive technologies for the
stakeholders’ real life contexts and experiences. Through the use of designed scenarios,
stakeholders will be able to intimately view alternative ‘technological futures’. This
chapter describes the development of these co-designed scenarios and provides
justification for their use.
The development of the future scenarios was grounded in the learnings derived from
the findings of Study One. The researcher’s role in the design of the future scenarios was
based upon an external qualitative view of the livestock industry. However, Carroll
(1996 p.288) states that:
“The mediator (in this case the designer) role has been criticised on grounds
that mediators may have too little knowledge to represent users and
developers.”
Therefore, the designer went through a process of immersing himself in the industry
through the use of observations of critical parts of the value chain. Essentially, the
process allowed better “formative evaluation and redesign of the prototype” (Carroll,
1996), in this case, the future scenarios. These observations allowed the designer to
understand the socio-cultural underpinnings of the industry. By immersing himself or
becoming a participant observer (Sasha, Michael, Tyler, Kurt, & Markeda, 2004), the
designer could gain a deeper knowledge of the implications of the proposal. Indeed,
Sasha (2004) explains that the design of an artefact that ostensibly changes the
7.1 Introduction
7.2 Process
7.3 Results
7.4 Design Scenarios
7.5 Discussion
7.6 Summary

Page | 103
industry’s normal operations “may be naive and possibly arrogant”. Given this, further
evaluation and re-design of the scenarios was an advantageous decision.
Design thinking (Brown, 2008) offers techniques that enable participants to view
alternative ‘new’ futures, for example, product scenarios. Therefore, the value of design
is in its ability to create and construct novel ideas and approaches to innovative
solutions. In the livestock sector, design thinking has not been a widely used tool to
create new products and/or systems. Instead, as previously noted in Chapter Two,
companies have typically innovated for innovation’s sake, and adoption rates have been
typically slow. Design thinking in this project has been, therefore, grounded in a
participatory design (PD) approach through stakeholder engagement across the entire
value chain. As earlier explained in Chapter Two in the review of the Australian livestock
industry, innovating novel products in the industry is also highly dependent on the
cultural factors of the subjective norm (Pease & Rowe, 2005). This is another reason for
grounding the design workshops in PD, as it allows these socio-cultural/qualitative ideals
to resonant through the research (Carroll, 1996). Within the context of the traditional
agricultural face-to-face relationship, a PD approach facilitates better interactions.
Indeed, the technology presented in the research is only a means to draw upon deeper
cultural issues at play within the process of introducing a disruptive change to the
industry. Stakeholder engagement has been fundamentally positioned in the scenario-
based assessment of future proposals which complements the PD approach explained
above.
The advantage of using design scenarios is in the ability for stakeholders to quickly relate
and understand each proposal. Polanyi describes this as “the plunge by which we gain a
foothold in another shore of reality” (Polanyi, 1998 p.123). Polanyi explains that using
visuals helps to further the knowledge of the stakeholder, and allows them to explore
deep concepts more easily. Ehn (1988) also builds upon this concept by presenting the
position that designers must also be able to include the social tradition which
stakeholders can relate too; more than that, designers must have the capacity to
translate these visuals into constructed futures. These futures must transcend the
tradition of the previous, and hence drawn the stakeholder into a plausible future. In
this way, Ehn (1988) argues that the stakeholder can be more thoroughly engaged.
For the purpose of determining the social impact of radical innovation with which this
thesis is concerned, the proposals were created to provoke an engagement with the

Page | 104
research participants (Bucolo & Matthews, 2010). Bucolo (2010) explains the advantage
of provoking stakeholders in relation to changing social patterns/innovations. Further to
this, stakeholders can easily comment on the proposals and can offer opinions on how
each slide would affect both them personally, and the sector as a whole. The design
proposals (explained in detail later in this chapter) specifically draw out cultural barriers
to market and practical concerns of the innovation.
7.2 Process
As briefly described in Chapter Five, the methodology for Study Two has been separated
into two smaller stages in order to reach the final design scenarios. These are:
Study 2a – Observations
Study 2b – Co-design
Figure 7.1 documents how these two smaller methodologies fit within the greater
research scope of this thesis.

Page | 105
Figure 7.1: Path of three stage research study
7.2.1 Study 2a: Observation Procedure
To commence Study Two a week long observation was used to engage researchers with
the industry on the ground. In this process, the researcher adopted the role of a passive
observer and used these learnings to refine the proposed scenarios presented later in
this chapter (Sasha, et al., 2004). For this process, listening and observing was the main
aim, with these observations aimed at reviewing the learnings established from Study
One.
As earlier noted, the observations took place in Roma and Dalby (Queensland, Australia).
These sites were selected due to the size and scale of the areas visited there and the
diversity of different aspects of the livestock value chain being represented. Table 7.1
depicts the observational rationale.

Page | 106
Table 7.1: Rationale of livestock observations
Observation
Objective To identify cultural, social and physical barriers to entry for the
commercialisation of three-dimensional imaging throughout the
various stages of the value chain – from seed stock segment to
processing – and to include the opinions of a designer who has
developed a new three-dimensional innovation.
Setting Various Sites in Dalby & Roma, QLD Australia
03/05/10 – 07/05/10
Methods Observation
Data
Collection
Use of a digital camera, recorded notes and conversation
Process sketching for later analysis
Experiment Test validity of proposed scenarios
Observing the process of drafting in the saleyard specifically:
- How many workers does each operation employee?
- Communication between these employees
- Efficiency of process and workflow of the business
- Identifying ideal areas for the implementation of three-dimensional
drafting technology
The participants were questioned about the process and how they
think it works for them.
Data
Analysis
tools
Researcher reflection on the process, comments and actions of the
participants.
Sketching of the process and analysis of task
Observation localities/participants
For the observation processes to be worthwhile, the researchers spanned the five
observations across a working week. Figure 7.2 documents the locations of each
particular observation, according to day and subsequent placing within the supply chain.
There were no participants directly involved in the observations at each of the localities,
so the signing of participant release forms for ethical purposes was not required.
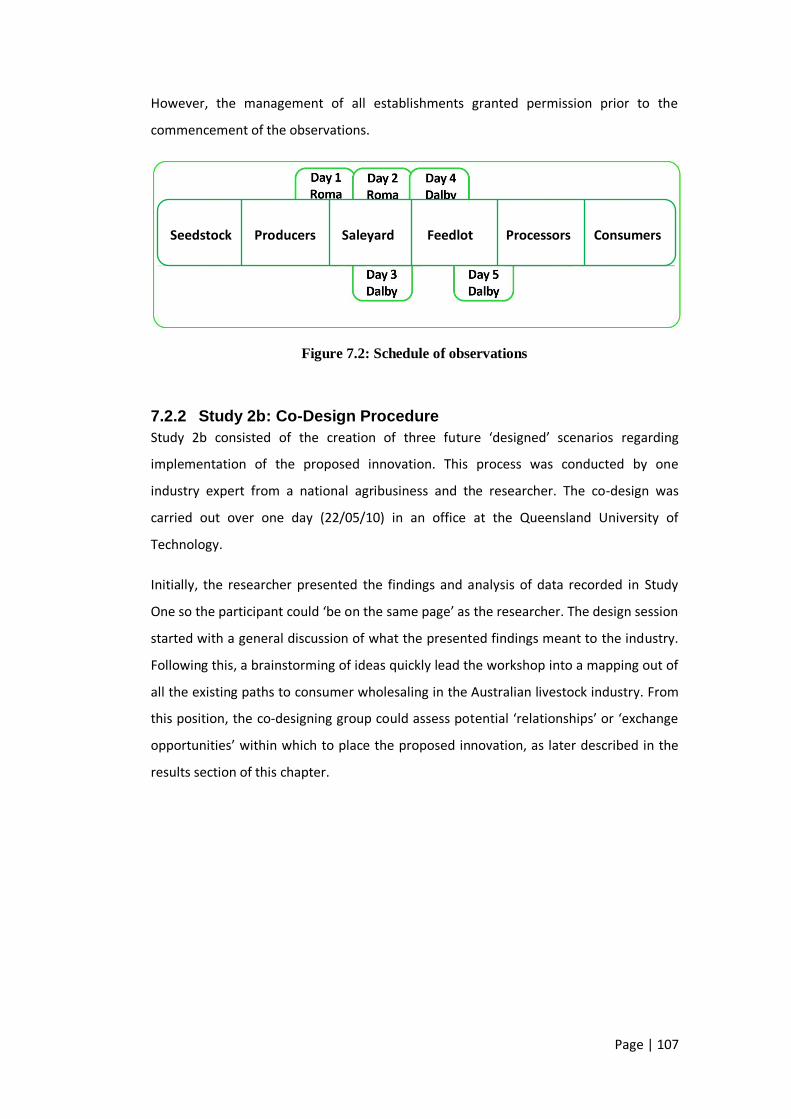
Page | 107
However, the management of all establishments granted permission prior to the
commencement of the observations.
Figure 7.2: Schedule of observations
7.2.2 Study 2b: Co-Design Procedure
Study 2b consisted of the creation of three future ‘designed’ scenarios regarding
implementation of the proposed innovation. This process was conducted by one
industry expert from a national agribusiness and the researcher. The co-design was
carried out over one day (22/05/10) in an office at the Queensland University of
Technology.
Initially, the researcher presented the findings and analysis of data recorded in Study
One so the participant could ‘be on the same page’ as the researcher. The design session
started with a general discussion of what the presented findings meant to the industry.
Following this, a brainstorming of ideas quickly lead the workshop into a mapping out of
all the existing paths to consumer wholesaling in the Australian livestock industry. From
this position, the co-designing group could assess potential ‘relationships’ or ‘exchange
opportunities’ within which to place the proposed innovation, as later described in the
results section of this chapter.
Seedstock Producers Saleyard Feedlot Processors Consumers

Page | 108
7.3 Results
7.3.1 Study 2a: Observations
The five day observation of various livestock locations identified numerous
understandings and confirmed many questions/queries that the researcher held (For a
complete and thorough report of each activity viewed, refer to Appendix 2). The
observations identified numerous actions; these have been generalised into three
topics: process, technology and culture, as presented in Table 7.2.
Table 7.2: Results of five day observation
Activity Processes Technology Culture
Drafting of
livestock
Verbal
Communication –
hard to hear work
orders
Low tech
leaver-gate
systems
Long days with early
start. Hard tedious work
having to concentrate
quite hard
Saleyard
Auctions
Verbal cry out, Hand
note taking by all
(agents & buyers)
MLA rep using
technology to
record sale prices.
No technology
used to sell
livestock
Fast, dynamic and
direct. Agents try to
maintain control of the
crowd by joking. Most
cattle will sell from the
pen
Feedlot
Inductions
Slow & tedious
process of visual
inspection of stock
3D scanning
currently being
trialled at this
particular feedlot.
Culture of superiority
than the lowly
producer. Maintain
accuracy of processes
Feedlot
Operation
Feeding of stock very
measured and
deliberate. Try to
reduce the human
contact with
livestock to ensure
quality of stock
Feed trucks
measured for
weight loss of food.
No technological
measurement of
stock during time
in pen.
Culture of superiority
than the lowly
producer. Maintain
accuracy of processes

Page | 109
Through the use of industry observations, the end design of the future scenarios was
made easier. By more thoroughly understanding the social, cultural and physical
underpinnings of the industry, designers can more accurately create a plausible design
outcome. Moreover, by understanding these above mentioned factors, designers can
intentionally move the scenario into new areas/markets which are not currently catered
for in existing markets (as described in Study 2b). Following the observation the
researcher was able to design initial conceptual business proposals based on the
knowledge gained. A total of three concepts were designed in order to be co-evaluated
and redesigned in study 2b. However merely verbally communicating these proposals
only allows participants to make superficial comment; hence the use of a design
scenario where participants are engaged through a story with meaningful characters can
be used as a fast and effective process of evaluation.
7.3.2: Study 2b: Co-Design
After the observation described in study 2a, three initial concepts for value-added gains
based on the proposed technology were designed for the Australian livestock industry.
This process was driven by a design thinking innovation approach and lead into the co-
design of three future scenarios. In the development of a disruptive technology it is
important to offer a distinct difference and value of implementing a new way to perform
a similar task. In this case, it was important to identify a new value exchange between
real people in the industry, through new channels. The proposed innovation was able to
be crafted and subsequently designed to fit into a disruptive business model, and placed
in a future scenario in the co-design process.
In the co-design process, the researcher and expert participant created a high level
mapping out of all possible channels to the wholesale market of the livestock in the
livestock industry. Through this process, it was then possible to identify different
exchange relationships between stakeholders in the industry where the proposed
business might be able to fit into. This process allowed a critique of every exchange of
livestock between stakeholders in the industry and gave way to a strategic placement of
these business models. Figure 7.3 displays this mapping of the paths to wholesale as
identified by the co-design participants. In the figure, three relationships to be
addressed by the proposed innovation have been identified, and are marked in red. The

Page | 110
relationships were assessed, and decided by the co-design group to be the most
advantageous positioning for the proposed technology.
Figure 7.3: Paths to wholesale market of livestock and identification of potential
innovation relationships
The three relationships presented in Figure 7.3 were all transferred respectively into a
‘future scenario’ for each relationship by the design group. Hence, the relationship
between the seedstock segment and the producer segment was addressed by a
‘Differentiation Scenario’. Secondly, the relationship between the feedlot segment and
the processor segment was addressed by an ‘Efficiency Scenario’. Lastly, the third
relationship identified in the study addressed the relationship between the earlier two
scenarios through a ‘Business Model Scenario’.
7.4 Design Scenarios
7.4.1 Design Narrative
The design narrative is a tool which designers and researchers can use to help
participants digest novel information. Hence, a design narrative was written with the
intent of allowing study participants to easily understand the proposed technology. The
use of a design narrative affords participants the ability to closely connect to the story
(Clandinin & Connelly, 2004). Images alone can lead to differing ideas and opinions;
however, the narrative ties the designed proposal together. In the presentation of each
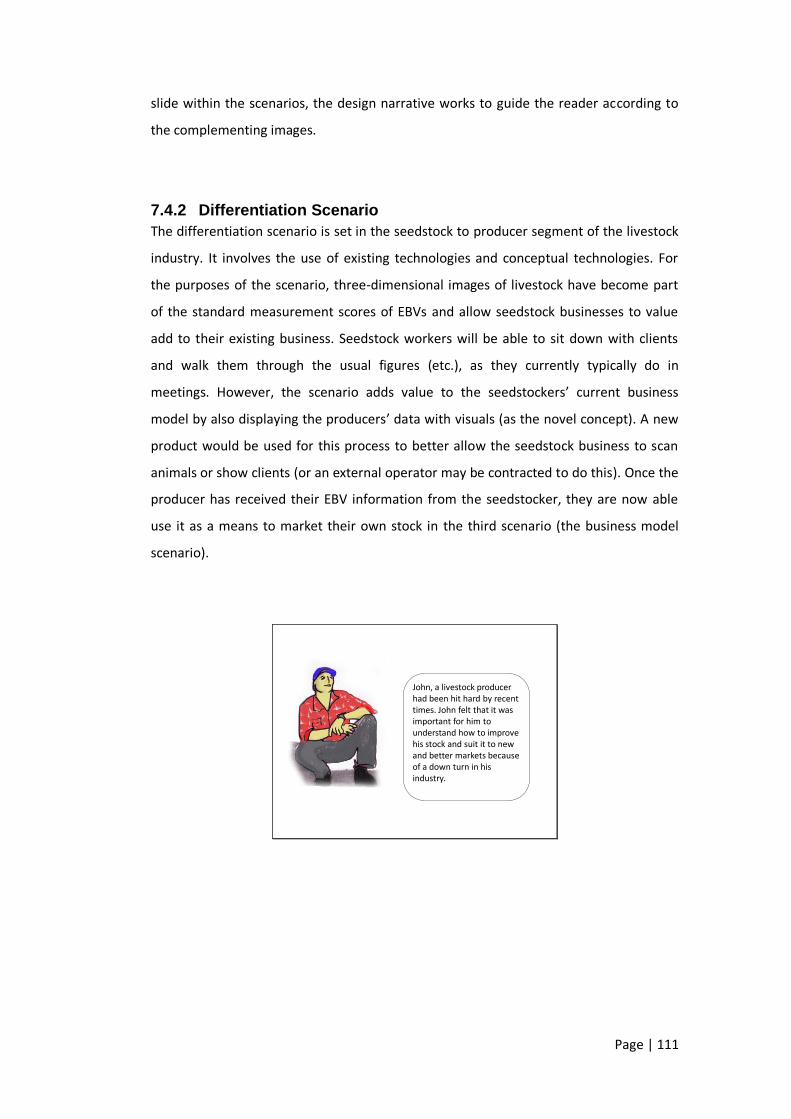
Page | 111
slide within the scenarios, the design narrative works to guide the reader according to
the complementing images.
7.4.2 Differentiation Scenario
The differentiation scenario is set in the seedstock to producer segment of the livestock
industry. It involves the use of existing technologies and conceptual technologies. For
the purposes of the scenario, three-dimensional images of livestock have become part
of the standard measurement scores of EBVs and allow seedstock businesses to value
add to their existing business. Seedstock workers will be able to sit down with clients
and walk them through the usual figures (etc.), as they currently typically do in
meetings. However, the scenario adds value to the seedstockers’ current business
model by also displaying the producers’ data with visuals (as the novel concept). A new
product would be used for this process to better allow the seedstock business to scan
animals or show clients (or an external operator may be contracted to do this). Once the
producer has received their EBV information from the seedstocker, they are now able
use it as a means to market their own stock in the third scenario (the business model
scenario).
John, a livestock producer had been hit hard by recent times. John felt that it was important for him to understand how to improve his stock and suit it to new and better markets because of a down turn in his industry.

Page | 112
To do this John decided to call his local seed stock business & arrange a meeting to analyse his stock to genetically enhance it.
Daniel, the seed stocker was provided with John’s current livestock details (EBVs) and begins to work with John’s herd.
+ New
product
=
Daniel, the seed stock agent met with John and used his computer to work with him.Daniel was able to visually show John a 3D image on the digital screen of his own stock.
John sat down with Daniel and inspects individual livestock that may be injected into John’s current herd, and how the offspring might grow.
Something which other seed stock agents could not do for John.
Daniel started to adjust the EBV levels on the screen. John watched the 3D image transform in real time in front of him. John quietly thought to himself “When Daniel changed that statistic, I didn’t really like the look of that beast…” So John told Daniel that maybe this EBV variation wasn’t quite right.

Page | 113
John still remained sceptical of the technology and what it really meant for him. So Daniel brought up another image of a lamb (one of Daniel’s other clients) to show John. Daniel manipulated the image to show John the capability of the technology and just how detailed it was.
Daniel was able to better communicate with John; using 3D visuals. Their relationship was made easier by facilitating a better communication exchange between the two men, based on the visuals.
John now might also wish to use his new 3D data as a platform to sell his newly improved stock on the internet.
Figure 7.4: Differentiation Scenario
The participants’ justification of this positioning strategy was based on extensive
industry knowledge. The scenario was positioned here based on the influencing power
of the seedstock agents over the producer; and because of the perceived advantage the
proposed innovation might pose for this relationship. Adding value to the seedstock
agents’ ability to communicate was deemed important and quite useful in this

Page | 114
interaction. Using a three-dimensional innovation at the early stage of the value chain
was thought to be strategic because of the flow on effects that the technology could
foster in the producer’s mind. The overall logic of this positioning is, therefore, to help
the producer become accustomed to the three-dimensional innovation through an
external source, whilst adding value to the producer’s operation. Thus, the producer
would feel more comfortable using three-dimensional technologies in the future for
other aspects of their business.
7.4.3 Efficiency Scenario
The efficiency scenario is set in a feedlot operation and is more hardware based than
the differentiation scenario. Specifically, it is an efficiency approach to the use of a
three-dimensional management system. This system will replace the long standing
method of having a manned race or shoot, ‘drafting’ individual animals into varying
pens. Feedlots will now be able to send out tenders to source the type of product that
suits the desired markets. For instance, external environmental and historical factors
may mean that various types of livestock are better suited to different programs within
the feedlot process. An automated, visual and three-dimensional platform may be a
viable solution. As an animal walks through the entry shoot, it is recognised individually,
and analysed based on a set three-dimensional algorithm. This automatically drafts the
animal into a specific feed program.
Simon, a Feedlot buyer based in QLD, is typically sent out to source the best type of product that suits his feedlot. Simon sources his stock from anywhere within the state. His hours are long and often spent away from his family.Usually Simon purchases directly from the paddock or on AuctionsPlus because he can ensure quality and price. Sometimes Simon goes to saleyards but prefers not to.

Page | 115
Once Simon delivered the beast, it was inducted to the feedlot, the beast was given an individual program to suit it.
Simon monitors the beast as it comes to feed; 3D matching technology is able to re-direct individual beasts to their specific feeding areas to ensure that it is able to feed on its individual quota.
Simon can value add to his feedlot by being able to develop relationships with processors based on 3d imaging and its implications.Other buyers may also access the feedlot’s database & view detailed information of the quality and type of stock being fed.
Simon’s buyers can purchase stock from him and be confident that no outliers are present within the ‘for-sale herd’ before the transaction takes place.
Figure: 7.5: Efficiency Scenario
This scenario was located in the feedlot to processor segment of the value chain. The
scenario draws on the automatic capabilities of the potential innovation and how it
might work. The concept works to better create effective feeding programs for
individual animals amongst a mob of cattle, or to filter out lesser quality animals
altogether from the feedlot program. The innovation will scan the individual animal as it
enters the feedlot and automatically tracks the animal for the remainder of its time
within the feedlot system. Using an algorithm based on the three-dimensional scan of
the animal, certain traits can be extrapolated upon, producing a specific individual
feeding program. Therefore, better quality animals are fed for the longest period
because they will typically take to the program more quickly. Feed will not be wasted on
poorer quality animals that take more feed to gain the same weight as the better quality
animals.

Page | 116
7.4.4 Business Model Scenario
The business model scenario, as seen in Figure 7.6, is a social interaction tool based over
the Internet. The concept integrates social networking within an agricultural sense, or
‘Facebook for farms’. It is a web-service that actively connects sellers (producers) with
buyers (processors), through a three-dimensional orientated web service. Through the
system, a buyer can place a tender for a specified type of product, including an EBV
reference requirement (where three-dimensional analysis had become the standard).
This is automatically viewable by producers who match the type of tender offering from
this buyer. The website then connects the two enterprises and facilitates the transaction
of the animals, including payment and other important processes.
A processor might be looking to use the site as a means to establish future B2B relations
with a producer; however, the producer is likely to stay within the system because of
the greater exposure and publicly viewable information about each transaction that is
available. A producer might be setting themselves into a lower price for an extended
period of time, rather than utilising the tender system to their advantage. The exposure
that the website offers is of more value than one relationship with one buyer.
The business mdoel scenario was co-designed through the knowledge presented in the
literature from Chapter 2, specifically: Frank (1995), Driedonks (2005), Rogers (1995),
Allee (2008) and Christensen (1997). Buidling upon this knowledge, the findings of Study
One were also considered and used to justify the design of such a provocative scenario.
John, a grazier likes to log onto the farming social networking website.John liked it because he can connect with other farmers in his local area and communicate with them on various topics, forums & socially as well.
As John worked his way through the website he realised he can also be trained in various skills specific to his industry.

Page | 117
John used the website as a social networking tool, as an online forum of rural based issues and importantly a tender based sales system.John decided to use the website to bypass the middleman that he currently employed.John accessed the website and used it as a means to buy and sell this livestock using a 3D assessment.
Alert to a new tender for livestock
When John logged onto the website, he received an alert from a buyer and an option to make a connection to that vendor.In this way John, the producer, controlled the transaction and when he was ready to sell, there was an array of buyers willing to purchase from him.
The website facilitated John’s business connection to the purchasing vendor & his payment was also made through the site. John saved time allowing the paper work required for the movement of animals to be automated and tracked via the national database.

Page | 118
Other Producers Processors Retail Customers
John regarded the website highly because of the advantages that online sale offered.John continued to use the website because of the social aspect of it and for the convenience of real time notification of bid tenders/approvals.
John explained to his wife that the website essentially incorporated all the benefits of saleyards and online transactions. John’s wife was able to understand and liked the fact that John could be at home just a little bit more.
Figure 7.6: Business Model Scenario
The social interaction of the industry members was deemed to be quite important to the
adoption of any innovation, a concept presented through the literature reviewed in
Chapter Two. The development of this last scenario was influenced by Frank (1995), who
found that innovations were very much determined by the extent of required change to
the farmer’s self-concept. If a farmer felt as though his peers did not see value in the
innovation, then adoption of the technology would be difficult. Given this, if the
proposed innovation was to become a standard practice, the traditional social
interaction experienced at saleyards might potentially disappear. Hence, the solution to
this problem was answered by the integration of online social networking into the
industry. This aspect of the scenario was given merit by the co-design group due to the
current lack of mainstream online agricultural social networking in Australia at the
current point in time.
Page | 119
7.5 Disscussion
The co-design process outlined in this chapter allowed the designer to establish a
plausible yet futuristic approach to the design propositions. In this way, future
participants in the focus groups can also think more creatively and are more likely to
express deeper cultural issues within the system if it is likely to alter their current
practices. In effect, the scenarios become a soft prototype of the proposed three-
dimensional innovation. Brown (2008) comments on prototypes, saying that: “They
should command only as much time, effort, and investment as are needed to generate
useful feedback and evolve an idea. The more ‘finished’ a prototype seems, the less
likely its creators will be to pay attention to and profit from feedback.”(Brown, 2008 p3)
7.6 Summary
Chapter Seven outlined the development of the three proposed scenarios that will be
tested within the body of Chapter Eight. Using a co-design, a participatory method
allowed the development of the scenarios to be realistic within the livestock industry
context. By utilising literature study, preliminary study and field observations, coupled
with industry expert opinions, the scenarios were able to reflect a more realistic
snapshot of how the innovation might fit into the livestock industry within a 20 year
timeframe. Given contemporary innovations’ rate of diffusion (refer to Chapter Two
with respect to online transactions and RFID tagging), it would seem that this timeframe
is realistic for the successful application of such an innovation. Moreover, presenting the
scenarios within this time period aids the research in uncovering social trends which
may inhibit, or indeed allow, radical innovation to succeed within the livestock industry.
As the innovation is deliberatly not shown in a tangible sense, only the
outcomes/implications of the innovation (as elicited from the designed scenarios)
become integral to the successful collection of quality data. Combining visual data with a
narrative allows all participants to follow the ‘journey’ of the characters more accurately
and, hence, stakeholder/participant comments should be more consise.
In this chapter, the development and theorectical standing of the scenario proposals has
been explained. In the following chapters the prestation of the proposed sceanrios is
documented in study three. Following this the findings and design implications are
therefore also presented.

Page | 120
Chapter 8 Study 3: Testing the Proposed Designed
Three-Dimensional Scenarios
8.1 Introduction
The third study of this thesis aimed to
test the three design scenarios, as co-
designed and documented in Study Two.
It is a difficult task to apply disruptive or
radical technologies to new markets;
hence, the design scenarios aimed to
determine the best market position for the proposed technology. Ideally, if an
innovation (technological or system) could be placed across an entire value chain, it
would stand to be more profitable. However, a lack of proper placement may lead to
non-adoption, as earlier identified in the literature (refer to Chapter Two), and
subsequent breakdown of the entire innovation system may occur. In order to address
this problem, this thesis employs a design led innovation, grounded in design thinking.
Thus, Study Three makes use of a PD approach to engage industry stakeholders in better
refining the proposed innovation. Using this methodology also fills an identified gap in
the agricultural literature. This chapter, therefore, describes the use of a design led
innovation strategy and records the results and data analysis of this third study.
The design scenario was used as a medium of information transfer in the study.
Moreover, the three scenarios were utilised to provoke an engagement between the
researcher and participants (Bucolo & Matthews, 2010). By establishing this situation,
more traditionally minded participants were encouraged to think more broadly and
innovatively about their industry. Importantly, the stakeholders in each of the groups
represented one segment of the value chain.
The scenarios that were tested aimed at understanding the ‘why’ behind the adoption of
a three-dimensional imaging solution. Instead of focusing on ‘what’ the technology
exactly is and how the innovation might be applied, the scenario tried to uncover why a
user might want to adopt the innovation based on its social cultural aspects.
8.1 Introduction
8.2 Process
8.3 Data Analysis
8.4 Findings
8.5 Results
8.6 Summary

Page | 121
Understandings could be developed by analysing the reaction to these alone. Yet, to
understand the ‘why’, questions were asked; these questions were designed to
challenge the status quo of the livestock industry. The intent of the questions was also
to create a reaction (positive or negative) relevant to each participant’s personal
position within the value chain. A comparison between participants is therefore made
easier by contrasting these reactions. By considering the effect that each scenario (slide
by slide) had on different segments of the value chain, it might become obvious why a
participant might choose to adopt, or not to adopt, the innovations.
Co-designing changes to the proposed future system was encouraged in group
discussion. Because of the fluid nature of the design scenarios (Carroll, 2000), co-
designing new aspects of the system was made easier. Refining of the proposed system
was thus directed by the comments and attitudes of the stakeholder participants,
through actively engaging their ideas. The inclusion of the design narrative in the
proposed scenarios was to allow the participants to more thoroughly believe in the
system as depicted in the scenario. Mateas and Sengers (1999) document that the
“Narrative has been recognised as a particularly rich constellation of ideas for informing
system design”, even commenting that: “People are narrative animals. As children, our
caretakers immerse us in stories: fairy tales, made-up stories, favourite stories.” By
explaining the system in a story telling manner, or design narrative, participants were
more likely to connect and understand the issues at play within the scenario. Another
aspect that is important to the narrative is that the technological issues are, in a sense,
removed from the story.
The groups critically evaluated the proposed design, drew out cultural barriers to
market, raised practical concerns about the technology, and commented on the system
in its three parts. Discussion with other participants and researchers within each group
was encouraged and many issues were debated. Readiness to innovate was then
explored; this was then contrasted with the readiness to innovate and adopt new
technology of other groups within the value chain.

Page | 122
8.2 Process
The method used for the presentation of the designed propositions was grounded in a
participatory design approach (Carroll, 2000). In order to better facilitate this research,
participants were presented with the scenarios in a focus group format. These focus
groups afforded the participants the time and the setting to debate and discuss relevant
topics. The focus groups were mostly comprised of 2-5 participants within one segment
of the value chain. In some instances, however, location and other factors meant that
the focus group could only be conducted with one participant as a semi-structured
interview/focus group. Obviously, this was a limitation of the research method in that
the same level of discussion and interaction could not be achieved in the smaller groups.
8.2.1 Participants and Procedure
A total of 11 industry stakeholders took part in the six focus groups. All participants
were stakeholders from the livestock industry. These participants ranged from all parts
of the value chain; however, only one of the eleven participants was female and ages of
the participants ranged from 19-60 plus. The participants in the research were initially
contacted via telephone and a request was made for them to contribute to this study.
They were asked to volunteer their time and were not paid to do so. Table 7.3 outlines
each focus group and the industry segment which it represents.
Table 7.3: Focus group background information
Focus Group
Number
Industry Segment Location
1 Sheep Feedlot Loxton, SA
2 Sales Agent /
Producer
Brisbane, QLD
3 Beef Feedlot Glen Innes, NSW
4 Seedstock /
Producer
Holbrook, NSW
5 Seedstock Holbrook, NSW
6 Processor Brisbane, QLD

Page | 123
The focus groups were arranged by researchers contacting potential participants directly
(phone and email) and re-contacting the members of the initial study. These contacts
were identified and supplied by the industry partner. Each focus group (2-5 participants)
was presented with the three scenarios and asked to comment on the proposed system
and how it (in terms of each slide) would affect them on various levels: personal,
sectoral, and with consideration of the future). Throughout the focus groups,
participants were asked to relate to the three characters in the design scenarios. The
focus groups were all voice recorded and later transcribed for analysis.
The purpose of the focus groups was, ultimately, to have participants explain the value
(or at least perceived value) of the three-dimensional imaging to their personal contexts.
To achieve this, the first part of the research focus group was to create an environment
or establish an understanding of future technology and innovation. The key to the
success of the focus group was in the ability of the researcher to induce a sense of
innovative thinking. This was, particularly, to negate any existing negative associations
with technology (for instance, the Internet), as identified in the literature and also in
Study One. Only then could a participant comment on the potential implications of the
three-dimensional technology in the future (up to twenty years).
When the focus groups commenced, the focus group facilitator indicated that the voice
recorder had been turned on to capture the discussion. Each slide was verbally read out
by the focus group facilitator. All focus groups were asked to relate to the characters
within the narrative and comment on the images provided. The participants were able
to read along with the narrative and also to correlate the text with the visual prompts.
Participants were asked exploratory open ended questions such as: “What value would
there be in being able to visually see your livestock on a digital screen and how different
would it be to evaluate a beast on a screen than in real life”. Depending on the flow of
the conversation that was being generated, the questions were asked in varying orders
so as to further facilitate a good flow of discussion for each slide. Creating the flow of
discussion was found to be an important determinant of the data produced in the focus
groups.

Page | 124
8.3 Data Analysis
As with Study One, the data gathered in Study Three was detailed and rich. As Rabiee
(2004) reflects: “Qualitative research and, in particular, focus-group interviews generate
large amounts of data”. The coding and subsequent data analysis was based on the
work of Kruegar, and performed according to the methods described by Rabiee (2004).
This process used a five stage framework of coding: familiarisation, identification of a
thematic framework, indexing, charting, mapping and interpretation. The benefit of a
thematic approach is that it develops ideas both from the research questions and from
the points made by participants in reference to the scenarios (Rabiee, 2004). Emerging
themes become the categories for analysis; these are reviewed, refined and named into
main themes and sub-themes (Liamputtong & Ezzy, 2005).
The identification of themes occurred through “careful reading and re-reading of the
data” (Rice & Ezzy, 1999. P258). The transcripts of all focus groups were reviewed and
qualitative, thematic coding was performed throughout. Comparison tables to contrast
the various comments made by the separate focus groups were used. Each quote was
pre-coded under relevant themes, and subsequent analysis compared themes to value
chain sectors. Macro themes were identified, and sub-category themes are further
explored and presented in the results section of this chapter.
8.4 Findings
Participants within the focus groups displayed a wide range of opinions and insights,
both positive and negative. The findings of this study are presented within each of the
three designed scenarios. These findings (presented below) detail the opinions of focus
group participants and compare varying views throughout.
8.4.1 Differentiation Scenario
The participants within the focus groups displayed a predominately positive reaction to
the differentiation scenario, which introduce the capabilities of three-dimensional
imaging and what such a system could mean for individual producers.
Participants expressed positive comments that the producer in the scenario could be
advantaged by such a three-dimensional system. However, many felt that “Less than

Page | 125
20% of producers are willing or currently try to enhance stock quality either by being
lazy or being traditional” (FG3), and positively compared the three-dimensional system
to the incumbent Internet auction website:
“AuctionsPlus has the lack of images, it’s stretched out. If you had more in-
depth visuals and know the results it would halve Johns time, Farmers have to
be cost effective. If he had enough education in the process he could do it
himself.” (FG3)
There was a feeling that loyalty to the incumbent model of saleyards would stop
stakeholders from switching, although there was a sense that education might address
the cultural change needed.
Stakeholders consistently explained that only twenty percent of other producers were
perceived to be actively trying to enhance business operations; stakeholders suggested
that increased education could improve this situation.
The guiding principle motivating the development of the visuals and scenarios was that
the innovation presented would provide producers and stakeholders with a completely
objective manner of livestock analysis. Throughout the data analysis of this first
scenario, it appeared that the term ‘objectivity’ in the livestock industry represents
different ideals. One focus group reflected on objective technology by saying: “They
don’t know how to read EBVs. 20% read EBVs first, 80% look at bull and then read EBV,
then they buy it anyways… Absolutely need to trust the EBV – but if you’re a breeder
there is a danger in appraising bulls without visuals.” (FG5)
Participants responded surprisingly well to the idea of adopting/incorporating new
innovation into their businesses. However, it seemed as though, in action, stakeholders
could be classed as ‘progressive’ to ‘traditional’. One focus group explained the current
role of EBVs in the industry: “EBVs are important but you've got to have an animal that
can walk. It’s about relationships.” (FG6) The focus groups were able to relate to the
need to use technology in the purchase/evaluation of livestock. One participant explains
that the relationship between seller and buyer is important to combat the problem of
not actually being able to see the animal. Interestingly, the same participant did not like
the ability to view the animals in three-dimensional from an office: “You can’t get the
sense of the animal through email. I want discussion, I want to be able to ask what he's
got, how old, the price... It’s not something I would do via email. See I would never buy

Page | 126
on EBVs alone, that’s probably 20%. I would say the majority go 80% on the animal and
20% on EBVs, it should be the other way around, but it’s not...” (FG6)
The following is the continued conversation between this focus group participant and
the researcher:
FG 6: If you take this example you can already get online and look at catalogues
of stud animals and they have pictures there, so a three-dimensional image
would be of additional value there.
Researcher: So is inspecting livestock on the computer screen different to real
life?
FG 6: Yes inspecting a real life replica in a three-dimensional sense on the
computer is different to inspecting the same animal in real life. You're not going
to see them moving... More for the guys that have bigger properties, it’s more
important to know that you have an animal that’s going to walk to water and
that’s going to look after itself during the extreme of summer.
Researcher: Can you tell an animal that will be better suited to those conditions,
from a 30 second look in the pen over the fence?
FG 6: Well maybe not better animals, but just that it doesn’t have obvious faults.
Like claws, the structure of the claws, the angle of the hocks, how fleshy the
thing is, length as well. So structural things, tails etc. Honestly, would I use it as a
cattle producer, no. I think honestly it’s the enjoyment, you know.
Researcher: It’s the experience?
FG 6: Yea.
From this excerpt, it can be seen that the participant explained all the benefits of using a
real three-dimensional replica model of a beast, without realising it. Interestingly, the
participant admitted that more than the face to face relationship and the real life visual
assessment, it was the enjoyment of being there that would prevent them from using
three-dimensional visuals to purchase livestock.
Another focus group participant lamented this fact and stressed that he believed that
the stakeholders within the industry who purchase animals on the basis of visuals would
be the first to fail in the coming years. Interestingly, this participant was a seedstocker.

Page | 127
He showed no accountability in the fact that his profession aims to help producers
increase quality, and admitted that although he has previously tried to educate farmers,
he just does not bother anymore: “Agents need to educate him (Speaking in the context
of other producers/clients). And the agents aren’t educated and that’s the problem.
Seedstock is not mainstream and once a person has been educated in the 'old school'
it’s hard to change that culture.” (FG5) From this seedstocker’s perspective, “three-
dimensional visuals would be a step backward for the industry”. (FG5)
The three-dimensional scenario was described as “...of little value, and something we
can do with our eyes just as quick. It’s navel gazing, you should be analysing the genetic
profile and the things that are important for this person’s market…” (FG5). The focus
group in this sector of the value chain focused more on percentages to describe
livestock: “We probably talk more percentages than anything else than figures or data...
This ram is in the top 5% of the trade index... The producer mightn't be that smart, but
he knows what that means really quickly...” (FG5). It appears then that the seedstockers
in the focus group try instead to manage their clients’ education levels, and to give them
enough information to get by in an operational sense.
8.4.2 Efficiency Scenario
The efficiency scenario was located within a specialised industry within the value chain:
the feedlot sector. The designed proposal depicted feedlots individually tracking
livestock using three-dimensional technology, with implications for value added
commercial gain. The scenario was initially queried, as the technology was questioned;
however, it was found that feedlotters were able to display an innovative attitude
toward the scenario: “Today’s Feedloters are more of a business operation than a farm.
There is not as much holding onto the traditional farming methods.” (FG3)
The scenario described three key areas where Feedlotters would engage the use of
three-dimensional technology:
1. In the pre-purchasing assessment of livestock
2. In the tracking of livestock whilst in the feedlot
3. In the subsequent re-selling into the processing sector.

Page | 128
The data collected from the efficiency scenario was generally positively slanted: “That’s
perfect, if we could see the producer’s herd, and extended details (environment, three-
dimensional, history, age etc.) we could use the website database to find the optimal
cattle for us…” (FG1). Currently, the feedlotters who participated in the research
operate using a catalogue of previous clients. They typically foster working relationships,
which fits into the macro theme of communication. The feedlot industry is, therefore,
very cautious of taking new clients due to a lack of previous knowledge of livestock
performance attributes. Therefore, any system which could provide detailed (either
subjective or objective) data, beyond what is currently possible, would value add to the
feedlotting service. Indeed, the web service platform suggested in the scenario would fit
well into the business model of feedlots as it promotes direct sales, and the
establishment of business to business relationships:
“Prefer direct sales cause of less stress and better price incentives. Generally go
through agents for stock (4:00)…Yes prefer not to go to Saleyards. Stress factors.
Saleyards don’t offer feedback which is so important to us. We need to know if
livestock have had access to grain before for instance…If you could compare
environment it would be of great value.” (FG3)
Therefore, it is plausible to deduce that such a three-dimensional orientated web-
service might be valid in the industry in the near future. Providing the capabilities upon
which feedlots could base new business relationships and increased data exchange is a
positive, whether this is related fundamentally to three-dimensional imaging or not.
The second stage of the scenario presented an operational shift toward the actual
business of feedlotting. The focus groups were seemingly more able to think
innovatively about this proposed scenario, over the previous scenarios. The participants
seemed willing to explore the implications of such a system, both early in the value
chain (on which they are so dependent) and throughout the later stages: “There would
be an increased uptake in producer to feedlot, instead of feedlot to processor…” (FG1).
Interestingly, participants often drew on other types of similar innovations and showed
a willingness not to group the technologies together, but to critically analyse each on
their own merits: “There is a technology called via scan that has been in the system that
still needs a lot of work” (FG5). The focus group continued and, in effect, explained why
the technology might not be fully integrated into the abattoir business: “The processing
industry is very basic and not been updating infrastructure in Australia. The Abattoirs are

Page | 129
old, but processors would be more inclined to use three-dimensional if the rest of the
industry was using it… (FG2)”.
The scenario was deemed to greatly impact on the focus groups’ business infrastructure;
both feedlot groups elaborated on the proposal of a change to their systems. “Maybe
start in the mob based progression to a pen system and then to individual animals”
(FG1), said one in relation to the tracking of individual livestock. Another concern raised
was the practicality of tracking livestock individually: “The practicalities of feeding 20
000 cattle might mean day to day scanning is tough” (FG3). However, the same focus
group certainly did see the positives of individual tracking: “Yes selling some with
specific traits would be great. Yes you may have the ability to upgrade individual animals
to appropriate markets.”
The attitude to the third aspect of the scenario was found to generate a few differences
of opinion between focus groups and between participants. This final aspect played on
the communication theme and explained a disruptive mechanism for sale of finished
livestock. One focus group described the system thus: “It’s definitely a point of
difference for a feedlot to provide this type of system, being able to inspect the herd in
the feedlot before the transaction takes place would be positive” (FG1). Another focus
group praised the system, but questioned the pull of the system: “Yea and that’s just an
add-on of AuctionsPlus… It would be great for purchasing. Maybe not feedlot to plate, a
housewife doesn’t care about all this…” (FG4).
The participants who came from a feedlot background showed greater ability to accept
technology and critically assess three-dimensional imaging. Although practical concerns
were raised, they were not deterred by them and were still able to explain potential
benefits of the system. This segment was able to more easily grasp the concept, and to
think more innovatively than the remainder of the value chain.
8.4.3 Business Model Scenario
The final scenario that the focus groups were asked to comment on was the business
model scenario, being an Internet based social networking platform. On the whole,
participants showed a lack of readiness to adopt such a method of transaction; however,
many conceded that this was a logical step for the industry to move towards: “This sort
of approach in my opinion is the future of an ‘Elders’ or of a ‘Landmark’ to be honest.

Page | 130
They’ve got to be providing this sort of concept or they become less relevant” (FG3).
Although the idea of online auctions and agricultural social networking are not novel,
the format in which these two concepts had been linked in the scenario was. The
researcher deemed that the link between utilising tangible technology (hardware to
scan livestock into three-dimensional) and online interaction was plausible. Therefore,
an understanding of the cultural acceptance of the Internet was required.
Promisingly, the one younger aged participant showed a complete readiness to adopt
this system: “Yea sure, Facebook is a perfect example and living in the country catching
up is hard; so Facebook is a great way to keep up to date” (FG4). This participant
suggested, however, that because many of his friends were already using other social
networking sites, perhaps he would stick to those. The communication theme was once
more raised as a sceptical concern, with the perceived poor access to online services in
rural communities. Many participants suggested that they would rather talk to real
people than interact via an online platform. The ability to understand the scenario was
lost, however, when the topic of the Internet was raised. Even though the slide in the
scenario said “The website facilitated Johns business connection” and depicted the
character speaking on the phone, industry stakeholders appeared to hold on to
preconceived ideas of the Internet. It was more comfortable for the participants to
simply suggest that “younger era people might like this type of thing”. Stakeholders
consistently cited education as an important factor for this to work; however, the results
of the data analysis also point towards a lack of accountability in preparing themselves
for the future:
“Computers? I prepare myself as much as a have to, but in 5 years’ time, I won’t
be doing this job anymore. To me the systems in place are enough. Even though
I know the industry is going to this sort of thing.” (FG2)
“Education is the only way forward, so yes the new age farmers will use the
computer to learn yes. It’s about not being intimidated by all this.” (FG4)
The focus groups showed practical concern about the data input that any three-
dimensional image would need to have, and were particularly apprehensive should the
system be built around a DIY model. However, through the process of participatory
design, researchers and stakeholders were able to address the problem: “An assessment
truck, yea that’d be alright. It’s still subjective, but it’s consistently subjective.

Page | 131
Objectively subjective... I’d be happy with that” (FG3). The focus groups developed the
idea of an assessment truck, or similar device, that would automatically access stock
using a three dimensional innovation. The consideration that using the system would
mean that other producers could see what livestock you were running at any time was
raised. The development of active livestock (or publicly viewable livestock) available for
sale, versus private stock (only accessible to the owner) was addressed.
The online sales model was thought to be unsuitable. Even though the idea of online
auctions was an agreed channel of sale for the use of three-dimensional imaging, the
proposed use of tender transactions was responded to negatively: “If I was a producer
and I could cut out the middle man I would, but who’s the arbitrator if something goes
wrong?” (FG3). One focus group conceded on the idea that a tender is similar to a direct
sale, and that direct sales seemed to be flourishing at the moment. Thus, the
participants said: “There’s got to be a sale, maybe not a tender system. It should offer
different systems, different types of sales, direct, slaughter sale and a store stock tender
sale” (FG1).
Importantly, another focus group stressed that
“You have to provide a level playing field for both parties of the transaction.
Auctions seem to be more transparent and a producer needs to make a
commitment…But farmers would be out hassled by processors (in relation to
tenders). Processors do this stuff day in and day out. It would be a step
backwards in terms of how the system works now.” (FG2)
Across the entire value chain, all stakeholders agreed that the business model scenario
would be a good add-on to the current online sales systems. In comparing the two
(AuctionsPlus to three-dimensional), one focus group acknowledged the need for visuals
and data (subjective and objective) to be included in the scenario: “Yea but you need
data too. The one problem with AuctionsPlus is that if there’s two beasts with the same
EBV it would come down to a visual decision, this is where your system could better
AuctionsPlus” (FG2).

Page | 132
8.5 Results
Overall, the focus groups were very happy to trial new innovations and demonstrated a
culture of innovation. However, participants were not likely to want to invest money in
the trialling process. In regard to each of these new innovations, stakeholders
continually referred back to education as being an important tool or aspect of the
adoption process. Consistently, stakeholders mentioned that communication was a large
part of the three-dimensional system. This ranged from verbal communication to
technological feedback communication, and even social communication. However,
across the industry an engagement theme appeared throughout; or, rather, a lack of
engagement. Stakeholders were keen to trial innovation, but they wanted to see proof
before this could occur. Also, commercial engagement suggested that stakeholders were
ruthless in their approach to other competitors. A sense of ‘commercial evolution’,
where only the strongest businesses survived and where other businesses/peers were
not willing to share new knowledge, was identified.
Stemming from these general results, and in response to the research questions
outlined in Chapter One, four categories of socio-cultural inhibiters of innovation in the
livestock industry were identified. Through a thematic analysis approach (described in
Chapter Five), the socio-cultural inhibiters were found to be: Education, Culture of
Innovation, a Lack of Engagement and Communication. Within each separate theme,
certain sub-themes were also found to be important or to directly affect the main
theme. In Figures 8.1 to 8.4, where more minor sub-themes are also presented in the
grey circles and explained/justified in the following sections.

Page | 133
8.5.1 Education as a Socio-Cultural Inhibiter
Figure 8.1: Education as a socio-cultural inhibiter of livestock innovation adoption
Education appeared to be the largest determinant in the adoption of innovations.
Consistently, participants suggested that an appropriate education or a lack of education
was the downfall in the adoption of any innovation (or of the designed proposition or
adoption of the scenarios). Given this, stakeholders saw the potential of the proposed
innovation, and qualified their responses to suggest that an appropriate educational
platform would need to coincide with the system. Adding to this, the themes of
adoption and scepticism were found to be the biggest contributors to the education
theme, as presented in Figure 8.1.
The literature (Rolfe et al., 2003; Wilson & Stacey, 2004) suggests that the Internet may
be a potential foundation to the education of stakeholders in the agricultural industry.
The findings of this thesis, however, were that only a limited number of participants
expressed a positive attitude to using the Internet as a means of self-education.
Furthering this, all focus groups expressed the attitude of the remainder of the industry
that there was a lack of education of all stakeholders. Focus Group Two explained that
“…the majority don’t even understand EBVs so yes this (three-dimensional imaging)
would help that process” (FG6). To further add to the theme of education, Focus Group
Three cited a relationship between education and producers having a higher level of
quality of their livestock: “Less than 20 percent of producers are willing or currently try

Page | 134
to enhance stock quality either by being lazy or being traditional” (FG3). Therefore, from
Study Three it was found that the socio-cultural inhibitor of lack of education should be
addressed in order for stakeholders in the livestock industry to be more receptive to
adopting new technology/practice. Within the context of education, two minor social
themes were identified as influencing factors: scepticism toward innovation and the
concept of adoption.
Scepticism of innovation
Scepticism was drawn upon as a theme throughout the entire research process. The
term ‘scepticism’ indeed carries a negative connotation; however, the theme is not
completely negative in this instance. Stakeholders within the sampled group displayed a
generally positive reaction to the proposed innovation and its value implication.
Interestingly, there were varying reasons for positive reaction.
The feedlot sector liked the system as it could connect them to a wider array of
producers and have the ability to access a database of suitable livestock for their needs.
Producers and local agents from Study Three expressed positive views of the system
centred on the scenario’s ability to more efficiently value add to the current online
model of livestock auctions, by combining all positives from saleyards (i.e., visual self-
appraisal) and the benefits of Internet auctions. However, seedstock stakeholders
expressed negative attitudes toward the scenario, purely because it promoted
environmental analysis. It should be noted that seedstock stakeholders were
commenting from a stud stock perspective, and producers and local agents from a store
stock perspective.
An interesting trend identified in the focus groups was the fact that innovations
throughout the industry are initially resisted unless they directly add increased dollar
value to livestock at the transaction end of the scale. For example, producers and
stakeholders are more likely to display negative attitudes to innovations involving
efficiency gains, such as RFID tagging (NLIS). This is directly due to the fact that the
adoption of the technology does not directly correlate to increased profit margins.
Interestingly, however, the literature suggests that if RFID tagging is fully incorporated
into a business, the potential is there to increase profits (Trevarthen, 2007).
Nevertheless, the scepticism about technology is an industry wide cultural issue that

Page | 135
needs to be addressed. Conversely a theme of ‘trial versus trust’ of technology appeared
throughout the data.
Willingness to trial a new innovation was found to be consistent across most areas of
the value chain. This trial versus trust attitude is linked strongly to the socio-cultural
inhibitor theme of a culture of innovation. All stakeholders were receptive to innovation,
even though they initially held a sceptical view of it in the early stages of understanding
the scenarios. Once a ‘grounded’ understanding was established and there was a
perceived value in what a three-dimensional system could mean for a producer,
participants eagerly responded to the scenarios. This pattern was noted constantly for
the first two scenarios of the focus groups. However, in the third scenario, participants
typically displayed a cynical approach to the Internet. Throughout the focus group data
collection, the first two scenarios depicted the Internet as being in the background and
minor. On the whole, results were fairly positive towards these more tangible
innovations.
Strangely, after expressing positive attitudes to the first two scenarios, participants did
not positively respond to the use of an Internet service to build upon existing practices.
Perhaps the culture of the industry played a role in this finding also, in that until now, all
marketing (selling of livestock) was handled by an outside third party. Innovation
surrounding the use of the Internet and/or similar systems (for instance, NLIS tagging
and AuctionsPlus) correlated strongly with negative attitudes. The industry strangely
showed a willingness to trial and adopt tangible innovations but, conversely,
demonstrated a dissatisfaction with Internet based models of innovation. In comparison,
the third scenario depicted the Internet only and described the online service. Results
showed that stakeholders failed to attach the same levels of positive attitude towards it.
This was intriguing considering the positive expression given to the first two scenarios.
Therefore, it may be concluded that industry wide, the attractiveness of innovation is
very much determined by the incorporation of viral services, that is, the Internet. An
external example of this is the AuctionsPlus platform maintaining a 1-2% market share in
the industry, with little growth over the last decade.
This research found that numerous factors influence the overall success of an innovation
in the Australian livestock industry. The success of an innovation, therefore, can be
measured by certain predictor of scepticism as found in the analysis of the findings;
these predictors of scepticism were recorded as:

Page | 136
The stakeholders’ segment of the value chain
The stakeholders’ age
Previous experiences with other technology
Previous experience with the Internet
Ability to think beyond the traditional way of life
Ease of trial of the innovation.
The industry was found to be suspicious of new innovations by nature. This, however, is
understandable when fully considered. Stakeholders throughout the industry are
dependent on factors beyond their control (such as weather) and, therefore, show
caution toward all novel approaches. In the minds of the participants, it was better to be
cautious and to take time to consider technology, than to immediately adopt the
innovation and possibly lose out as a result.
Adoption of innovations
The category of ‘adoption’ was the last and hence the end point/final decision for a
stakeholder in deciding to adopt a three-dimensional innovation. Adoption of innovation
was reflected on by individual participants in both the initial study and focus groups
(Study Three). Adoption of the proposed three-dimensional innovation was found to be
affected by issues of culture, traditions, self-identity of the participant, technological
attitudes, the three-dimensional visuals and also sometimes a ‘fear’ of adoption. The
theme was heavily linked to the other socio-cultural inhibitors of ‘education’ and ‘lack of
engagement’. For instance, if positive experiences/associations were recorded within
the ‘relationship’ theme, stakeholders were found to be more likely to express positive
attitudes toward the adoption of the proposed innovation. Furthermore, the same
theory applies to attitudes toward standard ‘new technologies’. Thus, if technology is
perceived as of benefit, positive adoption behaviour may occur.
Interestingly, participants in the focus groups commented on industry stakeholders of
the livestock industry stating: “No the average farmer won’t use it ‘cause they’ve already
come to the end of their reign” (FG4). There was a particular feeling throughout the
sampled participants that many livestock stakeholders would find it hard to adopt a new
innovation such as three-dimensional imaging. However, differing reasons were
provided to qualify this position. Typically, reasons were that producers were ‘too old’ to

Page | 137
care about changing their systems or that there was a perception that having to use the
computer/Internet would simply deter others. This was heavily related to the tradition
of the industry and the culture of farmer. Therefore, the sub-theme of ‘adoption’ lead to
an association with the socio-cultural theme of ‘education’, where participants
concluded that embracing education throughout the industry would lead to a higher
level of innovation success.
8.5.2 Culture of Innovation as a Socio-Cultural Inhibiter
Figure 8.2: Culture of Innovation as a socio-cultural inhibiter
The theme of a ‘culture of innovation’ was found throughout the responses provided in
the focus groups and in Study One also. This theme was a perceived cultural trend
within the livestock industry, as identified by data analysis of participant responses. All
participants suggested that producers and other livestock businesses would definitely
trial most innovations to assess their appropriateness for a particular application. The
term ‘progressive producers’ was consistently used to describe this group of industry
stakeholders. This term exemplifies the ‘early adopter’ category posed by Rogers (1995).
Interestingly, it should be noted that the participants across all six focus groups
immediately expressed caution about, or almost close-minded attitudes to, innovation.
To clarify, these participants essentially would not consider the face value of a new
product or service before going through a process of consideration [This correlates with

Page | 138
arguments presented by Rolfe et al. (2003)]. It appeared that participants began with a
negative view of the proposed innovation but, throughout the process of the focus
group, were led ‘on the journey’ to a positive association with the innovation. This was
evident in the fact that many participants wanted to see ‘proof’ of the concept before
commenting. Focus Group three typified this response: “Yes in the early stages people
would query the ability of the site to be objective…” (FG1). Participants were
questioning the ability of the proposed business model scenario to provide an objective
measurement. However, the same focus group, in final remarks, concluded: “From my
point of view it’s a logical progression, you’re linking all these things together (social
networking, assessment, agents)…”
Therefore, it was seen that the Australian livestock industry displayed encouraging signs
that, overall, the industry was not afraid of innovation; in fact, many participants
mentioned the ability of people within the industry to show innovative qualities when
working to solve farmyard problems. However, it seemed as though participants would
question the practical nature of unfamiliar technologies. In simple terms, a farmer who
has not been able to view the design and development of an innovation cannot trust its
appropriateness. To combat this, the focus groups commented that: “If you’re trying to
get a sceptical person to embrace change, then you need to give them some comfort
and their eyes give them comfort…” (FG3) and “Images provide an objective assessment
– you know, It’s more evidence…” (FG2). While a culture of innovation was identified in
Study Three, both time savings and issues of practicality arose as concerns of the
livestock industry participants.
Desire for time savings
Participants showed the desire to implement increased efficiencies within the livestock
industry. The focus groups thought that the three-dimensional system had the potential
to save time in their business operations: “Yea course it is revolutionary, it would mean
a huge bonus for the industry because it means we can get rid of the non-efficient
animals at the right time. A lot of these cattle have been stuffed up even before they get
here, based on their environment/genetics” (FG3). The participant here thought he
would be able to increase his efficiency, or value-add to his business, by using the
technology to firstly select appropriate animals for his feedlot. Then, also knowing when
the animal might be individually ready for market was viewed to be a positive.

Page | 139
The perceived value of the time savings on offer by the proposed innovation was quite
high. All stakeholders interviewed from Study One and Study Three acknowledged this
to be important. From applying efficiency techniques/approaches to feedback of
information, automated assessment and more efficient handling, a path to
commercialisation might be forged. Importantly, all of these experiences were also
found to be influenced by a positive or negative feeling associated with the service: “It’s
about creating good experiences, not creating bad ones. If a person has a negative
experience early within the system they’re likely to stop using the system...” (FG1).
Hence, the crucial finding from this theme is that time saving efficiencies are pointless
unless they are coupled with a good experience.
Thus, if a time efficiency approach is taken to the commercialisation of three-
dimensional imaging, the system must incorporate either face-to-face relationships
(based on the generational issues raised in the focus groups), or guarantee a positive
experience. Promising a positive experience in the livestock industry is obviously hard
because so much of the industry is reliant on external factors (such as weather patterns,
market prices). Hence, it seems that commercialising the proposed innovation based
only on the premise of time savings would be challenging.
Desire for practicality
The industry displayed a critical approach to every proposal within the designed
scenarios. Interestingly this ‘desire for practicality’ sub-theme was consistently referred
to by participants in Study One also. There was a connection between the
innovation/system being practical to the agricultural lifestyle and the perceived benefit
of actually using the system. It was found that to be effective, the innovation must fit
into the stakeholder’s personal time schedule. A farmer does not want to be offered a
system that involves more time spent inside: that correlates to having to do more work
outside later to make up for ‘time lost’. This fits into the culture of innovation in that
participants thought that outside stakeholders would not display the ability to think
beyond the tangible practicalities of the proposed innovation to the latent value
potential that the system offered. Simply put, participants who could not understand
the practicalities of the proposed system could, therefore, not comprehend the
potential value added results.

Page | 140
As identified in Study One, participants explained the need for a technological
commitment to objective livestock analysis. However, Study Three found that the actual
term ‘objectivity’ is used differently by various segments of the livestock value chain.
Therefore, before utilising a technological system/innovation to meet practical concerns
of the industry, the clarification of this definition is required. Indeed, for some
participants, the ability to offer an automated subjective approach was acceptable,
being ‘objectively subjective’. Other stakeholders, however, thought the idea of even
considering the use of environmental factors in livestock analysis was ‘un-objective’; in
fact, going as far as to warn against the practice. Therefore while, at the start of the
thesis, three-dimensional imaging was considered to be an objective tool, some
segments of the industry did not view it as such. Furthermore, for some in the industry,
to provide an objective assessment means to perform the appraisal themselves: the
assessment becomes objective in their mind because they were able to determine the
assessment of a particular beast.
Therefore, the design of any innovation that aims to assess livestock will need to address
this socio-cultural consideration of ‘objectivity’. The Australian livestock industry indeed
displayed a tendency to be innovative; however, this thesis found that a particular
innovation is likely to be more successful if the design and development is transparent
and has included industry stakeholders, thus giving the innovation a sense of
trustworthiness.
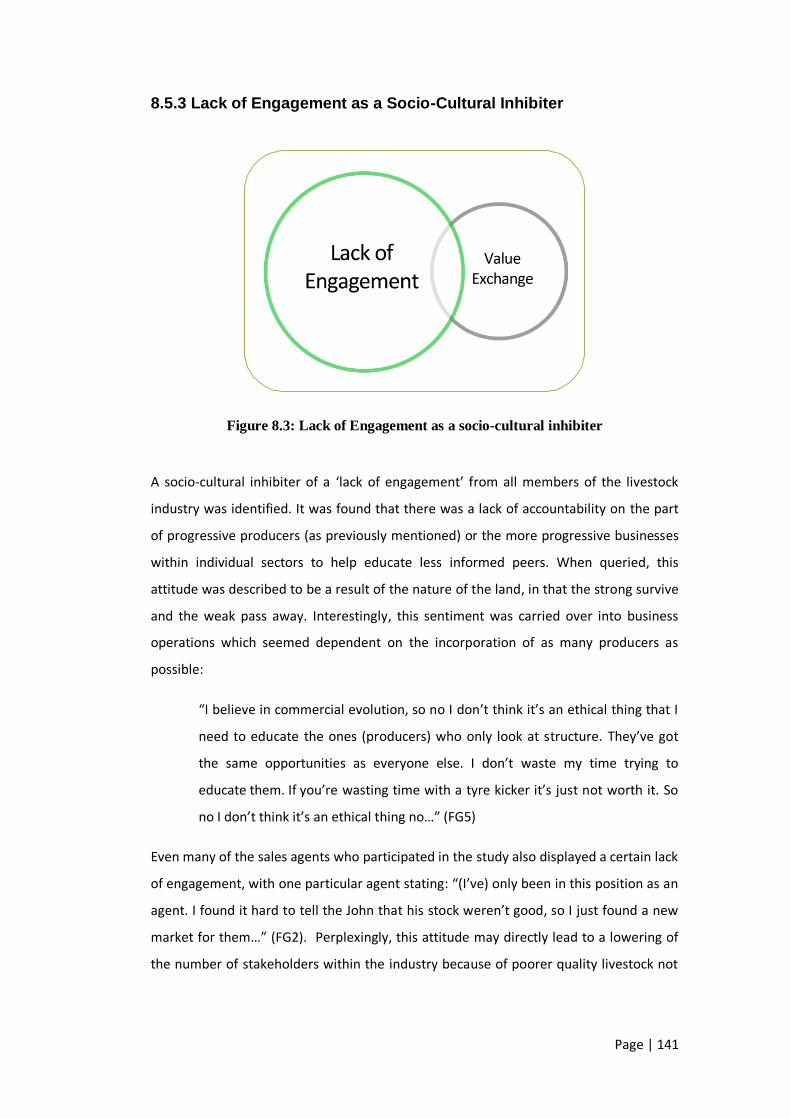
Page | 141
8.5.3 Lack of Engagement as a Socio-Cultural Inhibiter
Figure 8.3: Lack of Engagement as a socio-cultural inhibiter
A socio-cultural inhibiter of a ‘lack of engagement’ from all members of the livestock
industry was identified. It was found that there was a lack of accountability on the part
of progressive producers (as previously mentioned) or the more progressive businesses
within individual sectors to help educate less informed peers. When queried, this
attitude was described to be a result of the nature of the land, in that the strong survive
and the weak pass away. Interestingly, this sentiment was carried over into business
operations which seemed dependent on the incorporation of as many producers as
possible:
“I believe in commercial evolution, so no I don’t think it’s an ethical thing that I
need to educate the ones (producers) who only look at structure. They’ve got
the same opportunities as everyone else. I don’t waste my time trying to
educate them. If you’re wasting time with a tyre kicker it’s just not worth it. So
no I don’t think it’s an ethical thing no…” (FG5)
Even many of the sales agents who participated in the study also displayed a certain lack
of engagement, with one particular agent stating: “(I’ve) only been in this position as an
agent. I found it hard to tell the John that his stock weren’t good, so I just found a new
market for them…” (FG2). Perplexingly, this attitude may directly lead to a lowering of
the number of stakeholders within the industry because of poorer quality livestock not

Page | 142
being able to deliver a good return on investment; therefore, this could potentially and
eventually mean fewer clients for the agency to service.
Value Exchange
When an innovation is considered for potential adoption (for instance, three-
dimensional imaging) evaluation of the potential value gains is required. The focus group
scenarios posed various levels of added value gain through the use of the designed
solution. The first value gain was situated in the seedstock to producer relationship. This
aspect of the scenario was thought to be of value if the process was proven to be cost
effective. Stakeholders throughout the industry thought that offering the system in this
manner would be mutually beneficial to both parties. However, producers’ positive
reaction to this scenario was contradicted by the impractical attributes and negative
perceived value from the seedstockers’ perspective.
The second proposed value gain was the provision of a better system of finding quality
and suitable livestock for individual operations. This was the most favourably responded
to scenario, with all comments being positive in nature. However, the altering of
infrastructure was an important consideration for feedlots in the research. A
stakeholder would be less likely to adopt a commercial three-dimensional solution if its
implication dramatically affected the other systems in place. After all, industry
operations at the moment are generally profitable. Therefore, the commercialisation of
three-dimensional imaging must pose a very large value gain – more than an
incremental shift – to be worth the altering of process. Hence, the theme of value
exchange becomes more important, as a changing of a particular approach, should offer
these higher value added benefits.
Lastly, the third social aspect of the system – utilising social networking to connect
business and peers – was a value proposition. Results showed that providing a free
service (that is, social networking) in the industry is viewed not to be of value because of
time constraints, even though participants were aware of the abilities to connect and
view other producers’ livestock (which would be available for tender bidding). Results
may again be representative of the ideals/ideas surrounding the use of the Internet, as
previously reported.

Page | 143
Ultimately, this sub-theme identifies stakeholders within the industry as cautious to
adopt innovation without a proven value gains proposition above and beyond their
current operations. Therefore, unless innovations directly add increased dollar value to
livestock, they are unlikely to be successful. Efficiency innovations that, in themselves,
do not lead to increased end dollar value of livestock are also viewed in the same
manner, and need to establish themselves within the market on word of mouth
promotion.
8.5.4 Communication as a Socio-Cultural Inhibiter
The communication social inhibitor was identified through the responses to the use of
technology and services in the livestock industry. Participants continually suggested that
the industry was a people based one, where word of mouth was a very strong factor in
the adoption of innovation. Thus fostering ‘relationships’ in the industry was thought to
be a strong path to market. Figure 8.4 depicts this graphically.
Figure 8.4: Communication as a socio-cultural inhibiter
In this relationship consideration, the trustworthiness of an individual was deemed to be
very important, to the point where, if a bad experience had previously been recorded,
subsequent similar dealings would be avoided. While this in itself is an obvious reaction,
the emphasis upon building and fostering strong and trustworthy relationships was

Page | 144
found. Interestingly, participants in Study Three were more likely to only communicate
with other members of the industry outside a business transaction when a bad
experience had been previously encountered. The implication of this fact was that the
only time stakeholders communicated was to fix a problem. One participant mentioned
that he finds he gets more business from clients who have been the victims of mistakes
(and he tried his best to fix the problems), than from clients who have had only good
experiences.
Interestingly, the practical concerns of maintaining communication channels via a
technological approach appeared to hold negative associations. This was represented
via the social connections made available through the third business model scenario.
Participants found it hard to accept the possibility of using a platform (as suggested in
the narrative) to communicate in the industry. A participant from the third focus group
lamented that “You need to have a relationship with the people you’re buying from - It
becomes impersonal without that relationship… See, Tamarina use a lot of technology
but do it with that personal touch…” (FG3). Therefore, at least for this participant, it was
important for him to still utilise the latest technology and innovations in a business deal,
but more so to have it done in a meaningful mode – in this instance, a face to face
dealing. Hence, relationships throughout the value chain were seen as the key to
building a successful livestock operation.
Relationships
The communication inhibitor was most highly affected by the relationships premise.
From the focus groups it was identified that word-of-mouth was the most trusted source
of information in the industry: “Word of mouth through peers, mates and maybe agents
– 95% is word of mouth…” (FG2). However, the implication of the designed scenarios
moved the industry towards a more efficient and strategic livestock operation, based on
three-dimensional visual technology/Internet. The desire for producers and businesses
to become efficient was generated through the interview process in Study One;
however, as identified in Study Three, there was an unwillingness to lose face to face (or
at least telephone) relationships. The effect that relationships have on the
commercialisation of a three-dimensional technology is grounded in the traditional
nature of the livestock industry; being able to facilitate trustworthy communication
channels is still important.

Page | 145
The relationship sub-theme was also affected by the remoteness of the stakeholder.
However, the effect of the farmer/farming business (seedstocker, local agent,
feedlotter) relationship was even greater. As seen in the design scenarios, the service
provided with any innovation is crucial to the success of the system. Many focus groups
reiterated the earlier presented point that “You need to have a relationship with the
people you’re buying from - It becomes impersonal without that relationship…” (FG3).
Therefore, by fostering positive and personal relationships, a service can be deemed to
be more likely to be successful. This point may seem obvious; however, in a livestock
context, the importance of this aspect is greatly amplified. One participant mentioned
post focus groups that if he saw a particular AuctionsPlus assessor on an auction list,
based on previous ‘bad’ business relationships, he would not even bother to consider
purchasing the lot, no matter the quality of the mob.
The social networking capacity that was described in the business model scenario was
not very well responded to. In a couple of cases (usually younger stakeholders) positive
comments were recorded. More promisingly, the business networking aspect of the
scenario was generally liked. This part of the system promoted direct sales, established
on providing thoroughly detailed information in a three-dimensional essence.
Lastly, a lack of engagement was also found between farming businesses and the
producers. Livestock enterprises were not concerned about educating the un-
knowledgeable. Compounding the situation, a typical local agency business would
respond to this issue by stating they did not have the time to help educate stakeholders.
One focus group remarked: “Agents need to educate him; and the agents aren’t
educated and that’s the problem. Seedstock is not main-stream and once a person has
been educated in the 'old school' it’s hard to change that culture…” (FG1). Therefore,
addressing this relationship theme in the current cultural context is important, because
of this culture of lack of engagement within the industry.

Page | 146
8.6 Summary
Chapter Eight has presented four socio-cultural inhibitors to the social adoption of
innovations in the Australian livestock industry. Using a design led innovation strategy
implemented via a participatory design focus group methodology; it was found that
these social inhibitors acted as barriers to successful market entry of the proposed
innovation in the forms suggested in the design scenarios. Chapter Eight, therefore,
examined the industry’s social and cultural phenomena and generated the data analysis
into the four thematically identified areas. Given this chapter nine presents a discussion
on the implications of the findings presented in this chapter and how designers can use
these findings for future innovative efforts.

Page | 147
Chapter 9 Discussion and Overall Findings
of Research
9.1 Introduction
Literature published within the Australian livestock
industry describes the majority of stakeholders in
the sector as traditionally minded when it comes to
the adoption of innovations (Hassall, 2007; Rogers,
1995; Ville, 2005). Given this, the testing of the
designed scenarios documented in Chapters Five
and Six would appear to be a difficult task.
However, the results of the PD approach applied in Chapter Six contradicts this broad
assessment, supporting the findings of Frank (1997). This stage of data collection
involved the use of workshops populated with stakeholders from only one given section
of the value chain. As initially expected, stakeholders were intrigued by the proposal,
but attached negative judgments before understanding the proposed design solution.
The proposed design solution (scenarios) played on this traditional and negative
mindset. By using characters in the design narrative that demonstrated a scepticism to
all technology presented to them, the stakeholders were able to relate more easily to
the characters. As the proposal progressed and the design solution took shape, the
characters presented in the scenarios made positive connections to the technology. For
most of the stakeholders, this worked well as a means of extracting cultural issues
surrounding the adoption of innovations within each sector, as this pattern (of initial
negative attitudes moving to positive) mirrored the participant experience.
The participatory design method allowed researchers to engage with stakeholders in a
way that allowed both positive and negative opinions to be voiced. However, it was
important for the facilitator of the focus groups to create an appropriate ‘headspace’ for
the participants. This needed to be established very early on in the discussion as, if it did
not occur, the stakeholders were found to be quite unresponsive. Stakeholders were
encouraged to think ‘twenty’ years into the future; however, for some participants, the
constraints of contemporary technologies restricted and limited their ability to think
9.1 Introduction
9.2 Critique of Design
Research
Methodology
9.3 Outcomes of
Research
9.4 Summary

Page | 148
innovatively. Until the participants were able to let go of current technological
capabilities and not be ‘bogged’ in the detail, the value of the proposed design could not
be discussed. Some participants could not even begin to consider the end value
proposition, before understanding the process of how they would reach that point.
Of stakeholders who participated, the majority showed an immediate ability to think
about the future in terms of innovation and technology. As the group’s discussion
moved forward, the scenario worked to challenge the traditional value exchange within
the industry. This ‘provoking’ of the group was intended to create debate amongst the
group of stakeholders. This worked best with larger groups. Unfortunately, given the
rural constraints of the industry, some focus groups had only one or two participants,
and the same level of discussion was not recorded.
The impression from the data collected in the focus groups was that objectivity means
different things to various sectors of the value chain. In the seedstock sector, objectivity
or objective analysis is referred to in genetic terms; however in the producer and feedlot
sectors, it is deemed to be referred to in an environmental stance. Visual assessment
protocols (as used in the AuctionsPlus format) have been set in place to make the
process of the visual assessment objective in nature. However, many stakeholders will
only be satisfied with their own, personal assessment of cattle; to them, that is how an
assessment can be objective. Simply put, a producer would rather trust their own eyes
or appraisal from a close and trusted colleague.
This comparison is affected by the context in which each of these segments operates.
Producers and feedlotters purchase on environmental factors, whereas a seedstocker
would argue that environmental factors mean nothing for the purchase decision. An
agency focus group described the scenario in the environmental analysis potential:
“Comparing livestock in different environments would be great. It’s all about facts and
figures, you need detailed information; feed, environment, conditions, history and EBV.”
This participant thought that using the three-dimensional system could provide both
himself and his clients with the opportunity to value add to their purchasing ability.
The differential scenario, then, was accepted well by the middle and end sectors of the
value chain. Most stakeholders were able to critically think and describe issues
surrounding the scenario.

Page | 149
9.2 Critique of Design Research Methodology
The research methodology used throughout Studies One, Two and Three were grounded
in a design led innovation strategy. As found as a result of the literature review, the use
of design strategies has previously not been explored in the Australian livestock
industry; therefore, this thesis aimed to fill this gap. The design led innovation strategy
was used as a driver for the methodologies implemented throughout the three studies
of this thesis. Within this research methodology, the DLI approach also used
participatory design, design thinking and human centred design. Each of these methods
was applied in different contexts, as the methods were more appropriate to individual
and specific design tasks. Table 9.1 describes each research method and its associated
research action within each of the three studies.
Table 9.1 Design research study methodologies
Study Method Application
1 HCD Semi-structured
interviews
2 HCD/PD Co-design /
Observations
3 PD Focus Groups
The research method used in Study One was, overall, beneficial to the scope of the
thesis. Using a human centred design approach in the early stage of the research
allowed the researcher/designer to assess the industry, based on participants views
expressed in one on one interviews. Through this process of considering varying latent
needs and business opportunities from a livestock market perspective, the main
direction of the proposed technological innovation was able to be addressed. Hence, the
HCD method in this thesis brought about strong design outcomes, which were used to
further the research aims of the following studies.
A mixed methodology was used in Study Two, due to the two phase aspect of the
investigation. In the first section of Study Two (2a), again, a HCD method was used. The
process of using week long observations to allow the researchers the chance to immerse

Page | 150
themselves in the culture of the industry was vital. This was important so that the
researchers could obtain a fast understanding of the industry and, therefore,
appropriately develop the proposed design scenarios. In the second phase of Study Two
(2b), the learnings of the observation and Study One were applied in the designing of
three designed future scenarios, which used the proposed innovation. This was achieved
using a participatory design method. In the co-design of the scenarios, the PD method
created equality between expert participant and designer/researchers. In order for the
co-design to be successful, it was important that the one background did not override
the other; in that way, the PD approach worked very well.
The last study also used a participatory design methodology; in this instance, however, it
was applied in a focus group format. Where the PD approach differed from traditional
focus groups was that it allowed a ‘level playing field’ for the participants of the study. In
regular focus groups, researchers present quite detailed and finished solutions, whereas
participants generally provide opinions. The PD approach, by contrast, facilitated a
deeper engagement of the participants and allowed them to be involved much earlier in
the design of an innovation. That the integration of participants so early on in a design
investigation has been possible is unique within the Australian livestock industry (as
identified in the recent literature cited in Chapter Two).
9.2.1 Limitations
As with all studies and experiments, there were certain limitations present in the
research. The main limitation of Study Three was the sample size of the stakeholders.
This particular study was carried out between June and August, 2010. Researchers
unfortunately found it difficult to find appropriate scheduling for many stakeholders;
thus, their participation was precluded. As with much qualitative research, the
consideration of the total number of research participants can be problematic. There
exists a trade-off between speed and ease of subsequent analysis of collected data and
the richness of data found. Krueger (1995) suggests continuing with focus groups until a
clear pattern emerges and subsequent groups produce only repetitious information
(theoretical saturation). However, several authors – including Krueger (1995) – suggest
that, for a simple research question, the number of focus groups necessary may only be
three or four [For a full discussion of this issue, see Burrows & Kendall (1997)].

Page | 151
It is important to remember that the aim of qualitative research is illumination,
impression and understanding, not the statistics or casual predictions offered by
quantitative research. As Liamputting and Ezzy (2005) argue, in qualitative research,
data saturation is much more important than the actual sample size:
“Many people become concerned about how many cases constitutes a large
enough sample for qualitative research. The answer to the question is simple;
when the researcher is satisfied that the data are rich enough and cover enough
of the dimensions they are interested in, then the sample is large enough.”
(2005 p. 49).
Therefore, given the richness of the data gathered from all three studies, it was
determined that the study had an effective and manageable number of contributing
participants.
9.3 Outcomes of research
9.3.1 Discussion of Socio-Cultural Inhibiters
The research questions of this thesis were designed to determine answers to the
hypothesis of the research. Firstly, as literature has previously found, innovations in the
Australian livestock industry have previously shown very slow adoption rates. Therefore,
this thesis sought to investigate the social barriers within the industry to determine why
these slow adoption rates occur.
Furthering this approach, the second aspect of the research questions asked whether a
design led innovation strategy could be used to engage stakeholders in the industry. By
implementing a design strategy in the early design phases of the proposed innovation,
four socio-cultural inhibitors to innovation adoption – education, a culture of innovation,
a lack of engagement and communication – were identified, and found to restrict the
eventual adoption decisions made by industry stakeholders.
However, these themes do not immediately begin to add value to a designer’s ability to
innovate in the industry. Therefore, three categories of design implications have been
extrapolated from these socio-cultural inhibiters and identified as important to the
designing of future innovations in the livestock industry. These are labelled as: change of

Page | 152
attitudes, the practical nature of the innovation, and actual attributes of the technology.
These three factors are presented and discussed in the following section.
9.3.2 Overall Findings from Socio-Cultural Inhibitors
By utilising a design-centred approach to exploring barriers to market for livestock
technology adoption, this research has highlighted that the Australian livestock industry
is open to tangible innovations and closed to efficiency (Internet) innovations. To date,
as the literature has not explicitly explored social adoption patterns in the livestock
industry (nor in the context of radical innovations), this thesis’ findings emphasise the
value of stakeholders being able to participate in the early design phases of innovation.
Subsequently, this may lead to higher levels of overall trust being shown by the
remaining members of the industry, leading to higher innovation adoption levels. Table
9.2 shows the three extrapolated design implications and offers important learning to
designers looking to innovate in the Australian livestock industry in the future.

Page | 153
Table 9.2 Barriers to adoption: Attitudes, practicality and technological
factors
Barriers to adoption
Attitudes
1. Efficiency innovations are not as likely to be
adopted as tangible ones. Stakeholders were
more likely to attach positive attitudes to a
proven/trial-able innovation. There was an
acknowledgement of a need to become more
efficient, but an unwillingness to lose face to face
relationships.
2. Education of stakeholders was deemed to be the
quickest path to marketing new innovations
within the industry. Technologists cannot simply
place a product on the market; there needs to be
an education package coinciding with purchase.
3. The theoretical benefits of social networking
(without mentioning the Internet) and its
business/personal implications were viewed
positively by stakeholders. However, stakeholders
displayed negative attitudes to the actual process
of using the Internet.
4. Objectivity is something that is a misconception in
the industry. It has a confused meaning across
stakeholders.
Practicality
1. Best identified placement of three-dimensional
imaging was found to be within the feedlot
sector. Feedlots portrayed the practical ability to
adopt a three-dimensional innovation.
2. Lack of engagement was an issue. Farming
enterprises were not concerned with educating

Page | 154
Table 9.2 presents three barriers to the adoption of radical innovations in the Australian
livestock industry. These barriers cover livestock social constructs, practical conerns of
stakeholers within their contemporary workplace setting, and current technological
attitudes held by these stakeholders.
Attitudes
The Attitudes category summarises the results of the study which fall under ‘stakeholder
opinions’ and ‘mind-set’. Generally, attitudes to innovation were positive as shown by
the ‘culture of innovation’; and the response to the proposed innovation was seen to
reflect this.
un-knowledgeable or ‘traditional’ farmers.
3. Fewer stakeholders in the industry will lead to
fewer clients; hence, ensuring that support is
given to these ‘traditional’ farmers is important.
4. Scalability of proposed innovation was
questioned.
Technological
Factors
1. Three-dimensional imaging was of little or no
value to participating seedstock and processor
stakeholders, but of moderate to high value for
participating producers, sales agents and feedlot
stakeholders.
2. Trial vs. trust of technology. Participants in the
industry appeared to initially hold closed views on
the three-dimensional system. Hence, participants
were not likely to adopt innovations immediately,
even if the system had been proven previously.
3. Innovations are resisted unless they directly add
increased $ value to livestock rather than to
efficiency innovations.

Page | 155
The strong theme of ‘education’ throughout the industry was most notably present
across all segments of the value chain. Stakeholders presented a line of reasoning that,
to assist any individual to adopt a new product/system, there is a need to educate the
adopter first. This is an interesting finding compared to other consumer markets where
the responsibility is upon the consumer to educate themselves about the product prior
to purchase. This is not to say that there are not opportunities for ‘consumers’
(producers, etc.) to educate themselves within the industry. In fact, some participants of
the research represented Meat and Livestock Australia (MLA), whose responsibility it is
to provide this type of information to the industry. These industry experts provide a
large amount of educational information which is at the producer’s disposal. However,
the themes generated from the research suggested that, on the whole, there was a lack
of traction for producers to show active engagement in this service.
Therefore, stakeholder participants expressed thoughts that adoption of a three-
dimensional imaging solution would require face to face education periods. Another
aspect noted by participants was that an educational phase may promote and facilitate
trust in the system. Social networking has achieved a fast rise in popularity in urban
settings (Boyd & Ellison, 2008), and the creation of a rural social networking site is not a
novel concept. However, only two stakeholders in this study showed knowledge of these
webpage’s (notably, these stakeholders admitted it was only because it was their job to
know).
Therefore, the scenarios were able to introduce the concept of social networking to
stakeholders. Initially, the perceived benefits were thought to be positive. Then, as the
character within the scenario explored the capacity of the system, which involved using
the Internet, attitudes noticeably turned negative. Participants suggested that they did
not have the time to use the Internet to be rewarded with the benefits that they were
previously shown.
The literature (Assink, 2006; Christensen, 1997) suggests that social networking, in this
case, may alter the participants’ self- image. This may be true; however, the nature of
disruptive technology is that users are categorised as not knowing what their market
needs are or will be in the future. Adding to this, the negative connotations of the
Internet may be accredited to the nature of its use. For instance, access to the web is
made in private settings (an office). Obviously, this is not publicly viewable to the
outside world as Rogers (1995 p.11) suggests is included by the stakeholder in the

Page | 156
process of considering to adopt a new products. Therefore, the attitude to social
networking may be a result of the attitude to the Internet and its inability to allow
stakeholders to compare their own experiences to those of their contemporaries.
Objectivity in the industry was an interesting finding. Throughout the industry, the word
was found to mean varying things. Therefore, the industry’s buzz words ‘objective
analysis’ was found to be a confusing phenomenon. It was found that there were two
different methods of analysing livestock in the industry: genetic or environmental (or
EBVs as opposed to visual assessment). Furthermore, some stakeholders thought that
an objective assessment was one that was performed by either a trusted party or simply
by themselves. Understandably, some stakeholders viewed three-dimensional imaging
as subjective and others considered it as being objective.
The last attitude finding relates to that of efficiency innovations, namely, the approach
of using technology as a means of heightened communication channels. This research
identified the industry stakeholders’ attitudes, in that efficiency innovations were not as
likely to be adopted as tangible or observable ones. This therefore contradicted the
culture of innovation displayed by the participants. It appeared that whilst they did in
theory approve of ‘innovation’, they did not want to lose face to face relationships in the
industry. Furthermore these tangible innovations are less likely to alter self-identity
issues surrounding the adoption of innovations (Frank, 1997). This can be attributed to
traditional, cultural and technological factors. However, there was an acknowledgement
of a need to become more efficient as a whole in the industry.
Practicality
The ‘practicality’ category outlines the findings that represent the realistic and non-
realistic concerns surrounding the proposed innovation, and is strongly linked to the
culture of Innovation inhibiter theme. Firstly, a high level of scepticism about the
inhibitor of education had practical implications for attitudes to the scenarios. In most
cases, participants were, however, able to overcome these education concerns through
learning more about the scenario.
The nature of the proposed innovation was that it could easily detail environmental
factors in livestock. Therefore, it seems feedlots would be able to use the technology to
its greatest practical capacity as much of their operations depend heavily on

Page | 157
environmental factors of weight gain, etc. Further to this, feedlots have more to lose on
poorly performing stock and need to continually source animals regularly. To further add
to this finding, the feedlotting segment of the industry seems to be progressing in terms
of growth. This segment will remain strong and, hence, establishing service
dependencies with stakeholders in this segment seems a good idea.
Many of the benefits of three dimensional imaging surrounded the continual
improvement of livestock quality over time, being integrated with other external
technologies (EBVs). However, the lack of engagement shown by many participants in
the industry was perplexing with consideration to the contemporary state of the
industry. Many stakeholders explained throughout the research that there was a need
to move away from traditional methods. One such example was the movement toward
objective analysis of livestock over traditional subjective means. Whether the solution to
this problem is found via a three-dimensional innovation or not, the industry will need
to be willing to change and address these cultural issues before diffusion can occur.
Lastly, the scalability of the proposed three-dimensional innovation was queried: Could
it hold up to the conditions of the rural environment and the sheer numbers of livestock
that producers and other stakeholders run? Scalability in novel innovations is always
subject to testing and prototyping of the system. The potential scalability of the Internet
platform proposed is not questioned; however, the hardware that would coincide with
the system is. Fundamentally, however, as in many systems, if one aspect fails, so too
will the remainder.
Technological factors
In general, participating stakeholders expressed positive attitudes surrounding the area
of adoption of innovations. This was consistent throughout Study 1 and continued into
the focus groups also. However, tangible innovations were found to more attractive to
the industry and, therefore, are more successful when compared to intangible
innovations. Also, any innovation needs to add an end increased sale price to individual
beasts to be more attractive for adoption in the Australian livestock industry. Therefore,
in extrapolating on this notion, it may be seen that marketing a novel three-dimensional
system on ‘efficiency and costs savings’ might not register the sought after emotional
response that will prompt product adoption by a stakeholder.
Page | 158
These findings support the research Katz and Boland (2000). Livestock stakeholders will
consider five factors when choosing to adopt any innovation: (1) Relative advantage, (2)
Compatibility, (3) Complexity, (4) Triability and (5) Observability. The relative
disadvantage then in the proposed design solution is that, yes, when the innovations are
‘publicly viewable’ (as the first two scenarios were) attitudes were positive; however,
when the innovation was not publicly viewable (as in using the Internet, or Internet
based innovation), attitudes were likely to be negative. Therefore, the socio-cultural
inhibitor of relationships becomes important to the successful adoption of ‘un-viewable’
innovations (Internet based systems). Hence, for the commercialisation of a novel
product in the Australian livestock industry it is important to present a publicly viewable,
tangible and perceivably sturdy product. Adding to this, an innovation should directly
increase the sale price of livestock because this is how stakeholders judge the success of
a new process.
The general position of participants within the research was to immediately perceive
new technological innovations in a cautious manner. There was a strong culture of
trialling a product/system before passing final judgement on the innovation, thus
relating to a culture of innovation. This trial versus trust phenomenon that stakeholders
displayed is promising for any further design developments in the industry; the
willingness to trial a new product can be built upon and exploited by establishing a
strong and ‘trustable’ brand.
Lastly, it was found that the proposed three-dimensional scenarios did not meet the
technological needs of some segments of the value chain, but did meet the needs of
others. Three-dimensional imaging was found to be of little or no value to seedstock and
processors, compared to value being moderate to high for producers, sales agents and
feedlots. Limitations of the study were, however, that the sample size was small,
because of the nature of exploratory qualitative research (Liamputtong & Ezzy, 2005).
Only two seedstock stakeholders were able to participate in the focus group stage of the
research. Interestingly, their opinions of the system contradicted those of the seedstock
participants from Study One, whose opinions about visual three-dimensional assessment
were positive. Therefore, further study into the acceptance of the system within this
sector is recommended.
Positive value exchange was found to exist in the relationships between producer, sales
agents and feedlots. Participants from Study Three expressed positive attitudes to the
Page | 159
business relations that three-dimensional imaging could afford. The social networking
capabilities of using the Internet was fundamentally supported by all participants from
large business backgrounds; however, utilisation by the individual producers was
deemed to be (more than likely) low. Feedlots, however, enjoyed the ability to access a
national database of three-dimensional livestock and to search for new and more
suitable clients to purchase stock from. Therefore, innovations were more likely to be
individually assessed by industry stakeholders on a case by case basis; this correlates
with Frank’s (1997) findings: in some instances, a particular stakeholder would be likely
to adopt one innovation immediately, but in considering another, would wait and see
how other people handle the innovation.
9.4 Summary
Chapter nine presented a general discussion and provided overall findings of this thesis.
The chapter expanded upon the socio-cultural inhibitor themes found in the analysis of
Study Three. Drawing upon the four socio-cultural inhibitors, three barriers to social
adoption in the Australian livestock industry were found to be: attitude, practical
concerns and technological factors. Chapter Nine also importantly critiqued and
evaluated the design led innovation strategy and Participatory Design methodologies
used throughout the workshops of Study Three. Engaging the participants in future
scenarios was found to work well in aiding them to think broadly and innovatively about
their industry. For many stakeholders who participated in the study, it was the first time
they had ever been in such a research environment, and they very willing to be included
in expressing their views on the proposed innovation.

Page | 160
Chapter 10 Recommendations and Conclusions
10.1 Introduction
Chapter Ten presents recommendations and
offers conclusions to the findings recorded
in Chapters Five to Nine. This thesis used a
design led theoretical approach to uncover
the social implications of implementing
disruptive innovations within the Australian livestock industry, using a proposed three
dimensional imaging innovation to facilitate the work. Firstly, the notion of using a
design investigation to uncover social trends and then to combine these learnings within
a business model approach within the livestock industry is a novel approach. The
findings that this thesis presented were brought about through the DLI theory, and
driven by design thinking. The three studies of this thesis subsequently utilised both
participatory design and human centred design methodologies. This process worked
well to both initially design the proposed scenarios (using DLI and DT) and then to
extract rich data from stakeholders (using PD and HCD). It also allowed these
stakeholders to actively create and shape the resulting design outcome which can be
applied in future work. Brown (2008) summarises the ability to understand the social
trends of a particular sub-culture (in this case, the livestock industry).
“Many of the world’s most successful brands create breakthrough ideas that are
inspired by a deep understanding of consumers’ lives and use the principles of
design to innovate and build value. Sometimes innovation has to account for
vast differences in cultural and socioeconomic conditions. In such cases design
thinking can suggest creative alternatives to the assumptions made in developed
societies... The inclusion of a design thinking approach from the board room
level is essential for strategic business development.” (Brown, 2008 p. 6)
This thesis concerned itself with the innovating of radical or disruptive technologies
within a traditionally minded industry. Three certain cultural barriers to successful
implementation of radical technology were identified and presented in Chapter Seven.
10.1 Introduction
10.2 Recommendations
& Implications of
Findings
10.3 Final Words

Page | 161
These barriers to technological uptake were found to be Attitudinal, Practical and
Technological. These three barriers are defined and expanded upon below.
10.2 Recommendations/Implications for the Australian
Livestock Industry
Innovating novel concepts in traditional marketplaces can appear to be a challenging
process. Using the theory of disruptive innovation (Christensen, 1997), it is argued in this
thesis that by using a design led innovation methodology, a latent need can be found
within the livestock industry. The design of radical innovations has been tested using a
participatory design approach, which worked well to engage stakeholders effectively
and to extract meaningful data. This extraction of data formulated the three barriers to
technological innovation previously explained in this chapter. The recommendations and
implications arising from these three barriers to end adoption of innovations are
summarised below:
1. Design led innovation strategies should be further explored in the Livestock
industry context. As proven in this thesis, the DLI strategies can be used to
evaluate new innovations and/or developments of this technology quickly
and effectively. Traditionally it is difficult to gather the people/ stakeholders
to talk about issues surrounding the design of novel systems, but the
methods used through this thesis worked well to engage stakeholders early
on in the design project in meaningful ways which they had not been a part
of before.
2. Three-dimensional imaging in the current form as described in this thesis
should be further applied in a pilot study with a feedlot(s). Feedlots were
found to need an objective environmental measure; the proposed
technological solution is projected to be able to provide this. Some
commercial enterprises are currently performing this service (IAP) (that is,
at the time of writing this thesis) hence validating this pilot study.
3. The creation of education pathways investing in the teaching of
stakeholders is necessary if future technological innovations (internet
based) are to be successful in the Livestock industry. Whether this is
performed by Landmark or through government agencies, it is in the greater

Page | 162
industries best interest to see education levels increase in respect to
technology know-how; as this will potentially influence the adoption of new
processes/innovations by stakeholders.
4. The culture of using the Internet to facilitate business operations is
something that needs to change in order for three-dimensional imaging to
be adopted. Developing a positive stakeholder attitude to the Internet and
other ‘virtual’ platforms is integral to the overall success of the innovation.
5. For the majority of the industry, three-dimensional visuals appear to be too
futuristic for mass product innovation. Therefore, work towards introducing
this analysis medium should be undertaken in order to foster positive
stakeholder attitudes. This investment in social resources may be crucial to
the extension of the technology in the long term.
These five recommendations are drawn from the identification of the four socio-cultural
inhibitors of innovation adoption that this thesis presented. The recommendations link
to the proposed innovation and work to shape the next steps of this thesis: the industry
partner’s continued plans for the technology.
10.3 Final Words
10.3.1 Theoretical Implications
Using the theoretical theories outlined in this thesis, some conclusions can be offered
surrounding the innovating of technologies in the livestock industry. Firstly, the design
thinking approach is a tool that should be used further in the industry. Utilising a
different approach to strategic business decisions, design led innovation has the
potential to impact not only on design direction, but also on system inclusion, in-store
retailing strategies, and on branding and marketing campaigns.
The use of participatory design based research was tested within the livestock industry
throughout this thesis. The method fully engaged stakeholders across the entire value
chain, and intermediaries throughout. Both quickly and efficiently, researchers were
able to help stakeholders think innovatively and to access the commercial viability of the
proposed three-dimensional innovation. Using these design frameworks, designers can

Page | 163
effectively engage with opinion leaders and co-design radical innovations in the future,
so that the system is grounded and fully adoptable by the wider industry stakeholder
community.
10.3.2 Future Research
As for any initial, exploratory work, new ideas that need further research development
are often found and identified. Future design research generated from this thesis could
be in the area of future prototyping of the proposed radical innovation used in this
thesis. A complete evaluation of this prototype would also complement the work.
Secondary future research covering other gaps in knowledge could be also investigated.
These specifically involve: firstly, how the Internet may be used more effectively in
agricultural business operations; secondly, other socially accepted models of livestock
transaction/business operation; and, lastly, investigating whether technology could play
a role in education within the industry.
Throughout the process of assessing industry literature and collating given responses
from participants, other technologies have been identified as potentially marketable
innovations within the industry. The seedstock segment identified the use of personal
ultrasound equipment. This technology is still growing in the industry and investment
into providing novel designs around it seems credible. Research could be invested in
technologies that provide the capability of automated construction of moving images
(that is, standardised video capture), thus allowing stakeholders the ability to compare
different stock simultaneously. Lastly, any tangible and integrated product that
complements BREEDPLAN is likely to be a successful incremental product to explore.
10.3.3 Potential of Design Led Innovation in the Agricultural Industry
Design led innovation strategies, such as design thinking and design driven innovation,
are tools that are unfamiliar to the business world (Brown, 2008; Bucolo & Matthews,
2010). However, the inclusion of a design thinking approach from the boardroom level is
essential for strategic business development and to ensure the needs of all stakeholders
can be considered more thoroughly. The results of this thesis indicate that design led
innovation can intimately bridge the gap between the boardroom and business

Page | 164
stakeholders on the ground. Designers have the ability to understand both strategic
business direction and to evaluate the end users’ product needs; therefore, more
practical, relevant and effective innovations can be more easily created.
The process of using participatory design facilitated this deep engagement in the
Australian livestock chain and included both ends of the business supply chain (the
boardroom and the ground). This engagement demonstrated the potential for design
thinking and the theory of design driven innovation to build strategic products and
solutions that cater for the concerns of both business and end users.

Page | 165
References
ABC. (2006). Cattle producers urged to audit livestock records. ABC Premium News. (2005). Livestock agents won't support planned NLIS. ABC Regional News. (2006a). DPI pleased with livestock ID scheme acceptance. ABC Regional News. (2006b). Saleyards feels cost of NLIS. ABC Rural News. (2006). NLIS working at major saleyards. ABC Rural News. (2007). Fed Govt says livestock system has improved despite
complaints. ABS. (2008). Labour Force Australia Australian Bureau of Statistics. Canberra. ABS. (2010). Australian Farming in Brief Retrieved 09/09/2010). from
http://www.abs.gov.au/Ausstats/[email protected]/mf/7106.0/ Ajzen, I. (1991). The theory of planned behavior. Organizational Behavior and Human
Decision Processes, 50, 179-211. Allee, V. (2008). Value network analysis and value conversion of tangible and intangible
assests Journal of Intellectual Capital, 9(1), 5-24. Anderson, A. (1982). Processes and Implications of Knowledge Transmission in Australian
Agricultural Extension (Unpublished Report). Department of Communication, School of Management, Hawkesbury Agricultural College. Australia.
Assink, M. (2006). Inhibitors of disruptive innovation capability: a conceptual model. European Journal of Innovation Management, 9(2), 215-233.
Australian Bureau of Statistics. (2008). Use of the Internet on Farms, Australia, 2007-08. Canberra
Australian Livestock & Property Agents Association Limited. (2010), from www.alpa.net.au/
Bailey, & Britt. (2000). Electronic identification and tracking of cattle in Victoria, Australia. Performance recording of animals: state of the art, 2000. Proceedings of the 32nd Biennial Session of ICAR, Bled, Slovenia. Retrieved from http://www.cababstractsplus.org/abstracts/Abstract.aspx?AcNo=20023108756
Bailey, Peterson, & Brorsen. (1991). A comparison of video cattle auction and regional market prices. American Argicultural Economics Association, 465-475.
Bergen, R., Miller, S. P., Mandell, I. B., & Robertson, W. M. (2004). Use of live ultrasound, weight and linear measurements to predict carcass composition of young beef bulls. Canadian Journal of Animal Science, 85 (1), p23-35, 13p.
Boland, M. (2009). What is Value-added Agriculture? Agricultural marketing resource centre, from http://www.agmrc.org/business_development/getting_prepared/valueadded_agriculture/articles/index.cfm
Boyd, D. M., & Ellison, N. B. (2008). Social Network Sites: Definition, History, and Scholarship. Journal of Computer-Mediated Communication, 13(1), 210-230. doi: 10.1111/j.1083-6101.2007.00393.x
Brethour, J. (1999). Measurement of intramuscular fat in cattle. Kansas State University Research Foundation.
Brown, T. (2008). Design Thinking. Harvard Business Review, June. Bucolo, S., & Matthews, J. (2010). Using a design led distruptive innovation approach to
developing new services: Practicing innovation in times of discontinuity. Paper presented at the proceedings of CI-Net. 2010.
Bucolo, S., & Matthews, J. (2011). Design Led Innovation - Exploring the Sythesis of Needs, Technologies and Business Models. Paper presented at the Participatory Innovation Conference, Sonderborg, Denmark.

Page | 166
Burke, J., Nuthall, P., & McKinnon, A. (2004). An analysis of the feasibility of using image processing to estimate the live weight of sheep Farm and Horticultural Management Group
Burrows, D., & Kendall, S. (1997). Focus groups: What are they and how can they be used in nursing and health care research? Social Sciences in Health, 3,
244-253. Byrne, A. (2009). Are your animals structurally sound? Animal husbandry, 1-2. Carroll, J. M. (1996). Encountering Others: Reciprocal Openings in Participatory Design
and User-Centered Design. [Article]. Human-Computer Interaction, 11(3), 285-290.
Carroll, J. M. (2000). Five reasons for scenario-based design. Interacting with Computers, 13, 43-60.
Christensen. (1997). The innovators dilemma. New York: HarperCollins Publishers Inc. Christensen, & Rosenbloom. (1995). Explaining the attacker's advantage: technological
paradigms, organizational dynamics, and the value network. Research Policy, 24, 233-257.
Clandinin, J., & Connelly, M. (2004). Narrative inquiry : experience and story in qualitative research. San Francisco, Califorina: Jossey-Bass Publishers.
Clarke, R., & Jenkins, M. (1993). The strategic intent of on-line trading systems. Journal of Strategic Information Systems, 2(1), 57-76.
Cooper, R. G. (2006). Winning at New Products: Pathways to Profitable Innovation. Courtney, P. (Writer) & Landline (Director). (2009). Hard sell: ABC. Cox, G. (2005 ). The Cox Review of Creativity in Business: Building on the UK's Strategy.
SME’s in manufacturing., London. Cumpston, B., Ananthavel, S., Barlow, S., Dyer, D., Ehrlich, J., Erskine, L. L., et al. (1999).
Two-photon polymerization initiators for threedimensional optical data storage and microfabrication. Letters to Nature, 398, 51-54.
Danneels, E. (2004). Disruptive technology reconsidered: A critique and research agenda. Journal of Product Innovation Management, 21, 246–258.
Davis, F. (1989). Perceived usefulness, percieved ease of use and user acceptance of information technology. MIS Quarterly (September)(319-340).
Davis, F. (1993). User acceptance of information technology: System characteristics, user perceptions and behavioural impacts. International Journal Man-Machine Studies, 38, 475-482.
Driedonks, C., Gregor, S., Wassenaar, A., & VanHeck, E. (2005). Economic and social analysis of the adoption of B2B electronic marketplaces: A case study in the Australian beef industry. International Journal of Electronic Commerce 9(3), 49-72.
Ehn, P. (1988). Work oriented design of computer artifacts. . Stockholm, Arbetslivscentrum.
Erickson, G. S., & Kelly, E. P. (2007). International aspects of radio frequency identification tags: Different approaches to bridging the technology/privacy divide. [Article]. Knowledge, Technology & Policy, 20(2), 107-114. doi: 10.1007/s12130-007-9011-y
Fielding, K., Terry, D., Masser, B., & Hogg, M. (2008). Integrating social identity theory and the theory of planned behaviour to explain decisions to egage in sustainable agricultural practices. British Journal of Social Psychology, 47, 23-48.
Fishbein, M., & Ajzen, I. (1975). Belief, attitude, intention and behaviour: An introduction to theory and research. Reading, MA: Addison Wesley.

Page | 167
Frank, B. (1995). Constraints limiting innovation adoption in the north Queensland beef industry. I: A socio-economic means of maintaining a balanced lifestyle. Agricultural Svstems, 47, 291-321.
Frank, B. (1997). Adoption of innovations in the north queensland beef industry. III: implications for extension management. Agricultural Systems, 55(3), 347-358.
Gengatharen, D. (2006). Assessing the success and evaluating the benefits of government sponsored regional internet trading platforms for small and midium enterprises: A Western Australian perspective. Doctor of Philosophy, Edith Cowan University, Perth.
Gregor, S., & Jones, K. (1999). Beef producers online: diffusion theory applied. Information Technology & People, 12(1), 71-85.
Grieger, M. (2003). Electronic marketplaces: A literature review and a call for supply chain management research. European Journal of Operational Research, 144, 280–294.
Guerin, T. F. (2000). Overcoming the Constraints to the Adoption of Sustainable Land Management Practices in Australia. Technological Forecasting and Social Change, 65(2), 205-237. doi: Doi: 10.1016/s0040-1625(99)00090-6
Hassall. (2007). A Review and Analysis of Saleyard Marketing in Australia. Dubbo: Hassall, & Associates Pty Ltd.
Herefords Australia Limited. (2009). Understanding the EBVs, selection Indices and accuracy - Hereford breedplan, from http://abri.une.edu.au/online/pages/understanding_ebvs_aphs.htm
Katz, J., & Boland, M. (2000). A new value-added strategy for the US beef industry: the case of US Premium Beef Ltd. Supply Chain Management: An International Journal, 5(2), 99-110.
Krueger, R. A. (1995). Focus Groups: A Practical Guide for Applied Research. Thousand Oaks, CA: Sage Publications, 2.
Liamputtong, & Ezzy (Eds.). (2005). Qualitative research methods (2nd ed ) New York.: Oxford University Press, South Melbourne, Vic.
Linton, J. D. (2009). De-babelizing the language of innovation. Technovation, 29(11), 729-737.
Lynch, T., Gregor, S., & Midmore, D. (2000). Intelligent support systems in agriculture: How can we do better? Australian Journal of Experimental Agriculture, 40, 609–620.
Madigan, A. (2010, 26/08). Stock agents are 'all things to men', Stock&Land. Markides, C. (2006). Disruptive innovation: In need of better theory. Journal of Product
Innovation Management, 23, 19-25. Mateas, & Sengers. (1999). ADD THIS FROM EXTERNAL HARD DRIVE. Mathieson, K. (1991). Predicting User Intentions: Comparing the Technology Acceptance
Model with the Theory of Planned Behavior. Information Systems Research, 2(3 September), 173-191.
McIntyre, R. (2009). Livestock library: a dream come true. Emerald Insight, 27(5), 869-877.
Meat and Livestock Australia. (2009). Fast Facts 2009. Meat and Livestock Australia. (2010). National Livestock Identification System. National
Livestock Identification System Retrieved 11/03/2010, 2010, from http://www.mla.com.au/TopicHierarchy/IndustryPrograms/NationalLivestockIdentificationSystem/default.htm
Naiman, L. (2010). Creativity at Work. What is Creativity? Retrieved 02/12/2010, from http://www.creativityatwork.com/articlesContent/whatis.htm
Page | 168
National Farmers Federation. (2010). Farm Facts Retrieved 15/11/2010, from http://www.nff.org.au/farm-facts.html
Parcell, J., Brees, M., & Giddens, N. (2009). Adding Value. Agricultural marketing resource centre from http://www.agmrc.org/business_development/getting_prepared/valueadded_agriculture/articles/adding_value.cfm
Pease, W., & Rowe, M. (2005). Diffusion of innovation - The adoption of electronic commerce by small and medium enterprises (SMEs): A comparative analysis. Australasian Journal of Information Systems, 13(1), 287-294.
Perry, D., McKiernan, W. A., & Yeates, A. P. (1993). Muscle score: its usefulness in describing the potential yield of saleable meat from live steers and their carcasses. Australian Journal o f Experimental Agriculture, 33(275-81).
Polanyi. (1998). Personal knowledge: Towards a post-critical philosophy. London, Routledge.
Rabiee, F. (2004). Focus-group interview and data analysis. Proceedings of the nutrition society, 63, 655-660.
Ribeiro, P. C. C., Scavarda, A. J., & Batalha, M. O. (2010). RFID in the international cattle supply chain: context, consumer privacy and legislation. International Journal of Services and Operations Management, 6(2), 149-164.
Rice, P., & Ezzy, D. (Eds.). (1999). Qualitative research methods: A health focus. Melbourne: Oxford University Press.
Rogers, E. (1995). Diffusion of Innovations (4th ed.). New York: Free Press. Rolfe, J., Gregor, S., & Menzies, D. (2003). Reasons why farmers in Australia adopt the
Internet. Electronic Commerce Research and Applications, 2(1), 27-41. doi: Doi: 10.1016/s1567-4223(03)00004-8
Sainio, L.-M., & Puumalainen, K. (2007). Evaluating technology disruptiveness in a strategic corporate context: A case study. Technological Forecasting and Social Change, 74(8), 1315-1333. doi: DOI: 10.1016/j.techfore.2006.12.004
Sasha, A. B., Michael, K. T., Tyler, D., Kurt, S., & Markeda, N. (2004). Critical Design Ethnography: Designing for Change. Anthropology and Education Quarterly, 35(2), 254.
Sinjaa, J., Karugiab, J., Baltenwecka, I., Waithakac, M., Mianoc, M. D., Nyikalb, R., et al. (2004). Farmer perception of technology and its impact on technology uptake: The case of fodder legume in central kenya highlands. International Livestock Research Institute.
Sunding, D., & Zilberman, D. (2000). The agricultural innovation process: Research and technology adoption in a changing agricultural sector. Handbook of Agricultural Economics.
Superior Livestock Auction Inc. (2008). Superior Livestock Auction, from http://www.superiorlivestock.com/
Tonts, M., Yarwood, R., & Jones, R. O. Y. (2010). Global geographies of innovation diffusion: the case of the Australian cattle industry. Geographical Journal, 176(1), 90-104. doi: 10.1111/j.1475-4959.2009.00331.x
Trevarthen, A. (2007). The national livestock identification system: the importance of traceability in E-business. J. Theor. Appl. Electron. Commer. Res., 2(1), 49-62.
Veil, S. (2010). Adoption Barriers in a High-Risk Agricultural Environment. International Journal of Technology and Human Interaction, 6(1), 69.
Verganti. (2008). Design, Meanings, and Radical Innovation: A Metamodel and a Research Agenda. J PROD INNOV MANAG, 25, 436–456.

Page | 169
Ville, S. (2005). Social Capital Formation in Australian Rural Communities: The Role of the Stock and Station Agent. [Article]. Journal of Interdisciplinary History, 36(2), 185-208. doi: 10.1162/0022195054741460
Wark, T., Corke, P., Sikka, P., Klingbeil, L., Ying, G., Crossman, C., et al. (2007). Transforming agriculture through pervasive wireless sensor networks. Pervasive Computing, IEEE, 6(2), 50-57.
Weir, T. (1999). Innovators or news hounds? A study of early adopters of the electronic newspaper. Newspaper Research Journal, 20(4), 62–81.
Wheelwright, S., & Clark, K. (1992). Revolutionizing Product Development Quantum Leaps in Speed, Efficiency
and Quality. The Free Press, New York. Wignall, D., & Jones, P. (2009). Australian agribusiness and the future positioning of
AuctionsPlus: Strategic plan & systems review. In M. P. Ltd (Ed.). Melbourne: AuctionPlus.

Page | 170
Appendices
List of Appendices:
Appendix 1 – Participant information sheet
Appendix 2 – Observations

Page | 171
Appendix 1 – Participant Information Sheet
PARTICIPANT INFORMATION for QUT RESEARCH PROJECT
“Commercialisation of three-dimensional imaging in the Australian Livestock
Industry”
Research Team Contacts
Carl Behrendorff – Lead Researcher Sam Bucolo – Research Supervisor
0431 479 890 (07) 3138 2239
[email protected] [email protected]
Description
This project is being undertaken as part of a Masters project for Carl Behrendorff. The
project is funded by Landmark. The funding body will not have access to identifiable
data obtained during the project. The purpose of this project is to commercialise a new
three-dimensional imaging solution in the Australian livestock market. The research
team requests your assistance because you have been nominated as an important part
of the livestock value chain.
Participation
Your participation in this project is voluntary. If you do agree to participate, you can
withdraw from participation at any time during the project without comment or penalty.
Your decision to participate will in no way impact upon your current or future
relationship with any members of Landmark. All material will be made anonymous to
Landmark. Once material has been submitted to the study it will not be possible to
withdraw participation data from the study.

Page | 172
Your participation will involve an interview (semi-structured) and analysis of a brief
scenario, specific to the livestock industry.
The interview will cover the aspects of (1) how your supply chain operates, (2) the
invested capital of which you have set up and operate your business efforts through, (3)
the communications with your suppliers and how you currently go about this process,
(4) implementing technology for enhancing cattle analysis and (5) the thoughts you have
on the growth and possibly future of your industry.
The length of time for participation should not exceed an hour.
Expected benefits
It is expected that this project may benefit you either directly or in-directly. This is
because of the nature of the livestock value network and how it traditionally operates.
The potential for the study is quite likely to influence/impact the entire value chain
either directly or in-directly in a positive manner. However, it may benefit other areas of
the value chain in the livestock industry as well; specifically in the health and wellbeing
of the livestock themselves. Also the harsh conditions that animals experience through
transport may be reduced because of this research.
The study may influence the manner in which livestock are currently bought and sold
and so all members of the value chain stand to be influenced.
Risks
There are no risks beyond normal day-to-day living associated with your participation in
this project. However if you do feel distress from the research you may wish to access
independent counselling services:
QUT provides for limited free counselling for research participants of QUT projects, who
may experience discomfort or distress as a result of their participation in the research.

Page | 173
Should you wish to access this service please contact the Clinic Receptionist of the QUT
Psychology Clinic on 3138 0999. Please indicate to the receptionist that you are a
research participant.
Confidentiality
All comments and responses are anonymous and will be treated confidentially. The
names of individual persons are not required in any of the responses.
Consent to Participate
We would like to ask you to sign a written consent form (enclosed) to confirm your
agreement to participate.
Questions / further information about the project
Please contact the researcher team members named above to have any questions
answered or if you require further information about the project.
Concerns / complaints regarding the conduct of the project
QUT is committed to researcher integrity and the ethical conduct of research projects.
However, if you do have any concerns or complaints about the ethical conduct of the
project you may contact the QUT Research Ethics Officer on +61 7 3138 5123 or
[email protected]. The Research Ethics Officer is not connected with the research
project and can facilitate a resolution to your concern in an impartial manner.

Page | 174
CONSENT FORM for QUT RESEARCH PROJECT
Research Team Contacts
Carl Behrendorff – Lead Researcher Sam Bucolo – Research Supervisor
0431 479 890 (07) 3138 2239
[email protected] [email protected]
“Commercialisation of three-dimensional imaging in the Australian Livestock Industry”
Statement of consent
By signing below, you are indicating that you:
- have read and understood the information document regarding this project
- have had any questions answered to your satisfaction
- understand that if you have any additional questions you can contact the
research team
- understand that you are free to withdraw at any time, without comment or
penalty
- understand that you can contact the Research Ethics Officer on +61 7 3138 5123
or [email protected] if you have concerns about the ethical conduct of the
project
- agree to participate in the project
- understand that the project will include audio and/or video recording
Name
Signature

Page | 175
Date / /
By signing below, you are indicating that the project has been discussed with you and
you agree to participate in the project.
Name
Signature
Date / /
Media Release Promotions
From time to time, we may like to promote our research to the general public through,
for example, newspaper articles. Would you be willing to be contacted by QUT Media
and Communications for possible inclusion in such stories? By ticking this box, it only
means you are choosing to be contacted – you can still decide at the time not to be
involved in any promotions.
Yes, you may contact me about inclusion in promotions
No, I do not wish to be contacted about inclusion in promotions

Page | 176
WITHDRAWAL OF CONSENT FORM FOR QUT RESEARCH PROJECT
“Commercialisation of three-dimensional imaging in the Australian Livestock Industry”
Research Team Contacts
Carl Behrendorff – Lead Researcher Sam Bucolo – Research Supervisor
0431 479 890 (07) 3138 2239
[email protected] [email protected]
I hereby wish to WITHDRAW my consent to participate in the research project named
above.
I understand that this withdrawal WILL NOT jeopardise my relationship with Queensland
University of Technology or Landmark.
Name
Signature
Date / /

Page | 177
Appendix 2 – Observations
First day – Drafting cattle in Roma
Observation – Roma Saleyards
Participants 6 members of the Roma Landmark livestock team (3 full time, 3
casual)
Context The participants were drafting (or sorting) cattle at the saleyard
the day before the auction was to be held. This involved the
workers starting just after lunch and working until all cattle were
penned. The typical finishing time is after 10pm. The staff are
required to then get back to the saleyard from 5.30am the next
morning, ready for the sale.
Understandings
developed
(Barriers to entry)
The workers communication was verbally based. Sometimes it
was hard for the workers to hear each other over the sounds of
the cattle because of the nature of the environment. To help the
work, visual aids such as pointing and motioning to ‘speak up’
were used. There was however a strong understanding of ‘what
to do next’, shown by each of the employees, where through
experience they knew when to move cattle in and out of pens.
Cattle were drafted into 8 smaller sized pens (8mx8m) based on
a visual characteristic appraisal. This was only performed by the
local livestock manager. The process of judging was very fast and
subjectively based. The other workers did not question the word
of this assessor due to the experience that the manager had. He
had been working with livestock for many years and was able to
visually perform his job well.
The drafting process seemed to be labour intensive and
tiresome; upon talking with the workers it was discovered that
this was the fastest manual approach they knew of to draft
cattle. However each saleyard has differing infrastructure to
perform the same process of drafting the cattle. This was said to
be due with the age of the saleyard/s and the local preference to
the job.
The impact of the gruelling work hours might mean that some

Page | 178
animals are drafted into the wrong pen, which causes problems
later in the auction. If a buyer does not particularly like the look
of 1 animal they have the right not to purchase it – meaning that
a separate auction is then held for the 1 remaining animal and
it's quite time consuming.
A barrier to entry would be the set infrastructure that would
need to be removed in order to adopt a new three-dimensional
innovation.
The traditional agent being used in the saleyard is a
social/cultural happening of the industry. Only agents can sell
through the saleyard operations and so to have adoption occur,
agents must fundamentally need the technology and push for its
inclusion in the saleyard. The saleyard operators would also
need convincing, but if the innovation meant fewer margins for
error, both from a drafting perspective and a health and safety
approach, it is thought the operators would prefer the
innovation.
Implications for
scenario/s
Proposing an automated drafting system would be of value. It
would be better in terms of health and safety, wage reduction
etc.
Using three-dimensional may potentially speed this process up.
Appendix Figure 1.1: Agents working to ‘draft’ cattle manually in saleyard pens
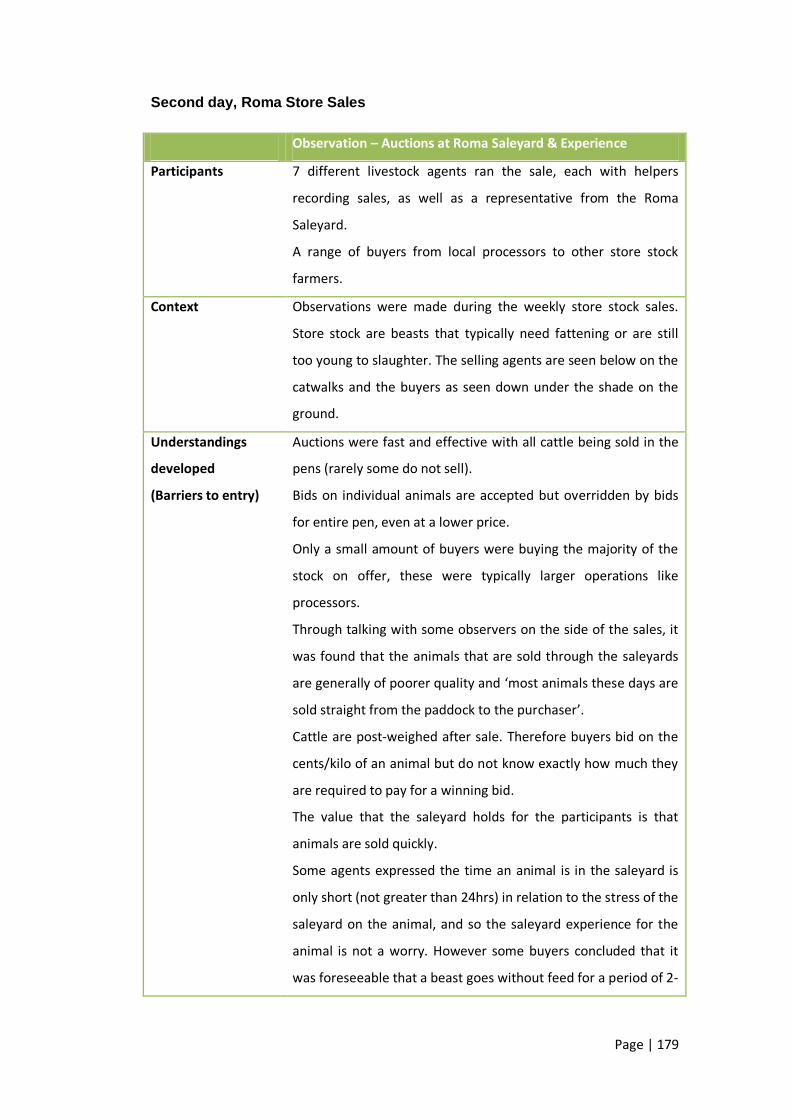
Page | 179
Second day, Roma Store Sales
Observation – Auctions at Roma Saleyard & Experience
Participants 7 different livestock agents ran the sale, each with helpers
recording sales, as well as a representative from the Roma
Saleyard.
A range of buyers from local processors to other store stock
farmers.
Context Observations were made during the weekly store stock sales.
Store stock are beasts that typically need fattening or are still
too young to slaughter. The selling agents are seen below on the
catwalks and the buyers as seen down under the shade on the
ground.
Understandings
developed
(Barriers to entry)
Auctions were fast and effective with all cattle being sold in the
pens (rarely some do not sell).
Bids on individual animals are accepted but overridden by bids
for entire pen, even at a lower price.
Only a small amount of buyers were buying the majority of the
stock on offer, these were typically larger operations like
processors.
Through talking with some observers on the side of the sales, it
was found that the animals that are sold through the saleyards
are generally of poorer quality and ‘most animals these days are
sold straight from the paddock to the purchaser’.
Cattle are post-weighed after sale. Therefore buyers bid on the
cents/kilo of an animal but do not know exactly how much they
are required to pay for a winning bid.
The value that the saleyard holds for the participants is that
animals are sold quickly.
Some agents expressed the time an animal is in the saleyard is
only short (not greater than 24hrs) in relation to the stress of the
saleyard on the animal, and so the saleyard experience for the
animal is not a worry. However some buyers concluded that it
was foreseeable that a beast goes without feed for a period of 2-

Page | 180
3 days, meaning they can lose weight and be exposed to
unnecessary stress levels.
Cultural way of doing things (most people at the sale were
middle aged 40+ years old).
The time in which the sale takes place does not allow for three-
dimensional to be specifically used here, although automated
three-dimensional drafting might be of value.
All buyers kept a hand written account of their beasts bought.
They typically record the pen number and the total of animals
bought at the selling price.
Implications for
scenario/s
The use of three-dimensional is only foreseeable in drafting of
animals in saleyards.
Buyers are more likely to trust their eyes, rather than look at a
screen and spend the time figuring out how much they should
bid on a particular animal. Incorporating three-dimensional
would slow the auction down.
Appendix Figure 1.2: Agents during a cry-out auction & worker painting sold
beasts, workers weighing sold animals

Page | 181
Third Day - Dalby Sales
Observation – Dalby Saleyard Experience
Participants Several different livestock agents ran the sale, each with helpers
recording sales, as well as a representative from the Dalby
Saleyard monitoring the sales.
Context Observations were made during the weekly prime stock sales.
The prime sale is typically for beasts ready for slaughter. The
selling agents are seen below on the catwalks and the buyers as
seen down under the shade on the ground. Buyers are able to
walk on a separate and lower catwalk to bid in the auctions. This
was typically the “only good thing going for this particular
saleyard”.
Understandings
developed (Barriers
to entry)
No new understanding formed - Very similar to previous
saleyard experiences.
Set infrastructure is a barrier to entry. The saleyard
infrastructure is however quite old in the Dalby yard, still being
made of wood in some places. Half of the pens are also
aluminium but the auctions took place in the older section.
The saleyard still exists here through the social/cultural way of
doing things (the age of most people at the sale was similar to
the Roma sales, being mostly middle aged).
The time in which the sale takes place does not allow for three-
dimensional to be specifically used here, although automated
three-dimensional drafting might be of value.
Implications for
scenario/s
Refer to Roma auction observation.
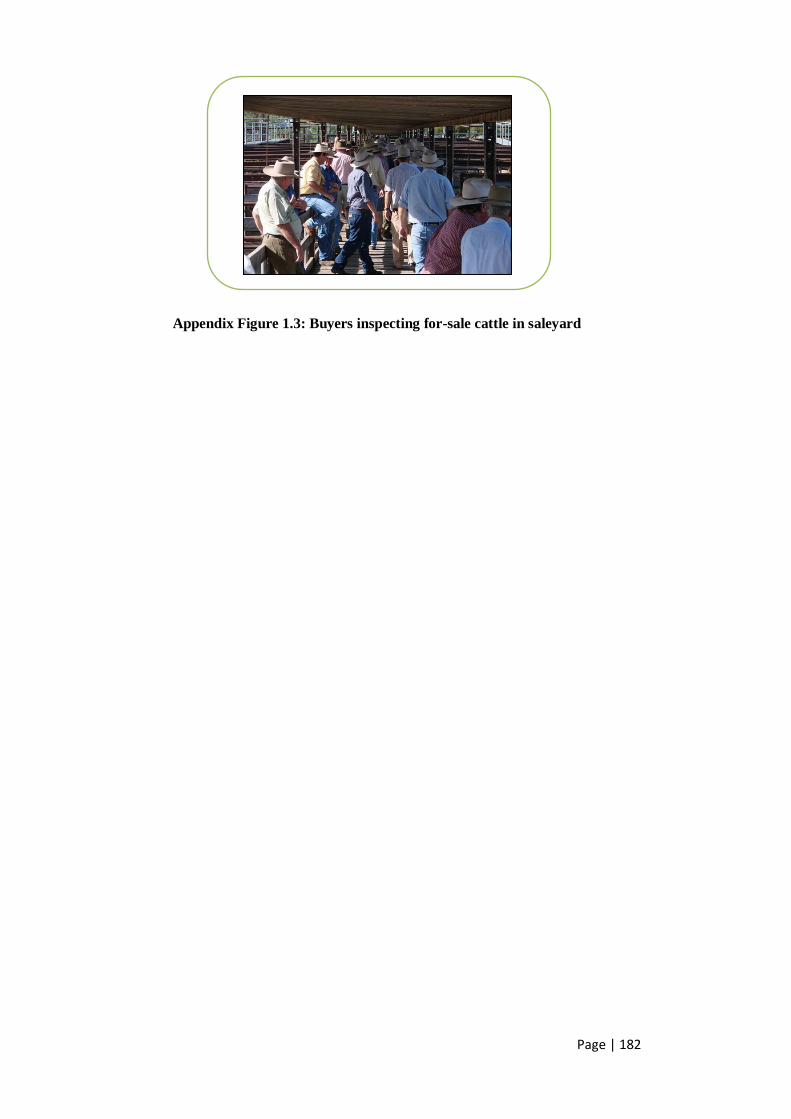
Page | 182
Appendix Figure 1.3: Buyers inspecting for-sale cattle in saleyard

Page | 183
Fourth Day - Feedlot inspection
Observation – Feedlot Inspection
Experiment Observing the set up of the feedlot and how it operates:
- How animals are fed
- Monitoring of animal growth
- Efficiency of the operation
- Room for implementation of three-dimensional technology
Participants Researcher and Landmark Feedlot expert
Context The inspection was at the Sandalwood feedlot, Dalby. The
observations were made from the car as the feedlot expert
drove around and through the property, checking his own
animals that were currently in the feedlots system.
This was a good way for the researcher to understand the
workings of the feedlot as commentary could be given as the
inspection was done.
Understandings
developed
(Barriers to entry)
Animals are left in pen for the entirety of their stay in the
feedlot; the feedlot is keen not to handle the cattle too often,
both for reducing stress levels in the stock, but also because it
costs less to not continuingly moving stock about.
There is a trend that if a beast is handled, it will tend not to eat
as well as it should for a few days after. Therefore the less
handling of the beast the more weight it can be slaughtered for.
The operation is very efficient; feed is measured exactly and
daily recorded.
Animals are ‘inducted’ and analysed in order to be compared to
the progress after slaughter. This induction includes
inoculations, health checks, detention recording, NLIS tag
inspection, a three-dimensional scan and other relevant tests.
The individual animal is weighed only once in the period it is at
the feedlot, during the induction.
Individually monitoring animals may be hard due to the
infrastructure set up of the feedlot. The average feed
consumption of the herd is what is currently measured. From

Page | 184
the average feed consumption, nutritionists can work out the
amount of weight an animal should be gaining day in and day
out.
If a beast is regularly weighed and handled there is potential to
decrease the potential for the animal to put on weight.
Implications for
scenario/s
The three-dimensional feedlot scenario is proven to be of value
as this feedlot has already employed the use of a three-
dimensional analysis tool – however not known exactly how
effectively
There is still a plausible concept surrounding the on-selling of
the fattened cattle via the three-dimensional tender website. It
means that the feedlot can add a 3rd metric into the
comparisons that the business already does (three-dimensional
scan at start to kill sheet data). This time can be around 100+
days to gather.

Page | 185
Fifth Day - Feedlot tour
Observation – Feedlot Tour
Experiment Observing the set up of the feedlot and how it operates
- How animals are fed
- Monitoring
- Efficiency of the operation
- Room for implementation of three-dimensional technology
-The use of three-dimensional imaging and how it already is of
value in this particular feedlot’s operation
Participants Researcher, Landmark Feedlot expert, Sandalwood Manager
Context The first hour was spent talking with the manager of the feedlot.
The manager was asked to explain his operation and what value
he saw it having within the greater industry.
The rest of the morning was devoted to physically taking the
researcher through the process that an animal would take on
arrival to the feedlot.
The visuals below detail the automatic drafting system that was
set up at the feedlot. It is clear to see that the user inputs the
variables that system will draft the beasts on and; then each
beast walks single file into a crush and is drafted automatically.
Understandings
developed
(Barriers to entry)
The use of a three-dimensional drafting tool is used to sort good
from poor animals so they are not ever allowed into the feedlot
Purchasing through saleyards is avoided and buying directly
from paddock is the preferred method because of the greater
control that the feedlot can exert over the sale and the quality
purchased.
Handling cattle is avoided and care is taken not to place too
much stress on any animal
If the three-dimensional analysis tool could be made portable
the feedlot would find it of more value to their operation. At the
moment cattle need to be brought to the equipment and then
decisions are made whether to accept or reject them.
Individually tracking each animal is not seen to value add the

Page | 186
operation because the information would “need to be averaged
out anyway”. The feedlot currently tracks the average feed
intake of the pen of beasts but does not measure the growth of
the beasts. Comparisons are made from induction assessment
(before the beast is fed) to the slaughter information (on the kill
sheet, that is provided by the processing company)
There is no continual relationship built with a processor,
meaning that the feedlot is not locked into any contracts for a
set price.
The feedlot does take principle position on a percentage of the
animals brought to the property, but also includes a certain
percentage dedicated to the production of a clients stock.
Implications for
scenario/s
The three-dimensional feedlot scenario is proven to be of value
in that this feedlot has already employed the use of a three-
dimensional analysis tool – however not known exactly how
effectively
Possibly propose a portable solution that goes out to the
property/saleyard
Appendix Figure 1.4: Feedlot Livestock inspection equipment

Page | 187
Innovation
Glossary
Livestock The term ‘livestock’ in this thesis refers only to sheep and
cattle. Hence, where this term is used, the context
contains these two groups of animals only. When explicitly
talking of ‘sheep’ (or ‘lamb’) or ‘cattle’ (or ‘beef’) these
singular, specific terms will be used.
Objective analysis ‘Objective analysis’ refers to the assessment of livestock in
the industry. Within this definition, being ‘objective’ refers
to the use of measureable data to assess the livestock
rather than purely visual appraisal.
Three-dimensional This thesis refers to the phrase ‘the proposed
technological innovation’. The phrase refers to the
scanning of livestock to produce a three-dimensional
image.
Sales agents Sales agents are stakeholders within the livestock industry.
They act as mediators and aid producers in marketing
livestock through any channel at their disposal.
Marketing of The term ‘marketing’ literally means to sell or find a
livestock market for livestock through a selling channel.
Disruptive Disruptive innovation refers to technologies that have
been introduced to a market which ultimately leads to the
eventual breaking down of an incumbent market based on
an older prior technology. These ‘innovations’ are
commonly termed ‘game changing’ breakthrough
technologies.
Imaging