social network analysis - analytics, business intelligence ... · “canada is a wonderful safe...
TRANSCRIPT

Copyright © 2006, SAS Institute Inc. All rights reserved. Company confidential for internal use only for internal use only
Social Network Analysis TDMF – May 5 th , 2010
Dan McKenzie – Fraud Solutions Specialist

Copyright © 2006, SAS Institute Inc. All rights reserved. Company confidential for internal use only
Matt Malczewski
Facebook?
for internal use only
Matt Malczewski

What is “Social Network Analysis” Definition: The practice of linking individuals and measuring the strength of their relationships.
Copyright © 2006, SAS Institute Inc. All rights reserved. Company confidential for internal use only
“Social Network Analysis” ?
The practice of linking individuals and measuring the strength of
for internal use only
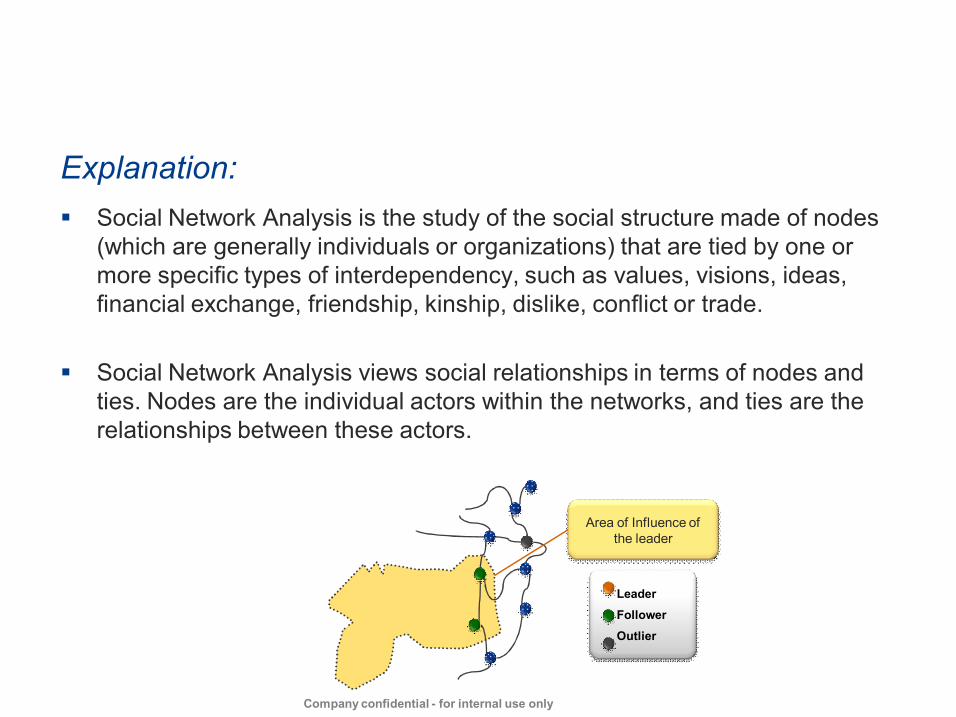
Explanation: § Social Network Analysis is the study of the social structure made of nodes
(which are generally individuals or organizations) that are tied by one or more specific types of interdependency, such as values, visions, ideas, financial exchange, friendship, kinship, dislike, conflict or trade.
What is "Social Network Analysis”
Copyright © 2006, SAS Institute Inc. All rights reserved. Company confidential for internal use only
Explanation: § Social Network Analysis is the study of the social structure made of nodes
(which are generally individuals or organizations) that are tied by one or more specific types of interdependency, such as values, visions, ideas, financial exchange, friendship, kinship, dislike, conflict or trade.
§ Social Network Analysis views social relationships in terms of nodes and ties. Nodes are the individual actors within the networks, and ties are the relationships between these actors.
Social Network Analysis is the study of the social structure made of nodes (which are generally individuals or organizations) that are tied by one or more specific types of interdependency, such as values, visions, ideas, financial exchange, friendship, kinship, dislike, conflict or trade.
"Social Network Analysis” ?
Company confidential for internal use only
Explanation: § Social Network Analysis is the study of the social structure made of nodes
(which are generally individuals or organizations) that are tied by one or more specific types of interdependency, such as values, visions, ideas, financial exchange, friendship, kinship, dislike, conflict or trade.
§ Social Network Analysis views social relationships in terms of nodes and ties. Nodes are the individual actors within the networks, and ties are the relationships between these actors.
Area of Influence of the leader
Leader
Follower
Outlier

SAS ® Social Network Analysis
SAS ® Social Network Analysis improves customer retention, crosssell / upsell, & acquisition by enabling marketers to:
Copyright © 2006, SAS Institute Inc. All rights reserved. Company confidential for internal use only
§ Identify social communities based on behavioral relationships between customers
§ Measure and segment customers based on social influence (e.g. “leaders”, “followers”, “marginals
§ Target customers based on community status and behavioral changes within communities (e.g. when a community “leader” changes, target his/her “followers”)
Social Network Analysis
improves customer retention, sell, & acquisition by enabling marketers to:
for internal use only
Identify social communities based on behavioral relationships
Measure and segment customers based on social influence marginals” and “outliers”)
Target customers based on community status and behavioral (e.g. when a community “leader”
changes, target his/her “followers”)

Where to use Social Network Analysis in Marketing
1. Segmentation
2. Retention • Churn / attrition prevention
Copyright © 2006, SAS Institute Inc. All rights reserved. Company confidential for internal use only
• Churn / attrition prevention
3. Crosssell & upsell • Viral product adoption
4. Acquisition
Where to use Social Network Analysis in Marketing
Churn / attrition prevention
for internal use only
Churn / attrition prevention
sell Viral product adoption

Example – Crosssell “Leaders” for “viral” Effect Capability:
•Identify “Leaders” & better understand new product adoption
Marketing Action:
•Target cross / up strategies to “Leaders” 1 leveraging “viral” adoption
Copyright © 2006, SAS Institute Inc. All rights reserved. Company confidential for internal use only
Outlier
Marginal Very few connections
Leader
Community
Follower
Follower
sell “Leaders” for “viral” Effect Marketing Action:
Target cross / upsell strategies to “Leaders” 1 st – leveraging “viral” adoption
Benefit:
•Extend the impact of marketing spend
•Improve timing & pagination of new offers
for internal use only
Community
Outlier
Bridge connectors between different communities

Copyright © 2006, SAS Institute Inc. All rights reserved. Company confidential for internal use only for internal use only
SNA and Fraud Detection

“Canada is a wonderful safe environment to commit fraud as there are no real deterrents and very few repercussions”
Craig Hannaford
Copyright © 2006, SAS Institute Inc. All rights reserved. Company confidential for internal use only
Craig Hannaford
“Canada is a wonderful safe environment to commit fraud as there are no real deterrents and very few repercussions”
Craig Hannaford
for internal use only
Craig Hannaford Executive Consultant Fraud Squad TV Ex RCMP

Starting with the SAS Financial Crimes Framework
§ Fraudsters • Far more sophisticated – organized, patient, share rules • Engage insiders to understand detection environment • High velocity of attacks – disappear after 2
Increasing Fraud The Business Problem
Copyright © 2006, SAS Institute Inc. All rights reserved. Company confidential for internal use only
• High velocity of attacks – disappear after 2 • Hit multiple channels and industries at the same time • Continuously evolve fraud strategies
§ Current Fraud Systems • Silo’d by line of business – • Act on transaction or customer • Rules and predictive models have limitations • No real proactive steps taken to combat cross channel fraud • Evidence insufficient to act upon
Starting with the SAS Financial Crimes Framework
organized, patient, share rules Engage insiders to understand detection environment
disappear after 23 transactions
The Business Problem
for internal use only
disappear after 23 transactions Hit multiple channels and industries at the same time Continuously evolve fraud strategies
– No sharing of data Act on transaction or customer Rules and predictive models have limitations No real proactive steps taken to combat cross channel fraud Evidence insufficient to act upon

SAS Fraud Analytics Using a Hybrid Approach for Fraud Detection
Suitable for known patterns
Suitable for unknown patterns
Customer Account/ Policy
Enterprise Data
Rules
Rules to filter
Anomaly Detection
Detect individual and
Copyright © 2006, SAS Institute Inc. All rights reserved. Company confidential for internal use only
Proactively applies combination of all 4 approaches at account, customer, and network levels
Hybrid Approach
Trans action
Appli cations
Internal Bad Lists Employee
3 rd Party Flags
Call Center Logs
Rules to filter fraudulent transactions and behaviors
Examples:
• Mort. payments from different accounts
• Card order follows address change
• New ACH payee
• Claim close to policy inception
Detect individual and aggregated abnormal patterns
Example:
• % accidents in off peak hours exceeds norm
• # unsecured loans on network exceed norm
• Check or ACH velocity exceeds norm
Using a Hybrid Approach for Fraud Detection unknown
patterns Suitable for complex
patterns Suitable for associative
link patterns
Anomaly Detection
Detect individual and
Predictive Models
Predictive assessment
Social Network Analysis
Knowledge discovery
for internal use only
Proactively applies combination of all 4 approaches at account, customer, and network levels
Hybrid Approach
Detect individual and aggregated abnormal
% accidents in off peak hours exceeds
# unsecured loans on network exceed norm
Check or ACH velocity exceeds norm
Predictive assessment against known fraud cases
Example:
• Like account opening & closure patterns
• Like soft tissue injury patterns across claims (staged)
• Like network growth rate (velocity)
Knowledge discovery through associative link analysis
Example:
• Association to known fraud
• Identity manipulation
• Transactions to suspicious counterparties

Why the Hybrid Approach?
§ More fraud/actionable cases identified • Including both previously undetected networks and extensions to already identified cases
Provides the ability to apply Rules, Predictive Models, and Anomaly Detection on linked data
Copyright © 2006, SAS Institute Inc. All rights reserved. Company confidential for internal use only
already identified cases
§ Reduction in false positive rates • Hybrid approach with SNA reduces false positives by up to 10+ times over traditional rulesbased approaches
§ Improved analyst / investigation efficiency • Each referral takes 1/2 – 1/3 the time to investigate using SAS’ fraud network visualization on aggregated data
§ Significant increase in ROI per analyst / investigator
Why the Hybrid Approach?
More fraud/actionable cases identified Including both previously undetected networks and extensions to
the ability to apply Rules, Predictive Models, and Anomaly Detection on linked data
for internal use only
Reduction in false positive rates Hybrid approach with SNA reduces false positives by up to 10+
based approaches
Improved analyst / investigation efficiency 1/3 the time to investigate using SAS’
fraud network visualization on aggregated data
Significant increase in ROI per analyst / investigator

Analytic Engine
§ Network scoring • Rule and analyticbased
§ Analytic measures of association help users know where to look in network
SAS Social Network Analysis
Copyright © 2006, SAS Institute Inc. All rights reserved. Company confidential for internal use only
where to look in network • NetCHAID for local area of interest (node) in the network
• Density, BetaIndex (network) • Risk ranking with hypergeometric distribution, degree, closeness, betweenness, eigenvector, clustering coefficients (node)
§ Modularity (subnetwork)
association help users know
SAS Social Network Analysis
for internal use only
CHAID for local area of interest (node) in the network
Index (network)
hypergeometric distribution,
clustering coefficients (node)

Case Study – Workers Compensation Insurer
SAS Approach SAS subjected 4 years of historical data Highlights
Business Problem A large US commercial insurer was incurring significant fraud losses across their lines of business. The insurer solution that would provide the most lift over their current rules and models and enhance effectiveness of the triage and fraud investigation teams.
Copyright © 2006, SAS Institute Inc. All rights reserved. Company confidential for internal use only
SAS subjected 4 years of historical data Fraud Framework. Client investigators evaluated the solution results during a validation period to identify incremental fraud detection at the claim and network levels, reduction in false positives, and enhancements to investigative efficiency.
Highlights • Advanced analytics drove 38% better results than competition
• 40% lift on claim referrals
• 27% lift on network referrals
• Incremental estimated save of $10.8M annually (for same # of annual investigations)
• 61% lift over current process
• 47% correct hit rate on claims
• 67% correct hit rate on networks
• 100% of WC and GL claims processed (~$16B claims)
Results The key client decisioning factors for vendor selection include:
• Incremental Detection: $10.9M annually • ADVANCED ANALYTICS
investigator time analytics, SAS performed
• OPEN ARCHITECTURE box + services based approaches (self sufficiency can annual savings on services costs.
Workers Compensation Insurer
4 years of historical data to the predictive capabilities of the SAS
Business Problem A large US commercial insurer was incurring significant fraud losses across their lines of business. The insurer engaged 3 vendors in a competitive pilot to determine the solution that would provide the most lift over their current rules and models and enhance effectiveness of the triage and fraud investigation teams.
for internal use only
4 years of historical data to the predictive capabilities of the SAS Fraud Framework. Client investigators evaluated the solution results during a 3 week
period to identify incremental fraud detection at the claim and network levels, reduction in false positives, and enhancements to investigative efficiency.
The key client decisioning factors for vendor selection include: Incremental Detection: $10.9M annually (for same number of investigations) ADVANCED ANALYTICS, allowing the appropriate prioritization of investigator time and extraction of maximum value. Using SAS advanced analytics, SAS performed 38% better than all other vendors. OPEN ARCHITECTURE, allowing client to become self sufficient vs. other black box + services based approaches (self sufficiency can result in significant annual savings on services costs.).

Case Study – County Department of Social Services
SAS Approach
Business Problem The Department of Social Services of a large US County was being hit by fraud, waste, and abuse across their public assistance programs pilot the SAS Fraud Framework solution could assist in proactively detecting both opportunistic and organized fraud across providers and participants
Copyright © 2006, SAS Institute Inc. All rights reserved. Company confidential for internal use only
Results The pilot resulted in a business case and deployment roadmap for full implementation:
• Investigative Efficiency: $3.0M • Earlier Detection: $1.6M • Incremental Detection: $26.5M
SAS Approach SAS subjected 6 years of historical data Fraud Framework. Client investigators evaluated the solution results during a validation period against 4 main categories: efficiency, earlier fraud detection
Highlights • 32 times increase in # fraud rings detected annually
• Incremental estimated save of $31.1M annually
• 83% correct hit rate on provider fraud
• 40% correct hit rate on participant fraud
• 6 years of historical data from 5 data source systems
County Department of Social Services Business Problem The Department of Social Services of a large US County was being hit by fraud, waste,
public assistance programs. The County engaged SAS to SAS Fraud Framework to determine if the data analytics and visualization
proactively detecting both opportunistic and organized across providers and participants in the Childcare program.
for internal use only
The pilot resulted in a business case and deployment roadmap for full implementation: Investigative Efficiency: $3.0M (saved across 40 investigators) Earlier Detection: $1.6M annually Incremental Detection: $26.5M annually
6 years of historical data to the predictive capabilities of the SAS Fraud Framework. Client investigators evaluated the solution results during a 3 week
period against 4 main categories: Ease of analyst use, investigative earlier fraud detection, and incremental fraud detection.

Copyright © 2006, SAS Institute Inc. All rights reserved. Company confidential for internal use only Copyright © 2009, SAS Institute Inc. All rights reserved. for internal use only