social networks and the process of globalizationsocial networks and the process of globalization...
TRANSCRIPT

Social networks and the process of globalization
Georg Duernecker
University of Mannheim
Fernando Vega-Redondo
Bocconi University & IGIER
August 2017
Abstract
We propose a stylized dynamic model to understand the role of social networks in the phenomenon
we call “globalization.” In a nutshell, this term refers to the process by which even agents who are
geographically far apart come to interact, thus being able to overcome what would otherwise be a fast
saturation of local opportunities. A key feature of our model is that the social network is the main
channel through which agents exploit new opportunities. Therefore, only if the social network becomes
global (heuristically, it “reaches far in few steps”) can global interaction be steadily sustained.
An important insight derived from the model is that, in order for the social network to turn global, the
long-range links required (bridges) cannot endogenously arise unless the matching mechanism displays
significant local structure (cohesion). This sheds novel light on the dichotomy between bridging and
cohesion that has long played a prominent role in the socio-economic literature. Our analysis also relates
the process of globalization to other features of the environment such as the quality of institutions or
the arrival rate of fresh ideas. The model is partially studied analytically for a limit scenario with a
continuum population and is fully solved numerically for finite-population contexts.
Keywords: Social networks, Globalization, Bridging, Cohesion, Search, Innovation.
JEL classif. codes: D83, D85, C73, O17, O43.
1 Introduction
The idea that most economies are fast becoming more globalized has become a commonplace, a mantra re-
peated by the press and popular literature alike as one of the distinct characteristics of our times. Economists,
on the other hand, have also started to devote substantial effort to constructing measures of globalization
that extend well beyond the traditional concern with trade openness (see Section 2 for a short summary
of this predominantly empirical literature). Only relatively scant attention, however, has been devoted to
understanding the phenomenon from a theoretical viewpoint. And this, of course, not only limits our grasp
of matters at a conceptual level. It also limits our ability to advance further along the empirical route.
The main objective of this paper is to provide a theoretical framework for the study of globalization from
the perspective afforded by the theory of social networks. A first question that arises concerns the nature
1

of the phenomenon itself: what is globalization? Our reply is that it involves two key (related) features.
First, agents are relatively close in the social network, even if the population is very large – this is the
situation often described as a “small world.” Second, the links (connections) among agents tend to span long
geographical distances.
A second question is equally basic: Why is globalization important? In response to this question, our
model highlights the following points. Economic opportunities for collaboration appear both locally and
globally (in terms of geographical space). The former are relatively easy to find and exploit but they are also
limited in number. Hence sustained economic expansion must be able to access opportunities at a global
scale. The social network is crucial in this respect, since information and trust (both of which underlie
collaboration) are largely channeled through it. Sustained economic expansion, therefore, can only unfold
if the social network itself becomes global in the sense suggested before. This, in sum, is the process of
socio-economic globalization that provides the fuel and support for growth.
The former considerations raise a host of interesting issues. How and when is an economy able to build
a truly global social network? Is the corresponding process gradual or abrupt? Does it lead to a robust
state of affairs, or is it a fragile outcome hinging upon some quite special circumstances? What is the role
of geography? Does geography provide a structure that facilitates, or instead hinders, globalization? Is the
there a role for policy? More specifically, are there temporary policy measures that may achieve permanent
results?
To address these questions, we formulate a terse model where agents in a large population are spread
uniformly over some fixed ring-like space and can form links with others not only close along the ring but
also far away. Connecting far is important because congestion is wasteful – specifically, it is assumed that
multiple additional links between the same two individuals are worthless. Of course, as link density grows,
such redundant connectivity could not be avoided if linking opportunities were to arise just locally. Thus
we assume that global opportunities also emerge between distant individuals. The flip side of the problem
is that the exploitation of such global opportunities is subject to the threat of opportunistic behavior.
Specifically, the setup of those projects is modeled as a Prisoner’s Dilemma, in which cooperation can be
induced only by the threat of future third-party punishment, as embodied by the social (equilibrium) norm.
Such a punishment, however, is only effective if the two individuals involved are well embedded in the social
network, so that their social distance is relatively short. Only in this case they have enough at stake that
opportunism can be deterred, and hence the project can be effectively set up.
The key challenge, therefore, is to understand how one can tackle effectively the conflict between
(a) the need to connect with distant partners (in order to remedy the local saturation of opportunities), and
(b) the difficulty of doing so (e.g., if the potential for opportunism is high when partners stand far apart).
In brief, our conclusion is that the aforementioned conflict can be overcome if the economy displays some local
(geographical) cohesion, i.e. a tendency of agents to interact preferentially with those who lie geographically
close. But, of course, too much such cohesion can only be detrimental, since it induces too many local links
and hence leads to the congestion that must be avoided in the first place. So what is needed is a suitable
(intermediate) level of it – a level that allows the buildup of a global social network but does not restrict
excessively the rise of global linking opportunities. We show that only in this case can the economy trigger
a robust transition to a steady state where a large set of productive links are maintained. In such high-
2

connectivity state, despite the fact that a persistently “volatile” environment leads many links to become
obsolete and disappear, many new ones are also created that compensate for that link destruction.
Thus our model highlights that cohesion and bridging (i.e. long-range linking) play not only crucial but
complementary roles in boosting network performance. In contrast, the social-network literature traditionally
viewed them as conflicting forces, and spawned a long and heated debate about their relative importance.
On one side of this debate, researchers such as Granovetter (1973) and Burt (1992) stressed the essential
role played by network bridges – i.e. ties (generally “weak”) that connect heterogeneous agents and hence
are often able of closing “structural holes.” The point there was that the highest value is typically generated
by those links that connect parts of the network that were before distantly related, since those links tend to
contribute the least redundant information. On the other side of the debate, Coleman (1988) argued (see also
Gambetta (1988) or Uzzi (1996)) that in creating/supporting valuable connections it is usually important
that the agents involved in them be part of a cohesive group. Here the emphasis was on the fact that, in
general, links that are highly valuable also induce higher incentives to “cheat.” Hence, only if there is the
possibility of bringing social pressure to bear on the interaction – which is facilitated by high levels of social
cohesion – can the corresponding links be successfully created and maintained.
From the early stages of this literature, the discussion has gradually evolved towards a much more
balanced view on the importance of cohesion and bridging in the generation of value within a given social
network. By way of illustration, we may refer to the recent interesting papers by Reagans and Zuckerman
(2008), Vedres and Stark (2010), or Sinan and Van Alstyne (2010). In the language of the latter paper, it
is now amply recognized that, in the “trade-off between network diversity and communications bandwidth,”
there is intermediate optimal compromise.1
In this paper, we also obtain a compromise of sorts between bridging and cohesion, but it is not one
that pertains to a given social network. Rather, it concerns the process of link formation through which the
network itself comes about and evolves, determining in particular whether or not a transition takes place to
a state where economic possibilities are exploited at a global scale. Our measure of performance, therefore,
is inherently dynamic, which seems the natural course to take in modeling processes of development and
growth.
The rest of the paper is organized as follows. Section 2 reviews some related literature and outlines a
companion paper that tests empirically some basic implications of our theory on the field of international
trade and growth. Section 3 presents and motivates the model. Section 4 carries out the analysis, decom-
posing it into two parts. Firstly, in Subsection 4.1, we formulate an analytical “benchmark” theory of the
phenomenon of globalization that applies, strictly speaking, only to the limit of a large (infinite) population.
Secondly, Subsection 4.2 builds upon the benchmark theory to develop a finite-population model that can
be solved numerically and predicts accurately the outcome of simulations, thus allowing for a full array of
comparative-statics results on the effect of the different parameters. Section 5 concludes the main body of
the paper with a summary of its content and an outline of future research. For the sake of smooth exposition,
formal proofs and other details of our discussion (e.g. a specification of the algorithm used in our numerical
computations) are relegated to the Appendix.
1Other analogous trade-offs can be considered as well between cohesion and bridging. For example, the paper by Reagansand Zuckerman (2008) focuses on the fact that while redundancy (as induced by cohesion) limits the richness of network accessenjoyed by an agent, it also increases her bargaining power.
3

2 Related literature
Concerning the phenomenon of globalization, the bulk of economic research has been of an empirical nature,
with only a few papers addressing the issue from a theoretical perspective. However, two interesting the-
oretical papers that display a certain parallelism with our approach are Dixit (2003) and Tabellini (2008).
In both of them, agents are distributed over some underlying space, with a tension arising between the
advantages of interacting with far-away agents and the limits to this imposed by some measure of distance,
geographical or otherwise. Next, we outline these papers and contrast them with our approach.
The model proposed by Dixit (2003) can be summarized as follows: (i) agents are arranged uniformly
on a ring and are matched independently in each of two periods; (ii) the probability that two agents are
matched decreases with their ring distance; (iii) gains from matching (say trade) grow with ring distance;
(iv) agents’ interaction is modeled as a Prisoner’s Dilemma; (v) information on how any agent has behaved
in the first period arrives at any other point in the ring with a probability that decays with distance.
In the context outlined, one obtains the intuitive conclusion that trade materializes only between agents
that do not lie too far apart. Trade, in other words, is limited by distance. To overcome this limitation,
Dixit contemplates the operation of some “external enforcement.” The role of it is to convey information
on the misbehavior of any agent to every potential future trader, irrespective of distance. Then, under the
assumption that such external enforcement is quite costly, it follows that its implementation is justified only
if the economy is large. For, in this case, the available gains from trade are also large and thus offset the
implementation cost.
The second paper, Tabellini (2008), relies on a spatial framework analogous that of Dixit (2003). In
it, however, distance bears solely on agents’ preferences: each matched pair again plays a modified Pris-
oner’s Dilemma, but with a warm-glow altruistic component in payoffs whose size falls with the distance
to the partner. Every individual plays the game only once. This allows the analysis to dispense with the
information-spreading assumption of Dixit’s model, which presumes that agents are involved in repeated
interaction. Instead, the distinguishing characteristic of Tabellini’s model is that agents’ preferences (specif-
ically, the rate at which the warm-glow component decreases with distance) are shaped by a process of
intergenerational socialization a la Bisin and Verdier (2001).
In a certain sense, altruist preferences and cooperative behavior act as strategic complements in Tabellini’s
model. This, in turn, leads to interesting coevolving dynamics of preferences and behavior. For example,
even if both altruism and cooperation start at low levels, they can reinforce each other and eventually lead
the economy to a state with a large fraction of cooperating altruists (these are agents who care for the welfare
of – and hence end up cooperating with – even relatively far-away partners). Under reasonable assumptions,
such steady state happens to be unique. There are, however, interesting variants of the setup where the
enforcement of cooperation (amounting to the detection of cheating and the offsetting of its consequences)
is the endogenous outcome of a political equilibrium, and this allows for multiple steady states that depend
on initial conditions.
In resemblance with the two papers just summarized, our model also attributes to some suitable notion
of “geographical” distance a key role in shaping the social dynamics. In Dixit (2003) and Tabellini (2008),
however, the impact of such exogenous distance is direct: the ability to sustain cooperation (on the basis
4
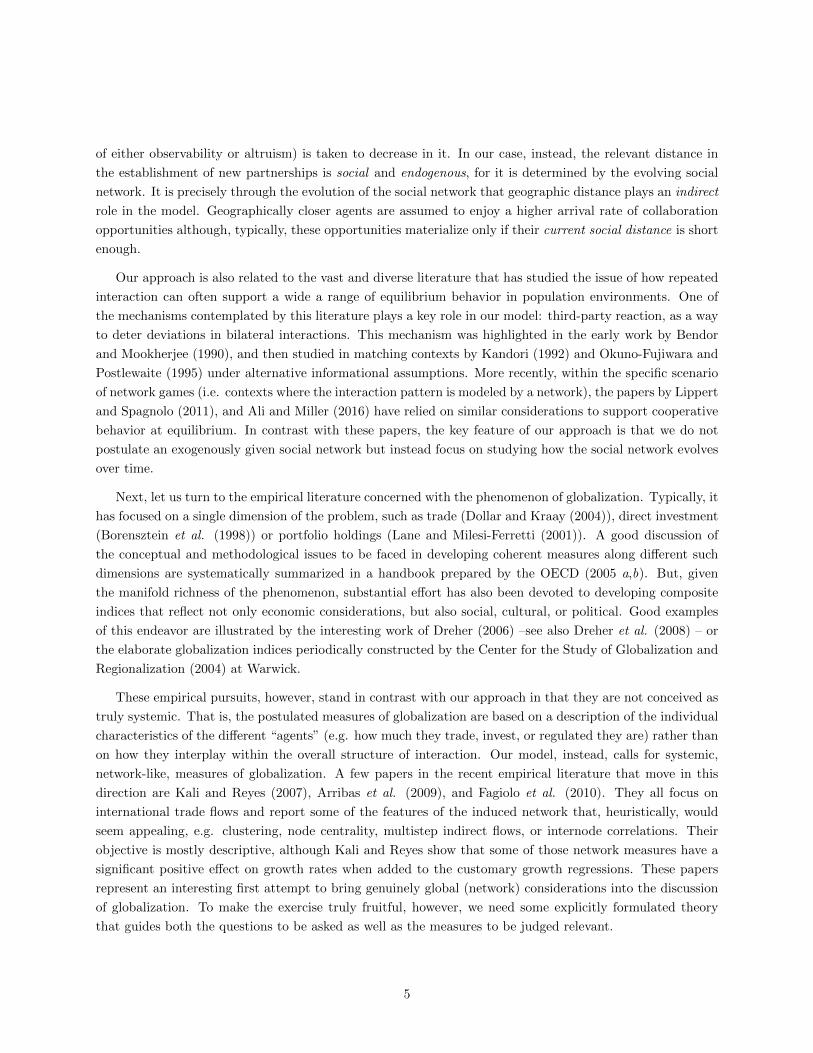
of either observability or altruism) is taken to decrease in it. In our case, instead, the relevant distance in
the establishment of new partnerships is social and endogenous, for it is determined by the evolving social
network. It is precisely through the evolution of the social network that geographic distance plays an indirect
role in the model. Geographically closer agents are assumed to enjoy a higher arrival rate of collaboration
opportunities although, typically, these opportunities materialize only if their current social distance is short
enough.
Our approach is also related to the vast and diverse literature that has studied the issue of how repeated
interaction can often support a wide a range of equilibrium behavior in population environments. One of
the mechanisms contemplated by this literature plays a key role in our model: third-party reaction, as a way
to deter deviations in bilateral interactions. This mechanism was highlighted in the early work by Bendor
and Mookherjee (1990), and then studied in matching contexts by Kandori (1992) and Okuno-Fujiwara and
Postlewaite (1995) under alternative informational assumptions. More recently, within the specific scenario
of network games (i.e. contexts where the interaction pattern is modeled by a network), the papers by Lippert
and Spagnolo (2011), and Ali and Miller (2016) have relied on similar considerations to support cooperative
behavior at equilibrium. In contrast with these papers, the key feature of our approach is that we do not
postulate an exogenously given social network but instead focus on studying how the social network evolves
over time.
Next, let us turn to the empirical literature concerned with the phenomenon of globalization. Typically, it
has focused on a single dimension of the problem, such as trade (Dollar and Kraay (2004)), direct investment
(Borensztein et al. (1998)) or portfolio holdings (Lane and Milesi-Ferretti (2001)). A good discussion of
the conceptual and methodological issues to be faced in developing coherent measures along different such
dimensions are systematically summarized in a handbook prepared by the OECD (2005 a,b). But, given
the manifold richness of the phenomenon, substantial effort has also been devoted to developing composite
indices that reflect not only economic considerations, but also social, cultural, or political. Good examples
of this endeavor are illustrated by the interesting work of Dreher (2006) –see also Dreher et al. (2008) – or
the elaborate globalization indices periodically constructed by the Center for the Study of Globalization and
Regionalization (2004) at Warwick.
These empirical pursuits, however, stand in contrast with our approach in that they are not conceived as
truly systemic. That is, the postulated measures of globalization are based on a description of the individual
characteristics of the different “agents” (e.g. how much they trade, invest, or regulated they are) rather than
on how they interplay within the overall structure of interaction. Our model, instead, calls for systemic,
network-like, measures of globalization. A few papers in the recent empirical literature that move in this
direction are Kali and Reyes (2007), Arribas et al. (2009), and Fagiolo et al. (2010). They all focus on
international trade flows and report some of the features of the induced network that, heuristically, would
seem appealing, e.g. clustering, node centrality, multistep indirect flows, or internode correlations. Their
objective is mostly descriptive, although Kali and Reyes show that some of those network measures have a
significant positive effect on growth rates when added to the customary growth regressions. These papers
represent an interesting first attempt to bring genuinely global (network) considerations into the discussion
of globalization. To make the exercise truly fruitful, however, we need some explicitly formulated theory
that guides both the questions to be asked as well as the measures to be judged relevant.
5

In a companion empirical paper, Duernecker, Meyer, and Vega-Redondo (2015) have built on the theory
presented here to undertake a preliminary step in this direction. The primary aim of the paper is to study
whether the growth performance of countries over time can be tailored to their evolving position in the
network of world trade. More specifically, the empirical hypothesis being tested is whether countries that
are central in that network (i.e. whose average economic distance to others is relatively short) grow faster.
To this end, the paper first introduces an operational counterpart of economic distance that relies on the
pattern of inter-country trade flows and reflects considerations that are analogous to those displayed by the
theoretical framework formulated here.2 Then, it checks whether the induced measure of centrality is a
significant variable in explaining intercountry differences in growth performance. It does so by identifying
systematically the control regressors that are to be included in the empirical model and then, most crucially,
address the key endogeneity problem that lies at the core of the issue at hand.3 It finds that the postulated
notion of centrality (which can be interpreted as a reflection of economic integration) is a robust and very
significant explanatory variable that supersedes traditional measures of openness (e.g. the ratio of exports
and imports to GDP), rendering them statistically insignificant. This suggests that the network-based
approach to the problem that is proposed here adds a systemic perspective that is rich and novel. We refer
the interested reader to the aforementioned companion paper for the details of the empirical exercise.
3 The model
The formal presentation of the model is divided in two parts. First, we describe the underlying (fixed)
spatial setup and the (changing) social network that is superimposed on it. Second, we specify the dynamics
through which the social network evolves over time from the interplay of link creation (innovation) and
link destruction (volatility). The formulation of the model is kept at an abstract level in order to stress its
versatility.
3.1 Geographic and social distance
The economy consists of a fixed set of dynasties N = {1, 2, ..., n}, each occupying a fixed location in ge-
ographical space and having a single homonymous representative living and dying at each point in time.
They are evenly spread along a one-dimensional ring of fixed length. To fix ideas, we speak of this ring as
representing physical space but, as is standard, it could also reflect any other relevant characteristic (say,
ethnic background or professional training). For any two dynasties i and j, the “geographical” distance
between them is denoted by d(i, j). By normalizing the distance between two adjacent locations to unity, we
2First, we define a weighted network in which the weights of the different inter-country links are identified with the magnitudeof their corresponding (size-normalized) trade flows. This defines a row-stochastic matrix, which is in turn reinterpreted as thetransition matrix of a Markov process governing the flow of economic interaction across countries. Then, the distance betweentwo countries is measured by the expected time required to reach one country from the other according to the probabilitiesspecified in the aforementioned transition matrix. (Incidentally, it is worth mentioning that such probabilistic interpretation isanalogous to that used by common measures of importance/centrality used in networks, such as the famous PageRank algorithmoriginally used by Google.)
3The selection of control variables is conducted through a large-scale use of the so-called Bayesian averaging methods used inthe literature (see e.g. Sala-i-Martin et al (2004)). The issues raised by endogeneity, on the other hand, are tackled by relyingon the use of maximum-likelihood methods that have proven effective to address the problem in panel growth data.
6

may simply identify d(i, j) with the minimum number of dynasties that lie between i and j along the ring,
including one of the endpoints.
At each point in time there is also a social (undirected) network in place, g ⊂ {ij ≡ ji : i, j ∈ N} ≡ Γ,
each of its links being interpreted as an ongoing value-generating project undertaken in collaboration by
the two agents (or dynasties) involved. With this interpretation in mind, when assessing the economic
performance of the system, we shall measure its success by the average number of (evolving) links that it
can persistently maintain over time.
The network of ongoing collaboration among the agents of the economy introduces an additional notion
of distance – the social (or network) distance. As usual, this distance is identified with the length of the
shortest network path connecting any two agents. (If no such path exists, their social distance is taken to
be infinite.) In general, of course, the prevailing social distance δg(i, j) between any two agents i and j can
be higher or shorter than their geographical distance d(i, j); see Figure 1 for an illustration.
Figure 1: Snapshot of a situation at some t. By way of illustration, note that whereas the social distanceis maximum (infinity) between agents i and j who are neighbors on the ring (i.e. their geodistance attainsthe minimum value of 1), the corresponding comparison for i and k yields the opposite conclusion, i.e. theirgeodistance is higher than their social distance.
3.2 Dynamics
Time t is modeled continuously. For expositional simplicity, each t ∈ R+ is conceived as a period [t, t+ dt] of
infinitesimal duration dt during which a new individual of every dynasty is born and dies. The state of the
system at t is identified with the network g(t) ⊂ Γ prevailing at the point when the new generation is born.
This network consists of the links directly inherited (within dynasties) by the individuals living at t. The
state changes due to two forces alone: innovation and volatility, each performed at separate stages within t.
Innovation embodies the creation of new links and itself requires the completion of two consecutive actions:
invention and implementation. Volatility, on the other hand, pertains to the destruction of existing links,
due to obsolescence or some other kind of decay. Next, we describe each of these forces in detail.
7

3.2.1 Invention
For every t, the agent from dynasty i living during that period (i.e. the current representative of the
homonymous dynasty i) gets, at the beginning of her life, an idea for a new project with probability ηdt
(i.e. at a fixed rate η > 0). We focus only on those projects that require inter-agent collaboration, with the
specific agent j required (taken to be unique) depending on random exogenous factors such as the nature of
project and the skills that are called for. We also assume that, from an ex ante viewpoint, the conditional
probability pi(j) that any given agent j is the one required by i’s idea satisfies:
pi(j) ∝ 1/ [d(i, j)]α
, (1)
for some α > 0. Thus, any new project by i is more likely to rely on skills possessed by close-by agents, the
corresponding probability decaying with geographical distance (geodistance, for short) at the rate α. This
abstract formulation admits a wide variety of concrete interpretations and here we illustrate this flexibility
by discussing two possibilities.
The first alternative is the most simplistic one. It conceives i and j above as actually meeting physically
at the time i has the idea, which makes j the (only) feasible partner to implement it. In this interpretation,
decay just reflects the fact that closer agents meet more often than distant ones. A second alternative
interpretation is based on the notion that fruitful collaboration between two agents requires that they be
similar (or compatible) in some exogenous characteristics – e.g. language, norms, or expectations. In this
case, (1) embodies the arguably natural assumption that “geographically” closer agents are more likely to
display similar such characteristics. Whatever the interpretation, one may view α as parametrizing the
prevailing degree of cohesion, generally conceived as the extent to which fruitful interaction mostly occurs
within a relative short “geographical” span. Henceforth, we shall refer to α as the cohesion of the economy.
3.2.2 Implementation
Consider an agent i who has had an idea for a project and j is the agent whose collaboration is required.
When will this collaboration indeed materialize, thus allowing the project to operate? This will happen if,
and only if, the agents can suitably tackle the incentive issues involved in setting up the project. To model
the problem in a very simple manner, we make the following assumptions. The period [t, t+dt] during which
any given agent lives is divided into three subperiods. The first one is where invention takes place, as it has
been presented above. The subsequent two are the setup and operating stages, now described in turn.
Setup stage : In this stage, the two agents must incur fixed sunk costs 2K to set up the new project.
Metaphorically, we may think of it as planting a tree, which will bear fruit later in the period. Only if
they manage to cover this cost the project can start to operate. The situation is modelled as a Prisoner’s
Dilemma. Each agent has to decide, independently, whether to Cooperate (C ) or Defect (D). If both choose
C, they share the cost equally (i.e. each covers K) and the project starts. Instead, if only one cooperates,
the cooperator covers the total cost 2K while the defector pays nothing. Such an asymmetric arrangement
still allows the project to be undertaken. Finally, if both defect, the setup cost is not covered, the project
fails to start, and the economic opportunity is irreversibly lost.
Operating stage : In this last stage, the agents can reap the benefits of all the existing projects in which
they are involved. In attempting to do so, for each of these (bilateral) projects the two agents involved
8
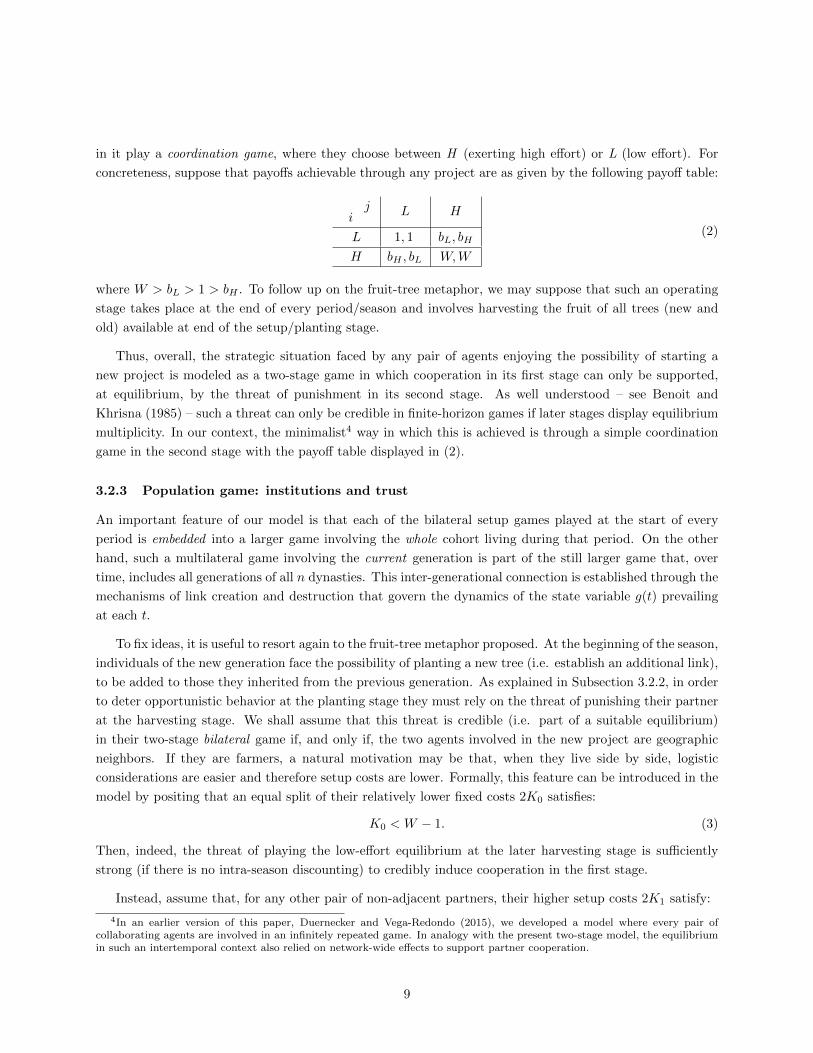
in it play a coordination game, where they choose between H (exerting high effort) or L (low effort). For
concreteness, suppose that payoffs achievable through any project are as given by the following payoff table:
ji L H
L 1, 1 bL, bH
H bH , bL W,W
(2)
where W > bL > 1 > bH . To follow up on the fruit-tree metaphor, we may suppose that such an operating
stage takes place at the end of every period/season and involves harvesting the fruit of all trees (new and
old) available at end of the setup/planting stage.
Thus, overall, the strategic situation faced by any pair of agents enjoying the possibility of starting a
new project is modeled as a two-stage game in which cooperation in its first stage can only be supported,
at equilibrium, by the threat of punishment in its second stage. As well understood – see Benoit and
Khrisna (1985) – such a threat can only be credible in finite-horizon games if later stages display equilibrium
multiplicity. In our context, the minimalist4 way in which this is achieved is through a simple coordination
game in the second stage with the payoff table displayed in (2).
3.2.3 Population game: institutions and trust
An important feature of our model is that each of the bilateral setup games played at the start of every
period is embedded into a larger game involving the whole cohort living during that period. On the other
hand, such a multilateral game involving the current generation is part of the still larger game that, over
time, includes all generations of all n dynasties. This inter-generational connection is established through the
mechanisms of link creation and destruction that govern the dynamics of the state variable g(t) prevailing
at each t.
To fix ideas, it is useful to resort again to the fruit-tree metaphor proposed. At the beginning of the season,
individuals of the new generation face the possibility of planting a new tree (i.e. establish an additional link),
to be added to those they inherited from the previous generation. As explained in Subsection 3.2.2, in order
to deter opportunistic behavior at the planting stage they must rely on the threat of punishing their partner
at the harvesting stage. We shall assume that this threat is credible (i.e. part of a suitable equilibrium)
in their two-stage bilateral game if, and only if, the two agents involved in the new project are geographic
neighbors. If they are farmers, a natural motivation may be that, when they live side by side, logistic
considerations are easier and therefore setup costs are lower. Formally, this feature can be introduced in the
model by positing that an equal split of their relatively lower fixed costs 2K0 satisfies:
K0 < W − 1. (3)
Then, indeed, the threat of playing the low-effort equilibrium at the later harvesting stage is sufficiently
strong (if there is no intra-season discounting) to credibly induce cooperation in the first stage.
Instead, assume that, for any other pair of non-adjacent partners, their higher setup costs 2K1 satisfy:
4In an earlier version of this paper, Duernecker and Vega-Redondo (2015), we developed a model where every pair ofcollaborating agents are involved in an infinitely repeated game. In analogy with the present two-stage model, the equilibriumin such an intertemporal context also relied on network-wide effects to support partner cooperation.
9

K1 > W − 1. (4)
This means that the gains from defecting from an equal split of costs in the setup stage cannot be compensated
by bilateral punishment in the operating stage. Suppose, however, that opportunism in the planting stage
can be deterred if at least one other agent were involved in the punishment. Payoff-wise, this requires that:
2(W − 1) > K1, (5)
which implies that the single gains from defecting at the planting stage are more than offset by the losses
derived from playing the inefficient equilibrium at the harvesting stage with two different partners.
The above discussion implicitly presumes that there is a social norm in place by which agents (in equi-
librium) react to behavior that did not directly affect them. The importance of such multilateral norms in
supporting cooperative behavior has been highlighted by Coleman (1988, 1990) and others,5 both theoreti-
cally and empirically. It raises the question, however, of how an agent might learn in a large economy about
behavior to which she is not directly exposed. The assumption we make is that this information is channeled
through the social network itself, i.e. by agents relaying it to their partners. But this, in turn, suggests that
social (network) distance between the exploited and the punishing parties should play an important role on
whether multilateral norms may be supported in this manner.
To understand how the aforementioned considerations may bear on our model, consider the social norm
suggested above, where an agent i is supposed to punish any of his partners j who has unilaterally defected
on some other agent k (6= i). When will this norm be effectively applied? An important point to note is that,
despite being part of an equilibrium, such a punishment entails a cost to i. For, as explained, it involves
playing an inefficient equilibrium of the coordination game involving i and j. In this light, one relevant
factor may be that i would be ready to punish j only if the defected-upon agent k is not too far away from
i in the social network. A natural motivation for this condition is based on what the literature has called
the “circle of trust.”6 It specifies the social range, generally limited, at which agents may be expected to
enforce, in a costly (and equilibrium-supported) manner, some given social norm. In our analysis, the radius
of such a circle of trust, denoted by r, is assumed exogenously fixed. For notational simplicity, we shall use
the derived parameterµ ≡ r + 1 (6)
which is interpreted as the quality of the prevailing institutions of the economy.7 Formally, µ defines the
5See, for example, Greif (1993), Lippert and Spagnolo (2011), Vega-Redondo (2006), Karlan et al. (2009), Jackson et al.(2012), or Ali and Miller (2016).
6When the circle of trust is narrow, the society is afflicted by what, in a celebrated study of Southern Italy, Banfield (1958)labeled “amoral familism.” Banfield used this term to describe the exclusive trust and concern for the closely related, as opposedto the community at large. He attributed to this anti-social norm a major role in the persistent backwardness he witnessed in hisstudy. More recently, Platteau (2000) has elaborated at length on the idea, stressing the importance for economic developmentof the dichotomy between generalized morality – moral sentiments applied to abstract (we would say “socially-distant”) people– and limited-group morality – which is restricted to a concrete set of people with whom one shares a sense of belonging. Usingmodern terminology, this can be described as a situation where cooperative social norms are enforced, perhaps very strongly,for those who are socially close, but they are virtually ignored when the agents involved lie outside some tight social radius.
7It should be noted that this interpretation of our model implicitly builds on the assumption that information flows instan-taneously within any network component. One may adopt an alternative interpretation that departs from such a demandingassumption (which, for a large population, is clearly far-fetched) and supposes instead that agents immediately observe only thebehavior that occurs in their own interactions. And concerning the behavior arising in other interactions, we may assume thatthe information is received with some delay and/or less reliability, as it diffuses further along the links of the social network. Inthis interpretation, µ can be conceived, rather than as related to the circle of trust, as a measure of how the promptness or/andreliability of information decays with network distance, in part depending on how proactive agents are in enforcing social norms– this, in a sense, can also be regarded as a measure of the quality of institutions).
10

farthest that agent k above can be from the agent j with whom she is considering a fresh collaboration and
still count on third-party punishment to induce cooperative behavior on j’s part. That is, such a punishment
can be anticipated if, and only if, δg(k, j) ≤ µ.
Such a restriction on third-party punishment will be one of the key features of the game theoretic
framework formalizing agent interaction in Subsection 3.2.4 below. A second important feature concerns
what we call congestion. By this term we capture the idea that there are sharply decreasing returns to how
much value can be extracted from interacting “in the intensive margin” with few other agents. As suggested
in the introductory Section 1, congestion is precisely the reason why agents must turn global in order to
diversify/widen their range of partners. For convenience, we model the idea starkly by assuming that any
given pair of agents can only be involved in a single active project. Thus, if two already connected agents
are given the opportunity to start a new project, this is assumed unfeasible as long as the original project is
active. Admittedly, this is an extreme way of modelling the phenomenon, but has the advantage that it is
particularly transparent.
3.2.4 Population game: formalization
Finally, we formalize the intertemporal game that combines the different features of the environment intro-
duced in the former subsections. Our context defines a stochastic game with an unbounded number of agents
who live for just one period (an “instant” in continuous time) and are associated to one of the n dynasties.
Since agents have no concern for future generations, only the interaction taking place within their lifetime is
strategically relevant for them. The whole game, however, is genuinely dynamic, with the situation prevailing
at any point in time t (i.e. the state of the system) being fully characterized by the social network g(t) in
place at the beginning of that period.
We focus on a particular Markov Perfect Equilibrium (MPE) for this game. It involves strategies that,
at each t, only depend on the corresponding state g(t). They prescribe, for any individual of dynasty i who
is facing the possibility of starting a new project with some other agent j, the following behavior at each of
her two decision points:
D1. At the setup stage, i is taken to choose C if, and only if, the following two conditions jointly hold:
L1: δg(t)(i, j) ≤ µ or/and d(i, j) = 1, i.e. i and j are socially close or/and geographic neighbors.
L2: ij /∈ g(t), i.e. i and j are not already involved in an ongoing project together.
D2. At the operating stage, in the separate coordination game that i plays with each of her current partners
k, she chooses H if, and only if, k did not unilaterally choose D in the setup stage of a project initiated
at t with i or someone in i’s circle of trust, i.e. with some ` such that δg(t)(i, `) ≤ r(= µ− 1).
As explained, the above strategies embody a social norm that deters defection in the setup stage by the threat
of third-party (credible) punishment in the operating stage. Formally, they are given by stationary (i.e. time-
invariant) decision rules for each agent/dynasty i of the form {σi}i∈N = {[σ1i (k`, g), σ2
i (·; k`, g)]g,k`/∈g}i∈Nthat include the following two components.
The first component – σ1i (k`, g) for each i, g, and k` – applies to the setup stage when the link k` is absent
11

in g and, upon the arrival of the opportunity to create it, one of the agents involved is i (i.e. i ∈ {k, `}).8 In
that case, as explained in L1 above, σ1i (k`, g) ∈ {C,D} is as follows:
σ1i (k`, g) = C ⇔ [δg(k, `) ≤ µ ∨ d(k, `) = 1], (7)
i.e. individual i cooperates in the setup stage for the link k` if, and only if, the two agents involved are either
socially or geographically close. Note that such a strategy format presumes that agents know the prevailing
network g. This, however, is not strictly needed for our purposes since it would be enough to posit that they
simply have the local information required to know whether the social distance to a potential new partner
is larger than µ or not. Analogous considerations apply to the behavior contemplated in (8) below.
On the other hand, the second component of each agent’s strategy – i.e. σ2i (·; k`, g) for each i, g, and
k` /∈ g – applies to the operating stage. As formulated in D2, it prescribes the action to be chosen (H or L)
for each of the active links ij ∈ g′, where g′ is the network prevailing in that stage – that is, g′ = g ∪ {k`}if the link k` was formed in the first stage (because C ∈ {ak, a`}) or simply g′ = g otherwise. Thus, to be
precise, we may write{σ2i [ij, (ak, al); k`, g]
}j:ij∈g′ ∈ {H,L}
z′i where z′i is the degree of i in g′. In view of
D2, the only interesting choices to be considered here are those associated to a link ij ∈ g′ such that:9
(a) {i, j} ∩ {k, `} 6= ∅ (the link ij includes at least one of the agents connected by the new link k`), and
(b) ∃h, h′ ∈ {k, `} s.t. ah = D and ah′ = C (one of the agents involved in k` defected on the other).
Under these contingencies (and h and h′ as identified above), we must have:
σ2i [ij, (ak, al); k`, g] = L ⇔ [{i, j} = {k, `}] ∨ [ih ∈ g ∧ δg(i, h
′) ≤ µ− 1] . (8)
The strategy profile defined by (7)-(8) defines a Markov Perfect equilibrium where every player behaves
optimally at every state. This applies, in particular, for the most interesting case where a single fresh linking
opportunity arises. To see this note that, proceeding by backwards induction, the selection of the low-effort
equilibrium within the operating stage is obviously a continuation equilibrium in the final game played in
each partnership at every period – hence a credible threat. Then, our payoff assumptions (cf. (4)-(5))
guarantee that there is a Markov Perfect continuation equilibrium where cooperation at the setup phase is
optimal if, and only if, the agents involved have third parties who are socially close enough and thus could
be called upon for deterring punishments. This provides a suitable game-theoretic foundation for D1-D2.
3.2.5 Volatility
As explained, link decay is the second force governing the dynamic process. We choose to model it in the
simplest possible manner as follows. Exogenously, for reasons not concretely modeled, each existing “fruit
tree” dries up at the end of every period [t, t + dt] with probability λdt, i.e. at a constant rate λ > 0.
This entails the destruction of the corresponding link and, in general, may be interpreted as the result of a
process of obsolescence through which existing projects lose (all) value. We choose, therefore, not to model
link destruction explicitly, while letting the interplay between the social network and the overall dynamics
be fully channeled through the mechanism of link formation alone. Without loss of generality, the volatility
rate is normalized to unity (λ = 1), by scaling time appropriately.
8 Here we focus on the case involving the possible creation of only one link since, given that periods are of infinitesimallength, the event that at most one linking opportunity arises is infinitely more likely than its complement. This renders thepossibility of multiple linking opportunities inessential, and can be ignored in formally specifying the agents’ strategies – see(7) and (8).
9For all partner pairs such that neither agent is involved in the new link k`, D2 trivially prescribes joint high effort.
12

4 Analysis
Very succinctly, the network formation process modeled in the preceding section can be described as the
struggle of innovation against volatility. The primary objective of our analysis is to understand the conditions
under which such a struggle allows for the rise and maintenance, in the long run, of a high level of economic
interaction (i.e. connectivity). More specifically, our focus will be on how such long-run performance of the
system is affected by the sole three parameters of the model: η (the rate of invention10 ), µ (institutions),
and α (geographical cohesion). Concerning specifically the latter, our aim will be to understand the extent
to which some cohesion is needed for the process of globalization to take off effectively, and how the optimal
level of it depends on the other two parameters of the model.
The discussion in this section is organized in two parts. First, we develop a benchmark theory that can
be studied analytically and is directly applicable to the limit case of an infinite population. Second, we
build upon that benchmark theory to formulate a finite-population model that can be solved numerically
and predicts accurately the outcome of simulations. Then we use this fully solvable version of the model to
conduct a full array of comparative-statics results.
4.1 Benchmark theory
The theoretical framework considered in this subsection focuses on a context where the population is taken to
be very large (n→∞) and, for any given level of connectivity (i.e. average degree), the underlying network
is of the Erdos-Renyi type. In such a large-population context, the process may be modeled as essentially
deterministic, with the aggregate behavior of the system identified with its expected motion. This affords
substantial advantages from an analytical point of view. For example, its dynamics can be analyzed in terms
of an ordinary differential equation, instead of the more complex stochastic methods that would be required
for the full-fledged study of finite-population scenarios. In fact, as we shall see in Subsection 4.2, a suitable
adaptation of this approach is also very useful to study a finite (large enough) context since, with high
probability, its actual (stochastic) behavior is well approximated by the expected one.
Our analysis (both here and in the next subsection) relies on the following simple characterization of
the stable steady states of the process. Let φ denote the average conditional linking probability prevailing
at some steady state – i.e. the probability that a randomly selected agent who receives an invention draw
succeeds in forming a new link. This is an endogenous variable, which we shall later determine from the
stationarity conditions of the process. Based on that probability, the expected rate of project/link creation
can be simply written as the product φηn, where η is the invention rate and n is the population size (for
the moment, taken to be finite). On the other hand, if we denote the average degree (average number of
links per node) by z, the expected rate of project/link destruction is given by λ(z/2)n = 12zn, where recall
that we are making λ = 1 by normalization.11 Thus, equating the former two magnitudes and canceling n
10Throughout the paper, in the interest of simplicity we refer to η as the invention rate even although, strictly speaking, itis the rate at which innovation opportunities arrive. Alternatively, we could have called it the invention rate.
11Note that the number of links is half the total degree because every link contributes to the degree of its two nodes.
13
on both sides of the equation, we arrive at the following condition:
η φ =1
2z. (9)
This equation characterizes situations where, in expected terms, the system remains stationary, link creation
and link destruction proceeding at identical expected rates.
Our theoretical approach focuses on (stable) stationary configurations. These are ensembles of states (i.e.
probability measures γ ∈ ∆(Γ) defined over all possible networks g ⊂ Γ) where the component subprocesses
of link creation and link destruction operate, in expected terms, at a constant rate. The following two
postulates are taken to govern the behavior of the system at such configurations:
(P1) Link creation: At stationary configurations, every individual agent is ex-ante subject to a symmetric
and stochastically independent mechanism of link creation. Thus each of them obtains a new link to a
randomly selected other agent at a common probability rate η φ.
(P2) Link destruction: At stationary configurations, every link is ex-ante subject to a symmetric and
stochastically independent mechanism of link destruction. Thus each of them vanishes at some common
probability rate λ.
Postulate (P2) directly follows from our model and thus requires no elaboration. Instead, (P1) embodies
the assumption that, at stable stationary configurations, the aggregate dynamics of the system can be
suitably analyzed by assuming that the average rate of link creation applies uniformly and in a stochastically
independent manner across nodes and time. The rationale motivating this assumption when the population is
large is akin to that providing support to the widespread application of stochastic-approximation techniques
to the study of dynamical systems. The main point here is that, when the population is large, one can
presume that a substantial amount of essentially independent and symmetric sampling is conducted in the
vicinity of a configuration that, on average, changes very gradually (because it is approximately stationary).
In applying (9) to the study of stationary configurations, two basic difficulties arise. First, as explained,
φ is an endogenous variable that depends on the state of the system, i.e. it changes as the prevailing
network g evolves. Second, the equation reflects only expected behavior, so that for finite systems there
must be some stochastic noise perturbing the system around the induced stationary configurations. To
tackle these problems in a combined fashion, we adopt in this subsection a methodology widely pursued
by the modern theory of complex networks and also by some of its recent applications to economics: a
mean-field representation (see e.g. Galeotti and Rogers (2013), Jackson and Yariv (2011), or Lopez-Pintado
(2008)).12 This approach involves a deterministic description of the dynamical system that, under suitable
conditions,13 can be shown to approximate closely its actual motion if the population is large enough.
In our case, we rely on (P1)-(P2) and an intuitive appeal to the Law of Large Numbers to identify actual
12This is the methodology adopted by some of the canonical models in the random network literature, e.g. the model forScale-Free networks proposed by Barabasi and Albert (1999). A compact description of this and other models studied in theliterature from such a mean-field perspective can be found in Vega-Redondo (2007).
13A mathematical underpinning for the mean-field analysis of evolutionary games has been provided by Benaım and Weibull(2003) and Sandholm (2003). An analogous exercise has been undertaken by Marsili and Vega-Redondo (2016) for a networkformation process similar to the present one, where link destruction is also modelled as stochastically independent volatilitywhile link creation is tailored to the payoffs of a simple coordination game. For a good discussion of the main stochastic-approximation results that provide the mathematical basis for the mean-field analysis of various large-scale systems the readeris referred to Sandholm (2010, Chapter 10).
14

and expected magnitudes along the process – more specifically, we focus on the aggregate motion of the
system in the neighborhood of stationary configurations. This leads to a deterministic law of motion for
the aggregate behavior system that is captured by an ordinary differential equation (cf. (14) below). An
indication that such a mean-field approach is applicable to our context will be provided, indirectly, by the
analysis conducted in Subsection 4.2. There we shall show that a finite-population counterpart of our model
yields a quite accurate prediction of the behavior of the system for large (finite) populations. This will be
interpreted as providing substantial support to the use of (P1)-(P2) as the basic postulates of our analysis,
both for the benchmark context studied here as well as for finite-population scenarios.
To start our mean-field analysis, it is convenient to anticipate a useful result, which will be formally
established below by Lemma 2. This result asserts that, under our maintained assumptions, a stationary
configuration of the system can be appropriately described as a Binomial random network (i.e. a random
network where the probability that any given node displays a given degree is governed by a Binomial
distribution). This implies, in particular, that the network prevailing at a stationary configuration can be
fully characterized by its expected degree z. Thus, at least as far as such configurations are concerned, the
underlying network can be uniquely defined by the single real number that, for large population, defines its
average connectivity.
For the moment, let us allow for the possibility that stationary configurations could arise for any possible
z, possibly by fine-tuning the volatility rate to the required level, say λ(z). We label the ensembles thus
obtained as z-configurations. Then, given the corresponding (Binomial) random network that describes the
situation, denote by φ(z) the conditional probability at which a randomly selected agent who is given a
linking opportunity effectively creates a new link. This entails a link-creation rate given by η φ(z), which in
turn requires (cf. (9)) that the volatility rate be equal to
λ(z) =2 η φ(z)
z. (10)
if the presumed stationarity in the corresponding z-configuration is to materialize.
In general, of course, z-configurations do not define a genuinely stationary situation in our model since
the volatility rate λ cannot be freely modified but is exogenously given (and has been normalized to unity).
It turns out, however, that the preliminary step of focusing on such “artificial” configurations will prove
very useful, both for the present benchmark analysis as well as for the numerical approach to equilibrium
determination that will be pursued in Subsection 4.2. For, indeed, a truly stationary configuration of our
model – i.e. what we shall simply label an equilibrium configuration – can be simply defined as a specific
z∗-configuration such that λ(z∗) = 1.
In practice, to carry out our theoretical analysis, we still need to address the issue of how to determine
endogenously the conditional linking probability φ(z) induced by any given z-configuration. To proceed for-
mally, given any z, denote by Φ(z ; α, µ, n) the conditional linking probability displayed by a z-configuration
under parameters α, µ, and n. We shall see that this magnitude is (uniquely) well-defined. While α is an
exogenously fixed parameter, our interest here is on contexts where the population size n grows unboundedly.
Then the value of µ should adjust accordingly as a function of n. For, as the network size grows, interesting
aggregate results can arise only if institutions can adapt to the larger population. If, for example, µ were to
remain bounded as n grows unboundedly, there would be an extreme mismatch between the magnitude of the
15

economy and the range of its institutions, since the “circle of trust” would display a radius of infinitesimally
shorter length than the size of the population. Such acute contrast could not possibly support effective
globalization.
But how fast must µ rise to render the analysis interesting? As it turns out, our large-population
analysis will only require (see Lemma 3) the mild assumption that, as the population size n increases, the
corresponding level of institutions µ(n) should increase at a rate no slower than (possibly equal to) that of
log n. Mathematically, this amounts to asserting that there is some constant K such that
limn→∞
µ(n)
log n≥ K > 0. (11)
The previous condition formalizes the requirement that institutions should display some responsiveness to
population size that, albeit possibly very weak, must be positive. Intuitively, if not even such responsiveness
obtained and the economy was set to grow steadily in size, at some point its institutions would necessarily
block the possibility of enjoying the rising potential benefits of full-scale globalization. The simple reason is
that, within a bounded “circle of trust,” only a finite number of individuals can be reached (provided the
number of partners per individual is also bounded). Thus, asymptotically, only an infinitesimal fraction of the
population could be “trusted” in that case as the population size n→∞. These considerations motivate our
decision to maintain (11) throughout the present study of the benchmark model, while keeping the actually
prevailing value of µ in the background. Instead, in Subsection 4.2, where we shall study a finite-population
scenario, we shall be able to carry a detailed comparative analysis of the effect that different (finite) values
of µ have on the economy’s performance.
Thus, let us take the large-population limit and define:
Φ( z ; α) ≡ limn→∞
Φ( z ; α, µ(n), n). (12)
Assuming µ(n) satisfies (11), it can be shown14 that the function Φ(· ; α) is well-defined on Q+ and can be
uniquely extended to a continuous function on the whole R+. Then, we can suitably formulate the following
counterpart of (9):
η Φ( z ; α) =1
2z, (13)
which is, in effect, an equation to be solved in z for the equilibrium/stationary points of the process. Then,
adopting an explicitly dynamic perspective, we are naturally led to the following law of motion:
z = η Φ( z ; α)− 1
2z (14)
which tailors the changes in z to the difference between the current rates of link creation and destruction:15
14The main point to note here is two-fold: (a) the diameter of the largest component of a Binomial network – the so-called
giant component – grows at the order of logn (see Bollobas (2001)); (b) the function Φ(· ; α) depends on z only through theuniquely induced distribution of component sizes. By way of illustration, consider the simplest case with α ≤ 1. Then theconditional linking probability specified by Φ(· ; α) equals the probability that two randomly selected nodes belong to the giantcomponent (which is the sole component with positive fractional size in the limit n→∞). Specifically, if the fractional size ofthe giant component is denoted by χ(z) ∈ [0, 1], such linking probability is [χ(z)]2. This function is uniformly continuous onQ+, so admits a continuous extension to R+.
15As explained before, this is in line with the theory of stochastic approximation showing that, if the population is large
16

This differential equation can be used to study the dynamics of the process out of equilibrium. As it turns
out, its behavior – and, in particular, the stability properties of its equilibrium points – crucially depends
on the magnitude of α. We start by stating the result that spells out this dependence and then proceed to
explain in various steps both its logic and its interpretation. (The proof of the proposition below as well as
of all other results in this Subsection can be found in Appendix A.)
Proposition 1 The value z = 0 defines an asymptotically stable equilibrium of the dynamical system (14)
if, and only if, α ≤ 1, independently of the value of η.
This proposition implies that, in the limit model obtained for n→∞, the ability of the population to build
a network with some significant connectivity from one that was originally empty (or very little connected)
depends on the level of geographical cohesion. Thus, if α ≤ 1, there exists some ε > 0 such that if the initial
configuration z0 satisfies z0 ≤ ε, then the induced trajectory [ϕ(t, z0)]t≥0 induced by (14) that starts at z0
satisfies limt→∞ ϕ(t, z0) = 0. Instead, if α > 1, an immediate consequence of Proposition 1 is as follows.
Corollary 1 Assume α > 1. Then, from any initial z0, the induced trajectory satisfies limt→∞ ϕ(t, z0) ≡z∗(z0) > 0.
That is, no matter what the initial conditions might be (even if they correspond to an empty network with
z0 = 0), the system converges to a configuration with strictly positive connectivity.
The previous results indicate that the set of environments can be partitioned into two regions with
qualitative different predictions:
• Low geographical cohesion (LGC): α ≤ 1
• High geographical cohesion (HGC): α > 1
Intuitively, in the LGC region, “geography” (possibly, in a metaphorical sense of the word) has relatively
little bearing on how new ideas arise, while in the HGC region the opposite applies. To understand why the
contrast between the two regions should be so sharp as reflected by Proposition 1, it is useful to start by
highlighting the effect of α on the probability that the agent chosen as possible partner for a new project be
one of his two geographical neighbors. From (1) this probability is simply given by the following expression:
po ≡ pi(i+ 1) + pi(i− 1) ≡
(n−1)/2∑d=1
1
dα
−1 (15)
where, for simplicity, we assume that n is odd. Denote ζ(α, n) ≡∑(n−1)/2d=1 1/dα. As n → ∞, ζ(α, n)
converges to what is known as the (real-valued) Riemann Zeta Function ζ(α), i.e.
ζ(α) ≡ limn→∞
ζ(α, n) =
∞∑d=1
1
dα. (16)
and the adjustment is gradual, the aggregate dynamics can be suitably described deterministically as the solution path of anordinary differential equation.
17

It is is a standard result in Real Analysis16 that
ζ(α) <∞ ⇐⇒ α > 1. (17)
Hence, for n→∞, we have:
po > 0 ⇐⇒ α > 1. (18)
The above expression has several important consequences. An immediate one is that being able to build up
the interagent connectivity from scratch (i.e. from a very sparse network) requires a geographical cohesion
larger than unity. For, if there are essentially no links, the only way an agent can hope to form a link is when
she is matched with one of her immediate geographic neighbors. But if this event has probability po = 0,
then no link will ever be formed from the empty network and hence the ensuing networks will continue being
empty forever. The important point made by Proposition 1 is that this intuition continues to hold in the
limit benchmark model when z is positive but small.
Formally, the stability result embodied by Proposition 1 hinges upon the determination of certain key
properties of the function Φ( z ; α) defined in (12). To facilitate matters, the analysis will be organized
through a set of auxiliary lemmas. We start with Lemma 1 below which establishes that, given any finite
population, the linking probability of any particular agent/node must satisfy some useful bounds in relation
to the size of its respective component.
Lemma 1 Let g be the network prevailing at some point in a population of size n, and consider any given
agent i who is enjoying a link-creation opportunity. Denote by φi(g) the conditional probability that she
actually establishes a new link (under the link-formation rules L1-L2 in Subsection 3.2.3) and let Mi(g)
stand for the size of the component to which she belongs.17 Then, we have:
φi(g) ≤ Mi(g) + 1
2[ζ(α, n)]
−1. (19)
In addition, if agent i happens to be isolated (i.e. has no partners), then
φi(g) = [ζ(α, n)]−1. (20)
Lemma 1 highlights the two main considerations that govern the linking probability φ: the level of cohesion
(as parametrized by α), and the typical component size. On the effect of the former – channeled through
the impact of α on the limit value ζ(α, n) – we already elaborated upon before. Concerning the latter, on
the other hand, the main conclusions arise from the following result, which establishes that every stationary
configuration is given by a Binomial (usually called Erdos-Renyi) network.
Lemma 2 Given any z ≥ 0, consider any z-configuration γ of the mean-field model given by (P1)-(P2). This
configuration can be described as a Binomial random network where the probability that any particular node
i has degree zi = k is given by β(k) =(n−1k
)pk(1− p)n−k−1, with p = z
n−1 .
16See e.g. Apostol (1974, p. 192).17As usual, a component is defined to be a maximal set of nodes such that every pair of them are connected, either directly
by a link or indirectly through a longer path. The size of a component is simply the number of nodes included in it
18

As noted, we are interested in studying a large-population setup where n → ∞. In this limit, we can rely
on Lemma 2 and classical results of the theory of random networks,18 to establish the following result.
Lemma 3 Under the conditions specified in Lemma 2, consider any given z ≥ 0, and let {γ(n)}n=1,2,... stand
for a sequence of z-configurations associated to different populations sizes n ∈ N and, correspondingly, denote
by χ(n) ∈ [0, 1] the fractional size of the giant component19 in γ(n) that converges to some γ. The sequences
{γ(n)}n∈N and {χ(n)}n∈N converge to a well-defined limit distribution and limit giant-component size, γ and
χ respectively. Furthermore, χ > 0⇔ z > 1.
Finally, from Lemmas 3 and 1, together with the property of the Riemann Zeta Function ζ(α) stated in (17),
we arrive at the two results below. These additional lemmas compare the properties of the function Φ( · ; α)
in the two cohesion scenarios (LGC and HGC) that arise depending whether or not α lies above 1. Recall
that the function Φ(z, α) stands for the conditional linking probability prevailing in a z-configuration for an
asymptotically large population and a particular level of geographical cohesion.
Lemma 4 Assume α ≤ 1. Then Φ( z ; α) = 0 for all z ≤ 1.
Lemma 5 Assume α > 1. Then Φ( z ; α) > 0 for all z ≥ 0.
It is easy to show (cf. Appendix A) that Lemmas 4-5 yield the conclusion stated in Proposition 1. The
essential idea underlying this result is illustrated in Figures 2 and 3, where equilibrium configurations are
represented by intersections of the function Φ( · ; α) and the ray of slope 1/(2η). First, Figure 2 depicts a
situation with low cohesion (i.e. α < 1). By virtue of Lemma 4, Φ( · ; α) is uniformly equal to zero in a
neighborhood of z = 0 – hence, at this point, it displays a zero slope. Then, the equilibrium configuration
with z = 0 is always asymptotically stable, no matter what is the value of η. When η is small (e.g. η = η′
in this figure) the equilibrium z = 0 is unique, while for larger values (e.g. η = η′′) multiple equilibria exist
– some stable (such as z1 and z3) and some not (e.g. z2).
In contrast, Figure 3 illustrates the situation corresponding to a cohesion parameter α > 1. In this case,
Φ( 0 ; α) = [ζ(α, n)]−1
> 0, which implies that every path of the system (14) converges to some positive
equilibrium degree for any value of η, even if it starts at z = 0. If the invention rate η is high (larger than η),
such a limit point will be unique (independent of initial conditions) and display a relatively large connectivity
(e.g. z5 in the figure), whereas the limit connectivity will be unique as well and relatively small if η is low
(smaller than η). Finally, for any η between η and η, the induced limit point is not unique and depends on
the initial connectivity of the system.
Proposition 1 (and, more specifically, Lemmas 4-5) highlight that geographical cohesion must be large
enough if the economy is to arrive at a significantly connected social network from an originally sparse one.
Provided such level of cohesion is in place, other complementary points that may be informally conjectured
from the way in which we have drawn the diagram in Figure 3 are as follows. First, as a function of the
18See, for example, the extense survey of Newman (2003) or the very accessible monograph by Durrett (2007) for a goodpresentation of the different results from the theory of random networks that will be used here. For a more exhaustive accountof this field of research, see the classic book by Bollobas [1985] (2001).
19As indicated in Footnote 14, the giant component is the largest component of a network that uniquely may have a positivefractional size.
19

Figure 2: The effect of changes in η on the equilibrium degree under low cohesion (α < 1)). See the text foran explanation.
Figure 3: The effect of changes in η on the equilibrium degree under moderately high cohesion (i.e. 1 < α < αfor some relatively low α). See the text for an explanation.
invention rate η, the value of network connectivity achieved in the long run from any given initial conditions
is arbitrarily large if η is high enough. Probably more interestingly, a second heuristic conjecture we may
put forward is that if cohesion is “barely sufficient” to support the aforementioned build-up, the transition
to a highly connected economy should occur in an abrupt/discontinuous manner. That is, the conjecture is
that there is a threshold value for the cohesion level (i.e. η in Figure 3), such that the long-run connectivity
displays an upward discontinuous change as η rises beyond that threshold. Reciprocally, there should also
be another threshold (η in Figure 3) such that a discontinuous jump downward occurs if η falls below it.
In fact, the overall behavior just described informally is precisely as established by the next two results.
20

The first one, Proposition 2, is straightforward: it establishes that if α > 1 the long-run average degree
grows unboundedly with η at all levels of this parameter and for all initial conditions.20 On the other hand,
Proposition 3 asserts that if α is larger than 1 but close enough to it, the long-run connectivity attained
from an empty network experiences a discontinuous upward shift when η increases past a certain threshold
value, while a discontinuous downward shift occurs as η decreases past another corresponding threshold.
Proposition 2 Assume α > 1 and let z∗(z0 ; η) > 0 stand for the limit configuration established in Corollary
1 for every initial configuration z0 and invention rate η. Given any z0, the function ζ∗(z0 ; ·) is strictly
increasing and unbounded in η.
Proposition 3 There exists some α such that if α > α > 1, the function z∗(0 ; ·) displays an upward
right-discontinuity at some η = η > 0. Reciprocally, and under the same conditions for α, a downward
left-discontinuity occurs at some η = η > 0.
4.2 The finite-population model
The stylized “benchmark” approach pursued in Subsection 4.1 serves well to highlight some of the key forces
at work in our theoretical setup. For example, it provides a clear-cut understanding of the role of cohesion
in the rise of globalization (Proposition 1), and identifies conditions under which this phenomenon can be
expected to unfold in an abrupt manner (Proposition 3). This approach, however, also suffers from some
significant limitations. One shortcoming derives from the difficulty of obtaining an explicit solution of the
model, which in turn hampers our ability to carry out a full-fledged comparative analysis of it. This pertains,
in particular, to some of its important parameters such as institutions (µ) and its interplay with cohesion
(α). Another drawback of the benchmark setup is that it is studied asymptotically, the size of the population
being assumed infinitely large. The relevant question then arises as to whether the insights obtained in such
a limiting scenario are still relevant when the population is finite. To address these various concerns is one
of the objectives of the present subsection.
Another important objective is to provide some computational support to the mean-field approach pur-
sued in our analysis of the benchmark model. In a nutshell, this will be done by testing the predictive
performance of the finite-population version of our model. In this respect, a first point to stress is that
the same conceptual framework is used to study the benchmark model and the finite-population scenario,
with the postulates (P1)-(P2) playing the key role in both. Recall that these postulates prescribe that, at
stationary configurations, links adjust (through innovation and volatility) in a stochastically independent
manner. This implies that, as the population grows large, the dynamics induced by the finite-population
model in the vicinity of a stationary configurations should converge to their deterministic counterparts, as
reflected by the benchmark model. Thus, in this sense, the benchmark model should represent a suitable
approximation of the finite-population model when the population becomes arbitrarily large.21
20Of course, in the present continuum model, the unboundedness of the connectivity as η grows is a consequence the factthat the population is infinite and therefore no saturation is ever reached.
21More precisely, the claim may be verbally stated as follows, in line with the standard formulation of the problem consideredin Stochastic Approximation Theory (see e.g. Sandholm (2010, Chapter 10). Take any stable stationary configuration of thebenchmark model and suppose that the system starts at a state consistent with it. Then, over any given time span andwith arbitrarily high probability, the finite-population model induces ensuing paths that are arbitrarily close to the startingconfiguration if the population is large enough.
21

Of course, the previous considerations are to be judged truly relevant only to the extent that the basic
postulates (P1)-(P2) underlying the theoretical analysis are largely consistent with the dynamics prescribed
by our model, as actually resulting from the behavior displayed by the agents (as described in Subsection
3.2.4). In what follows, therefore, our first task is to check this issue. More specifically, the aim is to find
whether the results obtained across a wide range of Monte Carlo simulations resulting from a numerical
implementation of the network dynamics are compatible with the essential features of the solution derived
for the finite-population version of the model. As already advanced, we shall find that the finite-population
theory performs remarkably well in predicting the outcome of simulations, even in only moderately large
systems – see Figure 5 below for an illustration. This, we argue, provides good albeit indirect support to the
claim that the postulates (P1)-(P2) indeed represent a suitable basis for our theory – not only as applied to
a finite-population context but to the benchmark setup as well.
As customary, the starting point of the endeavor at hand is to construct a discrete-time dynamical
system that is equivalent to the continuous dynamic process posited by our (continuous-time) theoretical
framework. In such a discrete-time formulation, only one adjustment instance takes place at each point (i.e.
a single link creation or destruction),22 with respective probabilities proportional to their corresponding
rates in the continuous-time counterpart (see Appendix B for details). In this context, our approach to
studying the finite-population model will be computational rather than analytical. In part, the reason for
this is that, with a finite population, we cannot reliably use the asymptotic theory of random networks to
determine the counterpart of the function Φ(·) used in the benchmark model.23 Other than that, we shall
proceed just as we did for the benchmark model (recall (10)). That is, for any value of z, we implement
a (stationary) z-configuration through an instrumental modification of the system where the volatility rate
is modulated “artificially” so that the system achieves and maintains an average degree equal to z. Such a
modulated volatility is applied throughout in a strictly unbiased manner across links, and hence the induced
configuration can indeed be suitably conceived as a z-configuration in the sense formulated in Subsection
4.1. And then, given that the induced process is ergodic, by iterating it long enough for each possible value
of z we obtain a good numerical estimate of the value of Φ(z). That is, we obtain a good computation of
the link-creation probability associated to the z-configuration in question.
Next, we provide a more detailed description of the procedure just outlined, which we label Algorithm P.
Algorithm P: Numerical determination of Φ(z)
Given any parameter configuration and a particular value of z, the value Φ(z) is determined through
the following two phases.
1. First, we undertake a preliminary phase, whose aim is simply to arrive at a state belonging to the
configuration associated to the given degree z. This is done by simulating the process starting
from an empty network but putting the volatility component on hold – that is, avoiding the
destruction of links. This volatility-free phase is maintained until the average degree z in question
is reached.24
22Note that, as explained in Subsection 3.2 (cf. Footnote 8), in the continuous-time dynamics posited by our model, whenan adjustment occurs it almost surely involves only one link being created or destroyed.
23Recall that this function is the large-population limit of the function Φ(·) that determines the linking probability associatedto any given z-configuration, as contemplated by the stationarity condition (9).
24The details governing this first phase are inessential since the specific form in which the algorithm first reaches a state in
22

2. Thereafter, a second phase is implemented where random link destruction is brought in so that,
at each point in time, the average degree remains always equal to z. In practice, this amounts to
imposing that, at each instant in which a new link is created, another link is subsequently chosen
at random to be eliminated. (Note that, by choosing the link to be removed in an unbiased
manner, the topology of the networks so constructed coincides with that which would prevail if
the resulting configuration were a genuine steady state.) As the simulation proceeds in the manner
described, the algorithm records the fraction of times that (during this second phase) a link is
actually created between meeting partners. When this frequency stabilizes, the corresponding
value is identified with Φ(z).
Given the function Φ(·) computed through Algorithm P over a sufficiently fine grid, the value ηΦ(z) induced
for each z considered acts, just as in the benchmark model, as a key point of reference. For, in effect, it
specifies the “notional” expected rate of link creation that would ensue (normalized by population size)
if such average degree z were to remain stationary. Indeed, when the overall rate of project destruction
λ z2 = z2 equals ηΦ(z), the former conditional “if” applies and thus the stationary condition actually holds
in expected terms.
Diagrammatically, the situation can be depicted as for the benchmark model, i.e. as a point of intersection
between the function Φ(·) and a ray of slope equal to 1/(2η). Figure 4 includes four different panels where such
intersections are depicted for a fixed ratio 1/(2η) and alternative values of α and µ, with the corresponding
functions Φ(·) depicted in each case having been determined through Algorithm P. As a quick and informal
advance of the systematic analysis that is undertaken below, note that Figure 4 shows behavior that is fully
in line with the insights and general intuition shaped by our preceding benchmark analysis. First, we see
that the transition towards a highly connected network can be abrupt and large for low values of α, but is
gradual and significantly more limited overall for high values of this parameter. To focus ideas, consider the
particularly drastic case depicted in Panel (a) for α = 0.2 and µ = 2. There, at the value of η corresponding
to the ray being drawn (η = 20), the system placed at the low-connectivity equilibrium (whose average degree
is lower than 1) is at the verge of a discontinuous transition if η grows slightly. This situation contrasts with
that displayed in the panels for larger α – see e.g. the case α = 2 – in which changes in η (that modify the
slope of the ray) trace a continuous change in the equilibrium values.
It is also worth emphasizing that some of the details apparent in Figure 4 point to significant differences
with the benchmark model. For example, Φ(z) does not uniformly vanish to zero below a certain positive
threshold z for α ≤ 1. This, of course, is simply a consequence of the fact that this condition must be expected
to hold only in the limit as the population size n → ∞. For finite populations, significant deviations from
it must be expected, which is a point that underscores the benefits of developing an approach that extends
our original benchmark model to account for finite-population effects.
The formal parallelism between the benchmark and finite-population models provides a welcome coher-
ence to the overall analysis of the model. Furthermore, it lends some reassuring support to our mean-field
approach through the comparison of the predictions of the finite-population version of the model and the nu-
merical simulations carried out across different parameter configurations. By way of illustration, the outcome
the configuration associated to desired degree z has only short-run consequences. After the application of the second phaseduring long enough, any effect on those specific details will be largely removed by “stochastic mixing.”
23

(a) α = 0.2 (b) α = 0.5
(c) α = 1 (d) α = 2
Figure 4: Graphical representation of the equilibrium condition Φ(z) = 12η z in the finite-population frame-
work. The diagrams identify the steady states as points of intersection between a fixed ray associated toη = 20 (i.e. with a slope equal to 1/40) and the function Φ(·) computed for different institutions µ (withineach panel) and cohesion levels α (across panels).
of one such comparison exercise is reported in Figure 5, where we compare the theoretical and simulation
results obtained as the invention rate η changes for two different scenarios: one with low cohesion (α = 0.5)
and another with high one (α = 2), while keeping the institutions fixed at a relatively low level µ = 3 where
the situation is most interesting. For the sake of clarity, we report only the average degree of the network,
which is the variable that our theory posits as a sufficient description of the prevailing state. The continuous
lines trace the stable predictions induced by the finite-population theory (multiple ones in the middle range
for η, unique for either of the extreme regions). In addition, the diagram also marks the outcomes obtained
24

from long simulation runs using the formulated law of motion.25
Figure 5 shows that the solid lines closely trace the locus of points marking the simulation outcomes
throughout the whole range for η and two polar values for α. We find, therefore, that there is a precise
correspondence – not just qualitative but also quantitative – between the theoretical predictions and the
simulation results, both for the low- and high-cohesion scenarios. This suggests that the theoretical principles
used to build the benchmark model have a satisfactory equivalent in the counterpart model developed for the
finite-population context, where they can be used to predict accurately simulation outcomes. Having shown
Figure 5: Comparison between the theoretical predictions and the numerical simulations for thestationary/long-run average degree corresponding to different values of the invention rate η, two differ-ent cohesion scenarios (α = 0.5 , 2), institutions µ = 3, volatility rate λ = 1, and population size n = 1000.The continuous lines trace the theoretical predictions derived from the mean-field model, while the marksrecord simulation results. These results are obtained by averaging a large number of independent simulationruns under analogous initial conditions. In the middle range for η both the theory and the simulations inducetwo possible outcomes, depending of initial conditions: a high one associated to a relatively well-connectedinitial network, and a low one associated to an initial sparse network. Outside of this range, the outcome isunique (hence independent of initial conditions).
the close match between theory and simulations, we can proceed to the next objective of the finite-population
model. This is to undertake a full-fledged set of comparative analyses in all the three key parameters of
the model: invention rate η, cohesion α, and institutions µ (recall that the volatility rate is normalized to
unity).26 Our analysis will specifically consider the following three issues.
25It is easy to see that, for any finite population, the process is ergodic and therefore its unique long run behavior does notdepend on initial conditions. Thus, in this light, it must be stressed that what the simulation outcomes marked in Figure 5represent is the average degree of those z-configurations that are said to be metastable. These, in general, may be non-unique(as in the middle range for η in our case). When multiple metastable configurations exists, the system is initially attracted toone such metastable configuration and thereafter spends long (but finite) periods of time in its vicinity. In fact, the length ofsuch periods becomes exponentially large in system size, which essentially allows us to view those configurations as suitablelong-run predictions. The reader is referred to Fredlin and Wentzel (1984) for a classical treatment of metastability for randomdynamical systems.
26In tracing the function Φ(·), we need to discretize the parameters η and α (the parameter µ is already defined to be discrete).For η we choose a grid of unit step, i.e. we consider the set Ψη = {1, 2, 3, ...}, while for α the grid step is chosen equal to 0.05,
25

First, in Subsection 4.2.1, we focus on one of the central issues that has largely motivated our general
discussion: how the tradeoff between the positive and negative consequences of cohesion interplay with
other parameters of the environment in shaping performance (i.e. network connectivity at steady states).
These parameters include, most notably, the quality of institutions (which obviously bears crucially on the
aforementioned tradeoff) as well as the rate of invention that determines the pace at which new links/projects
can be generated.
Secondly, in Subsection 4.2.2, we turn our attention to how increases in the invention rate trigger different
types of transitions in connectivity – gradual or abrupt – depending on the degree of cohesion. This, as the
reader may recall, was one of the prominent features arising in our analysis of the benchmark model (cf.
Proposition 3).
Thirdly, in Subsection 4.2.3, we revisit the role of institutions, by focusing on how their improvement
affects network performance for given values of the other parameters. By so doing we shall gain a comple-
mentary perspective on the substitutability between cohesion and institutions. We shall also find that the
effect of institutions on network connectivity displays a threshold step-like behavior. That is, it is essentially
flat up to and beyond a certain single value of µ, which is the only point at which an effect (typically quite
sizable) obtains when institutions are improved.
4.2.1 The optimal level of geographical cohesion
Throughout our discussion of the model, we have stressed the two opposing implications of geographical
cohesion: it endows the linking process with useful structure but, on the other hand, exacerbates the problem
of congestion/saturation of local linking opportunities. This is why we have argued that, in general, there
must be an optimal resolution of this trade-off at some intermediate level. To be precise, define the Optimal
Geographic Cohesion (OGC) as the optimal value α = α∗ that maximizes the long-run average network
degree when the process starts from the empty network. The conjecture is that such OGC should decrease
with the quality of the environment, i.e. as institutions get better (higher µ) or invention proceeds faster
(higher η). This is indeed the behavior displayed in Figure 6. The intuition for the dependence pattern of
the OGC displayed in Figure 6 should be quite apparent by now. In general, geographical cohesion can only
be useful to the extent that it helps the economy build and sustain a dense social network in the long run.
Except for this key consideration, therefore, the lower is the geographical cohesion of the economy the better.
Heuristically, one may think of the OGC as the value of α that provides the minimum cohesive structure
that allows for globalization to take off. Thus, from this perspective, since it is easier for this phenomenon
to arise the better the underlying environmental conditions, the fact that we find a negative dependence of
OGC on η and µ is fully in line with intuition.
The behavior shown in Figure 6 can also be seen as an additional manifestation, specially clear-cut, of
the extent to which bridging and cohesion are, in a sense, “two sides of the same coin.” The stability of a
globalized economy crucially relies on the long-range bridges that make it a “small world,” but the process
through which these bridges are created cannot be triggered unless the economy displays sufficient local
cohesion. In the end, the dichotomy discussed in the Introduction – building bridges or enhancing cohesion –
thus the grid is Ψα = {0.05, 0.1, 0.15, ...}. Finally, concerning population size, our analysis will consider n = 1000. We haveconducted robustness checks to confirm that the gist of our conclusions is unaffected by the use of finer parameter grids orlarger population sizes.
26

(a) (b)
Figure 6: Optimal value of geographical cohesion as a function of institutions µ, given different values of η(Panel (a)); and as a function of the the invention rate η, given different values of µ (Panel (b)) – volatilityrate λ = 1 and population size n = 1000.
that attracted so much debate in the early literature on social networks appears as an unwarranted dilemma
when the problem is conceived from a dynamic perspective. For, in essence, both bridging and cohesion
are to be regarded (within bounds) as complementary forces in triggering a global, and thus dense, social
network.
4.2.2 Geographical cohesion and the transition to globalization
Within the limit setup given by the benchmark model, the transition to globalization from a sparse network
is only possible if the cohesion parameter α > 1 (cf. Proposition 1). This, however, is strictly only true in
the limit case of an infinite population. In contrast, for a large but finite population, one would expect that
the transition to globalization becomes progressively harder (in terms of the invention rate η required) as α
decreases to, and eventually falls below, unity. Furthermore, in line with the main insights for the benchmark
model reflected by Propositions 2 and 3, we would expect as well that, if globalization does take place, its
effect on network connectivity arises in a sharper manner, and is also more substantial in magnitude, the
lower is geographical cohesion.
Our study of the finite-population model permits the exploration of the former conjectures in a systematic
manner across all regions of the parameter space for a large population. The results of this numerical analysis
are summarized in Figure 7 for a representative range of the parameters α and µ. In the different diagrams
included, we trace the effect of η on the lowest average network degree that can be supported at a steady-
state configuration of the system. In line with our discussion in Subsection 4.1, this outcome is interpreted
as the long-run connectivity attainable when the social network must be “built up from scratch,” i.e. from
a very sparse network.
27

(a) α = 0.3 (b) α = 0.5
(c) α = 0.75 (d) α = 1
(e) α = 2 (f) α = 4
Figure 7: Numerical solution for the lowest average network degree that can be supported at a steady state,as the invention rate η rises, for different given values of geographical cohesion α and institutions µ (withλ = 1, n = 1000).
28

4.2.3 The role of institutions
For the reasons discussed in Subsection 4.1, the benchmark model was studied under the assumption that the
level of institutions µ grew with the population size (possibly slowly but monotonically so – cf. (12). This,
in essence, allowed us to abstract from this parameter in the analysis, the only relevant consideration being
how the size of components change across different situations – not their diameter or any other distance-
related magnitude. But, of course, in general we are interested on studying how institutions impinge on
globalization, and a finite-population framework provides a setup where this can be done systematically by
relying on the approach developed in the present section.
The results of our analysis are summarized in Figure 8, which shows the effect of institutions on the lowest
network connectivity supportable at a steady state for a representative range of the remaining parameters,
α and η. One of the conclusions obtained is that, if η is not too large, cohesion can act as a substitute
for bad institutions. Or, somewhat differently expressed, the conclusion is that if cohesion is large enough,
institutions are not really important – they do not have any significant effect on the equilibrium outcome.
Instead, when cohesion is not high, the quality of institutions plays a key role. If their quality is low enough,
the economy is acutely affected by that and the corresponding equilibrium displays an extremely low average
degree.
However, on the other side of the coin, Figure 8 also shows that institutions can play a major role when they
reach a certain threshold. At that point, the economy makes an abrupt transition where its low cohesion
can then attain its large potential, formerly unrealized due to bad institutions. Another related conclusion is
that, once institutions exceed the threshold, the improvements that can be achieved by improving institutions
further are capped. That is, institutions saturate at a relatively low level their ability to increase the long-run
connectivity of the network.
The intuition for why cohesion and institutions act as substitutes should be clear. In a sense, the role of
high cohesion in our setup is precisely that of compensating for bad institutions. When agents cannot “trust”
those who lie relatively far in the social network, only high cohesion can support the creation of new links.
But, of course, high cohesion also has its drawbacks, which are manifest as well in Figure 8. If the economy
can overcome the deadlock of a low-connectivity equilibrium (i.e. it is past the point where institutional
improvements have had an effect), then low cohesion is always associated to higher performance. This, in
essence, is the basis for the trade-off marking the optimal level of cohesion that was studied in Subsection
4.2.1.
Finally, we discuss the intuition of why the effect of institutions on performance is of the threshold type,
thus giving rise to the step functions found in Figure 8. The key point to note is that, in line with what
was shown to be true for the infinite-population benchmark model, the social network prevailing in a steady
state of the finite-population framework can be suitably approximated as a random network if the economy
is large. Hence we may rely on standard results in the theory of random networks to assert that essentially
all nodes in the unique sizable (so-called “giant”) component must lie at diameter (i.e. maximum) distance
(cf. Footnotes 12 and 18 for useful references). This diameter must then coincide with the level of µ at
which the transition takes place, and any increase thereafter can have no effect on the process.
29

(a) α = 0.3 (b) α = 0.5
(c) α = 0.7 (d) α = 1
Figure 8: Numerical solution for the lowest average network degree that can be supported at a steady state,as institutions improve, for different given values of the invention rate η and geographical cohesion α (withλ = 1, n = 1000).
5 Summary and conclusions
The paper has proposed a “spatial” theoretical framework to study the relationship between globalization
and economic performance. The main feature of the model is that connections breed connections, for it is
the prevailing social network that supports the materialization of new linking opportunities. In the end, it is
the fast exploitation of those opportunities that offsets the persistent process of link decay and hence allows
the economy to sustain a steady state with a dense network of connections.
30

But in order for such a process to unfold, the social network must turn global, i.e. network distances have
to become short and then links can span long geographical distances. Otherwise, only local opportunities
are available and hence economic performance is sharply limited by local saturation. To understand the
way in which this phenomenon of globalization comes about has been the primary concern of the paper.
One of the key insight obtained from the analysis is that some degree of “geographic” cohesion is generally
needed to render the transition to globalization possible. Thus, in contrast with what has been typically
argued in the literature, cohesion and bridging are not to be regarded as opposing factors in the build-up of
a dense network. Rather, their interplay is rich and subtle, both playing complementary roles in the process
of globalization. More specifically, we have seen that long-range bridging (which is of course inherent to the
phenomenon of globalization) crucially relies on some degree of cohesion in order to take off. Too much of it,
however, is detrimental in that it leads to congestion and the consequent waste of link-creation opportunities.
This paper is to be viewed as a first step in what we hope might be a multifaceted research program.
From a theoretical viewpoint, an obvious task for future research is to enrich the microeconomic/strategic
foundations of the model. This will require, in particular, to describe in more detail how information flows
through the social network, and the way in which agents’ incentives respond to it. Another important
extension of the model should be to allow for significant agent heterogeneity (the basis for so much economic
interaction), which should probably be tailored to the underlying geographic space as in the work of Dixit
(2003) – cf. Section 2.
Our model should also be useful in discussing policy issues. By way of illustration, recall that, if ge-
ographical cohesion is not too strong, significant equilibrium multiplicity may arise, alternative equilibria
displaying substantial differences in network connectivity. Such a multiplicity, in turn, brings in some hys-
teresis in how the model reacts to small parameter changes. That is, slight modifications in some of the
parameters (e.g. a small stimulus to the invention rate) may trigger a major shift in globalization that, once
attained, remains in place even if the original parametric conditions are restored. Conceived as a short-run
policy measure, the effectiveness of any such temporary involvement derives from its ability to trigger the
chain of self-feeding effects that are inherent to network phenomena. In this light, therefore, we may argue
that even a limited intervention could attain major changes in the system that are also robust, i.e. “locally
irreversible” and hence likely to be persistent.
Finally, another important route to pursue in the future is of an empirical nature. As discussed in
Section 2, there is a substantial empirical literature on the phenomenon of globalization but a dearth of
complementary theoretical work supporting these efforts. The present paper hopes to contribute to closing
the gap, by suggesting what variables to measure and what predictions to test. Specifically, our model
highlights network interaction measures that stress the importance of both direct and indirect existing
connections in the process of creating and supporting new ones. As an example, we have summarized the
paper by Duernecker, Meyer, and Vega-Redondo (2015) that adopts this perspective in constructing network
measures of economic interaction among countries that can be used to explain inter-country differences of
performance across time. Conceivably, a similar approach could be used to study many other instances of
economic interaction where the network dimension seems important, e.g. the internal network (formal and
informal) among workers and managers in a firm (see Burt (1992)), or the network among firms collaborating
in R&D projects within a certain industry (see Powell et al. (2005)).
31

Appendix
Appendix A
Proofs
Proof of Lemma 1
First, in order to establish (19), note that, upon receiving a link-formation opportunity, a necessary
condition for any agent i to be able to establish a new link at t with some other agent j who has been
selected as given in (1) is that either j belongs to the same network component of i or/and both nodes are
(geographical) neighbors. Given that there are Mi − 1 other nodes in i’s component and every agent has
two geographic neighbors, the desired upper bound follows from the fact that the maximum probability with
which any agent j can be chosen as a potential partner of i is [2 ζ(α, n)]−1
.
On the other hand, to establish (20), we simply need to recall that an isolated node i will always form
a new link with either of its two geographical neighbors if these are selected as potential partners. Since
the geographic distance to each of them is normalized to 1, the probability that either of them is selected is
simply 2 [2 ζ(α, n)]−1
. This coincides with the claimed lower bound.
Proof of Lemma 2
Under the conditions (P1)-(P2) posited by the mean-field model, the stochastic process induced by the
subprocesses of links creation and link destruction is ergodic for any given (finite) n. To see this note that,
for every state/network of the process, g ∈ Γ, there is positive probability, bounded away from zero, that the
process transits from g to the empty network. Thus it has a unique invariant distribution. To establish the
result, therefore, it is enough to show that there is a certain distribution µ that yields the desired conclusion.
Consider the distribution µ specified as follows:27
µ(g) = A∏
i,j∈N,i<j
(2 η φ
λ(n− 1)
)gij(g ∈ Γ) (21)
where φ and λ are the given conditional linking probability and volatility rate prevailing at the z-configuration
under consideration, A is a normalizing constant equal to[∏
i,j∈N,i<j
(2 η φλ(n−1)
)gij]−1, and we use the con-
venient notation gij ∈ {0, 1} as an indicator for the event that the link ij ∈ g.
It is well-known that, in order to verify that such a distribution µ is invariant it is sufficient to establish
the following so-called detailed-balance conditions:
µ(g) ρ(g → g′) = µ(g′) ρ(g′ → g) (g, g′ ∈ Γ) (22)
where ρ(g → g′) denotes the rates at which transitions from g to g′ take place along the process. These
27See Marsili and Vega-Redondo (2016) for an analogous approach. Of course, we are implicitly assuming that n is very large,so each of the product terms in the expression are lower than unity.
32

conditions are now confirmed to hold in our case. First, note that, because in continuous time at most
one adjustment can occur with significant probability in a small time interval, we need to consider only
transitions across adjacent networks, i.e. networks that differ in just one link (created or eliminated). Thus
consider two such networks, g and g′, and suppose for concreteness that g′ differs from g in having one
additional link ij. Then, on the one hand, since any existing link is taken to vanish at the rate λ we have:
ρ(g′ → g) = λ.
On the other hand, for the opposite transition we have:
ρ(g → g′) =2 η φ
n− 1
since in order for the link ij to be formed starting from network g, the following events must jointly occur:
either i or j must receive a linking opportunity (which occurs at the rate η); that agent has to select the other
one to establish the link (this occurs with probability 1/(n− 1); finally, the linking opportunity must indeed
materialize (an event that occurs with the conditional linking probability φ). Thus, in order for conditions
(22) to hold, it is required thatµ(g)
µ(g′=ρ(g′ → g)
ρ(g → g′)=
2 η φ
λ(n− 1).
But this is precisely the condition that follows from (21). This shows that the suggested distribution µ is
indeed the (unique) invariant distribution of the process. To complete the proof of the lemma, we simply
need to rely on the fact that (21) involves a full factorization across links. This implies that the probability
that any particular node i has degree k is given by the Binomial expression β(k) =(n−1k
)pk(1 − p)n−k−1,
with p =(
2 η φλ(n−1)
)and hence an average degree z =
(2 η φλ
), which is the desired conclusion
Proof of Lemma 3
It is a standard result in statistics that, for a fixed average value z, the limit of Binomial distributions
converge to a Poisson distribution where the probability that any particular node i has degree zi = k is
given by ψ(k) = e−zzk
k! . It is also well-known from the classical Erdos-Renyi theory of random networks (see
e.g. Bollobas, B. [1985] (2001), Chapter 5) that the giant component of an asymptotically large Binomial
network has a giant component of limit fractional size that is positive if, and only if, its expected degree
exceeds unity, in which case its diameter grows logarithmically with network size. In view of 11, the proof
is thus complete.
Proof of Lemma 4
Recall that Φ( z ; α), as defined in (12), embodies the limit conditional linking probability of an arbitrarily
large Binomial random network with expected degree z, under a level of geographical cohesion given by α.
Assume z < 1 and α ≤ 1. This has direct implications on the aforementioned linking probability in view
of (a) the upper bound (19) on it established in Lemma 1; (b) the characterization for the finiteness of
the Riemann Zeta Function ζ(α) given in (17); (c) the characterization for the fractional size of the giant
component established by Lemma 3. Combining all of the above, it follows that the conditional linking
probability converges to zero as n→∞, i.e. Φ( z ; α) = 0, as desired.
33

Proof of Lemma 5
By virtue of Lemma 3, the set of z-configurations may be partitioned into two classes: those with z ≤ 1
and those with z > 1.
For the first case, z ≤ 1, it is clear that there must be a positive fraction of nodes/agents that have fewer
than two links. Those agents are not connected to at least one of their geographically adjacent neighbors
on the underlying ring. Hence they will form a link if given the opportunity to do so with such a potential
partner. Since it is here assumed that α > 1, such linking opportunity arrives with positive probability,
which entails a conditional linking probability that is on average positive and hence induces Φ( z ; α) > 0.
For the second case, z > 1, the giant component has a positive fractional size, even as n→∞. There is,
therefore, a positive fraction of agents who can connect to an equally positive fraction of individuals if they
are not already connected to them. For such configurations, the probability that a linking opportunity arrives
to an agent who can be in turn materialize it into a new link is positive. This again implies Φ( z ; α) > 0
and completes the proof.
Proof of Proposition 1
For any given α, let F (z) ≡ η Φ(z; α)− z2 define the (one-dimensional) vector field governing the dynamical
system (14).
If α > 1, Lemma 5 implies that z = 0 does not define a zero of the vector field F (·) and hence is not an
equilibrium. Thus the desired conclusion trivially follows.
Instead, when α ≤ 1, F (0) = 0 and therefore we are interested in evaluating the derivative F ′(z). From
Lemma 4, F (z) = −1
2z for all z ≤ 1, which implies:
F ′(0) = −1
2< 0
This confirms the asymptotic instability of the equilibrium configuration at z = 0 and completes the proof.
Proof of Proposition 2
Given some z0, consider any arbitrarily large value z. Let $ ≡ min{
Φ(z, α) : z ≤ z}
. Since α > 1, we
know by Lemma 5 that Φ(z, α) > 0 for all z ≥ 0, and hence $ > 0. Choose η such that η $ > z/2. Then, if
η ≥ η, we have:
∀z ≤ z, η Φ(z, α) > z/2, (23)
which implies that z∗(z0, η) ≥ z, where z∗(z0,η) is the limit equilibrium configuration defined in the statement
of Corollary 1. This completes the proof.
Proof of Proposition 3
Consider any given α > 1. By the same argument used in the proof of Lemma 5, there exists some z1
34

and z2 (1 < z1 < z2) and ϑ > 0 such that
∀α ≤ α, ∀z ∈ (z1, z2), Φ(z, α) > ϑ. (24)
This then implies that we can choose some η such that, if η ≥ η, then
∀α ≤ α, ∀z ∈ (z1, z2), Φ(z, α) >1
2ηz.
Fix now z1 and z2 as above as well as some α ≤ α. For any given θ > 0, define the ray of slope θ as the
locus of points rθ ≡{
(z, y) ∈ R2 : y = θz, z ≥ 0}
. We shall say that rθ supports Φ(·, α) on [0, z2] if
∀z ∈ [0, z2], Φ(z, α) ≥ θ z
and the above expression holds with equality for some z ∈ [0, z2], i.e.
Φ(z, α) = θ z. (25)
Now note that, by Lemma 4 and the continuity of Φ(·), there must exist some α > 1 with α ≤ α such that,
if 1 < α ≤ α the (unique) ray rθ′ that supports Φ(·, α) on [0, z2] has its slope θ′ satisfy
θ′ z2 < ϑ. (26)
By (24) and (26), it follows that any value z satisfying θ′ z = Φ(z, α) must be such that z < z1. Indeed,
since it is being assumed that α > 1, it must also be the case that z > 0.
Make now η′ =1
2θ′. For such value η′, the we may identify z∗(0, η′) with the lowest average degree z for
which (25) holds. As mentioned, it can be asserted that
0 < z∗(0, η′) < z1 (27)
where z1 is chosen as in (24).
Now consider any η′′ = η′ + ε for any arbitrarily small ε > 0. Then we have:
∀z ∈ [0, z2], Φ(z, α) >1
2η′′z. (28)
But, since Φ(·) ≤ 1, there must exist some z′′ such that
η′′ Φ(z′′, α) =1
2z′′. (29)
And again, if we identify z∗(0, η′′) with the lowest value of z′′ for which (29) holds. Then it follows from (28)
that z∗(0, η′′) ≥ z2. This establishes that the function z∗(·) displays an upward right-discontinuity at η′ and
completes the proof of the first statement of the result. The second statement can be proven analogously.
35

Appendix B
Simulation algorithm
Here we describe in detail the algorithm that is used to implement in Subsection 4.2 the discrete-time
equivalent of the continuous-time dynamics posited by our theoretical framework. This is the approach used
both for Algorithm P and for the simulations described in Figure 4.28
The implementation proceeds in two successive steps, which are repeated until certain termination criteria
are met. The first step selects and implements a particular adjustment event (which can be either an invention
draw or a link destruction) and the second step checks whether or not the system has reached a steady state.
As mentioned, we normalize the rate of link destruction to λ = 1. Thus the free parameters of the model
are η, α, and µ. The state of the network at any point in the process is characterized by the n×n dimensional
adjacency matrix A. A typical element of it, denoted by a(i, j), takes the value of 1 if there exists an active
link between the nodes i and j, and it is 0 otherwise. L denotes the total number of active links in the
network. By construction, L has to equal twice the number of non-zero elements in the state matrix A.
We now describe systematically each of the steps the algorithm. The algorithm runs in discrete steps
but its formulation is intended to reflect adjustments that are undertaken in continuous time. Hence only
one adjustment takes place at each step (either a new link is created or a preexisting link is destroyed), with
probabilities proportional to the corresponding rates. Some given A, characterizes the initial state, which
can be either an empty network (with A containing only zeros), or some other network generated in some
pre-specified manner.
• Step I: At the start of each simulation step, t = 1, 2, ..., an adjustment event is randomly selected:
This event can be either an invention draw or a link destruction. As explained, the two possibilities are
mutually exclusive. The rates at which either of the two events occur are fixed and equal to λ per link
and η per node. Every node in the network is equally likely to receive an invention draw. Similarly,
all existing links are equally likely to be destructed. Hence the flow of invention draws and destroyed
links are respectively given by η n and λL. This implies that the probability of some invention draw to
occur is ηnηn+λL whereas some link destruction occurs with the complementary probability. Depending
on the outcome of this draw, the routine proceeds either to Step A.1. (invention draw) or Step B.1.
(link destruction)
– A.1. The routine starts by selecting at random the node i ∈ N that receives the project draw. All
nodes in the network are equally likely to receive the draw, so the conditional selection probability
for a particular node is 1/n. Having completed the selection, the algorithm moves to A.2.
– A.2. Another node j ∈ N (j 6= i) is selected as potential “partner” of i in carrying out the
project. The probability pi(j) that any such particular j is selected satisfies pi(j) ∝ d(i, j)−α.
This can be translated into an exact probability pi(j) = B × d(i, j)−α by applying the scaling
factor B =(∑
j 6=i∈N d(i, j)−α)
derived from the fact that∑j 6=i∈N pi(j) = 1. The algorithm
then moves to A.3.28The FORTRAN code implementing the algorithm is available upon request.
36

– A.3. If a(i, j) = 1, there is already a connection in place between i and j. In that case, the
invention draw is wasted (by L2 in Subsection 3.2.3), and the algorithm proceeds to Step II. If,
instead, a(i, j) = 0 the algorithm proceeds to A.4.
– A.4. In this step, the algorithm examines whether or not it is admissible (given L1 in Subsection
3.2.3) to establish the connection between i and j. First, it checks whether i and j are geographic
neighbors, i.e. d(i, j) = 1. If this is the case, the link is created and the step ends. Otherwise,
it computes the current network distance between i and j, denoted δA(i, j). This distance is
obtained through a breadth-first search algorithm that is described in detail below. If it is found
that δA(i, j) ≤ µ then the link ij (= ji) is created and the corresponding elements in the adjacency
matrix A, a(i, j) and a(j, i) are set equal to 1. Instead, if δA(i, j) > µ, the link is not created. In
either case, Step A.4 is ended. At the completion of this step, the algorithm proceeds to Step II.
– B.1. If the event selected in Step I involves a link destruction, the algorithm randomly picks one
of the existing links in the network and dissolves it. The state matrix is updated accordingly by
setting a(i, j) and a(j, i) both equal to 0. All existing links in the network are equally likely to
be destructed. Thus, for a specific link the probability of being selected is L−1. Once the link
destruction process is completed, the algorithm moves on to Step II.
• Step II: If we start with an empty network (with A containing only zeros) and let the two forces -
invention and volatility - operate, then the network gradually builds up structure and gains in density.
If this process is run long enough, eventually, the network attains its equilibrium. An important
question in this context is, when to terminate the simulation? Or put differently, how can we find out
that the system has reached a stationary state? Step II of the algorithm is concerned with this issue.
Strictly speaking, the equilibrium of the network is characterized by the constancy of all the endogenous
variables. That is, in equilibrium, the structure of the network, as measured for instance by the average
connectivity, remains unchanged. However, a computational difficulty arises from the random nature of
the processes involved. Link creation and destruction are the result of random processes, which imply
the constancy of the endogenous variables only in expectations. In other words, each adjustment step
leads to a change in the structure of the network, and consequently, the realization of each of the
endogenous outcomes fluctuate around a constant value. To circumvent this difficulty, the algorithm
proceeds as follows:
– C.1. At the end of each simulation step t , the routine computes (and stores) the average connec-
tivity prevailing in the current network as z(t) = 2×L(t)N .
– C.2. Every T steps it runs an OLS regression of the T most recent values of z on a constant and
a linear trend.
– C.3. Every time the slope coefficient changes its sign from plus to minus, a counter n is increased
by 1.
Steps I and II are repeated until the counter n exceeds the predetermined value of n. For certain
parameter combinations, mainly for those that imply high and globalized interaction, the transition process
towards the equilibrium can be very sticky and slow. For that reason and to make sure that the algorithm
does not terminate the simulation too early we set T = 5× 10⁵, T = 104 and n = 10.
37

Breadth-first search algorithm: In Step A.4. we use a breadth-first search algorithm to determine if,
starting from node i, the selected partner node j can be reached along the current network within at most
µ steps. The algorithm is structured in the following step-wise fashion:
• Step m = 1: Construct the set of nodes which are directly connected to i, Formally, this set is given
by X1 = {k ∈ N : δA (i, k) = 1}. Stop the search if j ∈ X1 otherwise proceed to Step m = 2
• Step m = 2, 3, ... For every node k ∈ Xm−1 construct the set Vk = {k′ ∈ N \ {i} : δA (k, k′) = 1}.Let Xm be the union of these sets with all the nodes removed which are already contained in Xm−1.
Formally: Xm =
{ ⋃k∈Xm−1
Vk
}\ Xm−1. By construction, all nodes k′ ∈ Xm are located at geodesic
distance m from the root i, i.e. δA (i, k′) = m, ∀k′ ∈ Xm. Moreover, all elements in Xm are nodes that
were not encountered in any of the previous 1, 2, ...,m − 1 steps. Stop the search if (a) j ∈ Xm, (b)
m = µ, or (c) Xm = ∅, otherwise proceed to Step m + 1. In Case (a), Node j has been found within
distance µ ≤ µ. In Case (b), continuation of the search is of no use as δA (i, j) > µ, in which case the
creation of the link ij cannot rely on a short social distance. Finally, in Case (c), no new nodes are
encountered along the search, which implies that i and j are disconnected from each other.
The above-described search proceeds until Case (a), (b), or (c) occurs.
Computation of the variables of interest: In the text, our discussion focuses on the outcomes
obtained in the simulations for two endogenous variables: the average connectivity of the network (Figures
5, 7, and 8) and the effective probability of link creation (Figure 4). They are computed as follows.
1. To compute the average connectivity of the network we simulate the equilibrium of the system for
t = 1, 2, ...t, with t = 5× T , steps and take the average of z(t) over all t realizations.
2. The effective probability of link creation is computed as the ratio of the number of invention draws
which lead to a successful link creation to the total number of invention draws obtained in t simulation
steps.
References
[1] Ali, S. N. and D.A. Miller (2016): Ostracism and Forgiveness. American Economic Review 106, 2329-48.
[2] Apostol, T. A. (1974): Mathematical Analysis, Addison-Wesley Pub. Co., Reading, Ma,
[3] Arribas, I., F. Perez and E. Tortosa-Ausina (2009): “Measuring globalization of international trade:
theory and evidence,” World Development 37, 127-145.
[4] Banfield, E.C. (1958): The Moral Basis of a Backward Society, New York: The Freepress.
[5] Barabasi, A.-L. and R. Albert (1999): “Emergence of scaling in random networks,” Science 286,
509-12.
38

[6] Benaım, M. and J. Weibull (2003): “Deterministic approximation of stochastic evolution in games,”
Econometrica 71, 873-903.
[7] Bendor, J. and D. Mookherjee (1990): “Third-party sanctions, and cooperation,” Journal of Law,
Economics, and Organization 6, 33-63.
[8] Benoit, J-P and V. Krishna (1985): “Finitely Repeated Games,” Econometrica 53, 905-922
[9] Bisin, A. and T. Verdier (2001): “The economicsof cultural transmission and the dynamicsof prefer-
ences,” Journal of Economic Theory 97, 289-319.
[10] Bollobas, B. [1985] (2001): Random Graphs (2nd. Edition), Cambridge (U.K.): Cambridge University
Press.
[11] Borensztein, E., J. de Gregorio, and J.-W. Lee (1998): “How does foreign direct investment affect
economic growth?,” Journal of International Economics 45, 115-135.
[12] Burt, R. S. (1992): Structural Holes: The Social Structure of Competition, Cambridge: Harvard Uni-
versity Press.
[13] Centre for the Study of Globalisation and Regionalisation (2004): The CSGR Globalisation Index,
http://www2.warwick.ac.uk/fac/soc/csgr/index/.
[14] Coleman, J. S. (1988): “Social Capital in the Creation of Human Capital,” American Journal of Soci-
ology 94, 95-120.
[15] Coleman, J. S. (1990): Foundations of Social Theory , Cambridge, MA: Harvard University Press.
[16] Dixit, A. (2003): “Trade Expansion and Contract Enforcement,” Journal of Political Economy 111,
1293-1317.
[17] Dollar D. and A. Kraay (2004): “Trade, Growth, and Poverty,” Economic Journal 114, F22-F49.
[18] Dreher, A. (2006): “Does globalization affect growth?”, Evidence from a new index of globalization,
Applied Economics 38, 1091-1110.
[19] Dreher, A., N. Gaston and P. Martens (2008): Measuring Globalization: Gauging its Consequences,
New York: Springer .
[20] Duernecker, G. and F. Vega-Redondo (2015): ”Social Networks and the Process of Globalization”
Working Paper, University of Mannheim and Bocconi University.
[21] Duernecker, G., M. Meyer and F. Vega-Redondo (2015): “Being Close to Grow Faster: A network-based
empirical analysis of economic globalization,” Working Paper, World Bank, University of Mannheim and
Bocconi University.
[22] Durrett, R. (2007): Random Graph Dynamics, Cambridge: Cambridge University Press.
[23] Erdos, P. and A. Renyi (1959): “On random graphs I,” Publicationes Mathematicae Debrecen 6, 290-297.
39

[24] Fagiolo, G., J. Reyes, and S. Schiavo (2010): “The evolution of the World Trade Web,” Journal of
Evolutionary Economics 20, 479-514.
[25] Freidlin M.I. and A.D. Wentzell (1984): Random Perturbations of Dynamical Systems, Berlin: Springer.
[26] Galeotti, A. and B. W. Rogers (2013):“Strategic immunization and group structure,” American Eco-
nomic Journal: Microeconomics 5, 1-32).
[27] Gambetta, D. (1988): Trust: Making and breaking cooperative relations, Oxford: Basil Blackwell.
[28] Granovetter, M. (1973): “The strength of weak ties,” American Journal of Sociology 78, 1360-1380.
[29] Greif, A. (1993): “Contract enforceability and economic institutions in early trade: the Maghribi traders’
coalition,” American Economic Review 83, 525-48.
[30] Jackson, M., T. Rodriguez-Barraquer and Xu Tan (2012): “Social capital and social quilts: network
patterns of favor exchange,” American Economic Review 102, 1857-97.
[31] Jackson, M. and Leeat Yariv (2011): “Diffusion, strategic interaction, and social structure,” in Benhabib,
J., A. Bisin, M. O. Jackson (eds.), Handbook of Social Economics, Amsterdam: North Holland Press.
[32] Kali, R. and L. Reyes (2007): “The architecture of globalization: a network approach to international
economic integration,” Journal of International Business Studies 38, 595-620.
[33] Lane, P. and G. M Milesi-Ferretti (2001): “The external wealth of nations: measures of foreign assets
and liabilities for industrial and developing countries,”Journal of International Economics 55, 263-94.
[34] Lippert, S. and G. Spagnolo (2011): “Networks of relations, word-of-mouth communication, and social
capital,” Games and Economic Behavior 72, 202-217.
[35] Lopez-Pintado, D. (2008): “Diffusion in complex social networks,” Games and Economic Behavior 62,
573-590.
[36] Marsili, M. and F. Vega-Redondo (2016): “Networks emerging in a volatile world,” mimeo, International
Center for Theoretical Physics (Trieste) and Bocconi University (Milan).
[37] Karlan, D., M. Mobius, T. Rosenblat, and A. Szeidl (2009): “Trust and Social Collateral,” Quarterly
Journal of Economics 124, 1307-1331.
[38] Newman, M. (2003): “The stucture and function of complex networks,” SIAM Review 45, 167-256.
[39] Okuno-Fujiwara, M., and A. Postlewaite (1995): Social norms and random matching games. Games
and Economic Behavior 9, 79-109.
[40] Platteau, J. P. (2000): Institutions, Social Norms, and Economic Development, Amsterdam: Hardwood
Academic Publishers and Routledge.
[41] Powell, W.W., D. R. White, K. W. Koput, and J. Owen-Smith (2005): “Network dynamics and field
evolution: the growth of inter-organizational collaboration in the life sciences,” American Journal of
Sociology 110, 1132-1205.
40

[42] Reagans, R.E. and E.W. Zuckerman (2008): “Why knowledge does not equal power: the network
redundancy trade-off,” Industrial and Corporate Change 17, 903-944.
[43] Sala-i Martin, X., G. Doppelhofer, and R. I. Miller (2004): “Determinants of Long-Term Growth: A
Bayesian Averaging of Classical Estimates (BACE) Approach,” American Economic Review 94, 813-
835.
[44] Sandholm, W. H. (2003): “Evolution and equilibrium under inexact information,” Games and Economic
Behavior 44, 343-378.
[45] Sandholm, W. H. (2010): Population Games and Evolutionary Dynamics, Cambridge: MIT Press.
[46] Sinan, A. and M. van Alstyne (2010): ”The diversity-bandwidth tradeoff,” American Journal of Soci-
ology, 117, 90-171.
[47] Tabellini, G. (2008): “The scope of cooperation: values and incentives,” Quarterly Journal of Economics
123, 905-950.
[48] Trajtenberg, M. and A. Jaffe (2002): Patents, Citations and Innovations: A Window on the Knowledge
Economy, Cambridge, Mass.: MIT Press.
[49] OECD (2005a): Measuring Globalisation: OECD Handbook on Economic Globalisation Indicators, June
2005.
[50] OECD (2005b): Measuring Globalisation: OECD Economic Globalisation Indicators, November 2005.
[51] Uzzi, B. (1996): “The sources and consequences of embeddedness for the economic performance of
organizations: the network effect, American Sociological Review 61, 674-698.
[52] Vedres, Balazs and David Stark (2010): “Structural folds: generative disruption in overlapping groups,”
American Journal of Sociology 115, 1150-1190.
[53] Vega-Redondo F. (2006): “Building up social capital in a changing world,” Journal of Economic Dy-
namics and Control 30, 2305–2338.
[54] Vega-Redondo, F. (2007): Complex Social Networks, Econometric Society Monograph Series, Cam-
bridge: Cambridge University Press.
41