social participation: how does it vary with illness ... · social participation: how does it vary...
TRANSCRIPT
Social Participation: How does it vary with illness, caring and ethnic group?
Lucinda Platt
ISER Working Paper 2006-18
Acknowledgement: Crown copyright material is reproduced with the permission of the Controller of HMSO and the Queen’s Printer for Scotland. I am grateful to the Home Office for permission to use the Citizenship Survey 2001 (Home Office, 2003) and to the UK Data Archive at the University of Essex for making it available. Neither the Home Office nor the Data Archive, however, bear any responsibility for the analysis presented here. I am grateful to participants at the CRSP seminar at the University of Loughborough and the Cardiff Social Stratification conference, who gave valuable feedback on earlier versions of this paper. I am also grateful to the University of Essex for funding my participation at the Cardiff conference. The paper was started while I was a visitor at DIW Berlin and completed during a visit to CASE at the London School of Economics. I am grateful to both institutions for their hospitality. The research presented here was initiated as part of a Joseph Rowntree Foundation funded project into long-term illness, ethnicity and poverty. I am grateful to the JRF for their support, and to colleagues in the project, in particular Sarah Salway, for helpful comments on drafts of this paper.
Readers wishing to cite this document are asked to use the following form of words:
Platt, Lucinda (May 2006) ‘Social Participation: How does it vary with illness, caring and ethnic group?’, ISER Working Paper 2006-18. Colchester: University of Essex.
The on-line version of this working paper can be found at http://www.iser.essex.ac.uk/pubs/workpaps/ The Institute for Social and Economic Research (ISER) specialises in the production and analysis of longitudinal data. ISER incorporates
MISOC (the ESRC Research Centre on Micro-social Change), an international centre for research into the lifecourse, and
ULSC (the ESRC UK Longitudinal Studies Centre), a national resource centre to promote longitudinal surveys
and longitudinal research. The support of both the Economic and Social Research Council (ESRC) and the University of Essex is gratefully acknowledged. The work reported in this paper is part of the scientific programme of the Institute for Social and Economic Research. Institute for Social and Economic Research, University of Essex, Wivenhoe Park, Colchester. Essex CO4 3SQ UK Telephone: +44 (0) 1206 872957 Fax: +44 (0) 1206 873151 E-mail: [email protected] Website: http://www.iser.essex.ac.uk
© May 2006 All rights reserved. No part of this publication may be reproduced, stored in a retrieval system or transmitted, in any form, or by any means, mechanical, photocopying, recording or otherwise, without the prior permission of the Communications Manager, Institute for Social and Economic Research.

ABSTRACT It has long been accepted that lack of social participation in wider society is one aspect or one definition of poverty. Current concerns with the extent and distribution of social capital as both a measure of a good society and as means to upward mobility also emphasise the importance of social contacts and networks to the well-being of individuals and communities. While research has often focused on ‘civic participation’ and the measurement of trust, more informal social bonds are also a crucial part of individuals’ social capital. Moreover, informal social capital or social participation might be particularly important for those whose circumstances make them already more vulnerable to marginalisation, exclusion or poverty. For example, social interaction has been argued to be conducive to better outcomes for those with health problems; and there is an extensive literature which aims to chart and explain the role of ‘ethnic capital’ in the life chances of minority ethnic groups. I use the British Home Office Citizenship Survey 2001 for England and Wales to explore the impact on four aspects of lack of social engagement of long-term illness, caring for someone with such an illness, and ethnicity. Controlling for a range of characteristics and examining the relationships separately for men and women there is evidence that between them, the four measures reveal an underlying propensity for reduced social contact. Other things being equal, illness has little association with reduced social participation, but caring does seem to affect opportunities for sociability. Members of some ethnic groups are less likely to engage in neighbourly social visiting than others, and these differences are little affected by income level. By contrast differences in ‘going out’ across groups can largely be explained by differences in income. Overall, social engagement among male Bangladeshis and to a lesser extent Pakistanis is high, whereas Black Africans and Black Caribbeans, especially women, are notable for their lack of opportunities for social engagement compared with their otherwise similar peers. They would appear to be particularly at risk of social isolation, with consequences for their current and future welfare.
NON-TECHNICAL SUMMARY It has long been accepted that lack of social participation in wider society is one aspect or one definition of poverty. Current concerns with the extent and distribution of ‘social capital’ as both a measure of a good society and as means to upward mobility also emphasise the importance of social contacts and networks to the well-being of individuals and communities. This paper explores levels of social engagement within the population of England and Wales, and how that social participation varies according to whether an individual experiences a long term illness or has caring responsibilities and according to their ethnic group. It explores the experience of men and women separately. It uses four measures of social engagement or participation and examines patterns across the individual measures, as well as investigating the chances of experiencing none of them or all of them, and how such chances vary with illness, caring and ethnic group. Results show that there is variation in patterns of social participation by illness, caring and ethnic group. The variation according to illness can be largely explained by differences in available income, as well as in qualifications and age, among those with and without a long-term illness. The implication is that a focus on opportunities for older people, on raising the qualifications levels of disabled and chronically ill people, and on improving their income levels is likely to improve the social contact of those with a long-term illness. On the other hand, carers, particularly male carers, seem to have more constraints on their social activity. While some of this can be attributed to lower incomes among carers, caring responsibilities in their own right can divorce people from extensive social engagement. Greater specific support for carers and enhancing their opportunities for social engagement may be of direct relevance for this group. Ethnic groups showed great variation in their patterns of social participation, with rates of reciprocal neighbourly visiting high among Bangladeshi men, for example, and the use of organised activities greater among Black Africans. The situation of Bangladeshi and to a lesser extent, Pakistani men, indicated that they had good sources of social contact, compared with those from other ethnic groups with similar characteristics. This indicates that they foster sources of social capital which may be important for the community as a whole and for subsequent generations as well as for current individuals’ well-being. However, the most notable difference to emerge was the particular position of Black African and Black Caribbean women. Women from these groups were at much less likely to enjoy opportunities for social activity than otherwise comparable women from other ethnic groups or than men. They were also much more likely to experience none of the four forms of social participation than those with a long-term illness and caring responsibilities. Further research might be able to illuminate this finding and whether these women draw on alternative forms of social support not covered here. Meanwhile, it suggests that if we are to take seriously the potential benefits of social contact and social support, and the role of lack of participation as a form of deprivation, then we should be concerned to engage with such women to understand ways in which their opportunities for sociability can be enhanced or supported.

Introduction Participation at an acceptable level in society, including social participation, has been a widely accepted element of the definition of poverty since at least Townsend’s seminal (1979) study of poverty, even if the measurement of such participation remains a more contested issue (Platt, 2006). Lack of ‘normal’ social participation can therefore be considered an element of deprivation either alongside or regardless of levels of income. Thus recent studies of deprivation have generally included some measures of social exchange and activity, such as having friends round, giving presents and so on, alongside more strictly functional lacks, such as damp housing or inadequate clothing (Mack and Lansley, 1985; Gordon and Pantazis, 1997; Nolan and Whelan, 1996; Gordon et al., 2000). Typically, however, in such studies the measures of deprivation are summed in some way to produce an overall measure of deprivation. The summing means that different forms of deprivation are equated, even where some grouping (as in Nolan and Whelan, 1996) is involved, and it is the score resulting from the summing that is considered important rather than its specific components. There may, however, be good reasons for examining different aspects of deprivation separately, even when they are part of a similar cluster (Capellari and Jenkins, 2004). In this case the focus is on different aspects of social engagement or ‘sociability’. The paper uses multivariate analysis of the British Home Office Citizenship Survey 2001 of England and Wales to examine the characteristics associated with four distinct measures of social engagement, and to explore whether the results support the idea of some underlying propensity to lack of sociability for which all four measures act as indicators. The four measures are derived from the survey questions best placed to capture different sorts of activity that might be considered important elements of ‘normal’ social participation. Such activities are having friends and neighbours round, visiting friends and neighbours, involvement in some form of organised activity or ‘club’, and going out for a social reason. These are considered as potentially distinct aspects of sociability, though in the final analysis the chances of lacking all four forms of social engagement, or none, are examined. The aim of this paper is to describe and analyse patterns of sociability among those for whom lack of social engagement might have particularly significant consequences: those with a long-term health problem, those caring for someone with a health problem, and those from minority ethnic groups. In all these cases, risks of other forms of deprivation tend to be higher, and the relevance of strong social networks has been stressed. Typically in deprivation analysis, the measure of deprivation is validated in relation to income. That is, the lack is only considered to constitute deprivation if it occurs where income levels are also low. The reason for this is to avoid the fact that people may lack apparent necessaries through preference rather than constraint. However, the logic of deprivation measures is that they constitute deprivation regardless of income and that their rationale is to present an alternative to income measurement. More particularly, it may well be interesting to explore different aspects of deprivation in their own right, for their potential impact on an individual’s well-being and life chances. One such area of potential deprivation is in the area of social engagement. Sociability can be deemed to be, like health or educational opportunities, an important aspect of well-being. Constraints on such social engagement can thus contribute to, as well as stem from, social exclusion. The attention paid to social capital has emphasised the importance of social networks and social contact in creating both individual and public welfare or advantage. While Bourdieu’s (1997) perspective on social capital emphasises the maintenance of networks for individual advantage and retention of privileged social position, Putnam’s (1995, 2000) interpretation and analysis emphasises the significance of social capital for the effective functioning of communities and society as a whole.

Recently, British policy circles have been highly receptive to the importance of promoting social capital, based on the idea that increasing levels of social contact can enhance communities and the public good, while loss of social networks leads to or is equated with social exclusion (Aldridge and Halpern, 2002; Office for National Statistics [ONS], 2001). The concept of the individual advantage to be gained from social capital is combined with the notion that improving the level of social capital within communities will produce public goods. Accompanying this interest, tangible measures of such social capital have been identified across the range of British social surveys (see http://www.statistics.gov.uk/socialcapital/).i As has been pointed out, such a focus on social capital and its creation presents a relatively costless (as well as possibly nebulous) answer to society’s ills (Portes, 1998; Loizos, 2000), which makes its contemporary attractiveness for government especially comprehensible (see the discussion of this point in ONS, 2001; Aldridge and Halpern, 2002). It also risks losing sight of the potentially disadvantageous effects of social capital formation – either for the individual enmeshed in tight social bonds that restrict their upward mobility or via the use of networks to promote the exclusion of others (Portes, 1998; Lin, 2001). The description and analysis of different forms of social contact are of empirical interest and have implications for the future application and potential success of policies based on promoting social capital. As the authors of the Performance and Innovation Unit survey of social capital conclude: ‘Social capital should be seen as giving policymakers useful insights into the importance of community, the social fabric and social relations at the individual, community and societal level. As such, it can open up a range of new policy levers but it is not a simple or single magic bullet for solving all policy problems’ (Aldridge and Halpern, 2002: 73; see also the similar claims made by Schuller, Baron and Field, 2000). It is to insights such as this that this paper aims to contribute. Much of the British literature on the measurement of social capital has focused on a small number of the aspects potentially associated with social capital (see Note i): that is, on measures of ‘civic participation’ or associational membership and trust (Duffy, 2004; Li et al, 2002; Li et al, 2003; Warde et al, 2003; Pennant, 2005). However, the importance of other elements of social capital, such as ‘coffee shop culture’, and their possible replacement of more traditional forms of participation have also been the subject of recent research (Laurier and Philo, 2005); and Ruston’s 2003 time-use study examined socialising as a contrasting activity to formal volunteering and helping. The sorts of activity that are the focus here – reciprocal visiting, participation in more organised activities such as clubs or volunteering, as well as simply going out – can be linked to the kinds of informal associative activity emphasised by Coleman (1988), who saw social capital formation primarily as a consequence of activities pursued for other purposes. These measures also, however, overlap with measures of civic participation as more formally conceived in the existing literature and as emphasised in Putnam’s work. In fact, Putnam’s (2000) index of social capital includes among its 14 components two measures of informal sociability. All 14 are argued to be highly intercorrelated; but, as noted above, the appropriateness of using such correlations to develop a single index derived from multiple and diverse measures is open to question. Some analysis of social capital, often following a particular interpretation of Putnam, emphasises it as a property of communities rather than individuals (see, for example, McKenzie et al, 2002). However, such approaches have a greater danger of circularity in arguing from causes to effects (Portes, 2000), and have also been argued to have little to say about health outcomes (Veenstra, 2000). Moreover, there is a well-established tradition of interpreting social capital as a property of individuals or families (Bourdieu, 1997). It is such an individual level approach that we adopt here, which also links it more closely to the deprivation
literature discussed and to more traditional understandings of the relationship between health and social support, considered further below. The measures used in this paper are also inclined towards the sorts of activity that may be more closely linked to within-community stability than to upward mobility per se, and thus to be more likely to be associated with some of the negative potential of social capital (Schuller, Baron and Field, 2000). Three of the sociability measures may sustain – or represent – bonding rather than bridging, social capital (in Putnam’s terms) or less efficacious ‘strong’ rather than more advantageous ‘weak’ ties (Granovetter, 1973; see also Lin, 2001). It is thus of interest to identify the extent to which such close bonding occurs across groups and what particular patterns it assumes. Does the evidence support hypotheses about the existence of self-sufficient and close-knit local communities? In the existing literature, it is the impact of social capital on outcomes – whether social capital does indeed seem to function as a form of ‘capital’ that repays investment with interest – that has been addressed. Instead of considering social capital as of value merely in terms of future returns, social contact and networks could be deemed to have intrinsic value for current welfare. This is the approach adopted in this paper, and is consistent with the previously stated claim that lack of opportunities for sociability constitutes a form of deprivation and is an important component of social exclusion, despite being largely neglected in the social exclusion literature. The paper thus describes patterns of social activity and their variation across groups and individuals, focusing on forms of social contact that can perhaps best be described as aspects of ‘sociability’, and examining them in relation to those with a long-term health problem, carers and those from different ethnic groups. This means we can observe the differences in ‘current consumption’ of such social goods, with a discussion of the further potential implications of such variation in the concluding comments. The role of networks and contact for minority ethnic groups specifically has been subject to academic and policy attention. Both the meaning of ‘ethnic capital’ – as human or social capital,or both – and its potential role in both aiding or inhibiting upward mobility or integration within society have been debated (Borjas, 1992; Esser, 2005). Underlying much of the discussion has been an assumption of relatively close ties within groups – yet the extent to which this is reflected in patterns of social activity remains open to empirical investigation. In this study it is not possible to distinguish the forms of activity in terms of whether they are with members of the same community or not; nevertheless, analysing the amount of contact across various measures will still inform us about the levels and routes of social capital generation by ethnicity and aid the development of theory in relation to the role of such capital in Britain’s ethnic groups’ outcomes. The report on the 2003 and 2001 Citizenship Surveys and the recent release of findings from the 2005 survey summarised some of the variables on social activity (Attwood et al., 2003; Green et al., 2004; Murphy et al., 2005). However, these breakdowns did not take account of the complex factors that might shape or mediate these patterns of social activity. Little attention was paid to illness and caring, even though ill-health and caring responsibilities might be expected to shape the possibilities and patterns of social contact to a very large extent.ii And though ethnic group results were presented for a number of different measures, these did not go beyond simple tabulations. It is therefore of immediate interest to investigate ethnic group differentials taking account of illness and caring as well as of other factors, such as age and family status.

Ill-health, disability and caring may impinge on social participation in a variety of ways (Howard, 2001; Locker, 1983; Parker, 1993). And of course, while one might posit that it is ill-health that reduces participation, the positive aspects of social contact may also have a beneficial impact on the health of those already suffering from a chronic condition (or their absence a negative one). This has been explored in such studies as that by Smith and Midanik (1980) on the role of social support in the recovery of disabled adults, though their results were equivocal. A number of other studies have suggested that social participation and engagement may have a beneficial impact on health, and that social isolation may have a negative one (Berkman, 1984; Berkman et al, 2000; Veenstra, 2000). Whelan (1993) has argued that social support protects against chronic stress consequent on material deprivation, while Cattell (2001) has stressed the complexity of the relationship between poverty, social engagement and health. Once again, then, ascertaining the patterns of social activity by health and caring status and the extent to which these are independent of the financial situation of the sufferer is important to developing our understanding of the negative impacts of ill-health and the productive role of social capital. Moreover, rates of ill-health, disability and caring vary widely across ethnic groups (Nazroo, 1997; Erens et al, 2001). On one level this is unsurprising given that poverty both stems from and contributes to ill-health (Jenkins and Rigg, 2004; Burchardt, 2000) and rates of poverty vary greatly across minority ethnic groups. Those groups with the highest rates of long-term illness – Pakistanis and Bangladeshis – also have the highest poverty rates (Platt, 2002). On the other hand, Black Africans also have extremely high rates of poverty (particularly when relevant characteristics are controlled) but have low rates of long-term ill-health. Stopes-Roe and Cochrane’s (1990) study indicated higher levels of social support in South Asians than in the white British ethnic majority; on the other hand, Pollard et al. (2003) posited that greater levels of coronary heart disease among South Asians might stem from social isolation, though they found little unambiguous support for this proposition. This brings us back to the importance of identifying what the patterns of sociability / isolation are for different ethnic groups, and the potential impact of those patterns on known patterns of health and illness as well as their implications for future health status. It is, then, the distribution of social engagement across individuals, its current and implicit future impacts, and its variation with ill-health, caring and ethnicity, with implications for solidarity, marginalisation or exclusion of vulnerable groups, that this paper aims to shed light on. In the next section I describe the data and the variables and approach in more detail. Subsequent sections discuss the results of the analyses, examining men and women separately. The final section draws some conclusions. Data and methods Data Social engagement and its lack is analysed using the Home Office Citizenship Surveyiii (Home Office, 2003; see also http://www.homeoffice.gov.uk/rds/citizensurvey.html). This is a biennial survey which is explicitly designed to capture information about the involvement of individuals in a range of community and civic activities, their child-rearing practices and sources of information and support, and their experience of their neighbourhood and attachment to it. In this paper, I use the survey for 2001.iv The sampling unit was the individual (rather than the households) and most of the questions relate to the respondent’s own experience, views and perceptions: there is only limited information about the family and household context of respondents. The survey was specifically intended to capture ethnic group differences in ‘citizenship’ and community experiences and therefore, on top of its c. 10 000 person main sample, the design incorporates a booster sample of c. 5 000 members of minority ethnic groups to allow sufficient numbers for ethnic group breakdowns on key variables and for

inclusion of ethnic group in analytical models. Weights were created to adjust for the survey design and for response probabilities. These weights are employed throughout. The focus of this paper is on adult respondents of working age (18-59/64), since long-term health problems are less exceptional among older people, and because I wanted to examine the possibility of variation by employment status. The outcomes for men and women are examined separately throughout the paper, given the wide variation in both health status, caring, and social activity according to sex. This clearly becomes particularly important when examining ethnic group variation. Variables For measuring lack of social engagement I exploit the four questions in the survey that I deemed summarised most effectively different aspects of sociability. I constructed binary variables from the chosen questions to represent deprivation on the measure, i.e. lack of that particular form of social participation. The measures obviously have some limitations – such as the fact that in the original questions the measure of extent of participation is grouped into a limited number of possibilities – and they do not necessarily capture all forms of social engagement. However, between them they allow us both to plot variation in types of social engagement across the groups of interest and, I argue, together they effectively summarise social isolation. The four measures are: • Lack of visiting: whether the respondent goes round to friends or neighbours less often
than once a fortnight; • Lack of being visited: whether the respondent has friends or neighbours over less often
than once a fortnight; • Lack of going out: whether the respondent goes out with friends or neighbours less often
than once a fortnight; and • Lack of organised activities: whether the respondent is involved in ‘clubs’ less often than
once a month or not at all. ‘Clubs’ is here an inclusive term which includes voluntary activities, activities based round a religious centre or focus, as well as organised interest groups.
Patterns of lack of social engagement on these measures are explored by health status and caring and ethnic group for men and women. Multivariate analysis is then used to investigate the associations with each measure introducing a range of control variables. Health status is measured by the response to the question on whether the respondent suffered from a limiting long-term health problem. The aggregation of both the long-term illness and its limiting nature means that it is not possible to investigate the extent to which perception of an illness as limiting is associated with greater or lesser social participation. Caution needs to be exercised in relation to possible systematic differences in self-reporting of illness, including differences by ethnic group as well as sex (see, for example, Curtis and Lawson, 2000). On the other hand, the question is similar to that used in the Census which is widely exploited and self-rated health measures have been found to be relatively robust (Idler and Benyami, 1997), including across ethnic groups (Chandola and Jenkinson, 2000) . Caring is measured by the response to whether the respondent cared for someone within or outside the household with such a limiting long-term health problem. In the 2001 survey the caring question did not distinguish between whether the person cared for lived in or outside the household. Thus where the person was outside the household, this may count for some form of external social contact in its own right. It is not possible to distinguish the sex of the person being cared for.

For ethnic group, the 17-form ethnic group variable was reduced to eight groups in order both to achieve sample sizes suitable for analysis and to provide relatively well-defined categories to work with. The eight categories are white British, Indian, Pakistani, Bangladeshi, Black African, Black Caribbean, Chinese, and Other and Mixed. However, the results for the Chinese are not extensively discussed in what follows given the small counts on which they are based. The combination of the various, numerically small, ‘mixed’ groups with ‘other’ groups results in a residual category that is not inherently meaningful. The seven main categories are not uncontested; nor are they assumed to be homogenous. However, they are regularly employed in analysis as representing aggregations with distinctive histories and displaying diverse outcomes both in absolute terms and which often persist when a range of relevant characteristics are held constant. Whether such diversity extends also to social participation is an empirical question that is investigated here. Characteristics that are known to be relevant to the understanding differences across the main variables, discussed, above, were held constant to allow the comparison of differences between those with otherwise comparable characteristics. These ‘control variables’ were identified and measured in the following way: • age – this is a binary variable which distinguishes between those aged 18-39 and those
aged 40-59/64, since illness and caring are much higher at the older age ranges. In the survey data, age is banded and thus the creation of a distinction between ages was limited by the range of the bands. Nevertheless, this division is consistent with other literature on the prevalence and impact of ill-health and caring.
• the presence of a child aged under 5 years, which could be expected both to limit opportunities for social activity as well as creating opportunities for certain, child-based activity. The presence of pre-school children has often been found to be the crucial indicator for various forms of participation – including labour market participation. It should be noted that this variable is strongly associated with age and thus it is predominantly serving to distinguish the probability of lack of social participation within the younger age group.
• presence of a partner, since being in a relationship could substitute for forms of social participation, as well as potentially enabling access to alternative, additional networks. For this study, partnership includes cohabitation as well as marriage.
• work history. I derived a variable with three categories: whether currently working; whether worked in the past but currently not in employment; and whether never worked. Work is commonly espoused as ‘the best form of welfare’. Some of the justification for the reform of incapacity benefits revolves around the notion that being on sickness benefits is bad for the health and for social relations (as well as for the economy) (Department for Work and Pensions [DWP], 2006). Work could also be regarded as a form of participation in itself: it could be argued that either those in work are more likely to have social contacts, resulting in positive effects on measures of social participation, or that work itself constitutes such a form of social contact, which might result in negative effects on other forms of social participation. It was important to distinguish within the non-working between those who had worked at some time – and might well return – and those who had never worked. Those who had worked in the past might have existing work-based networks to call upon. On the other hand the negative impacts of unemployment on social engagement are well known. By contrast, those who have never worked may have developed alternative sources of social support and contact – or conversely may be among the most isolated. This distinction was felt to be particularly important given that the proportions of those who have never worked varies by ethnic group (for men as well as women).
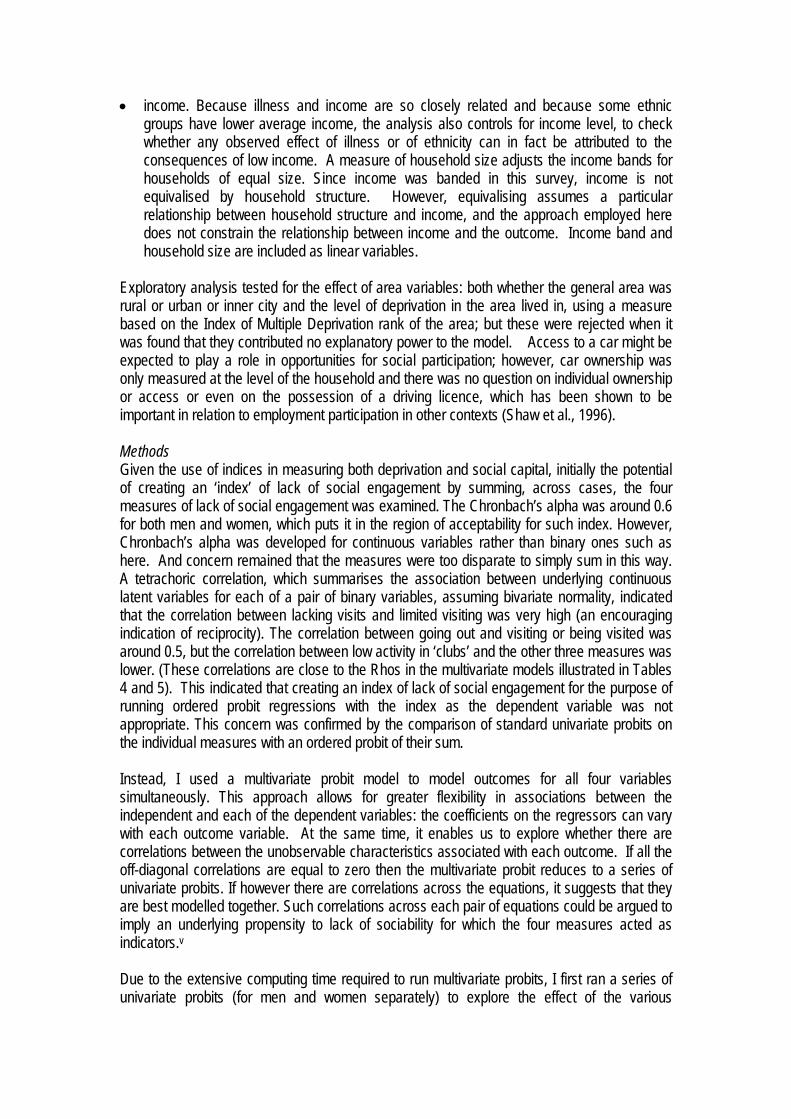
• income. Because illness and income are so closely related and because some ethnic groups have lower average income, the analysis also controls for income level, to check whether any observed effect of illness or of ethnicity can in fact be attributed to the consequences of low income. A measure of household size adjusts the income bands for households of equal size. Since income was banded in this survey, income is not equivalised by household structure. However, equivalising assumes a particular relationship between household structure and income, and the approach employed here does not constrain the relationship between income and the outcome. Income band and household size are included as linear variables.
Exploratory analysis tested for the effect of area variables: both whether the general area was rural or urban or inner city and the level of deprivation in the area lived in, using a measure based on the Index of Multiple Deprivation rank of the area; but these were rejected when it was found that they contributed no explanatory power to the model. Access to a car might be expected to play a role in opportunities for social participation; however, car ownership was only measured at the level of the household and there was no question on individual ownership or access or even on the possession of a driving licence, which has been shown to be important in relation to employment participation in other contexts (Shaw et al., 1996). Methods Given the use of indices in measuring both deprivation and social capital, initially the potential of creating an ‘index’ of lack of social engagement by summing, across cases, the four measures of lack of social engagement was examined. The Chronbach’s alpha was around 0.6 for both men and women, which puts it in the region of acceptability for such index. However, Chronbach’s alpha was developed for continuous variables rather than binary ones such as here. And concern remained that the measures were too disparate to simply sum in this way. A tetrachoric correlation, which summarises the association between underlying continuous latent variables for each of a pair of binary variables, assuming bivariate normality, indicated that the correlation between lacking visits and limited visiting was very high (an encouraging indication of reciprocity). The correlation between going out and visiting or being visited was around 0.5, but the correlation between low activity in ‘clubs’ and the other three measures was lower. (These correlations are close to the Rhos in the multivariate models illustrated in Tables 4 and 5). This indicated that creating an index of lack of social engagement for the purpose of running ordered probit regressions with the index as the dependent variable was not appropriate. This concern was confirmed by the comparison of standard univariate probits on the individual measures with an ordered probit of their sum. Instead, I used a multivariate probit model to model outcomes for all four variables simultaneously. This approach allows for greater flexibility in associations between the independent and each of the dependent variables: the coefficients on the regressors can vary with each outcome variable. At the same time, it enables us to explore whether there are correlations between the unobservable characteristics associated with each outcome. If all the off-diagonal correlations are equal to zero then the multivariate probit reduces to a series of univariate probits. If however there are correlations across the equations, it suggests that they are best modelled together. Such correlations across each pair of equations could be argued to imply an underlying propensity to lack of sociability for which the four measures acted as indicators.v Due to the extensive computing time required to run multivariate probits, I first ran a series of univariate probits (for men and women separately) to explore the effect of the various

explanatory variables on the four outcome measures. The estimates from these univariate models are special cases of the more general multivariate probit model. This exploratory analysis and the key concerns of the study determined which independent variables were included in the final model. These variables have been described above. I then ran multivariate probits for men and women with versions including and excluding income in each case.vi The use of versions including and excluding income was undertaken for two reasons: one practical and one theoretical. Around 29 per cent of adult respondents did not respond to the income question (27 per cent of men and 30 per cent of women). The non-response also varied by ethnic group, with as many as 39 per cent of Pakistani men and 50 per cent of Pakistani women not providing a response. Thus, including income substantially reduced sample sizes and diminished the opportunities for discerning ethnic group effects. By examining models with and without income, therefore, it was possible to identify comparable coefficients across the two, which were insignificant in the income models but where the larger sample sizes from non-income model rendered them statistically significant. At the theoretical level, the interest was in observing the extent to which forms of social engagement – or, rather, its absence – were coterminous with lower incomes. That is, could lower levels of social engagement be explained in terms of financial constraints? By comparing models with and without income it was possible to identify the extent to which the inclusion of income changed the story and modified the impact of some of the key variables of interest and their association with forms of social engagement. In order to clarify the results from the models and to enable comparison by ethnicity, health status and caring, predictions were estimated for outcomes on the different measures of lack of sociability and for the probability of experiencing all or none of them with characteristics held constant and varying only on the focus of interest (ethnicity, or caring and health status). These predicted probabilities illustrate the very different chances and patterns of social contact that men and women from different ethnic groups and with or without ill-health and caring responsibilities can expect to experience. Descriptive statistics Figures 1-3 show the distribution of the key variables within the survey: the prevalence of illness and caring by age, sex, and ethnicity. Figure 1 shows rates of long-term illness and of caring broken down by sex. Unsurprisingly, and consistent with other sources, both increase with age. Rates of illness are fairly equal across the sexes for these two age bands, though slightly lower for women; but women have higher rates of caring. Overall 24 per cent of the working age population in this survey have a long-term illness and nine per cent are carers. Nearly a quarter of the carers have a long-term illness themselves, which means that two per cent of the sample are both ill and caring. In the multivariate analysis the impact of caring and illness are both included to examine the impact of caring controlling for health status (and vice versa). Figure 1: Long term illness and caring by age band and sex, 2001

0
5
10
15
20
25
men women men women
Long-term illness Carer
%
18-39
40-59/64
All adults
Source: Home Office Citizenship Survey 2001, authors’ analysis Notes: weights are used to estimate these proportions. Unweighted counts: men=5 406; women=6 310 Figures 2 and 3 provide the ethnic group proportions of those who are long-term ill and caring by sex. While there are some contrasts across groups, the amount of observed variation will depend on the age structure of the groups and variation across other characteristics.
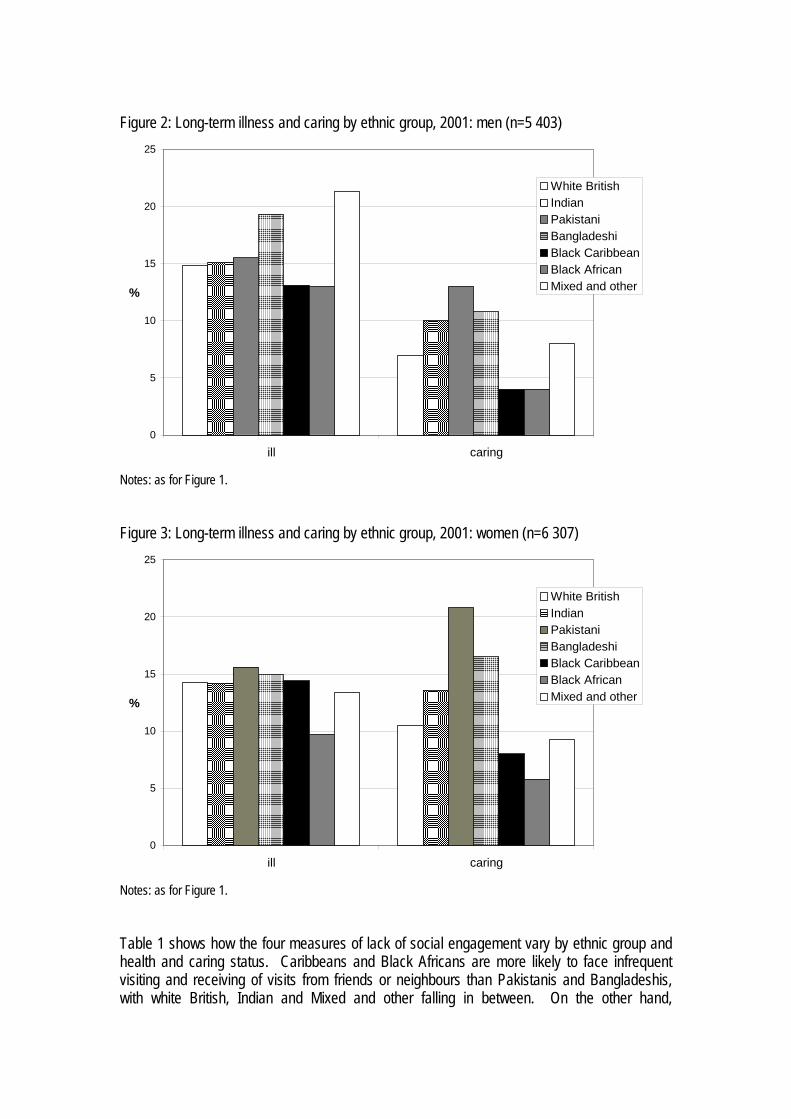
Figure 2: Long-term illness and caring by ethnic group, 2001: men (n=5 403)
0
5
10
15
20
25
ill caring
%
White BritishIndianPakistaniBangladeshiBlack CaribbeanBlack AfricanMixed and other
Notes: as for Figure 1. Figure 3: Long-term illness and caring by ethnic group, 2001: women (n=6 307)
0
5
10
15
20
25
ill caring
%
White BritishIndianPakistaniBangladeshiBlack CaribbeanBlack AfricanMixed and other
Notes: as for Figure 1. Table 1 shows how the four measures of lack of social engagement vary by ethnic group and health and caring status. Caribbeans and Black Africans are more likely to face infrequent visiting and receiving of visits from friends or neighbours than Pakistanis and Bangladeshis, with white British, Indian and Mixed and other falling in between. On the other hand,

Bangladeshi and Pakistani men as well as women are less likely to go out or participate in organised activities than those of white British, mixed and other and Indian ethnicity. These patterns would suggest that there is some substitution between the measures, with different groups favouring different routes for sociability. However, the Caribbeans lose out in terms of social engagement overall. Both male and female Caribbeans appear more socially deprived than the white British on all four measures. This may have implications for their wellbeing and their opportunities. On the other hand, Black Africans, whose overall profile makes them look similar to the Black Caribbeans in terms of sociability, have the lowest rates of deprivation on the measure of organised activity (participation in ‘clubs’). The central role of the Church for many Black African communities may help to explain this finding. Again, then, we may be seeing some substitution in relation to available or preferred forms of activity. The similarity between the patterns of non-participation for the mixed and other groups and the white groups is consistent with expectations that these groups will be more likely to share norms and activities with the white majority. Both illness and caring appear to increase the chances of lacking social engagement across measures. However, overall it would appear that it is caring that puts more constraints on sociability than illness, particularly for men. Table 1: Percentage with limited forms of social engagement according to four measures, by ethnic group: men aged 18-64 Infrequent
visits Infrequent
visiting Infrequent going out
Low contact
with clubs
Not socially
deprived on any
measure
Deprived on two or
more measures
Socially deprived
on all four measures
White British 37 41 29 46 30 47 10 Indian 34 38 31 44 32 41 11 Pakistani 32 34 45 48 24 46 10 Bangladeshi 23 31 43 49 28 39 -- Black Caribbean
40 42 36 57 22 51 12
Black African 39 50 44 42 20 49 14 Chinese 54 57 -- 56 -- 57 -- Mixed and other
35 39 34 45 28 45 10
Long-term ill 41 50 40 49 20 46 11 Caring 48 60 43 45 21 63 14 ALL men 37 41 30 46 29 46 10 Source: Home Office Citizenship Survey 2001, authors’ analysis Notes: percentages are based on weighted counts and have been rounded up; percentages based on raw counts of less than 30 have been suppressed (indicated --)

Table 2: Percentage with limited forms of social engagement according to four measures, by ethnic group: women aged 18-59 Infrequent
visits from friends or
neighbours
Infrequent visiting to friends or
neighbours
Infrequent going out
Low contact
with clubs
Not socially
deprived on any
measure
Deprived on two or
more measures
Socially deprived
on all four measures
White British 34 36 36 47 27 45 10 Indian 36 39 45 54 23 50 16 Pakistani 28 38 55 64 16 55 17 Bangladeshi 29 30 56 68 11 56 11 Black Caribbean
48 52 49 47 15 60 13
Black African 45 54 56 40 19 60 15 Chinese 45 54 32 46 -- 61 -- Mixed and other
36 37 35 49 30 46 11
Long-term ill 37 42 48 54 20 55 12 Caring 39 45 48 46 22 52 15 ALL women 35 37 36 48 27 45 10 Notes: as for Table 1 The indication is, then, that there is both ethnic group variation across measures and that there is some substitution between the different forms of social activity. However, patterns of sociability are also likely to vary with age, employment status and family situation, characteristics which also vary with ethnicity. And the risks of lack of social engagement are higher for those with a long-term illness or caring responsibilities – but these are also factors which vary by ethnicity (as shown in Figures 2 and 3). The question then becomes whether these distinctive patterns of social engagement by ethnic group and health / caring status remain when other relevant characteristics are held constant. And to what extent do these measures, crude as they may appear, function as markers of an underlying propensity to sociability or self-sufficiency? These questions are covered in the next sections. Multivariate analysis Table 3 shows the distributions of the variables included in the multivariate analysis across the sample and broken down by sex. Table 3: Percentage distribution of characteristics potentially associated with social engagement among men aged 18-64 and women aged 18-59, 2001 Characteristic Men
52.4 [5403] Women
47.6 [6310] All adults 18-59/64
100 [11710] Health and caring Caring responsibilities 7 [423] 11 [683] 9 [1106] Long-term ill 15 [910] 14 [986] 15 [1896] Ethnic Group White British 88.6 [2842] 87.9 [3721] 88.3 [6113]

Indian 1.7 [535] 1.7 [590] 1.7 [1125] Pakistani 1.1 [401] 0.9 [414] 1.0 [815] Bangladeshi 0.5 [255] 0.4 [259] 0.4 [514] Black Caribbean 0.6 [322] 0.7 [456] 0.7 [778] Black African 0.6 [260] 0.7 [393] 0.7 [653] Chinese 0.2 [58] 0.2 [80] 0.2 [138] Other and mixed 6.7 [730] 7.3 [844] 7.0 [1574] Older age group 49.4 [2619[ 45.5 [2499] 47.5 [5118] Family status Partnered 68.4 [3388] 68.0 [3530] 68.2 [6918] Children under five present 12.4 [855] 15.9 [1411] [2266] Highest qualification None 17.0 [1215] 20.3 [1543] 18.6 [2758] level 1 6.1 [300] 8.9 [567] 7.4 [867] level 2 16.2 [800] 23.4 [1297] 19.6 [2097] level 3 + apprenticeships 27.0 [1189] 16.4 [865] 22.0 [2054] higher and higher diplomas 32.0 [1686] 29.9 [1795] 31.0 [3481] other 1.7 [161] 1.1 [160] 1.4 [321] Work status Working 80.6 [3953] 68.4 [3638] 74.8 [7591] Unemployed but has worked in the past
17.4 [1196] 27.1 [1834] 22.0 [3030]
Never worked 2.1 [231] 4.4 [789] 3.2 [1020] Household Size 1 person 12.4 [1116] 9.0 [879] 10.8 [1995] 2 people 32.8 [1471] 31.9 [1792] 32.4 [3263] 3 people 21.7 [900] 24.3 [1390] 22.9 [2290] 4 people 22.7 [1023] 23.4 [1251] 23.0 [2274] 5 people 7.1 [487] 8.0 [558] 7.5 [1045] 6 or more people 3.3 [409] 3.4 [440] 3.4 [849] Banded annual household income from all sources
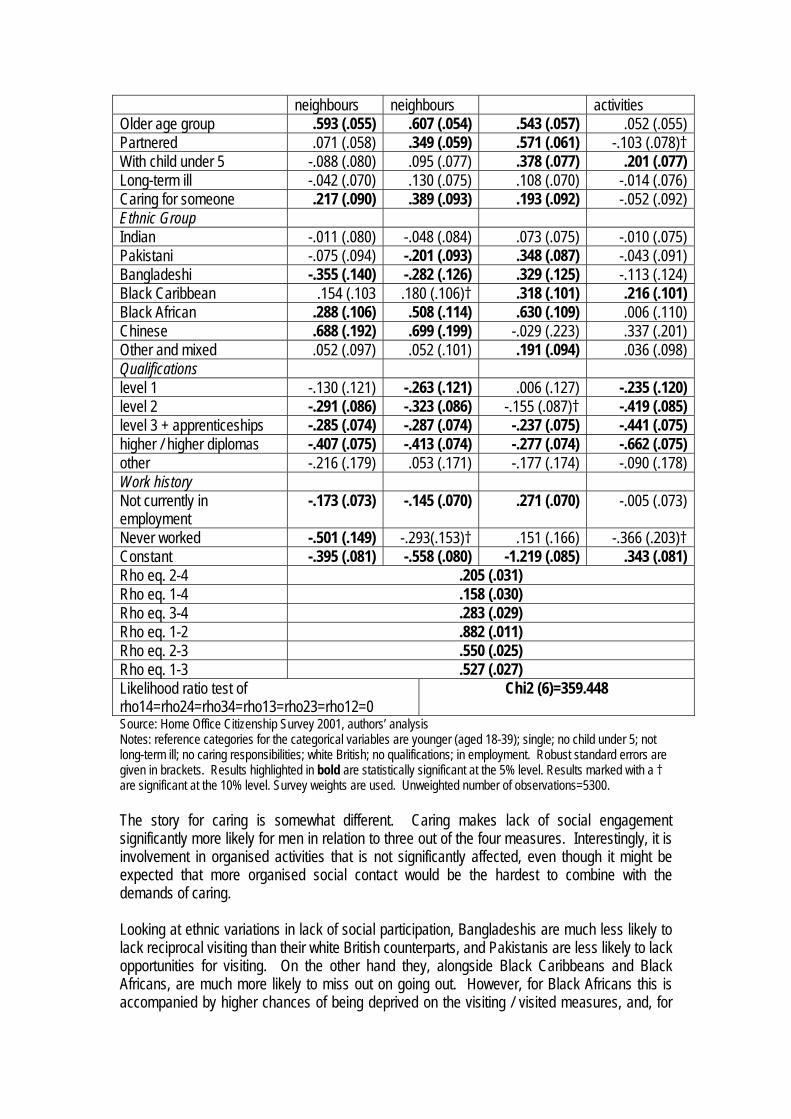
up to £4,999 4.9 [365] 6.5 [529] 5.6 [894] £5,000-£9,999 7.1 [432] 10.5 [744] 8.7 [1176] £10,000-£14,999 8.9 [508] 10.8 [616] 9.8 [1124] £15,000-£19,999 11.7 [494] 11.3 [507] 11.5 [1001] £20,000-£24,999 10.9 [401] 11.5 [407] 11.2 [808] £25,000-£29,999 10.8 [390] 10.4 [369] 10.6 [759] £30,000-£34,999 9.2 [290] 7.7 [275] 8.5 [565] £35,000-£39,999 8.2 [247] 6.7 [216] 7.5 [463] £40,000-£44,999 6.1 [178] 5.2 [168] 5.7 [346] £45,000-£49,999 5.0 [154] 4.5 [134] 4.7 [288] £50,000 and above 17.1 [479] 14.9 [447] 16.1 [926] Source: Home Office Citizenship Survey 2001, authors’ analysis Notes: proportions based on weighted counts, and subject to rounding. Unweighted counts are given in square brackets [ ]. Tables 4 and 5 show the estimates of the multivariate probit regression models for the four measures of lack of social contact for men and women respectively. All the variables in Table 3, except household income and household size have been included in the model and equations for each measure, each with the full set of explanatory variables, were run

simultaneously. In the tables, positive coefficients indicate that the characteristic is associated with greater deprivation – or a lower chance of engaging in the activity – while negatively signed coefficients indicate that the chances of lacking this form of social engagement are reduced (or sociability is increased). Men Starting with Table 4, the results for men show that older people are less likely to visit, be visited or go out. But their involvement in organised activities is not significantly different from younger respondents. Partnership may represent an alternative form of social contact for respondents, as those with a partner are more likely to be infrequent visitors of their friends and neighbours and to go out less frequently. On the other hand, partnership makes lack of contact with organised activities less likely. By contrast, having a young child – even for men – would seem to constrain the types of activity engaged in: fathers of young children are more likely to miss out on going out and participating in organised activities relative to their peers with older or no children. But patterns of visiting and being visited are not significantly affected. Qualifications reduce chances of lacking social engagement across the board, as would be expected; and not being employed would appear to allow greater time for visiting and being visited but restrict opportunities for going out. This could be through lack of networks to go out with or be a disguised income effect: those not in work have fewer resources to spend on going out, with substitution between more expensive and cheaper activities taking place. The model with income included (discussed further below) suggested that it was lack of resources that inhibited participation for the currently not working: the coefficient became very small and lacked any statistical significance. However, for those who have never worked, lack of networks to go out with would appear to be more important: the coefficient actually increased substantially in size, once income was controlled, and became marginally statistically significant (p=.06).Work history has no significant effect on participation in organised activities. I move on to consider the variables of particular interest to this paper. The estimates for men show that illness is, in fact, scarcely significantly associated with any of these measures of sociability. That is, people with a long-term health condition are no more or less likely than those without to lack social opportunities. As suggested in the Introduction, isolation may exacerbate or produce ill-health, but the lack of association between sociability and long-term illness gives little support to that argument. It might be claimed that this, somewhat surprising, result is due to the fact that employment status and qualifications are also controlled for in these models and the low employment rates and lower average qualifications among those with a long-term health condition might be affecting the results. Univariate probits indicated that introducing work history and qualifications rendered the (positive and statistically significant) coefficient for illness non-significant in relation to going out and visiting neighbours. But for the other two measures (irregular involvement in organised activities and receiving visits) illness had no statistically significant effect in a model with just basic demographic characteristics and before work history and qualifications were added. It would seem, then, that illness itself is not substantially associated with lower sociability. Table 4: Multivariate probit regression estimates of the effects of various characteristics on measures of lack of social engagement, 2001: Men [1] Infrequent
visits from friends or
[2] Infrequent visits to friends or
[3] Infrequent going out
[4] Irregular/ no involvement in organised
neighbours neighbours activities Older age group .593 (.055) .607 (.054) .543 (.057) .052 (.055) Partnered .071 (.058) .349 (.059) .571 (.061) -.103 (.078)† With child under 5 -.088 (.080) .095 (.077) .378 (.077) .201 (.077) Long-term ill -.042 (.070) .130 (.075) .108 (.070) -.014 (.076) Caring for someone .217 (.090) .389 (.093) .193 (.092) -.052 (.092) Ethnic Group Indian -.011 (.080) -.048 (.084) .073 (.075) -.010 (.075) Pakistani -.075 (.094) -.201 (.093) .348 (.087) -.043 (.091) Bangladeshi -.355 (.140) -.282 (.126) .329 (.125) -.113 (.124) Black Caribbean .154 (.103 .180 (.106)† .318 (.101) .216 (.101) Black African .288 (.106) .508 (.114) .630 (.109) .006 (.110) Chinese .688 (.192) .699 (.199) -.029 (.223) .337 (.201) Other and mixed .052 (.097) .052 (.101) .191 (.094) .036 (.098) Qualifications level 1 -.130 (.121) -.263 (.121) .006 (.127) -.235 (.120) level 2 -.291 (.086) -.323 (.086) -.155 (.087)† -.419 (.085) level 3 + apprenticeships -.285 (.074) -.287 (.074) -.237 (.075) -.441 (.075) higher / higher diplomas -.407 (.075) -.413 (.074) -.277 (.074) -.662 (.075) other -.216 (.179) .053 (.171) -.177 (.174) -.090 (.178) Work history Not currently in employment
-.173 (.073) -.145 (.070) .271 (.070) -.005 (.073)
Never worked -.501 (.149) -.293(.153)† .151 (.166) -.366 (.203)† Constant -.395 (.081) -.558 (.080) -1.219 (.085) .343 (.081) Rho eq. 2-4 .205 (.031) Rho eq. 1-4 .158 (.030) Rho eq. 3-4 .283 (.029) Rho eq. 1-2 .882 (.011) Rho eq. 2-3 .550 (.025) Rho eq. 1-3 .527 (.027) Likelihood ratio test of rho14=rho24=rho34=rho13=rho23=rho12=0
Chi2 (6)=359.448
Source: Home Office Citizenship Survey 2001, authors’ analysis Notes: reference categories for the categorical variables are younger (aged 18-39); single; no child under 5; not long-term ill; no caring responsibilities; white British; no qualifications; in employment. Robust standard errors are given in brackets. Results highlighted in bold are statistically significant at the 5% level. Results marked with a † are significant at the 10% level. Survey weights are used. Unweighted number of observations=5300. The story for caring is somewhat different. Caring makes lack of social engagement significantly more likely for men in relation to three out of the four measures. Interestingly, it is involvement in organised activities that is not significantly affected, even though it might be expected that more organised social contact would be the hardest to combine with the demands of caring. Looking at ethnic variations in lack of social participation, Bangladeshis are much less likely to lack reciprocal visiting than their white British counterparts, and Pakistanis are less likely to lack opportunities for visiting. On the other hand they, alongside Black Caribbeans and Black Africans, are much more likely to miss out on going out. However, for Black Africans this is accompanied by higher chances of being deprived on the visiting / visited measures, and, for
Black Caribbeans on the organised activity and (marginally) on the visiting measure. Thus, these two Black groups would appear to face limited social opportunities compared to both their white peers and those from other minority ethnic groups. Again, the amount that can be explained by differentials in income will be illustrated from the results of the next model, though it cannot be expected to explain the negative coefficients on reciprocal visiting for Pakistanis and Bangladeshis, given their lower average levels of income. Finally, Table 4 shows substantial variations in the cross-equation correlations (the Rhos). The correlations between lack of involvement in organised activity and the other three outcome variables are between 0.16 and 0.28. The correlation between not visiting and not being visited is, however, over 0.88, which shows a high level of reciprocity between these activities (people don’t ask you round if you don’t ask them). Correlations between these measures of visiting and not going out are above 0.5. All the correlations are, nevertheless, statistically significant and the likelihood ratio test clearly rejects the independence of the equations. As discussed above, if all the off-diagonal correlations are equal to zero then the multivariate probit reduces to a series of univariate probits. If, however, there are correlations across the equations, it suggests that they are best modelled together. The results indicate that there is an underlying propensity to lack of social engagement – or its lack. That is, these four measures act between them as indicators of a tendency not to participate socially, call it asociability or, more positively, self-sufficiency, that cannot itself be measured directly and that is independent of the characteristics already controlled. Women Turning to the model for women, the same pattern for the cross equation correlations can be observed, suggesting that these measures work as indicators of such a latent propensity equally well across the sexes. The individual correlations are also of a similar size, indicating that the association between different forms of sociability is also common across the sexes. As far as the coefficients for individual characteristics are concerned, there is also a certain amount of commonality across the sexes – as well as some noticeable differences. Qualifications and work history variables show the same overall pattern of effects for women as for men, and the effect of being older is also fairly consistent for men and women. Partnership also seems to act as a substitute for social activity for women as for men – but for women the effect is strong and significant in relation to receiving visits as well as for visiting and going out. Having a child under five results in a more strongly negative (and statistically significant) coefficient for receiving visits. That is, those with young children are less likely to lack visitors than those with older or no children – and this is controlling for work status. For women, unlike for men, having a young child is not associated with low participation in organised activities. Examining long-term illness and caring among women, illness does have a statistically significant association with infrequently going out, as well as having, as for men, a marginally significant effect on reduced visits to friends and neighbours. Women carers are, however, not especially at risk of infrequent visits, unlike their male counterparts – and they are more likely than non-carers to be involved in organised activities. Nevertheless, caring does increase risks of infrequent visits and infrequently going out – suggesting that their responsibilities keep them predominantly at home. Table 5: Multivariate probit regression estimates of the effects of various characteristics on measures of lack of social engagement, 2001: Women [1] Infrequent [2] Infrequent [3] Infrequent [4] Irregular/
visits from friends or neighbours
visits to friends or neighbours
going out no involvement in organised activities
Older age group .400 (.053) .507 (.052) .448 (.053) -.041 (.052) Partnered .249 (.051) .278 (.050) .289 (.049) .070 (.050) With child under 5 -.155 (.067) -.039 (.070) .469 (.065) -.030 (.064) Long-term ill .067 (.067) .118 (.069)† .164 (.066) .097 (.067) Caring for someone .066 (.074) .149 (.074) .182 (.075) -.135 (.064)† Ethnic Group Indian .100 (.076) .151 (.076) .246 (.074) .123 (.076) Pakistani -.040 (.106) .205 (.109)† .313 (.107) .413 (.104) Bangladeshi .066 (.166) .081 (.147) .264 (.138)† .424 (.138) Black Caribbean .483 (.084) .528 (.085) .446 (.084) .073 (.085) Black African .513 (.098) .728 (.096) .616 (.097) -.111 (.096) Chinese .439 (.154) .675 (.179) .084 (.164) .088 (.180) Other and mixed .138 (.098) .139 (.095) .045 (.088) .134 (.090) Qualifications level 1 -.145 (.094) -.114 (.095) -.225 (.092) -.363 (.091) level 2 -.114 (.073) -.113 (.071) -.314 (.072) -.495 (.072) level 3 + apprenticeships -.212 (.080) -.218 (.083) -.414 (.079) -.704 (.080) higher / higher diplomas -.228 (.071) -.256 (.071) -.571 (.069) -.926 (.070) other -.459 (.236)† -.366 (.233) -.207 (.232) -.679 (.230) Work history Not currently in employment
-.257 (.057) -.217 (.060) .200 (.055) -.027 (.057)
Never worked -.170 (.131) -.245 (.128) .400 (.120) -.037 (.121) Constant -.552 (.077) -.609 (.075) -.658 (.076) .454 (.076) Rho eq. 2-4 .212 (.029) Rho eq. 1-4 .167 (.029) Rho eq. 3-4 .203 (.028) Rho eq. 1-2 .863 (.011) Rho eq. 2-3 .466 (.025) Rho eq. 1-3 .477 (.026) Likelihood ratio test of rho14=rho24=rho34=rho13=rho23=rho12=0
chi2(6) = 679.47
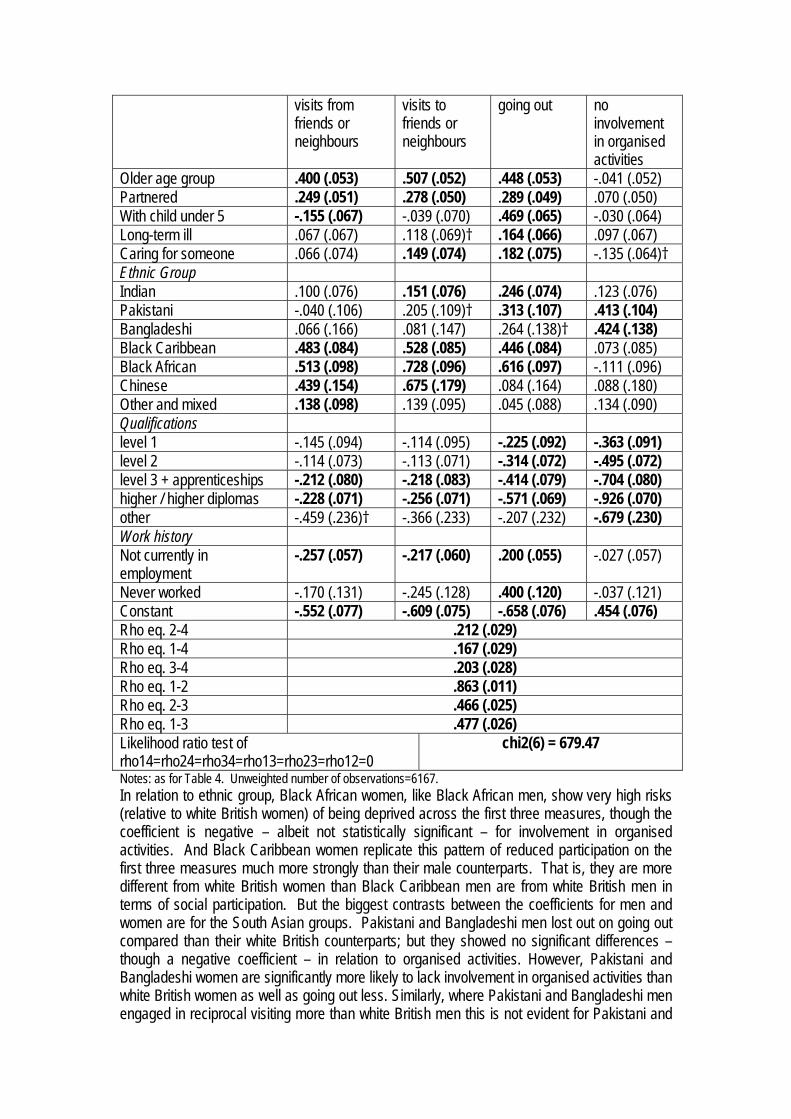
Notes: as for Table 4. Unweighted number of observations=6167. In relation to ethnic group, Black African women, like Black African men, show very high risks (relative to white British women) of being deprived across the first three measures, though the coefficient is negative – albeit not statistically significant – for involvement in organised activities. And Black Caribbean women replicate this pattern of reduced participation on the first three measures much more strongly than their male counterparts. That is, they are more different from white British women than Black Caribbean men are from white British men in terms of social participation. But the biggest contrasts between the coefficients for men and women are for the South Asian groups. Pakistani and Bangladeshi men lost out on going out compared than their white British counterparts; but they showed no significant differences – though a negative coefficient – in relation to organised activities. However, Pakistani and Bangladeshi women are significantly more likely to lack involvement in organised activities than white British women as well as going out less. Similarly, where Pakistani and Bangladeshi men engaged in reciprocal visiting more than white British men this is not evident for Pakistani and

Bangladeshi women compared to white British women. Finally, where Indian men were insignificantly different from their white counterparts in relation to their patterns of social participation, Indian women are significantly more likely to lack social engagement, relative to white women, on at least two of the measures. This is not a ‘South Asian’ effect, however, since, as noted above, Caribbean women and Black African women also show much higher risks of being deprived on these measures than their white counterparts. Nor is it a simple gender effect, since, clearly these contrasts are with white British women – who might be expected to face many of the same gender constraints as other women, particularly when employment and family status is controlled. Instead, minority group women seem to share much in relation to their social participation in ways that distinguish them both from majority women and men from their own ethnic group. There are clearly preferences or constraints operating to shape patterns of social participation in ways that are distinctive across ethnicities. One such constraint that might potentially be playing an important role is, of course, levels of resources. There is only a measure of annual household income (from all sources), so we do not know about the respondent’s individual access to resources, and this issue of control over resources might be particularly relevant for women’s participation – or lack of it. However, controlling for the income level in the household should still provide some grasp of whether this is a particular constraint that is affecting patterns of participation and opportunities for social contact. The effect of income The models were re-run controlling additionally for banded income and adjusting by household size. Adding income and household size (to adjust income to needs) resulted in some changes in coefficients, indicating that apparent effects can instead be put down to differences in income. The tables that follow simply highlight changes that can be observed consequent on the inclusion of income, and focusing only on the illness, caring and ethnic group variables across the equations.vii The cross-equation correlations (the Rhos) remain very similar for the two models for both men and women, so the argument that there is an underlying propensity to lack of social engagement holds for these models as well. Table 6 summarises whether the inclusion of income makes any difference to the significance and any substantial difference to the size of the coefficients on the variables of interest. Income itself had a statistically significant and negative effect across all four equations for both men and women. That is (as would be expected), social participation increased with income level, across all measures. If it is income that accounts for the more limited social participation of those from particular ethnic groups or with a long-term illness or caring, we would then expect to see a change from a positive and statistically significant coefficient to a smaller and non-statistically significant effect.viii Such changes have been highlighted in Table 6. For men, income seems to constrain opportunities for going out for carers and for Pakistani, Bangladeshi and Black Caribbean men. It also ‘explains’ the risks of reduced visiting for those with a long-term illness. However, it cannot account for the fact that male carers and Chinese men are more likely to lack reciprocal visiting than their non-caring / white British counterparts. Nor can it help us to understand why, like for like, Black African men have much higher risks of infrequent visiting and of infrequent going out than their white British counterparts or why Black Caribbean men have a higher risk of not receiving visits. Access to resources is thus important for enabling some forms of social participation for men from some marginalised groups – but for many, different patterns of neighbourly visiting seem relatively independent of income. There may well be implications for quality of life and for community building and options for social capital formation from this. In the introduction I drew attention to the possible detrimental effects of bonding social capital, with which neighbourly visiting would seem to be most closely associated. But it is also likely to

bring individual benefits; and the lack of such opportunities, especially if combined with other forms of deprivation may well lead to greater isolation for those affected. It is also worth noting that patterns of going out appear to be closely tied to available resources (except for the Black Africans), thus refuting cultural explanations for specific minority ethnic groups’ patterns of going out and the notion that caring responsibilities alone prevent such social activity – at least for men. For women, there is some impact of income on the coefficient for illness in relation to visiting. This also applies to carers in relation to the going out measure, and to Pakistani women with regard to visiting neighbours and going out and to Bangladeshi women with respect to going out. In all these cases it could be argued that the observed differentials in Table 5 are actually caused by the lack of resources wherewith to engage in social participatory activities. However, some effects are strengthened with the inclusion of income: Indian women are more likely to have infrequent visits and to lack involvement in organised activities than comparable white women of the same income level and, similarly, women carers are less likely to have visitors than non-carers of the same income level. In these instances, rather than lower income explaining non-participation, it is those who are not necessarily the worst off who nevertheless experience lower participation. Perhaps just as interesting is the issue of those for whom controlling for income makes no change. Income might account for carers’ lower probability of going out, but it makes no difference to their lower probability of visiting neighbours. Similarly, income may account for the reduced participation of Bangladeshi and Pakistani women, but it cannot explain the high risks of lack of social engagement for Caribbean and Black African and Chinese women.ix Indeed, it is perhaps noteworthy that despite stereotypes and expectations of greater restrictions on Pakistani and Bangladeshi women, it is Indian, Caribbean and Black African women who show greatly increased risks of limited sociability compared to comparable white women. If we take seriously the notion of lack of participation as a form of poverty we should consider as deprived those who lack opportunities for participation despite their income level. And we can see that this lack of social participation cannot be simply fixed by higher incomes or participation in employment. Table 6: Effect of inclusion of income in the multivariate probit regression on the coefficients for long-term illness, caring and ethnic group. Infrequent visits
from friends or neighbours
Infrequent visits to friends or neighbours
Infrequent going out
Irregular/ no involvement in organised activities
Men
Long-term ill No change Smaller and no
longer at all significant
No change No change
Caring No change No change Smaller and no
longer significant No change
Indian Change of sign but still far from significant
No change Change of sign but still far from significant
No change
Pakistani Change of sign but Similar size, Smaller and no No change

still far from significant
significance reduced to 10% level
longer significant
Bangladeshi No change Similar size but no longer significant
Smaller and no longer significant
No change
Black Caribbean
Stronger and now significant at 10% level
No change Smaller and no longer significant
Smaller and no longer significant
Black African Smaller and no longer significant
No change No change No change
Chinese No change No change No change Change of sign but highly insignificant
Mixed and other
No change No change No change No change

Women
Long-term ill No change Smaller and not
at all significant Similar size but significance reduced to 10% level
No change
Caring Stronger and significant
No change smaller and no longer significant
No change
Indian Stronger positive effect and significant at 10% level
Similar size but not significant
No change Stronger and highly significant
Pakistani No change Smaller and not significant
Smaller and not significant
No change
Bangladeshi No change No change Changed to negative effect, but not at all significant
No change
Black Caribbean
No change No change No change No change
Black African No change No change No change No change Chinese No change No change No change No change Mixed and other
No change No change No change No change
Source: Home Office Citizenship Survey 2001, authors’ analysis Notes: ‘no change’ indicates that the coefficient has not changed in relation to statistical significance, that its sign has not changed, and that it has not changed dramatically in size. Adding up social engagement Here I consider the question of what these different patterns of social participation all add up to. In the preceding sections the focus has been on the distributions of the individual measures sociability across potentially vulnerable groups. On the other hand, early on the question was raised of whether there were some substitution effects, which might indicate that it was preferences for particular types of sociability rather than constraints that determined the patterns of social engagement. The multivariate analysis, however, suggested that such substitution effects did not seem to hold for Black Caribbeans and Black Africans. Here, predicted probabilities for being deprived on all four measures or on none are estimated. Do the differential risks add up to mean that the chances of complete sociability or lack of sociability are highly unevenly distributed? To examine the marginal impact of ethnic group and of illness and caring, other characteristics are held constant across groups. As we are looking at predicted probabilities, those for men and women arising from the separate models are compared. The baseline against which to measure these effects is a set of modal or median characteristics within the data: younger, partnered, no child under five, in employment, with level three qualifications and with annual household income of between £30 000 and £34 999. Figure 4 shows the predicted probabilities of having ‘zeros’ on all four measures (full social engagement), or having ‘ones’ on all four measures (lacking social engagement across all four areas), for men and women from six ethnic groups. (Chinese are excluded because the small sample sizes make some of the coefficients unreliable, and Mixed and other is both a residual – and therefore not intrinsically meaningful – category and also differed little from the white British in all models.) The health and caring status for Figure 4 is set as not ill and not

caring and thus the only sources of variation between the probabilities illustrated are sex and ethnic group. Figure 4 shows that, for women, all the minority groups have substantially lower probabilities than their white counterparts of not being deprived on any measure, with the Bangladeshis, Black Caribbeans and Black Africans clustering together at around 19 percent. They also have lower probabilities than their male counterparts across all groups. Women from minority groups also have higher probabilities of being deprived on all four measures than their white British counterparts, with the position of Black Caribbean and Black African women standing out here. Black African and Black Caribbean men also fare badly in relation to participation by comparison with men from other groups (though not by comparison with women). And the situation of Pakistani and Bangladeshi men indicates that sociability is relatively central to them – other things being equal. Figure 4: Predicted probabilities for proportions of those experiencing no lack of social engagement on any of four measures and of those experiencing lack of social engagement on all four measures, by sex and ethnic group, 2001
0
0.05
0.1
0.15
0.2
0.25
0.3
0.35
0.4
whi
te B
ritis
h
Indi
an
Pak
ista
ni
Ban
glad
eshi
Bla
ckC
arib
bean
Bla
ckA
frica
n
whi
te B
ritis
h
Indi
an
Pak
ista
ni
Ban
glad
eshi
Bla
ckC
arib
bean
Bla
ckA
frica
n
Social engagement on all four measures Lacks social engagement across all four measures
men
women
Source: Home Office Citizenship Survey 2001, author’s analysis Notes: Vertical axis represents the probability. Unweighted counts=3904 (men) and 4369 (women). Figure 5 shows, instead, the patterns contrasting those who are not ill and not caring with those who are. This comparison is made purely for white British men and women. While empirically there are few in the sample who are both ill and caring and who fit the baseline characteristics selected, the point is heuristic. It shows the extreme case of being both long-term ill and caring and the effect that has on extreme positions of sociability. For both men and women, the combined effects of being ill and caring cause an approximately four percentage point reduction in the chances of not being deprived on any of the four measures. For risks of being deprived on all four measures, however, the impact is greater for women than for men. Men who are caring and long-term ill are only 1 percentage point more likely to not be participating on any of the four measures than their well, non-caring counterparts. For women, by contrast, the increase in risk is of the nature of 3 percentage points, meaning that around 8 per cent of

women with the baseline characteristics but who are ill and caring are predicted as being deprived on all four counts. These effects can therefore be seen to be relatively small. The risks of extreme social isolation are not as great as we might have anticipated for those experiencing both ill-health and caring responsibilities. There would appear to be some balancing between different forms of social engagement that means that still relatively few are constrained in relation to all four measures of sociability. On the other hand, the picture is much starker for those from certain minority ethnic groups. If we compare Figure 5 with Figure 4, we can see that the predicted probability for white women who are ill and caring is still well below the predictions for Black Caribbean and Black African women of limited sociability on all four measures, which are estimated at 12 and 13 per cent respectively. Thus emphasises once again the particular position of Black Africans and Black Caribbeans, and especially women from these groups, in relation to their constrained patterns of social engagement. If social support and social contact is an important element of current well-being, as well as of the welfare of future generations, then this result should give us cause for concern. Figure 5: Predicted probabilities for proportions experiencing no lack of social engagement on any of four measures and those experiencing lack of social engagement on all four measures, by sex and caring/health status
0
0.05
0.1
0.15
0.2
0.25
0.3
0.35
not caring or long-term ill caring and long-term ill not caring or long-term ill caring and long-term ill
Social engagement on all four measures Lacks social engagement on all four measures
men
women
Notes as for Figure 4

Conclusions and policy implications Results showed that there was indeed variation in patterns of social participation by both illness/caring and ethnic group. However, the picture was not entirely negative. The impact of illness on opportunities for social participation was limited once relevant factors were held constant. That does not mean that, in absolute terms, those with a long-term illness are not more isolated than those without, but this would appear to have less to do with the illness than with other associated characteristics (such as age, income and qualifications). For carers, particularly male carers, their responsibilities did seem to create more constraints on their social activity. And only some of this can be attributed to income: caring responsibilities in their own right appeared to divorce people from extensive social engagement. However, there seemed to be some substitution between different forms of social engagement and carers, even ill carers, were not substantially more likely to be deprived on all four measures than non-carers. Variation in social engagement by ethnic group showed a very diverse picture. On the positive side, the situation of Bangladeshi and to a lesser extent, Pakistani men, indicated that they had good sources of social contact, comparing like with like. Their patterns of reciprocal visiting stood out, but the predicted probabilities showed that they were also more likely to be engaged across all four measures than any other group (and less likely to be deprived across all four measures). This indicates that, when other relevant characteristics are held constant, they foster sources of social capital which may be important for the community as a whole and for subsequent generations as well as for individuals’ well-being. As noted above, these forms of sociability may be more associated with bonding than with bridging social capital – and thus with tight, but relatively constrained communities. However, the most distinctive finding to emerge was the particular position of Black African and Black Caribbean women. Much has been made of the potential cultural and religious constraints on the activity of women from South Asian groups (Indians and, especially, Pakistanis and Bangladeshis). And it is important to remember that large absolute differences are likely to remain, given the important role of employment participation in patterns of social engagement, and the very different rates of labour market participation among women from different groups. However, when comparing like with like (that is comparing women in similar employment situations from the different groups), it is Black African and Black Caribbean women who seem most at risk of social isolation. And this cannot be put down to family responsibilities since the presence of young children and partnership were controlled for. Though these women may have alternative forms of informal social contact not measured here – though it is hard to imagine what they would look like, and this finding invites further investigation. The policy implications of these findings are not immediately obvious. However, what they do suggest is that two different general strategies may be appropriate.
• First, for the long-term ill and for Bangladeshis and Pakistanis, increased social engagement will follow from improving their situation in relation to other forms of deprivation, in particular income, employment and levels of educational qualifications.
• On the other hand, for Black African and Black Caribbean women, and to a lesser extent for carers, direct support for social activity would seem needed to increase their social welfare.
In addition, it is clear that strategies need to be sensitive to gender differences within and across vulnerable groups.
To develop these points in more detail: • For those of working age, long-term illness does not itself increase social isolation,
though some of the factors that are associated with it such as lower incomes and fewer qualifications may.
• Therefore, to support the social engagement of the long-term ill focusing on increasing qualifications among the disabled and chronically ill and improving their incomes are likely to have beneficial effects.
• Similarly the welfare of Bangladeshis and Pakistanis, particularly men from these groups is unlikely to be greatly enhanced by supporting their social participation directly. Indeed, their greater probabilities of characteristics such as worklessness, of income poverty and of ill-health that tend to increase the risks of social isolation are compensated for, to a large extent, by a greater tendency towards social engagement.
• Therefore their overall welfare is likely to benefit most from interventions focusing directly on other forms of deprivation: the low employment rates, high rates of illness and high rates of poverty experienced by these groups.
• By contrast, greater specific social support for carers and enhancing their opportunities for social engagement may be of direct relevance. Indeed, the fact that carers were less likely to lack involvement in organised activities than non-carers suggests that the existence of carers’ networks and support groups may already be providing an alternative form of social contact to the more informal visiting and being visited that they appear to miss out on.
• Support for voluntary sector groups and activities tailored to carers’ needs may prove particularly helpful to avoid the social isolation of those with caring responsibilities.
• If we take seriously the potential benefits of social contact, and the detriment to well-being of lack of social engagement, then the situation of Black Africans and Black Caribbeans, and women from these groups in particular, raises serious concerns.
• Policy should be concerned to engage with such women to understand ways in which their opportunities for social engagement can be enhanced or supported. The design of community programmes should acknowledge the constraints that exist for these women and factor in opportunities for supporting social participation and local contacts.
• Support for voluntary sector organisations and informal community groups in conducting activities which are targeted towards these groups may be a good first step. In particular, enabling those which acknowledge and cater for Black African and Black Caribbean women’s frequent dual roles as parents and full-time employees is likely to be beneficial.
Notes i ONS have defined five dimensions of social capital: views about the local area; civic participation; social networks and support; social participation; reciprocity and trust. The approach adopted here does not fit clearly into one of these dimensions, but it links social networks and support and social participation. ii For example, the report on the 2003 survey included one table which treated response to the long-term illness question. iii Also called the People, Families and Communities Survey. iv We had some unresolved questions about the quality of the ethnicity data for 2003, and therefore used the 2001 sweep instead. v It could be argued that such correlations are picking up characteristics that are potentially measurable that we have failed to include in the equation rather than ‘unobservables’, i.e. an unmeasurable latent propensity for sociability or, conversely, self-sufficiency. However, we include a wide range of independent variables and have tested for a number of others, which were found not to contribute to the explanatory power of the model and were therefore excluded.

vi The multivariate probit model was estimated using the –mvprobit– program for Stata software (Capellari and Jenkins, 2003). Each model was run with 30 draws and using antithetic acceleration in the interest of robustness of results. Predicted probabilities were derived using the companion post-estimation program –mvpred–. I am grateful to Stephen Jenkins for his advice on the use of mvprobit. vii The tables showing the full models are available from the authors on request. viii A loss of significance without a change in size could be attributed to the smaller sample used in the models including income. ix Though note that the Chinese results are based on small sample sizes, particularly given the lower number of cases with valid income information across all groups.
References Aldridge, S., Halpern, D. with Fitzpatrick, S. (2002) Social Capital: A discussion paper. London:
Performance and Innovation Unit. Attwood. C., Singh, G., Prime, D., Creasey, R. and others (2003) 2001 Citizenship Survey:
People, families and communities. Home Office Research Study 270, London: Home Office.
Berkman, L.F. (1984) ‘The relationship of social networks and social support to morbidity and mortality’, in S. Cohen and S.L. Syme (eds) Social Support and Health. San Diego: Academic Press.
Berkman, L.F., Glass, T., Brissette, I. and Seeman, T.E. (2000) ‘From social integration to health: Durkheim in the new millennium’. Social Science & Medicine 51: 843-857.
Borjas, G. (1992) ‘Ethnic capital and intergenerational mobility’, Quarterly Journal of Economics 107, 123-50.
Bourdieu, P. (1997). The Forms of Capital. Education: Culture, Economy, Society. A. Halsey, H. Lauder, P. Brown and A. Stuart Wells. New York, OUP.
Burchardt, T. (2000). Enduring Economic Exclusion: Disabled people, income and work. York, Joseph Rowntree Foundation.
Cappellari, L. and Jenkins, S.P. (2003) ‘Multivariate probit regression using simulated maximum likelihood’. The Stata Journal 3(3): 278-94.
Cappellari, L. and Jenkins, S.P. (2005) ‘Summarising multiple deprivation’. XIX Annual Conference of the European Society for Population Economics, 16-18 June 2005. Presentation available at: http://www.espe.org.
Cattell, V. (2001) ‘Poor people, poor places, and poor health: the mediating role of social networks and social capital’, Social Science and Medicine 52(10): 1501-16
Chandola, T. and Jenkinson, C. (2000) ‘Validating self-rated health in different ethnic groups’. Ethnicity and Health 5 (2): 151-60.
Coleman, J. (1988) ‘Social capital in the creation of human capital’ American Journal of Sociology 94, S95-S120.
Curtis, S. and Lawson, K. (2000) ‘Gender, ethnicity and self-reported health: the case of African-Caribbean populations in London’. Social Science & Medicine 50: 365-85.
Department for Work and Pensions [DWP] (2006) A New Deal for Welfare: Empowering people to work, CM 6730. London: TSO.
Duffy, B. (2004). ‘Life Satisfaction and trust in other people’. London: MORI. Available at http://www.mori.com/pubinfo/rd/understanding-life.shtml
Erens, B., Primatesta, P. and Prior, G. (2001) The Health Survey for England. The Health of Minority Ethnic Groups 1999. London: TSO.
Esser, H. (2004) ‘Does the ‘new’ immigration require a ‘new’ theory of intergenerational integration?’, International Migration Review 38(3): 1126-59
Gordon, D. and Pantazis, C. (1997) Breadline Britain in the 1990s. Aldershot: Ashgate. Gordon, D., Adelman, L., Ashworth, K., Bradshaw, J., Levitas, R., Middleton, S., Pantazis, C.,
Patsios, D., Payne, S., Townsend, P. and Williams, J. (2000) Poverty and Social Exclusion in Britain. York: Joseph Rowntree Foundation.
Granovetter, M. (1973) ‘The strength of weak ties’. American Journal of Sociology 78 (4); 1350-80.
Green, H., Connolly, H. and Farmer, C. (2004) 2003 Home Office Citizenship Survey: People, Families and Communities Home Office Research Study 289, London: Home Office.
Home Office (2003) Communities Research and BMRB International, Home Office Citizenship Survey, 2001 [computer file]. Colchester, Essex: UK Data Archive [distributor], November 2003. SN: 4754.

Howard, M. (2001). Paying the Price: Carers, poverty and social exclusion. London: Child Poverty Action Group.
Idler, E.L. and Benyami, Y. (1997) ‘Self-rated health and mortality: a review of twenty-seven community studies’. Journal of Health and Social Behaviour 39: 21-37.
Jenkins, S.P. and Rigg, J.A. (2004) ‘Disability and disadvantage: selection, onset and duration effects’. Journal of Social Policy 33 (3): 479-501.
Laurier, E. and Philo, C. (2005) ‘The Buzz of the “Cappuccino Community”’, ESRC Innovations Report, http://www.innovations-report.com/print/print_en01.php3?id=51933&ctyp=1
Li, Y., Savage, M. and Pickles, A. (2003) ‘Social capital and social exclusion in England and Wales, 1972-1999’. British Journal of Sociology 54 (4): 497-526.
Li, Y., Savage, M., Tampubolon, G., Warde, A. and Tomlinson, M. (2002) ‘Dynamics of social capital; trends and turnover in associational membership in England and Wales, 1972-1999’. Sociological Research Online 7 (3): U97-132
Lin, N. (2001) Social Capital: A theory of social structure and action. Cambridge: Cambridge University Press.
Locker, D. (1983). Disability and Disadvantage: The consequences of chronic illness. London: Tavistock.
Loizos, P. (2000) ‘Are refugees social capitalists?’ in S. Baron, J. Field and T. Schuller (eds.) Social Capital: Critical perspectives. Oxford: Oxford University Press, pp. 124-41.
Mack, J. and Lansley, S. (1985) Poor Britain. London: Allen & Unwin. McKenzie, K., Whitley, R. and Weich, S. (2002) ‘Social capital and mental health’. British
Journal of Psychiatry 181: 280-283. Murphy, R., Wedlock, E. and King, J. (2005) Early Findings from the 2005 Home Office
Citizenship Survey, Home Office Online Report 49/05. Nazroo, J. Y. (1997) The Health of Britain's Ethnic Minorities. London: Policy Studies Institute. Nolan, B. and Whelan, C. (1996) Resources, Deprivation and Poverty. Oxford: Clarendon
Press. Office for National Statistics [ONS] (2001) Social Capital: A review of the literature. London:
ONS. Parker, G. (1993). With This Body: Caring and disability in marriage. Buckingham: Open
University Press. Pennant, R. (2005) Diversity, Trust and Community Participation in England. Home Office
Findings 253. London: Home Office. Available at: http://www.homeoffice.gov.uk/rds/pdfs05/r253.pdf
Platt, L. (2002) Parallel Lives? Poverty among ethnic minority groups in Britain. London: CPAG. Platt, L. (2006) ‘Poverty’, in G. Payne (ed.) Social Divisions. 2nd Edition. London: Palgrave. Pollard, T. M., Carlin, L. E., Bhopal, R., Unwin, N., White, M. and Fischbaher, C. (2003) ‘Social
networks and coronary heart disease risk factors in South Asians and Europeans in the UK.’ Ethnicity & Health 8(3): 263-75.
Portes, A. (1998). ‘Social capital: It’s origins and applications in modern sociology’. Annual Review of Sociology 24(1-24).
Portes, A. (2000) ‘The two meanings of social capital’. Sociological Forum 15: 1-12. Putnam, R.D. (1995) ‘Bowling alone: America’s declining social capital’. Journal of Democracy
61: 65-78. Putnam, R.D. (2000) Bowling Alone: The collapse and revival of American community. New
York: Simon Schuster. Ruston, D. (2003) Volunteers, Helpers and Socialisers: Social capital and time use. London:
Office for National Statistics, Available at: http://www.statistics.gov.uk/CCI/article.asp?ID=319

Schuller, T., Baron, S. and Field, J. (2000) ‘Social capital: a review and critique’ in S. Baron, J. Field and T. Schuller (eds.) Social Capital: Critical Perspectives. Oxford: Oxford University Press, pp. 1-38.
Shaw, A., Walker, R., Ashworth, K., Jenkins, S. and Middleton, S. (1996) Moving Off Income Support: Barriers and bridges. Department of Social Security Research Report No. 53. London: HMSO.
Smith, R.T. and Midanik, L. (1980) ‘The effects of social resources on recovery and perceived sense of control among the disabled.’ Sociology of Health and Illness, 2(1): 48-63.
Stopes-Roe, M. and Cochrane, R. (1990). ‘Support networks of Asian and British families: comparisons between ethnicities and between generations.’ Social Behaviour 5: 71-85.
Townsend, P. (1979). Poverty in the United Kingdom: A survey of household resources and standards of living. London, Penguin.
Veenstra, G. (2000) ‘Social capital, SES and health: an individual-level analysis’. Social Science and Medicine 50 (5): 619-629.
Warde, A., Tampubolon, G., Longhurst, B., Ray, K., Savage, M. and Tomlinson, M. (2003) ‘Trends in social capital: membership of associations in Great Britain’, British Journal of Political Science 33: 515-525.
Whelan, C.T. (1993) ‘The role of social support in mediating the psychological consequences of economic stress’. Sociology of Health and Illness 15 (1): 86-101.