social protection lam lai q5 - world...
TRANSCRIPT

Social Protection
Vietnam Development Report 2008
Joint Donor Report to the Vietnam Consultative Group MeetingHanoi, December 6-7, 2007

CURRENCY EQUIVALENTSCURRENCY UNIT = DONG
US$ = 16,113GOVERNMENT FISCAL YEAR
January 1 to December 31
ACRONYMS AND ABBREVIATIONS
ADB Asian Development Bank ASEAN Association of South East Asian NationsCHS Commune Health StationCIEM Central Institute for Economic ManagementCIT Corporate Income TaxCHS Commune Health Station DFID Department for International DevelopmentDRG Diagnostic Related GroupEC European CommissionGDC German Development CooperationGDP Gross Domestic Product GSO General Statistics OfficeHCMC Ho Chi Minh CityHCFP Health Care Fund for the Poor HEPR Hunger Eradication and Poverty Reduction ProgramHPAI Highly Pathogenic Avian InfluenzaICA Investment Climate AssessmentILSSA Institute for Labor Studies and Social AffairsIMF International Monetary FundLUC Land-Use Right CertificateMDG Millennium Development GoalMOET Ministry of Education and TrainingMOF Ministry of Finance MOH Ministry of HealthMOLISA Ministry of Labor, Invalids and Social AffairsMONRE Ministry of Natural Resources and the EnvironmentMPI Ministry of Planning and InvestmentNGO Non-Governmental OrganizationNME Non-Market EconomyNTPH National Target Health ProgramPCI Provincial Competitiveness IndexPLWD People Living with DisabilitiesSBV State Bank of VietnamSEDP Socio-Economic Development PlanSFE State Forestry EnterpriseSHI Social Health InsuranceSOE State-Owned EnterpriseTRIPs Trade Related Intellectual Property RightsVASS Vietnam Academy of Social Sciences

VBARD Vietnam Bank for Agriculture and Rural DevelopmentVBSP Vietnam Bank for Social PoliciesVCCI Vietnam Chamber of Commerce and IndustryVGCL Vietnam General Confederation of Labor VHLSS Vietnam Household Living Standards Survey VHW Village Health WorkerVSS Vietnam Social SecurityWHO World Health OrganizationWTO World Trade Organization

ACKNOWLEDGMENTS
This report was prepared in partnership by the Asian Development Bank (ADB), the Department forInternational Development (DFID) of the United Kingdom, the European Commission (EC), the GermanDevelopment Cooperation (GDC), and the World Bank. A major contribution by all these donors was tofinance or conduct studies in areas related to the content of the report over the months and yearspreceding its writing. Such studies, listed in the bibliography section, were conducted as part of eachdonor's own country program. All these donors also contributed staff time to the preparation of thereport, through their active engagement in workshops and discussions.
The donors involved in this partnership also provided inputs and guidance to the overall effort througha Steering Committee comprising Kanokpan Lao-Araya (ADB), Kirsty Mason (DFID), Leo Faber (onbehalf of the European working group on health), Maike Lerch (GDC), and Martin Rama (World Bank).
The preparation of the report involved consultations with Vietnamese researchers and practitioners whoparticipated on a personal capacity. Their inputs and feedback were coordinated through a ReviewingCommittee comprising Ha Bui (Ministry of Planning and Investment - MPI), Son Kim Dang (Instituteof Policy and Strategy for Agriculture and Rural Development - IPSARD), Dung Tran Nghiem (Ministryof Health - MOH), Cuong Manh Nguyen (Ministry of Labor, Invalids and Social Affairs - MOLISA),Huong Lan Nguyen (Institute of Labor Studies and Social Affairs - ILSSA), Huu Hai Nguyen(MOLISA), Long Hoang Nguyen (MOH), Thang Nguyen (Vietnam Academy of Social Sciences -VASS), Son Luong Pham (Vietnam Social Security - VSS) and Nga Thuy Tran (MOLISA).
The team in charge of formally writing the report is affiliated with the World Bank. It was led by MartinRama and included Noritaka Akamatsu (on chapter 11), Quang Hong Doan (6), Nga Nguyet Nguyen (4,8, 9 and 10), Duc Minh Pham (5) and Carolyn Turk (1, 2, 3 and 7). Viet Tuan Dinh, Quy-Toan Do, MariaDelfina Alcaide Garrido, Severin Kodderitzsch, Samuel S. Lieberman, Ornsaran Manuamorn, DzungThe Nguyen, Minh Van Nguyen and Zen Delica Willson also provided specific inputs for variouschapters of the report.
The writing team benefited from a range of substantive contributions by colleagues in the broaderdevelopment community. Special thanks go to Bob Baulch (Institute of Development Studies, Sussex),Paulette Castel (consultant), Ian Fox (consultant), Paul Glewwe (University of Minnesota), Ross Hughes(consultant), Dung Kim Le (Oxfam GB), Trung Dang Le (VASS), Adam McCarty (Mekong Economics),Bruno Moser (consultant), Tuan Anh Do Nguyen (IPSARD), Steve Price-Thomas (Oxfam GB), MireilleRazafindrakoto (Institut de Recherche pour le Développement- Développement, Institutions et Analysede Long terme - IRD-DIAL), Francois Roubaud (IRD-DIAL), Jan Jung-Min Sunoo (InternationalLabour Organisation), Huong Than Thi Thien (DFID), and Nicolaus Tideman (Virginia TechUniversity).
Assistance with the analysis of data and documentation was provided by Cuong Viet Nguyen and TrungDang Le (National Economics University). Nha Thi Vu (Vietnam Development Information Center -

VDIC) was in charge of bibliographical research and referencing. The processing of the document wasdone by a World Bank team including Dung Thi Ngoc Tran on editing, Chi Kim Tran on publishing, andPhuong Minh Le and Ha Thi Thu Le on administrative support.
Overall guidance was provided by Vikram Nehru and Ajay Chhibber from the World Bank. RobinMearns, Ana Revenga and Adam Wagstaff, also from the World Bank, were the peer reviewers. Thereport was discussed with the International Monetary Fund (IMF). Comments and suggestions bynumerous colleagues are gratefully acknowledged.

TABLE OF CONTENTS
AcknowledgementsExecutive Summary
PART I: SOURCES OF VULNERABILITY . . . . . . . . . . . . . . . . . . . . . . . . . . . . . . . . . . .11. A Poverty Update . . . . . . . . . . . . . . . . . . . . . . . . . . . . . . . . . . . . . . . . . . . . . . . . . . . .32. Ethnic Minorities . . . . . . . . . . . . . . . . . . . . . . . . . . . . . . . . . . . . . . . . . . . . . . . . . . . .133. Shifts and Shocks . . . . . . . . . . . . . . . . . . . . . . . . . . . . . . . . . . . . . . . . . . . . . . . . . . .22
PART II: POLICIES AND PROGRAMS . . . . . . . . . . . . . . . . . . . . . . . . . . . . . . . . . . . . .334. Labor Markets . . . . . . . . . . . . . . . . . . . . . . . . . . . . . . . . . . . . . . . . . . . . . . . . . . . . . .355. Taxes and Fees . . . . . . . . . . . . . . . . . . . . . . . . . . . . . . . . . . . . . . . . . . . . . . . . . . . . . .486. Budget Allocations . . . . . . . . . . . . . . . . . . . . . . . . . . . . . . . . . . . . . . . . . . . . . . . . . .587 Targeted Programs . . . . . . . . . . . . . . . . . . . . . . . . . . . . . . . . . . . . . . . . . . . . . . . . . . .678. Health Care . . . . . . . . . . . . . . . . . . . . . . . . . . . . . . . . . . . . . . . . . . . . . . . . . . . . . . . .749. Health Insurance . . . . . . . . . . . . . . . . . . . . . . . . . . . . . . . . . . . . . . . . . . . . . . . . . . . .8410. Old-age Pensions . . . . . . . . . . . . . . . . . . . . . . . . . . . . . . . . . . . . . . . . . . . . . . . . . . .9611. Insurance Schemes . . . . . . . . . . . . . . . . . . . . . . . . . . . . . . . . . . . . . . . . . . . . . . . . .105
PART III: THE WAY FORWARD . . . . . . . . . . . . . . . . . . . . . . . . . . . . . . . . . . . . . . . . . .11312. An Integrated Approach . . . . . . . . . . . . . . . . . . . . . . . . . . . . . . . . . . . . . . . . . . . . .115
Bibliography . . . . . . . . . . . . . . . . . . . . . . . . . . . . . . . . . . . . . . . . . . . . . . . . . . . . . . . . . . .124Statistical Appendix . . . . . . . . . . . . . . . . . . . . . . . . . . . . . . . . . . . . . . . . . . . . . . . . . . . . .143

Boxes
Box 1.1: Top Down, Bottom Up and in between . . . . . . . . . . . . . . . . . . . . . . . . . . . . . . . . . . . . . . . . . .6Box 1.2: Pockets of Severe Poverty in Rural Areas . . . . . . . . . . . . . . . . . . . . . . . . . . . . . . . . . . . . . . . .9Box 1.3: What is Happening at the Upper End? . . . . . . . . . . . . . . . . . . . . . . . . . . . . . . . . . . . . . . . . . .12Box 3.1: A Vastly Under-Reported Internal Migration . . . . . . . . . . . . . . . . . . . . . . . . . . . . . . . . . . . . .24Box 3.2: New Diseases: Who Is at Risk? . . . . . . . . . . . . . . . . . . . . . . . . . . . . . . . . . . . . . . . . . . . . . . .28Box 3.3: Anti-Dumping and Catfish Farmers in the Mekong Delta . . . . . . . . . . . . . . . . . . . . . . . . . . .32Box 4.1: Towards a Better Monitoring of the Labor Market . . . . . . . . . . . . . . . . . . . . . . . . . . . . . . . .37Box 4.2: Trade Unions in Vietnam and in China . . . . . . . . . . . . . . . . . . . . . . . . . . . . . . . . . . . . . . . . .46Box 5.1: How Costly Is It to Comply with Tax Regulations? . . . . . . . . . . . . . . . . . . . . . . . . . . . . . . .53Box 5.2: Attitudes towards Tax Evasion . . . . . . . . . . . . . . . . . . . . . . . . . . . . . . . . . . . . . . . . . . . . . . . .56Box 6.1: Regional Plans, Infrastructure Master Plans and Public Projects . . . . . . . . . . . . . . . . . . . . . .65Box 7.1: A Variety of Targeting Approaches . . . . . . . . . . . . . . . . . . . . . . . . . . . . . . . . . . . . . . . . . . . . .68Box 7.2: Linking Targeting Programs and Mainstream Social Insurance . . . . . . . . . . . . . . . . . . . . . . .70Box 7.3: The Impact of Rural Roads . . . . . . . . . . . . . . . . . . . . . . . . . . . . . . . . . . . . . . . . . . . . . . . . . . .72Box 8.1: Health Care at the Grassroots Level . . . . . . . . . . . . . . . . . . . . . . . . . . . . . . . . . . . . . . . . . . . .78Box 8.2: Drug Production, Commercialization and Pricing . . . . . . . . . . . . . . . . . . . . . . . . . . . . . . . . .82Box 9.1: Alternative Provider Payment Mechanisms . . . . . . . . . . . . . . . . . . . . . . . . . . . . . . . . . . . . . .95Box 10.1: Other Benefits in the Compulsory Program . . . . . . . . . . . . . . . . . . . . . . . . . . . . . . . . . . . . .98Box 10.2: Participation in Voluntary Pension Programs . . . . . . . . . . . . . . . . . . . . . . . . . . . . . . . . . . .100Box 11.1: Private Pension Programs . . . . . . . . . . . . . . . . . . . . . . . . . . . . . . . . . . . . . . . . . . . . . . . . . .108Box 12.1: The Limits of Mandatory Social Health Insurance . . . . . . . . . . . . . . . . . . . . . . . . . . . . . .119Box 12.2: Managing Public Pension Reserves . . . . . . . . . . . . . . . . . . . . . . . . . . . . . . . . . . . . . . . . . .122
Tables
Table 1.1: Poverty Rates and the Poverty Gap . . . . . . . . . . . . . . . . . . . . . . . . . . . . . . . . . . . . . . . . . . . .4Table 1.2: Poverty Rate across Regions . . . . . . . . . . . . . . . . . . . . . . . . . . . . . . . . . . . . . . . . . . . . . . . . .7Table 1.3: What Lies behind Changes in Urban Poverty? . . . . . . . . . . . . . . . . . . . . . . . . . . . . . . . . . . .11Table 1.4: Share of Expenditures by Population Quintile . . . . . . . . . . . . . . . . . . . . . . . . . . . . . . . . . . .12Table 2.1: Public Programs Are Reaching Out . . . . . . . . . . . . . . . . . . . . . . . . . . . . . . . . . . . . . . . . . . .17Table 2.2: Size of Land Used by Ethnicity . . . . . . . . . . . . . . . . . . . . . . . . . . . . . . . . . . . . . . . . . . . . . .17Table 2.3: Access to Health Care by Ethnicity . . . . . . . . . . . . . . . . . . . . . . . . . . . . . . . . . . . . . . . . . . .19Table 2.4: Access to Credit by Ethnicity . . . . . . . . . . . . . . . . . . . . . . . . . . . . . . . . . . . . . . . . . . . . . . . .20Table 3.1: The Economic Consequences of Health Shocks . . . . . . . . . . . . . . . . . . . . . . . . . . . . . . . . .29Table 3.2: Who Is more Vulnerable? . . . . . . . . . . . . . . . . . . . . . . . . . . . . . . . . . . . . . . . . . . . . . . . . . . .31Table 4.1: The Structure of the Labor Force . . . . . . . . . . . . . . . . . . . . . . . . . . . . . . . . . . . . . . . . . . . . .36Table 4.2: The Safety Net for Redundant SOE Workers . . . . . . . . . . . . . . . . . . . . . . . . . . . . . . . . . . . .41Table 4.3: Minimum Wages and Average Wages . . . . . . . . . . . . . . . . . . . . . . . . . . . . . . . . . . . . . . . . .43Table 5.1: How Progressive Are Taxes and Fees? . . . . . . . . . . . . . . . . . . . . . . . . . . . . . . . . . . . . . . . . .51Table 5.2: Revenue Assignment by Level of Government . . . . . . . . . . . . . . . . . . . . . . . . . . . . . . . . . .54Table 6.1: Budget Allocation Norms for Provinces . . . . . . . . . . . . . . . . . . . . . . . . . . . . . . . . . . . . . . . .61Table 7.1: A Growing Number of Beneficiaries . . . . . . . . . . . . . . . . . . . . . . . . . . . . . . . . . . . . . . . . . .69Table 7.2: Coverage and Leakage of Targeted Programs . . . . . . . . . . . . . . . . . . . . . . . . . . . . . . . . . . .71Table 9.1: Average Spending by Type of Insured . . . . . . . . . . . . . . . . . . . . . . . . . . . . . . . . . . . . . . . . .92Table 10:1: Social Insurance Revenue and Spending . . . . . . . . . . . . . . . . . . . . . . . . . . . . . . . . . . . . .103

Figures
Figure 1.1: Consistent Decline but Different Levels . . . . . . . . . . . . . . . . . . . . . . . . . . . . . . . . . . . . . . . .5Figure 1.3: Poverty Maps at the Province Level . . . . . . . . . . . . . . . . . . . . . . . . . . . . . . . . . . . . . . . . . . .8Figure 1.2: Accelerated Regional Convergence . . . . . . . . . . . . . . . . . . . . . . . . . . . . . . . . . . . . . . . . . . .8Figure 2.1: Household Expenditures: A Two-wave Story . . . . . . . . . . . . . . . . . . . . . . . . . . . . . . . . . . .14Figure 2.2: Diversity among Ethnic Groups . . . . . . . . . . . . . . . . . . . . . . . . . . . . . . . . . . . . . . . . . . . . .15Figure 2.3: Same Remote Areas, Different Histories . . . . . . . . . . . . . . . . . . . . . . . . . . . . . . . . . . . . . .16Figure 2.4: Educational Attainment by Ethnicity . . . . . . . . . . . . . . . . . . . . . . . . . . . . . . . . . . . . . . . . .18Figure 3.1: A Rapidly Ageing Population . . . . . . . . . . . . . . . . . . . . . . . . . . . . . . . . . . . . . . . . . . . . . . .23Figure 3.2: Disaster-Prone Areas . . . . . . . . . . . . . . . . . . . . . . . . . . . . . . . . . . . . . . . . . . . . . . . . . . . . . .25Figure 3.3: Going under Water? . . . . . . . . . . . . . . . . . . . . . . . . . . . . . . . . . . . . . . . . . . . . . . . . . . . . . . .26Figure 3.4: The Evolving Causes of Mortality . . . . . . . . . . . . . . . . . . . . . . . . . . . . . . . . . . . . . . . . . . .27Figure 4.1: Determinants of Labor Earnings . . . . . . . . . . . . . . . . . . . . . . . . . . . . . . . . . . . . . . . . . . . . .39Figure 4.2: Who Are the Unemployed? . . . . . . . . . . . . . . . . . . . . . . . . . . . . . . . . . . . . . . . . . . . . . . . . .40Figure 4.3: Number of Strikes by Enterprise Ownership . . . . . . . . . . . . . . . . . . . . . . . . . . . . . . . . . . .45Figure 5.1: Who Pays Taxes in Vietnam? . . . . . . . . . . . . . . . . . . . . . . . . . . . . . . . . . . . . . . . . . . . . . . .49Figure 5.2: Tax Revenue by Source . . . . . . . . . . . . . . . . . . . . . . . . . . . . . . . . . . . . . . . . . . . . . . . . . . . .50Figure 5.3: The Tax Burden on Enterprises . . . . . . . . . . . . . . . . . . . . . . . . . . . . . . . . . . . . . . . . . . . . . .52Figure 5.4: Negotiating with Tax Officials . . . . . . . . . . . . . . . . . . . . . . . . . . . . . . . . . . . . . . . . . . . . . .57Figure 6.1: A Breakdown of Budget Expenditures . . . . . . . . . . . . . . . . . . . . . . . . . . . . . . . . . . . . . . . .59Figure 6.2: Not Overburdening Future Generations . . . . . . . . . . . . . . . . . . . . . . . . . . . . . . . . . . . . . . .60Figure 6.3: How Large are Equalization Grants? . . . . . . . . . . . . . . . . . . . . . . . . . . . . . . . . . . . . . . . . .62Figure 6.4: Net Transfers and Poverty Rates . . . . . . . . . . . . . . . . . . . . . . . . . . . . . . . . . . . . . . . . . . . . .64Figure 8.1: Child Mortality in International Perspective . . . . . . . . . . . . . . . . . . . . . . . . . . . . . . . . . . . .75Figure 8.2: Infant Mortality across Regions in Vietnam . . . . . . . . . . . . . . . . . . . . . . . . . . . . . . . . . . . .76Figure 8.3: Quality of Care to Children with Diarrhea . . . . . . . . . . . . . . . . . . . . . . . . . . . . . . . . . . . . .77Figure 8.4: Health Expenditures in International Perspective . . . . . . . . . . . . . . . . . . . . . . . . . . . . . . . .79Figure 8.5: Mostly from Out-of-Pocket Payments . . . . . . . . . . . . . . . . . . . . . . . . . . . . . . . . . . . . . . . .80Figure 9.1: A Varying Degree of Enterprise Compliance . . . . . . . . . . . . . . . . . . . . . . . . . . . . . . . . . . .85Figure 9.2: A Rapid Expansion in Coverage . . . . . . . . . . . . . . . . . . . . . . . . . . . . . . . . . . . . . . . . . . . . .86Figure 9.3: Targeting and Leakage in Decision 139 . . . . . . . . . . . . . . . . . . . . . . . . . . . . . . . . . . . . . . .87Figure 9.4: Vast Disparities across Regions . . . . . . . . . . . . . . . . . . . . . . . . . . . . . . . . . . . . . . . . . . . . .88Figure 9.5: Health Care Contacts by Group of Insured . . . . . . . . . . . . . . . . . . . . . . . . . . . . . . . . . . . . .90Figure 9.6: Costs and Revenues of the Health Insurance Program . . . . . . . . . . . . . . . . . . . . . . . . . . . .92Figure 9.7: Sources of Hospital Income . . . . . . . . . . . . . . . . . . . . . . . . . . . . . . . . . . . . . . . . . . . . . . . .93Figure 10.1: Working Less, Getting Sick more Often . . . . . . . . . . . . . . . . . . . . . . . . . . . . . . . . . . . . . .97Figure 10.2: Coverage of the Compulsory Pension Program . . . . . . . . . . . . . . . . . . . . . . . . . . . . . . . .99Figure 10.3: Households Receiving Pension Income . . . . . . . . . . . . . . . . . . . . . . . . . . . . . . . . . . . . .101Figure 10.4: Pension Benefits and the Actuarial Benchmark . . . . . . . . . . . . . . . . . . . . . . . . . . . . . . .102Figure 10.5: The Reserves of the Pension Program . . . . . . . . . . . . . . . . . . . . . . . . . . . . . . . . . . . . . .104Figure 11.1: A Steady-Growing Sector . . . . . . . . . . . . . . . . . . . . . . . . . . . . . . . . . . . . . . . . . . . . . . . .106Figure 12.1: The Cost of Subsidizing Participation in the Pension Program . . . . . . . . . . . . . . . . . . .116Figure 12.1: A Fragmented Approach to Information Management . . . . . . . . . . . . . . . . . . . . . . . . . .121
The popularity of the term "social protection" is evidenced in therecent literature and policy debate. […S]ocial protection hashowever fairly recently come into extensive use in developingcountries. The concept remains confusing mainly due to therange of existing definitions and the variety of ways in which itis interpreted.
Since the late 1990s, a growing concern with the globaldimensions of social policy has been apparent. A majority ofagencies take an action approach to social protection policies,seeing it as a collection of measures to manage risks andimprove or protect livelihoods.
[…T]here is an outer circle of promotional measures, whichincludes mainly macro policies, development strategies andinstitutional measures. They help enhance the social status andempower the rights of the marginalized and the disadvantaged.Preventive measures, which make up the middle circle, aregenerally made up of direct measures for averting deprivation.This typically refers to a range of social insurance and otherservices which protect people from falling into crisis andrequiring public assistance. Lastly, the inner circle of protectivemeasures consists of narrowly targeted safety nets which aim toprovide the vulnerable with in-kind and cash donations, or othershort-term public assistance and relief from shocks (e.g. naturaldisasters, animal disease, family illness). […] The threecomponents can overlap and interact, but are not identical inpractice.
[…T]hrough the discussion held so far on the topic and theGovernment's activities in this area, both social protectionresearchers and practitioners seem tentatively not to object todefine social protection as (i) direct assistance to poor andvulnerable household, (ii) social insurance and (iii) otheractivities aimed at reducing the vulnerability caused by suchrisks as unemployment, aging and disabilities.
Le, Bach Duong, and others. 2005. Social Protection for theMost Needy in Vietnam. The Gioi Publishers, Hanoi.

Vietnam will soon join the group of middle-income countries. In a simple, mechanicalway, this means that its income per capita willcross some more or less arbitrary threshold.At a deeper level, becoming a middle-incomecountry entails harnessing new, more complexpolicy challenges. Two decades of Doi Moihave sustained a spectacular transformation ofVietnam, from being a poor agrarian economyto becoming a globally integrated player, frombeing run through command and planning tothriving on market mechanisms. The mainstructural reforms have been adopted, or are inthe process of being implemented. Marketshave been opened for competition, or createdaltogether. A hard budget constraint andprivate initiative have been brought intopublic enterprises. The banking sector isbeing reorganized and capital markets arebeing developed to support an efficientmobilization of resources. While muchremains to be done in order to consolidatethese transformations, the general sense ofdirection is clear. But a second generation ofreforms is increasingly needed.
As Vietnam enters the ranks of middle-incomecountries, it needs to layout the foundations ofa more sophisticated economy. It has tosustain productivity growth in the long term,moving up towards more skill-intensive,knowledge-based activities. It should avoiddraining down its natural resources anddamaging its environment in ways that couldbe irreversible or too costly for futuregenerations to redress. It needs to increasetransparency and accountability in publicadministration, avoiding the waste ofcorruption and its potential damage to publicconfidence and morale. And it needs to
establish mechanisms to preserve the inclusivenature of its development so far, at a timewhen rapid economic growth could easilyresult in increased hardship and inequality.
Vietnam is at the dawn of unprecedentedeconomic and social transformation. Theaverage citizen is a mostly healthy 26 yearsold who lives in a rural area, belongs to amulti-generation household including grand-parents and works in agriculture or doesinformal activities, such as being a casuallaborer or helping in a household business.Because of a rapid demographic transition, ina few decades population will be much olderon average. And because of rapid rural-urbanmigration, it will have moved too. By thenthis average citizen may have health concerns,will most probably have migrated to a city,could belong to a nuclear household includingno grand-children (and perhaps no children),will most probably be part of the formaleconomy as a wage employee or abusinessperson, and will not be so far fromretirement.
How well will the institutional arrangementsof Vietnam support this transformation? Howcan they contribute to making the personaljourneys of millions of citizens becomestories of prosperity and accomplishment, notof hardship and uncertainty? Jobs will beneeded for people to move out of agricultureand informal sector activities. Localdevelopment will be required to boost theliving standards of those who do not migrate.Social services should be accessible for thosewho do, and may need them away from home.Health care should be affordable and of goodquality. Instruments should be available for
i
EXECUTIVE SUMMARY
people to save towards their old age. Andprotection mechanisms should exist to copewith multiple risks along the way, fromnatural disasters to anti-dumping actions byVietnam's trade partners to catastrophic healthshocks.
Targeted programs aimed at the mostvulnerable will not be enough. Targetedprograms have not been a critical componentof the government strategy anyway. Theyhave aimed at helping the neediest householdsto cope with the costs of social services and togain access to credit. They have alsosupported the most disadvantaged communesto integrate with the market economy. Butthey have never represented a major budgetaryoutlay, and only reach a fraction of the poor.The strategy of the government has reliedmore on economic growth, the redistributionof land and reasonably good health andeducation. And when it comes to socialpolicies, the stated ambition of thegovernment is to build universal programs.From this perspective, targeted programs canbecome important in supporting theparticipation of the poor and the vulnerable inmainstream social programs. But mere socialassistance will not do.
However, the policy agenda of a country atVietnam's development level cannot be tomimic the social protection systems ofindustrial countries either. Poverty remains aserious issue. It continues to decline rapidlyin rural areas, but for the first time it seems tohave stagnated, perhaps even increased, inurban areas. The higher cost of living inbooming economic hubs may start to take atoll on those whose means are barely abovethe poverty line. In rural areas, the plight ofethnic minorities deserves special attention.Many in this population group are bound to"cross" the poverty line in the coming years,which will result in continued povertyreduction overall. But they will still be barelyabove the line for the foreseeable future. Andmeanwhile, many among the ethnic minoritieswill still be suffering from deep poverty. Apolicy agenda focused on managing risks andshocks only would fail to deliver to these
groups, as they experience hardship even ingood times.
This report aims to contribute to thediscussion of appropriate social protectionstrategies for Vietnam. It does so in theunderstanding that this is a new area, closer tothe second-generation reforms faced bymiddle-income countries than to the structuralreforms Vietnam has successfully gonethrough over the last two decades. It also doesso in the understanding that a common visionexists among policy makers, academics andthe population at large. But at this early stagethe specifics remain unclear, often resulting infrustration in the daily implementation ofsocial policies and programs.
The vision is one of shared and inclusivegrowth, in the socialist spirit of Vietnam.Based on the success of Doi Moi, it involvesrelying on market mechanisms to the extentpossible, to ensure an efficient allocation ofresources in the short term and sustaininnovation and growth in the longer term. Butit also entails mobilizing government resourcesto finance the participation of the poor andother vulnerable groups. And it requiresmarket regulation and policy stewardship, toensure that everybody has access to servicesand quality standards are met.
Because the vision is clear, the report focuseson the specifics. While its scope is wide, thetopics covered can be regrouped into threemain areas: opportunity to thrive, support forthose left behind and insurance to cope withshocks.
Opportunity. Job creation has been one of themain avenues out of poverty in Vietnam. Aflexible labor market has allowed absorbingalmost one and a half million new entrants tothe labor force, year after year. Wageemployment is particularly important in thisrespect. Regardless of whether this is ideal ornot, access to social programs, from healthinsurance to old-age pensions, is easier forthose with formal sector jobs. Sustainingrapid job creation, especially in the formalsector, is crucial to keep growth inclusive.But success should not be taken for granted.
SOCIAL PROTECTION
ii

The implementation of commitments made toaccede to the World Trade Organization(WTO) will require that the minimum wagefaced by domestic private enterprises be raisedrapidly over the next few years. Thetemptation to balance the books of the socialinsurance agency through higher socialsecurity contributions will only add to theburden faced by employers. Meanwhile, theindustrial relations system in force is notconducive to decentralized wage bargaining atthe enterprise level and exacerbates laborconflicts. Moving out of such an outdatedsystem could also help Vietnam exit the Non-Market Economy (NME) status it was grantedwhen entering the WTO. This, in turn, wouldhelp confront protectionist anti-dumpingactions by Vietnam's trade partners, which areanother major threat to jobs.
Support. Opportunities do not arisespontaneously, and not everybody has accessto them. Deliberate efforts are needed toconnect communities to markets and todevelop local infrastructure, so that businessescan thrive. In a country as decentralized asVietnam, the amount of budgetary resourcesavailable to a province has a decisiveinfluence on its capacity to deliver socialservices, implement social policies andfinance infrastructure development. A set oftransparent budget allocation norms has beenset up to transfer resources from richer topoorer provinces, on a scale that dwarfssimilar efforts in much richer regions of theworld. But there has been less progress in theallocation of provincial resources to districts,communes and below. As a result, there aremarked gaps between funding and needs.Programs targeted to specific households andcommunes are of mixed quality, with somehaving a considerable impact and others beingclearly less effective. Redistribution ofresources also happens through taxation, anarea currently undergoing a dramaticoverhaul. Overall, the taxes paid byhouseholds are progressive in Vietnam, butthis is not true of local fees. And taxes paid byenterprises seem to put a heavy burden onsmaller units, while entailing high compliancecosts. As for the current attempts to
redistribute resources through PersonalIncome Tax (PIT), they run the risk ofpenalizing the formalization of economicactivity, without mobilizing much revenue.Taxes on valuable urban land bear a muchhigher potential to redress inequality and toraise resources for local infrastructuredevelopment, without distorting incentivesmuch. But they would require a substantialmodernization of both land and taxadministration.
Insurance. Households face a range ofshocks, some of which may have devastatingeffects on their livelihoods. Natural disasters,crop failure, serious health conditions, thedeath of a breadwinner or longevity beyondresources are among them. Insurance marketshave developed considerably in Vietnam, andmay soon extend their reach to areas such ashealth, pensions and agriculture. However,for their coverage to be substantial and for therisk of default to be contained, the governmentneeds to provide adequate regulation. In somecases, like flood-based insurance, it may needto lay the foundations of a market through theestablishment of verifiable indicators andhazard maps. In other cases, regulation willjust not be enough. Health insurance faceswell-known adverse selection problems,resulting in the exclusion of high-riskpopulations. Old-age pensions suffer from afree rider problem, whereby people may notsave enough in the expectation thatgovernment will provide support when thetime comes. The organization of the socialinsurance system tries to address theseproblems, but in doing so it also introducesother distortions. In the end, implementationdetails can make all the difference. Voluntaryhealth insurance or pension programs may notbe sufficient to address the correspondingmarket failures and substantially expandcoverage. Provider payment mechanisms orbenefit packages may not elicit a cost-effective delivery of services. The regulationof providers may result in some populationgroups (the poor in particular) being deniedservice, or at least quality service. Thecomplexity of these problems is what makesthe social protection agenda part of a second,
EXECUTIVE SUMMARY
iii
technically more demanding generation ofpolicy reforms.
In reviewing the situation and challenges inrelation to opportunity, support and insurancethe current report tries to provide analyticalinput for important policy debates ahead.During the remaining of this five-year period,the National Assembly will most probablypass a Law on the Minimum Wage and revisethe Labor Code, especially on industrialrelations. A Law on Social Assistance maylead to the revamping of targeted programs.Tax policies and tax administration will besubject to a major overhaul, with new lawspassed for almost every major tax instrument,including property tax. A Law on HealthInsurance will be discussed in 2008, while anew voluntary pension program will beimplemented from 2009 onwards. A decree onprivate pensions will also be passed as part ofthe agenda for capital markets development.Meanwhile, the adoption of a Natural DisasterManagement Strategy raises the prospect ofdeveloping new market-based insuranceinstruments.
The report is organized under the form of"vertical", self-standing chapters dealing witheach of the key issues to be addressed by theNational Assembly and by policy makers ingovernment during the next few years. Thesechapters can be seen as brief policy notes,trying to provide an analytical structure for thediscussion. Because of their brevity, theycannot go in depth into each of the aspectscovered, and can only sketch the findings ofmore rigorous and detailed studies. However,for those interested in digging deeper, thereport includes an extensive bibliography,mainly made of references produced by localresearchers and think tanks.
The report also tries to extract a few majorpolicy recommendations, cutting across all the"vertical" chapters. These recommendationsamount to basic principles which could helpbuild a more integrated social protectionsystem in Vietnam. They can be summarizedunder the form of four policy priorities:extending coverage, strengthening incentives,
improving information and managingresources.
Extending coverage. While the visionunderlying the social protection agenda is oneof shared growth and inclusion, Vietnam isquite far from anything resembling universalcoverage for its social programs. In the caseof health insurance, the initial target was toget there by 2010. By now close to half of thepopulation is covered, which is certainly anaccomplishment for a l?-income country. Butsubsequent gains could prove increasinglydifficult. Coverage is even more limited inrelation to pensions, raising the prospect oflarge liabilities when the young of todayreach retirement age, if budgetary resourcesneed to be mobilized to pay for non-contributory pensions. Targeted programs donot reach all of their intended beneficiarieseither; far from that.
Implementing the vision will require boldersteps. The full subsidization of participationby the poor in mainstream programs, alreadyadopted in the case of health insurance, opensa promising avenue. Something similar couldbe done in the case of pensions, where aminimum contribution towards retirement andsome basic benefits could be paid bygovernment to the social insurance agency onbehalf of each poor household head. Anecessary complement to this approach is thepartial subsidization of participation by thenear-poor. Without it, the incentive forhouseholds to escape poverty could bereduced and enrollment could decline amongthose who do escape. There is also a need todelimit the extent of voluntariness. Groupinsurance (involving all household membersor a minimum fraction of all people in a thon)can help address adverse selection in the caseof health. Mass organizations could bemobilized to support enrollment into thevoluntary pension program.
One important question is whether a strategyinvolving the subsidization of a large fractionof the population can be afforded. The answeris probably yes. To begin with, part of thesubsidization simply entails shifting current
SOCIAL PROTECTION
iv

government funding from providers (say,public hospitals) to purchasers of services (thesocial security agency, or a dedicated fund forchronic illnesses and life-threateningdiseases). In the case of pensions, thealternative to the subsidy is not savings: it is acontingent liability, as something will need tobe done sooner or later to support old peoplewithout income. The truly additionalspending can be contained as long as policiesare in place to support a rapid reduction inpoverty.
Strengthening incentives. Increased relianceon market mechanisms, one of the foundationsof Doi Moi, can certainly lead to largeefficiency gains. The improvement in thequality of care provided by hospitals operatingin an autonomous manner is a case in point.However, in sectors which are plagued bymarket imperfections, undesirable outcomesare common as well. Hospitals may becomegood at catering to those who can pay, but theycan also neglect the mandatory provision offree services to the poor. Improving themonitoring of health care providers is thus animportant priority.
The mechanisms used by the government toregulate these sectors can be a source ofdistortions as well. The payment schedulesused by the social insurance agency toreimburse health care providers can encourageexcessive diagnosis and treatment, resulting inan unwarranted escalation of health care costs.The benefit formulas used for the old-agepensions program affect the incentives to saveand to participate in the system. Pensions arequite far from what an actuarially fair systemwould provide. Government employees andwomen get more, out of the same stream ofcontributions, than private sector workers andmen do. After 20 years of contributions, theincentive to remain enrolled starts decliningand it is in the interest of participants to under-declare their earnings. The emergence ofprivate pension funds will require thatattention be paid to the portability of benefitsacross programs. Introducing better-designedprovider payment mechanisms in health andbringing the pension program closer to the
actuarial benchmark are important priorities inrelation to social insurance.
Some of the most complex incentive issuesmight actually be faced in rural areas.Sustaining the emergence of flood insuranceand other market-based tools to deal withnatural disasters will not be easy. Without aproper institutional set up, involving cadastralmaps, hazard modeling and verifiableinformation, insurers may simply not beinterested. In other areas, such as agriculturalextension, finding the right incentives mayinvolve a much deeper understanding ofcultural differences between ethnic minoritiesand the majority group. The current offer ofservices is based on models which haveworked well in the lowlands but may be oflittle relevance for swidden cultivation onsloping plots of land.
Improving information. The vision of anintegrated approach to social protection is atodds with the current fragmentation ofinformation systems. Targeted programs usethe classification of households by povertystatus, conducted by local officials ofMOLISA. Health insurance and old-pensionprograms run on separate informationsystems, focused on individuals rather thanhouseholds. All of these programs rely on theplace where the household or the person lives,or is supposed to live, through a system ofresidential registration which often restrictsaccess to benefits in other localities. Suchsystem seems ill-adapted to a country where alarge fraction of the population will be movingfrom rural to urban areas in the coming years.
The fragmentation of information systems issuch that the ministries in charge offormulating policies cannot effectivelymonitor the behavior of the populations theyare supposed to serve. MOH has difficultyfiguring out how health care services are usedby different participants in the healthinsurance program. MOLISA knows littleabout the typical jobs and earnings transitionsof contributors towards old-age pensions.Because of this fragmentation, participantscan easily be denied service. Current,
EXECUTIVE SUMMARY
v

scattered attempts to introduce moderninformation technology, through the use ofbank cards for pensions or chip cards forhealth, may add layers of complexity to analready difficult problem.
The main recommendation in this area is tointroduce a single social insurance number, tobe given to every person at birth regardless ofcoverage. Unlike current registration cards,such number allows the full portability ofbenefits throughout the country. The povertystatus of the household the person belongs tocan be updated on an annual basis. And thenumber can serve to document personalhistories in connection to employment,earnings and health care use, among others.With adequate information managementsystems, these personal histories can helpdesign better provider payment mechanisms inhealth, and eventually support the introductionof individual accounts in the case of pensions.A single social insurance number could alsolimit the denial of service often observed atpresent.
Managing resources. Delivering on the socialprotection agenda also requires solid financialmanagement. Targeted programs involvetransferring resources to thousands ofcommunities and millions of households.Extending the coverage of social programswill require some form of subsidization for thepoor and perhaps the near poor, with thebudget covering the contributions of asignificant portion of the population, orsupporting provinces to do so. Thedevelopment of the health insurance programamounts to shifting an increasingly large shareof the funding for health care from publicproviders to wholesale purchasers of healthcare services. The pension program, in turn, isbound to accumulate a massive amount ofreserves during several decades. This isbecause the population is young and the labormarket is formalizing, so that dependencyratios will remain low.
Transparent financial management will becrucially important in all these areas. Therewill be a need to make sure that targeted
communes do receive the resources they areentitled to and manage them properly. It willbe necessary to monitor that those who areclassified as poor get their social securitycontributions totally or partially paid for outof public resources. The purchasing decisionsof the social insurance agency will involvehundreds of thousands of providers, includingpublic hospitals, private clinics, facilities ofnon-governmental organizations (NGOs) andcertified doctors. Scrutiny will be required toavoid abuse or favoritism, as in any otherpublic procurement decision.
An area deserving special attention is themanagement of the reserves of the old-agepension program. Those reserves alreadyexceed the equivalent of 4 billion dollars. Butthey are placed in bonds and liquid assetsyielding low returns. There is a need forstrategic decisions as to what the authorizedinvestments are, and how portfolioreallocation decisions are going to be made.Transparent mechanisms could also beconsidered to report to the National Assemblyon the financial performance of socialprotection programs, including themanagement of reserves, perhaps on anannual basis.
Some may question whether these fourpolicy recommendations address the mostimportant policy priorities faced by Vietnam.It can be argued that the strengthening ofmonetary and financial policies, thedevelopment of infrastructure and themodernization of tertiary education are moreurgent at this point. And it is true that lesshinges on effective social protection andinclusive growth in the short term.However, this agenda may still be of criticalimportance for the medium term. Whilemany developing countries have made it tomiddle-income level, very few havecontinued to become industrial nations.Handling the social protection agenda wellcould hold the key for a successful transitionto the next level a few decades down theroad. To get there, it is better to make theright policy choices now.
SOCIAL PROTECTION
vi

PART I: SOURCES OF
VULNERABILITY

3
Household survey data from 2006 confirms thecontinued reduction of poverty in Vietnam, withthe fraction of households living below thepoverty line attaining 16 percent, compared to28.9 percent in 2002, and 58.1 percent in 1993.Other estimates, using different methodologies,yield an equally encouraging picture. Butprogress is uneven. Poverty remains muchhigher among the ethnic minorities than amongthe Kinh and Chinese majority. Most of the poorlive in rural areas, and it is encouraging that ruralpoverty continues to decline, albeit at a slowerpace than before. On the other hand, urbanpoverty rates appear to have stagnated, and couldeven be for the first time on an upward trend.The combination of these diverging urban andrural trends is probably behind the convergencein poverty rates observed across regions andprovinces. The Northwest, the CentralHighlands and the North Central Coast remainmuch poorer than the rest of the country. Buteven in these regions some provinces and groupsare witnessing important declines in theirpoverty rates. Understanding why povertyremains high in specific areas requires a closeranalysis of local circumstances, as shown by thediversity of experiences across poor ruralcommunities. As for urban poverty, the ratecould be somewhat inflated due to statisticalbiases, such as the better sampling of migrants inrecent surveys and the re-classification of wardsat the fringe of cities as urban. However, thesebiases do not explain everything. It is likely thatrapidly growing prices of goods and services,possibly associated with much higher landprices, are pushing households that were barelymaking it back into poverty. As for inequality,standard indicators suggest that it remains quite
low for an economy growing as fast as Vietnam,and might even have declined slightly. However,household expenditure surveys may not be well-suited to capture a rapid increase in wealth at thetop of the distribution.
Main trends
Poverty rates continue to fall in Vietnam. Oneway to assess the speed of this decline is basedon data on household expenditures from fivesurveys on living standards conducted by theGeneral Statistics Office (GSO) in 1993, 1998,2002, 2004 and 2006. One internationalmethodology to produce a number of indicatorsthat are consistent over time is to comparehousehold expenditures per capita with a povertyline. The latter is defined as the cost of a foodand non-food consumption basket allowing ahealthy life. In the case of Vietnam, it has beencustomary to consider the poverty line as the costof a basket allowing a daily intake of 2,100calories per person per day. Based on thismeasure, it appears that poverty has fallendramatically between 1993 and 2006, both inrural and in urban areas and for both Kinh and forethnic minority groups (Table 1.1). According tothese estimates, over a 13 year period Vietnamhas seen 42 percent of the population (equivalentto about 35 million people) move above thepoverty line. In 2006, 16 percent of thepopulation remained below the poverty line.
Rural areas still account for the bulk of the poorin Vietnam, but it is the rapid decline in ruralpoverty that is driving poverty reduction atnational levels. Between 2004 and 2006, therural poverty rate fell by 2.3 percentage points
1. A POVERTY UPDATE

per year, compared to 3.5 points between 1993and 2004. While this reflects a slowdown, theoverall trend remains strong. By contrast, theurban poverty rate appears to have stabilized,or to have even increased slightly. Confidenceintervals are such that no clear trend can beinferred from the data in this case. And tosome extent, poverty rates are bound tostabilize as they get closer to zero. However,the slight slowdown in poverty reduction inrural areas and its stagnation in urban areasdeserve closer analysis.
Other commonly used indicators refer to foodpoverty and the poverty gap. A household issaid to be food poor when its expenditures areso low that even if they were entirely allocatedto buying food that would not be enough toattain 2,100 calories per person per day. It isclear that even the poorest households spend onnon-food items. Therefore, a food poorhousehold can be expected to suffer fromhunger, at least during some periods of the year.The poverty gap is the average "distance"between the expenditures of poor people and the
expenditure level associated with the povertyline. This measure is used to describe whetherpoverty is shallow, with most poor people beingquite close to the poverty line, or deep.
While falling rapidly, food poverty still affectsnearly nine percent of rural households, and anastounding 29 percent of ethnic minorityhouseholds. The good news is that poor peopleacross all population groups are moving closerto the poverty line, with the poverty gap fallingfrom 6.9 percentage points in 2002 to 3.8percent in 2006. Even among ethnic minorities,the poverty gap in 2006 was comparable to thatof the Kinh and Chinese majority in 1993.
Other metrics
As for all issues related to measurement,methodology matters. In Vietnam's case, atleast two other ways of measuring povertyreceive considerable attention. One of themconsiders a poverty line set at one dollar perperson per day. The main point of using such
SOCIAL PROTECTION
4
Table 1.1: Poverty Rates and the Poverty Gap
1993 1998 2002 2004 2006 Poverty rate 58.1 37.4 28.9 19.5 16.0
Urban 25.1 9.2 6.6 3.6 3.9 Rural 66.4 45.5 35.6 25.0 20.4 Kinh and Chinese 53.9 31.1 23.1 13.5 10.3 Ethnic minorities 86.4 75.2 69.3 60.7 52.3
Food poverty 24.9 15.0 10.9 7.4 6.7 Urban 7.9 2.5 1.9 0.8 1.2 Rural 29.1 18.6 13.6 9.7 8.7 Kinh and Chinese 20.8 10.6 6.5 3.5 3.2 Ethnic minorities 52.0 41.8 41.5 34.2 29.2
Poverty gap 18.5 9.5 6.9 4.7 3.8 Urban 6.4 1.7 1.3 0.7 0.7 Rural 21.5 11.8 8.7 6.1 4.9 Kinh and Chinese 16.0 7.1 4.7 2.6 2.0 Ethnic minorities 34.7 24.2 22.8 19.2 15.4
Source: Based on preliminary GSO data. Estimates for 2006 are unofficial.

poverty line is to facilitate comparisons withother countries. However, prices also differconsiderably across countries, so that thepurchasing power of the dollar needs to beadjusted as well. This is usually done througha correction factor called Purchasing PowerParity (PPP), which seeks to find theequivalent of one dollar in the US. As of2006, the PPP factor for Vietnam was around3.36, which means that 30 cents can buyroughly the same as one dollar in the US.
On the one-dollar-a-day metric, poverty inVietnam has declined at the same rapid pacesuggested by the 2,100-calories metric (Figure1.1). As of 2006, only 4.9 percent of thepopulation was below this poverty line. Thiscan be interpreted as meaning that only 4.9percent of the population was poorer thansomeone living on one dollar per day in theUS. Beyond supporting internationalcomparisons, the usefulness of thisinformation to local policy makers can be
questioned. More importantly, PPP factors areas difficult to estimate as householdexpenditures. Because they are subject tooccasional revisions, it is not uncommon tosee unexpected jumps in poverty rates, in onedirection or another.
Other commonly reported poverty figures forVietnam are produced by MOLISA, using analternative methodology. Again, the underlyingprinciple is to compare some indicator ofhousehold living standards with some minimumacceptable benchmark. But both householdliving standards and the poverty line aremeasured in ways that differ from theinternational methodology.
The poverty line used by MOLISA wasoriginally conceived as a certain amount of rice.Back in 1993, people were considered poor ifthey could not afford 20 kilos of rice per personper month in urban areas, and 15 kilos in ruralareas. These amounts were increased to 25 and
A POVERTY UPDATE
5
Source: Based on data from GSO, MOLISA and World Bank.
Figure 1.1: Consistent Decline but Different Levels

20 respectively in 1995, and a threshold of 15kilos was introduced in 1997 for mountainousareas. In 2001 rice amounts were converted intomoney terms, at 150, 100 and 80 thousand dongper person per month, respectively. A majorupdate took place in 2006, when the poverty linewas set at 260 thousand dong for urban areas and200 thousand dong for all rural areas.
To determine which households are below thepoverty line, local officials from MOLISA use acombination of survey techniques and villagediscussions. They also rely on their personalknowledge of the families in the communitythey oversee. The result is a list of poorhouseholds, who are then targeted asbeneficiaries under government programs
SOCIAL PROTECTION
6
Box 1.1: Top Down, Bottom Up and in between
The poverty lines estimated by GSO rely on a painstaking measurement of expenditures at the household level. Ittakes two days for a respondent to fill in the questionnaire of a living standards survey, and considerable training,monitoring and checking is required to ensure that the data are of high quality. Not surprisingly, the samples ofsuch surveys tend to be small. The first Vietnam Living Standards Survey (VLSS) for Vietnam, conducted withfunding by the United Nations Development Program with technical assistance from the World Bank included4,800 households, on a nationally representative basis. With 6,000 households covered, the sample of the VLSS1998 was only slightly larger. A major expansion took place with the 2002 Vietnam Household Living StandardsSurvey (VHLSS), when 30000 households were surveyed. At 9,189, sample sizes were also quite large for 2004and 2006 VHLSSs. However, sample sizes remain too small for really accurate provincial estimates (the errorsare quite large) and certainly too small to measure poverty at lower levels of administration. Building on datafrom household surveys and population censuses, statistical methods known as poverty maps allow estimatingdefensible poverty rates at the district and perhaps the commune level. But in a country characterized by rapidgrowth and massive rural-urban migration, population censuses become quickly outdated and so do poverty maps.
The MOLISA approach, on the other hand, deals with almost all poor and near-poor households in the country,one by one. Every year the list of poor households is updated in each community or thon. This involves somediscussion as to which households might have moved out of poverty and which ones might have fallen back in it.A careful assessment of local household classifications was conducted across 41 communities all over Vietnam,relying on wealth-ranking exercises, using the same methodology in all of them. Wealth-ranking is a standardparticipatory approach derived from applied anthropology. Households in these communities were also subject tomore quantitative techniques, in the spirit of those used by GSO to measure household expenditures. In statisticaljargon, these techniques are known as means testing and proxy-means testing, among others. It appeared that theclassification by MOLISA officials outperformed all the statistical approaches, both within each community andacross communities. However, poverty rates computed based on the MOLISA classification did not perform wellat ranking communities. It is clear that aggregating the classifications further up, at district or province level, canonly result in unreliable poverty rates.
With the GSO metric being reliable at aggregate levels and the MOLISA metric being better at commune levels,the main question is how to reconcile them at the middle ground. One of the most obvious steps is to use the samepoverty lines in both cases. The revision of the MOLISA poverty lines in 2005 is an important step in thisdirection, as the new thresholds are much closer to the 2,100 calories benchmark. However, reconciling bottom-up poverty figures, obtained by aggregation over local MOLISA poverty rates, and top-down figures, fromhousehold surveys and poverty maps, will not be an easy task. MOLISA is currently undertaking research intohow targeting procedures can make best use of the comparative strengths of the methodologically rigorous GSOestimates and the more disaggregated, local estimates. For some time, however, there still may be conflictinginformation on poverty rates at the district and commune levels.
Source: Based on information from GSO, MOLISA, and Nga Nguyet Nguyen and Martin Rama (2007).

designed to reduce poverty. The process throughwhich the lists are compiled varies across the10,000 or so communes in Vietnam, whichsomewhat affects the comparability of theestimated poverty rates. Analysis suggests thatmost of those included on the lists were indeedpoor, but that, at least until the poverty line wasincreased in 2006, the lists often missed manyother poor households.
The co-existence of the GSO and MOLISAmeasures of poverty has led to confusion in thepast, with some analysts preferring one metricto the other. But both approaches have strengthsand weaknesses, making the two metricscomplementary to some extent (Box 1.1).
Poverty and geography
Regional differences remain wide, with themountainous areas being much poorer than thelowlands, and especially than the Southeast(Table 1.2). But there are also importantdifferences in the speed at which poverty isfalling. The poorest region of the country, theNorthwest, has reduced poverty by 19percentage points over the last four years andthe Central Highlands by a staggering 23percentage points. The two least poor regions,
the Red River Delta and the Southeast, on theother hand, are seeing a marked slowdown.This slowdown is all the more notable, since itfollows a period of strong and sustained povertyreduction.
The combination of fast declines in povertyrates in the poorer areas of the country andslower declines in the richer ones is resulting ina narrowing of the gap between regions. In anencouraging sign of convergence, poverty hasfallen more rapidly in areas where its incidencewas initially highest (Figure 1.2). Statistically,between 1993 and 2002 a region whose povertyrate was 1 percent higher than the averageexperienced an annual decline that was 0.037percentage points faster than the average.Between 2002 and 2004, the decline was 0.082percentage points faster. And the fit of thestatistical relationship also became strongerover time.
The picture is similar when provincial povertyrates, instead of regional poverty rates, areconsidered. There are still dramatic gapsbetween the poorest and the richest provinces inthe country (Figure 1.3). But even in the pooresthighland areas some provinces are doingconsiderably better and starting to resemble theirricher counterparts in the lowlands.
A POVERTY UPDATE
7
1993 1998 2002 2004 2006 Northern Mountains 81.5 64.2 43.9 35.4 30.2
Northeast 38.4 29.4 25.0 Northwest 68.0 58.6 49.0
Red River Delta 62.7 29.3 22.4 12.1 8.8 North Central Coast 74.5 48.1 43.9 31.9 29.1 South Central Coast 47.2 34.5 25.2 19.0 12.6 Central Highlands 70.0 52.4 51.8 33.1 28.6 Southeast 37.0 12.2 10.6 5.4 5.8 Mekong Delta 47.1 36.9 23.4 15.9 10.3
Vietnam 58.1 37.4 28.9 19.5 16.0
Table 1.2: Poverty Rate across Regions
Source: Based on preliminary GSO data. Estimates for 2006 are unofficial.

SOCIAL PROTECTION
8
Figure 1.2: Accelerated Regional Convergence
Source: Based on preliminary GSO data, with one observation per region and per inter-survey period. Estimates for 2004 - 2006are unofficial.
Figure 1.3: Poverty Maps at the Province Level
Source: Based on preliminary data from GSO. Estimates for 2006 are unofficial.

Underlying forces
Rapid improvements in wellbeing should notdeflect attention from the fact that there maystill be around 13.5 million people living inpoverty in Vietnam, with between 5 and 6million of them being food poor. One of thechallenges for the medium term is to locatethose places and populations where povertypersists, and to understand the reasons why theyare not benefiting from economic growth as themajority of the population is, so as to reachthem with the kind of support that stands thehighest chances to be effective. Small-scalesurveys from across the country show thediversity of circumstances under which ruralpoverty persists (Box 1.2).
While it is clear that poverty is largely rural innature, the figures for 2006 suggest thateconomic growth alone may not be sufficient todeal with poverty in urban areas. The major
cities of Vietnam have been booming for manyyears now, and yet urban poverty appears tohave stabilized, if not increased. It must benoted that the sample of the household survey issuch that less than 100 urban households in itare poor. Under these circumstances,movements of the poverty rate by less than onepercentage point are not statistically significant.Yet, any increase is bound to raise questions ina country where measured poverty has fallenconsistently and rapidly over the past 13 years.Understanding why this is so is especiallyimportant to adjust social protection policies ina period of rapid urbanization.
Admittedly, the stabilization of urban povertycould just be a statistical artifact. GSO has beenmaking consistent efforts to better capture rural-urban migrants in the sample of its householdsurvey. This group is poorer than well-established urban dwellers. If their relativeweight had increased in the 2006 sample, urban
A POVERTY UPDATE
9
Box 1.2: Pockets of Severe Poverty in Rural Areas
In Ninh Thuan province, research that is part of an ongoing participatory poverty monitoring exercise engagedwith poor communities that have seen little positive change in wellbeing for the poor. Asked about their quality oflife over the previous 12 months, a vast majority of poor households reported either no change (51 percent) ordeterioration (33 percent). Meanwhile, twice as many non-poor households than poor households reported animprovement in the quality of life. Households blamed dependence on an unpredictable weather for continuingpoverty or worsening conditions.
Kong Chro is one of the poorer districts of Gia Lai Province. Researchers visiting one of the district's 13communes were impressed by the outreach of government services. A paved road led to the commune centre,health care cards had been allocated, houses built, land distributed and water supply systems constructed.However, conditions of life remained very difficult for Ede people. One family of eight people visited wassubsisting on two hectares of land where they cultivated maize and cassava. Besides raising a pig and fewchickens, the family was entirely dependent on income from agriculture. Despite the well-constructed road, thisfamily remained disconnected from the economic growth that is encouraging farmers in other parts of the countryto diversify their income sources.
Pockets of poverty are not confined to the mountains. The Red River Delta region has seen dramatic declines inpoverty over the last ten years. But even there it is possible to remain marginalized from the growth process. Acoastal commune in Thai Binh province has a number of households that are prospering through investments inshrimp farms. But other households in that same commune have so little land that they are dependent onharvesting shellfish and tiny shrimp that live in the mud flats exposed at low tide. Within moments of the watersreceding, whole families (including school age children) appear to dig the mud for shellfish and shrimp, whichthey sell in local markets to raise supplementary incomes for very meager returns. Every low tide the familiesreturn, regardless of the time of day.
Source: ActionAid Vietnam & Institute of Economics (2004) and Xuan Thanh Hoang (2007).

poverty could have increased mechanically,without it implying that well-established urbandwellers have become poorer.
A similar composition effect may result fromland conversion. Because of rapid urbanization,formerly rural wards in the fringes of cities havebeen reclassified as urban. Those wards werepresumably wealthier than most other ruralareas, but also poorer than the cities next tothem. Their reclassification could, other thingsequal, bring the urban poverty rate down.
However, there may also be more substantivereasons why poverty has apparently stoppeddeclining in urban areas. Increasingly higherprices in the cities stand as a plausibleexplanation. The boom in real estate pricesincreases the cost of retail trade and otherservices in the cities. Therefore, even simplestaples can cost much more than in rural areas,and the gap is presumably increasing. Higherprices in urban areas may result in lower livingstandards for those whose earnings do not growaccordingly. They could push into povertypeople whose expenditures are barely above thepoverty line.
The so-called regional deflators used tocompute poverty rates can be used to assesswhether higher prices may be affecting thepurchasing power of urban households.Regional deflators play the same role as PPPconversion factors when comparing povertyrates across countries. They help convertexpenditures measured in nominal terms into"quantities" of goods and services purchased.The regional price deflators for 2006 confirmthat prices in urban areas are rising more rapidlythan in rural areas. The trend would be evenslightly faster if the regional price deflatorswere constructed so as to reflect populationshares in different parts of the county, instead ofthe consumption shares currently being used.Were population weights to be applied, urbanpoverty rates would be marginally higher.
When all these possible explanations are puttogether, it seems unlikely that urban povertymay be falling (Table 1.3). Biases from a bettersampling of migrants can be accounted for by
looking only at urban households that weresurveyed in both 2004 and 2006. Povertyamong this "panel" component of the surveyappears to have increased (the poverty rate goesfrom 5.0 to 5.7 percent). Biases from landreclassification can be corrected by focusingonly on wards that were considered urbanalready in 2004. This adjustment makes littledifference to the urban poverty rate in 2006 (itgoes from 3.9 percent using the classificationfor 2006 to 4.0 with that of 2004). Finally, pricesmatter too, as the 2006 price deflators lead tohigher urban poverty rates compared to the 2004deflators (from 3.6 to 3.9 percent). Admittedly,all the changes are minor and unlikely to besignificant. But for the first time in 13 yearsthey are suggestive of a slowdown in urbanpoverty reduction, if not worse.
Growing inequality?
Vietnam's strong record in terms of growth andpoverty reduction has been associated with onlymodest increases in inequality.
Household expenditure data permits compilingsome standard indicators in this respect. Forinstance, it is possible to break the populationinto five equally large population groups basedon their living standards and to estimate theshare of all expenditures that are made by each"quintile" (Table 1.4). These estimates showthat the poorest 20 percent of the populationmakes around 7.2 percent of all expenditures,compared to 43.3 percent for the wealthiestquintile. This implies that the average person inthe richest quintile spends six times as much asthe average person in the poorest one.
Another standard indicator is the Gini index.Measured on a scale from zero to one, thisindicator increases with inequality. In thecommand and control economy precedingeconomic reforms in Vietnam, the Gini indexwas presumably very low, as mostly everybodywas poor. Market mechanisms usually result ina differentiation of incomes encouraging workeffort and capital accumulation, and thisdifferentiation can be expected to increase inperiods of rapid economic growth.
SOCIAL PROTECTION
10

Because of its economic transition and itsremarkable growth performance, Vietnam couldhave seen a substantial increase in inequality.Yet the Gini index only trended up slightlybetween 1993 and 2004, and even declined anotch between 2004 and 2006. This stability ofthe Gini index is driven by the goodperformance of the three middle quintiles of thepopulation, which in turn reflects the emergenceof an increasingly important middle class. Themiddle three quintiles accounted for 50 percentof total expenditures in 2006, a relatively highproportion by developing country standards.But the growth of the middle class is notincompatible with a growing gap between thetop and the bottom quintiles.
Standard inequality indicators may not betelling the full story, however. There is
abundant anecdotal evidence of rapidlyincreasing wealth at the top of Vietnam'sdistribution. Sales of cars are growing by nearly80 percent per year. Literally hundreds of thosecars were imported by plane by customers whodid not want to wait for normal delivery, addingoutrageous transport cost to the already highimport duties and taxes. Vietnamesenewspapers now regularly run stories about themarket for luxury phones, cars and, most recentyachts. The year 2007 saw the purchase of twoRolls Royce cars, with a price tag exceeding onemillion dollars, and one luxury yacht, at a costof more than two million. And there areindividual investors owning shares with a valuein excess of 100 million dollars. Whetherstandard inequality indicators are able tocapture developments of this sort is a matter ofdebate (Box 1.3).
A POVERTY UPDATE
11
2004 2006 All
house- holds
Panel house- holds
With 2006 regional deflators
All households
With 2004 regional deflators
With 2004 ward
classification
Panel house- holds
Vietnam 19.5 20.2 16.2 16.0 17.0 16.2 16.1 Urban 3.6 5.0 4.0 3.9 3.6 4.0 5.7 Rural 25.0 25.0 20.7 20.4 21.9 20.5 19.6
Table 1.3: What Lies behind Changes in Urban Poverty?
Source: Based on preliminary data from GSO. Estimates for 2006 are unofficial. Figures in parentheses are standard errors.

SOCIAL PROTECTION
12
Box 1.3: What is Happening at the Upper End?
The primary focus of surveys of living standards in developing countries is often on the measurement of poverty.Therefore, tools such as the VHLSS can provide a sound basis to analyze the welfare of households around thepoverty line. They are less good at capturing information from those at the very poorest end of the distribution,since the destitute are often absent from samples. They are also less good at describing the richest end. The verywealthy are unlikely to spend two days answering a questionnaire. And even if they did, they could find it hardto recall how much they have spent over the reference period. The questionnaires themselves tend to be designedbased on the expenditure patterns of average citizens, rather than the very wealthy. Questions on conspicuousconsumption are often omitted, since they have no relevance for the very large majority of respondents. While theomission of the very rich has no relevance for the measurement of poverty, it could have implications for themeasurement of inequality. One study from China found that the exclusion of the top one percent of the samplereduced the Gini index from 0.50 to 0.44.
In 2006, the top ten percent of the population accounted for 28 percent of total expenditures. This is less than inseveral neighboring countries. In China, for example, the top ten percent accounts for 35 percent of total income.In Malaysia it accounts for 38 percent and in both Thailand and the Philippines for 34 percent.
Nobody can be sure how much expenditure is missing from the VHLSS. One clue is to look at non-response ratesof surveys, but unfortunately this is not available for the VHLSS 2006. Another approach is to compute totalconsumption based on the VHLSS and compare the resulting figure with private consumption as estimated bynational accounts. This exercise shows that the VHLSS 2006 might have underestimated expenditures by around18.8 percent. This is more than in 2004 (16.2 percent) and 1998 (15.9) percent.
Perhaps the biggest uncertainties concern the valuation of housing. The VHLSS asks households to report theapproximate market value of the place they live in. The average figures reported for large cities suggest thatresponses are plausible. However, to measure expenditures it is necessary to convert the value of housing into animputed rent. This conversion is based on information on the households which do rent the place they live in. Butthere are not many of those in the sample of the VHLSS, and the resulting ratio of rent to property value may beunder-estimated. Many urban households have made sizeable capital gains on the value of their housing. Failureto reflect those gains in their imputed rent may lead to an under-estimation of consumption by the richestpopulation groups, hence to an under-estimation of the extent of inequality.
1993 1998 2002 2004 2006
Poorest 8.4 8.2 7.8 7.1 7.2 Near poorest 12.3 11.9 11.2 11.2 11.5 Middle 16.0 15.5 14.6 15.2 15.8 Near richest 21.5 21.2 20.6 21.8 22.3 Richest 41.8 43.3 45.9 44.7 43.3
Total 100.0 100.0 100.0 100.0 100.0
Richest/Poorest 5.0 5.3 5.9 6.3 6.0
Gini index for expenditures 0.34 0.35 0.37 0.37 0.36
Table 1.4: Share of Expenditures by Population Quintile
Source: Based on preliminary data from GSO. Estimates for 2006 are unofficial.

13
Ethnic minority groups account for anincreasingly large share of the poor inVietnam. Poverty rates have been decliningsteadily for ethnic minorities living in valleysor in the lowlands and engaging in paddy fieldcultivation. Other groups, less dominant innumber, are seeing little improvement in theirliving standards. Overall poverty ratesremain much higher among ethnic minoritiesthan among the Kinh and Chinese majority.The severity of poverty is much higher too,and hunger remains an issue for several of thegroups. This is despite considerable progressin making ethnic minority communities moreaccessible and providing them with basicsocial services. In fact, geography alonecannot be retained anymore as the mainexplanation for poverty among ethnicminorities. Even in remote areas, householdsbelonging to the Kinh and Chinese majorityare doing reasonably well. Differences inendowments do not tell the full story either.Ethnic minority people tend to have moreannual cropland than the majority group,albeit of poorer quality. Their educationalattainment is improving, at roughly the samespeed as that of the majority. And there hasalso been considerable progress in their accessto education, health and credit. Ethnicminorities are at a disadvantage in relation toannual cropland, use-rights to forestry landand schooling levels. But one of the mainreasons why they lag behind may be thefailure of public policies and programs to takeinto account their specific needs andbehavioral differences. For instance,agricultural research and extension modelswell suited to the lowlands may be of littlerelevance for swidden cultivation on sloping
plots of land. Ethnic minority people are alsoless geographically mobile, which results in adifferent impact of investments inaccessibility. In spite of all this, a fasterreduction in ethnic minority poverty can beexpected in the coming years, for the simplemechanical reason that the expenditures percapita of a large number of households aregetting closer to the poverty line and couldsoon be above it.
Doing better, but…
Vietnam's remarkable record in povertyreduction is qualified by slower progress inthe case of ethnic minorities. Constitutingabout 14 percent of the population, ethnicminorities currently account for 44 percent ofthe poor and 59 percent of the hungry. Overthe last 13 years, their poverty rate has beendeclining at an average of 2.6 percentagepoints per year, against 3.4 points for the Kinhand Chinese majority. In 2006, 52 percent ofethnic minority people were still living inpoverty, compared to only 10 percent of Kinhand Chinese people. Poverty for ethnicminorities was also deeper than for Kinh andChinese people. The poverty gap, whichindicates the average distance between thehousehold expenditures of the poor and thepoverty line, has also remained consistentlyhigher for ethnic minorities.
There could be a faster decline of povertyamong ethnic minorities in the coming years,however. The distribution of householdexpenditures per capita across households inVietnam can be seen as the combination oftwo distinct distributions, one for the Kinh and
2. ETHNIC MINORITIES

Chinese group and the other for ethnicminorities (Figure 2.1). The distribution ofexpenditures among ethnic minorityhouseholds in 2006 is similar to the oneobserved for the Kinh and Chinese populationin 1993, prior to a period of very rapid povertyreduction.
Growth in Vietnam has, to date, beeneffective at moving those a little way belowthe poverty line over the poverty line. It ispossible that the next few years of highgrowth will see the movement of ethnicminorities over the poverty line at a morerapid pace than in the past. But suchacceleration of poverty reduction, if it were tohappen, should not be automaticallyattributed to successes in policymaking orgovernment programs. To some extent, itwould reflect a relatively mechanical process,whereby a slight increase in householdexpenditures per capita pushes people overwhat is ultimately an arbitrary line.
Most previous analyses of ethnic minoritypoverty have provided a blunt comparison ofperformance between two populations, thefirst comprising Kinh and Chinese people,
the second aggregating all other ethnicminorities. However, ethnic minorities are arelatively heterogeneous group.Representative data are not available for allof them, given their small populations. Butdistinguishing between sub-groups providesa "higher resolution" picture, allowing amore nuanced assessment of their differences(Figure 2.2).
Ethnic minority groups based in the lowlands(Khmer and Cham) have seen dramatic ratesof poverty reduction. Groups who tend to bevalley-dwelling rice farmers in the NorthernMountains (Tay, Thai, Muong and Nung)have also seen a significant reduction inpoverty over the past 13 years. But othergroups in the Northern Mountains, theCentral Highlands and the South and NorthCentral Coasts remain extremely poor. Thelack of progress for these groups tends to bemasked by the more rapid improvements inthe larger ethnic minority groups. Forinstance, the poverty rate of the CentralHighlands fell by a remarkable 23 percentagepoints between 2002 and 2006. However, acloser examination suggests that there has
SOCIAL PROTECTION
14
Figure 2.1: Household Expenditures: A Two-wave Story
Source: Bob Baulch, T. Hung Pham and Barry Reilly (2007).

been almost no movement in living standardsfor minority groups in that region.
Some of these groups are actually poorenough to be exposed to hunger. In 2006, agreater proportion of ethnic minorities werebelow the food poverty line than was the casefor Kinh and Chinese people in 1993.Hunger appears to be particularly acute insome regions. For example, more than 40percent of ethnic minorities live in hunger inthe South Central Coast, and more than 52percent in both the Central Highlands and theNorthwest. At the same time in all of theseregions less that ten percent of Kinh andChinese people were below the highergeneral poverty line.
Stories from an ongoing research exerciseillustrate the problems ethnic minorities stillface. In four poor villages in Ninh Thuanprovince, not having enough rice or maize fordaily consumption was a less severe problem
than four to five years earlier. Villagersagreed that better-off households no longerexperienced food shortages and that the"hungry period" for poor households hadfallen from between eight and ten months peryear in 2003 to between two and six monthsin 2007. But they also reported that mostRaglai households experienced hungerbetween harvests, especially from April toJuly. During this period, lack of food andcash would send people into the forests insearch of sweet potatoes. At other times ofthe year, poorer households might haveadequate quantities of rice or maize to eat,but would only be able to afford fish or meatonce or twice a month.
Not just remoteness
Regional and ethnic patterns of poverty showthat prosperity is possible in all regions of thecountry. Kinh and Chinese people have seenextremely rapid reductions in poverty
ETHNIC MINORITIES
15
Figure 2.2: Diversity among Ethnic Groups
Source: Bob Baulch, T. Hung Pham and Barry Reilly (2007).

regardless of which region they live in. Ethnicminority poverty has remained high in boththe Northern Mountains and the CentralHighlands, but Kinh and Chinese poverty inthose regions has declined at 4.6 and 2.8percentage points per year respectively(Figure 2.3). Analyses that investigate how thewelfare of different ethnic groups deviatesfrom average welfare confirm that differencesin living standards are not simply an issue ofgeography. District-specific effects appear tobe modest in explaining differences inexpenditures per capita.
Access to infrastructure and services isimproving throughout the country, for both theKinh and Chinese majority and for ethnicminorities. By 2006, 80 percent of the ethnicminority population was living within twokilometers of an all-weather road, compared to59 percent in 1998. At 91 and 76 percentrespectively, figures were much higher in thecase of the majority group. But the changeover time was similar in both cases. Traveltimes have also fallen considerably. For
instance, in 2006 the average travel time to thenearest primary school was 18 minutes (2.7kilometers) for ethnic minority people, against10 minutes (1.6 kilometers) for the majoritygroup. The gap was slightly bigger for thenearest lower secondary school, andsubstantially bigger for the nearest uppersecondary school. But even in this case, theaverage distance for ethnic minority peoplewas reduced from 12.8 to 9.8 kilometers intwo years, from 2004 to 2006, whereas it onlyfell by 0.3 kilometers in the case of themajority group.
Overall, it is fair to say that the efforts toimprove infrastructure at local levels arepaying off. Access has increased as a result(Table 2.1).
Land and its use
Ethnic minority livelihoods are highlydependent on agriculture. More than 90 percentof households in this group have annualcropland. In regions where ethnic minorities are
SOCIAL PROTECTION
16
Figure 2.3: Same Remote Areas, Different Histories
Source: Based on GSO data. Data for 2006 are preliminary.

most dominant the percentage is even higher(Table 2.2). Those ethnic minority householdswho have annual cropland tend to have more ofit than Kinh and Chinese people, but this shouldnot necessarily be interpreted as an advantage.Much of the annual cropland farmed by ethnicminorities is on sloping terrain and yields onlyone crop a year. Kinh people are much morelikely to have higher-quality irrigated land.
Perennial cropland land has been importantin allowing rural households to diversifyincome sources. Kinh people have more ofit, particularly in the Central Highlandswhere coffee and other cash crops have beena source of rural development. Thoughethnic minorities often reside close toforestry land, whether they actually haveaccess to it varies considerably across the
ETHNIC MINORITIES
17
Travel time to lower-secondary
school (minutes)
Travel time to market (minutes)
Within 2 km of an all-
weather road (percent of population)
Access to improved
water sources
(percent of population)
Access to improved sanitation (percent of population)
2004 Kinh and Chinese 14 9 84 82 36 Ethnic minorities 28 36 66 37 4 Vietnam 17 13 82 76 32
2006 Kinh and Chinese 12 9 91 87 43 Ethnic minorities 25 32 80 55 7 Vietnam 15 13 90 82 38
Table 2.1: Public Programs Are Reaching Out
Source: Based on data from GSO. Data for 2006 are preliminary.
Northeast Northwest Central Highlands
Kinh and Chinese
Ethnic minorities
Kinh and Chinese
Ethnic minorities
Kinh and Chinese
Ethnic minorities
Have (percent) 88 98 75 99 48 90 Annual cropland Size (m2) 2457 4995 5436 11855 7745 11399
Have (percent) 33 25 30 20 66 38 Perennial cropland Size (m2) 2471 3617 3561 3582 12193 10782
Have (percent) 17 50 - 22 2 4 Forest land Size (m2) 13487 17645 - 22199 - -
Table 2.2: Size of Land Used by Ethnicity
Source: Based on preliminary data from GSO for 2006. Size is computed over households that have at least one piece of thatland; "-" means that the sample is too small to provide a reliable estimate.

country. Half the ethnic minorityhouseholds in the Northwest region declarethat they "use" forestry land. But only 4percent of ethnic minorities in the CentralHighlands have these use-rights, despite thisbeing the region with largest forest area inthe entire country.
The way agricultural research and extensionare organized may result in ethnic minoritiesreaping lower returns from their landallocations. Policies that encouraged theproduction of wet rice in valleys may have hadlittle impact on ethnic minority poverty. Bycontrast, limited attention has been paid toupland agriculture, which is an essential partof most ethnic minority livelihoods.Diminishing fallow times present a challengefor upland farming systems, one that has notbeen sufficiently addressed by publicagricultural research. Similarly, agriculturalextension is not supporting farmers enough asthey switch from subsistence to cash crops ontheir upland plots. More broadly, agriculturalextension is not oriented towards the technicalchallenges of upland agriculture and its staff isoften unable to communicate in ethnicminority languages.
Social services
The last 13 years have seen improvements ineducational attainment across the board.Though ethnic minorities have not caught upwith the Kinh and Chinese majority, there isno sign that they are falling behind either(Figure 2.4). For instance, the proportion ofadults who have not completed primaryeducation dropped by 30 percentage pointsfor the Kinh and Chinese majority, and for28 percentage points for ethnic minorities.Over the same period, the proportion ofadults who completed lower secondaryeducation rose slightly faster for ethnicminorities than for the Kinh and Chinesemajority. And while there appears to be aslowdown in improvements during the lasttwo years for both groups, a closer analysisis needed to determine whether thisrepresents a real trend or is rather a productof flaws in the data.
There has also been a considerable success inthe distribution of health insurance orhealthcare cards to ethnic minority people(Table 2.3). Data for 1998 do not allowdiscerning between health cards and health
SOCIAL PROTECTION
18
Figure 2.4: Educational Attainment by Ethnicity
Source: Based on data from GSO. Data for 2006 are preliminary. Figures are in percent of the adult population.
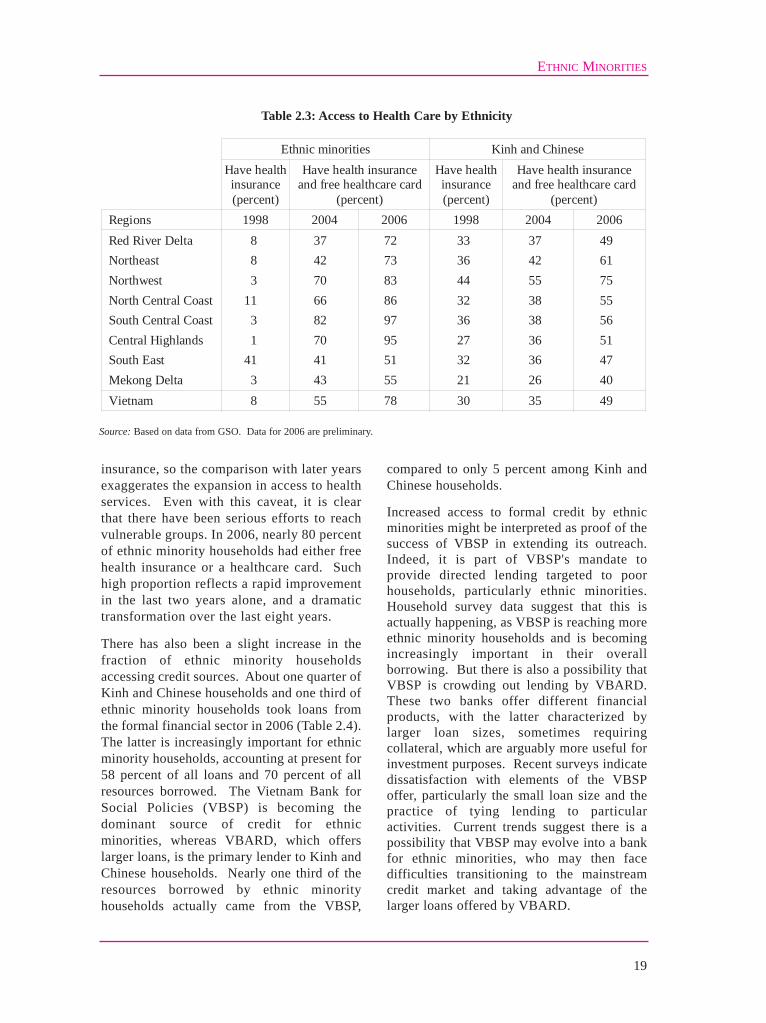
insurance, so the comparison with later yearsexaggerates the expansion in access to healthservices. Even with this caveat, it is clearthat there have been serious efforts to reachvulnerable groups. In 2006, nearly 80 percentof ethnic minority households had either freehealth insurance or a healthcare card. Suchhigh proportion reflects a rapid improvementin the last two years alone, and a dramatictransformation over the last eight years.
There has also been a slight increase in thefraction of ethnic minority householdsaccessing credit sources. About one quarter ofKinh and Chinese households and one third ofethnic minority households took loans fromthe formal financial sector in 2006 (Table 2.4).The latter is increasingly important for ethnicminority households, accounting at present for58 percent of all loans and 70 percent of allresources borrowed. The Vietnam Bank forSocial Policies (VBSP) is becoming thedominant source of credit for ethnicminorities, whereas VBARD, which offerslarger loans, is the primary lender to Kinh andChinese households. Nearly one third of theresources borrowed by ethnic minorityhouseholds actually came from the VBSP,
compared to only 5 percent among Kinh andChinese households.
Increased access to formal credit by ethnicminorities might be interpreted as proof of thesuccess of VBSP in extending its outreach.Indeed, it is part of VBSP's mandate toprovide directed lending targeted to poorhouseholds, particularly ethnic minorities.Household survey data suggest that this isactually happening, as VBSP is reaching moreethnic minority households and is becomingincreasingly important in their overallborrowing. But there is also a possibility thatVBSP is crowding out lending by VBARD.These two banks offer different financialproducts, with the latter characterized bylarger loan sizes, sometimes requiringcollateral, which are arguably more useful forinvestment purposes. Recent surveys indicatedissatisfaction with elements of the VBSPoffer, particularly the small loan size and thepractice of tying lending to particularactivities. Current trends suggest there is apossibility that VBSP may evolve into a bankfor ethnic minorities, who may then facedifficulties transitioning to the mainstreamcredit market and taking advantage of thelarger loans offered by VBARD.
ETHNIC MINORITIES
19
Ethnic minorities Kinh and Chinese
Have health insurance (percent)
Have health insurance and free healthcare card
(percent)
Have health insurance (percent)
Have health insurance and free healthcare card
(percent) Regions 1998 2004 2006 1998 2004 2006 Red River Delta 8 37 72 33 37 49 Northeast 8 42 73 36 42 61 Northwest 3 70 83 44 55 75 North Central Coast 11 66 86 32 38 55 South Central Coast 3 82 97 36 38 56 Central Highlands 1 70 95 27 36 51 South East 41 41 51 32 36 47 Mekong Delta 3 43 55 21 26 40 Vietnam 8 55 78 30 35 49
Table 2.3: Access to Health Care by Ethnicity
Source: Based on data from GSO. Data for 2006 are preliminary.

The cultural dimension
Thanks to the availability of good householdsurvey data, it is relatively straightforward todocument the endowments of ethnic minorities,as well as their access to social services. Dataof this sort are at times used to "explain" the gapin household expenditures per capita betweenthe Kinh and Chinese majority and the ethnicminority population. The result is adecomposition of the gap between differences inendowments (for instance, in the amount of landavailable) and differences in the returns to thoseendowments (in the productivity of such land).However, these decompositions can bemisleading, as they tend to ignore the role ofcommunity characteristics which are muchmore difficult to capture through survey data.
For instance, looking at differences ingeography and infrastructure is easy, but actualmobility could be more relevant. One recentresearch exercise combining qualitative and
quantitative techniques found Kinh people inethnic minority areas to be much more mobilethan the minorities. Nearly all Kinh peopleinterviewed had visited the commune centre andwell over 90 percent had visited the provincialtown, compared to 85 percent and a little morethan one half respectively for ethnic minorities.Most notable was the difference in the historiesof visits outside the province. Two thirds ofKinh people had traveled beyond provinceboundaries, but only 18 percent of ethnicminorities had done so. Higher mobility maygive Kinh people advantages not easily pickedup by household surveys, such as greater accessto information, broader social networks,increased contact with markets and theopportunity to learn from others.
Failing to understand this more culturaldimension of the difference between ethnicminorities and the Kinh and Chinese majoritymay easily result in stigma, lead toinappropriate policy responses and frustrate
SOCIAL PROTECTION
20
Percent of households borrowing from the
different lenders
Percent of resources borrowed from the different lenders
2006 2004 2006
Lenders Kinh and Chinese
Ethnic minorities
Kinh and Chinese
Ethnic minorities
Kinh and Chinese
Ethnic minorities
Formal 25 36 61 68 70 69 VBSP 7 18 3 16 5 30 VBARD 17 18 42 51 47 38 Other banks 2 0 17 1 18 0
Informal 21 23 39 31 30 31 Employment support fund 1 1 1 0 1 Credit organization 2 1 4 2 4 6 Mass organization 3 3 1 3 2 4 Money lenders 4 5 6 5 4 5 Friends and relatives 12 13 25 19 19 13 Others 1 2 2 3 1 2
Total 41 54 100 100 100 100
Table 2.4: Access to Credit by Ethnicity
Source: Based on data from GSO. Data for 2006 are preliminary. The total is not sum of formal and informal borrowing becausea household can borrow from more than one lender.

ETHNIC MINORITIES
21
development efforts. Anthropological studieshave explored differences in behaviors and havefound that some ethnic minority responses topolicies and programs, though unexpected byofficials used to managing service delivery inmajority areas, are entirely rational given thecontext. In other cases, those policies andprograms have been found to be conceptuallyflawed, being based on ill-informedpreconceptions.
Government programs to reduce ethnic minoritypoverty are often built on the assumption thatactivities which worked well for the Kinh andChinese majority should also work well forethnic minorities. When they do not, lack ofunderstanding can lead to the conclusion thatthe target beneficiaries are backward, orunmotivated, or lazy.
For example, the distribution of healthinsurance cards has, in general, improved accessto healthcare for the poor. If certain ethnicminority groups make limited use of their cards,it could be tempting to conclude that they do notvalue modern medicine as much as the Kinh andChinese people do. However, a study of ethnicdifferences in health seeking behavior in Son Lasuggests that economic considerations maymatter more than perceptions. When taking intoaccount the distance to the closest providercovered by the health insurance program, thetime away from work, the expense and thelikelihood of decent treatment, the decision notto use the card seems sensible. Reliance on
modern medicine is more common when thecommune health station (CHS) is close by, thedoctor speaks the same language as the patient,and the health insurance card is issued withcorrect information on it.
Other interventions may be misguided becauseof behavioral assumptions which are notsubstantiated by evidence. Over severaldecades, well-funded programs have aimed tosettle groups seen as nomadic because of theirdependence on swidden agriculture. However,a recent study found that only a tiny fraction ofethnic minority people were living a nomadiclifestyle, with most upland farmers being wellsettled. In the same spirit, a review of thesesedentarization programs concluded that theyhad had little discernible impact onlivelihoods.
There is also a need to look beyond ethnicminorities as a whole and realize the challengesthe variety of cultures and contexts across the 53different groups present for policymakers.Nationally representative household surveys areunable to capture this diversity well, because thesmaller groups get only a tiny representation intheir sample, if any at all. Studies that haveinvestigated the situation of a small number ofgroups in certain areas show that differencesbetween ethnic minority groups (in terms ofendowments, contexts and, by extension,responses to government interventions) can beeven more marked than differences with theKinh and Chinese majority.
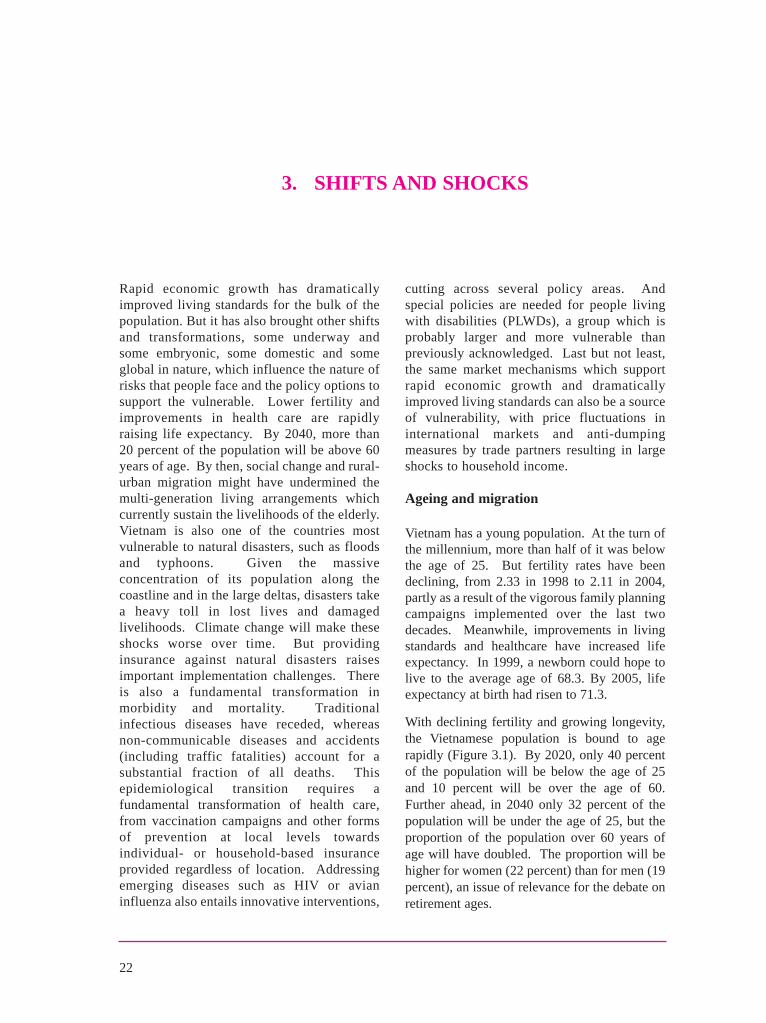
22
Rapid economic growth has dramaticallyimproved living standards for the bulk of thepopulation. But it has also brought other shiftsand transformations, some underway andsome embryonic, some domestic and someglobal in nature, which influence the nature ofrisks that people face and the policy options tosupport the vulnerable. Lower fertility andimprovements in health care are rapidlyraising life expectancy. By 2040, more than20 percent of the population will be above 60years of age. By then, social change and rural-urban migration might have undermined themulti-generation living arrangements whichcurrently sustain the livelihoods of the elderly.Vietnam is also one of the countries mostvulnerable to natural disasters, such as floodsand typhoons. Given the massiveconcentration of its population along thecoastline and in the large deltas, disasters takea heavy toll in lost lives and damagedlivelihoods. Climate change will make theseshocks worse over time. But providinginsurance against natural disasters raisesimportant implementation challenges. Thereis also a fundamental transformation inmorbidity and mortality. Traditionalinfectious diseases have receded, whereasnon-communicable diseases and accidents(including traffic fatalities) account for asubstantial fraction of all deaths. Thisepidemiological transition requires afundamental transformation of health care,from vaccination campaigns and other formsof prevention at local levels towardsindividual- or household-based insuranceprovided regardless of location. Addressingemerging diseases such as HIV or avianinfluenza also entails innovative interventions,
cutting across several policy areas. Andspecial policies are needed for people livingwith disabilities (PLWDs), a group which isprobably larger and more vulnerable thanpreviously acknowledged. Last but not least,the same market mechanisms which supportrapid economic growth and dramaticallyimproved living standards can also be a sourceof vulnerability, with price fluctuations ininternational markets and anti-dumpingmeasures by trade partners resulting in largeshocks to household income.
Ageing and migration
Vietnam has a young population. At the turn ofthe millennium, more than half of it was belowthe age of 25. But fertility rates have beendeclining, from 2.33 in 1998 to 2.11 in 2004,partly as a result of the vigorous family planningcampaigns implemented over the last twodecades. Meanwhile, improvements in livingstandards and healthcare have increased lifeexpectancy. In 1999, a newborn could hope tolive to the average age of 68.3. By 2005, lifeexpectancy at birth had risen to 71.3.
With declining fertility and growing longevity,the Vietnamese population is bound to agerapidly (Figure 3.1). By 2020, only 40 percentof the population will be below the age of 25and 10 percent will be over the age of 60.Further ahead, in 2040 only 32 percent of thepopulation will be under the age of 25, but theproportion of the population over 60 years ofage will have doubled. The proportion will behigher for women (22 percent) than for men (19percent), an issue of relevance for the debate onretirement ages.
3. SHIFTS AND SHOCKS

This demographic transition has a number ofimplications for policymaking. There willclearly be a much larger number of elderly.The 20 percent of people who will be over60 years old in 2040 are currentlyeconomically active. Most of them are notpoor and many of those who are poor arequite likely to exit poverty in the next fiveto ten years. An important opportunity existstherefore to put in place mechanisms thatallow today's youth to be saving foreconomic inactivity in older age.
This will be particularly important ashousehold structures begin to change, withmore traditional, multi-generation householdsbecoming less dominant. This change isalready taking place in urban areas, wherevalues are shifting along with increased wealthand intensified exposure to the wider world.But it is also likely to happen in rural areas, asdomestic migration becomes a mainstreamresponse to economic opportunities in otherparts of the country. Traditional patterns ofcare within a multi-generation household maybe less of a safety net when the youth of todayretire than they are now.
Domestic migration is the other majordemographic transformation ahead. Explosivegrowth in the non-agricultural sector wassustained by a massive movement of peopleout of agriculture. Quantifying suchmovement is difficult, however, and there aregood reasons to suspect that current statisticsunderestimate it by a large margin. Indeed,migrants from rural to urban areas are notsystematically included in the surveys mostoften used to assess poverty and vulnerability(Box 3.1).
It is not clear how the absence of migrantsaffects the poverty estimates in urban areas.But it is clear that migrants may be vulnerablein a number of ways which are hard to analyzewith existing data. Access to servicesdepending on registration papers (as foreducation) or on presence in a specifiedlocation (as for healthcare) is a case in point.
SHIFTS AND SHOCKS
23
Figure 3.1: A Rapidly Ageing Population
Source: Based on United Nations (2007).

Weather and climate
Vietnam's climate and topography make it oneof the countries most prone to natural disasters.Typhoons and floods are by far the mostfrequent and severe natural hazard. Typhoonshit the long coastal area most directly.Flooding is extensive and prolongedthroughout the wet season in the large deltas.
Most of Vietnam's 2,360 rivers are short andsteep, so that heavy rainfall in their basinsproduces intense, short duration floods.Sizeable portions of the country, and especiallythe Central Highlands and the Central Coast,are subject to heavy rainfall. Even moreunsettling is the substantial variation in rainfall,especially over the long coastline and in theNorthern Mountains (Figure 3.2).
SOCIAL PROTECTION
24
Box 3.1: A Vastly Under-Reported Internal Migration
Does the VHLSS underestimate the number of rural-urban migrants in Vietnam? In spite of sustained efforts toimprove its sampling, there is a concern that migrants working in industrial zones and living in rented bedroomsmay not be appropriately captured. There is also a possibility that the sampling frame may be of better quality forthe population having permanent forms of registration (KT1 or KT2 status) than for people holding moretemporary cards (KT3 or KT4).
One way to answer this question is to focus on HCMC, where a population census was carried out in 2004. Thecensus is supposed to be the most comprehensive data source, as it attempts to capture all households. TheVHLSS has a question that enables to estimate the population having differing types of registration. The responsesto this question in the case of HCMC can be matched to those provided to a similar question in the Census. Ifmigrants with temporary forms of registration were appropriately captured in the 2004 VHLSS, the proportions ofrespondents with KT3 and KT4 registration should be similar of that of the 2004 Census. As it happens, theCensus estimated that households with KT3 or KT4 registration accounted to nearly 20 percent the population,compared to only 3.8 percent in the VHLSS.
Another way to assess the coverage of rural-urban migrants in the VHLSS is to estimate the population employedin different sectors, or holding different occupations. The VHLSS responses can in this case be matched toemployment estimates from the Enterprise Surveys conducted annually by GSO. The results suggest, again, thatmany migrants are omitted from the VHLSS sample. In 2002, the VHLSS underestimated employment inmanufacturing in all of Vietnam by about 2 percent. By 2006 the gap had widened to 22 percent. The largestdifference is for the leather goods industry, which includes shoe manufacturers. The VHLSS appears to miss about41 percent of leather workers (160,000 people in all) in 2002 and around 45 percent (or 230,000 workers) in 2004.It is also apparent that the VHLSS surveys miss a substantial number of construction workers, who are oftenmigrants. The gap in this case amounted to 480,000 workers in 2002 and 420,000 workers in 2004.
Source: Based on data from GSO.
2004 Census for HCMC Registration Status
2004 VHLSS in HCMC All Communes Communes in VHLSS
KT1 85.5 71.6 71.8 KT2 9.2 9.7 8.6 KT3 11.5 12.6 KT4
3.8 7.2 7.0
Other 1.5 - -

With around 70 percent of the population livingin lowland areas, in the deltas or along the 3,200km-long coastline, these disasters often take aheavy toll. There are about 700 deaths per yearas a result of typhoons, floods and rainfall-induced landslides. In addition to the humancasualties, there are important economic lossesand environmental damage. Between 1991 and2000, natural disasters resulted in 2.3 milliontons of food lost, 6 million houses destroyed and9,000 ships sank. In total about 3 billion dollarsin assets was lost.
The encroachment of economic activity anddevelopment into marginally suitable areas,
such as floodplains, coastal swamps, drainagechannels or other natural buffers, only adds tothe vulnerability of the population.
Preliminary results from an ongoing studysuggest that households living in disaster proneareas have been active in diversifying theirincome sources so as to reduce risk. Matchingdaily rainfall data from 172 weather stations forthe period 2001-2006 with household surveydata from the surrounding areas shows thatfarmers in areas facing higher weathervolatility diversify their labor inputs more. Butthey do not self-insure by accumulatinglivestock or asset holdings, nor do they
SHIFTS AND SHOCKS
25
Figure 3.2: Disaster-Prone Areas
Source: Quy-Toan Do and Trung Dang Le (2007). The coefficient of variation is the ratio between the dispersion (as measured bythe standard error) and the mean. Data are for 2001-2006.

participate more in social networks. The studyalso suggests that farmers in these disasterprone areas have fewer diversification options,perhaps because they do not have good accessto land or credit.
Vulnerability to natural disasters may beexacerbated over time by climate change.International consensus now exists that globalwarming is linked with human activity. There isalso consensus that the poor are vulnerable to itsimpacts, because they live in more exposedareas and depend more on natural resources fortheir livelihoods. But there is uncertainty overthe scale and nature of the possible impacts.Modeling is more advanced in relation to theimpact on sea levels than on weather patterns,and especially on how rainfall patterns willchange across the country. Climate simulationsunder a range of scenarios suggest that meanannual temperature in Vietnam could increaseby between 1.5 to 2.5 degrees Celsius by 2100,
whereas the sea level could rise by 18 to 59centimeters.
Different scenarios have been developed tomodel the potential impacts of climate change.While they need to be interpreted with caution,they provide important warnings. One studyconsidered 84 coastal countries and found thatVietnam was one of the five most vulnerable tosea level rise in the entire world, and the mostvulnerable in East Asia (Figure 3.3). This isbecause a large proportion of the population,infrastructure and economic production,including irrigated agriculture, is located incoastal lowlands and deltas.
Digital surface data has been used to improvethe resolution of these scenarios. It appears thata one-meter rise in the sea level would affect 39of the 64 provinces in six of the eight economicregions of Vietnam. About 20 percent ofcommunes could be wholly or partly inundated,
SOCIAL PROTECTION
26
Figure 3.3: Going under Water?
Source: Dasgupta and others (2007)

with the Mekong River Delta being the mostseriously affected area. By one estimate, a one-meter rise in sea level would affectapproximately 5 percent of Vietnam's land area,11 percent of the population, and 7 percent ofagricultural output. However, these figuresshould not be taken literally. In particular, moredetailed analysis is needed before deriving anypolicy implications. For example, scenarios ofthis sort do not consider the contribution that theexisting system of sea dykes provides for floodprevention.
Beyond the potential for arguments overassumptions, it appears that without effectiveadaptation strategies, climate change willincrease vulnerability among some of thepoorest groups in Vietnam. As is the case fornatural disasters today, there will be a need todevelop appropriate policy responses, frommitigation to insurance.
Providing insurance against natural disasterraises important implementation challenges.Pooling risk is difficult when shocks are boundto affect large population groups, which is theproper of hazards such as typhoons or floods.Measuring the extent of damage in an objectiveway might be difficult as well. And theavailability of insurance could discourageprevention efforts by households andcommunities. As a result, market responsesmay be insufficient, and complementaritiesbetween public policy and private provision willhave to be explored.
Health and disability
Vietnam is well along in its epidemiologicaltransition, with non-communicable diseasesbeing by now the main cause of morbidity andmortality, by a large margin. Traditionalinfectious diseases may still be an issue in
SHIFTS AND SHOCKS
27
Figure 3.4: The Evolving Causes of Mortality
Source: Based on data from MOH.
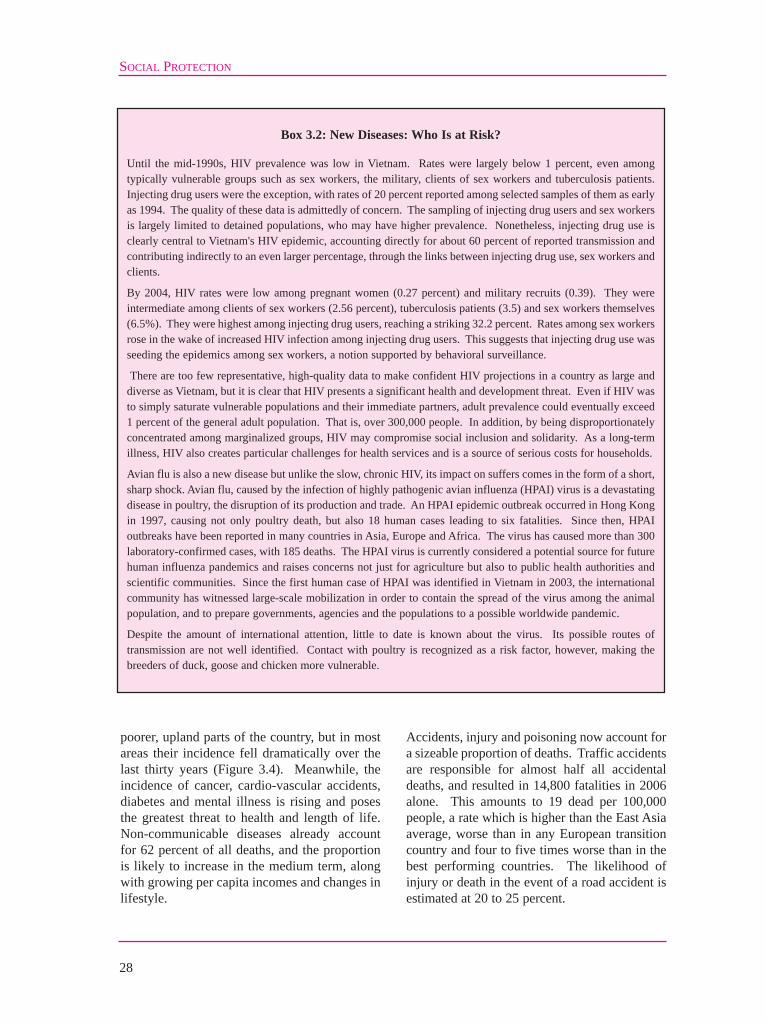
SOCIAL PROTECTION
28
poorer, upland parts of the country, but in mostareas their incidence fell dramatically over thelast thirty years (Figure 3.4). Meanwhile, theincidence of cancer, cardio-vascular accidents,diabetes and mental illness is rising and posesthe greatest threat to health and length of life.Non-communicable diseases already accountfor 62 percent of all deaths, and the proportionis likely to increase in the medium term, alongwith growing per capita incomes and changes inlifestyle.
Accidents, injury and poisoning now account fora sizeable proportion of deaths. Traffic accidentsare responsible for almost half all accidentaldeaths, and resulted in 14,800 fatalities in 2006alone. This amounts to 19 dead per 100,000people, a rate which is higher than the East Asiaaverage, worse than in any European transitioncountry and four to five times worse than in thebest performing countries. The likelihood ofinjury or death in the event of a road accident isestimated at 20 to 25 percent.
Box 3.2: New Diseases: Who Is at Risk?
Until the mid-1990s, HIV prevalence was low in Vietnam. Rates were largely below 1 percent, even amongtypically vulnerable groups such as sex workers, the military, clients of sex workers and tuberculosis patients.Injecting drug users were the exception, with rates of 20 percent reported among selected samples of them as earlyas 1994. The quality of these data is admittedly of concern. The sampling of injecting drug users and sex workersis largely limited to detained populations, who may have higher prevalence. Nonetheless, injecting drug use isclearly central to Vietnam's HIV epidemic, accounting directly for about 60 percent of reported transmission andcontributing indirectly to an even larger percentage, through the links between injecting drug use, sex workers andclients.
By 2004, HIV rates were low among pregnant women (0.27 percent) and military recruits (0.39). They wereintermediate among clients of sex workers (2.56 percent), tuberculosis patients (3.5) and sex workers themselves(6.5%). They were highest among injecting drug users, reaching a striking 32.2 percent. Rates among sex workersrose in the wake of increased HIV infection among injecting drug users. This suggests that injecting drug use wasseeding the epidemics among sex workers, a notion supported by behavioral surveillance.
There are too few representative, high-quality data to make confident HIV projections in a country as large anddiverse as Vietnam, but it is clear that HIV presents a significant health and development threat. Even if HIV wasto simply saturate vulnerable populations and their immediate partners, adult prevalence could eventually exceed1 percent of the general adult population. That is, over 300,000 people. In addition, by being disproportionatelyconcentrated among marginalized groups, HIV may compromise social inclusion and solidarity. As a long-termillness, HIV also creates particular challenges for health services and is a source of serious costs for households.
Avian flu is also a new disease but unlike the slow, chronic HIV, its impact on suffers comes in the form of a short,sharp shock. Avian flu, caused by the infection of highly pathogenic avian influenza (HPAI) virus is a devastatingdisease in poultry, the disruption of its production and trade. An HPAI epidemic outbreak occurred in Hong Kongin 1997, causing not only poultry death, but also 18 human cases leading to six fatalities. Since then, HPAIoutbreaks have been reported in many countries in Asia, Europe and Africa. The virus has caused more than 300laboratory-confirmed cases, with 185 deaths. The HPAI virus is currently considered a potential source for futurehuman influenza pandemics and raises concerns not just for agriculture but also to public health authorities andscientific communities. Since the first human case of HPAI was identified in Vietnam in 2003, the internationalcommunity has witnessed large-scale mobilization in order to contain the spread of the virus among the animalpopulation, and to prepare governments, agencies and the populations to a possible worldwide pandemic.
Despite the amount of international attention, little to date is known about the virus. Its possible routes oftransmission are not well identified. Contact with poultry is recognized as a risk factor, however, making thebreeders of duck, goose and chicken more vulnerable.

While traditional infectious diseases arereceding, emerging communicable diseasespose new threats to public health. SARS,HIV/AIDS and Avian Influenza are the mostvisible examples, especially because of the riskof rapid scale up (Box 3.1). But the re-emergence of diseases which were previouslyunder control, such as Japanese encephalitis,dengue fever and tuberculosis, also represents achallenge for the authorities.
People living with HIV continue to faceconsiderable stigma. By the time theircondition becomes known, many of them losetheir jobs, often under the excuse that theirhealth does not fit their work requirements.This critically reduces the income of theirfamilies, especially when they are thebreadwinners. Women living with HIV tend tobe more highly stigmatized than men due to thecommonly held assumption that HIV is acquiredthrough immoral means, and the socialexpectation that women should uphold themoral integrity of family and society, while mencan be more self-indulgent. Stigma is alsocommon in other contexts, from the denial ofservice in restaurants or shops to the separationof children at school.
Whether due to communicable disease, non-communicable disease or accident, the impactof a health shock on household living standardscan be substantial. A study comparing thesituation of the same households in 1998 and
1993, depending on whether they hadexperienced a major health shock, highlightshow large the effects can be (Table 3.1). Thefindings suggest that the impact is stronger inurban households than in rural households. Thestudy also demonstrates the impact ofhospitalization on household medicalexpenditures. In rural areas, serious illness canbe destabilizing enough to cause a 10 percentdrop in household food intake.
Impacts of this magnitude call for policyinterventions to mitigate health shocks and,when these shocks happen, to reduce theirimpact on household living standards.However, the epidemiological transition ofVietnam has implications on the nature of therequired policies. When morbidity andmortality were related to infectious diseases,vaccination and prevention campaigns with ageographical focus were the most effectiveinterventions. With non-communicablediseases becoming a more important cause ofmorbidity and mortality, curative care gainsprominence, and the focus needs to shift toproviding insurance to individuals andhouseholds, regardless of where they live.
Emerging communicable diseases also call fordifferent policy interventions, involving a closercoordination between health services and otherareas of government, ranging from extensionservices (in the case of Avian Influenza) tosocial policies (in the case of HIV) to
SHIFTS AND SHOCKS
29
Urban Rural
Change expressed in percent, for the household as a whole
Earned income
Medical spending
Food intake
Earned income
Medical spending
Food intake
Death (working age) -30.6 n.s. -18.5 -12.5 n.s. -8.3
Hospitalization (working) n.s. 339.3 n.s. n.s. 292.0 n.s.
Hospitalization (non-working) n.s. 256.8 n.s. n.s. 322.1 n.s.
Serious illness (household head) n.s. n.s. n.s. n.s. n.s. -10.8
Table 3.1: The Economic Consequences of Health Shocks
Source: Based on Adam Wagstaff (2007a). Figures were estimated using data from the 1993 and 1998 VLSS. Death is computedonly if it took place in the two years preceding the 1998 survey; hospitalization, if it spanned at least seven days over theprevious year; serious illness if body mass fell by one standard deviation or more between the surveys. Estimates are forchanges at the household level, everything else being equal; n.s. stands for not statistically significant.

infrastructure and education (in the case oftraffic accidents). Community-based responsesare likely to be important to reach out to groupsthat are poorly positioned to know or demandthe services they need.
PLWDs are another group in need of specialpolicies. The VHLSS 2006 contained a modulewhich allows estimating how large this group isin Vietnam. The questionnaire probesrespondents on seeing, hearing, walking,remembering, caring for themselves andcommunicating. One simple way to present thefindings is to distinguish between "any level ofdisability" and "severe disability". About 15.3percent of the population falls in the formergroup and 3.7 percent in the latter. These figuresreveal a much higher prevalence of disabilitiesthan suggested by previous, official estimates.
A closer inspection shows a strong link betweendisability and age, with the increase in disabilityprevalence as age rises being more marked thanin other countries. There are higher reportedlevels of disability for women than for men,possibly reflecting their older average age.There are no discernible patterns linking thebroader category of disability to income group,and no regional patterns either. But a strongassociation exists between severe disability andpoverty.
A small survey of PLWDs in Hung Yen, QuangNgai and Ho Chi Minh City (HCMC) is quitetelling about the difficulties they face. Theeducational attainment of this group is muchlower than that of the general population, withmore than one third of the sample beingilliterate. This low level of education may resultfrom disability itself and its impact on learningcapacity. But it also reflects the difficulties facedby this group in accessing education. By thetime of the survey, only half of the sample wasworking, mainly on precarious jobs includingpetty trade and simple services such as food andstall cooking and motorbike washing.
Market fluctuations
The adoption of market mechanisms hasresulted in an extraordinary improvement of
living standards in Vietnam, but it also hasbrought in a number of dramatic changes. Theconversion of land from agricultural to non-agricultural purposes, the shift from farming towage employment and the movement of peoplefrom rural to urban areas are all signs of avibrant economy that offers opportunity. Butthese changes are also potential sources ofvulnerability, from landlessness tounemployment to the loss of social networks.
Some groups are particularly vulnerablebecause they are already poor, or are barelyabove the poverty line, or lack sufficient assetsto cope with shocks (Table 3.2). Among themare farmers, those working for other householdsor for collectives and those who areeconomically inactive. Those working for thegovernment or in a foreign invested companyappear to be least vulnerable by these criteria.
Recent changes in land use influencevulnerability as well. For example, increasedreliance on aquaculture in coastal zones hasgenerated high returns for those with sufficientinvestment capital and connections with localofficials. But this trend may increase thevulnerability of groups without access to suchassets. This is because aquaculture ponds havereplaced or degraded public goods assets (suchas coastal mangroves and wetlands for capturefisheries) that previously helped diversifylivelihoods, especially in times of stress.
Global integration has opened new outlets fordomestic production, allowing economies ofscale to materialize and supporting massiveproductivity gains. But exposure tointernational markets can also result in largeprice fluctuations, as experienced by coffeefarmers at the turn of the millennium. As theeconomy diversifies, and more sophisticatedmechanisms are developed to hedge againstrisks, some of these vulnerabilities will startreceding. However, in the medium term even astep as positive as WTO accession can be adouble-edged sword. For instance, the removalof subsidies for fertilizers could affect farmers.
In relation to global integration, one importantsource of vulnerability is the NME status given
SOCIAL PROTECTION
30

SHIFTS AND SHOCKS
31
to Vietnam at the time of accession. Thisstatus makes it much easier for its tradingpartners to impose anti-dumping measures,which in turn can have a serious impact on theliving standards of specific population groups(Box 3.3).
The importance of market fluctuations as asource of vulnerability is highlighted by a recentsurvey conducted among poor households in 24rural communes across eight provinces. Askedabout the economic risks they faced, 87 percentof respondents declared to have experienced atleast one major shock over the previous threeyears. On average, each household had sufferedtwo shocks. Floods, droughts andenvironmental degradation were often
mentioned as sources of vulnerability. Amongfarmers, crop failure was identified as thebiggest risk, followed by the lack ofemployment and the ups and downs of themarket prices for key agricultural products.
The most common measure taken by a vastmajority of households to address the effects ofthese shocks was to reduce expenditures. Twothirds of them also borrowed, mainly fromprivate lenders and relatives, friends orneighbors. One third relied on relief programsoffered by the government. About 12 percentof the respondents declared having takenchildren out of school, and almost ten percenthad a family member migrating to urban areasfor work.
Percent of households who
Occupation of household head Are poor
Are less than 10 percent above the
poverty line
Have less than 15
million dong in assets
Meet any of these three
criteria Inactive 12.5 3.8 2.6 14.2 Employed by
Government 1.5 1.6 0.7 6.1 State-owned enterprises (SOEs) 4.7 1.1 1.3 3.4 Foreign-invested company 2.5 0.0 0.0 0.4 Private sector 4.2 2.9 2.9 2.4 Households and collective enterprises 20.4 6.8 7.2 13.3
Non-farm self-employment 6.8 2.2 1.7 22.6 Farmers 25.1 5.8 4.8 37.5 Total 16.0 4.4 3.7 100
Table 3.2: Who Is more Vulnerable?
Source: Based on preliminary GSO data for 2006.

SOCIAL PROTECTION
32
Box 3.3: Anti-Dumping and Catfish Farmers in the Mekong Delta
In June 2002, US catfish farmers filed a lawsuit against Vietnam, arguing that its exports of frozen catfish (that is,tra and basa) fillets were conducted at prices below the cost of production. A few months later, in January 2003,the US Department of Commerce ruled in favor of the plaintiffs. Because Vietnam is not recognized as a marketeconomy, it is claimed that its domestic prices are distorted and therefore its domestic costs cannot be used toassess whether production or exports are subsidized. Instead, the production costs of a "surrogate", supposedlycomparable country are used. In the case of Vietnamese catfish, the US Department of Commerce choseBangladesh as the surrogate country. The comparison between Vietnamese prices and Bangladeshi costs resultedin tariffs ranging between 37 and 64 percent on imports of frozen catfish from Vietnam. In July 2003, the USInternational Trade Commission ratified the ruling. Shortly after, Vietnamese exports of catfish to the USplummeted.
The impact of this anti-dumping measure on the living standards of catfish farmers can be assessed usinghousehold data from the 2002 and 2004 VHLSS, which span the period right before and after the tariffs on catfishwere imposed. A key feature of the VHLSS is that thousands of households surveyed in 2002 were interviewedagain in 2004. Many among them were aquaculture farmers in the Mekong River Delta, the main area wherecatfish is produced in Vietnam. Comparing the change in the living standards of these farmers to that ofaquaculture farmers in other regions, where catfish is not produced, gives an estimate of the consequences of theanti-dumping measure.
Results indicate that the shock has an impact on income (via lower prices and quantities), per capita expenditures,and current use of inputs, especially in fishing (but also in agriculture more broadly). The average income of atypical catfish farmer fell by 3 to 10 percent, whereas per capita expenditure dropped by 11 to 17 percent. Laborsupply increased, partly to compensate the drop in fish-related income. However, long-run responses, likeexpenditure in education and health, and fundamentally school attendance, were not affected. It would then seemthat catfish farmers perceived the shock as being temporary.
Source: Guido Porto (2007).

PART II:POLICIES AND
PROGRAMS

35
Abundance of opportunities for gainfulemployment is one of the most important formsof social protection for households in general,and for the poor in particular. Moving out offarming jobs into self-employment, andespecially into salaried jobs, has been one ofthe main avenues for poverty reduction inVietnam. This transition has often taken placeby moving out of rural areas. Lowunemployment rates, high occupationalmobility and chances for migrants to do betterare thus essential for households to escapepoverty and cope with adverse shocks. So far,labor markets in Vietnam have performedrelatively well. But global integration brings innew challenges and labor market regulationshave to be adapted to a more complex anddiversified economy. In this context, theintroduction of an unemployment insurancescheme may not be a sufficient policy response,assuming that it is at all warranted. The mosturgent priority is to spur the growth of salariedemployment and to support its formalization.This entails a delicate balance betweenpreserving competitiveness and protectingworkers from abuse. The revision of minimumwage policies and the mechanisms forcollective bargaining is crucial in this respect.The commitments made by Vietnam in thecontext of WTO accession imply that theminimum wages paid by domestic and foreigncompanies will need to be unified in a fewyears. To avoid penalizing job creation in lessdeveloped parts of the country, a differentiationof minimum wages by region may beconsidered. Also, to avoid an explosion ingovernment spending, minimum wages shouldbe dissociated from the setting of salaries forcivil servants and pensions for retirees. As forcollective bargaining, the increase in the
number of wildcat strikes over time suggeststhat the current mechanisms for disputeresolution are increasingly ill-adapted toaddress labor discontent. Facilitating collectivebargaining at the enterprise level may also holdthe key for Vietnam to exit the NME statusearly on, hence to be able to protect its jobsfrom unjustified anti-dumping measures.
Activity and employment
Vietnam is a nation at work. At 71 percent, thefraction of the working-age population that iseconomically active is high compared to othercountries and among the highest in the SouthEast Asia region. Unlike other countries, thefraction is very similar for men and for women.Meanwhile, the fraction of the working-agepopulation in the total population is bound toincrease for some time. This is because ofVietnam's rapid demographic transition. Thepopulation growth rate declined from 1.9percent per year in the early 1990s to 1.3percent at the beginning of this century. As aresult, the fraction of children will decline,while the numerous children of today will beentering the labor market.
With roughly 1.4 million people joining thelabor force every year, both economicprosperity and social stability hinge on veryrapid job creation. So far, the performance ofthe labor market has been quite remarkable inthis respect. Over the decade and a half forwhich representative household surveys areavailable, the unemployment rate has remainedstable and relatively low (Table 4.1). Theprecision of the estimate may be questioned asthe available surveys are not well designed tomonitor the labor market. But it is clear that
4. LABOR MARKETS

unlike other transition economies, and despitethe remarkable transformation of its economicstructure, Vietnam has not faced a massunemployment problem.
To some extent, this relatively goodperformance simply reflects the fact that amajority of the active population still works inagriculture. Underemployment, more thanoutright unemployment, is the main mechanismfor labor adjustment in rural areas. But thefraction of the working age population forwhich farming is the main occupation has beendeclining rapidly, from about half in 1993 to athird in 2006. Meanwhile, the fraction workingfor a wage or a salary has increased steadily,from 16.5 to 27.7 percent.
In the early 1990s, civil servants and publicsector workers accounted for the bulk of wageemployment. Not anymore. Their share of thelabor force has slightly increased, partly as aresult of the expansion in the coverage of socialservices and partly because of the recruitment ofvillage chiefs into government administration.But the share of wage employment accounted
for by domestic private enterprises and foreign-invested companies has increased remarkablyover this period. The dynamism of thesecompanies accounts for the bulk of job creationduring this period, and helps explain whyVietnam has not faced mass unemployment.
Not everybody working for a wage or a salary isin the formal sector of the economy, however.In the context of the labor market, formality canbe defined in relation to the Labor Code,introduced in 1994 and amended in 2002. Intheory, the Labor Code applies to urban andrural laborers who have signed a labor contractor have a verbal agreement with theiremployers. The 2002 amendment defineddifferent kinds of contracts such as indefiniteterm, definite term and seasonal work. Laborersworking on farms are also theoreticallyprotected by the Labor Code. The reality is thatfew workers in rural areas benefit from suchprotection outside state-owned farms andplantations. Even in urban areas, non-compliance with labor regulations iswidespread. For instance, a study on migrantsrevealed that only 36 percent of those in paid
SOCIAL PROTECTION
36
1993 1998 2002 2004 2006 Inactive 19.4 15.3 16.7 17.2 19.5 Active 80.6 84.7 83.3 82.8 79.7 Employed Government 3.1 3.6 4.4 5.3 5.5 SOEs 2.5 2.6 3.3 3.1 3.3 Foreign-invested companies 0.1 1.1 0.8 1.3 1.6 Private enterprises 10.8 10.1 15.7 17.0 17.3 Non-farm self-employment 14.7 16.5 19.1 16.5 19.5 Farmers 49.5 50.2 38.2 38.8 32.6 Unemployed 0.6 1.8 0.8 0.8 Urban unemployment rate (MOLISA) 6.9 6.0 5.6 4.8
Table 4.1: The Structure of the Labor Force
Source: Based on data from GSO and MOLISA. GSO data for 2006 are preliminary. All figures are in percent of the populationaged 15 to 64, except for unemployment rates, which are in percent of the active population. Employment figures arebased on main occupation. Household businesses are treated as private enterprises for their hiring of wage workers, andas a source of non-farm self-employment for the jobs they provide to household members on an unpaid basis.

employment had a labor contract, with theproportion being lower among women.
Assessing trends in formalization, earnings andworking conditions is difficult, however, due tothe absence of adequate survey instruments.Household surveys have proved very useful inVietnam to assess poverty and measure progressin human development. But these surveys aretoo demanding to implement, so that they areconducted only every two years. And theirlabor modules tend to be succinct. A reliablemonitoring of labor market developments, as
the economy diversifies and further integrateswith the outside world will require a high-quality labor force survey conducted on acontinuous basis (Box 4.1).
Labor earnings
Low labor costs remain one of Vietnam's mainsources of competitiveness, especially whentaking into account that Vietnamese workerslearn fast and have a high work ethic. But laborearnings have been increasing rapidly.
LABOR MARKETS
37
Box 4.1: Towards a Better Monitoring of the Labor Market
How economic transition, rapid growth and global integration are affecting job quality and working conditions inVietnam remains an open question. One important problem is the lack of high-quality tools to monitor labormarket developments. Even assessing the evolution of simple indicators such as the share of wage workers in totalemployment is difficult. For instance, both the Labor Force and Employment Survey (LFES) implemented byMOLISA and the household expenditure surveys conducted by GSO put that share at around 17 to 19 percent inthe years around 1996 to 1998. And both report a substantial growth in the share in subsequent years. But around2004 the LFES estimates the share to be 26 percent, whereas the VHLSS puts it at 32 percent. Other problemsrelate to the ambiguity of some of the concepts and definitions used. For instance, some wage earners may workin the informal sector, and some self-employed in the formal sector.
A diagnosis of the existing surveys in Vietnam shows that none of them provides reliable estimates of informalemployment. The LFES concentrates on main occupation, and does not collect information on labor contract,benefits, or the characteristics of the employer. The VHLSS is probably the best data source at present.Nevertheless, being mainly designed to obtain income and expenditures estimates, it is weak on labor marketindicators and the accounting of informal sector production. As for the Annual Household Business Survey(AHBS), its main shortcoming is to exclude non-located enterprises, an important component of the informalsector. This has resulted in unsolved debates as to how many non-farm household businesses there are in Vietnam.
In 2007, taking advantage of the transfer of the LFES from MOLISA to GSO, the questionnaire design wassignificantly improved. The number of questions increased from around 25 to 50, allowing an enlarged coverageof labor markets indicators. The August 2007 survey will for the first time capture informal employment inVietnam, including both primary and secondary jobs, and both jobs in the informal sector and unprotected jobs inthe formal sector. The new questionnaire also ensures a better compatibility with international labor marketconcepts and definitions (for instance, on unemployment and underemployment).
Meanwhile, a household business and informal sector survey has been launched. Following the principle of mixedsurveys (covering both households and enterprises), it focuses on unincorporated enterprises identified asemployers or own-account workers in the LFES sample. Two representative pilot surveys have been conducted(in Hanoi and HCMC) and scaling up to the national level is scheduled for 2008.
In the medium run, the objective should be to consolidate the LFES and bring it up to the best internationalstandards. To attain this goal, it should become a continuous survey, able to provide quarterly estimates of themain labor markets indicators. It should also include a panel component, whereby the same respondents areinterviewed more than once over time, so as capture employment and earnings transitions. And it should allowfor flexible modules to address specific labor market issues, such as gender, training or job quality.
Source: Based on Mireille Razafindrakoto and Francois Roubaud (2007).

The exact speed depends on the indicatorconsidered. The average earnings of a full-timeworker in domestic private enterprises provide auseful perspective. In 1998, those earningsstood at 554 thousand VND per month; by2006, they had escalated to 1.420 thousand. Thefigures include bonuses and overtime pay, aswell as labor earnings from secondaryoccupations. They exclude the value ofpayments in kind and benefits such as healthinsurance or access to old-age pension. Basedon this indicator, nominal labor earningsincreased by a cumulative 12.5 percent per yearduring this period. Given that consumer pricesincreased by 4.2 percent during the same period,the annual growth rate of labor earnings, in realterms, was 8.3 percent.
Part of this growth in labor earnings wasassociated with workers getting better paid intheir jobs; part resulted from workers movingfrom lower to higher paying jobs. Occupationaland geographical mobility have actually been afundamental part of this moving-up process.
Needless to say, labor migrants to urban areasoften face considerable hardship, and their payand working conditions are far from ideal. Astudy of labor migrants to cities conducted in2004-2005 reported earnings substantiallybelow those of city residents. Most of themigrants made less than 1 million VND amonth; two out of five less than 600 thousand amonth. Women were much more likely to be inthe lowest paying group. More than half of themigrants interviewed also reported receivingunstable income. However, when asked if theyknew about the expected difficulties before theymigrated, four out of five said they did. And anastounding 95 percent of them declared that inspite of those difficulties migrating had been asound decision.
These findings indicate that labor migration inVietnam takes place with high risks and costs,but on average the payoffs still outweigh thehardship, especially taking into account thelimited opportunities for gainful employment inrural areas. When asked to compare theirearnings in the cities with those they could makehad they stayed in their place, again 95 percent
reported that they were higher or much higher.
A comprehensive analysis of job transitions,using a nationally representative sample ofhouseholds, reveals a more complex picture. Acomparison of labor earnings across alloccupations between 2002 and 2004 shows thatconsiderable gains were also made by movingout of wage employment into self-employment.This may reflect the creation of own businesses,after a phase accumulating savings andknowledge in a paid job. The analysis ofhousehold expenditures, instead of individuallabor earnings, yields a similar result, with gainsbeing particularly important for households whowere not engaged in farming before moving intoopening their own businesses. At the other end,those who had to complement their farmingactivity with some wage employment, and thosewho remained engaged in farming exclusively,fared much worse.
Another way to understand the mechanismswhich have allowed so many Vietnameseworkers to secure higher earnings is to look attheir individual characteristics. An analysis ofthe determinants of labor earnings highlights theimportance of education (Figure 4.1). In theearly stages of economic transition, there wasrelatively little differentiation in labor earnings.Pay compression was deliberate in the publicsector. Out of it, the redistribution ofagricultural land to rural households hadgenerated relatively similar opportunities formostly everybody. However, with thedevelopment of the market economy, those withhigher skills have faced increasingly betterearnings opportunities. Beyond fluctuationsthat may be attributed to quality data, theincrease in the returns to education is one thesalient trends of this period. In 1993, anadditional year of schooling resulted in laborearnings being only 1 percent higher onaverage. By 2002, the corresponding gain was6 percent and since then it roughly stabilized.This widening gap stresses the importance ofequality of opportunity in education.
The development of a market economy mighthave been more of an equalizer in otherrespects. In particular, the gender gap in
SOCIAL PROTECTION
38

earnings appears to have declined during the1990s. Other things equal, a woman at workused to earn 24 percent less than a man in 1993.By 1998, the gap had narrowed to about 15percent and it remained at roughly that levelsince then.
Other salient trends include the catch up ofearnings in government, with civil servantsbeing underpaid in the 1990s and experiencing arecovery subsequently, especially around 2004where minimum wages were raisedsubstantially. Workers in smaller cities alsoappear to have experienced important gains.Those in larger cities clearly earn much more,but the fluctuations of the estimate (especially in2002) cast doubts on its precision.
Unemployment
While unemployment has not been a major issuein Vietnam so far, rapid global integration isexpected to lead to increased competition acrossall sectors, and this in turn could result in
substantial economic restructuring. Recentexperience also shows that important job lossescould result from anti-dumping measures byVietnam's trade partners. It is thereforeimportant to understand who the unemployedare, and what measures could be taken tofacilitate their transition to work.
So far, the bulk of the unemployed are young,urban people with secondary or even tertiaryeducation. Very few of them are unemployeddue to job loss or dismissal (Figure 4.2).
Data from the 2003 National SurveyAssessment of Vietnamese Youth providevaluable insights into the employmentopportunities and paths of this populationgroup. Overall, 57 percent of working youth areself-employed, with two thirds of them doingunskilled agricultural jobs. Even after twodecades of economic reforms, only a modest 6percent of the employed youth reported workingin domestic private enterprises and 5 percent inforeign-owned companies or joint ventures.
LABOR MARKETS
39
Figure 4.1: Determinants of Labor Earnings
Source: Based on data from GSO. The figures are based on the estimated coefficients of aMincerian equation explaining hourly earnings in the main occupation of therespondent.
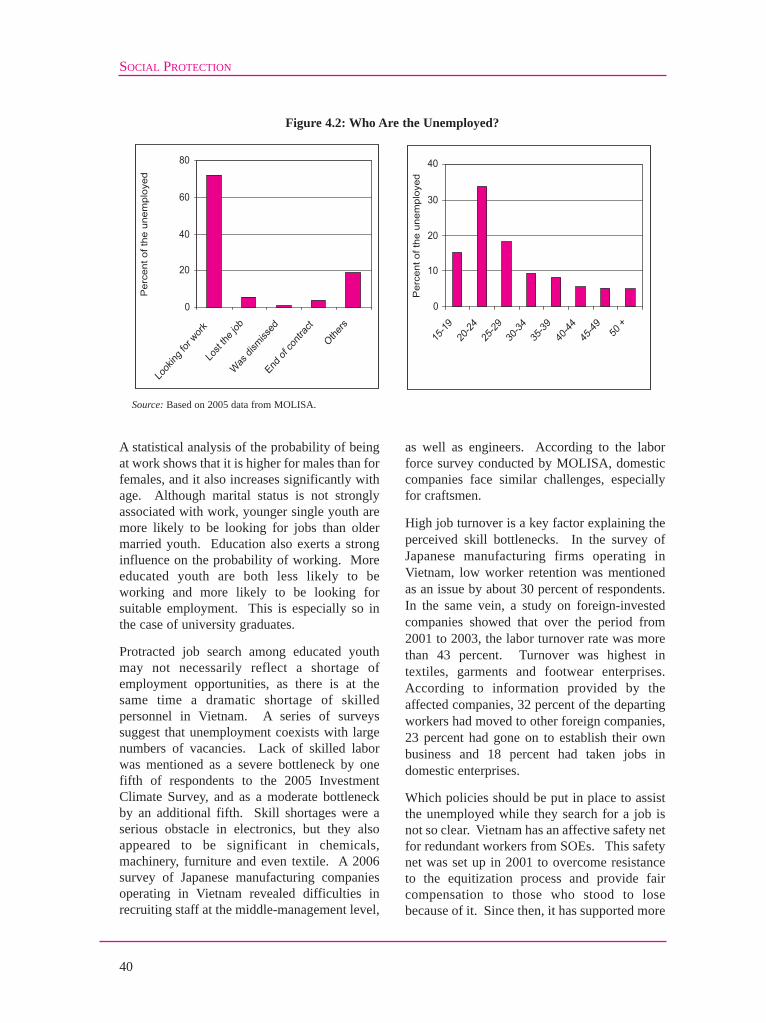
A statistical analysis of the probability of beingat work shows that it is higher for males than forfemales, and it also increases significantly withage. Although marital status is not stronglyassociated with work, younger single youth aremore likely to be looking for jobs than oldermarried youth. Education also exerts a stronginfluence on the probability of working. Moreeducated youth are both less likely to beworking and more likely to be looking forsuitable employment. This is especially so inthe case of university graduates.
Protracted job search among educated youthmay not necessarily reflect a shortage ofemployment opportunities, as there is at thesame time a dramatic shortage of skilledpersonnel in Vietnam. A series of surveyssuggest that unemployment coexists with largenumbers of vacancies. Lack of skilled laborwas mentioned as a severe bottleneck by onefifth of respondents to the 2005 InvestmentClimate Survey, and as a moderate bottleneckby an additional fifth. Skill shortages were aserious obstacle in electronics, but they alsoappeared to be significant in chemicals,machinery, furniture and even textile. A 2006survey of Japanese manufacturing companiesoperating in Vietnam revealed difficulties inrecruiting staff at the middle-management level,
as well as engineers. According to the laborforce survey conducted by MOLISA, domesticcompanies face similar challenges, especiallyfor craftsmen.
High job turnover is a key factor explaining theperceived skill bottlenecks. In the survey ofJapanese manufacturing firms operating inVietnam, low worker retention was mentionedas an issue by about 30 percent of respondents.In the same vein, a study on foreign-investedcompanies showed that over the period from2001 to 2003, the labor turnover rate was morethan 43 percent. Turnover was highest intextiles, garments and footwear enterprises.According to information provided by theaffected companies, 32 percent of the departingworkers had moved to other foreign companies,23 percent had gone on to establish their ownbusiness and 18 percent had taken jobs indomestic enterprises.
Which policies should be put in place to assistthe unemployed while they search for a job isnot so clear. Vietnam has an affective safety netfor redundant workers from SOEs. This safetynet was set up in 2001 to overcome resistanceto the equitization process and provide faircompensation to those who stood to losebecause of it. Since then, it has supported more
SOCIAL PROTECTION
40
Figure 4.2: Who Are the Unemployed?
Source: Based on 2005 data from MOLISA.
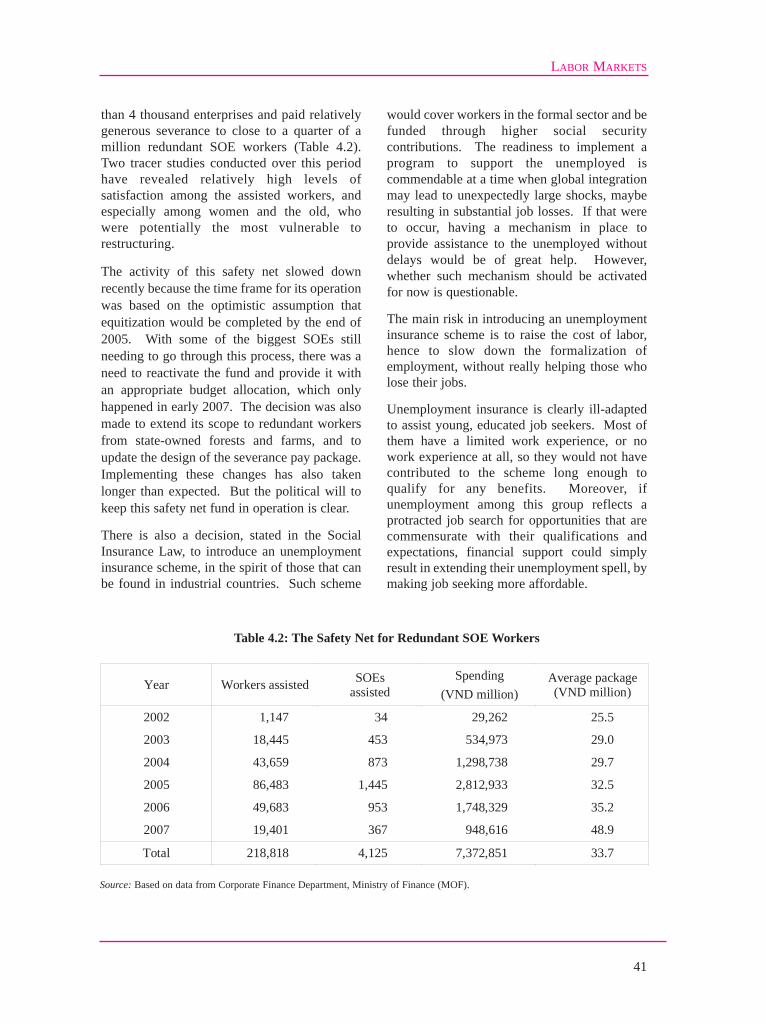
than 4 thousand enterprises and paid relativelygenerous severance to close to a quarter of amillion redundant SOE workers (Table 4.2).Two tracer studies conducted over this periodhave revealed relatively high levels ofsatisfaction among the assisted workers, andespecially among women and the old, whowere potentially the most vulnerable torestructuring.
The activity of this safety net slowed downrecently because the time frame for its operationwas based on the optimistic assumption thatequitization would be completed by the end of2005. With some of the biggest SOEs stillneeding to go through this process, there was aneed to reactivate the fund and provide it withan appropriate budget allocation, which onlyhappened in early 2007. The decision was alsomade to extend its scope to redundant workersfrom state-owned forests and farms, and toupdate the design of the severance pay package.Implementing these changes has also takenlonger than expected. But the political will tokeep this safety net fund in operation is clear.
There is also a decision, stated in the SocialInsurance Law, to introduce an unemploymentinsurance scheme, in the spirit of those that canbe found in industrial countries. Such scheme
would cover workers in the formal sector and befunded through higher social securitycontributions. The readiness to implement aprogram to support the unemployed iscommendable at a time when global integrationmay lead to unexpectedly large shocks, mayberesulting in substantial job losses. If that wereto occur, having a mechanism in place toprovide assistance to the unemployed withoutdelays would be of great help. However,whether such mechanism should be activatedfor now is questionable.
The main risk in introducing an unemploymentinsurance scheme is to raise the cost of labor,hence to slow down the formalization ofemployment, without really helping those wholose their jobs.
Unemployment insurance is clearly ill-adaptedto assist young, educated job seekers. Most ofthem have a limited work experience, or nowork experience at all, so they would not havecontributed to the scheme long enough toqualify for any benefits. Moreover, ifunemployment among this group reflects aprotracted job search for opportunities that arecommensurate with their qualifications andexpectations, financial support could simplyresult in extending their unemployment spell, bymaking job seeking more affordable.
LABOR MARKETS
41
Year Workers assisted SOEs assisted
Spending (VND million)
Average package (VND million)
2002 1,147 34 29,262 25.5
2003 18,445 453 534,973 29.0
2004 43,659 873 1,298,738 29.7
2005 86,483 1,445 2,812,933 32.5
2006 49,683 953 1,748,329 35.2
2007 19,401 367 948,616 48.9
Total 218,818 4,125 7,372,851 33.7
Table 4.2: The Safety Net for Redundant SOE Workers
Source: Based on data from Corporate Finance Department, Ministry of Finance (MOF).

SOCIAL PROTECTION
42
Unemployment insurance is also ill-suited tohelp other potentially vulnerable groups ofworkers. The entry of large supermarketchains in Vietnam, with their more efficientsupply chains and management techniques,could affect the earnings of householdbusinesses engaged in retail trade. But themembers of these households would not beeligible to claim unemployment benefitsbecause they would not have contributed. Asfor workers in the formal sector, under theLabor Code they are entitled to a reasonableamount of severance pay. Admittedly, thatentails an additional cost for the restructuringenterprises. But the additional contributiontowards an unemployment insurance schemewould represent an additional cost for allenterprises, not just those undergoingrestructuring, at a time when minimum wagehikes and reforms to social insurance programsalready risk increasing labor costssubstantially.
An unemployment insurance scheme would notbe a useful substitute for the safety net forredundant SOE workers either. No standardscheme would be able to match the generosityof the current safety net. Without suchgenerosity, the equitization of large SOEs couldbe stalled. The efficiency gains that can beexpected from bringing business-orientedoutsiders into the management of large SOEsare bound to be sizeable. In fact, completing therestructuring of the state sector is one the lastmajor hurdles for Vietnam to fully become amarket economy. The safety net for redundantSOE workers can be seen as a compensatingmechanism, to avoid making losers along theway, rather than as a pure social protectionmechanism. From that perspective, replacing itby unemployment insurance benefits would notbe advisable.
Wage setting
Supporting rapid employment generation,especially by the formal sector of the economy,is the most effective way to address the risk ofunemployment. To achieve this goal a goodbalance is required between protecting workers
from abuse and keeping formal enterprisescompetitive. Policies influencing wage settingare especially important in this respect.
Vietnam introduced a minimum wage forforeign-invested companies in 1990 and one fordomestic enterprises in 1993. The latter is thesame for the entire country. Since 1992, theformer varies by region, depending on theprovince and on whether the companies arelocated in urban or rural districts. Minimumwages were adjusted in several opportunitiesover the years, with the minimum wage fordomestic enterprises growing faster (Table 4.3).The ratio between minimum wages and averagewages in domestic enterprises has increasedmoderately, from 25 percent in 1998 to 32percent in 2006.
In spite of these adjustments, the minimumwages applying to foreign companies remainsubstantially above the domestic minimumwage. The margin varies from 53 to 93 percentdepending on the region. This margin isincompatible with the national treatmentprinciple of the WTO. Vietnam is thusconfronted with the need to unify the minimumwage applying to domestic and foreigncompanies. And because the latter cannot bereduced, unification will require that theminimum wage applying to domesticenterprises be increased rapidly. The prospectof affecting employment creation andformalization is thus real, and requires theadoption of a sound policy strategy.
A first step is to identify who the minimumwage earners are. The characteristics of full-time workers whose earnings fall within anarrow range of the applicable minimum wageprovide a good indication in this respect. Usinga 20 percent band (from 10 percent below to 10percent above) and data from 2004, it appearsthat some 2 to 2.7 percent of all wage earnersare paid the minimum wage. The range in theestimates is due to the various defensible waysto compute labor earnings. If part-time andcasual workers are considered, and theminimum wage is computed on an hourly basis,some 3.1 to 6.1 of wage earners appear to be atthe minimum.
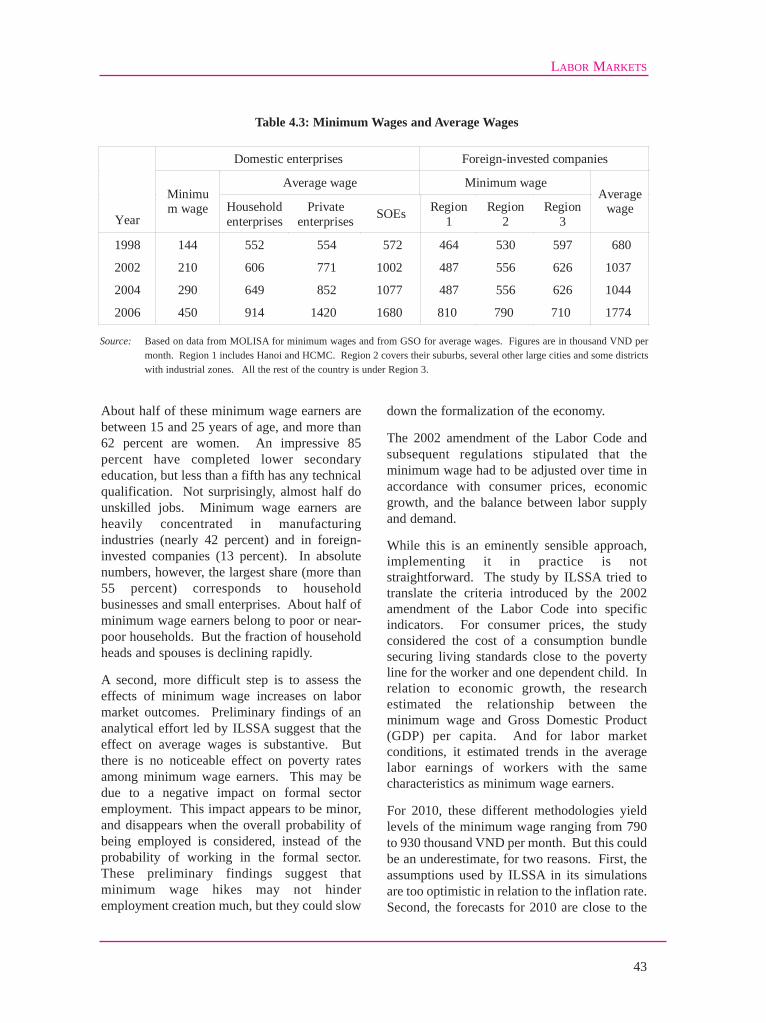
About half of these minimum wage earners arebetween 15 and 25 years of age, and more than62 percent are women. An impressive 85percent have completed lower secondaryeducation, but less than a fifth has any technicalqualification. Not surprisingly, almost half dounskilled jobs. Minimum wage earners areheavily concentrated in manufacturingindustries (nearly 42 percent) and in foreign-invested companies (13 percent). In absolutenumbers, however, the largest share (more than55 percent) corresponds to householdbusinesses and small enterprises. About half ofminimum wage earners belong to poor or near-poor households. But the fraction of householdheads and spouses is declining rapidly.
A second, more difficult step is to assess theeffects of minimum wage increases on labormarket outcomes. Preliminary findings of ananalytical effort led by ILSSA suggest that theeffect on average wages is substantive. Butthere is no noticeable effect on poverty ratesamong minimum wage earners. This may bedue to a negative impact on formal sectoremployment. This impact appears to be minor,and disappears when the overall probability ofbeing employed is considered, instead of theprobability of working in the formal sector.These preliminary findings suggest thatminimum wage hikes may not hinderemployment creation much, but they could slow
down the formalization of the economy.
The 2002 amendment of the Labor Code andsubsequent regulations stipulated that theminimum wage had to be adjusted over time inaccordance with consumer prices, economicgrowth, and the balance between labor supplyand demand.
While this is an eminently sensible approach,implementing it in practice is notstraightforward. The study by ILSSA tried totranslate the criteria introduced by the 2002amendment of the Labor Code into specificindicators. For consumer prices, the studyconsidered the cost of a consumption bundlesecuring living standards close to the povertyline for the worker and one dependent child. Inrelation to economic growth, the researchestimated the relationship between theminimum wage and Gross Domestic Product(GDP) per capita. And for labor marketconditions, it estimated trends in the averagelabor earnings of workers with the samecharacteristics as minimum wage earners.
For 2010, these different methodologies yieldlevels of the minimum wage ranging from 790to 930 thousand VND per month. But this couldbe an underestimate, for two reasons. First, theassumptions used by ILSSA in its simulationsare too optimistic in relation to the inflation rate.Second, the forecasts for 2010 are close to the
LABOR MARKETS
43
Domestic enterprises Foreign-invested companies
Average wage Minimum wage
Year
Minimum wage Household
enterprises Private
enterprises SOEs Region 1
Region 2
Region 3
Average wage
1998 144 552 554 572 464 530 597 680
2002 210 606 771 1002 487 556 626 1037
2004 290 649 852 1077 487 556 626 1044
2006 450 914 1420 1680 810 790 710 1774
Table 4.3: Minimum Wages and Average Wages
Source: Based on data from MOLISA for minimum wages and from GSO for average wages. Figures are in thousand VND permonth. Region 1 includes Hanoi and HCMC. Region 2 covers their suburbs, several other large cities and some districtswith industrial zones. All the rest of the country is under Region 3.
current minimum wage levels in foreign-invested companies. It is unlikely that workersin these companies would be satisfied if therewas no increase of the applicable minimumwage between now and then. Vietnam is thusconfronted with the need to double, if not totriple, the domestic minimum wage over just afew years.
Absorbing such an increase without losing incompetitiveness could be a serious challenge formany domestic enterprises. The governmenthas sensibly chosen to introduce a regionaldistinction for all minimum wages, in the spiritof the one in force nowadays for foreign-invested companies. In this case, the increase inminimum wages would be fastest in Hanoi andHCMC, and slowest in the least developedprovinces.
The doubling or even trebling of minimumwage levels over a short period of time couldalso have an adverse impact on public finance.The salaries of civil servants are determinedthrough formulas involving the domesticminimum wage and coefficients related tooccupation and seniority, plus a series ofbonuses and additional payments. Because ofthe latter, a minimum wage hike would result ina smaller increase of the wage bill. But theincrease could still put public finance understrain. The domestic minimum wage also entersin the benefit formulas determining the pensionsof retired civil servants. Therefore, governmentliabilities would also increase substantially inthe event of a minimum wage hike. Thisstresses the importance of separating minimumwage policies from civil service pay andpension formulas.
Industrial relations
According to Vietnam's labor regulations, anyenterprise employing five workers or more musthave a trade union or a temporary trade unionexecutive established within its first six monthsof operation. Yet, compliance is very limited.The majority of enterprises in Vietnam do nothave a representative with the right to bargainon behalf of workers. According to the VietnamGeneral Confederation of Labor (VGCL), 90
percent of SOEs, one third of privateenterprises, and half of foreign-investedcompanies had a trade union by 2005. And eventhis could be an overestimate.
Most importantly, there are serious deficienciesin the representational funcion of existing tradeunions at the enterprise level. The majority areled by the management staff of the enterprise.Trade unions at enterprise level also haveproblems of capacity in terms of representationand bargaining skills. VGCL estimated that 96percent of SOEs had collective agreements inforce in 2006. But the reported fraction droppedto 40 percent in foreign-invested companies,and further to 25 percent in domestic privateenterprises.
A study of industrial relations in selectedprovinces reached similar conclusions. Only10.4 percent of enterprises in Ha Tay hadcollective bargaining agreements in 2005. Theshare was as low as 3.7 percent in Khanh Hoa.Not only there is a limited number of enterpriseswith collective bargaining agreements, but thecoverage of existing collective agreements isalso quite restrictive. Many of them are simplereplications of the Labor Code rather than theoutcome of a real negotiation between workersand employers. Wage bargaining is thus theexception rather than the norm.
Meanwhile, labor conflicts have been on therise, especially among foreign-investedcompanies (Figure 4.3). The above-mentionedstudy of industrial relations found that 90percent of strikes had happened due to violationof labor regulations by employers, and 80percent was related to wage issues. However, inthe absence of a well-established negotiationmechanism at the enterprise level, most of theseconflicts had been processed outside the legalframework and without trade unioninvolvement. The increase in the number oflabor conflicts has been related to issues such assalaries, working time, meals and workingconditions, and they do not necessarily entail aviolation of legal rights by employers. Laborconflicts also result from the lack of adjustmentof the minimum wage for foreign companies.Many workers have been paid the same wage
SOCIAL PROTECTION
44

LABOR MARKETS
45
level for many years, while the cost of living hasconsiderably increased.
The lack of workers' representation at theenterprise level and the prevalence of wildcatstrikes suggest that the legal framework forcollective bargaining of Vietnam is not welladapted to the maturity of its economy. Currentregulations are too stiff in only allowing a tradeunion executive committee or a temporary tradeunion to raise proposals for negotiation andengage in labor collective agreements. They donot allow for more than one collectivebargaining agreement at the enterprise level.They do not permit those working on pieceproduction to be associated with wagenegotiations, or to engage in industrial action.And they do not protect workers serving as tradeunion representatives from harassment byabusive employers.
Current labor market regulations also ignorethe possibility of collective bargaining takingplace at higher levels. The Vietnam Chamber
of Commerce and Industry (VCCI) and theVietnam Cooperative Association are appointedto be the national representatives of employers,much the same as VGCL represents workers.But no provisions exist for negotiation atsectoral or regional levels. For instance, there isno legal representative actor of employers insectors such as garments, textiles or cement.
Other shortcomings of the legal frameworkrefer to the settlement of disputes. Forinstance, there is no time limit for negotiation.In the event of disagreements, the law requiresthe Labor Conciliation Council to assist infinding a solution. But the Council is simplymade of the representatives of the two parties inthe negotiation. In the absence of anagreement, the involvement of an independentthird party would be required. Laboradministration agencies could play this role.However, they are not allowed to interveneunless requested to do so by the two parties.And even then, their responsibility is describedin vague terms.
Figure 4.3: Number of Strikes by Enterprise Ownership
Source: Based on data from MOLISA.

In late 2006, a number of articles of theLabor Code regarding the resolution ofcollective labor disputes were amended, withseveral implementing regulations issuedduring 2007. The changes separate resolutionmechanisms for rights-based and interest-based disputes. Importantly, they allowconciliation by the district labor officer, thefirst step of the dispute resolution process.Both employer and employees need to agreein written form on the selection of thedistrict-level labor conciliator. The chairmanof the district People's Committee becomes
the new authority responsible for settlingdisputes in the second stage of the resolutionprocess.
Improving the legal framework for collectivebargaining would not only provide a betterchannel for the resolution of industrialdisputes: it could also help Vietnam counteranti-dumping measures by trade partners. Theabsence of satisfactory wage negotiationmechanisms at the enterprise level is invokedas evidence that Vietnam is still an NME.Under WTO agreements, an NME is more
SOCIAL PROTECTION
46
Box 4.2: Trade Unions in Vietnam and in China
Trade unions in China and Vietnam continue to encompass all types of 'workers', including top managers. Thisoriginated from the nature of socialist employment relations where it was perceived that no conflicts of interestsexisted between management and workers. This perception has easily become a convenient tool for managementto dominate the workplace and control the unions. In both countries, trade union leadership at the enterprise levelis disproportionately dominated by staff members representing the management. However, there are importantdifferences as well.
Rank-and-file workers in Vietnam have displayed a great degree of spontaneous solidarity, outside the officialunions and the official legal framework, to defend and advance their rights and interests. Field research indicatesthat most wildcat strikes were not only well planned and coordinated, but were also participated in by a majorityof the workers within the enterprises concerned. The so-called contagion effect of wildcat strikes illustrates theVietnamese workers' ability to take well coordinated collective actions. For example, on December 28, 2005,18,000 workers of a Taiwanese owned company in Linh Trung Processing Zone in HCMC went on a wildcat strikedemanding a wage increase, this move was immediately followed by strikes in two other factories in the sameZone on the same issue.
What is also noticeably different from China is the response of the public authority to wildcat strikes. In Vietnamthe local labor administration will usually send its officials to investigate the situation and to resolve the strikesituation by offering a compromise. This intervention tends to legitimatize workers' actions. For instance,managers are quietly advised by local government officials not to take any retaliatory action such as dismissalagainst labor leaders, as it would only provoke another round of strikes. Of 50 strikes for which detailedinformation is available, workers' key demands were met in 48 cases. Favorable coverage of the collective actionsby local media also generates pressures on the local government to intervene.
Trade unions at higher organizational level in Vietnam tend to display stronger support for workers on strikes thantheir counterparts in China. Local trade union cadres usually accompany the government conciliators, puttingpressure on the management side to accept reasonable demands while also persuading workers to return to work.In response to the strikes in Linh Trung Processing Zone in December 2005, VGCL actually criticized thegovernment for its failure to raise the minimum wage for foreign-invested companies for a long period of time.
The strong solidarity of workers, the tolerant attitude of the public authorities, the supportive response of thegeneral public and the relatively autonomous behavior of higher level trade union organizations all differentiateVietnam from China.
Source: Chang-Hee Lee (2006b).

LABOR MARKETS
47
vulnerable to anti-dumping measures, becausethe production costs of other (so-calledsurrogate) countries can be used to measurethe extent of subsidization.
Vietnam has accessed the WTO with an NMEstatus which will expire automatically in 2018.Introducing a more adequate industrial relationsframework could hold the key to advancing thisdate. And there are valid reasons to believe thatVietnam is in a relatively strong position to
make this move (Box 4.3). A more adequateframework could include more flexiblemechanisms for employees and employers toappoint their representatives at various levels. Itcould also allow piece workers to be part ofcollective agreements, and provide protection toemployees' representatives. Introducing timelimits for negotiation and replacing the LaborConciliation Council by conciliators who aretruly independent from both parties would beanother change worth considering.

48
Before any resources can be spent by thegovernment on social protection policies andprograms, they have to be raised throughtaxation. Securing stable government revenueis one of the main priorities of the current taxreform agenda. But the tax base is evolvingrapidly, requiring an adjustment of both taxinstruments and tax administration. SOEscontinue to account for the bulk of revenuecollection, but the share of foreign companiesand private domestic firms is growing rapidly.The structure of revenue by tax instrument ischanging as well, with tariffs and other trade-related taxes losing share as a result of globalintegration. The way those tax instruments isdesigned has an impact on both equity andefficiency. Taxes and fees introduce a wedgebetween gross and net income and thusredistribute resources across households. InVietnam, they are progressive overall, with thetax burden increasing with householdexpenditures. But there is a wide variationacross instruments. Value Added Tax (VAT) isprogressive, some local fees are regressive, andPersonal Income Tax (PIT) affects only a tinyfraction of households. The burden onenterprises varies too. Disturbingly, it appearsto be higher for domestic private enterprises, forsmall firms and for those located in rural areas.The cost for enterprises to comply with taxregulations is high as well. But estimates varywidely, suggesting the need for reliableindicators to monitor the efficiency and integrityof tax administration. In a country wherewealth is very much associated with theownership of valuable urban land, propertytaxes have the potential to redistribute resourcesacross households without introducing theinefficiencies associated with taxes onhousehold or enterprise income. Property taxes
should also allow a better recovery of the costsof infrastructure development, targeting its mostdirect beneficiaries. But property tax requiresgood registration and reliable valuation of landtitles. More generally, a proper operation of thetax system has strong administrativerequirements. Vietnam has adopted anambitious agenda to modernize taxadministration, but implementation will bechallenging. Changing business processes fromsystematic inspection towards self-declarationwill be necessary to expand the number oftaxpayers, reduce the cost of compliance andmitigate the risk of corruption. This change isnow being rolled out, with encouraging results.
An evolving tax base
As part of the transition to a market economy,two major tax policy reforms were undertakenin Vietnam in 1990 and 1998. Acomprehensive legal framework wasdeveloped as a result. Taxes imposed on state,non-state and agricultural sectors wereintegrated into major instruments, notablyturnover and profit taxes. Subsequently, thesewere transformed into VAT and CorporateIncome Tax (CIT) respectively. By now, thesystem in place also includes natural resourcetaxes, PIT, excises, customs duties, and anumber of minor taxes, fees and charges.Considerable efforts have also gone intoreforming the legal framework for taxadministration.
Despite the reforms already undertaken, manydifficulties remain. The number of potentialtaxpayers is growing faster than currentarrangements can handle. The large set ofminor taxes, charges and fees results in
5. TAXES AND FEES

unnecessary complexity. Efforts have beenmade to shift the responsibility for collectionof these taxes to local governments, butdecentralization creates additional accountingand supervision problems. Taxpayerscomplain about ambiguities and contradictoryprovisions in the tax system, which increasethe compliance burden and the discretionarypower of tax inspectors. To address theseconcerns, a third wave of reforms to tax policyand tax administration is currently underway.
Amidst these transformations, the structure ofgovernment revenue is changing as well.Overall revenue has increased slowly butsteadily in recent years, from 20.5 percent ofGDP in 2000 to 23.4 percent in 2007. Thisincrease is mainly due to the growth in oilrevenues and in non-tax revenue. Tax revenueproper actually experienced a minor decreaseduring the same period. SOEs remain themost important taxpayers, accounting forsome 54 percent of CIT and 42 percent of VATrevenue. Revenue from SOEs doubledbetween 2001 and 2006, whereas it multipliedby 3.3 in the case of domestic private
enterprises and by 4.3 in the case of foreign-owned companies (Figure 5.1). Yet, in spite ofthe buoyancy of the mainly small-scaledomestic private sector, the 673 largesttaxpayers still contribute more than 70 percentof total domestic tax revenues.
There are also ongoing changes in thestructure of revenue by tax instrument. CITand VAT remain the workhorses of the system(Figure 5.2). In particular, VAT is a highly"productive" tax in Vietnam, in the sense thatthe revenue (measured in percentage points ofGDP) per point of the basic rate (in percent ofvalue added) is among the highest in theregion. However, the planned revision of theVAT, which includes the establishment of anexempt threshold and an enhancement of therefund mechanism, may result in lowerrevenue.
On the other hand, greater global integrationhas led to a diminished importance of taxesrelated to international trade. The share ofimport and export duties in total tax revenueshas decreased from 28.9 percent in 1996 to
TAXES AND FEES
49
Source: Based on data from MOF.
Figure 5.1: Who Pays Taxes in Vietnam?

17.8 percent in 2003 and further to 13.1percent in 2007. The implementation of WTOcommitments will reinforce this trend,although not necessarily in the short term.The commitments made by Vietnam do notentail dramatic reductions in tariffs. As thereductions are mainly at the high end, importvolumes (the base on which taxes arecomputed) are bound to growth so thatrevenue could actually increase, at least forsome time. Moreover, WTO commitmentsallow raising the tariff lines for a rangenumber of items from zero at present to amaximum of 5 percent. This should alsoresult in higher revenue.
From gross to net income
Taxes and fees not only raise revenue for thegovernment: they also introduce a wedgebetween gross and net income, and thusredistribute resources across households.Some times, such redistribution is a deliberatechoice, accomplished through a variety ofexemptions, thresholds and differential taxrates. Quite often, however, the complexity ofthe tax system leads to unplanned (and evenunknown) redistribution.
In Vietnam, households are directly subject to
several taxes and fees. As consumers, theypay VAT and excise taxes. As residents, theyface a range of local fees such as agriculturaltaxes, education fees and taxes on householdbusinesses, among others. Overall, thesetaxes are progressive (Table 5.1). In 2006, ahousehold in the richest quintile of thepopulation devoted 14.8 percent of itsspending to paying taxes and fees, comparedto 8.7 percent for a household in the poorestquintile. But not all taxes and fees are equallyprogressive. VAT, excise taxes and taxes onhousehold businesses are, while agriculturalfees are not. And not all households pay alltaxes and fees. For instance, mostlyeverybody is confronted with VAT whereas ameager 0.1 percent of households pay PIT.
In industrial countries, PIT is one of the maintax instruments for redistribution. Its role istypically more modest in developingcountries, given that many households areengaged in farming or work in the informalsector, where incomes are difficult todocument. The potential for evasion is high atthe top of the distribution as well, as profitsand capital gains are relatively easy to hidefrom tax agents, some times with theircomplicity. That leaves civil servants andworkers in the formal private sector as the
SOCIAL PROTECTION
50
Figure 5.2: Tax Revenue by Source
Source: Based on data from MOF.

main taxpayers for PIT. Because it fallsmainly on formal wage and salary earnings,PIT can be seen as disincentive toformalization.
In spite of these well-known problems, thegovernment of Vietnam is trying to scale upits PIT. A new law was promulgated in late2007, and from 2009 onwards all individualsmaking more than 4 million dong per monthwill be subject to PIT. Implementation isexpected to increase the number of taxpayersto about 2.3 million, and result in 13 trilliondong in additional tax revenue. Thiscompares with about 300 thousand high-income taxpayers and six trillion dong inrevenue at present. The main source ofhousehold income targeted by PIT is wageearnings. But the PIT law also applies toincome related to equity shares, givingindividual investors two options: a 20 percenttax on the profits they make or a 0.1 percenttax on the sale of stocks.
In Vietnam, wage employment is the source ofroughly one quarter to one third of household
income, with the proportion being higheramong richer population groups. However,not all wage income comes from the formalsector, and only a fraction of it (presumablyamong the upper quintiles of the population) islikely to be subject to PIT.
A more comprehensive assessment of taxincidence should take into account the indirectimpact of taxes on consumer prices, throughproduction costs. For instance, taxes on fuelaffect households who do not pay themdirectly, because they raise the cost oftransportation. To assess the impact ofupstream taxes on inputs it is necessary to useinformation on the cost structure of goods andservices.
The only study of this sort available forVietnam was conducted using householdsurvey data from 1998 and the input-outputtable for 1997. This study was able to tracethe incidence of approximately half of all taxrevenue. Its findings suggest that taxationremains progressive even when consideringindirect effects. But the gap between the
TAXES AND FEES
51
Taxes as percent of household expenditure per capita
Poorest quintile
Near poorest
Middle quintile
Near richest
Richest quintile
All house- holds
House- holds
paying taxes
(percent)
Value-added tax 4.7 6.0 6.7 7.4 7.6 7.0 100.0
Excise taxes 1.2 1.4 1.6 1.7 2.2 1.8 97.3 Taxes on household enterprises 0.1 0.3 0.6 1.8 2.4 1.6 15.4
Educational fees 1.2 1.6 1.8 1.9 1.3 1.5 62.1 Agricultural fees 0.7 0.9 0.6 0.3 0.1 0.4 40.2 Personal income tax - - - - 0.1 0.1 0.2 Other fees 0.8 0.8 0.8 0.9 1.1 1.0 99.0 Total tax paid 8.7 11.0 12.1 14.0 14.8 13.4 Expenditure per capita (thousand dong per year) 2,469 3,982 5,529 7,980 17,106 7,411
Table 5.1: How Progressive Are Taxes and Fees?
Source: Jonathan Haughton and Phuong Viet Ngo (2007).

burden of the richest and the poorest quintileis lower than when direct taxes alone areconsidered.
Taxing capital
Taxes can also affect the incentives faced byfirms. In the case of Vietnam, the tax burdenshould be the same across all enterprises, andamount to 28 percent of corporate profits. Inpractice, however, the tax burden may differfrom that benchmark. Policies to encourageinvestment in laggard regions, or dynamicsectors, or labor-intensive technologies, usuallyrely on tax incentives, which in turn shouldresult in a lower burden for the encouragedenterprises. But poor enforcement, arrears andeven corruption may lead to substantialdisparities in the actual tax burden acrossenterprises of different sorts.
Individual records from enterprise surveysallow comparing actual tax payments to thehypothetical benchmark. The latter can becomputed as 28 percent of the declared pre-taxprofits. The comparison shows that actual tax
payments have moved closer to the benchmarkover time, which is reassuring (Figure 5.3). Butthey also suggest that the gap with thebenchmark is wider in the case of SOEs, largefirms and enterprises located in urban areas.Whether this pattern is due to deliberateincentives, to weak tax administration or toevasion is unclear. But whatever the reasons,imposing a higher (actual) tax burden on smallfirms, private businesses or enterprises locatedin rural areas does not seem to be in the bestinterest of Vietnam.
However, there are other, more indirect ways inwhich taxation can become a burden onenterprises. The actual cost of complying withtaxes, in terms of hours of skilled personneldevoted to filling forms and negotiating with taxofficials, has been a hotly debated topic inVietnam in recent years (Box 5.1).
The burden from corruption is also difficult toassess, but not less real. A diagnostic studyprepared in 2005 by the Central Committee forInternal Affairs of the Party identified taxadministration as one of the governmentagencies most vulnerable to corruption. This
SOCIAL PROTECTION
52
Figure 5.3: The Tax Burden on Enterprises
Source: Based on data from the GSO enterprise survey. Figures are for 2005 unless otherwise indicated.

conclusion was corroborated by an investmentclimate survey conducted among arepresentative sample of firms in 25 provinces,also in 2005. Corruption was facilitated by thebusiness processes of the tax administrationagency at the time, which involved inspectionsby tax agents to each individual taxpayer firm.Those inspections were prone to negotiation onthe profits to be declared. The investment
climate survey suggests that the size of thebribes was not particularly large, but thepractice was prevalent
Taxing property
A potentially more effective way to redistributeincome across households while avoidingdistorting incentives is to tax property, and
TAXES AND FEES
53
Box 5.1: How Costly Is It to Comply with Tax Regulations?
Assessments of the cost of complying with taxes can be sensitive to the methodology used. Three recent attemptsto measure such cost in Vietnam have yielded substantially different results.
Investment Climate Assessment (ICA). Conducted by the World Bank in 2005, it surveyed a representative sampleof firms in manufacturing across 25 provinces in Vietnam. The focus of the survey was not to estimate the taxburden, but rather to assess the broader investment climate However, one of the questions referred to the timespent dealing with tax inspections, including the preparation of relevant documentation. According to the results,firms were subject to an average of 2.5 inspections per year, lasting 9.5 hours on average. From these figures, itcould be inferred that firms need to spend about 24 hours of work to comply with taxes. But tax inspections, nomatter how burdensome, are only part of the overall compliance cost. Therefore, the ICA produces an under-estimate of tax compliance costs.
Doing Business. Also conducted by the World Bank, this is an attempt to quantify various dimensions of theoverall business environment across countries. One of those dimensions refers to the costs of complying withtaxes. In this respect, the Doing Business methodology relies on expert assessments for a hypothetical enterprisewith 60 employees and a turnover equivalent to 0.7 million dollars per year (in Vietnam's case). In all theassessments conducted from 2005 to 2007, the time needed for this enterprise to be current in its obligations was1,055 hours per year. This estimate refers to CIT, VAT, PIT and labor taxes. It includes the time to prepare taxreturns and to keep books. However, the latter may be incurred anyway, regardless of tax payments. Also, fewenterprises pay PIT in Vietnam, and the estimate assumes that electronic filing is not used. Therefore, the DoingBusiness methodology over-estimates compliance costs.
Central Institute for Economic Management (CIEM). This government-led evaluation was conducted in 2007using a "standard cost model" developed by the Dutch government. The model relies on 360 interviews with smalland medium enterprises. In the case of Vietnam, the average time to comply with taxes was estimated at 1,959hours. Most of this cost (1,733 hours) was associated with VAT, which respondents seem to consider particularlyannoying. However, this evaluation mixes the one-time cost of obtaining a taxpayer number with the recurrentcost of paying taxes. Also, the methodology makes it difficult to distinguish between activities which are part ofdoing business, activities specifically related to the payment of taxes, and more subjective "annoyance costs". Acloser analysis shows that the estimate for the time spent on inspections is four times higher than in the ICA. Thecost of dealing with most taxes is twice as high as in the Doing Business report, and the cost of dealing with VATabout 30 times higher. Therefore, the CIEM study is likely to have vastly over-estimated tax compliance costs.
In order to avoid similar discrepancies in the future, a consistent methodology to monitor tax compliance cost andservice delivery should be developed. Such methodology should be anchored on representative samples and well-tested questionnaires. Estimates should be produced on a regular basis, focusing on the costs (time and money)faced by different groups of taxpayers. Similar surveys of tax officers would allow for a more complete picture.Key metrics should include not only the cost of complying with taxes, but also indicators related to the efficiencyof administration, the integrity of its officials and the satisfaction of taxpayers.
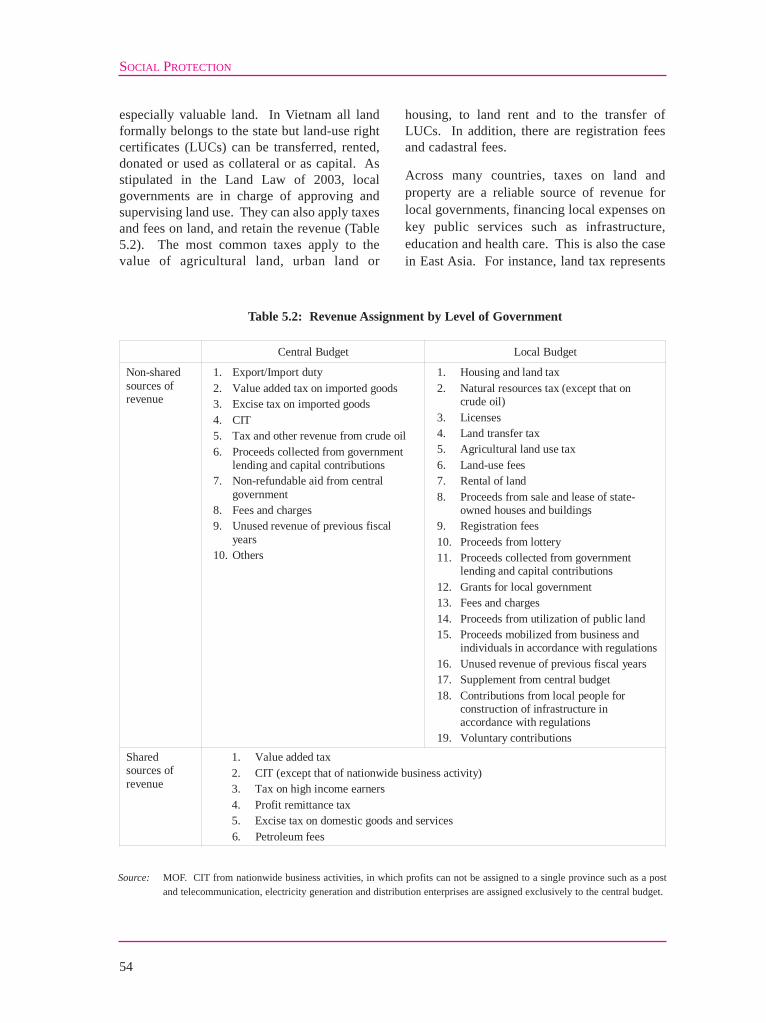
especially valuable land. In Vietnam all landformally belongs to the state but land-use rightcertificates (LUCs) can be transferred, rented,donated or used as collateral or as capital. Asstipulated in the Land Law of 2003, localgovernments are in charge of approving andsupervising land use. They can also apply taxesand fees on land, and retain the revenue (Table5.2). The most common taxes apply to thevalue of agricultural land, urban land or
housing, to land rent and to the transfer ofLUCs. In addition, there are registration feesand cadastral fees.
Across many countries, taxes on land andproperty are a reliable source of revenue forlocal governments, financing local expenses onkey public services such as infrastructure,education and health care. This is also the casein East Asia. For instance, land tax represents
SOCIAL PROTECTION
54
Central Budget Local Budget
Non-shared sources of revenue
1. Export/Import duty 2. Value added tax on imported goods 3. Excise tax on imported goods 4. CIT 5. Tax and other revenue from crude oil 6. Proceeds collected from government
lending and capital contributions 7. Non-refundable aid from central
government 8. Fees and charges 9. Unused revenue of previous fiscal
years 10. Others
1. Housing and land tax 2. Natural resources tax (except that on
crude oil) 3. Licenses 4. Land transfer tax 5. Agricultural land use tax 6. Land-use fees 7. Rental of land 8. Proceeds from sale and lease of state-
owned houses and buildings 9. Registration fees 10. Proceeds from lottery 11. Proceeds collected from government
lending and capital contributions 12. Grants for local government 13. Fees and charges 14. Proceeds from utilization of public land 15. Proceeds mobilized from business and
individuals in accordance with regulations 16. Unused revenue of previous fiscal years 17. Supplement from central budget 18. Contributions from local people for
construction of infrastructure in accordance with regulations
19. Voluntary contributions Shared sources of revenue
1. Value added tax 2. CIT (except that of nationwide business activity) 3. Tax on high income earners 4. Profit remittance tax 5. Excise tax on domestic goods and services
6. Petroleum fees
Table 5.2: Revenue Assignment by Level of Government
Source: MOF. CIT from nationwide business activities, in which profits can not be assigned to a single province such as a postand telecommunication, electricity generation and distribution enterprises are assigned exclusively to the central budget.

a quarter of local revenue in Japan. Evenamong developing countries in the region, 13percent of the revenue of local governments isaccounted for by land and building tax inIndonesia, and by real property tax in thePhilippines.
Property tax has several appealing features. Itcan be strongly progressive, as land andhousing are among the most valuable assets ahousehold can have. In Vietnam, fortuneshave been made at extraordinary speed thanksto capital gains on property. Such gains aredifficult to tax through PIT. At the same time,it is straightforward to exempt small plots ofagricultural land from taxation, so as to avoidpenalizing poor farmers. One legitimateconcern refers to households with limitedincome who happen to live on plots whichappreciated considerably, simply because ofurban development. Paying tax on land couldbe beyond their financial capacity and forcethem to sell their property, thus destabilizingtheir livelihoods. However, this concern canbe addressed by delaying the payment of thetax (plus interest) until the property istransferred, through sale or inheritance.
Property tax also allows recoveringinfrastructure development costs, at leastpartially. The market value of land is veryclosely related to the density of the area andthe quality of the surrounding infrastructure.Every time a road is build, those living nearbymake a capital gain, some times substantial.But if the road is financed out of general taxrevenue, they do not revert much of that gainto society. Property tax helps recovering partof the capital gain for government, under theform of a stream of revenue computed on thenew (higher) value of the land. From thisperspective, it contributes not only to fairnessbut also to the development of localinfrastructure, one of the main priorities ofVietnam at this stage of development.
Perhaps one of the biggest advantages ofproperty tax is that it does not distortincentives as much as other taxes do. In adeveloping country, taxing wage earnings is
an encouragement to informality. Taxingcapital returns, if pushed too far, can bedetrimental to competitiveness. Both workersand employers can move elsewhere to avoidpaying taxes. But land cannot be moved.Admittedly, property tax creates competitionamong localities, encouraging households andenterprises to settle in places whereinfrastructure and amenities are good whileproperty taxes are not too high. But given theenormous agglomeration effects taking placein the process of development, some placesare simply unique. There are not two Hanoi, ortwo HCMC. At most, there is a case to taxland more heavily than the buildings on it, soas to avoid discouraging residential andcommercial investment.
The main problem with property tax is that itrequires good registration systems and reliablepricing mechanisms. Good registrationsystems avoid ambiguities on ownership andphysical delimitation. Reliable pricingmechanisms help set tax payments at a levelthat is commensurate with the situation of thereal estate market. To improve registration, itis necessary to complete the issuance of LUCson urban property, to update cadastral mapsand to modernize the information systems ofland administration offices. Setting up reliablemechanisms for pricing is more complex.Administrative procedures may proveinsufficient given the vast number of plots tooversee. As in other aspects of taxadministration reform, self-declaration may bea better alternative. There is obviously a riskthat unrealistically low prices could bereported, to avoid paying high taxes. Howeverthis risk can be addressed by establishing a linkwith rights for compensation in the event ofland reclamation. If the government can setland compensation at the reported price, theowner faces an incentive to align such price toactual market conditions.
Tax administration
A comprehensive tax administration reformprogram was adopted by the Politburo in 2004.Its objectives are to develop a modern, fair and
TAXES AND FEES
55

SOCIAL PROTECTION
56
transparent tax system, promoting voluntarycompliance, improving taxpayer service andenforcement, and enhancing revenuecollection. These objectives seem largely inline with the values and expectations of theVietnamese population (Box 5.2).Implementing such ambitious reform programwill be challenging, however.
Revamping business processes so as to changethe relationship between tax agents andtaxpayers will be critical to the success of thereform. A pilot project for self-assessment ofVAT in selected localities is now being rolledout at the national level. It leads to the gradualreplacement of tax inspections by thedeclaration of tax liabilities by taxpayersthemselves. Tax filings are then subject toanalysis, with inspections taking place onlywhen objective indicators suggest an improperassessment or an intention to fraud. Thischange in business processes should make itpossible for the tax administration agency to
increase substantially the number of taxpayersit can handle. It should also reduce the scopefor negotiation between enterprises and taxagents, hence for corruption.
There are some indications that this approachis paying off already. For several years, amail-in survey of enterprises has beenconducted to compare the quality ofgovernance at local levels, under the form ofa so-called Provincial Competitiveness Index(PCI). The survey contains the followingstatement: "Negotiations with tax authoritiesare an essential part of doing business" andasks respondents whether they agree. Thefraction that agrees declined from 75.2percent in 2005 to 61.1 percent in 2006 to44.7 percent in 2007. The last two surveysincluded all provinces in Vietnam. Theircomparison is telling about the progressmade through the introduction of self-assessment (Figure 5.4). But it also suggeststhat more progress can be made.
Box 5.2: Attitudes towards Tax Evasion
Opinion surveys can be used to gauge attitudes towards taxation and to compare them across countries. TheHuman Beliefs and Values Survey is a potentially valuable tool in this respect, as it covers 200 thousandrespondents in 81 countries accounting for 85 percent of the world's population. Of those respondents, 989 arefrom Vietnam.
The survey questionnaire includes a range of statements and asks the respondents to comment whether they agreewith them. One of such statements refers to "cheating on taxes if you have a chance". Answers can be in a scaleof one to ten, where one means that it is "never justifiable" and ten "always justifiable."
A vast majority of Vietnamese participants declared that tax evasion was unethical, with 87.8 percent consideringthat it was never justifiable. The mean score was 1.32. Admittedly, self-reporting high ethical standards is notsurprising and may not be particularly informative. But it is interesting to note that the share considering evasionto be never justifiable was substantially higher in Vietnam than in other countries and territories in the region,including China, Hong Kong (China) and Thailand.
Variation across population groups in Vietnam is interesting as well. The belief that tax evasion is never justifiableappears to be slightly stronger among young adults and the elderly, whereas there is more willingness tocompromise among respondents aged between 30 and 49 years. Also, the category most receptive to tax evasionis the most highly educated group.
Another suggestive breakdown is by religion. Ancestral worshippers are most likely to believe that tax evasion isnever justifiable. Buddhists are somewhat more flexible on the ethics of tax evasion, whereas Christians are themost accommodating.
Source: Robert McGee (2006).

TAXES AND FEES
57
Figure 5.4: Negotiating with Tax Officials
Source: VNCI and VCCI (2007). Figures indicate the percent of survey respondents who agree with the statement:"Negotiations with tax officials are an essential part of doing business".

58
Opportunities for people to make a living, tohave access to social services and to get supportin the event of bad shocks are better where thereis an effective government. It takes more thanjust budget resources to deliver oninfrastructure, health care or targeted programs.But the availability of such resources can makea difference, especially in areas which are toopoor to raise them on their own. Publicexpenditures in Vietnam are not particularlylarge in relation to GDP, but they have been ona slightly upward trend, with spendingincreasing on investment and education, and toa lesser extent on health. The level of publicexpenditures also appears to be sustainable overtime, as the ratio of public debt to GDP isexpected to peak barely above 51 percentaround 2016 and to start declining afterwards.While neither the functional composition northe relative level of public expenditures arechanging dramatically in Vietnam, themechanisms used to allocate budget resourcesto lower levels of government went through aprofound transformation since 2004, as part of amove towards increased decentralization. Bynow, almost half of public expenditures aredecided at provincial levels and below.Importantly, transparent formulas have beenintroduced to allocate budget resources to theprovinces. Initially they covered recurrentexpenditures, but they were recently extended tocapital expenditures as well. These formulasrely on indicators such as provincial populationand the level of development; they also take intoaccount geographic conditions and theorganization of government administration. Inpractice, budget allocation norms result in amassive transfer of resources from richer topoorer provinces, some of which may receive
the equivalent of 50 percent or more of theirGDP in equalization grants. Such availability ofresources bears the potential to make adifference, helping to lift people out of povertyand to reduce their vulnerability. The mainchallenge is to use them effectively. The smallsize of the typical Vietnamese province raisesimportant coordination problems in relation topublic investments. And the pro-poor nature ofbudget allocations from the center to theprovinces is only now starting to be replicatedfor transfers from provinces to districts andbelow. At the commune level, progress is stillneeded to improve grassroots participation inthe budget process.
Overall spending
Total government expenditures are notparticularly large in Vietnam. By internationalstandards, where they accounted for 29.8percent of GDP in 2006. This fraction had beengradually increasing since 1990, but hasremained relatively stable in the last four years.The government's declared intention is to haveexpenditures grow annually by 2 to 3 percentless than GDP. However, it is unclear that thiswill happen in practice, given the willingness toupgrade the skills base of the country, theescalating costs of health care and the pressingneeds in terms of infrastructure development.
Some of these upwards trends have already beenclear for quite some time in the budget of thecentral government (Figure 6.1). Between 2000and 2007, spending on infrastructure by thecentral government has increased by about 2percentage points of GDP, spending oneducation by about 1 percent, and spending on
6. BUDGET ALLOCATIONS
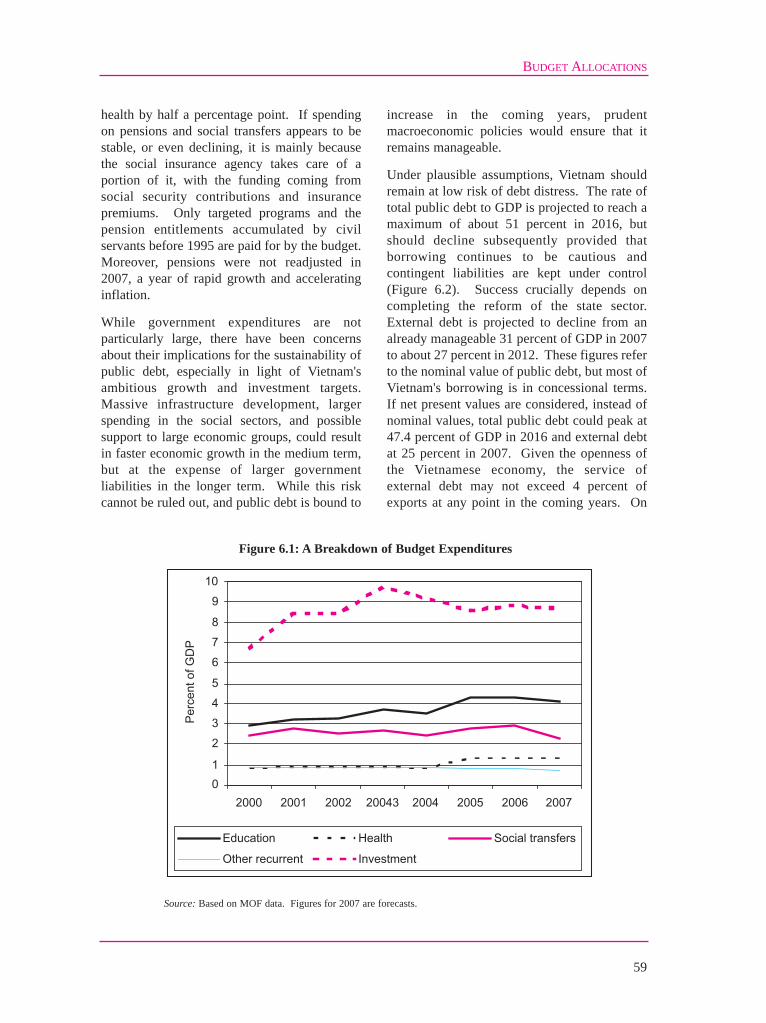
health by half a percentage point. If spendingon pensions and social transfers appears to bestable, or even declining, it is mainly becausethe social insurance agency takes care of aportion of it, with the funding coming fromsocial security contributions and insurancepremiums. Only targeted programs and thepension entitlements accumulated by civilservants before 1995 are paid for by the budget.Moreover, pensions were not readjusted in2007, a year of rapid growth and acceleratinginflation.
While government expenditures are notparticularly large, there have been concernsabout their implications for the sustainability ofpublic debt, especially in light of Vietnam'sambitious growth and investment targets.Massive infrastructure development, largerspending in the social sectors, and possiblesupport to large economic groups, could resultin faster economic growth in the medium term,but at the expense of larger governmentliabilities in the longer term. While this riskcannot be ruled out, and public debt is bound to
increase in the coming years, prudentmacroeconomic policies would ensure that itremains manageable.
Under plausible assumptions, Vietnam shouldremain at low risk of debt distress. The rate oftotal public debt to GDP is projected to reach amaximum of about 51 percent in 2016, butshould decline subsequently provided thatborrowing continues to be cautious andcontingent liabilities are kept under control(Figure 6.2). Success crucially depends oncompleting the reform of the state sector.External debt is projected to decline from analready manageable 31 percent of GDP in 2007to about 27 percent in 2012. These figures referto the nominal value of public debt, but most ofVietnam's borrowing is in concessional terms.If net present values are considered, instead ofnominal values, total public debt could peak at47.4 percent of GDP in 2016 and external debtat 25 percent in 2007. Given the openness ofthe Vietnamese economy, the service ofexternal debt may not exceed 4 percent ofexports at any point in the coming years. On
BUDGET ALLOCATIONS
59
Figure 6.1: A Breakdown of Budget Expenditures
Source: Based on MOF data. Figures for 2007 are forecasts.

the other hand, the fraction of governmentrevenue needed to service public debt couldincrease from 10 percent at present to 15percent by 2017, to start gradually decliningafterwards.
Spatial allocation
The allocation of public expenditures acrosslevels of government changed dramaticallywith the Budget Law of 2002, which came intoeffect in 2004. Vietnam became a much moredecentralized economy as a result. By now, 45percent of public spending decisions are madeat the provincial level and below. The NationalAssembly and People's Councils are in chargeof budget appropriations. This has also entailedan important transformation in the role of lineministries, from doing to steering. Forinstance, provincial governments now decideon their investment plans using their availablebudgetary resources, instead of submitting"wish lists" of projects to MPI for screeningand approval.
The move towards decentralization has beenaccompanied by the implementation of anequalization mechanism, aimed at transferringbudgetary resources to provinces so as to meetthe government's development objectives. Thismechanism also seeks to achieve greater
coherence between capital and recurrentexpenditures. To foster transparency, transfersare based on numerical formulas, involving aseries of measurable indicators at the provincelevel. Initially, allocation norms were applied torecurrent expenditures only, based on 11formulas by policy area. Since 2007 the sameprinciple has been adopted for capitalexpenditures.
The formulas use provincial population as oneof the main determinants of budget allocations,but they modulate them based on the level ofdevelopment of the province, the difficulty of itsterrain, its administrative organization or thepresence of a regional development pole, amongother criteria (Table 6.1).
Other redistribution mechanisms forgovernment expenditures are also at play, inaddition to these formulas. Among them are aseries of targeted programs such as theexemption of education fees for poorhouseholds, the distribution of healthinsurance cards for disadvantage people or thesupport to communes facing extremedifficulties. Each of these programs has itsown formula mapping resources to locations.In most cases there is a noticeable trendtowards greater simplicity and transparency.For instance, in the case of health insurancecards (under Program 139), provinces receive
SOCIAL PROTECTION
60
Figure 6.2: Not Overburdening Future Generations
Source: Debt sustainability assessment by IMF and the World Bank.

70 thousand dong per beneficiary per year.And in the case of support to disadvantagedlocalities (under Program 135) each targetedcommune receives 800 million dong forinfrastructure and 200 million for productiondevelopment.
Support to communes affected by naturaldisasters has a design more akin to insurance.All communes located in areas consideredprone to typhoons, floods and other calamitieshave to set aside either 3 or 4 percent of theirbudget as a solidarity contribution. Theapplicable percentage is set based on weatherstatistics from the period 2001-2005. Thecentral budget, in turn, includes a relief fundfor natural disasters whose size is roughly
similar to the sum of resources set aside by allthe communes in potentially affected areas. Inthe event of a natural disaster, affectedcommunes can tap on that common fund.
Pro-poor transfers
Budget allocation norms, combined with theauthority for People's Councils to decide how toappropriate the resources allocated to them, couldbe a powerful tool for social inclusion. Unliketargeted programs, these norms transfer to locallevels of government not only the funding butalso the responsibility for its use. Provided, thisis, that the norms actually redistribute resourcesfrom richer to poorer provinces.
BUDGET ALLOCATIONS
61
Capital expenditures Category
Criterion Recurrent
expenditures Equalization transfers
Targeted transfers
1) Total + + + 2) School-age children + 3) Ethnic minorities + + Population
4) School-age children in P135 communes
+
5) Poverty rate + + + 6) Local revenue + 7) Revenue transferred
to state budget + + Development
8) Industrial output + + 9) Total surface + + 10) Disadvantaged
location + + + Geography
11) Growth pole + + 12) Administrative units
at district level + +
13) Districts in disadvantaged locations
+ Administration
14) Civil servants +
Table 6.1: Budget Allocation Norms for Provinces
Source: Based on Decision 151/2006/QD-TTg for the allocation of recurrent expenditures in 2007 and Decision 210/2006/QD/TTgfor the allocation of capital expenditures in 2007-2010. The former does not include NTPs, Health Care Funds for thePoor (HCFPs), and Program 135.

By referring to the provincial poverty rate, or tothe number of districts in disadvantagedlocations, the formulas underlying these normsought to do so. For instance, transfers forinvestment purposes increase by 50 thousanddong per year for each ethnic minority personliving in the province. Similarly, the allocationof recurrent health expenditures per capita is 72percent higher in the uplands and in low areaspopulated by ethnic minorities than in urbanareas. But not all the criteria considered inbudget allocation formulas are progressive. Forexample, more resources are transferred toprovinces which have greater capacity forrevenue collection or harbor regionaldevelopment poles.
In the end, whether the mechanism set up by thegovernment of Vietnam actually transferresources from richer to poorer provinces is an
empirical question. But once the numbers havebeen worked out, the answer is clearlyaffirmative (Figure 6.3).
The size of the transfer is actually remarkable,both in absolute and in relative terms. Thepoorest provinces in the Northwest or in theCentral Highlands receive equalization grants inexcess of 2 million dong per person per year.Everything else being equal this amounts to 25to 30 billion dong more per year than for a richprovince in the deltas.
While figures on sub-national accounts are nottotally reliable in Vietnam, equalization grantscould exceed 50 percent of provincial GDP insome cases. Beyond those extreme cases, it isclear that poorer provinces in the NorthernMountains, the Central Highlands and theCentral Coast receive much larger equalization
SOCIAL PROTECTION
62
Figure 6.3: How Large are Equalization Grants?
Source: Based on data from MOF and GSO.

BUDGET ALLOCATIONS
63
grants than provinces in the richer Red RiverDelta, Southeast and Mekong Delta.
Not only do budget allocation norms favorpoorer provinces: they have also made theallocation of government expenditures moreprogressive over time. This is reflected in thecorrelation between net transfers and povertyrates by province. Provincial poverty rates canbe measured using the household expendituresurveys produced by GSO. Net transfers aredefined as the difference between the resourceschanneled by the central government to theprovinces and the tax revenue channeled byprovinces to the central government. Nettransfers are highest for the poorest provinces,including Lai Chau, Bac Kan and Ha Giang.Richer provinces like Binh Duong and DongNai, on the other hand, are net contributors tothe central budget.
The correlation between net transfers andpoverty rates has become both stronger andsteeper over time. A comparison between 2002and 2006 is telling in this respect (Figure 6.4).In 2002, resources were channeled to theprovinces on the basis of allocations by lineministries, investment projects approved byMPI and targeted programs. In 2006 they stillrelied on targeted programs, but were mainlybased on quantitative formulas for recurrent andcapital expenditures. The correlation hasbecome stronger in the sense that it explains alarger share of the variation in net transfers. Ithas become steeper in that an increase in thepoverty rate is associated with a larger nettransfer. In 2002, one extra point of the povertyrate was associated with an additional transferof roughly 20 thousand dong per person peryear. By 2006, the corresponding net transferhad almost doubled. Even when inflation istaken into account, this almost doubling reflectsa very substantial increase in the real amount ofresources transferred. However, this increasemay not be sustainable and should rather beseen as a one-off change. The formulas for theallocation of budget resources are such thatprovinces with a stronger capacity to raiserevenue will be favored, whereas poorerprovinces will experience a slower growth in
their transfers. According to the new investmentplan of the Government, in 2008 the net transferto the Northern Mountains could increase byonly 0.8 percent, compared to 6.4 percent forthe Central Coast, 11.1 percent for South East,11.0 percent for the Central Highlands and 17.2percent for the Red River Delta.
Local decisions
The decentralization of authority on budgetappropriations to provincial governmentsprovides an opportunity to better serve localpopulations. But it also raises new challenges.One of them is the possible lack of coordinationbetween provincial decisions.
The median population of a Vietnameseprovince is less than one million people. Thismay result in over-investment in some casesand under-investment in others. Thewillingness of most coastal provinces to havetheir own deep-sea port, or their ownuniversity, could undermine the necessaryeconomies of scale. In other cases, none of theindividual provinces may be large enough orrich enough to undertake critical projects, suchas an international airport. Wasting resourcesthrough duplication, or failing to undertakecritical investments, could be detrimental toeconomic growth and job creation, thusmaking local populations more vulnerable.Regional planning, bringing coherence to theinvestment decisions of groups of relatedprovinces, is one way to address thiscoordination failure (Box 6.1).
Insufficient budgetary resources push manypoor localities to rely on local fees, charges oreven voluntary contributions to raise revenues.According to a recent study, the majority ofcommunes receive transfers accounting for 50to 70 percent of their budget needs. This studylisted about 28 different types of fees andcontributions the farmers have to pay to localgovernment and cooperatives to make up for theshortfall. On average, these fees andcontributions would cost a poor householdnearly 10 percent of its total expenditure. Insome extreme cases, they represent 18 percent

SOCIAL PROTECTION
64
Figure 6.4: Net Transfers and Poverty Rates
Source: Based on data from MOF, MPI and GSO. Hanoi, HCMC and Vung Tau are excluded from the figures althoughnot from the correlation analysis.
BUDGET ALLOCATIONS
65
of the income of the "average" household in thecommune.
Other problems arise at lower levels ofgovernment. Much progress has been made inadopting predictable and transparent formulasto allocate resources from central to provincialgovernments. But until recently allocationsfrom the province level down remain dominatedby the old budget mechanisms.
Only gradually are provincial governmentsstarting to emulate the national formulas for theirbudget transfers to districts and communes. Asof August 2007, 21 one of them (includingHanoi) had approved budget allocation normslike those used by the central government.Encouragingly, more than 30 others havesubmitted proposals in this direction to theirrespective People's Councils.
The budget allocation norms being developedby the provinces are somewhat simpler.Investment expenditures tend to be set as a lump
sum by district. But some more refinedschemes are emerging as well. Son La, forinstance, foresees the share of investmentresources allocated by districts growing from 15percent in 2007 to 30 percent in 2010, with theshare allocated by the provincial governmentdeclining accordingly. Guiding principles suchas transparency, equity and compliance withmaster plans are common. Priority is given tothe repayment of debt over the approval of newprojects. When district-level indicators are usedto determine the amount of resources to betransferred, the criteria are very similar to thosechosen by the central government. Theyinvolve the population of the district (includingethnic minorities), its development level, itsgeography and the size of its civil service.Economic zones, industrial zones and worldheritage areas also get special treatment.
Further down, the decree on the exercise ofdemocracy in communes, issued in 2003,enshrined the right of citizens to supervise andto be informed about "the annual estimates and
Box 6.1: Regional Plans, Infrastructure Master Plans and Public Projects
With much greater emphasis being placed on sustainability, regional development planning has also receivedincreased attention in the last few years. The Socio-Economic Development Plan (SEDP) 2006-2010 explicitlysets out the requirements for the reform of regional planning, by instructing government to "pay attention to spatialplanning, technical infrastructure… to prevent overlapping efforts and conflicts between sectors and territories".Shortly after the approval of the SEDP, the government has promulgated Decrees 92, 99 and 140. Thesedocuments for the first time lay out the regulatory framework for regional planning.
According to Decree 92, master plans should have their targets built around three pillars: economic, social andenvironmental. The decree also requires the evaluation of the strategic environmental impacts of master plans,although it provides no guidance as to how this should be done. Decree 99 specifies the process and theresponsibility of relevant authorities in the implementation and monitoring of development plans and master plans.Decree 140 lists out the requirements of environmental protection in the formulation, appraisal andimplementation of development strategies, master plans, socio-economic development plans, developmentprograms and projects.
The importance attached to improving master plans was highlighted again in the report of the Prime Ministerbefore the National Assembly, in October 2007. Improving the quality of the development of strategies and masterplans was included as one of the main tasks for 2008.
Through Official Letter 950, issued in July 2007, the Prime Minister instructed MPI to take the lead in theformulation of the Socio-Economic Development Strategy to 2020 and the regional master plans for the period2010-2020. Decree 92 is now being revised to increase transparency, to remove duplications and to increaseconsultation along the way.

SOCIAL PROTECTION
66
settlements of the commune budget". Thedecree also recognized the right to be informedabout "the estimates and settlement of revenuesand expenditures of funds, programs, projectsand contributions mobilized from the people forthe construction of infrastructure and publicwelfare projects of communes, villages andhamlets, as well as their implementation results"and to supervise "the collection and spending ofvarious funds and fees according to the Stateregulations as well as various contributions ofthe people".
Progress in the implementation of theseprovisions has been limited, however. A studybased on surveys and focus group discussions in320 villages across four provinces in Vietnamfound that two thirds of participants eitherdisagreed or strongly disagreed with thestatement that "there is plenty of timelyinformation on the commune budget". Anotherstudy found that 40 percent of the interviewees
had heard about the commune budget but,disturbingly, all of them reported that they didnot understand it. Bearing in mind thecomplexity of budget issues, the findingsindicate that there is still a long way to go inimplementing grassroots democracy.
In April 2007 an ordinance was issued replacingthe decree on the exercise of grassrootsdemocracy. The Ordinance provides citizenswith the same rights as the Decree with regardto the transparency and supervision of localbudgets, but it contains new elements that couldincrease transparency and improveimplementation. Unlike the decree, theordinance indicates when the information mustbe posted and the duration of the posting, itrationalizes the means through whichinformation must be disseminated, andintroduces the right to submit complaints anddenunciations in relation to the supervisedactivities.

67
Vietnam has a range of targeted programswhose goal, directly or indirectly, is toalleviate poverty. Some of them provide cashtransfers to vulnerable groups such asorphans, the very elderly or war invalids.Others support poor households throughaccess to credit or through subsidies toparticipate in mainstream social programs.Yet others focus on disadvantagedcommunes, financing local infrastructuredevelopment and initiatives to improvelivelihoods. And there are also programsfocused on improving access to services andboosting the assets of ethnic minorities.These programs differ in several importantways. There is a wide variation in theresources available, both across programsand for the same program across provinces,depending on the local funding they canmobilize. The result is a considerabledispersion in the support received by variousbeneficiaries, from modest in the case of cashtransfers to sizeable in the case of localinfrastructure development. There is alsoconsiderable diversity in targeting methods.In some cases, beneficiaries are a smallfraction of the population at large, andpresumably of the intended target group aswell. In others, the coverage of the targetgroup is quite substantial, and the extent ofleakage to other groups is not excessivelylarge. Assessing the impact of all theseprograms on household living standards isnot an easy task from a methodologicalperspective. A rigorous evaluation isavailable in the case of local infrastructuredevelopment. The results suggest that thisintervention has a sizeable impact on localaccess to markets, household expendituresand even social indicators such as children's
schooling. The impact is larger in poorercommunes and in those located in moredifficult or remote areas. It is smaller incommunes where ethnic minorities representa larger share of the population. There aregood reasons to believe that the subsidizationof participating in mainstream programs bypoor households is having a positive impactas well. But there is less clarity in relation tothe subsidization of micro-credit. In somecases, it is simply too early to tell. Thetargeted program for rural sanitation and theinitiatives to increase the landholdings ofethnic minorities fall in this category.However, there are signs suggesting that theirimplementation will be challenging.
A range of programs
A number of social assistance and anti-poverty initiatives exist in Vietnam. Some ofthem provide cash support to vulnerablegroups, others deliver assistance on a targetedbasis to disadvantaged groups or regions. Thepricing of utilities such as water can also bebased on the ability to pay of differentpopulation groups.
Cash transfers are mainly handed over bySocial Guarantee Funds, which provideregular relief to defined vulnerable groupsand to war veterans and invalids. Subsidiesare provided through the National TargetProgram for Poverty Reduction (NTPPR),formerly the Hunger Eradication and PovertyReduction program (HEPR). Developmentassistance to poor communes is managedthrough Program 135, whereas Program 132and Program 134 seek to support ethnicminorities with agricultural and residential
7. TARGETED PROGRAMS
land, housing and water supply. All theseinitiatives differ not only in the nature of thebenefits they provide, but also in the targetingtechniques they use to identify theirbeneficiaries (Box 7.1).
The overall number of beneficiaries fromtargeted programs is not easy to estimate. Inthe case of the Social Guarantee Fund, it hasincreased more than three-fold over the firstpart of the decade (Table 7.1). The number ofbeneficiaries has risen in all categories.
Yet, regular relief in the form of monthlycash transfers to vulnerable groups stillcovers only a small fraction (about 0.5percent) of the Vietnamese population.
Although funding has increased, reaching750 billion dong in 2007, it remains animportant constraint. The resourcessupporting these cash transfers come from acombination of national and local sources,with their amount varying widely across thecountry. As a result, some in the targetgroups cannot be covered and, when covered,allowances tend to be small on average and todiffer considerably across recipients.
A recent review of the implementation of theOrdinance on Disabled Persons interviewedintended beneficiaries in two provinces. InTuyen Quang, about 40 percent of thedisabled people interviewed were receiving
SOCIAL PROTECTION
68
Box 7.1: A Variety of Targeting Approaches
The NTPPR 2006-2010, much the same as its predecessor the HEPR 2001-2005, targets households who havebeen listed as poor using procedures set out by MOLISA. Poor households are formally identified on the basis ofan official poverty line, defined as a certain level of income per person per month. In practice, whether householdincome is above or below such threshold is decided through a combination of surveys and community discussions.This procedure is currently under revision, based on the results of comprehensive field work conducted in 2005.The new approach first identifies those households who are "certainly poor" and "certainly non-poor" and appliestests to the remaining households to establish whether or not they are likely to be poor. MOLISA is currentlytesting the results of these exercises against household expenditure data from the VHLSS. At aggregate levels,the new approach yields poverty rates which are similar to those produced by the GSO using data from theVHLSS.
Program 135, which provides support to communes facing hardship in ethnic minority and mountainous areas,adopts a geographic approach to targeting. The first phase of the program allocated 700 million VND per year toselected communes. In general these allocations were made in a pro-poor manner. Poverty maps constructedusing small area estimation techniques show that the communes targeted by Program 135 were generally thosewith the higher poverty rates. Targeting issues arise at lower levels, as resource allocation may favor wealthiervillages within a commune and not everyone in those villages is poor anyway. The second phase of program 135is tackling these issues by requiring the inclusion of both poorer villages within the poorest "zone III" communesand the poorest villages in the less poor "zone II" communes. The new guidelines governing resource allocationspecify the need to develop clear, transparent criteria for channeling resources to the poorest villages andcommunes and allow flexibility in allocating more funds to poorer places.
Programs 132 and 134 have targeted vulnerable ethnic minorities using different criteria. Program 132 aims atdistributing agricultural and residential land to ethnic minority households in the Central Highlands, so as to bringlandholdings up to a specified minimum. IPSARD is currently assessing the impact of this program in twoprovinces. Program 134 operates on the same logic, but it targets all ethnic minorities (not just those in the CentralHighlands) and its specified minimum for landholdings is lower. In addition to providing land, this program alsoidentifies ethnic minorities living in temporary housing as eligible to receive 5 million dong for housingconstruction. Ethnic minority households living in high mountains or in areas lacking clean water are also eligiblefor support to improve their water sources. Villages without clean water supply get a varying level of assistancedepending on the proportion of ethnic minorities in the village population.

cash allowances of an average amount of 79thousand dong per month. In Nghe An, on theother hand, only 17 percent of the interviewedwere receiving allowances. But at 221thousand dong per month the average cashsupport was much higher.
One relevant question, then, is whether cashtransfers should be scaled up under the formof a more coherent program, both in terms ofbeneficiaries and in their allocation ofresources to local levels.
Poor households
Assistance to poor households under theNTPPR and its predecessor HEPR has beenrunning since 1998. The change in the name ofthe program reflects the conclusion byMOLISA that hunger has been alreadyeradicated in Vietnam. In its new phase, theprogram seeks to halve poverty between 2005and 2010.
Activities under the NTPPR fall into three areas.Two policies and four projects aim to createconditions for the poor to develop theirproductive activities. This area includes thelargest component of the NTPPR, the provisionof preferential credit through VBSP. Thesecond area comprises four policies coveringaccess to basic services, including healthcare,education, housing, water supply and legal aid.The third area focuses on building the capacity
of officials working on poverty alleviationprograms, and on monitoring.
A total of 43.5 trillion dong has been allocatedto this program over a five-year period, with 60percent of the resources going to the provisionof preferential credit. For the remainder, thecentral budget covers 29 percent of theenvelope, with local governments and localcommunities expected to contribute a further 5and 6 percent respectively.
Most of the resources flow through existingpolicies managed by a number of lineministries. For example, MOH is responsiblefor providing free health insurance cards to poorhouseholds and honoring the obligations thesecards bring. Likewise, the Ministry ofEducation and Training (MOET) is responsiblefor ensuring that exemptions and reductions ofeducation fees are implemented according topolicy.
Other programs provide a subsidy allowing thepoor to participate in the mainstream servicesaccessed by the non-poor. In a context wherepoverty continues to decline, the assumption isthat subsidies can be reduced over time andthose who move out of poverty can fund theirown participation in education or healthinsurance. However, ensuring the coherencebetween mainstream social services andtargeted subsidies can be challenging (Box 7.2)
Household expenditure surveys can be used to
TARGETED PROGRAMS
69
2001 2002 2003 2004 2005 2006 Isolated elderly and poor disabled 68 73 77 103 110 122 Orphaned children 24 39 32 45 47 61 Disabled 90 111 120 155 179 180 Elderly above 85 26 70 88 People with HIV/AIDS 10 10 Other 9 Total number of beneficiaries 182 223 229 329 416 470
Table 7.1: A Growing Number of Beneficiaries
Source: Based on data from MOLISA. Figures are in thousands.

assess the coverage of some of the NTPPRprograms and projects. Data from the 2006VHLSS show that that 13.7 percent of allhouseholds had been classified as poor bylocal authorities (Table 7.2). Though this wasnot much lower than the estimated number ofpoor households using consumption-basedapproaches to measurement, there wereimportant shortfalls in some places. Forexample, according to the 2006 VHLSS, 49percent of the population of the Northwestregion is below the poverty line. However,only 22 percent of people had been officiallyclassified as poor. On a more positive note,the fraction of people officially classified aspoor was higher among those withexpenditures below the poverty line (46percent), and considerably lower among thoseabove (7 percent). In the parlance oftargeting, this reflects a reasonably good"coverage" of the program, and a modestamount of "leaking". By way of comparisonin 2002 the corresponding fractions were 28and 5 percent.
Poor communes
Some targeted government expenditures do nothave poor or vulnerable households as theirintended beneficiaries, but rather poorcommunes. While the emphasis of publicinvestment programs during the 1990s was onthe countries' growth poles, in recent yearsconsiderable resources have been spent inlinking poor regions to nationwide transport andelectricity networks. Accurate estimates ofexpenditure are complicated by the blend ofcentral and local funds. But over the past decadethe government has probably spent about 1.2billion dollars to connect 6.3 million householdsto the electricity grid. A further 2.6 billion waschanneled towards the construction of roads inrural areas over a five-year period. By now, lessthan 300 communes are without road access.There is evidence that these investments canhave a significant impact on the welfare of therural population (Box 7.3).
In addition to directing investment resources
SOCIAL PROTECTION
70
Box 7.2: Linking Targeting Programs and Mainstream Social Insurance
Decision 139 (passed in 2002) led to the establishment of HCFPs, with 75 percent of the funding to be providedby the central government and the rest by local and international sources. Initially, resources could be used toeither purchase health insurance cards for beneficiaries or to directly reimburse providers. From 2006 onward,HCFPs can only be used to purchase health insurance cards. The government is also to increase the resources perintended beneficiary and to introduce a partial subsidy for the heath insurance premium of the near-poor. Althoughthe implementation of HCFPs was slow to take off in many provinces, the number of beneficiaries has increasedsubstantially in the last few years.
Several problems remain, however. Funding is one of them. The government support for the HCFPs wasincreased from 50 thousand dong initially to 70 thousand in 2006. But this is still too low compared to the costof the benefit package for the poor. And only a few provinces have mobilized significant levels of funding fortheir HCFPs.
Another problem is the limited extent of risk pooling. All the beneficiaries from this program fall under the samefund in VSS, regardless of their province. But such fund is still managed separately, offering no scope to diversifyrisk with other population groups with different patterns of morbidity. Pooling would make it possible to increasethe average healthcare spending on the poor which is extremely low compared to that of other participants in thehealth insurance program.
Concerns have also been expressed about equity, due to the limited capacity to identify the beneficiaries at locallevels and to use this information in budget planning. Experience with a health support project in the MekongRiver Delta shows that better-off provinces obtain more resources for their HCFPs by applying looser targeting,hence reporting a higher number of beneficiaries.

towards the provision of mainstreaminfrastructure to rural areas, the government hasalso developed mechanisms to channelsignificant funds to some of the country'spoorest localities. In its first phase, Program135 allocated around 430 million dollars to2,362 disadvantaged communes over a five-yearperiod for local infrastructure investment andlivelihood support.
The program is now in a second phase, withabout one billion dollars scheduled fordisbursement before 2010. While it remainsheavily focused on the provision of basicinfrastructure, it now foresees significantlyincreased financing for capacity building. Thisincludes support for agricultural productionaimed at farmer groups, support forparticipatory planning and investmentmanagement at the commune level, andcommunications outreach to promote publicaccess to information about the program. Theprogram has also been emulated by a similarinitiative targeted to poor coastal communes.
The second phase of Program 135 is still in itsearly stages, so that relatively few hard data areavailable on actual implementation. However, arange of good practices have been noted inparticular provinces. For example, on the issueof decentralization of investment ownership tolocal levels, more than 28 percent of allcommunes under the program are investment
owners by now. This is almost twice the levelachieved under the first phase. Tuyen Quangprovince has already attained the goal ofassigning all beneficiary communes to beinvestment owners, demonstrating to otherprovinces that this is feasible.
Among other achievements to date, a number ofprovinces have developed needs-based criteriafor resource allocation for 2008, despite theabsence to date of specific central-levelguidance on this issue. Financial reports arebeing prepared that track resources down to thelevel of spending agencies. The individualaccounts of these agencies are being reconciledwith local treasury accounts in many provincesand implementation audits have been conductedin eight of them. On other hand, further progressis needed on issues such as public disclosure offinancial and audit reports, guidance onactivities to support production for markets andappropriate procurement methods for small-scale infrastructure.
Water and land
Other government interventions aim atproviding access to services to the mostdisadvantaged populations, or at boosting theirassets. In terms of basic services, Vietnam is atrisk of not attaining the MillenniumDevelopment Goal (MDG) on water andsanitation. As of 2004, only 48 percent of rural
TARGETED PROGRAMS
71
Household type
Percent who: Total Food poor Poor Non poor
Are officially classified as poor 13.7 53.6 46.6 7.5 Hold a healthcare card 10.5 41.6 35.1 6.2 Covered by health insurance 39.9 31.4 31.7 41.3 Have access to preferential credit 5.8 21.4 18.7 3.4
Are exempt from education costs 8.3 38.8 31.6 3.9
Table 7.2: Coverage and Leakage of Targeted Programs
Source: Based on preliminary 2006 data from GSO. A household is classified as poor if its total expenditures are below the costof a food and non-food basket securing 2,100 calories per person per day. It is classified as food poor if its totalexpenditures are below the cost of the food component of such basket.

households had access to clean water sourcesand a mere 16 percent had hygienic sanitation.It is clearly the ambition of the government toredress this situation. The National Rural CleanWater Supply and Sanitation Strategy sets thetarget for access to clean water (based onnational standards) at 85 percent by 2010 and100 percent in 2020. The strategy alsoanticipates that 70 percent of the ruralpopulation will be using hygienic latrines by2010, with full coverage achieved by 2020. Themain government instrument to implement thisstrategy is the National Target Program (NTP)
on Rural Water Supply and Sanitation. But inspite of rapid progress, meeting such ambitiousgoals will be challenging.
Alongside the revised Program 135, thegovernment has also embarked on an attempt tostrengthen the economic base of ethnic minorityhouseholds. The focus is on productive andresidential land. Introduced in 2002, theoriginal program (known as Decision 132)aimed to address the pressing land problems ofethnic minorities in the Central Highlands. Themore recent Decision 134 extends land
SOCIAL PROTECTION
72
Box 7.3: The Impact of Rural Roads
Assessing the impact of local infrastructure investments on the livelihoods of local populations is not easy fromthe methodological point of view. Infrastructure development often coincides with rapid economic growth, whichin turn increases the availability of goods and improves access to markets. How much of the change observed inliving standards at local levels can be attributed to infrastructure development alone becomes unclear. Also, thesame intervention could have different impacts on different places, depending on their characteristics. Forexample, communes with better educated households could derive larger impacts from improved access tomarkets. The extent of local corruption matters as well, as it may affect the way funds are used. Another way inwhich the workings of government can dull impacts is fungibility. Aid or central government spending for roadprojects may substitute for local government spending intended for that purpose.
A study of a road project implemented in Vietnam between 1997 and 2001 addressed these methodologicalproblems in a convincing way. The project aimed at rehabilitating rural roads which were in very bad condition,some with missing bridges and impassable sections year round. The study constructed a baseline before theproject started, in 1997. It conducted subsequent surveys in 1999, 2001 and 2003, tracing the implementationprocess and schedules of prior rounds. This approach provides sufficient controls for comparison and follows thebeneficiary communes for long enough to capture full impacts.
The findings reveal significant impacts of rural roads on the development of markets and commercialization.Some outcomes, such as food goods availability, responded rapidly to new and improved roads. Others, such asthe presence and frequency of markets and the availability of non-food goods and services, took two years moreon average to emerge. The project resulted in households switching from agriculture to non-agricultural activities,mostly service-based. Perhaps most notable, the project had significant and sustained impacts on primary schoolcompletion rates. On the other hand, there are many indicators of local area development which cannot be easilyattributed to better roads.
The study also found enormous impact heterogeneity, depending on local circumstances. Other things equal,poorer communes tend to benefit more. But poorer communes are generally not equal, and some of theircharacteristics tend to lessen impacts. For example, location in mountainous areas, holding other communecharacteristics constant, boosts road impacts. But many mountainous communes in Vietnam have a high share ofethnic minorities and high illiteracy rates which are both negative in their effects. The role of the initial level oflocal market development appears to be crucial. The complexity of the way in which initial conditions interactwith road improvements to affect outcomes suggests that simple formulas to allocate resources for localinvestment may be elusive.
Source: Ren Mu and Dominique van de Walle (2007).

TARGETED PROGRAMS
73
allocation activities to ethnic minorities acrossthe country and expands the scope of support toinclude the provision of clean water andhousing. Local authorities are required toidentify households that have landholdingsbelow a certain specified minimum, whichvaries for different qualities of land. They arethen expected to make up the identified shortfallby allocating land from state-owned farms, byreclaiming previously unused land, or byredistributing land from households with biggerendowments.
On first analysis, these actions seem wellconceived. Ethnic minorities often lack theproductive land assets that have supported themajority group to move out of poverty. Fromthis perspective, the allocation of additionalland would provide an obvious solution.
A survey-based review of the implementation ofthese decisions is currently being undertaken.Though field work is not yet complete, findingsso far suggest that the impact on ethnic minoritylivelihoods may be less advantageous thanoriginally foreseen.
One obvious difficulty lies in the fact the mostproductive and most easily cultivable land isalready allocated and farmed. Though it may bepossible for authorities to find extra land, inpractice it may be distant or poor quality orboth. Further complications arise because theprocess of reclaiming land from state forestryenterprises (SFEs) has been more cumbersomethan expected. Provinces also argue that
resources have been inadequate to obtain thenecessary amount of land from otherhouseholds.
Even if land can be allocated satisfactorily,research suggests that there is no easy,automatic response in terms of increasingwelfare. One study follows the process of re-allocating forestry land away from SFEs tohouseholds and user groups in two villages inthe Central Highlands. The research describesland allocation taking place in a context ofdisputes over rights to use forest land, with prioror customary claims sometimes over-riding thenewer, formal claims. Though the handover ofland to local people brought some welfare gains,they were highly variable across households.The degree to which households were able toconvert their new rights into higher incomesdepended on wealth, the size of upland fieldsoutside the allocated forest, labour capacity andthe location of the village.
Different issues may influence theimplementation of the housing component ofDecision 134. The case of a commune in GiaLai province is telling in this respect. Thecommune had been allocated funds to buildhouses for 121 households with low-qualitydwellings. Each house cost six million dongand was built by a contractor hired by thecommune. The houses were built of brick, inthe Kinh style, next to the traditional ethnicminority houses. But they were not consideredto be appropriate substitutes by the intendedbeneficiaries, who chose not to move.

74
If health care systems are to be judged by theiroutcomes, Vietnam deserves high marks. Keyindicators, especially in relation to childmortality, morbidity and nutrition, are indeedcomparable to those of countries at a muchhigher development level. And progress onthese indicators has been sustained over time.However, on a closer examination the picture ismore complex. Average indicators haveimproved, but the gap between rich and poorhas widened. And the grassroots health carenetwork that served Vietnam so well in difficulttimes is increasingly under strain, unable tocope with the growing importance of non-communicable diseases and the demand formore advanced services by an increasinglywealthy population. Meanwhile, the scale andheterogeneity of the hospital network, combinedwith the emergence of large numbers of privatehealth units, makes the regulation of the healthsystem increasingly challenging. Thegovernment's overall strategy combines thereliance on market mechanisms (the so-calledsocialization policy) with the subsidization ofthe participation of the poor in mainstreamprograms (the socialist orientation). Increasedreliance on market mechanisms has aligned theincentives of service providers with thedemands of those who can afford user fees, butit has led to a relative neglect of social mandatesand a ballooning of health costs. Thesubsidization of the poor may not have resultedin lower out-of-pocket expenditures. For thegovernment strategy to be successful, it needs topay attention to market imperfections requiringspecific interventions, and not just increasedcompetition. Monitoring the delivery ofservices by autonomous units (especially ofsocial mandates), certifying private and non-
government health units through their eligibilityfor reimbursement by the social insurancesystem, and fostering the use of generic drugsand the development of pharmaceuticalresearch, are steps worth considering.
Good but unequal
Health systems can be judged by their ability toimprove the health of the population. They maynot the only thing that matters for healthoutcomes, and it is difficult to quantify theindividual contribution they make. But it isunlikely that a country could exhibit good healthoutcomes if its health system was in disarray.
From this perspective, Vietnam is doing well;as well as countries at a considerably higherdevelopment level. One key indicator forwhich internationally comparable data areavailable is child mortality. China, Indonesia,the Philippines and Thailand did better thanVietnam during the 1980s. However,Vietnam's performance, in absolute terms andrelative to these other countries, picked up inthe early 1990s, and has improved further sincethen. Between 2000 and 2005, the infantmortality rate declined from 36.7 per thousandto 17.8, and the mortality rate for childrenunder 5 years from 42.0 to 27.5 (Figure 8.1).As a result, life expectancy at birth climbedfrom 67.8 years to 71.3.
Other indicators show Vietnam under anequally positive light. Maternal mortality rate,which stood at 85 per 100,000 live births in2002, had declined to 80 by 2005. The fractionof children with low weight at birth fell from7.3 percent in 2000 to 5.1 percent in 2005. And
8. HEALTH CARE

malnutrition among children under five yearsof age dropped from 33.8 percent in 2001 to25.2 percent in 2005.
Admittedly, this was a period when householdincome increased substantially. But even aftertaking into account its strong economic growth,Vietnam still remains a good performer in termsof infant and under-five mortality. During thisperiod there was also an increase in theproportion of people with access to safe water.However, this may not be the full explanationfor the progress in health outcomes either, as thefraction of households with hygienic latrinesand access to safe water in rural, mountainous,remote and isolated areas is still low. And thequality of water remains an issue elsewhere.
Performance is less remarkable whenconsidering the distribution of gains in healthoutcomes across regions, income groups ormedical conditions. Infant mortality has fallenfaster in richer southern regions and the RedRiver Delta. It remains stubbornly high in theNorthern Mountains and the Central Highlands(Figure 8.2). There are also concerns in relationto specific diseases. In the area of pneumoniatreatment the quality of care appears to havedeteriorated during the 1990s, and there is a re-emergence of tuberculosis.
Most worrying of all is the growing gap in childsurvival prospects between the poor and thebetter-off. Between 1997 and 2002, the largestreductions in both infant and under-fivemortality rates occurred among the middle andnear-poor quintile of the population, with thepoorest quintile seeing the smallest gains.Inequalities in child vaccination grew over thisperiod too, with the poorest fifth of thepopulation barely seeing any improvement,whereas the richest quintile experienced a 55percent increase of its immunization rate.
A sector in transition
Historically, grassroots care was the backboneof Vietnam's health system. During the war,Commune Health Stations (CHSs) and VillageHealth Workers (VHWs) played a key role inreducing communicable diseases and bringingunder control dangerous ones such as smallpox, polio and leprosy. Setting up andmaintaining such a network of local levelpersonnel during difficult times was aremarkable accomplishment. In remotelocalities, the assistance of the military healthsector was crucial.
The quality of care provided at the grassroots
HEALTH CARE
75
Figure 8.1: Child Mortality in International Perspective
Source: Based on data from World Bank (2007c).

SOCIAL PROTECTION
76
level is high by international standards. A studyby the World Health Organization (WHO)found that a high fraction of children withdiarrhea were correctly assessed, and a highfraction of these were correctly rehydtrated(Figure 8.3). A large share of caregivers withsuch children was also adequately advised andthe children were properly managed in a highproportion of cases. A full 100 percent ofchildren with dysentery were treated correctly.The picture was less impressive in relation tochildren presenting with pneumonia.
However, grassroots care is under strain atpresent (Box 8.1). And it is not well placed tocope with the challenges posed by the growingimportance of non-communicable diseases. Theincrease in household income resulting fromrapid economic growth also results in a demandfor more advanced services than CHSs candeliver.
Increasingly, the focus of health policy hasshifted from running an effective health systemat the grassroots level to managing a complex
network of health care providers, ranging fromlarge public hospitals to private practitioners.The scale of the system, the heterogeneity ofhealth care units and the overall decentralizationof government decisions to local levels add tothe complexity of the situation faced by healthauthorities.
Vietnam's hospitals are numerous and diverse.In 2007, there were 1,030 of them run bydifferent levels of government, and anadditional 49 owned and operated by the privatesector. That makes for a total of 16.3 beds forevery 10,000 persons. General and specializedhospitals under the direct management of MOH,all located in Vietnam's main cities, are thelargest and most technical up-to-date. At theprovince level, 324 hospitals handle medicalconditions requiring special treatment. Rangingfrom 300 to 500 beds, they are managed byprovincial health departments. The remaining600 hospitals, at the district level, have anaverage of 80 beds. These hospitals remainhighly dependent on the government budget fortheir operation.
Figure 8.2: Infant Mortality across Regions in Vietnam
Source: Based on data from MOH.

Meanwhile, there has been an explosion inprivate health care. In 2004, there were 65,000private health units licensed throughout thecountry, including 30,000 private healthclinics, 23,000 pharmaceutical units and12,000 traditional health units. These figuresunder-estimate the importance of privateproviders, as there are large number ofunlicensed facilities. Private health units aremainly established in big cities, and especiallyin Hanoi and HCMC. But home visits byprivate providers without a clinic or bytraditional healers are quite common,especially in rural areas.
The private sector plays an important role in thedelivery of out-patient services, where ithandles 60 percent of visits, focusing oninterventions allowing easy cost recovery. Onthe other hand, it only accounts for 4 percent ofin-patient services and 11 percent of preventivecare. The average Vietnamese person has 1.8contacts with private health units per year, 1.2contacts with CHSs, and 0.8 with publichospitals.
Non-government actors are gradually emerging.They include international and local NGOs,
research institutions and professional medicalassociations. Their activities range from theimplementation of preventive and curative careto health promotion and advocacy. Some havefocused on specific health issues such asHIV/AIDS, reproductive health, sanitation andthe quality of care.
Overall, there are around 200,000 health staff ofall categories in Vietnam, including medicaldoctors, pharmacists, nurses, nurse aids,midwives and technicians. The number ofhighly qualified personnel has increased overtime, and includes by now 982 staff withmasters degrees, 337 with PhDs and 188professors and associated professors. About 70percent of the doctors working in the privatesector are also employed in state-ownedfacilities.
The reform strategy
The Doi Moi process entailed a profoundtransformation of the health care system ofVietnam. The last decade and a half have beencharacterized by continuous experimentation insearch of new approaches. But beyond thespecifics these attempts have been guided by
HEALTH CARE
77
Figure 8.3: Quality of Care to Children with Diarrhea
Source: WHO (1998).
two main principles. First is to rely on user feesas a mechanism to reduce the dependence ofhealth care units on budget transfers and toincrease efficiency in the allocation ofresources. And second is to help the poor copewith out-of-pocket health expenditures. Thefirst of these principles is often referred to as the"socialization policy". The second one reflectsthe socialist orientation of the government ofVietnam.
User fees were introduced in 1989 and becamea crucial source of income for the health sector
during the 1990s. The additional incomederived from these fees was especiallyimportant to raise the earnings of healthpersonnel and to finance investments in healthfacilities. The scope for health care providers tomanage themselves was considerably enhancedthrough Decrees 10 (in 2002) and 43 (in 2006).Hospitals could then be operated like SOEs,with their own bank accounts and taxexemptions, with responsibility over personneldecisions, including hiring and firing, and withthe authority to mobilize or borrow resources.Further deepening the move in this direction,
SOCIAL PROTECTION
78
Box 8.1: Health Care at the Grassroots Level
CHSs are the basic technical unit in the public health system. Their main task is to provide primary health careto local populations, including preventive care, family planning, normal delivery, the supply of basic drugs, andoverall health promotion. In principle, the CHS is the primary health facility for most of the poor benefiting fromhealth insurance, before they can be referred to higher levels. CHSs also manage the operation of the localnetwork of VHWs.
The average CHS employs 3 to 5 health workers, including a medical doctor in roughly 70 percent of cases, anassistant doctor, a midwife and a nurse. Nationwide, around 50,000 staff are employed at the CHS level. Theyreceive a salary and get social insurance coverage.
Around 80 percent of villages in Vietnam have a VHW. But not all of them are qualified, especially in remote,mountainous and border areas. More than a quarter of VHWs did not receive the required, three-month training.And most of them perform other jobs assigned by the village or commune, so that they cannot devote much timeto health care activities. VHWs receive a small allowance of roughly 35,000 VND per month.
The grassroots level of the health care system is fundamental for the implementation of National Target HealthPrograms (NTHP). There are 10 such programs at present, dealing with malaria, goiter, tuberculosis, leprosy,dengue fever, immunization, child malnutrition, mental health, food safety and HIV/AIDS. Several NTHPs havegained positive results, especially in relation to extended immunization, malaria and leprosy. These programshave also helped to reduce the morbidity and mortality of some dangerous diseases and epidemics, and contributedto reductions in malnutrition.
About three quarters of the operating budget of CHSs is paid for by the government. The norm for recurrent costsis set at 10 million dong per CHS per year. Funding is provided by the central government in the case ofdisadvantaged communes and by local governments elsewhere. However, more than half of the country's CHSshave expenditures below the regulated norm, and about 72 percent of them have to collect service fees from thepopulation. On average, revenue from fees amounts to 3.7 million dong per CHS per year. Spending on drugsand medical supplies barely reaches 10,000 dong per person treated per year. Given the under-funding of CHSs,spending by the health insurance program on the poor remains very modest.
Since 2006, CHSs no longer report to district hospitals, which only kept responsibility for medical supervision.Now, preventive health bureaus are in charge of the implementation of NTPHs, whereas the health office of theDistrict's People's Committee handles organizational matters. This overlap of responsibilities has substantiallyweakened the coordination of core CHS activities. Besides, CHSs are not recognized as institutional entities.Contracts with them can only be made through their supervising institutions and proper accounting is notperformed.

HCMC is now preparing the equitization of itshospitals. Other provinces can be expected tofollow over time.
As user fees were rapidly raising out-of-pockethealth expenditures, province-level pilots testedfee waivers and cards identifying patients eligiblefor free or discounted services. Some of thosemechanisms rode on social health insurance, aprogram introduced in 1992 that did not havemany takers and was still stagnant one decadelater. Fee waivers did not work well either, ashospitals were often unwilling to accept them;delays, lack of funds, and information gapsspelled trouble for approaches relying on theissuance of cards. Drawing lessons from thesefailures, in 2003 the government passed Decision139, which created province-level HCFPs. Morerecently, it was decided that HCFP would directlypay the health insurance premium of the poor andtargeted groups, whereas a partial subsidy wouldbe offered to the near poor.
In 2005, the politburo of the Party took theunusual step of consolidating the overallapproach to health sector reform into a singlestrategic document, the Resolution 46 on
"People's Health Protection, Care andPromotion in a New Context". Citing concernsabout developments in the sector, andattributing the problems to a disconnectbetween demand and supply, this documentproposed to rapidly increase the share ofgovernment resources devoted to the healthsector, and to channel a larger fraction of thoseresources through health insurance. It even setuniversal health insurance coverage as the targetfor 2010 (the reference to a specific date wassubsequently dropped). It also advanced theneed to upgrade health care facilities, givingpriority to the lower tiers of the system,particularly in the Central Highlands, theNorthern Mountains, the Central Region and theMekong River Delta.
Who pays what?
The emergence of a market economy, theepidemiological transition, the increase inhousehold income and the overall direction ofreforms in the sector have resulted in afundamental transformation of health finance inVietnam.
HEALTH CARE
79
Figure 8.4: Health Expenditures in International Perspective
Source: Based on data from World Bank (2007).

SOCIAL PROTECTION
80
Total health spending is in line with what couldbe expected, given the country's developmentlevel (Figure 8.4). Total health spending is alsogrowing rapidly. In 2003, it was estimated at25.4 dollars per person per year. By 2006, itmay not be too far off the 45 dollars benchmarkproposed by the WHO for poor countries.
A rapid increase in health spending is notsurprising, as this is a common pattern ascountries grow richer. Across countries, a one-percent increase in GDP per capita is associatedon average with a 0.71 percent increase in theshare of health spending in GDP. However, inthe case of Vietnam spending may be growingeven faster.
From an input perspective, it is largely wagecosts that have been driving hospitalexpenditures up. Despite wages making up foronly 40 percent of total hospital costs, theyaccount for half of the growth in healthspending. Another 30 percent is accounted forby rising prices for drugs. From an outputperspective, the number of both inpatients andoutpatients is growing steadily, perhaps ataround 6 to 7 percent per year. But hospitals arealso spending more per patient, especially ondiagnostic tests such as X-rays and ultrasounds,and on surgery.
Hospitals in Vietnam receive their income fromthree main sources: the budget, fee incomereceived from patients and the health insuranceagency. The share of the latter has increased inrecent years. As for the budget, it remains themost important income source for hospitals, butits contribution to the health system as a wholehas been on a declining trend (Figure 8.5).Within government, there has been a transfer ofresponsibilities to the provinces. By 2000,around 60 percent of public spending on healthwas undertaken by provincial governments,with better-off areas raising an even greatershare of revenues from their own resources.
Out-of-pocket expenditures remain the mainsource of income for the health care system inVietnam. Of total household spending onhealth, 30 percent is used to pay user fees (bothofficial and unofficial) in health facilities. Theremaining 70 percent is spent on medicines andmedical consumables in retailers. An analysisof spending associated with inpatient staysshows that only 48 percent of it corresponds touser fees. Indirect expenses on medicines andextra services such as food, lodging, travel andgifts for health workers account for the rest.
Out-of-pocket expenditures are large enough topotentially result in higher poverty. Of course,
Source: MOH (2007a).
Figure 8.5: Mostly from Out-of-Pocket Payments

it is always difficult to assess what would havehappened in their absence, as households wouldhave probably behaved differently. Forinstance, if they did not need to save so muchfor health care perhaps they could have chosento work less hard. But a crude estimate of thepoverty impact of out-of-pocket expenditurescan be obtained by assuming that the moneycould have been used to support consumption.In that case the poverty rate of Vietnam wouldhave been 1.1 percentage points lower. Thisestimated impact is bigger than in othercountries in the region, except for China whereit is more than twice as large. Also, accordingto one estimate Vietnam has the highestincidence of catastrophic health care spendingin the world, together with Brazil.
User fees may not be the main factor behindlarge out-of-pocket expenditures in Vietnam, asshown by the importance of spending on drugsand other medical consumables. But incombination with the increased autonomy forservice delivery units, user fees might havecontributed to this outcome.
User fees are a mixture of charges per service(for instance, in the case of diagnostic tests) andcharges per day (for inpatient stays). There areauthorized ranges for each type of fee and alsovariations according to the type of hospital. Theintroduction of user fees did not result in highercharges by district-level hospitals, which werenot initially subject to Decree 10. But inprovincial hospitals it led to a 47 percentincrease in out-of-pocket income by the thirdyear of implementation. Whether such anincrease was justified in medical terms isdifficult to tell. But there is a risk thatautonomous hospitals simply induced demandfor their services.
Market imperfections
Solid health outcomes on average, good qualityof care at the grassroots level and the rapidexpansion in the availability and quality ofhealth services are all accomplishments thatVietnam can be proud of. However, inequalitiesin health outcomes, the ballooning of healthcare costs and the importance of out-of-pocket
expenditures suggest that important, unresolvedproblems remain in the organization of thehealth system.
The reform strategy adopted by the governmentis clear but its success will hinge on theorganization of health insurance, the mainmechanism chosen to extend access to healthcare and finance the delivery of health servicesover time. Given its importance, this is an issuethat deserves to be treated separately. Butsuccess will also depend on a goodunderstanding of the peculiar nature of marketsin the health sector, where informationasymmetries and monopoly power are common,and may result in inefficient outcomes. In thiscontext, just relying on market incentives andfinancing participation in mainstream programsby the poor (the two main principles of Doi Moireforms) may prove insufficient.
One area in need of attention is the delivery ofhealth services to those who are exempted fromthe payment of user fees, or simply cannotafford them. Decree 10 aimed to enlarge theoperational and financial autonomy of hospitals,providing their managers with wide latitude inall areas, except in setting fees. Hospitals wereallowed to earn net income, distribute it amongtheir staff and invest it. For instance, theyestablish wards for fee-paying patients,providing better-quality care than in regularhospital areas.
This latitude in the use of revenue from feesaligns the incentives of health staff with theinterests of fee-paying patients. But in theabsence of tight monitoring, it can be expectedto result in a relative neglect of those whocannot afford the fees, or are officially exemptfrom paying them. To the extent that hospitalsoffer health care interventions not availableelsewhere in their vicinity, there is also anincentive to set fees at an excessively high level.And with patients depending on healthpersonnel to tell them what they need, thetemptation to prescribe too many drugs anddiagnostic tests could be difficult to resist.
Decree 43 tried to realign incentives towardscompliance with social mandates. Under thisdecree, hospital staff only get a share of the
HEALTH CARE
81

revenue from fees after recurrent costs arerecovered (partly or fully) and after the first 25percent of the revenue is set aside for theupgrading of facilities. A cap was introduced onthe wage bill of hospital personnel, whichreduces their incentive to charge excessivelyhigh fees. Decree 43 also refers to the need tomonitor the quality of services provided.However, Vietnam lacks credible quality controlmechanisms in health care, and no reliablemonitoring system exists. Setting up suchsystem would be a major task. Consumerassociations should be involved in it.
A second, related problem with the currentdirection of reforms concerns the certificationof providers. By now, a large fraction of out-of-pocket expenditures is on services delivered byprivate health units, which account for 60
percent of outpatient visits. But patients arepoor judges of the quality of care they receive.In this context, the certification of providersbecomes crucial. Certification will also berequired if health insurance is to become the keymechanism to pay for health services, asforeseen by Resolution 46. Making a privatephysician eligible for the reimbursement ofexpenses by VSS is a straightforward way tosignal his or her medical expertise. But with atleast 65,000 private health units in Vietnam,going through this certification process in anysubstantive way would be a vast logisticchallenge.
The certification of providers should alsoextend to non-government actors. Their right toprovide social services was officiallyrecognized in 2004. However, their role does
SOCIAL PROTECTION
82
Box 8.2: Drug Production, Commercialization and Pricing
The patent system, developed under the WTO Trade Related Aspects of Intellectual Property Rights (TRIPs)agreement of 1995, established a global standard of 20 years of patent protection for all forms of technology,including medicines. Under the patent system, pharmaceutical companies have not always offered medicines ataffordable prices in developing countries, thus placing financial strains on national health programs and on peoplewho must pay for medicines out of their pocket. Under the original TRIPs Agreement, developing countries weretherefore provided with safeguards and flexibilities to promote and protect public health. The right of developingcountries to protect public health was reaffirmed under the Doha Declaration, which was agreed upon by all WTOMember States in November 2001.
Generic competition is an effective approach to reducing medicine prices. TRIPs safeguards introduce genericcompetition during the patent term and ensure rapid introduction of generic medicines upon patent expiration.Thailand, for example, exercised a specific safeguard, known as compulsory licensing, for three medicines to treatHIV/AIDS and cardiovascular disease. Before it did so, patent holders were unwilling to reduce the price theycharged for these medicines. But in response to the use of this safeguard, the Ministry of Public Health receivedsignificant discounts. This confirms the importance of compulsory licensing as a tool to prevent the abuse ofmonopoly power by pharmaceutical companies .
Developing countries are under pressure to introduce stricter levels of intellectual property rights protection,especially in the context of bilateral or regional free trade agreements. For instance, since 2002 all free-tradeagreements with the US include "TRIPs-Plus" articles. However, there are concerns that the implementation ofTRIPs-Plus could lead to increased expenditure on medicines. And it is not clear that higher protection ofintellectual property rights will encourage pharmaceutical research that is relevant for the needs of developingcountries. Indeed, less than 2 percent of the new medicines launched since 1999 address developing countrydiseases.
As public health demands continue to place a strain on public health systems in developing countries, it will beincreasingly important for intellectual property right rules to closely adhere to the letter and sprit of the DohaDeclaration on TRIPs and Public Health.
Source: Oxfam International (2006).

HEALTH CARE
83
not seem to have received the importance itdeserves, and there is a perception that theyhave been treated marginally in designingpolicies for the health sector.
A third area which needs attention relates todrug policies. A large fraction of out-of-pocketexpenditures in Vietnam goes into buyingmedicines. This is partly due to limitedcompetition in the domestic market for drugs.Single distributors often control large segmentsof it, which results in high markups overimported prices. From this perspective, it isreassuring to see the emphasis of thePharmaceutical Law of 2005 on fosteringcompetition. The Law approaches marketregulation on the basis that manufacturers andtraders are entitled to compete in terms of price.
However, there is also scope for a more activestance in relation to cheaper, generic drugs.Monopoly power by laboratories is intrinsic to thesystem through which pharmaceutical research isencouraged. Drug discovery and development isa complex, lengthy and costly process.Intellectual property rights are used to restrict theimitation of discoveries for some time, thusallowing laboratories to recover their research anddevelopment costs through high prices. But froma humanitarian perspective this is harder to justify.This is why developing countries can regulateintellectual property rights in ways that favor thedevelopment of cheaper, generic products, whileencouraging domestic pharmaceutical research(Box 8.2). The government of Vietnam shouldexplore such ways as it strives to implement itscommitments towards the WTO.

84
After a decade of sluggish growth, participationin Vietnam's health insurance program is nowexpanding rapidly and could soon reach half ofthe population. The program is actually made ofseveral schemes. The original ones covered theformal sector of the economy on a compulsorybasis, and the rest on a voluntary basis. Themain innovation behind the current rapidgrowth in enrollment was to create a new entrymodality, whereby the government directly paysthe premium on behalf of targeted populationgroups (disadvantaged people, children belowsix years of age…) This approach has beeneffective at increasing coverage among the poor,to whom it has provided better access to healthservices. The same principle will be applied toprovide partial subsidy to the near-poor so thatthey can participate on a voluntary basis.However, the health insurance program has alsoresulted in an escalation of health care costs, tothe point where the program ran a deficit for thefirst time in 2007. Two main forces underliethis trend. First, providers face an incentive todeliver both more treatments and moreexpensive treatment than may be warranted onmedical grounds. Second, the expansion of theprogram suffers from adverse selection,meaning that heavy users of health care servicesare more likely to enroll. Addressing these twoproblems through a higher premium for thevoluntary scheme or a higher social securitycontribution for the compulsory scheme wouldonly offer temporary relief. Such responsecould undermine the expansion of coverage andthe formalization of employment. Morepromising alternatives include strengthening theprocedures through which patients are referredto more advanced and expensive facilities,modifying the rules used to reimburse healthcare providers so as to encourage them to be
more efficient, and establishing dedicated fundsto cover the cost of chronic illnesses and life-threatening diseases for the population at large.
One program, several entries
In 1992, four years after the introduction of userfees under Doi Moi, the government launched ahealth insurance program. At the time, itcomprised two schemes: one compulsory, forworkers in the formal sector, the othervoluntary.
The compulsory scheme covers mainly civilservants, workers in SOEs and those inrelatively large private sector firms. Initially,only enterprises with ten workers or more wereobliged to participate, but this size thresholdwas eliminated in 2005. The contribution to thescheme is set at 3 percent of the salary, of which2 percentage points are formally paid by theemployer. Protection by this scheme does notextend to family members. But people of meritand pensioners are covered at the government'sexpense.
The benefit package is quite generous, as itincludes outpatient and inpatient services at alllevels of health care. It also includes laboratoryexams, X-rays and other diagnostic imagingprocedures, as well as drugs listed asreimbursable. The health insurance fund evencovers expensive high-tech services such asMagnetic Resonance Imagery, hemodialysis andopen-heart surgery. Insured patients are eligiblefor health care provided not only at publichealth facilities, but also in private units thathave contracts with the health insurance agency.
Despite the low contribution rate and the
9. HEALTH INSURANCE

generosity of the package, until not long agocompliance with the compulsory scheme wasonly partial. By 2005, mostly all SOEsparticipated in the program, but only a fractionof private enterprises did (Figure 9.1).Moreover, assessing compliance on this basisis potentially misleading, as even amongparticipating enterprises only a fraction of theworkers tends to be declared, and only afraction of their wage is used to calculate thecontribution. If the average contribution ratepaid by the enterprise is considered instead,the shortfall appears to be much larger.Including contributions towards old-agepensions and other benefits, enterprises shouldbe paying 17 percent of their wage bill to VSS.In 2005, the actual figure is between a thirdand a half of that.
The voluntary scheme is aimed at the rest of thepopulation, including the families of contributorsto the compulsory scheme. Payments are on aflat rate. Since 2007 the premium varies byregion, according to their development level.Co-payments had been eliminated in 2005, butwere reintroduced in 2007.
Group enrollment was encouraged, to betterpool risks between healthy participants andthose who are more likely to become heavyusers of health services. Education facilities, forinstance, can enroll their pupils only providedthat at least 30 percent of them participate. In2007 the focus shifted to householdmembership. Benefits were also revised withthe introduction of waiting time for hightechnology treatment and maternity. Given theslow expansion of the voluntary scheme, thereis a debate as to whether to remove allconditions on group participation.
Resolution 46 gave a new impetus to the healthinsurance program. It was followed shortlyafter by Decree 63, which significantlyincreased the scope and depth of the benefitpackage for both schemes. Importantly, thegovernment chose to directly financeparticipation in the program by increasinglylarge population groups. In practice, thisamounted to a new entry modality into thehealth insurance program
Vietnam was the first country in Asia and thesecond in the world to ratify the UN Convention
HEALTH INSURANCE
85
Figure 9.1: A Varying Degree of Enterprise Compliance
Source: Based on data from the 2005 Enterprise Survey by GSO.

on the Rights of the Child. In connection withthis move, in 2005 it was decided that publichealth facilities would provide health care freeof charge to children below six years of age.Such facilities were also mandated to hand overfree health insurance cards to children in need ofmedical attention. The government, in turn,committed to making the necessary transfers tofinance the additional costs.
A similar approach was adopted in the case ofdisadvantaged groups. Provincial HCFPs hadbeen created under Decision 139, in 2002, tofinance the health costs incurred by the poor, byethnic minority groups in six northern and fivehighland provinces, and by people living indifficult communes covered by Program 135.In practice, HCFP resources had been used todirectly reimburse public health care units forthe services rendered to these groups. But in2005 provinces were instructed to use HCFPresources to directly purchase health insurancecards for everyone in the targeted population.The initial allocation, out of the central budget,was 50 thousand VND per year per beneficiary.It will be raised to 130 thousand from 2008onwards. Increasing the government support forthe contribution by the poor to a level equivalent
to 3 percent of the minimum wage is beingconsidered as well.
A partial subsidy would also be extended for thenear poor to enrol. In late 2007, the decisionwas made to support half of the health insurancepremium for this group. Several provinces hadalready embraced this approach and were usingtheir own resources to top up the HCFPs andsupport participation in the health insuranceprogram by the near poor.
Who is covered?
Growing formalization, increased enrollmentin the voluntary scheme with governmentsupport, and above all the extension of theprogram to targeted population groups haveresulted in a rapid expansion of healthinsurance coverage, from around 25 percent ofthe population in 2004 to more than 40 percentat present (Figure 9.2).
It is often argued that health insurance isunlikely to result in substantial coverage. Indeveloping countries, the argument goes, theformal sector of the economy is small, so thatcompulsory schemes can only reach a fraction
SOCIAL PROTECTION
86
Figure 9.2: A Rapid Expansion in Coverage
Source: Based on data from VSS for 2006. Series on population groups are measured in millions of insured(left axis); the series for the total is expressed in percent of the population (right axis).

of the population. As for voluntary schemes,they suffer from adverse selection, meaning thatonly the elderly and those in need of healthtreatment have an incentive to enroll, whereasthe young and healthy majority of thepopulation is unlikely to do so.
While all this is true in Vietnam's case too,financial support by the government and theactive involvement of mass organizations inencouraging participation make the word"voluntary" lose some of its original meaning.From this perspective, discussing the merits anddemerits of social health insurance in general, orits potential to eventually reach universalcoverage, may not be particularly enlighteningin the case of Vietnam. A more relevantdiscussion is whether the health insuranceprogram is reaching those in need of support,and whether it is helping them gain access toaffordable health care of reasonable quality.
On the program's coverage, there are both goodand bad news. The good news is that resourcesfrom HCFPs are relatively well targeted towardsthe intended beneficiaries (Figure 9.3).Participation is highest among the poorest
quintile of the population, and declines asincreasingly better-off groups are considered.Admittedly, there is some leakage too, in thesense that individuals who are in principle noteligible do get support from HCFPs. Butleakage appears modest overall, and it happensmainly among the poorest population groupsanyway.
The conclusion is similar when considering thedistribution of HCFP resources across regions,rather than across population groups. Threequarters of the funding goes to the NorthernMountains, the Mekong River Delta, the NorthCentral Coast and the Red River Delta, in thatorder. On a per capita basis, however, the SouthEast receives almost four times the allocation ofthe Northern Mountains, and six times theallocation of the North Central coast.
The bad news is that the program is not coveringall vulnerable groups. Based on the criteria setby Decision 139, as of 2004 roughly 31 percentof the population ought to have been covered byHCFPs. But by the end of 2006 the real figurewas only around 22 percent. The situationmight have improved since then, both due to a
HEALTH INSURANCE
87
Figure 9.3: Targeting and Leakage in Decision 139
Source: World Bank (2007c).

better operation of HCFPs and to the fall in theproportion of the population living in poverty.However, some vulnerable population groupsare unlikely to be covered. Migrants are one ofthem. According to a recent study, for the smallportion of migrants that was sick and treated athealth facilities, 84 percent had to pay for thecost of services and medications out of theirown pockets. Only 12 percent had the costcovered by their family. None of them hadhealth insurance.
Access to services
The main goal of health insurance is to reducethe cost of medical treatment, especially in theevent of catastrophic shocks. In an actuariallyfair program, the total amount insured peoplespend on health, on average, should not beaffected by such shocks. The effect of insurancewould be to even out payments for health careacross the population. Those payments wouldnot vary so much according to whether peopleget sick, but rather according to their earnings(in the mandatory scheme) or not at all (in thevoluntary scheme).
Most estimates from Vietnam suggest that
health insurance coverage does not affect out-of-pocket expenditures or, if it does so, theeffect is not large or statistically significant.Only one study, on the voluntary scheme in HaiPhong, found a very large impact. A couple ofother studies estimated out-of-pocket savings inthe range of 20 to 35 percent, whereas morethan a dozen of them reported no effect. Also,health insurance might have reduced theincidence of catastrophic health spending, butnot dramatically. If the estimates are to beinterpreted literally, HCFPs result incatastrophic spending declining by 3 to 5percentage points.
However, looking only at out-of-pocketexpenditures is potentially misleading. If healthinsurance coverage makes access to healthservices more affordable, participants can beexpected to make a more intensive use of suchservices. The combination of lower costs andhigher use is certainly associated with increasedwellbeing. But it is not necessarily associatedwith lower out-of-pocket expenditures. The realissue, then, is whether participants in theprogram make a more intensive use of healthservices. The findings of available studies aremore consistent in this respect.
SOCIAL PROTECTION
88
Figure 9.4: Vast Disparities across Regions
Source: Based on data from VSS.

Health insurance coverage increases theprobability of admission to hospital and thelength of stay in hospital. To a lesser extent, itincreases the use of outpatient care as well.Studies also find evidence of health insurancecoverage encouraging the use of public sectorfacilities, instead of private health units andpharmacies. However, the impact varies acrossincome groups, with the poorest groupexperiencing the smallest increase.
Impacts appear to vary across schemes. Forinstance, the effect of insurance on theprobability of admission to hospital is smalleramong participants covered by HCFPs thanunder the compulsory scheme. And it issmaller still for those in the voluntary scheme.There is also evidence of impacts varying withincome. Membership of the mandatory schemeincreases the likelihood of hospital admissionfor all income groups, but the effect is mostpronounced for middle income groups. Amonglower income groups, mandatory healthinsurance has no significant impact on thelength of stay. Worryingly, no significantimpacts on inpatient care are evident among thepoorest 10 percent of the population, whichmay result from other barriers faced by thisgroup to access health services, notablytransport and time costs.
There are also some implicit barriers this groupfaces, as they have to first seek care at CHSswhose quality of service is low. Biasedtreatment and poor attitude of health stafftowards patients from this group also present asignificant obstacle on their way to seek care.Other barriers are related to hidden costs, suchas transport to the newest service provider, lossof earnings or the price it medicines.
Qualitative studies and focus group discussionstend to confirm that health insurance coveragemay not be enough to gain access to services.Throughout, beneficiaries of Decision 139 statethat they receive less attention than patientspaying on a private basis, particularly from thelevel of district hospitals upwards. It alsoappears that beneficiaries of Decision 139 arenot fully aware of the benefits they are entitledto, or do not understand the rights associated to
health insurance cards. In fact, limitedunderstanding extends beyond this group,affecting some times health staff at local levels.Also, in many opportunities patients who arecovered by health insurance do not use theircards when accessing services.
Access barriers are less severe in the case ofchildren below six years of age. Reports byprovincial health departments claim that 96percent of those children had received their freehealthcare cards. This claim is not reflective ofthe overall picture. If figures from thepopulation census are used as a reference, thenonly two thirds of the eligible children havebeen given cards. However, this in itself shouldnot be a major obstacle. MOH guidelinesstipulate that children under six without healthcare cards can still receive free services atpublic facilities as long as they present"equivalent papers", which include birthcertificates and commune birth registrationdocuments.
A spending bias
Health insurance can also be expected to lead toan overall increase in health spending. To someextent, this is so by design. Reducing the out-of-pocket cost of medical attention is bound tolead to an increased use of health services, ashas happened in Vietnam. This can beconsidered as a positive outcome, especially inthe case of disadvantaged population groupswho would have otherwise relied on self-medication or would not have sought anytreatment. But there are also less positivereasons why health insurance may lead to anescalation of health care costs.
On the users' side, in the absence of universalcoverage there is adverse selection, in the sensethat it is people with poorer health who tend toenroll. Those who are covered by the programare therefore likely to use medical services moreintensively than those who are not. On theproviders' side, unless the program is very welldesigned, there is an incentive to deliver moreservices than is warranted and to choose moreexpensive services too. This is because of thepractical difficulties in checking all medical
HEALTH INSURANCE
89
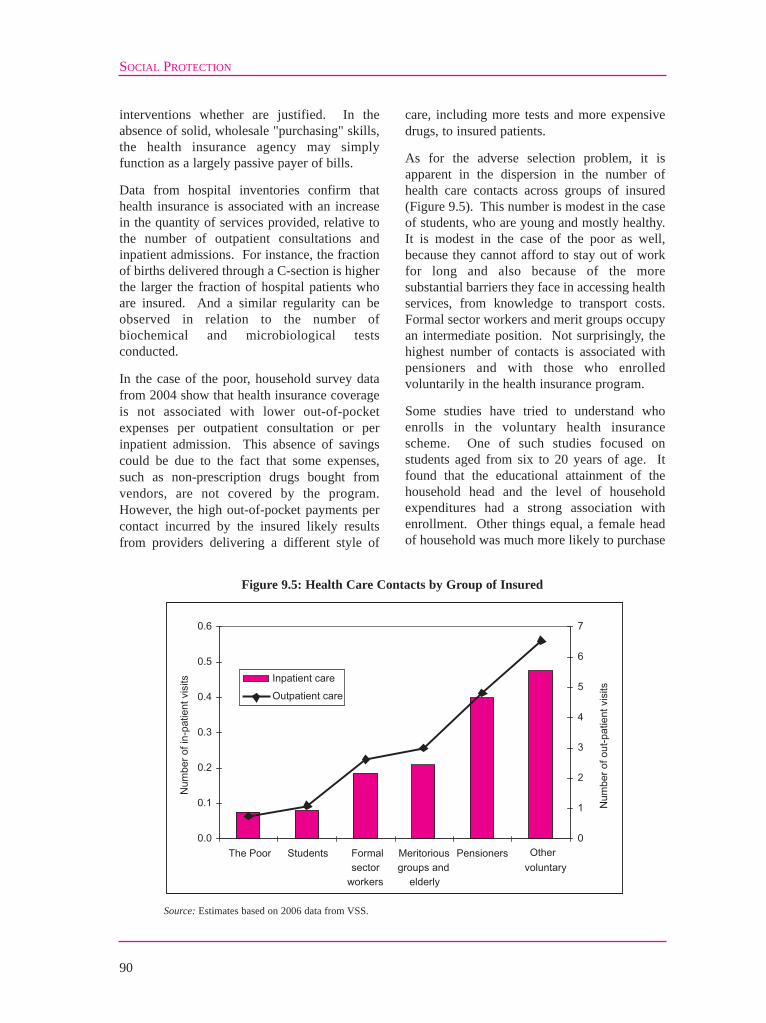
interventions whether are justified. In theabsence of solid, wholesale "purchasing" skills,the health insurance agency may simplyfunction as a largely passive payer of bills.
Data from hospital inventories confirm thathealth insurance is associated with an increasein the quantity of services provided, relative tothe number of outpatient consultations andinpatient admissions. For instance, the fractionof births delivered through a C-section is higherthe larger the fraction of hospital patients whoare insured. And a similar regularity can beobserved in relation to the number ofbiochemical and microbiological testsconducted.
In the case of the poor, household survey datafrom 2004 show that health insurance coverageis not associated with lower out-of-pocketexpenses per outpatient consultation or perinpatient admission. This absence of savingscould be due to the fact that some expenses,such as non-prescription drugs bought fromvendors, are not covered by the program.However, the high out-of-pocket payments percontact incurred by the insured likely resultsfrom providers delivering a different style of
care, including more tests and more expensivedrugs, to insured patients.
As for the adverse selection problem, it isapparent in the dispersion in the number ofhealth care contacts across groups of insured(Figure 9.5). This number is modest in the caseof students, who are young and mostly healthy.It is modest in the case of the poor as well,because they cannot afford to stay out of workfor long and also because of the moresubstantial barriers they face in accessing healthservices, from knowledge to transport costs.Formal sector workers and merit groups occupyan intermediate position. Not surprisingly, thehighest number of contacts is associated withpensioners and with those who enrolledvoluntarily in the health insurance program.
Some studies have tried to understand whoenrolls in the voluntary health insurancescheme. One of such studies focused onstudents aged from six to 20 years of age. Itfound that the educational attainment of thehousehold head and the level of householdexpenditures had a strong association withenrollment. Other things equal, a female headof household was much more likely to purchase
SOCIAL PROTECTION
90
Figure 9.5: Health Care Contacts by Group of Insured
Source: Estimates based on 2006 data from VSS.
health insurance for her children than a malehead. A short distance to the district hospitaland the presence of a public hospital in thecommune were also positively associated withenrollment, whereas the availability of privatehealth units had a negative effect. But overall,the study found little evidence of adverseselection among this group, as the height-for-age score was higher among enrolled children.
The conclusion was different in the case ofinformal sector workers. A study of enrollmentin the voluntary scheme among this group foundsome differences across industries. For instance,those working on a self-employment basis in thehealth sector were considerably more likely tohave enrolled. There were differences byoccupation too, with those who classifythemselves as skilled being more likely to enrollthan the unskilled. Women were more likely toenroll than men, and workers from high-incomehouseholds were more likely to enroll as well.But unlike the case of students, the study foundsome evidence of adverse selection among thisgroup, as informal sector workers who had beenconfined to bed or had taken time off workbecause of illness were more likely to enroll.
Financially viable?
At the beginning of 2007 the deficit of thevoluntary health insurance scheme was growingso rapidly that VSS temporarily suspended itsoperation. In barely two years, expenditures haddoubled and the balance of the health insuranceprogram as a whole had gone from a surplus of400 billion dong in 2004 to a deficit of 1.2trillion in 2006. The voluntary scheme was themain source of the problem, with thecompulsory insurance scheme not being able tocompensate for the shortfall anymore. In early2007, for the first time, VSS was no longercapable to fully reimburse the healthexpenditures of its members. Only after co-payments were reintroduced in the voluntaryscheme, and the premium for the voluntaryprogram was almost doubled, was the issuanceof health insurance cards authorized again.
The government is by far the biggest source ofVSS funding. In 2006, it paid contributions on
behalf of 4.5 million public sector employees.In addition, it directly or indirectly covered thepremium of another 18 million participants,among them public pensioners, merit groups,the poor and other disadvantaged people.
Securing income from other sources has provedmore elusive. For instance, there is a substantialgap between the contributions formal sectorfirms pay towards social insurance and thecontributions they report to the taxadministration office for the purpose of taxexemptions. Also, not all provinces use theresources from the HCFP to purchase healthinsurance for targeted population groups. LangSon, for instance, provides health insurancecards to the poor only when they need medicalattention, keeping its HCFP resources for otheruses. Meanwhile, VSS has substantialoutstanding bills with hospitals.
At a deeper level, however, the problem is theescalation in the costs per enrollee. Theexpansion in coverage is insufficient by itself toaccount for the growth in expenditures. Hadcosts per enrollee stayed at their level of 2003,expenditures would have gone up by only 30percent of their actual increase (Table 9.1).
Moreover, there is a clear gap between incomeand expenditure for two groups of insured,namely pensioners and participants in thevoluntary scheme other than students (Figure9.6). These worrying developments underscorethe need to keep treatment costs down, or atleast to keep their rate of growth in line withincome growth.
Smarter spending
Containing treatment costs per insured personand addressing the adverse selection problemhold the key to making the health insuranceprogram financially viable. Alternatives suchas raising the premium for the voluntaryscheme, or the contribution rate for thecompulsory scheme, can only offer temporaryrelief, because they do not correct the tendencytowards ever greater spending. Moreover,adjusting on the revenue side would have theunintended consequence of reducing coverage.
HEALTH INSURANCE
91

Higher contribution rates, in particular, wouldslowdown the formalization of the economy,especially at a time when minimum wagesneed to grow rapidly in order to comply withWTO commitments.
In practice, several complementary approachescould be considered to contain treatment costsand address the adverse selection problem.
They involve directing patients towards lessexpensive health care facilities wheneverappropriate, removing the incentive for serviceproviders to deliver unnecessary diagnosticsand treatment, and moving the funding forchronic illnesses and catastrophic shocks out ofthe program.
In the parlance of health specialists, these
SOCIAL PROTECTION
92
Reimbursement per card (thousand dong) Insurance group
2003 2004 2005 2006e I. Compulsory scheme 97 126 180 171 Pensioners 145 325 479 717 Formal sector and merit groups 136 171 238 265 II. Voluntary scheme 16 21 45 151 Students 16 19 26 56 Other voluntary 65 136 701 III. Poor and disadvantaged 34 52 71 56 All 73 91 126 166
Table 9.1: Average Spending by Type of Insured
Source: Based on data from VSS.
Figure 9.6: Costs and Revenues of the Health Insurance Program
Source: Based on data from VSS.

approaches concern referral procedures,provider payments and specialized fundsrespectively. At the risk of simplifying, strongerreferral procedures and better-designed providerpayments aim at containing treatment costs perinsured person, whereas specialized funds couldbe used to mitigate the adverse selectionproblem. Specialized funds could alsocontribute to making the system more equitable,at a time when the majority of the population isnot yet covered by the health insuranceprogram.
Before describing these approaches in moredetail, it is important to note that their financialimplications could go well beyond the healthinsurance program. VSS is gradually becominga major source of income for hospitals, asimportant by now as user fees (Figure 9.7).Meanwhile, the share of income directlyprovided by the budget is gradually declining.It amounted to 47 percent in 1998 but was downto 37 percent by 2006. VSS is also increasinglypassing contracts with private health care units.The growing importance of VSS as a wholesalepurchaser of health services makes it a naturalcandidate to encourage efficiency gains in
health care more generally. Its procedures, interms of referrals or reimbursements, stand achance to become industry standards. If theywere well designed, they could help contain thebroader escalation of health care costs inVietnam.
The main weakness of Vietnam's referral systemat present is its inability to prevent the insuredfrom "jumping" levels in the hierarchy of healthcare facilities and choosing unnecessarilyexpensive ones as their first point of contact. Inprinciple, CHSs should transfer patients todistrict hospitals, district hospitals shouldtransfer patients to provincial hospitals, andprovincial hospitals should transfer patients tocentral hospitals (in the South to HCMC and inthe North to Hanoi). In serious cases, levels canbe legitimately skipped. But bypassing seemsto be the rule more than the exception. Forinstance, a study on paediatric emergencyshows that about half of children patients checkdirectly into central hospitals, despite many ofthem not being from the city in which thecentral hospital they have checked into islocated. Such bypassing causes overload inexpensive central hospitals, distracts the best
HEALTH INSURANCE
93
Figure 9.7: Sources of Hospital Income
Source: MOH, Vietnam hospital inventories.

specialists towards minor cases, and results inhigher health care costs on average.
One important motivation for patients to skipreferral levels is to avoid what they perceive asbad quality of service. CHSs, which areofficially the first in line, do not have a goodreputation among the population at large, withhealth workers at higher levels or even with thehealth insurance agency. There isdissatisfaction even among the poor, despite theCHS being their main access point for medicalcare, above the pharmacy and the VHW. Arecent survey revealed discontent with the rangeof equipment and the quality of examinations atCHS level. Perceptions were more positive inrelation to district hospitals and above, excepton the friendliness of health staff which appearsto worsen. However, there are reasons to bedissatisfied with the quality of care at thoselevels too. In 2003, only 59 percent of patientsreferred to provincial hospitals had beencorrectly diagnosed at the district level, and 75percent of patients referred to central hospitalshad been correctively diagnosed at theprovincial level.
To mitigate the skipping of referral levels, a toppriority is to improve the quality of health careprovided by CHSs. But it is also important tostrengthen referral procedures, so thatprospective patients do not unnecessarily jumpover lower-level facilities. To achieve this goal,it could be more efficient to provide financialincentives to the facilities than to penalizeprospective patients. The health insuranceagency could apply a discount on thereimbursement of services to hospitals if thepatient was not appropriately referred by thelower level. This could create some pressurefrom district hospitals to their affiliated CHSs toensure that they comply with referralprocedures. As for the CHSs themselves, VHScould pay them a flat fee for consultationprovided.
Paying health care providers on a fee-for-service basis is not necessarily a good idea athigher levels in the system (Box 9.1). However,this is what VSS does since the mid 1990s,when a mixture of fees per outpatient service
and daily rates for inpatient stay wasestablished. Ceilings apply at low levels in thesystem, but not higher up. The schedule hasbeen revised, with the introduction of newprocedures and the pricing of some new drugs.But the incentive remains to overspend.Admittedly, the inspection unit of VSS performsa control of the charges reported, trying toassess whether they are plausible. But inpractice, this is a purely administrative check,resulting in a collective invoice being submittedby the provider. The consequence has been anescalation of refunds at higher levels. Forinstance, in 2007 one central hospital in Hanoiabsorbed 5 percent of the total amountreimbursed by VSS nationwide.
It would make sense for VSS to assume the roleof an informed wholesale purchaser, linkingrefunds to medical conditions more than toservices provided and specifying the requiredquality standards.
Experimentation with alternative providerpayment mechanisms has been going of forsome time already. Capitation was introducedin Hai Phong (since 2005) and Hai Duong (since2007). After six months of operation, goodcompliance with the delivery of the services andprescription of generic drugs was observed,whereas the administrative workload decreasedsignificantly. However, there were concernsabout the difficulty to finance the introductionof high-tech procedures. There were also initialsteps towards establishing a pathology-basedreimbursement system. The analysis concludedthat in the case of conditions with limited costvariation, such as appendicitis and C-section,DRG payments would be workable. However,DRGs are difficult to introduce on a large scalewithout appropriate (and highly elaborate)costing and controlling mechanisms.
Finally, some consideration should be given tothe mechanism to fund the treatment ofchronic illnesses and life-threatening diseases,such as diabetes or cancer. These are themedical conditions resulting in catastrophicshocks for household. The current coverageof the health insurance program implies thatmore than half of the population is exposed to
SOCIAL PROTECTION
94
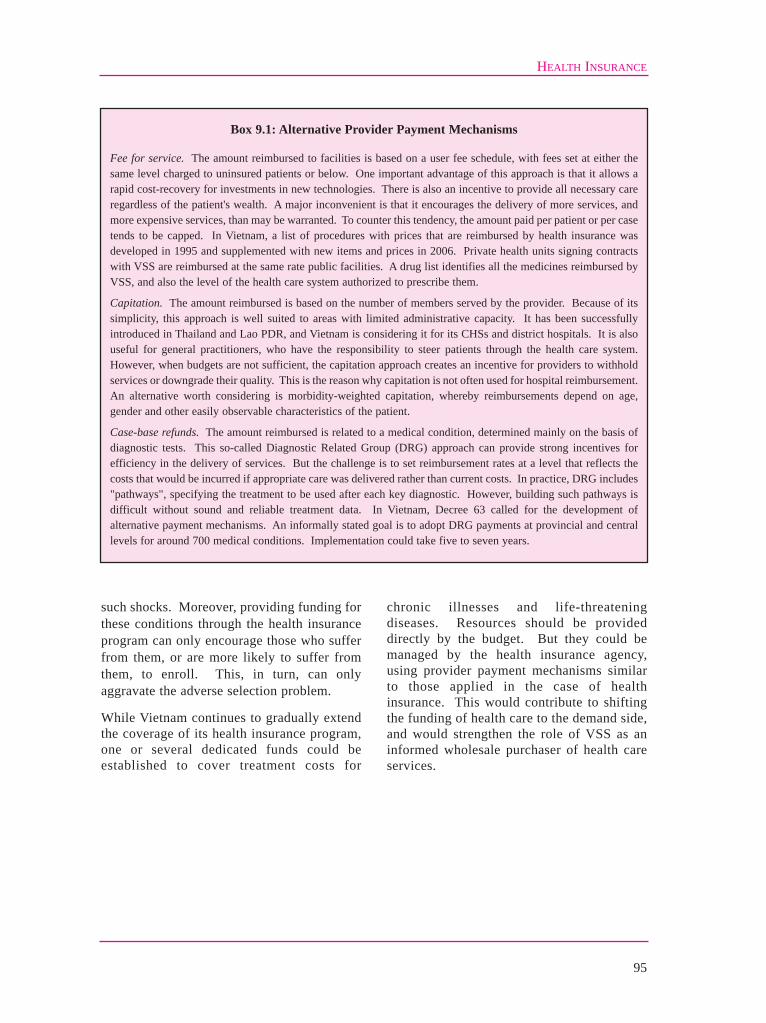
HEALTH INSURANCE
95
such shocks. Moreover, providing funding forthese conditions through the health insuranceprogram can only encourage those who sufferfrom them, or are more likely to suffer fromthem, to enroll. This, in turn, can onlyaggravate the adverse selection problem.
While Vietnam continues to gradually extendthe coverage of its health insurance program,one or several dedicated funds could beestablished to cover treatment costs for
chronic illnesses and life-threateningdiseases. Resources should be provideddirectly by the budget. But they could bemanaged by the health insurance agency,using provider payment mechanisms similarto those applied in the case of healthinsurance. This would contribute to shiftingthe funding of health care to the demand side,and would strengthen the role of VSS as aninformed wholesale purchaser of health careservices.
Box 9.1: Alternative Provider Payment Mechanisms
Fee for service. The amount reimbursed to facilities is based on a user fee schedule, with fees set at either thesame level charged to uninsured patients or below. One important advantage of this approach is that it allows arapid cost-recovery for investments in new technologies. There is also an incentive to provide all necessary careregardless of the patient's wealth. A major inconvenient is that it encourages the delivery of more services, andmore expensive services, than may be warranted. To counter this tendency, the amount paid per patient or per casetends to be capped. In Vietnam, a list of procedures with prices that are reimbursed by health insurance wasdeveloped in 1995 and supplemented with new items and prices in 2006. Private health units signing contractswith VSS are reimbursed at the same rate public facilities. A drug list identifies all the medicines reimbursed byVSS, and also the level of the health care system authorized to prescribe them.
Capitation. The amount reimbursed is based on the number of members served by the provider. Because of itssimplicity, this approach is well suited to areas with limited administrative capacity. It has been successfullyintroduced in Thailand and Lao PDR, and Vietnam is considering it for its CHSs and district hospitals. It is alsouseful for general practitioners, who have the responsibility to steer patients through the health care system.However, when budgets are not sufficient, the capitation approach creates an incentive for providers to withholdservices or downgrade their quality. This is the reason why capitation is not often used for hospital reimbursement.An alternative worth considering is morbidity-weighted capitation, whereby reimbursements depend on age,gender and other easily observable characteristics of the patient.
Case-base refunds. The amount reimbursed is related to a medical condition, determined mainly on the basis ofdiagnostic tests. This so-called Diagnostic Related Group (DRG) approach can provide strong incentives forefficiency in the delivery of services. But the challenge is to set reimbursement rates at a level that reflects thecosts that would be incurred if appropriate care was delivered rather than current costs. In practice, DRG includes"pathways", specifying the treatment to be used after each key diagnostic. However, building such pathways isdifficult without sound and reliable treatment data. In Vietnam, Decree 63 called for the development ofalternative payment mechanisms. An informally stated goal is to adopt DRG payments at provincial and centrallevels for around 700 medical conditions. Implementation could take five to seven years.

96
The old-age pension program of Vietnam hasrecently been revamped with the aim ofmaking it financially sustainable andextending its coverage, on a voluntary basis,to the informal sector of the economy. Thereare few pensioners for now. Almost all ofthem used to work for government or forSOEs. But multi-generation familyarrangements imply that almost one in tenhouseholds in Vietnam receives pensionincome. The distribution of such income isclearly regressive, in the sense of beingconcentrated among the richer part of thepopulation. However, other things equal, thepoverty rate would be several points higher inthe absence of pension income. Moreimportant than the current distribution ofbeneficiaries is the prospect of extending thecoverage of the program. The number ofparticipants in the compulsory program hasgrown steadily, and represents by now 18percent of the labor force. Whether thevoluntary program for the informal sector willhave many takers is not clear. The experiencewith the largest voluntary pension program inoperation in Vietnam, in the province of NgheAn, is not particularly encouraging. Many ofits participants would not be inclined to jointhe new voluntary pension program becausethe minimum contribution is too high andbecause they are unlikely to reach the 20 yearsof contribution needed to gain access to apension, as opposed to a lump sum. Theformulas used to compute pension benefitsalso result in important deviations from theactuarially fair level. Overall, those workingfor government get a better deal than thoseworking for businesses. With growth inenrollment coming mainly from the enterprise
sector, the compulsory pension program issolid financially. Its annual surplus is roughly3.7 percent of GDP at present, and it couldaccumulate a massive amount of reserves inthe coming decades. But how large thatamount will be will very much depend on howpension benefits are indexed to inflation.Meanwhile, the management of reserves couldbe substantially improved. At present mostinvestments are in low-yield instruments,which results in a return below inflation.
Life in old age
A majority of the elderly are women. Thefemale share of the population rises with age,from 58 percent for those over 60 years to 66percent above 80. A majority of the elderly alsolives in extended families. More than half ofthem are part of three-generation households,including working age adults and children. But37 percent of them live in householdscontaining elderly people only.
Old-age is a period of fundamentaltransformation in life. The amount of timedevoted to work, in the household and out,decreases quite steadily (Figure 10.1).Throughout old age, women work longer hoursthan men, with most of the difference due totheir higher involvement in household work.But even by age 70, both men and women arestill devoting roughly 20 hours every week tonon-household work. This reality is in sharpcontrast with the rigid retirement rules of manyold-age pension programs, which impose thatpeople cease working at a specified age. Old-age is also a period of more recurrent orchronic sickness.
10. OLD-AGE PENSIONS

OLD-AGE PENSIONS
97
The elderly live in households whose totalincome is slightly higher than the average forthe Vietnamese population (6.4 million dongper year in 2004, compared to 6.1 million forthe population at large). Their households havelower income from trade and businessactivities, but this shortfall is more thancompensated by larger remittances and socialsecurity transfers. About 90 percent of theelderly live in households receivingremittances. The urban elderly are more likelyto receive remittances from abroad; those fromethnic minorities much less so. However,remittances and transfers are only one way toprovide the elderly with resources. Living inextended families and pooling incomes remainsa much more powerful mechanism for now.
In spite of their slightly higher income,households including elderly people areslightly more likely to live in poverty. This isbecause they tend to be larger. Other thingsequal, the probability for a household to live inpoverty is 4 percent higher if it includessomeone aged over 60. Households withelderly that are headed by a woman aresignificantly more likely to be extremely poor.
Pension programs
In the period preceding Doi Moi Vietnam onlyhad a non-contributory old-age pensionprogram for civil servants and workers inSOEs. In 1993 coverage was extended todomestic private enterprises and foreigncompanies, on a contributory basis. Theentitlements of civil servants and SOEworkers were then "grandfathered" into thenew program, with the budget takingresponsibility for their funding. The programis since then administered by VSS. Inaddition, a non-contributory pension schemeis in place for people aged over 85 who lackresources. However, such non-contributoryscheme is administered separately byMOLISA, as one of its targeted povertyalleviation programs.
The system is now undergoing anunprecedented reform. The first ever SocialInsurance Law was passed in 2006, with itsvarious building blocks being implementedbetween 2007 and 2009. The reform aims togradually expand the coverage of the systemand to ensure its financial sustainability. The
Source: Based on preliminary data from GSO.
Figure 10.1: Working Less, Getting Sick more Often

SOCIAL PROTECTION
98
latter was accomplished through a series ofparametric changes in the formulas for pensionbenefits. The former through the establishmentof a voluntary pension program for the informalsector, designed to allow the portability ofbenefits to the compulsory program.
The compulsory pension program applies to allVietnamese citizens working in any enterpriseprovided that they have at least a three-monthcontract. It also covers government officials,military personnel and public securityemployees. The contribution rate towards old-age pension and survivor benefits is currently 16percent of the salary. Formally, 11 percent ispaid for by the employer and 5 percent by theemployee. The Social Insurance Law foreseesan increase of this contribution rate to 22percent of the salary by 2014.
In order to receive a pension, participantsmust contribute for at least 20 years. Thepension benefit is computed on the basis of an"average salary". In the case of women,benefits accrue at the rate of 3 percent of theaverage salary per each year of contribution.The accrual rate is the same for men during
their first 15 years of contribution, but it fallsto 2 percentage points subsequently. Theminimum pension is set equal to the minimumwage. The maximum is 75 percent of theaverage salary. Contributions made past thepoint when this maximum entitlement isreached accrue towards a lump-sum payment.Those with less than 20 years of contributionalso get a lump-sum payment when they reachthe retirement age. The immediate relatives ofpensioners who die are entitled to a survivorbenefit, ranging from 40 to 70 percent of theminimum wage per beneficiary, for up to fourbeneficiaries.
The retirement age is relatively low, at 55 yearsfor women and 60 years for men. Earlyretirement is allowed for those losing 61percent or more of their working capicity. Itresults in a reduction of the pension benefit by1 percentage point of the average salary forevery year in advance. Retirement ages are 50and 45 years for men and women havingworked for at least 15 years in hazardous jobsas listed by government.
In addition to old-age pension, the compulsory
Box 10.1: Other Benefits in the Compulsory Program
Sickness. This is a cash benefit paid to an employee suffering from an illness that prevents him or her fromworking. The benefit can be paid during 30 to 60 days, depending on the number of years of contribution. Amaximum of 180 days per year, irrespective of the contribution record, is available for diseases requiringlong-term treatment. The benefit amounts to 75 percent of the wage earned in the month immediately beforeceasing work.
Maternity. A cash benefit is paid to a breast-feeding woman for to six months after delivery, depending on herworking environment and health condition. The beneficiary is also entitled to up to five days of leave for pre-natal health checks.
Occupational disease or injury. A benefit under the form of a lump sum or a monthly payment is provided tocompensate for the loss of working capacity resulting from occupational injury or disease. The benefit coversinjury incurred during business trips or in the journey to and from work. Both the lump sum payment and themonthly benefit consist of two parts. One is based on the minimum wage, the other on the years of contributionand the average salary. In case of injury, the employer is responsible for medical expenses and salary for theduration of the treatment. VSS pays the benefit from the date of hospital discharge.
Disability. Participants who lose at least 31 percent of their working capacity are entitled to a disability pension.The size of the benefit depends on the extent to which working ability is affected. The minimum benefit isequivalent to 30 percent of the minimum wage. It increases by 2 percent of the minimum wage for each additionalpoint of working capacity lost.

program includes a pension in the event ofdisability, and a series of short-term benefitsrelated to sickness, maternity and occupationaldisease or injury (Box 10.1). An additional 3percent of the basic salary is contributedtowards the first two benefits. The contributionrate towards occupational disease or injurybenefits is an extra 1 percent. Therefore, intotal, participants in the compulsory socialinsurance program pay 22 percent of theirsalary towards old-age and short-term benefits.
The Social Insurance Law of 2006 introduced avoluntary old-age pension program accessible toany working-age person who is not currentlyenrolled in the compulsory program. Thefeatures of the voluntary program are largelyinspired from the compulsory system. Thecontribution to make in order to participate hasto be at least equal to 16 percent of the minimumwage; this threshold will be gradually raised to22 percent. Entitlement to pension benefitsoccurs at age 55 for women and 60 for men, aftera minimum of 20 years of contribution. Andimmediate relatives are entitled to a survivorpension. The main differences with thecompulsory program is the absence of aminimum pension.
Limited coverage
Participation in the compulsory pensionprogram has grown steadily over the years,albeit from a low base (Figure 10.2). Atpresent, there are about 8 million activecontributors representing roughly 18 percent ofthe labor force and 54 percent of employmentin SOEs, foreign invested companies andprivate domestic firms registered under theEnterprise Law.
It is too early to tell how many participants thevoluntary program will attract. The answer willpartly depend on the engagement of massorganizations to promote enrollment. But theexperience of the voluntary pension program forfarmers set up by Nghe An province in 1998sheds some light on possible trends andchallenges ahead (Box 10.2).
There are about 1.9 million pensioners inVietnam at present. This represents about aquarter of the population aged 60 years andabove, but many of those pensioners areactually younger. Because of extended familyarrangements close to one tenth of householdsreceive transfers from the social insurance
OLD-AGE PENSIONS
99
Figure 10.2: Coverage of the Compulsory Pension Program
Source: Based on data from VSS.

agency (Figure 10.3). Not surprisingly, thefraction is much higher among urban, non-poorhouseholds, belonging to the Kinh and Chinesemajority. This is because most of the pensionersof today were government employees and SOEworkers prior to 1995, when the new rules forcontributory pension were introduced.
Pension payments are an important source ofincome for the households of the elderly. Withmost pensioners being former civil servants andSOE workers, these payments are clearly
regressive. Almost half of pension spendinggoes to the two richest quintiles and only 2percent to the poorest. From this perspective,pensions are not a pro-poor program. Adifferent conceptual exercise is to subtractsocial security income from householdexpenditures. Based on data from the 2004VHLSS, the poverty rate would have been 4.6percentage points higher, with most of theimpact coming from pensions. From thisperspective, then, pensions do contribute topoverty reduction.
SOCIAL PROTECTION
100
Box 10.2: Participation in Voluntary Pension Programs
As of March 2007, the voluntary pension program of Nghe An province had about 85 thousand participants, ofwhich one thousand had reached or were soon to reach retirement age. More than 60 percent of the contributorsto this program are women.
There are several important differences between the Nghe An program and the new, national voluntary pensionprogram. The minimum contribution in the Nghe An program is 10 thousand dong, and the average contributionis 25 thousand. This is far less than 16 percent of the minimum wage required by the national program (theequivalent of 72 thousand dong per month in 2007). Only 5 percent of current contributors would reach theminimum contribution threshold at present. Also, in the Nghe An program almost all participants are entitled toa pension when they reach retirement age. The level of the monthly pension is equal to the sum of contributions,accrued at an interest rate of 0.6 percent per month, minus administrative expenses, divided by 120.Administrative expenses are set at 15 percent of the accrued interest. This formula would be close to actuarialprinciples in the life expectancy at retirement was about 10 years (or 120 months). But for a mainly femalepopulation it is probably much higher.
With the establishment of a voluntary pension program on a national basis, the question is whether participants inthe Nghe An program would be willing to switch to the national program and, if not, what kind of incentives theywould need in order to do so.
A field study was conducted to this effect in October 2007. It included a survey of 5 percent of participants in theNghe An program. Responses revealed a high degree of satisfaction among participants, with 84 percent of themsaying that they would want to continue with the program. Interviewees were also offered the option to switch tothe national program, "buying" years of contributions with their actual contributions to the Nghe An program.Because actual contributions are low, only 54 percent of Nghe An participants would be able to reach 20 years ofcontribution at they reach retirement age. The option was then offered to the other 46 percent to "buy" theremaining years of contribution.
Among the group who could aspire to a pension, 68 percent would be willing to switch to the national voluntaryprogram. This is the equivalent of 37 percent of all participants in the Nghe An program. Among the rest, 46percent would accept, but only provided that they can "buy" the additional years of contribution to get a pension.Very few would be interested in contributing towards a lump-sum payment at retirement age. The share wouldincrease by an additional 7 percentage points if the minimum contribution was set at 50 thousand dong per month,instead of 72 thousand.
Overall, 57 percent of participants in the Nghe An program would accept to switch in the absence of any subsidy.Disturbingly, those least interested in switching to the national voluntary program are poorer or older than the rest.
Source: Paulette Castel (2007a).

However, these analyses do not really tell whatthe real poverty impact of the pension programis. In order to assess such impact acounterfactual would be needed in whichhouseholds know that they cannot count onpension income and need to save on their ownfor old age. The impact of the program would beassessed by comparing the actual poverty ratewith the poverty rate in the hypotheticalcounterfactual. Constructing the counterfactualwould require behavioral assumptions in relationto labor force participation, savings or householdcomposition, spanning entire life cycles. Noteverybody is likely to agree on such assumptionsthough. And theoretical uncertainties would becompounded further by data limitations. It istherefore safer not to pass a judgment as towhether the pension program introduced inVietnam in 1995 is generally progressive orregressive. On the other hand, it should bepossible to assess whether the formulas of thepension program implicitly subsidize or penalizeparticipants with different characteristics.
Weak incentives
Whether pension benefits are generous or notdepends on the work history of each individual,
making it difficult to derive general patterns.But one practical step that can be undertaken isto compare those benefits with a hypotheticalactuarial benchmark, for workers with differentcharacteristics.
Consider the case of a man whose salary hasgrown by six percent per year in real terms, whoretires at age 60, and lives until age 78. Assumefor a moment that this man had not enrolled inthe pension program, but had nevertheless saved16 percent of his salary for a certain number ofyears. Assume also that the savings accrued atan annual rate of 4 percent, in real terms. In thishypothetical benchmark, when reaching age 60the man withdraws the savings and buys anannuity, to be paid to him for as long as he lives.Such deal would be actuarially fair, in the sensethat the present value of this man's savingswould be equal to the present value of hisannuity payments. A similar, benchmarkcalculation could be done for a woman retiringat age 55 and leaving until age 80.
Now consider that the savings go into thecompulsory pension program instead. In thiscase, computing the pension at retirementinvolves calculating first the "average salary" towhich the formula applies. And such "average
OLD-AGE PENSIONS
101
Figure 10.3: Households Receiving Pension Income
Source: Based on preliminary data from GSO. Figures are for 2006.

SOCIAL PROTECTION
102
salary" varies depending on whether the personworks for the government or not. If not, theaverage salary is computed over all the years ofcontribution. But if the person works forgovernment, the average is computed only overthe last few years before retirement, from aminimum of five for those who started before1995, to a maximum of ten for those who joinedafter 2005. To make salaries comparable overtime, they need to be adjusted for inflation. Buthere, again, there is a difference between thoseworking for government and the rest, with pastsalaries adjusted by the minimum wage in theformer case and by consumer prices in the latter.For the conceptual exercise, it is assumed thatinflation runs at 5 percent per year and realwages grow by 6 percent per year. Beyond thespecific figures, it is clear that the "averagesalary" of someone working for government ismuch higher than that of a person with the samework history but out of government. Note alsothat the pension program of Vietnam only paysa lump sum to participants who retire with lessthan 20 years of contribution. To be able tocompare its value to the actuarial benchmark,this lump sum can be converted into anequivalent string of payments. One possibility
is to assume that it is invested, yielding 4percent per year in real terms, the same as in theactuarial benchmark.
The comparison between the estimated pensionbenefits and the actuarial benchmark shows thatthe compulsory program of Vietnam createswinners and losers (Figure 10.4). Governmentemployees are clear winners, in the sense thattheir pension benefits are either comparable tothe actuarial benchmark or higher. Some timesmuch higher. The findings also show thatwomen do better than men. This is becausetheir pension benefits accrue more rapidly after15 years of contribution, but also because theirlonger life expectancy results in a loweractuarial benchmark. On the other hand, non-government employees stand to lose except ifthey choose to contribute for less than 30 years.
Different assumptions on the growth rate of realwages, or the annual rate of inflation, or the realrate of return on savings would yield differentpatterns. Regardless, considerable gaps wouldremain between actual pension benefits and theactuarial benchmark. And governmentemployees and women would most likelyemerge as net beneficiaries anyway.
Figure 10.4: Pension Benefits and the Actuarial Benchmark
Source: Based on Paulette Castel and Martin Rama (2005), updated so as to reflect the changes made to the draft SocialInsurance Law by the National Assembly. Pension benefits include 3 percent contribution paid by VSS towards healthinsurance.

The comparison between pension benefits andthe actuarial benchmark is relevant to assessthe prospects of extending the coverage of theprogram. The expansion cannot come from thegovernment sector, as it is already fullycovered. As for private sector workers, theywill be less likely to enroll if the pensionprogram does not compare well with saving ontheir own. Admittedly, the actuarialbenchmark would be difficult for them tomatch. The market for annuities is thin inpractice, so that self-insuring against the riskof living longer than resources would bedifficult. But it is still distressing to realizethat the pension program of Vietnam isunlikely to be appealing for private sectorworkers who have less than 20 years leftbefore reaching retirement age. And it is alsoclear that the program discouragesparticipation beyond 30 years of contribution.
Managing resources
The social insurance programs of Vietnamseem to enjoy an enviable financial health sofar. VSS is responsible for managing theresources of these programs. In recent years itsrevenue has far exceeded its expenditures(Table 10.1). In 2006 the surplus was 36trillion dong, or roughly the equivalent of 3.7percent of GDP. However, this robustperformance should not come as a surprise.The population of Vietnam is very young, sothat there is barely one pensioner for every 15contributors to the system. Moreover,
pensioners are mainly former governmentemployees and SOE workers whose benefitshave been grandfathered. Resources to pay fortheir benefits come directly from the budget, sothat the actual expenditures of VSS are modest.
The reforms introduced by the SocialInsurance Law of 2006 also ensure a goodfinancial health for VSS in the longer term.The sustainability of the pension programhinges on the way the "average salary" of non-government employees is calculated. To allowcomparisons over time, past salaries areinflated by consumer prices. But in a countrywith the growth prospects of Vietnam, actualsalaries will almost certainly increase muchfaster than consumer prices. Adjusting pastsalaries by inflation thus results in the "averagesalary" falling increasingly behind the salary atretirement. This is not the case for governmentemployees, whose "average salary" iscomputed only over the last few years ofservice, with past figures adjusted by theminimum wage, not by consumer prices. Butmost of the growth in coverage of the pensionprogram will come from the non-governmentsector. Therefore, it is the low pensions ofnon-government employees that will ensurethe financial viability of the pension program.
The volume of reserves of the pension programwill accumulate in the long term will cruciallydepends on how pensions are indexed toinflation. The Social Insurance Law states thatthe adjustment will be based on consumerprices and economic growth. But how exactly
OLD-AGE PENSIONS
103
Long-term benefits Short-term benefits Year Total
revenue Old-age pensions
Lump sums
Survivor benefits
Sickness invalidity
Mater- nity
Industrial injury
Total
spending
Balance
2002 26.7 7.0 0.4 0.3 0.2 0.3 0.1 8.2 18.5 2003 33.7 10.2 0.4 0.4 0.2 0.5 0.1 11.7 22.0 2004 42.6 11.2 0.5 0.4 0.2 0.6 0.1 13.1 29.5 2005 51.6 15.3 0.9 0.4 0.2 0.7 0.1 17.6 33.9 2006 60.7 21.4 1.2 0.6 0.3 1.1 0.1 24.7 36.0
Table 10:1: Social Insurance Revenue and Spending
Source: Based on data from VSS. Figures are in trillion dong.

SOCIAL PROTECTION
104
this rule is interpreted can make a difference.It could mean that the reference is the growthin consumer prices, provided that economiccircumstances make it affordable. Or it couldbe read as saying that pensions should not losevalue compared to the salaries of those atwork. In the first case, pensions would beadjusted by the inflation rate; in the secondthey could follow the minimum wage (a choicethat MOF seems to favor at present). For adecade or so, this choice would only affect thebudget transfer the government needs to maketo VSS to pay for the pensions of formergovernment employees and SOE workers. Butthe implications of this choice becomenoticeable as non-government workers start toretire, in a decade or so (Figure 10.5).
There are other aspects in which the financial
health of the pension program does not seem soenviable. By one estimate, the administrativecosts of VSS amount to roughly 4 percent oftotal contributions. And yet, 6 percent isretained, which raises questions as to how theremaining 2 percent is being used. Moreimportantly, the reserves of the pensionprogram are yielding a return below inflation.Investments have concentrated on safe sourceswith very low rates of return. These arepredominantly in the public sector. Accordingto one study, more than half of the portfolio isin bank deposits in state-owned commercialbanks, a third goes to support developmentprojects and the rest goes into governmentbonds and treasury bills. The figures in thisstudy are most probably outdated by now. Butit is unlikely that returns have increased muchsince then.
Figure 10.5: The Reserves of the Pension Program
Source: Based on Paulette Castel, and Martin Rama (2005), updated so as to reflectthe changes made to the draft Social Insurance Law by the NationalAssembly. The real return on investments is assumed to be 4 percent per year.

105
Market mechanisms can be very effective atdiversifying risk and cushioning shocks.Financial products such as life insurance,savings products for old age or agriculturalinsurance redistribute resources from "lucky"individuals and households who are not affectedby shocks toward the "unlucky" ones who are.From this perspective they can be seen as part ofthe broader social protection system. Sincemost of the poor and vulnerable already activelyparticipate in markets, as entrepreneurs,employees or consumers, in principle at leastthey could also benefit from the protectionprovided by such financial products. However,the markets for these products also suffer fromimperfections that make governmentintervention necessary. Without it, the share ofthe population covered could be thin andparticipants would be exposed to providersdefaulting on their obligations. For markets towork for those who need protection the most,they must first be able to work at all. Inpractice, the required degree of governmentintervention varies considerably acrosssegments, from industry regulation to activemonitoring to market organization. At one end,well-performing insurers can provide anefficiency benchmark against which to assessthe management of government-run socialinsurance mechanisms. For instance, returns onthe assets of private pension funds (net ofcommissions and fees) are an obviouscomparator for the returns of the assets of publicpension programs. At the other end, there is aneed to design incentives so that the poor andother groups who would tend to be excludedstand a chance to participate in those markets.Access to life and disability insurance throughmicro-credit schemes is an illustration of this
approach. In between, government leadershipcan be combined with private delivery.Agricultural insurance is a case in point.Reimbursement obligations on commercialloans by farmers could be linked to an objectiveindicator (such as upstream water levels), basedon a classification of land plots by risk area. Butsuch products are unlikely to emerge without aninitial government investment. In extremecases, insurance needs to be provided by thegovernment itself. Natural disasters fall in thiscategory. Exposure to multiple hazards, which islikely to increase as a result of climate change,requires stronger coordination arrangementsbetween all the ministries and agenciesinvolved.
Insurance products
Vietnam's insurance system has experiencedhealthy growth. The sector's liberalization tookplace in 1993 when entry by multiplestakeholders was first authorized. Lifeinsurance started in 1996 and began to growfrom 1999 onward, when large foreign insurersjoined the market. Reform accelerated from2003 when Bao Viet, a state-owned companyestablished in 1965 originally to provide onlyimport-export cargo and shipping insurance,was restructured into a financial group with lifeand non-life insurance services. Bao Viet andother state-owned insurers have since then beenequitized into joint stock companies, whereasprivate joint stock insurance companies andbrokers have been established.
By the end 2006, there were 37 firms ofdiversified legal form and scale operating inthe life and non-life insurance, reinsurance,
11. INSURANCE SCHEMES

SOCIAL PROTECTION
106
and insurance brokerage sectors (Figure 11.1).Of these, three were fully state-owned, 16 werejoint stock companies, four were joint venturesand the remaining 15 were fully private. Suchdiversification of ownership forms shows howmuch the sector has matured in the decadesince life insurance started in Vietnam.
Premium income for the insurance sector wasclose to 15 trillion dong in 2006, or about 1.5percent of GDP. This represents a growth of9.6 percent over the previous year. About 57percent of that income was accounted for bylife insurance. Funds invested by the insuranceindustry amounted to almost 31 trillion dong, or3 percent of GDP. More than half of the totalwas invested in government bonds, close to aquarter was in deposits, and roughly a tentheach in equity shares and trust investments.Financial performance was strong, thanks toenhanced risk assessment and loss preventioncapacity. Insurers have also performed well interms of gross and net claim ratios.
However, the overall insurance penetration rateis lower than elsewhere in the region. By wayof comparison, premium income reaches 3.5percent of GDP in Thailand, 5.4 percent in
Malaysia and nearly 10 percent in industrialcountries. In Vietnam today, more than 90percent of the population does not have anyformal insurance policy.
For many years the growth of the sector restedon life insurance, which was opened for foreigninvestment earlier on and is by now dominatedby foreign firms. The products offered numberaround 100. Among them, endowmentinsurance has been the dominant product, withan 80 percent share in new business premiums.The sector is offering increasing benefits,combining insurance protection with savingsand investment elements, thus attracting largersize contracts on average. Yet, the number ofnew life policies sold decreased in 2006, and sohas the number of life insurance agents.
To some extent, the healthy growth observed inlife insurance for many years reflected thescarcity of long-term saving instruments inVietnam. By now, however, life insurers areconfronted with heated competition from thethriving banking sector and the stock market.
The non-life insurance sector, which was untilrecently dominated by domestic firms, started
Source: Vietnam Association of Insurers.
Figure 11.1: A Steady-Growing Sector
growing rapidly since accession to WTO. Thismeans that protection of businesses andhouseholds against risks of accidents, businessevents and natural catastrophes startedimproving gradually. Non-life insurers areoffering about 700 products. Vietnam's WTOcommitments include allowing participation byforeign investors in the lucrative statutoryinsurance business from 2008 onwards. Amongthe areas to be opened up, motor insuranceaccounts for the largest share, followed byproperty and casualty insurance.
Products more closely related to socialprotection remain marginal. For instance, therewere only 1.4 thousand policies for annuities.Even on life insurance, there are half a millionpolicies active at present, which is theequivalent of roughly one for every 40households. Commercial health insurance looksmore promising. Local firms such as Bao Viet,Bao Minh and Pjico are implementing schemesfocusing on school children. However, no studyhas yet assessed the coverage, benefit packageand amount reimbursed of such schemes.Another area with growth potential is privatepensions (Box 11.1).
Insurance for the poor
Commercially-oriented insurance companiesrarely offer products that are attractive to the poor.The typical sources of market failure in insurancemarkets, related to asymmetric informationbetween policy holders and insurance managers,are exacerbated in their case. High administrativecosts usually lead to sizeable insurance premiumsthat poor households cannot afford. Premiums areanyway bound to be higher than for thepopulation as large, as the poor have shorter lifeexpectancies, higher disability rates and a higherincidence of disability. Moreover, the relativecomplexity of premiums, benefits and contingentpayments is often difficult to grasp forindividuals and households with limited financialknowledge. Thus, the typical insurance productsoffered by commercially-oriented companiesonly reach individuals and households withrelatively high incomes. This is also true in thecase of Viet Nam.
However, a few commercially-orientedmechanisms have emerged to provide socialprotection to low-income populations at locallevels. Two broad schemes, namely micro-insurance groups and credit unions, deserveespecial attention.
Several micro-insurance products are alreadyavailable in the case of Vietnam. Overall, thesector is growing rapidly, although from a lowbase. Microfinance groups and massorganizations have developed programs such asaid funds, hunger and calamity reserves andcash allowances for war invalids and meritcitizens. Other groups have introduced thewrite-off of outstanding debts in the event ofdeath. Sometimes the household of the insuredperson also receives a funeral grant.
Some commercially-oriented companies offermicro-insurance products as well. Bao Vietproposes products requiring low premiums; aslow as 15 thousand dong per person per monthfor people under 31 years of age. This is for apolicy with a value of five million dong in theevent of death. Mass organizations (inparticular the Women's Union) and sometimesmicrofinance institutions are used as brokers.
There is less information in relation to healthinsurance funds. The experience in Hoc Son,Hanoi, indicates the presence of serious adverseselection problems. Participants are primarilypregnant, old, or in bad health. There are alsosome signs of abuse, such as healthy peoplegetting medicines for other, noninsuredmembers of their family.
Information is also limited in relation toemergency loans. A 2004 survey of insuranceand micro-insurance products found thatinterest-based lenders, pawnshops, and twosavings-and-loans funds of the Women's Union(in Nghe An and HCMC) were providingemergency loan services. Besides these cases, adetailed study of households in the Duyen HaiDistrict in Tra Vinh Province also indicates thatit is common for poor households to borrow inkind. Rice is indeed obtained in small quantitiesfrom friends and relatives, but small traders alsolend rice through the shortage period leading upto the harvest.
INSURANCE SCHEMES
107

One of the government's larger-scale creditprograms, VBSP, targets its lending towardslow-income groups and includes emergencyloans among its products. Households canborrow up to 10 million dong to cover living
expenditures with no collateral required.Borrowers must instead be certified by thePeople's Committee of their commune and bepart of a credit and savings group. These tworequirements aim at reducing the risk of default,
SOCIAL PROTECTION
108
Box 11.1: Private Pension Programs
The main risk with private pension funds is to see them defaulting on their obligations towards the insured. Fewcompanies live for many decades. It might therefore be difficult for someone of working age today to trust onesuch company to administer his or her savings and faithfully pay a pension until death ensues.
Private pension funds with defined contributions manage savings on behalf of policy holders up to the point oftheir retirement. In doing so, they function like an investment fund. Therefore, similar regulations should apply.In both cases, provisions are needed against excessive borrowing. If by design a defined contribution fund doesnot have debt, it cannot go bankrupt, except for the case of fraud. As for the risk of fraud, it should be mitigatedby appropriate regulation and supervision to ensure sound business conducts and professional ethics.
Yet, even with limited borrowing and in the absence of fraud there might be cases of poor performance. Forinstance due to recessions, or to poor management. An important policy issue is how much protection should begiven to the insured against such risks.
Private pension funds which provide a minimum guarantee have an element of "defined benefit," or entitlement,which creates liabilities and thus risk of bankruptcy. Prudential regulation is required to discourage excessive risktaking by pension funds providing such a guarantee. Such funds must have a strong risk management capability.Aside from a tight limit on borrowing, regulation often includes specific restrictions as to the type of assets thatsuch funds are allowed to invest in. For instance, illiquid assets and unlisted securities tend to be banned.
The behavior of pension fund managers should be closely monitored not only by the supervisor but also by policyholders. If a pension fund is legally organized as a company (or an investment company), policy holders wouldbe the equivalent of shareholders. They should participate in the board of directors, having the power to hire orfire a fund manage and overseeing his or her performance of the pension fund manager. Similar arrangementsshould be made even when a pension fund takes a contractual form such as a business trust.
Assets managed on behalf of policy holders should be kept in a competent and independent custodian. Executionof sale and purchase of assets often requires a broker. Regulation should require that such a broker not be affiliatedwith the pension fund manager. There should also be arrangements in place to ensure a high degree oftransparency of business dealings between the fund manager and the broker. Those arrangements are necessaryto avoid the appropriation of assets through business practices such as "churning", "front running" or "self-dealing". The securities market regulator should have adequate competency to police such activities in the market.
Regulation should promote competition among pension fund managers. To ensure that, pensioners should beprovided with good portability so that they can choose and move to a well performing pension manager. Thisrequires a competent individual account management capability by the pension fund manager and its custodian.The regulation should require that they have appropriate electronic data processing. The performance of pensionfunds should also be made easily and frequently observable. In the case of investment funds, they are typicallyrequired to publicize their net asset value (NAV) daily. A similar requirement should be applied to pension funds.In a similar spirit to the case of open-end investment funds, pensioners should be provided with possibilities toliquidate their contributions without a prohibitive penalty.
At retirement, a pensioner should have an option of receiving a lump sum or reinvesting it in an annuity or gettinga mixture of both. Pension fund managers could continue to manage the annuity if they have appropriate expertiseto do so. In many countries, however, life insurance companies manage annuities because they specialize inactuarial business.

but they also considerably increase the time ittakes to get a loan. As a result of this delay,VBSP processes few emergency loans inpractice.
Besides administrate delays and a sometimeslimited local outreach, the low provision ofemergency loans by VBSP can also be linked toits reliance on commune authorities and localmass organizations to seek out the eligible poorhouseholds and organize lending groups. LocalWomen's Union representatives have raisedconcerns about the high costs for them to runthese activities properly, and have complainedthat these costs have not been fully factored in.Local authorities also express reluctance toendorse emergency loans, which are considereda high risk because they are not related to anyproductive investment.
Supporting micro-insurance products andemergency loans requires specific financialexpertise. In the case of micro-insurance, todetermine the level of premiums it is necessaryto estimate the frequency of the risks that arebeing insured and the magnitude of the lossesassociated with bad shocks. Also, to profitablyinvest and manage the resources collected,assess and process the claims, and rapidlydisburse the benefits, some financial expertiseand administrative capacity are required. Butsuch expertise is seldom available at locallevels. This explains why most providers ofmicro-insurance have turned to commercialinsurance companies for the management oftheir insurance schemes. This is the so-calledpartner-agent model where the formal insurancecompany assumes the financial risks and themicrofinance institution serves as a"matchmaker" to provide lower-cost linksbetween the parties.
Agricultural insurance
With a majority of the poor living in rural areas,and their livelihoods depending so much oncrop success, agricultural insurance is apotentially important social protectioninstrument. However, two common programsplague agricultural insurance programs aroundthe world, namely moral hazard and adverse
selection. The experience of Vietnam has beensimilar to that of many other countries in thisrespect. When Bao Viet experimented withagricultural insurance in the 1980s and 1990s itsoon learned that it was extremely difficult tocontrol administrative costs due to the small sizeof the average farm. Since then, the instrumenthas not really picked up.
Yet, focus groups discussions conducted inDong Thap province in 2007 suggest thatflooding remains a major concern. The mostsevere shocks are linked to early flooding, withnumerous participants referring to a particularlydevastating episode in 2000. Back then, notonly did many of them lose their crops and incuradditional debt, but some also ultimately lostland rights when they were unable to pay offtheir debts. Some of them have responded toearly flooding by advancing the harvest. Whilethis approach reduces costs, it also reducesbenefits due to the poorer quality of rice when itis harvested early on.
The feedback obtained from these focus groupssuggests that farmers do appreciate the idea oflinking insurance to commercial loans. Theyappear to value the lower transaction costs, andthus lower administrative costs, that wouldaccompany this type of contract. And theyunderstand the rationale for using the level ofwater in the river as an objective indicator todecide on repayment. Not everybody issupportive, however. Some of the participantsthink that recent improvements in infrastructurewould result in less flooding than 2000, even ifmapping work suggests otherwise. Somefarmers also believe that the government willforgive debts, despite recent policy changescalling for the halt of this practice.
In light of Vietnam's past experience withagricultural insurance and also based on thisstudy of Dong Thap province, solutions havebeen proposed to mitigate the traditionalproblems of high administrative cost, adverseselection, and moral hazard. Those solutionshinge on flood-index insurance offered over theshort period of time (June 20 to July 10) whenearly flooding interferes with the rice harvest.
Three insurance products can be considered.
INSURANCE SCHEMES
109

SOCIAL PROTECTION
110
One possibility is to index the level of waterupstream (at the Tan Chau hydro-meteorological station) and to provideindemnity payments directly to the dominantrural lending agency, the Vietnam Bank forAgriculture and Rural Development (VBARD).A second possibility is to provide farm-levelindemnity. In this case, assessment costs can bekept under control by classifying farm plots intoflood risk zones and using remote sensingsatellite technology to measure the water level.A third possibility is to pass on the benefitdirectly to rice producers based on flood riskmapping, instead of adjusting the benefit basedon actual flood levels.
Natural disasters
Vietnam has a long history of striving tomanage and reduce the damage risk formnatural hazards. This history goes back overcenturies, ever since floods were seen as one ofthe "four biggest dangers to mankind", togetherwith fire, robbers and invaders. By 1248, theRed River dyke system had already beenestablished. At present, a system of riverembankments and sea dykes spans thousands ofkilometers. There is also increasingrecognition that climate change can exacerbatenatural disasters, leaving large numbers ofpeople in need of emergency support andpushing many households back into poverty.
The government has succeeded remarkably wellin reducing the direct impacts of extremeclimatic events. To manage the disaster cycle,Vietnam has structures and mechanisms thatprovide prior mitigation, response during thedisaster, and subsequent recovery andreconstruction. Much of the effort is undertakenby the provinces and communes where disastersoccur, in the name of the subsidiarity principle.But there is also recognition that currentapproaches, largely geared towards handlingfloods and storms, need to be reconsidered.
At present, key institutions to manage andreduce natural disasters include the inter-ministerial Central Committee for Flood andStorm Control, which is replicated at the level of
the province, district and communeadministration. They also include the NationalCommittee for Search and Rescue, whichreports to the Prime Minister, and theCommittee for Distribution of Goods andMoney, with participation of the FatherlandFront and MOF. Other institutions are alsoassociated with the effort to reduce and managerisks from natural disasters are the NationalHydro-meteorological Center and GSO.
Public funding is provided under differentappropriations at the level of CentralGovernment. Investments to prevent andmitigate natural hazards include structures suchas dykes and resources such as hydro-meteorological forecasting capacity. Theseinvestments are financed by the concernedministries as part of their regular programs.Disaster response activities and post-disasterrelief are funded by MOLISA, which tops upthe resources mobilized by the affectedprovinces themselves.
These institutional and funding arrangementshave served Vietnam well in the past and haveresulted in considerable achievements. Yet theperformance of the current disaster riskmanagement systems seems to be fallingbehind.
In the absence of a broader consensus on how tojointly address exposure to multiple hazards,individual ministries pursue prevention andmitigation investments in isolation. They oftenemphasize disconnected structural measures,thus forgoing important synergies. Multi-hazard exposure requires the involvement ofmultiple ministries and agencies. While thereseems to be no single best organizationalstructure for that purpose, it is widely acceptedthat a strong central agency is key in a disastermanagement system. In Vietnam, thepreparation, approval and implementation ofpublic investments that would make provincesmore resilient to natural disasters arecumbersome, with little sense of urgency on thepart of concerned authorities. Theseinvestments are often not integrated into abroader national strategy and plan.

INSURANCE SCHEMES
111
In addition to structural investments, forinstance in river embankments, drainage canalsor safe harbors, much can be done at relativelylittle cost. Introducing disaster riskmanagement at the community level, throughlow-cost "Safer Commune" or "Safer Village"plans, is a promising approach. Another avenueis to undertake flood modeling, which allows tobetter plan the effect of possible infrastructureinvestments on flood and water flows. Land useplanning is also key to minimize economicactivities taking place on marginal sitesvulnerable to disasters. Similarly, revisiting
construction codes with the aim of disaster-proofing public infrastructure and privateproperty would help increase resilience todisasters.
Faster implementation of disaster relief andrecovery is often hampered by the absence ofcredible damage and loss assessments. Betterassessments would provide for better decisionmaking in terms of resources needed andtargeting. Credible assessments are alsoinstrumental in mobilizing international fundingin the case of larger damage events.

PART III: THE WAY
FORWARD

115
As poverty continues to fall, new forms ofvulnerability emerge. The rapid ageing of thepopulation, massive rural-urban migration, thegrowing importance of non-communicablediseases, fluctuations originating in worldmarkets, natural disasters and climate changeconfront Vietnam with unprecedentedchallenges. But the response to thosechallenges cannot be simply to mimic the socialprotection models of industrial countries.Poverty still remains an issue. It remains deepfor many in the ethnic minorities; it may bechanging its face in urban areas. Just dealingwith risks will not be enough, as some groupsare not doing well even in good times. Instead,it is better to think of social protection as acombination of policies and programs acrossthree areas: opportunity to thrive, support forthose left behind and insurance to cope withshocks. Much has been accomplished byVietnam in all three. As it joins the ranks ofmiddle-income countries, entering a period offundamental economic and socialtransformation, more will be needed to ensurethat growth remains inclusive. The key tosuccess may be in a better integration of policiesand programs across all three areas. Whilespecific policy recommendations may beoffered in each of them, they can be broughttogether under the form of four main priorities:extending coverage, strengthening incentives,improving information and managing resources.
A reform agenda
Vietnam is at the dawn of an unprecedentedeconomic and social transformation. Theaverage citizen is a mostly healthy 26 years oldwho lives in a rural area, belongs to a multi-
generation household including grand-parentsand works in agriculture or does informalactivities, such as being a casual laborer orhelping in a household business. Because of arapid demographic transition, in a few decadespopulation will be much older on average. Andbecause of rapid rural-urban migration, it willhave moved too. In a couple of decades thisaverage citizen may have health concerns, willmost probably have migrated to a city, could bepart of a nuclear household including no grand-children, will most probably be part of theformal economy as a wage employee or abusinessperson, and will not be so far fromretirement.
How well will the institutional arrangements ofVietnam support this transformation? How canthey contribute to making the personal journeysof millions of citizens become stories ofprosperity and accomplishment, not of hardshipand uncertainty? Jobs will be needed for peopleto move out of agriculture and informal sectoractivities. Local development will be requiredto boost the living standards of those who do notmigrate. Social services should be accessiblefor those who do, and may need them awayfrom home. Health care should be affordableand of good quality. Instruments should beavailable for people to save towards their oldage. And protection mechanisms should exist tocope with multiple risks along the way, fromnatural disasters to anti-dumping actions bytrade partners to catastrophic health shocks.
Targeted programs aimed at the most vulnerablewill not be enough. Targeted programs werenever a critical component of the governmentstrategy anyway. They aimed at helping theneediest households cope with the costs of
12. AN INTEGRATED APPROACH

SOCIAL PROTECTION
116
social services and to gain access to credit.They also supported the most disadvantagedcommunes to integrate with the marketeconomy. But they never represented a majorbudgetary outlay, and only reached a fraction ofthe poor. The strategy of the government hasrelied more on economic growth, theredistribution of land and reasonably goodhealth and education. And when it comes tosocial policies, the stated ambition of thegovernment is to build universal programs.From this perspective, targeted programs canbecome important in supporting theparticipation of the poor and the vulnerable inmainstream social programs. But mere socialassistance will not do.
However, the policy agenda of a country atVietnam's development level cannot be tomimic the social protection systems ofindustrial countries either. Poverty remains aserious issue. It continues to decline rapidlyin rural areas, but for the first time it seems tohave stagnated, perhaps even increased, inurban areas. The higher cost of living in
booming economic hubs may start to take atoll on those whose means are barely abovethe poverty line. In rural areas, the plight ofethnic minorities deserves special attention.Many in this population group are bound to"cross" the poverty line in the coming years,which will result in continued povertyreduction overall. But they will still be barelyabove the line for the foreseeable future. Andmeanwhile, many among the ethnic minoritieswill still be suffering from deep poverty. Apolicy agenda focused on managing risks andshocks only would fail to deliver to thesegroups, as they experience hardship even inthe best of times.
A common vision on what needs to be doneseems to exist among policy makers, academicsand the population at large. It is a vision ofshared and inclusive growth, in the socialistspirit of Vietnam. Based on the success of DoiMoi, it involves relying on market mechanismsto the extent possible, to ensure an efficientallocation of resources in the short term andsustain innovation and growth in the longer
Source: Paulette Castel (2007b).
Figure 12.1: The Cost of Subsidizing Participation in the Pension Program

term. But it also entails mobilizing governmentresources to finance the participation of the poorand other vulnerable groups. And it requiresmarket regulation and policy stewardship, toensure that everybody has access to services andthat quality standards are met.
But the specifics remain unclear, often resultingin frustration in the daily implementation ofsocial policies and programs. One way toarticulate the reform agenda is under the form offour policy priorities: extending coverage,strengthening incentives, improving informationand managing resources.
Extending coverage
While the vision underlying the socialprotection agenda is one of shared growth andinclusion, Vietnam is quite far from anythingresembling universal coverage for its socialprograms. In the case of health insurance, theinitial target was to get there by 2010. By nowclose to half of the population is covered, whichis certainly an accomplishment for a country atViietnam's development level. But subsequentgains could prove increasingly difficult.Coverage is even more limited in relation topensions, raising the prospect of large liabilitieswhen the young of today reach retirement age, ifbudgetary resources need to be mobilized to payfor non-contributory pensions. Targetedprograms do not reach all of their intendedbeneficiaries either; far from that.
Implementing the vision will require boldersteps. The full subsidization of participation bythe poor in mainstream programs, alreadyadopted in the case of health insurance, opens apromising avenue. But more budgetaryresources may be needed as the health insurancepremium increases to match real health carecosts. The partial subsidization of the near poor,to be undertaken from 2008 onwards, shouldalso contribute to the expansion of coverage. Asfor those who will not benefit from subsidies,there is a need to contain the adverse selection.It could be tempting to expand coverage bysimply lowering requirements to enroll.However, mechanisms such as group insuranceor household enrollment will be necessary if the
health insurance program is to remainfinancially viable.
Something similar could be done in the case ofpensions, where a minimum contributiontowards retirement and some basic benefitscould be paid by government to the socialinsurance agency on behalf of each poorhousehold head. A necessary complement tothis approach is the partial subsidization ofparticipation by the near-poor. Without it, theincentive for households to escape povertycould be reduced and enrollment could declineamong those who do escape.
One important question is whether a strategyinvolving the subsidization of a large fraction ofthe population can be afforded. The answer isprobably yes. To begin with, part of thesubsidization simply entails shifting currentgovernment funding from providers (say, publichospitals) to purchasers of services (the socialsecurity agency, or a dedicated fund for chronicillnesses and life-threatening diseases). In thecase of pensions, the alternative to the subsidy isnot savings: it is a contingent liability, assomething will need to be done sooner or laterto support old people without income. The trulyadditional spending can be contained as long aspolicies are in place to support a rapid reductionin poverty.
This is show by a recent study which assessedthe cost of three, potentially complementaryavenues to extend coverage in the case of old-age pensions. The first option is to pay in fullthe minimum contribution towards thevoluntary pension program for one adult perpoor household. The second one is to partiallysubsidize the participation of one adult per near-poor household in the voluntary pensionprogram. Based on a previous study on thewillingness to pay for old-age pensions, thesubsidy was set in this option at 40 percent ofthe minimum contribution. Finally, the thirdoption is to help the same two groups reach aminimum pension at retirement if theircontributions are not sufficient. In this thirdcase, the subsidy is equivalent to the gapbetween the pension or lump-sum they would beentitled to and half of the minimum wage.
AN INTEGRATED APPROACH
117

Taking household sizes into consideration, thestudy estimates the cost of financing theparticipation of 1.9 million poor and 2 millionnear poor today, and the partial subsidization ofpensions to one million poor and near poor asthey reach retirement age. The simulations arebased on the assumption that the minimumcontribution and the pension levels grow at thesame rate as income per capita. The resultsshow that these options are affordable (Figure12.1). The analysis may need furtherrefinement before reaching a firm conclusion.But these results are plausible, for two reasons.The first one is that the voluntary pensionprogram sets the minimum contribution at arelatively low level, which also results inrelatively low pensions. The second is theexpected decline in poverty rates, which shouldreduce the need for subsidization over time.
For the subsidization approach to work inpractice, two complementary policies need to beconsidered. One of them is to use targetedprograms more systematically as a vehicle forthe poor and the near poor to participate inmainstream programs. This is the spirit ofDecision 139, but there are a range of othertargeted programs whose effectiveness is lessclear. A consolidation of current program underthe form of a narrower and better defined set ofbenefits and transfers, including healthinsurance premiums, social securitycontributions and possibly cash transfers couldhelp in this respect.
The other complementary policy to considerrefers to the allocation of resources to sub-national levels. In a country as decentralized asVietnam, the implementation of nationalpolicies varies considerably depending on thecapacity and the resources of localgovernments. From this perspective, it isimportant to ensure that provincial resources arecommensurate with provincial needs. In thisrespect, developing a property tax providingresources to local governments would help.This move would reduce the reliance of localauthorities on regressive fees. It is alsoimportant to make sure that the budgetallocation norms used to redistribute resourcesto provincial levels and below take into
consideration the costs of extending thecoverage of social protection programs.
As for the compulsory health insurance and old-age pension programs, the extension ofcoverage hinges on the gradual formalization ofthe economy. In this respect, the main priorityis to avoid penalizing job creation throughexcessively high contribution rates. Labor costsare already bound to increase rapidly, as a resultof the rapid minimum age increases necessary tocomply with WTO commitments. The SocialInsurance Law, by foreseeing an increase incontributions towards old-age pension, andpossibly towards unemployment insurance, mayadd to this burden. In the same spirit, balancingthe books of the health insurance programthrough a higher contribution rate would not bean advisable move.
Strengthening incentives
Increased reliance on market mechanisms, oneof the foundations of Doi Moi, can certainlylead to large efficiency gains. The improvementin the quality of care provided by hospitalsoperating in an autonomous manner is a case inpoint. However, in sectors which are preciselycharacterized by market imperfections,undesirable outcomes cannot be rated out.Hospitals may become good at catering to thosewho can pay, but they can also neglect themandatory provision of free services to the poor.Improving the monitoring of health careproviders is thus an important priority.
The mechanisms used by the government toregulate these sectors can be a source ofdistortions as well. Health insurance has themerit of shifting the funding of health care fromthe supply side (say, hospitals) to the demandside (the insured and VSS). In doing so, it hasthe potential to foster competition amongproviders and increase the overall efficiency ofthe health sector. However, just adopting healthinsurance is not enough to contain the escalationof costs or to ensure a better quality of service(Box 12.1). The payment schedules used by thesocial insurance agency to reimburse health careproviders can encourage excessive diagnosisand treatment, resulting in an unwarranted
SOCIAL PROTECTION
118

escalation of health care costs. This is certainlyan area deserving attention by authorities.
The benefit formulas used for the old-agepensions program affect the incentives to saveand to participate in the system. Pensions arequite far from what an actuarially fair systemwould provide. Government employees and
women get more, out of the same stream ofcontributions, than private sector workers andmen do. After 20 years of contributions, theincentive to remain enrolled starts decliningand it is in the interest of participants to under-declare their earnings. Parametric changesshould be made to the benefit formulas tobring them closer to the actuarial benchmark,
AN INTEGRATED APPROACH
119
Box 12.1: The Limits of Mandatory Social Health Insurance
Like Vietnam, countries in the former Soviet block had tax-financed health systems in place when they began theirtransition to a market economy. Many experienced substantial reductions in government revenues along the way,and many looked to mandatory social health insurance (SHI) as a way to raise additional revenues for the healthsector. SHI was also seen as an opportunity to move away from paying health facilities through budgets, andinstead pay them according to the volume of care delivered, sometimes through a competitive contracting process.In the end, roughly half of the countries in the former soviet block adopted SHI. Some opted for a hybrid model,creating a SHI agency and adopting provider payment reforms, but financing the agency through income taxes orgeneral revenues.
A recent study finds that the countries that did adopt SHI experienced increases in government health spending,controlling for other contemporaneous factors, and also saw hospital activity increase somewhat. The transitionsdid not, however, bring a measurable reduction in mortality or disease incidence, despite the higher levels of healthspending. Several of those countries are now busy trying to introduce stronger incentives in the system to ensurethat their higher spending levels translate into better health outcomes.
All countries that adopted SHI have explicitly maintained the commitment to universal coverage, by using taxrevenues to finance "contributions" for people outside the formal sector. In practice, this has worked better insome countries than in others. Fiscally decentralized countries like Russia appear to have faced more difficulties.It does not appear that subsidized participants are denied care or receive worse quality care. But there is a shortfallof revenue for the health system as a whole.
China's recent experience is also of potential relevance to Vietnam. In 2003, the government began rolling out avoluntary health insurance program in rural areas following the almost total collapse of the old commune-basedcooperative medical system. The new scheme is heavily subsidized for everyone, with government picking upabout 65 percent of its total cost. In the poorest provinces, contributions are paid entirely by government.
In part because of the very generous subsidies, enrollment has been very high. The program appears to haveincreased utilization, but seems to have had only modest impacts on the risk of large out-of-pocket payments. Thispartly reflects a more intensive utilization of services, which is a positive outcome. But the impact of insuranceon out-of-pocket payments per contact has been minimal.
Because the budget for the program is small relative to total health spending in China, coinsurance rates are high,the list of exclusions extensive, deductibles sizeable, and reimbursement ceilings fairly low. All of which explainsthe high out-of-pocket payments. But even in urban areas, people with insurance face more costly care partlybecause they end up being treated at higher levels in the system. It is not clear that this extra expense is warrantedon medical grounds. There is certainly evidence in China of extensive "supplier-induced demand". It stems inpart from the emphasis on fee-for-service and the fact that facilities have almost complete autonomy.
China is now trying to deepen coverage. But the additional resources will come from more generous governmentsubsidies, not from higher household contributions. It is also trying to introduce provider payment reforms andother measures that will allow the insurer to put downward pressure on costs and upward pressure on quality.
so that those who contribute more also getmore. In practice this can be accomplished bygradually moving towards a system of"notional" accounts, which mimic throughaccounting what could be accomplished bysaving at a given interest rate and buying anannuity at retirement.
Moving closer to the actuarial benchmarkwould also help introduce flexibility into theretirement age. At present, mandatory ages aretoo far from the work patterns of the elderly inVietnam. Many of them would prefer tocontinue contributing for a longer time andenjoy a higher pension subsequently. Lowretirement ages may also dissuade many peopleof working age from joining the voluntarypension program. Under present rules, few menaged 40 or more and women aged 35 or morecould be interested in participating. Becausethey would know for sure that they can onlyaspire to a lump sum payment, not to a pension.And it is the assurance of a flow of revenue inold age that people value most.
The emergence of private pension funds willrequire that attention be paid to the portability ofbenefits across programs. As Vietnam growsricher, many may want to consider topping uptheir publicly run pension by saving through aprivate pension program. The morecomplementary the two systems are, thestronger the incentive to combine them.Eventually, for some segments of the populationthe voluntary pension program will have tocompete with private pension providers. Thiscan be a healthy development, whose potentialwould be amplified if savings could betransferred across programs. Equally importantis to regulate and closely supervise privatepension programs, to reduce the risk of themdefaulting on their obligations, throughbankruptcy or fraud.
Some of the most complex incentive issuesmight actually be faced in rural areas.Sustaining the emergence of flood insuranceand other market-based tools to deal withnatural disasters will not be easy. Without aproper institutional set up, involving cadastralmaps, hazard modeling and verifiable
information, insurers may simply not beinterested. In other areas, such as agriculturalextension, finding the right incentives mayinvolve a much deeper understanding ofcultural differences between ethnic minoritiesand the majority group. The current offer ofservices is based on models which have workedwell in the lowlands but may be of littlerelevance for swidden cultivation on slopingplots of land.
Improving information
The vision of an integrated approach to socialprotection is at odds with the currentfragmentation of information systems (Figure12.2). Targeted programs use the classificationof households by poverty status, conducted bylocal officials of MOLISA. Cash transfers forvulnerable groups, while also managed byMOLISA, are handled separately. Healthinsurance and old-pension programs run ontheir own information systems, focused onindividuals rather than households. All of theseprograms rely on the place where the householdor the person lives, or is supposed to live,through a system of residential registrationwhich often restricts access to benefits in otherlocalities. Such system seems ill-adapted to acountry where a large fraction of the populationwill be moving from rural to urban areas in thecoming years.
The fragmentation of information systems issuch that the ministries in charge of formulatingpolicies cannot really monitor the behavior ofthe populations they are supposed to serve. Forinstance, MOLISA knows little about the typicaljobs and earnings transitions of contributorstowards old-age pensions. And MOH hasdifficulty figuring out how health care servicesare used by different participants in the healthinsurance program.
Detailed information on the use of health carefacilities and services is obviously important toadequately reimburse providers. At a morefundamental level, this information is critical tomonitor the delivery of services, assess patternsof health care demand, monitor costs, and
SOCIAL PROTECTION
120

design appropriate policies for the health sector.At present, however, this information does notcirculate from providers to policy makers or thesocial insurance agency.
In the case of MOH, a central division on healthinformation is the focal point for collecting andanalyzing health statistics for the sector. At theprovincial level, there are one or two persons incharge of health care data. And at district levels,health departments are responsible to process aseries of forms compiled at commune level.But there are many such forms, and each NTHPhas its own information system. The result is acompilation of paper documents with littlepotential to feed into any usable database.
VSS also has a health information system,which records inpatient stays and outpatientvisits by the insured. Inspection units, based inhospitals, are responsible for data entry.Unfortunately, the impressive amount ofinformation being compiled by provincial anddistrict hospitals does not seem to be processedfurther.
There are several ongoing attempts to introducemodern information technology in parts of thesocial protection architecture. Some
commercial banks are paying old-age pensionsusing cards for automatic teller machines. LangSon is relying on sophisticated chip cards forparticipants in the health insurance program. Initself, each of these initiatives bears muchpromise. But the new systems are notconnected to a general architecture forinformation management, which limits theireffectiveness. Further down the road, bringingcommon standards into these scattered effortsmay add complexity to an already difficultproblem.
The main recommendation in this area is tointroduce a single social insurance number, tobe given to every person at birth regardless ofcoverage. The poverty status of the householdthe person belongs to can be updated on anannual basis. The social insurance numbercan serve as the platform to documentpersonal histories in connection toemployment, earnings and health care use,among others. With adequate informationmanagement systems, these personal historiescan help design better provider paymentmechanisms in health, and eventually supportthe introduction of individual accounts in thecase of pensions.
AN INTEGRATED APPROACH
121
Figure 12.1: A Fragmented Approach to Information Management
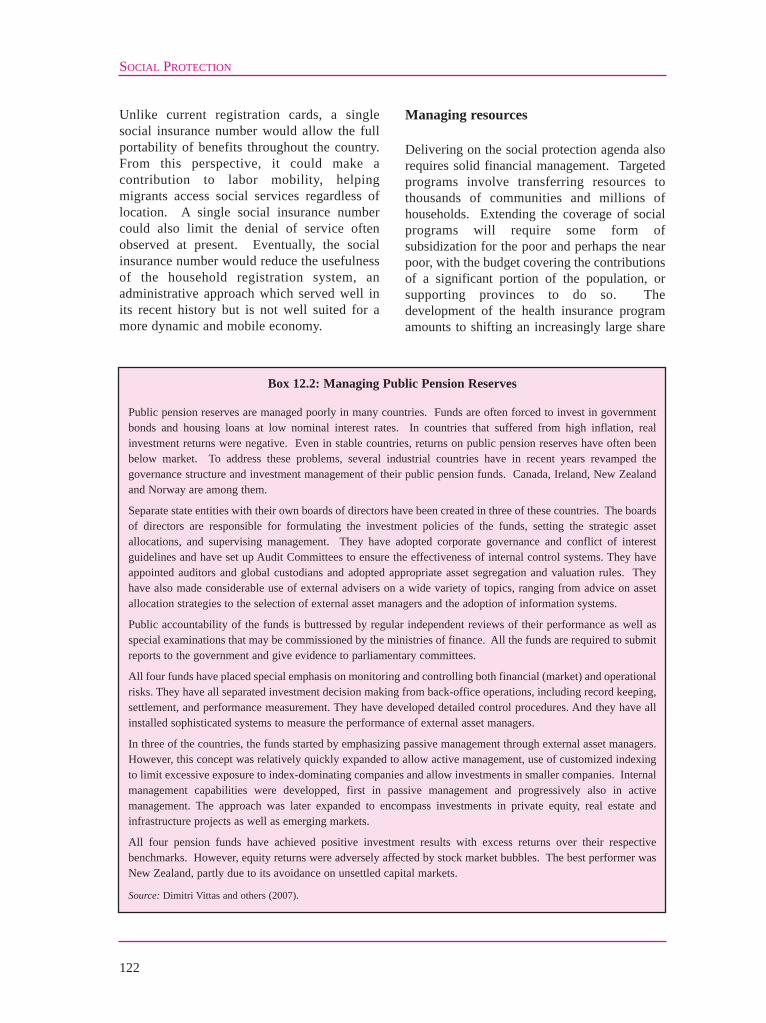
Unlike current registration cards, a singlesocial insurance number would allow the fullportability of benefits throughout the country.From this perspective, it could make acontribution to labor mobility, helpingmigrants access social services regardless oflocation. A single social insurance numbercould also limit the denial of service oftenobserved at present. Eventually, the socialinsurance number would reduce the usefulnessof the household registration system, anadministrative approach which served well inits recent history but is not well suited for amore dynamic and mobile economy.
Managing resources
Delivering on the social protection agenda alsorequires solid financial management. Targetedprograms involve transferring resources tothousands of communities and millions ofhouseholds. Extending the coverage of socialprograms will require some form ofsubsidization for the poor and perhaps the nearpoor, with the budget covering the contributionsof a significant portion of the population, orsupporting provinces to do so. Thedevelopment of the health insurance programamounts to shifting an increasingly large share
SOCIAL PROTECTION
122
Box 12.2: Managing Public Pension Reserves
Public pension reserves are managed poorly in many countries. Funds are often forced to invest in governmentbonds and housing loans at low nominal interest rates. In countries that suffered from high inflation, realinvestment returns were negative. Even in stable countries, returns on public pension reserves have often beenbelow market. To address these problems, several industrial countries have in recent years revamped thegovernance structure and investment management of their public pension funds. Canada, Ireland, New Zealandand Norway are among them.
Separate state entities with their own boards of directors have been created in three of these countries. The boardsof directors are responsible for formulating the investment policies of the funds, setting the strategic assetallocations, and supervising management. They have adopted corporate governance and conflict of interestguidelines and have set up Audit Committees to ensure the effectiveness of internal control systems. They haveappointed auditors and global custodians and adopted appropriate asset segregation and valuation rules. Theyhave also made considerable use of external advisers on a wide variety of topics, ranging from advice on assetallocation strategies to the selection of external asset managers and the adoption of information systems.
Public accountability of the funds is buttressed by regular independent reviews of their performance as well asspecial examinations that may be commissioned by the ministries of finance. All the funds are required to submitreports to the government and give evidence to parliamentary committees.
All four funds have placed special emphasis on monitoring and controlling both financial (market) and operationalrisks. They have all separated investment decision making from back-office operations, including record keeping,settlement, and performance measurement. They have developed detailed control procedures. And they have allinstalled sophisticated systems to measure the performance of external asset managers.
In three of the countries, the funds started by emphasizing passive management through external asset managers.However, this concept was relatively quickly expanded to allow active management, use of customized indexingto limit excessive exposure to index-dominating companies and allow investments in smaller companies. Internalmanagement capabilities were developped, first in passive management and progressively also in activemanagement. The approach was later expanded to encompass investments in private equity, real estate andinfrastructure projects as well as emerging markets.
All four pension funds have achieved positive investment results with excess returns over their respectivebenchmarks. However, equity returns were adversely affected by stock market bubbles. The best performer wasNew Zealand, partly due to its avoidance on unsettled capital markets.
Source: Dimitri Vittas and others (2007).

AN INTEGRATED APPROACH
123
of the funding for health care from publicproviders to wholesale purchasers of services.The pension program, in turn, is bound toaccumulate a massive amount of reservesduring several decades. This is because thepopulation is young and the labor market isformalizing, so that dependency ratios willremain low.
Transparent financial management will becrucially important in all these areas. Therewill be a need to make sure that targetedcommunes do receive the resources they areentitled to and manage them properly. It willbe necessary to monitor that those who areclassified as poor get their social securitycontributions totally or partially paid for outof public resources. The purchasing decisionsof the social insurance agency will involvehundreds of thousands of providers, from
public hospitals to private clinics to NGOfacilities to certified doctors. Scrutiny will berequired to avoid abuse or favoritism, as inany other public procurement decision.
An area deserving special attention is themanagement of the reserves of the old-agepension program. Those reserves alreadyexceed the equivalent of three billion dollars.But they are placed in bonds and liquid assetsyielding low returns. There is a need forstrategic decisions as to what the authorizedinvestments are, and how portfolioreallocation decisions are going to be made.Transparent mechanisms could also beconsidered to report to the National Assemblyon the financial performance of socialprotection programs, including themanagement of reserves, perhaps on an annualbasis (Box 12.2).

124
The word “processed” describesinformally reproduced works that may not becommonly available through libraries.
ActionAid Vietnam and Institute of Economics.2004. Listening to People Living inPoverty. Agriculture Publishing House,Hanoi.
Adams, Susan J. 2005. Vietnam’s Health CareSystem: a Macroeconomic Perspective.IMF, Washington, DC.
ADB (Asian Development Bank). 2001. SocialProtection in Asia and the Pacific. ADB,Manila.
ADB (Asian Development Bank). 2005a. LaborMarkets in Asia: Promoting Full,Productive, and Decent Employment.Key Indicators 2005. ADB, Manila.
ADB (Asian Development Bank). 2005b. M4PWeek 2005: Proceedings of a Series ofReview and Planning Events Held ByMaking Markets Work Better for thePoor (M4P) During the Week 31 Octoberto 4 November 2005. ADB, Hanoi.
ADB (Asian Development Bank). 2005c. SocialProtection Index for Committed PovertyReduction: Multi-Country Report.Prepared By Halcrow China Limited andInstitute of Development Studies,Sussex. TA No. 6120 - REG. ADB,Manila.
ADB (Asian Development Bank). 2006a. AsiaWater Watch 2015: Are Countries in Asiaon Track to Meet Target 10 of theMillennium Development Goals. Asian
Development Bank, Manila.
ADB (Asian Development Bank). 2006b. SocialProtection Index for Committed PovertyReduction. ADB, Manila.
ADB (Asian Development Bank). 2006c.Supermarkets and the Poor in Vietnam.Asian Development Bank. MakingMarkets Work Better for the Poor,Hanoi.
ADB (Asian Development Bank). 2007a. M4PWeek 2006: Proceedings of a series ofreview and planning events held byMaking Markets Work Better for thePoor (M4P) during the week 27November to 1 December 2006. ADB,Hanoi.
ADB (Asian Development Bank). 2007b. RuralLabor Markets and Migration. MakingMarkets Work Better for the PoorDiscussion Paper No. 18. ADB, Hanoi.
ADB (Asian Development Bank) and WHO(World Health Organization). 2002.Improving Health Status and ReducingInequalities. ADB and WHO, Hanoi.
Adger, W. Neil. 1998. Indicators of Social andEconomic Vulnerability to ClimateChange in Vietnam. CSERGE WorkingPaper GEC 98-02. Centre for Social andEconomic Research on the GlobalEnvironment. University of East Anglia,Norwich, UK.
Ahmadi, Nader. 2005. Situation Analysis ofInstitutional and Alternative CareProgrammes in Viet Nam. MOLISA,CIDA & UNICEF, Hanoi.
BIBLIOGRAPHY
Aksoy, Ataman and Aylin Isik-Dikmelik. 2007.The Role of Services in Rural Income:the Case of Vietnam. World Bank PolicyResearch Working Paper No. 4180.World Bank, Washington, DC.
Alarcon-Caracuel, Manuel Ramon. 2006.Report on the Current Situation and theDevelopment and ImprovementPerspectives of an Integrated System ofSocial Security in the Socialist Repubicof Vietnam. Spanish Agency forInternational Cooperation, Hanoi.Processed.
AusAID. 2006. Quang Ngai Natural DisasterMitigation Project: Lessons Learned.Hanoi. Processed.
AusAID and UNDP (United NationsDevelopment Programme). 2005. Impactof HIV/AIDS on Household Vulnerabilityand Poverty in Viet Nam. UNDP, Hanoi.
Axelson, Henrik. 2007. The Evolution of HealthInsurance Policy in Vietnam. AsianDevelopment Bank, Hanoi. Processed.
Axelson, Henrik and others. 2007. Evaluatingthe Impact of a Targeted Program onHealthcare Utilization and Expenditurein Vietnam Using Quasi-ExperimentalMethods. Paper Presented at the 6thWorld Congress of IHEA, Copenhagen,July 2007. Processed.
Bales, Sarah and others. 2007. The Early Impactof Decision 139 in Vietnam: AnApplication of Propensity ScoreMatching. Report to the Ministry ofHealth with the support of Vietnam-Sweden Health Cooperation Programmeand the Asian Development Bank.Hanoi. Processed.
Baulch, Bob, Joe Wood and Axel Weber. 2006.Developing a Social Protection Index forAsia. Development Policy Review,24(1):5-29.
Baulch, Bob, T. Hung Pham and Barry Reilly.2007. Ethnicity and Household Welfarein Vietnam: Empirical Evidence from1993 to 2004. Processed.
Baulch, Bob, Thi Kim Chuyen Truong,Dominique Haughton and JonathanHaughton. 2002. Ethnic MinorityDevelopment in Vietnam: aSocioeconomic Perspective. World BankPolicy Research Working Paper no.2836. World Bank, Hanoi.
Bhaumik, Sumon Kumar, Saul Estrin and KlausE. Meyer. 2007. Determinants ofEmployment Growth at MNEs:Evidence from Egypt, India, SouthAfrica and Vietnam. ComparativeEconomic Studies, 49(1):61-80.
Bijlmakers, Leon and others. 2006. Feasibilityof the Programme Approach in theHealth Sector in Vietnam. Hanoi.
Bird, Richard Miller and N. E. Slack. 2004.International Handbook of Land andProperty Taxation. Edward Elgar,Cheltenham, UK.
Brassard, Caroline. 2004. Wage and LabourRegulation in Vietnam within thePoverty Reduction Agenda. Policy andSociety, 23(2):49-77.
Brassard, Caroline and Scott Fritzen. 2007.Multi-Level Assessments for BetterTargeting of the Poor: a ConceptualFramework. Progress in DevelopmentStudies, 7(2):99-113.
Bui, Minh Dao. 2003. Mot So Van De GiamNgheo O Cac Dan Toc Thieu So VietNam (Poverty Reduction Issues of EthnicMinorities in Vietnam). Social SciencePublishing House, Hanoi.
Bui, Minh Dao and Thi Bich Lan Bui. 2005.Thuc Trang Doi Ngheo Va Mot So GiaiPhap Xoa Doi Giam Ngheo Doi Voi CacDan Toc Thieu So Tai Cho Tay Nguyen[Poverty and Some Solutions for HungerEradication and Poverty Reduction forEthnic Minorities in Tay Nguyen]. Nhaxuat ban Khoa hoc Xa hoi, Hanoi.
Capuno, Joseph. 2005. Health Insurance for thePoor: Lessons from the Philippines andVietnam: Paper Presented at Forum 9,Mumbai, India, 12-16 September 2005.
BIBLIOGRAPHY
125

Processed.
Carew-Reid, Jeremy and Lothar Linde. 2007.Rapid Assessment of the Extent andImpact of Sea Level Rise in Vietnam.Climate Change Discussion Paper 1.ICEM - International Centre forEnvironmental Management, Brisbane,Australia. Processed.
Castel, Paulette. 2005. Viet Nam: TowardUniversal Social Protection: PrivateMechanisms to Reach the Poor: PolicyIssues and Research Implications.Making Markets Work Better for thePoor Discussion Paper No. 13. ADB,Hanoi.
Castel, Paulette. 2007a. Nghe An VoluntaryPension Fund: Transition to the NationalScheme: Policy Options. Study Fundedby AECI - Spanish Cooperation inVietnam. Processed.
Castel, Paulette. 2007b. Old-age SecurityMedium and Short-term Policies:Pension Coverage for the PoorVoluntary Pension System Coverage andSocial Assistance Programs. StudyFunded by DFID Vietnam. Processed.
Castel, Paulette and Martin Rama. 2005.Comments on the Draft of the NewSocial Insurance Law. The World Bankin Vietnam, Hanoi. Processed.
CDI (Center for Development and Integration).2006. Sinh Ke Thay the Voi Cac SanPham Phi Go Cua Nhom Dan Toc DaoXa Thanh Son, Huyen Son Dong, TinhBac Giang (Replacing Livelihood, WithNon-Timber Products, of Dao Minorityin Thanh Son Commune, Son DongDistrict, Bac Giang Province). CDI,Hanoi.
Centre for Community Health Development.2006. Impacts of the Policy forHealthcare Support for the Poor throughEvaluation of the Implementation of theDecision 139/QD-TTg in the CentralHighland. Asian Development Bank,Hanoi. Processed.
Ci, Chy Lii, Chien Thang Nguyen, Hing CengVo and Hinh Thu Phan. Non-FarmEmployment in Rural Vietnam After DoiMoi: VASS - Doi Moi Review ProjectWith Support from UNDP and theEmbassy of Sweden Research Paper No.5. Hanoi. Processed.
CIEM (Central Institution for EconomicManagement) and GDC (GermanDevelopment Cooperation). 2004.Decentralization: National Policies andField Experiences on Decentralization ofPlanning and Budgeting. CIEM & GDC,Hanoi.
Clarke, Simon. 2006. The Changing Characterof Strikes in Vietnam. Post-CommunistEconomies, 18(3):345-361.
Committee for Ethnic Minorities and MPI(Ministry of Planning and Investment).2006a. Discussion Papers of Ministries:Documents to Be Distributed at theInternational Consultative Forum onSupporting the Socio-EconomicDevelopment in the Ethnic Minority andMountainous Areas of Vietnam 2006-2010. Committee for Ethnic Minoritiesand Ministry of Planning andInvestment, Hanoi.
Committee for Ethnic Minorities and MPI(Ministry of Planning and Investment).2006b. Discussion Papers of Provinces:Documents to Be Distributed at theInternational Consultative Forum onSupporting the Socio-EconomicDevelopment in the Ethnic Minority andMountainous Areas of Vietnam 2006-2010. Committee for Ethnic Minoritiesand Ministry of Planning andInvestment, Hanoi.
Conway, Tim. 2000. Current Issues in Sector-Wide Approaches for HealthDevelopment: Viet Nam Case Study.WHO, Geneva.
Conway, Tim. 2004. Politics and the PRSPApproach: Vietnam Case Study. ODIWorking Paper 241. OverseasDevelopment Institute (ODI), London.
SOCIAL PROTECTION
126

BIBLIOGRAPHY
127
Cuc Thong ke Thanh pho Ho Chi Minh. 2005.Dieu tra dan so giua ky nam 2004 Thanhpho Ho Chi Minh. Cuc Thong ke Thanhpho Ho Chi Minh.
Dang, Boi Huong, Sarah Bales and KhanhPhuong Nguyen. 2006. Ensuring HealthCare for the Rural Poor in Vietnam andChina: a State or a Market Approach?Medical Publishing House, Hanoi.
Dang, Boi Huong and others. 2007. RuralHealth Care in Vietnam and China:Conflict Between Market Reforms andSocial Need. International Journal ofHealth Services, 37(3):555-572.
Dang, Ngoc Quang and others. 2006. Su ThamGia, Tinh Minh Bach, Tinh Trach NhiemGiai Trinh Trong Tien Trinh Ngan SachXa: Truong Hop Tinh Tra Vinh, Viet Nam(Participation, Transparency,Accountibility in the CommuneBudgeting Process). Oxfam GB, OxfamHong Kong & Institute of DevelopmentMangement of Asia, Hanoi.
Dang, Nguyen Anh. 2005. Viet Nam InternalMigration: Opportunities and Challengesfor Development. In DFID (Departmentfor International Development) and IOM(International Organization forMigration) (eds.), Migration,Development and Poverty Reduction inAsia (pp. 149-170). IOM.
Dang, Nguyen Anh, Bach Duong Le and HaiVan Nguyen. 2005. Youth Employmentin Viet Nam: Characteristics,Determinants and Policy Responses. ILOEmployment Strategy Papers 2005/9.ILO, Geneva.
Dao, Lan Huong and others. 2006. Socio-Economic Status Inequality and MajorCauses of Death in Adults: a 5-YearFollow-Up Study in Rural Vietnam.Public Health, 120(6):497-504.
Dao, Quang Vinh. 2007. Profile of minimumwage earners and impact on minimumwage adjustment. Paper Presented at theWorkshop on Minimum Wage Policy in
Market Economy, Held by the Instituteof Labor Science and Social Affairs withthe Support of the World Bank, Da Nang,March 9-10, 2007. Processed.
Dasgupta, Susmita and others. 2007. TheImpact of Sea Level Rise on DevelopingCountries : A Comparative Analysis.World Bank Policy Research WorkingPaper No. 4136. World Bank,Washington, DC.
Davidsen, Soren and Carrie Turk. 2005. TheCitizens’ Report Card in Vietnam. WorldBank, Hanoi.
de Brauw, Alan and Tomoko Harigaya. 2007.Seasonal Migration and ImprovingLiving Standards in Vietnam. AmericanJournal of Agricultural Economics,89(2):430-447.
de los Angeles-Bantista, Feny. 2004. EarlyChildhood Care and Education in South- East Asia: Working for Access, Qualityand Inclusion in Thailand, thePhilippines and Viet Nam. UNESCO,Bangkok.
de Silva, M. J., S. R. Huttly, T. Harpham and M.G. Kenward. 2007. Social Capital andMental Health: a Comparative Analysisof Four Low Income Countries. SocialScience & Medicine, 64(1):5-20.
Dinh, Thi Phuong Hoa and Merel Mattoush.2006. A situational analysis of newbornhealth and interventions in Vietnam:Towards the development of a newbornhealth action plan. MOH and Save theChildren USA, Hanoi.
Do, Quy-Toan and Dang Trung Le. 2007.Natural disaster risk management (I):Household strategies. Processed.
Dufhues, Thomas. 2007. Accessing RuralFinance: the Rural Financial Market inNorthern Vietnam. Ph.D. Thesis. LeibnizInstitute of Agricultural Development inCentral and Eastern Europe (IAMO),Halle.
Dufhues, Thomas, Ute Lemke and Isabel

Fischer. 2004. Constraints and Potentialof Livestock Insurance Schemes: A CaseStudy from Vietnam. Research inDevelopment Economics and PolicyDiscussion Paper No. 05/2004.University of Hohenheim.
Duong, Bich Hanh. 2007. Impact of HealthInsurance Policies on Health SeekingDecisions of Users and the Quality ofServices in Vietnam. Processed.
Duong, D. V., C. W. Binns and A. H. Lee. 2004.Utilization of Delivery Services at thePrimary Health Care Level in RuralVietnam. Social Science & Medicine,59(12):2585-2595.
Duong, Huy Luong, Tang A Shenglan, TuohongZhang and Margaret Whitehead. 2007.Vietnam During Economic Transition: aTracer Study of Health Service Accessand Affordability. International Journalof Health Services, 37(3):573-588.
Edmonds, Eric V. and Nina Pavcnik. 2006.Trade Liberalization and the Allocationof Labor Between Households andMarkets in a Poor Country. Journal ofInternational Economics, 69(2):272-295.
Ekman, Björn, Henrik Axelson, Duc Anh Haand Liem T. Nguyen. 2007. Use ofMaternal Health Care Services andEthnicity: a Cross-Sectional Analysis ofVietnam. Processed.
Evans, Martin and others. 2007a. HowProgressive is Social Security in VietNam? UNDP, Hanoi.
Evans, Martin and others. 2007b. TheRelationship Between Old Age andPoverty in Viet Nam. UNDP, Hanoi.
French Embassy. 2004. Economic Growth andPoverty Reduction in Vietnam: Stuck inFirst Gear?: a Case Study of the O MonDistrict in the Mekong Delta. FrenchEmbassy, Hanoi. Processed.
Fritzen, Scott. 2004. Strengthening SocialProtection in Low Income Countries: the
Case of Vietnam. Working Paper 28.National University of Singapore,Singapore.
Fritzen, Scott. 2006. Vietnam’s HealthWorkforce in Transition: Problems,Policies and Prospects. Hanoi.Processed.
Fritzen, Scott A. 2007a. Legacies of PrimaryHealth Care in An Age of Health SectorReform: Vietnam’s Commune Clinics inTransition. Social Science & Medicine,64(8):1611-1623.
Fritzen, Scott A. 2007b. Reorienting HealthMinistry Roles in Transition Settings:Capacity and Strategy Gaps. HealthPolicy, 83(1):73-83.
Fritzen, Scott and Caroline Brassard. 2005.Vietnam Inequality Report 2005:Assessment and Policy Choices. MekongEconomics, Hanoi.
Gabriele, Alberto. 2006. Social ServicesPolicies in a Developing MarketEconomy Oriented Towards Socialism:the Case of Health System Reforms inVietnam. Review of InternationalPolitical Economy, 13(2):258-289.
GDC (German Development Cooperation).2006. The Current Salary System inVietnam’s Public Administration: Needfor Decentralized Approach. GDC,Hanoi.
Giang, Thanh Long. 2004. The Pension Schemein Vietnam: Current Status andChallenges in an Aging Society. VietnamDevelopment Forum (VDF), Hanoi.
Giang, Thanh Long. 2006. Pension Liabilitiesand Generational Relations: the Case ofVietnam. Oxford Institute of Ageing(OIA)Working Paper No. 106. OxfordInstitute of Ageing (OIA), London.
Glenday, Graham and Gangadhar P. Shukla.2006. Revenue Forecasting Techniquesand Application. Processed.
Glewwe, Paul, Nisha Agrawal and David Dollar(eds.). 2004. Economic Growth, Poverty,
SOCIAL PROTECTION
128

and Household Welfare in Vietnam.World Bank, Washington D.C.
Government of Vietnam. 2004. TaxAdministration Reform Program 2005 -2010. Hanoi.
Government of Vietnam. 2005a. Prime MinisterDecision No. 170/2005/QD-TTg of July8, 2005 Promulgating Poverty Lines forthe 2006-2010 Period.
Government of Vietnam. 2005b. VietnamManaging Public Expenditure forPoverty Reduction and Growth: PublicExpenditure Review and IntegratedFiduciary Assessment. Volume 1: Cross-Sectoral Issues. Financial PublishingHouse, Hanoi.
Government of Vietnam. 2005c. VietnamManaging Public Expenditure forPoverty Reduction and Growth: PublicExpenditure Review and IntegratedFiduciary Assessment. Volume 2:Sectoral Issues. Financial PublishingHouse, Hanoi.
Government of Vietnam. 2005d. Viet NamAchieving the Millennium DevelopmentGoals. Hanoi.
GSO (General Statistics Office). 2006. TheSituation of Enterprises through theResults of Surveys Conducted in 2004,2005. Statistical Publishing House,Hanoi.
GSO (General Statistics Office). 2007. TheSituation of Enterprises through theResults of Surveys Conducted in 2004,2005, 2006. Statistical PublishingHouse, Hanoi.
GSO (General Statistics Office). Various years.Statistical Yearbook. StatisticalPublishing House, Hanoi.
GSO (General Statistics Office) and UNFPA(United Nations Population Fund).2006a. The 2004 Vietnam MigrationSurvey: Internal Migration and RelatedLife Course Events. GSO, Hanoi.
GSO (General Statistics Office) and UNFPA
(United Nations Population Fund).2006b. The 2004 Vietnam MigrationSurvey: Migration and Health. GSO,Hanoi.
GSO (General Statistics Office) and UNFPA(United Nations Population Fund).2006c. The 2004 Vietnam MigrationSurvey: The Quality of Life of Migrantsin Vietnam. GSO, Hanoi.
Hanai, Kiyohito and Thi Minh Huyen Bach.2006. Revenue Assignment between theCentral and Local Budgets in Vietnam.In The Final Report of the JointResearch Program on the VietnameseTax System (pp. 217-260). Tax PolicyDepartment, Ministry of Finance,Vietnam and Policy Research Institute,Ministry of Finance, Japan.
Haughton, Jonathan, The Quan Nguyen andHoang Bao Nguyen. 2006. TaxIncidence in Vietnam. Asian EconomicJournal, 20(2):217-239.
Haughton, Jonathan and Viet Phuong Ngo.2007. Tax Incidence in Vietnam. SuffolkUniversity, Boston. Processed.
HEMA (Health Care Support for the Poor of theNorthern Uplands & Central Highlands).2007. Survey on Health SeekingBehaviour of the Poor and EthnicMinorities in Son La Province, Son La,July 2007. Processed.
Hoang, Xuan Thanh. 2007. ParticipatoryPoverty Monitoring at Phuoc Dai andPhuoc Thanh Communes, Bac AiDistrict, Ninh Thuan Province. ReportPrepared for Oxfam GB. Processed.
Hoang, Xuan Thanh, Thi Mong Phuong Le, VanHai Ngo and Thi Thu Huong Nguyen.2006. Subsidies in AgriculturalExtension for Poverty Reduction inVietnam. SNV, Hanoi.
Hohmann, Jurgen and Konrad Obermann. 2007.Improving Payment for Health Care inHoa Binh Province: Developing a“Research Protocol for the Follow-up ofthe Fund for the Poor and the Health
BIBLIOGRAPHY
129

Insurances in Vietnam”: Mission Report.GFA Consulting Group. Processed.
Hughes, R. forthcoming. Climate Change andVulnerability in Vietnam: Key Issues andFuture Options. Processed.
ILO (International Labor Organization). variousyears. Labour and Social Trends in Asiaand the Pacific. ILO, Bangkok.
ILO (International Labor Organization). 2007a.Labour and Social Trends in ASEAN2007: Integration, Challenges andOpportunities. ILO, Bangkok.
ILO (International Labor Organization). 2007b.Understanding and Minimizing Risk forStrikes in Vietnam. ILO, Hanoi.Processed.
ILO (International Labor Organization). 2007c.Visions for Asia’s Decent Work Decade:Sustainable Growth and Jobs to 2015.ILO, Bangkok.
ILSSA (Institute of Labour Science and SocialAffairs). 2006. Report: EmploymentTrends in Vietnam 2006-2015. SIDA-CIEM Project. Hanoi. Processed.
ILSSA (Institute of Labour Science and SocialAffairs) and ILO (International LaborOrganization). 2006a. CollectiveBargaining in Vietnam. Hanoi.Processed.
ILSSA (Institute of Labour Science and SocialAffairs) and ILO (International LaborOrganization). 2006b. National Reporton Labor Disputes and Settlement ofLabor Disputes. Hanoi. Processed.
Institute of Ethnology and World Bank. 2004.Proceedings of Workshop on PovertyReduction: Issues and Solutions forEthnic Minorities in NorthernMoutainous Areas in Vietnam.Agriculture Publishing House, Hanoi.
Institute of Social Sciences of Vietnam. 2005.Anh Huong Cua O Nhiem Moi Truong OMot So Khu Cong Nghiep Phia Bac ToiSuc Khoe Cong Dong [Effect ofEnvironmental Pollution in Northern
Industrial Zones to Community Health].Nha Xuat Ban Khoa Hoc Xa Hoi, Hanoi.
Institute of Sociology. 2005. Impacts of ExistingResidence Registration Policy on UrbanPoverty Alleviation: Two Case Studies inHanoi and Ho Chi Minh City. Instituteof Sociology, Hanoi.
IPCC (Intergovernmental Panel on ClimateChange). 2007. Summary forPolicymakers. In Susan Solomon, DaheQin, Martin Manning, Melinda Marquis,Kristen Averyt, Melinda M.B. Tignor,Henry LeRoy Jr. Miller and ZhenlinChen (eds.), Climate Change 2007: ThePhysical Science Basis. Contribution ofWorking Group I to the FourthAssessment Report of theIntergovernmental Panel on ClimateChange. Cambridge University Press,Cambridge, UK & and New York, USA.
Isik-Dikmelik, Aylin. 2006. Trade Reforms andWelfare: An Ex-Post Decomposition ofIncome in Vietnam. World Bank PolicyResearch Working Paper no. 4049.World Bank, Washington, D.C.
JBIC (Japan Bank for InternationalCooperation). 2007. Seventh PovertyReduction Support Credit (PRSC7):Japan’s Views on Policy Actions.Processed.
Jenkins, Rhys and Kunal Sen. 2006.International Trade and ManufacturingEmployment in the South: Four CountryCase Studies. Oxford DevelopmentStudies, 34(3):299-322.
JETRO (Japan External Trade Organization).2005. Impact of Socio-EconomicChanges on the Livehoods of PeopleLiving in Poverty in Vietnam. Institute ofDeveloping Economics - JETRO, Tokyo.
JETRO (Japan External Trade Organization).2006a. Actors in Poverty Reduction inVietnam. Institute of DevelopingEconomies. Japan External TradeOrganization, Chiba.
JETRO (Japan External Trade Organization).
SOCIAL PROTECTION
130

2006b. Comparative Survey on theLabor Environment in ASEAN, Chinaand India. JETRO, Tokyo.
JICA (Japan International Cooperation Agency)and BMH (Bach Mai Hospital). 2004a.Joint Evaluation Report on the JapaneseTechnical Cooperation for the Bach MaiHospital Project for FunctionalEnhancement. Hanoi. Processed.
JICA (Japan International Cooperation Agency)and MOH (Ministry of Health). 1999.Joint Evaluation Report on the Projectfor Cho Ray Hospital TechnicalCooperation in the Socialist Republic ofVietnam. Hanoi. Processed.
Jowett, M., P. Contoyannis and N.D. Vinh.2003. The Impact of Public VoluntaryHealth Insurance on Private HealthExpenditures in Vietnam. Social Scienceand Medicine, 56(2):333-342.
Justino, Patricia. 2005. Beyond HEPR (HungerEradication and Poverty Reduction): aFramework for An Integrated NationalSystem of Social Security in Viet Nam.UNDP Viet Nam Policy Dialogue Paper2005/1. DFID and UNDP, Hanoi.
Kabeer, Naila and Thi Van Anh Tran. 2006.Globalisation, Gender and Work in theContext of Economic Transition: TheCase of Viet Nam. UNDP Viet NamPolicy Dialogue Paper 2006/2. UNDP,Hanoi.
Kerbo, H. 2005. Foreign Investment andDisparities in Economic Developmentand Poverty Reduction: Comparative-Historical Analysis of the BuddhistCountries of Southeast Asia.International Journal of ComparativeSociology, 46(5-6):425-459.
Knowles, James C. 2007a. Review ofImplementation of the C2 Sub-component (the Swedish grantcomponent) of the Health Care in theCentral Highlands Project: Report to theMinistry of Health, Sida and the AsianDevelopment Bank: Draft. Hanoi.
Processed.
Knowles, James C. 2007b. Some Key HealthInsurance Policy Issues in Viet Nam.Report to the Asian Development BankRSC-C60848(VIE): “Health Policy inViet Nam: Responding to the Call forIntensified Engagement: Joint Analyticaland Advisory Activity”: Draft. AsianDevelopment Bank, Hanoi. Processed.
Knowles, James C., Henrik Axelson and NgocUyen Vu. 2007a. Data Used inApplication of SimIns Plus Model to VietNam. Report to the Asian DevelopmentBank RSC-C60848(VIE): “HealthPolicy in Viet Nam: Responding to theCall for Intensified Engagement: JointAnalytical and Advisory Activity”. AsianDevelopment Bank, Hanoi. Processed.
Knowles, James C., Henrik Axelson and NgocUyen Vu. 2007b. Simulations with theSimIns Model Applied to Vietnam:Report to the Asian Development BankRSC-C60848(VIE): “Health Policy inViet Nam: Responding to the Call forIntensified Engagement: Joint Analyticaland Advisory Activity”. AsianDevelopment Bank, Hanoi. Processed.
Knowles, James C. and others. 2006. Summaryof the Findings of Four Inter-relatedResearch Studies on Pro-poor Financingin Viet Nam: Final Report Prepared forthe Ministry of Health and the AsianDevelopment Bank TA No. 4331-VIE:Support for Pro-Poor Health Policies.Hanoi. Processed.
Knowles, James C. and others. 2005. MakingHealth Care more Affordable for thePoor: Health Financing in Vietnam:Final Report-TA No. 3877-VIE Ministryof Health/Asian Development Bank.Ministry of Health and AsianDevelopment Bank, Hanoi.
Kokko, Ari and Patrik Tingvall. 2007. TheWelfare State. In Ari Kokko (ed.), TheRole of the State in Vietnam. VASS - DoiMoi Review Project With Support fromUNDP and the Embassy of Sweden,
BIBLIOGRAPHY
131
Hanoi.
Korinek, K. 2004. Maternal Employment duringNorthern Vietnam’s Era of MarketReform. Social Forces, 83(2):791-822.
Korinek, Kim M. 2006. The Status Attainmentof Young Adults During MarketTransition: the Case of Vietnam.Research in Social Stratification andMobility, 24(1):55-72.
Kung, I. and H. Wang. 2006. SociallyConstructed Ethnic Division of Labour:Labour Control in Taiwanese-OwnedFirms in Malaysia and Vietnam.International Sociology, 21(4):580-601.
Kunieda, Shigeki and Ngoc Huynh Do. 2006.Vietnamese Personal Income TaxReform. In The Final Report of the JointResearch Program on the VietnameseTax System (pp. 21-72). Tax PolicyDepartment, Ministry of Finance,Vietnam and Policy Research Institute,Ministry of Finance, Japan.
Lambert, Sylvie, Martin Ravallion andDominique van de Walle. 2007. A Micro-Decomposition Analysis of theMacroeconomic Determinants of HumanDevelopment. World Bank PolicyResearch Working Paper no. 4358.World Bank, Washington, DC.
Le, Bach Duong and others. 2005. SocialProtection for the Most Needy inVietnam. The Gioi Publishers, Hanoi.
Le, Minh Tuan, Minh Duc Pham and Luc deWulf. 2007. Estimating EconomicBenefits for Revenue AdministrationReform Projects. World Bank,Washington D.C.
Le, Ngoc Thang and others. 2006. Nghien CuuVe Dinh Canh, Dinh Cu O Viet Nam(Research on Settled Agriculture andSettlement in Vietnam). NationalPolitical Publishing House, Hanoi.
Le, Thi Phuong Mai and Quy Nhan Vu. 2005. AFinal Assessment on the ReproductiveHealth Project in Nghe An Province.
Population Council and JICA, Hanoi.
Le, Van Truyen, Hoang Thai Luong, KhanhPhuong Nguyen and Trieu Dzung Le.2007. Vietnam National Trade andHealth Assessment: Draft ResearchReport. Ministry of Health, Hanoi.Processed.
Lee, Chang-Hee. 2006a. Industrial relations anddispute settlement in Vietnam. ILODiscussion Paper. International LabourOffice, Hanoi.
Lee, Chang-Hee. 2006b. Recent IndustrialRelations Developments in China andViet Nam: the Transformation ofIndustrial Relations in East AsianTransition Economies. Journal ofIndustrial Relations, 48(3):415-429.
Lempert, D., Van Le Nguyen and Tan SinhBach. 2004. Assessment of InstitutionalCapacity for Disaster Risk Managementin Viet Nam (NDM-Partnership, Phase 1Main Report ). UNDP, Hanoi. Processed.
Lieberman, S. S., J. J. Capuno and H. VanMing. 2005. Decentralizing Health:Lessons from Indonesia, the Philippinesand Vietnam. In R. White and P. Smoke(eds.), East Asia Decentralizes: MakingLocal Government Work (pp. 155-178).World Bank, Washington, DC.
Luu, Hoai Chuan. 2004. Danh Gia Hieu QuaHoat Dong Cua Bac Sy TuyenXa/Phuong Tai Mot So Dia Phuong: DeTai Khoa Hoc Cap Bo 2002-2003[Evaluating the Effectiveness of Doctorsat Commune/Ward Level]. Institute ofHealth Strategy and Policy, Hanoi.
Martinez-Vazquez, Jorge. 2005. Making FiscalDecentralization Work in Vietnam.Georgia State University, Atlanta.
Martinez-Vazquez, Jorge and Juan Luis Gomez.2005. Effective Fiscal Decentralizationin Vietnam. In Proceedings of the AnnualConference on Taxation (pp. 356-361).
Matsuo, Ayaka. 2006. Child Domestic Labourin South-East and East Asia: Emerging
SOCIAL PROTECTION
132

Good Practices to Combat It.International Labour Office, Bangkok.
McGee, Robert W. 2006. The Ethics of TaxEvasion: a Survey of VietnameseOpinion. Andreas School of BusinessWorking Paper. Barry University, MiamiShores, Florida.
Mclure, Charles E. 2005. Tax Policy forVietnam. In William T Alpert (ed.), TheVietnamese Economy and ItsTransformation to An Open MarketSystem (pp. 72-127). Sharpe, Armonk,N.Y.
Mcnicoll, Geoffrey. 2006. Policy Lessons of theEast Asian Demographic Transition.Population Council, New York.
Mekong Economics. 2006. MeasuringGrassroots Democracy in Vietnam.Presented to the Embassy of Finland inHanoi. Mekong Economics, Hanoi.
Minford, M., D. Quang, H. T. Nguyen and P.Brooke. 2004. An Expenditure TrackingStudy of the Hunger Eradication andPoverty Reduction Programme andProgramme 135: Final Report. UNDP,Hanoi. Processed.
Ministry of Foreign Affairs in Finland. 2005.Reducing Poverty in Quang Tri: SuccessStories in Vietnamese RuralDevelopment. Ministry of ForeignAffairs in Finland, Helsinki.
Minot, Nicholas, Michael Epprecht, Thi TramAnh Tran and Quang Trung Le. 2006.Income Diversification and Poverty inthe Northern Uplands of Vietnam. IFPRIResearch Report No. 145. InternationalFood Policy Research Institute (IFPRI),Washington, D.C.
MOF (Ministry of Finance). 2007. ReportMedium-Term Fiscal and ExpenditureFramework Over 2007-2009. FinancePublishing House, Hanoi.
MOH (Ministry of Health). various years.Health Statistics Yearbook. MOH,Hanoi.
MOH (Ministry of Health). 2004. Assessment of1-Year Implementation of Examinationand Treatment for the Poor (InAccordance With Decision139/2002/QD-TTg of the PrimeMinister). Hanoi. Processed.
MOH (Ministry of Health). 2004. HIV/AIDSEstimates and Projections in Vietnam2005- 2010. Hanoi.
MOH (Ministry of Health). 2005. Quan ly va tochuc y te (Managing and OrganizingHealth System). MOH, Hanoi.
MOH (Ministry of Health). 2007a. Joint AnnualHealth Sector Review (JAHR) 2007.Hanoi. Processed.
MOH (Ministry of Health). 2007b. StudyReport: Review on the Implementation ofFree Healthcare Services for Childrenunder Six in Public Healthcare Facilitieswith Regards to Child Mortality andMorbidity Patterns and AvailableTreatment. Study Conducted withUNICEF Support. Hanoi. Processed.
MOH (Ministry of Health). 2007c. VietnamHealth Report 2006. Medical PublishingHouse, Hanoi.
MOH (Ministry of Health), UNICEF (UnitedNations Fund for Children) and GSO(General Statistics Office). 2005. SurveyAssessment of Vietnamese Youth. MOH,Hanoi.
MOLISA (Ministry of Labor Invalids andSocial Affairs), ILSSA (Institute ofLabour Science and Social Affairs) andILO (International Labour Office). 2003.Equality, Labour and Social Protectionfor Women and Men in the Formal andInformal Economy in Viet Nam: Issuesfor Advocacy and Policy Development.Labour and Social Affairs PublishingHouse, Hanoi.
MOLISA (Ministry of Labor Invalids andSocial Affairs) and UNICEF (UnitedNations Fund for Children). 2004.Situational Analysis on Children withDisabilities in Viet Nam. Hanoi.
BIBLIOGRAPHY
133

Processed.
MONRE (Ministry of Natural Resources andEnvironment). 2003. Initial NationalCommunication to the IPCC. Ministry ofNatural Resources and Environment,Hanoi. Processed.
Moore, Mick. 2004. Taxation and the Political:Agenda, North and South. Forum forDevelopment Studies No. 1-2004.Institute of Development Studies (IDS),Brighton, UK.
Moore, Mick. 2007. How Does Taxation Affectthe Quality of Governance? IDS WorkingPaper 280. Institute of DevelopmentStudies, Brighton, UK.
MPI (Ministry of Planning and Investment) andSIDA (Swedish Agency for InternationalDevelopment Cooperation). 2005. ChiaSe - a Different Approach to PovertyAlleviation: Chia Se Vietnam/SwedenPoverty Alleviation Programme. MPIand SIDA, Hanoi.
MPI (Ministry of Planning and Investment) andUNDP (United Nations DevelopmentProgramme). 2006. Study onCompetitiveness and Impacts ofLiberalization: the Case of InsuranceServices. UNDP, Hanoi.
Mu, Ren and Dominique van de Walle. 2007.Rural Road and Poor Area Developmentin Vietnam. World Bank Policy ResearchWorking Paper no. 4340. World Bank,Washington, DC.
National Institute of Nutrition. 2005. NutritionStatus of Children and Their Mother inViet Nam 2005. Hanoi. Processed.(UNICEF contribution – no file)
Navigos Group. 2007. Vietnam Salary SurveyReport 2007. Hanoi.
Neefjes, Koos. 2004. Participation andEmpowerment in the HEPR Programme:Report of a Desk Study. UNDP, Hanoi.
Nguyen, Duc Hung. 2007. Industrial Relationand Wage Bargaining in IndustrialRelation. Paper Presented at the
Workshop on Minimum Wage Policy inMarket Economy, Held by the Instituteof Labor Science and Social Affairs withthe Support of the World Bank, Da Nang,March 9-10, 2007. Processed.
Nguyen, Duy Khe and others. 2005. Health andHealth Care: Equity Aspects in FilaBavi, Vietnam. In INDEPTH Network(ed.), Measuring Health Equity in SmallAreas: Findings from DemographicSurveillance Systems (pp. 127-142).Ashgate, Aldershot, UK.
Nguyen, Huu Dzung. 2005. Research onLabour Market and Career Guidance forVietnamese Youth at Current Time:General Report. (Independent ResearchTheme at National Level, ResearchTheme Code DTDL-2003/11). Labourand Social Affairs Publishing House,Hanoi.
Nguyen, Huu Dzung. 2007. Minimum WageSetting in Market Economy. PaperPresented at the Workshop on MinimumWage Policy in Market Economy, Heldby the Institute of Labor Science andSocial Affairs with the Support of theWorld Bank, Da Nang, March 9-10,2007. Processed.
Nguyen, Huu Hai. 2007. Develop a ReliableSocial Security System to Correspond tothe Socialist-Oriented Market Economy(in Vietnamese only). Research PaperNo. 8. VASS - Doi Moi Review ProjectWith Support from UNDP and theEmbassy of Sweden, Hanoi. Processed.
Nguyen, Khanh Phuong. 2006. FactorsAffecting Household Out-Of-PocketExpenditure. Ministry of Health andAsian Development Bank, Hanoi.Processed.
Nguyen, Minh Thang, I. Bhushan, E. Bloomand S. Bonu. 2007. Child Immunizationin Viet Nam: Situation and Barriers toCoverage. Journal of Biosocial Science,39(1):41-58.
Nguyen, Nguyet Nga and Martin Rama. 2007. A
SOCIAL PROTECTION
134

Comparison of Quantitative andQualitative Poverty Targeting Methodsin Vietnam. Q-Squared Working PaperNo. 32. Centre For International Studies- University Of Toronto.
Nguyen, Quynh Hoa, Ann Ohman, CeciliaStalsby Lundborg and Thi Kim ChucNguyen. 2007. Drug Use and Health-seeking Behavior for Childhood Illnessin Vietnam: A Qualitative Study. HealthPolicy, 82(3):320-329.
Nguyen, T. Binh, James W. Albrecht, Susan B.Vroman and M. Daniel Westbrook. 2007.A Quantile Regression Decomposition ofUrban-Rural Inequality in Vietnam.Journal of Development Economics,83(2):466-490.
Nguyen, Thanh Liem. 2004. Migration andHealth in Areas of Vietnam. Ph.D.Thesis. Brown University.
Nguyen, Thanh Liem and Michael J. White.2007. Health Status of TemporaryMigrants in Urban Areas in Vietnam.International Migration, 45(4):101-134.
Nguyen, Thi Hang. 2007. Opening Speech onthe Workshop. Workshop on MinimumWage Policy in Market Economy, Heldby the Institute of Labor Science andSocial Affairs with the Support of theWorld Bank, Da Nang, March 9-10,2007. Processed.
Nguyen, Thi Hong Ha. 2006. The Demand forStudent Health Insurance in Vietnam:Final Report Submitted to AsianDevelopment Bank TA No. 4331-VIE.Asian Development Bank, Hanoi.Processed.
Nguyen, Thi Hong Tu, Thi Lien Huong Nguyenand Bich Diep Nguyen. 2004.Globalization and Its Effects on HealthCare and Occupational Health in VietNam: Draft paper prepared for theRUIG/UNRISD project onGlobalization, Inequality and Health, acollaborative international projectforming part of the RUIG research
programme on The Social Challenge ofDevelopment. UNRISD, Geneva.
Nguyen, Thi Lan Huong. 2007a. Basis ofregional defferentiation of minimumwages. Paper Presented at the Workshopon Minimum Wage Policy in MarketEconomy, Held by the Institute of LaborScience and Social Affairs with theSupport of the World Bank, Da Nang,March 9-10, 2007. Processed.
Nguyen, Thi Lan Huong. 2007b.Recommendations from the research andproposed follow-up plan. PaperPresented at the Workshop on MinimumWage Policy in Market Economy, Heldby the Institute of Labor Science andSocial Affairs with the Support of theWorld Bank, Da Nang, March 9-10,2007. Processed.
Nguyen, Thi Lan Huong. 2007c. Scenario forintegration of minimum wage levels.Paper Presented at the Workshop onMinimum Wage Policy in MarketEconomy, Held by the Institute of LaborScience and Social Affairs with theSupport of the World Bank, Da Nang,March 9-10, 2007. Processed.
Nguyen, Thi Minh Hoa and Martin Rama. 2007.Community Effects and Poverty amongthe Ethnic Minorities of Vietnam.Processed.
Nguyen, Tien Dung and Misuo Ezaki. 2005.Regional Economic Integration and ItsImpacts on Growth, Poverty and IncomeDistribution: the Case of Vietnam.Review of Urban & RegionalDevelopment Studies, 17(3):197-215.
Nguyen, Tran Hien. 2006. The ExpandedProgram on Immunization: Twenty Yearsof Achievements in Vietnam. NationalExpanded Program on Immunization andNational Institute of Hygiene andEpidemiology, Hanoi.
Nguyen, Viet Cuong (ed.). 2004. 72 vu an tranhchap lao dong dien hinh: tom tat va binhluan (72 Typical Labor Disputes Cases:
BIBLIOGRAPHY
135
Summary and Comments). Nha xuat banLao dong Xa hoi, Hanoi.
Nguyen, Xuan Thanh and others. 2006. Does“The Injury Poverty Trap” Exist?: aLongitudinal Study in Bavi, Vietnam.Health Policy, 78(2-3):249-257.
Nose, Sakuya and Yasuyuki Sawada. 2007.Consumption Insurance againstUnforeseen Epidemics: The Case ofAvian Influenza in Vietnam. Processed.
O’Donnell, Owen A., Eddy Van Doorslaer andAdam Wagstaff. 2006. Decomposition ofInequalities in Health and Health Care.In Andrew M. Jones (ed.), ElgarCompanion to Health Economics (pp.179-192). Elgar, Cheltenham, U.K.
O’Donnell, Owen A., Furio C. Rosati and Eddyvan Doorslaer. 2004. Health Effects ofChild Work: Evidence from RuralVietnam. Research Paper Series 53. TorVergata University, CEIS.
Oostendorp, Remco H., Gian Nguyen Cong,Hong Quang Doan and Thi Lan HuongNguyen. 2006. Trade Liberalization, theGender Wage Gap and Returns toEducation in Vietnam: Working Paper.Free University. Processed.
O’Reilly, Sheelagh. 2005. The Utility of ForestEthics: a Proposed Approach Based onField Work in Vietnam: DiscussionPaper. International Institute forEnvironment and Development (IIED),London.
Oxfam International. 2006. Public Health atRisk: A US Free Trade Agreement CouldThreaten Access to Medicines inThailand. Oxfam Briefing Paper No. 86.Oxfam International, Oxford, UK.
Painter, Martin. 2006. Sequencing Civil ServicePay Reforms in Vietnam: Transition orLeapfrog? Governance, 19(2):325-346.
Pham, Quy Tho. 2006. Chuyen dich co cau laodong trong xu huong hoi nhap quoc te(Moving labor structure towards theinternational integration). Nha xuat ban
Lao dong, Hanoi.
Pham, Thai-Hung. 2007. Rural NonfarmEmployment Under Trade Reform:Evidence from Vietnam, 1993-2002.PRUS Working Paper No.35.Department of Economics. University ofSussex.
Phan, Thanh Thuy. 2006. Quality of PrivateHealth Services in Bac Giang City,Vietnam. Master Thesis. UmeaUniversity. Department of Public Healthand Clinical Medicine.
Plan in Vietnam. 2004a. Best Practices andLessons Learnt From Lang GiangHealth Project. Plan in Vietnam, Hanoi.
Plan in Vietnam. 2004b. Report on SchoolBased Child Health PromotionResearch. Plan in Vietnam, Hanoi.
Plan in Vietnam. 2004c. Thuc Trang Y TeTruong Hoc Va Dinh Huong Xay DungMo Hinh Can Thiep Nang Cao Suc KhoeTruong Hoc [Report on School BasedChild Health Promotion Research].Plan, Hanoi.
Porto, Guido. 2007. Vietnamese Catfish:Impacts of U.S. Antidumping. WorldBank, Washington, DC.
Qi, Li, Bill Taylor and Stephen Frost. 2003.Labour Relations and Regulation inVietnam: Theory and Practice. CityUniversity of Hong Kong, Hong Kong.
Razafindrakoto, Mireille and FrancoisRoubaud. 2007. The Informal Sector inViet Nam: What do Know and How toGo Further? A Statistical and EconomicPerspective. Statistical ScientificInformation, CS-06.
Salemink, O. 2006. Changing Rights andWrongs: the Transnational Constructionof Indigenous and Human Rights AmongVietnam’s Central Highlanders. Focaal -European Journal of Anthropology,47:32-47.
Sato, Motohiro and Cong Phi Tong. 2006. Land-Related Taxes and Fees in Vietnam. In
SOCIAL PROTECTION
136

The Final Report of the Joint ResearchProgram on the Vietnamese Tax System(pp. 123-166). Tax Policy Department,Ministry of Finance, Vietnam and PolicyResearch Institute, Ministry of Finance,Japan.
SEI (Stockholm Environment Institute). 2005a.Final Report of Joint Government of VietNam Donor Review of Rural WaterSupply, Sanitation and Health in VietNam: Building strengths to changedirections. Hanoi.
SEI (Stockholm Environment Institute). 2005b.Sector Status Report of JointGovernment - Donor Sector Review ofRural Water Supply, Sanitation andHealth in Viet Nam. Hanoi.
Sepehri, Ardeshir, Sisira Sarma and WayneSimpson. 2006. Does Non-Profit HealthInsurance Reduce Financial Burden?Evidence from the Vietnam LivingStandards Survey Panel. HealthEconomics, 15(6):603-616.
Sepehri, Ardeshir, Wayne Simpsona and SisiraSarmab. 2006. The Influence of HealthInsurance on Hospital Admission andLength of Stay—The Case of Vietnam.Social Science & Medicine, 63(7):1757-1770.
Sepehri, Ardeshir, Cuong Vu and Thanh TamLe. 2005. User Fees, FinancialAutonomy and Access to Social Servicesin Viet Nam. United Nations DiscussionPaper No. 6. United Nations, Hanoi.
Sikor, Thomas and Quang Tan Nguyen. 2007.Why May Forest Devolution Not Benefitthe Rural Poor? Forest Entitlements inVietnam’s Central Highlands. WorldDevelopment, 35(11):2010-2025.
Stern, Nicholas. 2007. The Economics ofClimate Changes: The Stern Review.Cambridge University Press,Cambridge, UK.
Sunderlin, William D. 2006. Poverty AlleviationThrough Community Forestry inCambodia, Laos, and Vietnam: An
Assessment of the Potential. ForestPolicy and Economics, 8(4):386-396.
Sunderlin, William D. and Thu Ba Huynh. 2005.Poverty Alleviation and Forests inVietnam. Center for InternationalForestry Research (CIFOR), Jakarta.
Sunoo, Jan Jung-Min. 2007. 24 FrequentlyAsked Questions about IndustrialRelations in Vietnam. Hanoi. Processed.
Swinkels, Rob and Carrie Turk. 2006.Explaining Ethnic Minority Poverty inVietnam: A Summary of Recent Trendsand Current Challenges. BackgroundPaper for CEM/MPI Meeting on EthnicMinority Poverty, Hanoi, 28 September2006. Processed.
Takahashi, Kazushi. 2007. Sources of RegionalIncome: Disparity in Rural Vietnam:Oaxaca-Blinder Decomposition. IDEDiscussion Paper no. 95. Institute ofDeveloping Economies (IDE), Tokyo.
Tanaka, Tomomi, Colin F. Camerer and QuangNguyen. 2005. Poverty, Politics, andPreferences: Field Experiments andSurvey Data from Vietnam. New YorkUniversity, New York.
Tat, S. and D. Barr. 2006. Healthcare in the NewVietnam: Comparing Patients’Satisfaction with Outpatient Care in aTraditional Neighborhood Clinic and aNew, Western-Style Clinic in Ho ChiMinh City. Social Science & Medicine,62(5):1229-1236.
Thai, Hung Cam. 2006. Money and Masculinityamong Low Wage VietnameseImmigrants in Transnational Families.International Journal of Sociology of theFamily, 32(2):247-271.
Tipple, G. 2006. Employment and WorkConditions in Home-Based Enterprisesin Four Developing Countries: Do TheyConstitute ‘Decent Work’? Work,Employment and Society, 20(1):167-179.
Tran, Anh Vu, H. Lee Seldon, Duc Hoang Chuand Phan Kien Nguyen. 2006. Electronic
BIBLIOGRAPHY
137

Healthcare Communications in Vietnamin 2004. International Journal ofMedical Informatics, 75(10-11):764-770.
Tran, Duc Vien, Vinh Quang Nguyen and VanThanh Mai. 2005. DecentralizationProcess and Its Impacts on Livelihoodsof Ethnic Minority Groups: A Study onDecentralization Process in ForestManagement in Northern and NorthCentral Uplands of Vietnam. AgriculturePublishing House, Hanoi. English
Tran, Quang Huy, Annika Johansson and HoangLong Nguyen. 2007. Reasons for notReporting Deaths: A Qualitative Study inRural Vietnam. World Health andPopulation, Feb.(2007).
Tran, Thi Mai Oanh. 2006. Report on Healthand Poverty Study (TA No. 4331-VIE:Support for Pro-Poor Health Policies).Asian Development Bank, Hanoi.Processed.
Tran, Tuan and others. 2004. Maternal SocialCapital and Child Health in Vietnam.Young Lives, Hanoi.
Tran, Tuan, Thi Mai Dung Van, Ingo Neu andMichael J. Dibley. 2005. ComparativeQuality of Private and Public HealthServices in Rural Vietnam. Health Policyand Planning, 20(5):319-327.
Trinh, Hoa Binh, Van Hai Tran, Thi Thuy NgaNguyen and Thi Hiep Vu. 2007.Application of Economic Modeling toMeasure the Likely Impact of StrongerIntellectual Property Rights (IPR)Protection on Medicine Prices inVietnam: Research Report. Ministry ofHealth and World Health Organization,Hanoi. Processed.
UNDP (United Nations DevelopmentProgramme). 2003. Health CareFinancing for Viet Nam. UNDPDiscussion Paper no. 2. UNDP, Hanoi.
UNDP (United Nations DevelopmentProgramme) and MOLISA (Ministry ofLabor Invalids and Social Affairs). 2004.
Taking Stock, Planning Ahead:Evaluation of the National TargetedProgramme on Hunger Eradication andPoverty Reduction and Programme 135.UNDP and MOLISA, Hanoi.
UNDP (United Nations DevelopmentProgramme) and MPI (Ministry ofPlanning and Investment). 2006. Impactsof Basic Public Services Liberalizationon the Poor and Marginalized People:the Case of Health, Education andElectricity in Viet Nam. UNDP and MPI,Hanoi.
UNESCO (United Nations Educational,Scientific and Cultural Organization).2005. Community-Based LiteracyProgrammes for Minority LanguageContexts in Asia. UNESCO, Bangkok.
UNFPA (United Nations Population Fund).2006. Provision and Utilisation ofReproductive Health Care Services inSeven UNFPA-Supported Provinces inthe 7th Country Programme: BaselineSurvey Report. UNFPA, Hanoi.
UNICEF (United Nations Fund for Children).2006. Out-Patient Visits and HospitalAdmissions at Three Referral PediatricHospitals in Vietnam, 1995-2004:Preliminary Report. Hanoi. Processed.
UNICEF (United Nations Fund for Children)and CERWASS (Center for Rural WaterSupply and Environmental Sanitation).2007. Water Environment and SanitationKnowledge, Attitude and PracticesSurvey among H’mong and Gia Rai.Processed.
UNICEF (United Nations Fund for Children)and Institute of Sociology. 2007. Impactof the Domestic Migration on the Familyand Children Left Behind. On-goingResearch Project. Hanoi. Processed.
UNICEF (United Nations Fund for Children)and WHO (World Health Organization).2007. Child Survival Profile: Vietnam.UNICEF, Hanoi.
United Nations. 2007. World Population
SOCIAL PROTECTION
138

Prospects: The 2006 Revision. UnitedNations, New York.
UNODC (United Nations Office on Drugs andCrime). 2003. Ethnic Minorities, DrugUse and Harm in the Highlands ofNorthern Vietnam: a ContextualAnalysis of the Situation in SixCommunes from Son La, Lai Chau, andLao Cai. UNODC, Hanoi.
Valdelin, Jan, Thanh Huyen Dao and GunillaKrantz. 2006. Health Cooperation at theCrossroads: More of the Same orMaking Difference: Vietnam-SwedenHealth Cooperation on Health Policyand Systems Development 2001-2005.SIDA, Stockholm.
van de Walle, Dominique. 2004. TestingVietnam’s Public Safety Net. Journal ofComparative Economics, 32(4):661-679.
van de Walle, Dominique and DileniGunewardena. 2000. Sources of EthnicInequality in Vietnam. World BankPolicy Research Working Paper no.2297. World Bank, Washington, DC.
van de Walle, Dominique and Ren Mu. 2007.Fungibility and the Flypaper Effect ofProject Aid: Micro-evidence forVietnam. Journal of DevelopmentEconomics, 84(2):667-685.
van Doorslaer, Eddy and others. 2006. Effect ofPayments for Health Care on PovertyEstimates in 11 Countries in Asia: AnAnalysis of Household Survey Data. TheLancet, 368(9544):1357-1367.
VASS (Vietnamese Academy of SocialSciences). 2007. Vietnam PovertyUpdate Report 2006: Poverty andPoverty Reduction in Vietnam 1993-2004. National Political Publishers,Hanoi.
Vittas, Dimitri, Gregorio Impavido and RonanO’Connor. 2007. Upgrading theInvestment Policy Framework of PublicPension Funds. World Bank,Washington, DC.
VNCI (Vietnam Competitiveness Initiative) andVCCI (Vietnam Chamber of Commerceand Industry). 2007. The VietnamProvincial Competitiveness Index 2007:Measuring Economic Governance forPrivate Sector Development. VNCIPolicy Paper No. 12. With Contributionby The Asia Foundation (TAF) andDevelopment Alternatives Inc. (DAI),Hanoi.
Vo, Thi Kieu and Wendy Poussard. 2006. Who isat Risk? An Analysis of Deaths Causedby Natural Disasters in Quang NgaiProvince from 1999 To 2005. AusAID,Hanoi. Processed.
Wagstaff, Adam. 2005a. Decomposing Changesin Income Inequality into Vertical andHorizontal Redistribution andReranking, with Applications to Chinaand Vietnam. World Bank PolicyResearch Working Paper No. 3559.World Bank, Washington, DC.
Wagstaff, Adam. 2005b. InequalityDecomposition and GeographicTargeting with Applications to China andVietnam. Health Economics, 14(6):649-653.
Wagstaff, Adam. 2007a. The EconomicConsequences of Health Shocks:Evidence from Vietnam. Journal ofHealth Economics, 26(1):82-100.
Wagstaff, Adam. 2007b. Health Insurance forthe Poor: Initial Impacts of Vietnam’sHealth Care Fund for the Poor. WorldBank Policy Research Working Paperno. 4134. World Bank, Washington D.C.
Wagstaff, Adam. 2007c. Social HealthInsurance Reexamined. World BankPolicy Research Working Paper No.4111. World Bank, Washington, DC.
Wagstaff, Adam and Menno Pradhan. 2005.Health Insurance Impacts on Health andNon-Medical Consumption in aDeveloping Country. World Bank PolicyResearch Working Paper no. 3563.World Bank, Washington D.C.
BIBLIOGRAPHY
139
Wagstaff, Adam and Eddy van Doorslaer. 2001.Paying for Health Care: QuantifyingFairness, Catastrophe, andImpoverishment, With Applications toVietnam, 1993-98. World Bank PolicyResearch Working Paper No. 2715.World Bank, Washington, DC.
Wagstaff, Adam, Eddy van Doorslaer andNaoko Watanabe. 2001. OnDecomposing the Causes of HealthSector Inequalities With An Applicationto Malnutrition Inequalities in Vietnam.World Bank Policy Research WorkingPaper no. 2714. World Bank,Washington, DC.
Waldman, Linda and others. 2005.Environment, Politics, and Poverty:Lessons from a Review of PRSPStakeholder Perspectives: SynthesisReview. Study Initiated under thePoverty Environment Partnership (PEP),and jointly funded and managed by theCanadian International DevelopmentAgency (CIDA), Department forInternational Development (DFID) ofthe United Kingdom, and GermanTechnical Cooperation Agency (GTZ).Institute of Development Studies,London.
Waseem, Saba and Carmen de Paz Nieves.2006. Social Protection in Vietnam:Background Note. World Bank, Hanoi.Processed.
WHO (World Health Organization). 1998. CHD(Child Health and Development)1996–1997 Report. WHO, Geneva.
WHO (World Health Organization). 2003.Health and Ethnic Minorities in VietNam. WHO, Hanoi.
WHO (World Health Organization). 2005a.Maternal Mortality in Viet Nam 2000-2001: An In-Depth Analysis of Causesand Determinants. WHO, Geneva.
WHO (World Health Organization). 2005b.Strategy on health care financing forcountries of the Western Pacific and
South-East Asia Regions (2006-2010).WHO, Geneva.
World Bank. 2003. Vietnam DevelopmentReport 2004: Poverty. World Bank,Hanoi.
World Bank. 2004. Vietnam DevelopmentReport 2005: Governance. World Bank,Hanoi.
World Bank. 2005a. Comments on the Draft ofthe New Social Security Law. WorldBank, Hanoi. Processed.
World Bank. 2005b. Health Analysis 2004 -VHLSS 2004. World Bank, Hanoi.Processed.
World Bank. 2005c. Vietnam DevelopmentReport 2006: Business. World Bank,Hanoi.
World Bank. 2006a. Accelerating Vietnam’sRural Development: Growth, Equity andDeversification. World Bank, Hanoi.
World Bank. 2006b. Explaining Ethnic MinorityPoverty in Vietnam: a Summary ofRecent Trends and Current Challenges.World Bank, Hanoi. Processed.
World Bank. 2006c. Social Protection inVietnam: Background Note. World Bank,Hanoi. Processed.
World Bank. 2006d. Urban DevelopmentStrategy: Meeting the Challenges ofRapid Urbanization and the Transition toa Market Oriented Economy. Vietnam’sInfrastructure Challenge. World Bank,Hanoi.
World Bank. 2006e. Vietnam DevelopmentReport 2007: Aiming High. World Bank,Hanoi.
World Bank. 2006f. Water Supply andSanitation Strategy: Building on a SolidFoundation. Vietnam’s InfrastructureChallenge. World Bank, Hanoi.
World Bank. 2007a. Vietnam - First Program135 Second Phase Support Operation forCommunes: Facing Extreme Hardship inEthnic Minority and Mountainous Areas.
SOCIAL PROTECTION
140

BIBLIOGRAPHY
141
World Bank, Washington D.C.
World Bank. 2007b. Vietnam: Higher Educationand Skills for Growth: Draft. Hanoi.Processed.
World Bank. 2007c. Vietnam Interim HealthSector Issues Note. World Bank, Hanoi.Processed.
World Bank. Forthcoming-a. Country SocialAnalysis: Ethnicity and Development inVietnam. World Bank, Hanoi.
World Bank. Forthcoming-b. Tax Policy Study:Work in Progress. Hanoi. Processed.
WPI (World Perspectives, Incorporated). 2007.Developing Agricultural Insurance inVietnam: Phase I Final Report for Asian
Development Bank TA 4480 VIE. Hanoi.Processed.
Xu, Ke and others. 2003. Householdcatastrophic health expenditure: Amulticountry analysis. The Lancet,362(9378):111-117.
Zezulin, Lena S. and Jean-Noel Martineau.2003. Financial Markets DevelopmentProgram and the Social Security System:Report Presented to Asian DevelopmentBank under T.A. No. 3147-VIE. AsianDevelopment Bank, Hanoi. Processed.
Zhang, H. X. and others. 2006. Migration in aTransitional Economy: Beyond thePlanned and Spontaneous Dichotomy inVietnam. Geoforum, 37(6):1066-1081.

STATISTICALAPPENDIX

Population and EmploymentTable 1.1 PopulationTable 1.2 Population by localityTable 1.3 Total employment by sectors
National AccountTable 2.1 GDP by industrial origin and by economic sector in current pricesTable 2.2 A GDP by industrial origin and by economic sector in constant pricesTable 2.2 B GDP by industrial origin -- growth rateTable 2.3 A GDP deflatorTable 2.3 B Change in GDP deflatorTable 2.4 National accounts: sources and uses
Balance of PaymentsTable 3.1 Balance of paymentsTable 3.2 Merchandise exports by commoditiesTable 3.3 Merchandise imports by commodities
Monetary SurveyTable 4.1 Monetary survey
BudgetTable 5.1 State budget revenues (VND billdion)Table 5.2 State budget revenues (share of GDP) Table 5.3 State budget expenditures (VND billion)Table 5.4 State budget expenditures (share of GDP)Table 5.5 External Debt
PricesTable 6.1 A Monthly change in consumer retail pricesTable 6.1 B Monthly comsumer price indexTable 6.2 A Price index by commodity groups (monthly change)Table 6.2 B Price index by commodity groups: monthly growth rates (December 2005 = 100)
AgricultureTable 7.1 Agriculture production in current priceTable 7.2 Agriculture production in constant priceTable 7.3 Industrial crop production and yields
IndustryTable 8.1 Industrial production outputTable 8.2 Major industrial products
STATISTICAL APPENDIX

Population GrowthYear (mid-year) Rate Male Female Urban Rural
1976 49,160 2.35 23,597 25,563 10,127 39,0331977 50,237 2.19 24,197 26,039 10,116 40,1141978 51,337 2.19 24,813 26,524 10,105 41,2261979 52,462 2.19 25,444 27,018 10,094 42,3681980 53,630 2.23 26,047 27,583 10,295 43,3351981 54,824 2.23 26,665 28,159 10,499 44,3241982 56,045 2.23 27,297 28,747 10,708 45,3361983 57,292 2.23 27,944 29,348 10,921 46,3711984 58,568 2.23 28,607 29,961 11,138 47,4291985 59,872 2.23 29,285 30,587 11,360 48,5121986 61,109 2.07 29,912 31,197 11,817 49,2921987 62,452 2.20 30,611 31,841 12,271 50,1811988 63,727 2.04 31,450 32,277 12,662 51,0651989 64,774 1.64 31,589 33,185 12,919 50,801 1990 66,017 1.92 32,203 33,814 12,880 53,136 1991 67,242 1.86 32,814 34,428 13,228 54,015 1992 68,450 1.80 33,242 35,208 13,588 54,863 1993 69,645 1.74 34,028 35,616 13,961 55,683 1994 70,825 1.69 34,633 36,191 14,426 56,399 1995 71,996 1.65 35,237 36,758 16,938 55,057 1996 73,157 1.61 35,857 37,299 15,420 57,737 1997 74,037 1.20 36,473 37,564 16,835 57,202 1998 75,456 1.92 37,090 38,367 17,465 57,992 1999 76,597 1.51 37,662 38,935 18,082 58,515 2000 77,635 1.36 38,166 39,469 18,805 58,830 2001 78,686 1.35 38,684 40,002 19,481 59,205 2002 79,727 1.32 39,197 40,530 20,004 59,723 2003 80,902 1.47 39,755 41,147 20,870 60,033 2004 82,032 1.40 40,311 41,721 21,737 60,295 2005 83,106 1.31 40,846 42,260 22,337 60,770 2006 84,156 1.26 41,355 42,801 22,824 61,332
Note : Population by sex and by area may not add to the total due to the possible exclusion of the armed force and migrant workersSource : GSO (2007)
Table 1.1: POPULATION
By area By sex
(thousand persons)

TotalProvinces/ Cities Male Female Urban Rural
Ha Noi 3,217 1,612 1,604 2,102 1,115Hai Phong 1,803 891 912 826 978Ha Giang 684 338 345 76 608Tuyen Quang 732 363 370 69 664Cao Bang 519 255 264 70 449Lang Son 746 371 375 150 596Lai Chau 320 161 159 50 270Dien bien 459 231 229 77 382Lao Cai 586 393 193 108 478Yen Bai 741 367 374 147 594Bac Can 302 151 151 45 256Thai nguyen 1,127 563 564 257 870Son La 1,008 507 501 110 897Hoa Binh 820 409 412 126 694Vinh Phuc 1,180 572 609 165 1,015Phu Tho 1,337 657 680 210 1,127Bac ninh 1,010 492 518 133 877Bac Giang 1,594 788 806 147 1,448Quang Ninh 1,091 553 539 509 582Ha Tay 2,544 1,226 1,318 261 2,282Hai Duong 1,723 835 888 268 1,454Hung Yen 1,143 553 590 127 1,016Thai Binh 1,865 896 969 136 1,730Nam Dinh 1,974 963 1,011 309 1,666Ha Nam 827 400 426 80 747Ninh Binh 923 450 473 141 781Thanh Hoa 3,680 1,803 1,878 360 3,320Nghe An 3,064 1,503 1,562 326 2,739Ha Tinh 1,306 649 658 144 1,162Quang Binh 848 419 429 119 729Quang Tri 626 309 316 154 472Thua Thien - Hue 1,144 562 582 360 784Quang Nam 1,473 713 760 252 1,221Da Nang 789 381 407 680 109Quang Ngai 1,296 629 667 186 1,110Binh Dinh 1,566 763 803 394 1,172Phu Yen 873 433 440 183 690Khanh Hoa 1,135 564 572 453 682Ninh Thuan 568 281 287 185 383Binh Thuan 1,163 580 583 437 726Gia Lai 1,162 591 570 350 812Kon Tum 383 192 191 134 249Dac Lac 1,738 876 861 389 1,349Dac Nong 407 202 205 53 355Lam Dong 1,179 590 589 443 736Ho Chi Minh City 6,106 2,946 3,160 5,245 861Binh Duong 964 462 502 282 682Tay Ninh 1,047 515 532 178 869Binh Phuoc 810 411 398 123 686Dong Nai 2,215 1,099 1,116 686 1,529Baria - Vung Tau 926 464 462 414 513Long An 1,423 700 723 236 1,188Dong Thap 1,668 814 854 252 1,416An Giang 2,210 1,087 1,124 621 1,590Tien Giang 1,717 834 884 256 1,461Ben Tre 1,353 657 696 132 1,221Vinh Long 1,057 514 543 158 899Tra Vinh 1,037 505 532 150 887Can Tho 1,140 561 579 572 568Hau giang 797 392 405 124 673Soc Trang 1,276 622 654 235 1,041Kien Giang 1,685 831 854 405 1,279Bac Lieu 820 399 421 209 611Ca Mau 1,232 608 624 248 984
Note : Population by sex and by area may not add to the total due to the possible exclusion of the armed force and migrant workers.Source : GSO (2007)
Table 1.2: POPULATION BY SEX AND LOCALITY IN 2006(thousand persons)
By sex By locality

Rev Rev Prel2000 2001 2002 2003 2004 2005 2006
Total Employment 37,610 38,563 39,508 40,574 41,586 42,527 43,347 State 3,501 3,604 3,751 4,035 4,142 4,039 4,008 Non-state 34,109 34,959 35,757 36,538 37,445 38,488 39,339
State Sector Employment 3,501 3,604 3,751 4,035 4,142 4,039 4,008Central 1,442 1,499 1,569 1,628 1,678 1,613 1,572Local 2,059 2,105 2,181 2,407 2,464 2,426 2,435
Employment by Sector Agriculture, forestry and fisheries 24,481 24,468 24,456 24,443 24,431 24,342 24,123 Industry and Construction 4,930 5,552 6,085 6,671 7,217 7,782 8,280 Services 8,199 8,542 8,967 9,460 9,939 10,402 10,945
Note : Figures are roundedSource : GSO (2007)
Table 1.3: TOTAL EMPLOYMENT BY SECTOR(thousand of persons)
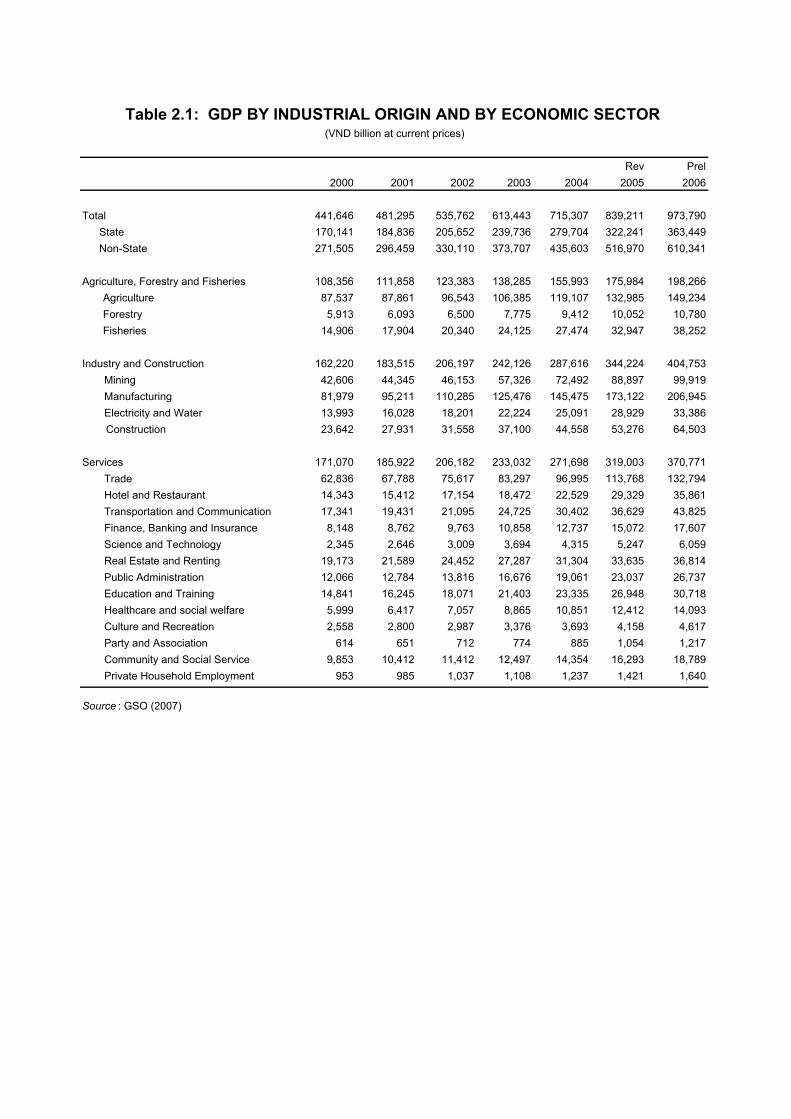
Rev Prel2000 2001 2002 2003 2004 2005 2006
Total 441,646 481,295 535,762 613,443 715,307 839,211 973,790 State 170,141 184,836 205,652 239,736 279,704 322,241 363,449 Non-State 271,505 296,459 330,110 373,707 435,603 516,970 610,341
Agriculture, Forestry and Fisheries 108,356 111,858 123,383 138,285 155,993 175,984 198,266 Agriculture 87,537 87,861 96,543 106,385 119,107 132,985 149,234 Forestry 5,913 6,093 6,500 7,775 9,412 10,052 10,780 Fisheries 14,906 17,904 20,340 24,125 27,474 32,947 38,252
Industry and Construction 162,220 183,515 206,197 242,126 287,616 344,224 404,753Mining 42,606 44,345 46,153 57,326 72,492 88,897 99,919Manufacturing 81,979 95,211 110,285 125,476 145,475 173,122 206,945Electricity and Water 13,993 16,028 18,201 22,224 25,091 28,929 33,386
Construction 23,642 27,931 31,558 37,100 44,558 53,276 64,503
Services 171,070 185,922 206,182 233,032 271,698 319,003 370,771Trade 62,836 67,788 75,617 83,297 96,995 113,768 132,794Hotel and Restaurant 14,343 15,412 17,154 18,472 22,529 29,329 35,861Transportation and Communication 17,341 19,431 21,095 24,725 30,402 36,629 43,825Finance, Banking and Insurance 8,148 8,762 9,763 10,858 12,737 15,072 17,607Science and Technology 2,345 2,646 3,009 3,694 4,315 5,247 6,059Real Estate and Renting 19,173 21,589 24,452 27,287 31,304 33,635 36,814Public Administration 12,066 12,784 13,816 16,676 19,061 23,037 26,737Education and Training 14,841 16,245 18,071 21,403 23,335 26,948 30,718Healthcare and social welfare 5,999 6,417 7,057 8,865 10,851 12,412 14,093Culture and Recreation 2,558 2,800 2,987 3,376 3,693 4,158 4,617Party and Association 614 651 712 774 885 1,054 1,217Community and Social Service 9,853 10,412 11,412 12,497 14,354 16,293 18,789Private Household Employment 953 985 1,037 1,108 1,237 1,421 1,640
Source : GSO (2007)
Table 2.1: GDP BY INDUSTRIAL ORIGIN AND BY ECONOMIC SECTOR (VND billion at current prices)

Rev Prel2000 2001 2002 2003 2004 2005 2006
Total 273,666 292,535 313,247 336,242 362,435 393,031 425,135 State 111,522 119,824 128,343 138,160 148,865 159,836 170,001 Non-State 162,144 172,711 184,904 198,082 213,570 233,195 255,134
Agriculture, Forestry and Fisheries 63,717 65,618 68,352 70,827 73,917 76,888 79,505 Agriculture 54,493 55,613 57,912 59,761 62,107 64,072 65,892 Forestry 2,544 2,556 2,568 2,589 2,610 2,635 2,665 Fisheries 6,680 7,449 7,872 8,477 9,200 10,181 10,948
Industry and Construction 96,913 106,986 117,126 129,399 142,621 157,867 174,239Mining 18,430 19,185 19,396 20,611 22,437 22,854 23,037Manufacturing 51,492 57,335 63,983 71,363 79,116 89,338 100,396Electricity and Water 6,337 7,173 7,992 8,944 10,015 11,247 12,574
Construction 20,654 23,293 25,755 28,481 31,053 34,428 38,232
Services 113,036 119,931 127,769 136,016 145,897 158,276 171,391Trade 44,644 47,779 51,245 54,747 59,027 63,950 69,418Hotel and Restaurant 8,863 9,458 10,125 10,646 11,511 13,472 15,145Transportation and Telecom 10,729 11,441 12,252 12,925 13,975 15,318 16,870Finance, Banking and Insurance 5,650 6,005 6,424 6,935 7,495 8,197 8,867Science and Technology 1,571 1,749 1,909 2,044 2,196 2,368 2,543Real Estate and Renting 12,231 12,631 13,106 13,796 14,396 14,816 15,252Public Administration 8,021 8,439 8,768 9,228 9,773 10,477 11,270Education and Training 9,162 9,687 10,475 11,260 12,125 13,127 14,231Healthcare and social welfare 3,946 4,151 4,464 4,853 5,234 5,640 6,082Culture and Recreation 1,601 1,648 1,706 1,857 1,997 2,163 2,329Party and Association 317 334 353 372 395 423 454Community and Social Service 5,734 6,026 6,353 6,743 7,141 7,655 8,210Private Household Employment 567 583 589 610 632 670 720
Source : GSO (2007)
(VND billion at constant 1994 prices)Table 2.2: GDP BY INDUSTRIAL ORIGIN AND BY ECONOMIC SECTOR

Rev Prel2000 2001 2002 2003 2004 2005 2006
Total 6.8 6.9 7.1 7.3 7.8 8.4 8.2 State 7.7 7.4 7.1 7.6 7.7 7.4 6.4 Non-State 6.2 6.5 7.1 7.1 7.8 9.2 9.4
Agriculture, Forestry and Fisheries 4.6 3.0 4.2 3.6 4.4 4.0 3.4 Agriculture 4.0 2.1 4.1 3.2 3.9 3.2 2.8 Forestry 0.4 0.5 0.5 0.8 0.8 1.0 1.1 Fisheries 11.6 11.5 5.7 7.7 8.5 10.7 7.5
Industry and Construction 10.1 10.4 9.5 10.5 10.2 10.7 10.4Mining 7.2 4.1 1.1 6.3 8.9 1.9 0.8Manufacturing 11.7 11.3 11.6 11.5 10.9 12.9 12.4Electricity and Water 14.6 13.2 11.4 11.9 12.0 12.3 11.8
Construction 7.5 12.8 10.6 10.6 9.0 10.9 11.0
Services 5.3 6.1 6.5 6.5 7.3 8.5 8.3Trade 6.3 7.0 7.3 6.8 7.8 8.3 8.6Hotel and Restaurant 4.1 6.7 7.1 5.1 8.1 17.0 12.4Transportation and Telecom 5.8 6.6 7.1 5.5 8.1 9.6 10.1Finance, Banking and Insurance 6.1 6.3 7.0 8.0 8.1 9.4 8.2Science and Technology 24.0 11.3 9.1 7.1 7.4 7.8 7.4Real Estate and Renting 2.6 3.3 3.8 5.3 4.3 2.9 2.9Public Administration 3.9 5.2 3.9 5.2 5.9 7.2 7.6Education and Training 4.0 5.7 8.1 7.5 7.7 8.3 8.4Healthcare and social welfare 6.4 5.2 7.5 8.7 7.9 7.8 7.8Culture and Recreation 6.4 2.9 3.5 8.9 7.5 8.3 7.7Party and Association 5.7 5.4 5.7 5.4 6.2 7.1 7.3Community and Social Service 3.1 5.1 5.4 6.1 5.9 7.2 7.3Private Household Employment 3.1 2.8 1.0 3.6 3.6 6.0 7.5
Source : GSO (2007)
Table 2.2B: GDP BY INDUSTRIAL ORIGIN -- GROWTH RATE(in percent)

Rev Prel2000 2001 2002 2003 2004 2005 2006
Total 1.6 1.6 1.7 1.8 2.0 2.1 2.3 State 1.5 1.5 1.6 1.7 1.9 2.0 2.1 Non-State 1.7 1.7 1.8 1.9 2.0 2.2 2.4
Agriculture, Forestry and Fisheries 1.7 1.7 1.8 2.0 2.1 2.3 2.5 Agriculture 1.6 1.6 1.7 1.8 1.9 2.1 2.3 Forestry 2.3 2.4 2.5 3.0 3.6 3.8 4.0 Fisheries 2.2 2.4 2.6 2.8 3.0 3.2 3.5
Industry and Construction 1.7 1.7 1.8 1.9 2.0 2.2 2.3Mining 2.3 2.3 2.4 2.8 3.2 3.9 4.3Manufacturing 1.6 1.7 1.7 1.8 1.8 1.9 2.1Electricity and Water 2.2 2.2 2.3 2.5 2.5 2.6 2.7
Construction 1.1 1.2 1.2 1.3 1.4 1.5 1.7
Services 1.5 1.6 1.6 1.7 1.9 2.0 2.0Trade 1.4 1.4 1.5 1.5 1.6 1.8 1.9Hotel and Restaurant 1.6 1.6 1.7 1.7 2.0 2.2 2.4Transportation and Telecom 1.6 1.7 1.7 1.9 2.2 2.4 2.6Finance, Banking and Insurance 1.4 1.5 1.5 1.6 1.7 1.8 2.0Science and Technology 1.5 1.5 1.6 1.8 2.0 2.2 2.4Real Estate and Renting 1.6 1.7 1.9 2.0 2.2 2.3 2.4Public Administration 1.5 1.5 1.6 1.8 2.0 2.2 2.4Education and Training 1.6 1.7 1.7 1.9 1.9 2.1 2.2Healthcare and social welfare 1.5 1.5 1.6 1.8 2.1 2.2 2.3Culture and Recreation 1.6 1.7 1.8 1.8 1.8 1.9 2.0Party and Association 1.9 1.9 2.0 2.1 2.2 2.5 2.7Community and Social Service 1.7 1.7 1.8 1.9 2.0 2.1 2.3Private Household Employment 1.7 1.7 1.8 1.8 2.0 2.1 2.3
Source : GSO (2007)
Table 2.3A: GDP DEFLATOR

Rev Prel2000 2001 2002 2003 2004 2005 2006
Total 3.4 1.9 4.0 6.7 8.2 8.2 7.3 State 2.0 1.1 3.9 8.3 8.3 7.3 6.0 Non-State 4.4 2.5 4.0 5.7 8.1 8.7 7.9
Agriculture, Forestry and Fisheries 1.8 0.2 5.9 8.2 8.1 8.5 9.0 Agriculture 1.0 -1.7 5.5 6.8 7.7 8.2 9.1 Forestry 2.7 2.6 6.2 18.6 20.1 5.8 6.0 Fisheries
Industry and Construction 6.8 2.5 2.6 6.3 7.8 8.1 6.5Mining 18.0 0.0 2.9 16.9 16.2 20.4 11.5Manufacturing 3.7 4.3 3.8 2.0 4.6 5.4 6.4Electricity and Water 4.2 1.2 1.9 9.1 0.8 2.7 3.2
Construction 1.0 4.8 2.2 6.3 10.2 7.8 9.0
Services 1.4 2.4 4.1 6.2 8.7 7.4 0.0Trade -0.5 0.8 4.0 3.1 8.0 8.3 7.5Hotel and Restaurant 2.8 0.7 4.0 2.4 12.8 11.2 8.8Transportation and Telecom 5.4 5.1 1.4 11.1 13.7 9.9 8.6Finance, Banking and Insurance 2.6 1.2 4.2 3.0 8.5 8.2 8.0Science and Technology -0.6 1.4 4.2 14.7 8.7 12.8 7.5Real Estate and Renting 2.4 9.0 9.2 6.0 9.9 4.4 6.3Public Administration -0.6 0.7 4.0 14.7 7.9 12.7 7.9Education and Training 1.9 3.5 2.9 10.2 1.2 6.7 5.1Healthcare and social welfare 4.3 1.7 2.3 15.6 13.5 6.2 5.3Culture and Recreation 1.1 6.3 3.1 3.8 1.7 4.0 3.1Party and Association -0.5 0.6 3.5 3.2 7.7 11.2 7.6Community and Social Service 2.6 0.6 4.0 3.2 8.5 5.9 7.5Private Household Employment 3.3 0.5 4.2 3.2 7.8 8.4 7.4
Source : GSO (2007)
Table 2.3B: CHANGE IN GDP DEFLATOR (in percent)

Rev Prel2000 2001 2002 2003 2004 2005 2006
Sources 452,524 492,277 563,446 664,671 769,307 874,299 1,006,261 GDP 441,646 481,295 535,762 613,443 715,307 839,211 973,790 Trade Balance 10,878 10,982 27,684 51,228 54,000 35,088 32,471
Uses 452,524 492,277 563,446 664,731 769,307 874,299 1,006,261 Total Consumption 321,853 342,607 382,137 445,221 511,221 584,793 668,540 Gross Capital Formation 130,771 150,033 177,983 217,434 253,686 298,543 347,900 Statistical Discrepancy -100 -363 3,326 2,076 4,400 -9,037 -10,179
Source : GSO (2007)
Rev Prel2000 2001 2002 2003 2004 2005 2006
Sources 283,751 304,230 334,640 367,691 392,558 417,469 449,966 GDP 273,666 292,535 313,247 336,243 362,435 393,031 425,135 Trade Balance 10,085 11,695 21,393 31,448 30,123 24,438 24,831
Uses 283,751 304,232 334,640 367,691 392,558 417,469 449,966 Total Consumption 200,665 210,029 225,610 243,515 260,940 280,104 301,382 Gross Capital Formation 83,496 92,487 104,256 116,623 128,916 143,291 156,645 Statistical Discrepancy -410 1,716 4,774 7,553 2,702 -5,926 -8,061
Source : GSO (2007)
Table 2.4A: NATIONAL ACCOUNTS: SOURCES AND USES (VND billion at current prices)
Table 2.4B: NATIONAL ACCOUNTS: SOURCES AND USES (VND billion at constant 1994 prices)

Rev Est2000 2001 2002 2003 2004 2005 2006
Exports (fob) 14,449 15,027 16,706 20,150 26,485 32,447 39,826
Imports (fob) 14,071 14,546 17,760 22,730 28,772 34,886 42,602
Trade Balance 378 481 -1,054 -2,580 -2,287 -2,439 -2,776
Non-Factor Services -615 -572 -750 -780 -870 -220 -8
Services (net) -595 -635 -790 -815 -890 -1,220 -1,430
Transfers (net) 1,476 1,250 1,920 2,240 2,485 3,380 4,050 - Official Transfers 136 150 150 140 175 230 250 - Private Transfers (net) 1,340 1,100 1,770 2,100 2,310 3,150 3,800
Current Account Balance (incl. Grants) 644 524 -674 -1,940 -1,565 -500 -165
Capital Account -525 -330 1,137 4,017 2,448 2,628 4,486
Medium and Long-Term 730 625 520 974 1,396 1,360 1,140 - Disbursements 1,410 990 1,100 1,540 1,920 1,915 1,690
ODA Loans 1,360 960 1,070 1,260 1,395 1,430 1,380 Non-concessional LT Borrowing 50 30 30 280 525 485 310
- Amortizations 680 365 580 566 524 555 550
Portfolio investment 865 1,315
Short-Term (net) (1) -1,755 -1,380 -993 1,738 -293 -1,030 276
Direct investment 1,100 1,245 2,025 1,895 1,880 1,960 2,400
FDI loan repayments 600 820 415 590 535 525 645
Overall Balance 119 194 463 2,077 883 2,131 4,321
Financing -119 -194 -463 -2,077 -883 -2,131 -4,321
Memo item:Current account as % of GDP 0.0 0.0 0.0 57.5 63.2 -0.9 -0.3
Note : Figures are rounded (1) Including errors and omissionsSource : SBV, World Bank and IMF
Table 3.1: BALANCE OF PAYMENTS(US$ million, unless otherwise indicated)

Prel2000 2001 2002 2003 2004 2005 2006
Total Exports 14,448 15,027 16,706 20,176 26,485 32,442 39,826
Rice 667 625 726 721 950 1,047 1,276 Quantity (000 tons) 3,477 3,729 3,241 3,813 4,060 5,250 4,643 Average Unit Value (US$/ton) 192 168 224 189 234 199 275
Crude oil 3,503 3,126 3,270 3,812 5,671 7,373 8,265 Quantity (000 tons) 15,424 16,732 16,879 17,143 19,501 17,967 16,419 Average Unit Value (US$/ton) 227 187 194 222 291 410 503
Coal 94 113 156 184 355 669 915 Quantity (000 tons) 3,251 4,290 6,049 7,246 11,624 17,986 29,307 Average Unit Value (US$/ton) 29 26 26 25 31 37 31
Rubber 166 166 268 378 641 804 1,286 Quantity (000 tons) 273 308 449 433 975 587 708 Average Unit Value (US$/ton) 607 539 597 872 658 1,370 1,817
Tea 70 78 83 60 96 97 110 Quantity (000 tons) 56 68 75 60 99 88 106 Average Unit Value (US$/ton) 1,250 1,150 1,103 1,002 961 1,103 1,045
Coffee 501 391 322 505 641 735 1,217 Quantity (000 tons) 734 931 719 749 975 892 981 Average Unit Value (US$/ton) 683 420 449 674 658 824 1,241
Cashew Nut 167 152 209 284 436 502 504 Quantity (000 tons) 34 44 62 84 105 109 127 Average Unit Value (US$/ton) 4,892 3,474 3,358 3,390 4,150 4,610 3,973
Black Pepper 146 91 107 105 152 150 190 Quantity (000 tons) 37 57 77 74 112 109 117 Average Unit Value (US$/ton) 3,943 1,601 1,399 1,416 1,362 1,381 1,632
Marine Products 1,479 1,778 2,023 2,200 2,401 2,739 3,358Vegetable & Fruits 214 330 201 151 179 235 259Textiles and Garments 1,892 1,975 2,752 3,687 4,386 4,838 5,834Footwear 1,465 1,559 1,867 2,268 2,692 3,040 3,592Handicraft 237 235 331 367 426 569 630Wood products 294 335 435 567 1,139 1,563 1,933Electronic and Computer parts 788 709 605 855 1,075 1,427 1,708Electric cables and wires 130 154 188 292 389 523 705Plastic products 100 134 153 154 261 350 480
Source : GSO (2007)
Table 3.2: MAJOR EXPORTS BY COMMODITY(US$ million)

Prel2000 2001 2002 2003 2004 2005 2006
Total Imports 15,637 16,162 19,733 25,227 31,954 36,978 44,891
Petroleum products 2,058 1,828 2,017 2,433 3,574 5,024 5,970 Quantity (000 tons) 8,777 8,998 9,966 9,995 11,050 11,478 11,213 Average Unit Value (US$/ton) 234 203 202 243 323 438 532
Fertilizers 509 404 477 628 824 641 687 Quantity (000 tons) 3,973 3,189 3,824 4,119 4,079 2,877 3,189 Average Unit Value (US$/ton) 128 127 125 152 202 223 216
Steel and Irons 812 965 1,334 1,657 2,573 2,931 2,936 Quantity (000 tons) 2,868 3,938 4,951 4,574 5,186 5,524 5,707 Average Unit Value (US$/ton) 283 245 269 362 496 531 515
OthersMachinery and Equipment 2,571 2,741 3,793 5,359 5,249 5,281 6,628Textile fiber and yarn 231 247 314 298 339 340 544Cotton 101 132 97 106 190 167 219Material for garment & footwear 1,422 1,590 1,711 2,034 2,253 2,282 1,951Motor vehicles and pats 238 433 604 834 904 1,193 672Motorbikes 787 670 422 329 452 541 557Pharmaceutical material 62 69 83 76 100 116 133Medicine 325 296 320 374 410 502 548Paper of all kinds 142 159 193 230 248 362 475Chemicals 307 352 406 510 683 865 1,042Chemical products 304 361 482 582 706 841 1,007Plastic materials 480 495 617 785 1,191 1,456 1,866Computer and Electronic components 882 666 664 975 1,342 1,706 2,048Wood - sawn and log 158 163 179 274 539 651 775Milk and dairy products 141 247 122 164 206 311 321Animal feed and materials 159 179 234 421 475 594 737
Source : GSO (2007)
Table 3.3: MAJOR IMPORTS BY COMMODITY(US$ million)

ACCOUNT Rev Prel2000 2001 2002 2003 2004 2005 2006
Net Foreign Assets 95.7 117.6 117.4 131.4 145.8 191.1 287.9 Foreign assets 112.7 135.9 135.9 150.5 172.3 220.5 327.0 Foreign liabilities -17.0 -18.3 -18.4 -19.1 -26.4 -29.4 -39.1
Net Domestic Assets 127.2 162.2 211.7 279.8 390.3 499.6 634.7Domestic credit 155.2 191.2 239.9 316.9 435.2 585.6 730.3 Net claims on government -0.5 2.1 8.8 20.1 14.9 32.5 36.5 Credit to the economy 155.7 189.1 231.1 296.7 420.3 553.1 693.8
Claims on state enterprises 69.9 79.7 89.5 105.4 142.9 181.3 218.5 Claims on other sectors 85.8 109.4 141.6 191.3 277.4 371.8 475.3
Other items, net -28.0 -29.0 -28.2 -37.0 -44.9 -86.0 -95.6
Broad money (M2) 222.9 279.8 329.1 411.2 536.2 690.7 922.7of which: total deposit 170.7 213.5 254.9 320.6 427.1 559.5 763.9 Dong liquidity 152.5 191.1 235.5 314.1 408.1 531.5 723.2 Currency outside banks 52.2 66.3 74.3 90.6 109.1 131.2 158.8 Deposits 100.3 124.8 161.2 223.6 299.0 400.3 564.4 Foreign currency deposits 70.4 88.7 93.6 97.1 128.1 159.2 199.5
Net Foreign Assets 56.4 22.9 -0.2 11.9 11.0 31.0 50.7Net Domestic Assets 28.2 27.5 30.5 32.2 39.5 28.0 27.0
Domestic credit 34.1 23.2 25.5 32.1 37.4 34.5 24.7 Credit to the economy 38.2 21.5 22.2 28.4 41.7 31.6 25.4
Claims on state enterprises 28.7 14.0 12.3 17.8 35.6 26.9 20.5 Claims on other sectors 46.9 27.5 29.4 35.1 45.0 34.0 27.8
Total liquidity 38.9 25.5 17.6 25.0 30.4 28.8 33.6of which: total deposits 43.3 25.1 19.4 25.8 33.2 31.0 36.5 Dong liquidity 30.7 25.3 23.2 33.4 29.9 30.2 36.1 Currency outside banks 26.1 27.0 12.0 22.0 20.4 20.2 21.1 Deposits 33.2 24.4 29.2 38.7 33.7 33.9 41.0 Foreign currency deposits 60.7 26.0 5.6 3.7 32.0 24.3 25.3
Note : Data from 1999 onwards comprise the SBV, six SOCBs and 83 non-state banksSource : SBV and IMF
Table 4.1: MONETARY SURVEY
(Annual change in percent )
(in VND trillion, end of period)

rev est2000 2001 2002 2003 2004 2005 2006
A Total revenues and grants 90,794 103,888 121,716 158,057 198,614 217,080 264,261
I Current revenues 87,928 100,918 118,346 145,823 180,197 199,953 244,043
II Taxes 79,497 91,688 106,154 127,948 155,579 188,119 230,5651 Corporate income tax 28,950 33,298 36,826 47,410 56,987 71,738 100,8202 Individual income tax 1,831 2,058 2,338 2,951 3,521 4,238 5,1813 Land and housing tax 366 330 336 359 438 514 5924 License tax 381 400 407 778 657 724 7945 Tax on the transfer of properties 934 1,191 1,332 1,817 2,607 2,797 3,3636 Tax on land use right transfer 213 298 327 408 640 985 1,2507 Value added tax 17,072 19,327 25,916 33,130 38,814 45,728 54,7738 Special consumption tax 5,250 6,229 7,272 8,851 12,773 15,702 17,1449 Natural resources tax 7,487 8,416 8,543 9,719 17,398 21,916 20,23210 Agricultural tax 1,776 814 772 151 130 132 12011 Export & import tax 13,437 17,458 21,915 22,374 21,614 23,645 26,29612 Other taxes 158 158 170
III Fees, charges and non-tax 8,431 9,230 12,192 17,875 24,618 11,834 13,47813 Revenue from discrepancy of import prices 131 116 168 133 40 1 014 Fees and charges (include gasoline fee) 4,950 5,120 6,016 6,483 7,765 7,055 8,00815 Rental of land 568 570 459 513 1,035 1,003 1,59616 Others 2,782 3,424 5,549 10,746 15,778 3,775 3,874
IV Capital revenues 838 959 1,120 9,265 15,540 14,785 16,600
VIII Grants 2,028 2,011 2,250 2,969 2,877 2,342 3,618
B Carry-over 3,400 2,145 19,353 26,162 7,030 8,510
Source : MOF
TABLE 5.1: STATE BUDGET REVENUES(VND billion)
final account
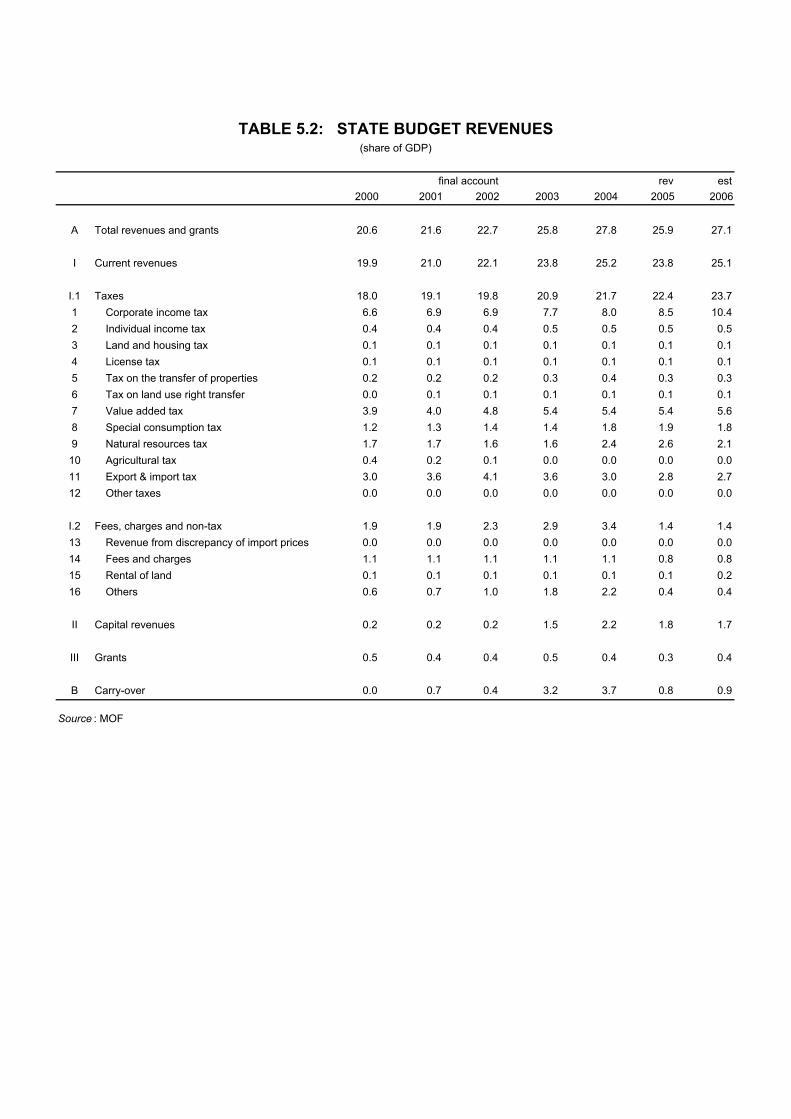
rev est2000 2001 2002 2003 2004 2005 2006
A Total revenues and grants 20.6 21.6 22.7 25.8 27.8 25.9 27.1
I Current revenues 19.9 21.0 22.1 23.8 25.2 23.8 25.1
I.1 Taxes 18.0 19.1 19.8 20.9 21.7 22.4 23.71 Corporate income tax 6.6 6.9 6.9 7.7 8.0 8.5 10.42 Individual income tax 0.4 0.4 0.4 0.5 0.5 0.5 0.53 Land and housing tax 0.1 0.1 0.1 0.1 0.1 0.1 0.14 License tax 0.1 0.1 0.1 0.1 0.1 0.1 0.15 Tax on the transfer of properties 0.2 0.2 0.2 0.3 0.4 0.3 0.36 Tax on land use right transfer 0.0 0.1 0.1 0.1 0.1 0.1 0.17 Value added tax 3.9 4.0 4.8 5.4 5.4 5.4 5.68 Special consumption tax 1.2 1.3 1.4 1.4 1.8 1.9 1.89 Natural resources tax 1.7 1.7 1.6 1.6 2.4 2.6 2.110 Agricultural tax 0.4 0.2 0.1 0.0 0.0 0.0 0.011 Export & import tax 3.0 3.6 4.1 3.6 3.0 2.8 2.712 Other taxes 0.0 0.0 0.0 0.0 0.0 0.0 0.0
I.2 Fees, charges and non-tax 1.9 1.9 2.3 2.9 3.4 1.4 1.413 Revenue from discrepancy of import prices 0.0 0.0 0.0 0.0 0.0 0.0 0.014 Fees and charges 1.1 1.1 1.1 1.1 1.1 0.8 0.815 Rental of land 0.1 0.1 0.1 0.1 0.1 0.1 0.216 Others 0.6 0.7 1.0 1.8 2.2 0.4 0.4
II Capital revenues 0.2 0.2 0.2 1.5 2.2 1.8 1.7
III Grants 0.5 0.4 0.4 0.5 0.4 0.3 0.4
B Carry-over 0.0 0.7 0.4 3.2 3.7 0.8 0.9
Source : MOF
final account
TABLE 5.2: STATE BUDGET REVENUES(share of GDP)

rev est2000 2001 2002 2003 2004 2005 2006
A Total expenditures 99,751 117,285 129,434 162,150 187,353 226,935 267,575
I Current expenditures 70,127 77,049 84,216 102,521 121,238 154,978 181,491
1 Administration expenditure 8,089 8,734 8,599 11,359 15,901 16,770 18,9942 Expenditure on economic affairs & services 5,796 6,288 7,987 8,164 10,301 12,843 15,0103 Social expenditures 30,694 37,369 40,747 50,185 55,185 77,312 91,409
3.1 Education 9,910 12,006 13,758 17,390 20,401 29,120 33,8223.2 Training 2,767 3,426 4,086 5,491 4,942 7,280 8,3763.3 Health 3,453 4,211 4,656 5,372 6,009 10,749 12,6853.4 Science, technology & environment 1,243 1,625 1,852 1,853 2,362 2,620 3,2353.5 Culture 919 921 1,066 1,258 1,584 1,718 2,0243.6 Radio and television 717 838 681 1,056 1,325 1,127 1,1403.7 Sports 387 483 586 648 883 675 9433.8 Population and family planning 559 434 841 666 397 410 5333.9 Social subsidies 10,739 13,425 13,221 16,451 17,282 23,613 28,6514 Interest payment 3,514 4,485 5,330 6,395 7,217 7,000 8,9135 Defence 13,058 14,409 18,463 22,8926 Public security 5,745 6,576 8,432 11,1507 Others 22,034 20,173 21,553 7,615 11,649 14,158 13,123
II Investment expenditure 29,624 40,236 45,218 59,629 66,115 71,957 86,084
1 Capital expenditure 26,211 36,139 40,740 54,430 61,746 66,799 81,7302 Others 3,413 4,097 4,478 5,199 4,369 5,158 4,354
B Carry-over 3,400 2,145 4,443 16,390 34,439 10,475 22,515
Source : MOF
Table 5.3: STATE BUDGET EXPENDITURES(VND billion)
final account

rev est2000 2001 2002 2003 2004 2005 2006
A Total expenditures 22.6 24.4 24.2 26.4 26.2 27.0 27.5
I Current expenditures 15.9 16.0 15.7 16.7 16.9 18.5 18.6
1 Administration expenditure 1.8 1.8 1.6 1.9 2.2 2.0 2.02 Expenditure on economic affairs & services 1.3 1.3 1.5 1.3 1.4 1.5 1.53 Social expenditures 6.9 7.8 7.6 8.2 7.7 9.2 9.4
3.1 Education 2.2 2.5 2.6 2.8 2.9 3.5 3.53.2 Training 0.6 0.7 0.8 0.9 0.7 0.9 0.93.3 Health 0.8 0.9 0.9 0.9 0.8 1.3 1.33.4 Science, technology & environment 0.3 0.3 0.3 0.3 0.3 0.3 0.33.5 Culture 0.2 0.2 0.2 0.2 0.2 0.2 0.23.6 Radio and television 0.2 0.2 0.1 0.2 0.2 0.1 0.13.7 Sports 0.1 0.1 0.1 0.1 0.1 0.1 0.13.8 Population and family planning 0.1 0.1 0.2 0.1 0.1 0.0 0.13.9 Social subsidies 2.4 2.8 2.5 2.7 2.4 2.8 2.94 Interest payment 0.8 0.9 1.0 1.0 1.0 0.8 0.95 Defence 2.1 2.0 2.2 2.46 Public security 0.9 0.9 1.0 1.17 Others (including salary increase in 2007) 5.0 4.2 4.0 1.2 1.6 1.7 1.3
II Investment expenditure 6.7 8.4 8.4 9.7 9.2 8.6 8.8
1 Capital expenditure 5.9 7.5 7.6 8.9 8.6 8.0 8.42 Others 0.8 0.9 0.8 0.8 0.6 0.6 0.4
B Carry-over 0.8 0.4 0.8 2.7 4.8 1.2 2.3
Source : MOF
Table 5.4: STATE BUDGET EXPENDITURES(share of GDP)
final account

rev est2002 2003 2004 2005 2006
Public and Publicily Guaranteed 9,413 11,383 13,505 14,208 15,641Official Creditors
Multilaterals 3,256 4,510 5,323 5,540 6,149Of Which IDA 1,100 1,476 1,744 1,780 2,010
Bilaterals 5,427 6,142 7,294 7,070 7,772Private Creditors 730 731 888 1,598 1,721
Bonds 382 382 382 1,113 1,095Commercial Banks 184 184 350 362 516Other Private 165 165 156 122 110
Total Long-Term DOD 9,413 11,383 13,505 14,208 15,641Disbursement 986 1,749 1,839 2,246 1,477Payment 849 776 612 698 765
Principal 642 573 327 435 436Interest 207 202 285 263 329
Source : MOF
Table 5.5: EXTERNAL DEBT(US$ million, unless otherwise indicated)

Month/ Year 1999 2000 2001 2002 2003 2004 2005
January 1.7 0.4 0.3 1.1 0.9 1.1 1.1February 1.9 1.6 0.4 2.2 2.2 3.0 2.5March -0.7 -1.1 -0.7 -0.8 -0.6 0.8 0.1April -0.6 -0.7 -0.5 0.0 0.0 0.5 0.6May -0.4 -0.6 -0.2 0.3 -0.1 0.9 0.5June -0.3 -0.5 0.0 0.1 -0.3 0.8 0.4July -0.4 -0.6 -0.2 -0.1 -0.3 0.5 0.4August -0.4 0.1 0.0 0.0 -0.1 0.6 0.4September -0.6 -0.2 0.5 0.2 0.1 0.3 0.8October -1.0 0.1 0.0 0.3 -0.2 0.0 0.4November 0.4 0.9 0.2 0.3 0.6 0.2 0.4December 0.5 0.1 1.0 0.3 0.8 0.6 0.8
Source : GSO (2007)
Month/ Year 1999 2000 2001 2002 2003 2004 2005
January 130.7 129.1 128.3 130.4 135.3 139.6 152.9February 133.2 131.2 128.8 133.2 138.2 143.8 156.7March 132.3 129.8 127.9 132.2 137.4 144.9 156.8April 131.5 128.9 127.3 132.2 137.4 145.6 157.7May 131.0 128.1 127.0 132.6 137.2 146.9 158.5June 130.6 127.4 127.0 132.7 136.8 148.1 159.1July 130.1 126.7 126.8 132.6 136.4 148.8 159.8August 129.5 126.8 126.8 132.6 136.3 149.6 160.3September 128.8 126.6 127.4 132.8 136.4 150.1 161.5October 127.5 126.7 127.4 133.2 136.1 150.1 162.2November 128.0 127.8 127.7 133.7 137.0 150.4 162.7December 128.6 127.9 129.0 134.1 138.0 151.2 164.0
Annual Index 130.2 128.1 127.6 132.7 136.9 147.4 159.3Annual Growth Rate 4.3 -1.6 -0.4 4.0 3.2 7.7 8.1Dec/ Dec Growth Rate 0.1 -0.5 0.8 4.0 3.0 9.5 8.5
Source: GSO (2007)
Table 6.1A: MONTHLY CHANGE IN CONSUMER RETAIL PRICES
Table 6.1B: MONTHLY CONSUMER RETAIL PRICE INDEX
(in percent)
(Index, January 1995 = 100)

GOODS and SERVICES Jan-06 Feb-06 Mar-06 Apr-06 May-06 Jun-06 Jul-06 Aug-06 Sep-06 Oct-06 Nov-06 Dec-06
General Index 1.2 2.1 -0.5 0.2 0.6 0.4 0.4 0.4 0.3 0.2 0.6 0.5
Food & foodstuff 1.7 3.2 -0.9 0.2 0.2 0.4 0.4 0.2 -0.2 0.5 1.2 0.7 of which: Food 2.1 1.7 0.2 0.3 0.3 0.2 0.4 0.3 0.4 1.3 3.8 2.4 Foodstuff 1.4 3.7 -1.1 0.2 0.1 0.4 0.5 0.1 -0.7 0.2 0.5 0.1Beverage & tobacco 1.2 1.5 -0.5 0.1 0.4 0.3 0.6 0.2 0.3 0.3 0.8 -0.1Garment, hats, footwear 0.9 0.8 0.3 0.2 0.4 0.4 0.3 0.5 0.7 0.4 0.0 0.7Housing & construction materials 0.8 0.7 0.1 -0.3 0.9 1.0 0.8 1.1 0.9 -0.5 -0.2 0.5Household appliancies 0.6 0.6 0.4 0.4 0.5 0.7 0.3 0.3 0.4 0.5 0.7 0.7Healthcare, pharmaceutical items 0.5 0.5 0.5 0.1 0.4 0.5 0.3 0.3 0.2 0.6 0.2 0.2Transport & Telecommunication 0.1 0.8 -0.6 0.1 2.9 0.1 0.2 0.9 0.7 -1.8 -0.5 0.1Educational items 0.1 0.1 0.1 0.1 0.3 -0.2 0.3 0.3 0.7 1.6 0.1 0.1Cultural and recreation items 0.2 1.9 -0.7 -0.2 0.9 0.0 0.0 0.3 0.4 0.2 0.4 0.2Goods and other services 0.8 1.7 -0.4 0.2 1.0 -0.3 0.5 0.2 0.0 0.9 1.0 0.8
Gold 4.0 5.4 1.8 4.8 17.6 -5.6 -3.1 2.3 -2.9 -3.1 1.7 3.2US Dollar 0.0 0.1 -0.1 0.1 0.8 -0.3 -0.2 0.1 0.1 0.2 0.2 0.0
GOODS and SERVICES Jan-06 Feb-06 Mar-06 Apr-06 May-06 Jun-06 Jul-06 Aug-06 Sep-06 Oct-06 Nov-06 Dec-06
General Index 101.2 103.3 102.8 103.0 103.6 104.0 104.5 104.9 105.2 105.4 106.0 106.6
Food & foodstuff 101.7 105.0 104.0 104.2 104.4 104.8 105.3 105.5 105.3 105.8 107.1 107.8 of which: Food 102.1 103.8 104.0 104.4 104.7 104.9 105.3 105.6 106.0 107.4 111.5 114.2 Foodstuff 101.4 105.2 104.0 104.2 104.3 104.7 105.2 105.4 104.6 104.8 105.3 105.5Beverage & tobacco 101.2 102.7 102.2 102.3 102.7 103.0 103.6 103.8 104.2 104.5 105.3 106.0Garment, hats, footwear 100.9 101.7 102.0 102.2 102.6 103.0 103.3 103.9 104.6 105.0 105.0 105.5Housing & construction materials 100.8 101.5 101.6 101.3 102.2 103.2 104.1 105.2 106.2 105.6 105.4 106.1Household appliancies 100.6 101.2 101.6 102.0 102.5 103.2 103.6 103.9 104.3 104.8 105.5 105.7Healthcare, pharmaceutical items 100.5 101.0 101.5 101.6 102.0 102.5 102.8 103.1 103.3 104.0 104.2 104.3Transport & Telecommunication 100.1 100.9 100.3 100.4 103.3 103.4 103.6 104.5 105.3 103.4 102.9 103.0Educational items 100.1 100.2 100.3 100.4 100.7 100.5 100.8 101.1 101.8 103.4 103.5 103.8Cultural and recreation items 100.2 102.1 101.4 101.2 102.1 102.1 102.1 102.4 102.8 103.0 103.4 104.3Goods and other services 100.8 102.5 102.1 102.3 103.3 103.0 103.5 103.7 103.7 104.7 105.7 105.7
Gold 104.0 109.6 111.6 116.9 137.5 129.8 125.8 128.7 125.0 121.1 123.1 127.1US Dollar 100.0 100.1 100.0 100.1 100.9 100.6 100.4 100.5 100.6 100.8 101.0 101.0
Source : GSO (2007)
(Index, December 2005 = 100)
Table 6.2A: PRICE INDEX BY COMMODITY GROUPS
TABLE 6.2B: PRICE INDEX BY COMMODITY GROUPS
Source : GSO (2007)
(monthly change)

Rev2000 2001 2002 2003 2004 2005
Gross Output 129,141 130,178 145,021 153,955 172,495 183,342
Crop Cultivation 101,044 101,403 111,172 116,066 131,552 134,755
Livestock 24,960 25,501 30,575 34,457 37,344 45,226
Services 3,137 3,273 3,275 3,433 3,599 3,362
Source : GSO (2007)
Rev2000 2001 2002 2003 2004 2005
Gross Output 112,112 118,990 122,150 127,628 132,888 137,112
Crop Cultivation 90,858 92,907 98,061 101,763 106,423 107,898 Food Crops 55,163 55,066 59,619 61,029 63,621 63,853 Industrial Crops 21,782 23,109 22,247 24,175 25,612 8,928
Livestock 18,505 19,283 21,200 22,907 23,439 26,108
Services 2,748 2,800 2,890 2,958 3,027 3,107
Memorandum Items:Paddy Ouput (000 tons) 32,530 32,108 34,447 34,569 39,581 39,622Cultivated Area (000 ha) 7,666 7,493 7,504 7,452 7,445 7,329 Yield (ton/ ha) 4.24 4.29 4.59 4.64 5.32 5.41
Source : GSO (2007)
Table 7.1: AGRICULTURAL PRODUCTION(VND billion at current prices)
Table 7.2: AGRICULTURAL PRODUCTION(VND billion at constant 1994 prices)

Table 7.3: INDUSTRIAL CROP PRODUCTION AND YIELDS
Rev Prel2000 2001 2002 2003 2004 2005 2006
Production (000 metric tons)Cotton 19 34 40 35 28 34 26Jute 11 15 20 12 13 13 11Sedge 61 65 88 96 90 81 93Sugar cane 15,044 14,657 17,120 16,855 15,649 14,949 15,679Peanut 355 363 400 406 469 489 465Soya-beans 149 174 206 220 246 293 258Tobacco 27 32 33 32 23 26 43Tea - raw and fresh 315 340 424 449 514 570 612Coffee 803 841 700 794 836 752 854Rubber 291 313 298 364 419 482 546Black pepper 39 44 47 69 73 80 83Coconut 885 892 915 893 960 977 982
Area Cultivated (000 ha)Cotton 19 28 34 28 28 26 21Jute 6 8 10 5 5 6 6Sedge 9 10 12 14 13 13 13Sugar cane 302 291 320 313 286 266 285Peanut 245 245 247 244 264 270 249Soya-beans 124 140 159 166 184 204 186Tobacco 24 24 27 23 16 17 27Tea 88 98 109 116 121 123 123Coffee 562 565 522 510 497 497.4 488.6Rubber 412 416 429 441 454 482.7 511.9Black pepper 28 36 48 51 51 49.1 48.5Coconut 161 156 140 134 133 132 133
Average Yield (metric ton/ ha)Cotton 1.0 1.2 1.2 1.3 1.0 1.3 1.3Jute 2.1 1.9 2.1 2.6 2.6 2.3 1.8Sedge 6.6 6.6 7.2 6.8 6.9 6.4 7.4Sugar cane 49.8 50.4 53.5 53.8 54.7 56.1 55.0Peanut 1.5 1.5 1.6 1.7 1.8 1.8 1.9Soya-beans 1.2 1.2 1.3 1.3 1.3 1.4 1.4Tobacco 1.1 1.3 1.2 1.4 1.4 1.5 1.6Tea - raw and fresh 3.6 3.5 3.9 3.9 4.3 4.7 5.0Coffee 1.4 1.5 1.3 1.6 1.7 1.5 1.7Rubber 0.7 0.8 0.7 0.8 0.9 1.0 1.1Black pepper 1.4 1.2 1.0 1.4 1.4 1.6 1.7Coconut 5.5 5.7 6.5 6.7 7.2 7.4 7.4
Source : GSO (2007)

Rev Prel2000 2001 2002 2003 2004 2005 2006
Gross Industrial Output 198,326 227,342 261,092 305,080 355,624 416,563 487,492State sector 82,897 93,434 105,119 117,637 131,655 141,117 154,231
Central 54,962 62,119 69,640 80,917 92,896 104,372 116,751Local 27,935 31,316 35,479 36,720 38,759 36,745 37,480
Non-state sector 44,144 53,647 63,474 78,292 95,785 120,127 148,783Collectives 1,334 1,575 1,668 1,770 1,893 1,969 2,032Private, households and mixed 42,810 52,072 61,807 76,522 93,892 118,158 146,750
Foreign-invested sector 71,285 80,261 92,499 109,152 128,184 155,319 184,479
Key IndustriesCoal 2,366 2,695 3,189 3,689 4,752 6,111 7,798Oil and gas 22,746 23,766 23,817 25,132 28,403 27,410 25,768Mining and metal ores 209 239 281 344 467 476 384Stones and other mining 2,015 2,398 3,039 3,597 3,842 4,354 4,900Food and beverage 43,634 50,373 56,061 64,585 74,694 84,482 99,452Cigarettes and tobacco 5,744 6,690 7,658 9,189 10,160 11,234 12,316Textile products 10,046 10,641 12,338 14,214 16,626 19,079 22,176Garment - apparel 6,042 6,862 8,182 10,466 12,792 15,304 18,463Leather tanning and processing 8,851 9,529 11,096 13,535 16,018 18,920 22,190Wood and wood products 3,598 3,903 4,488 5,485 6,570 8,120 10,282Paper and paper products 3,930 4,562 4,877 5,655 7,140 8,311 9,416Printing and publishing 2,274 2,453 2,876 3,515 3,774 4,626 5,945Chemicals 11,123 12,852 14,714 16,323 19,029 23,848 28,426Rubber products and plastic 6,456 8,128 9,706 11,291 15,169 18,237 21,940Non-metallic products 18,259 21,625 25,913 29,855 33,483 37,055 41,713Metal production 5,914 6,842 8,516 10,430 11,226 13,949 16,882Metallic products 5,768 7,063 8,506 10,646 12,963 17,595 22,159Machinery and equipment 2,761 3,421 3,711 4,612 5,371 5,495 5,718Computer and office equipment 1,295 977 1,003 1,538 1,846 3,206 4,645Electric and electronic equipments 3,622 5,172 6,520 7,462 9,050 11,992 15,638Radio, TV and telecom 4,395 5,407 6,169 7,162 7,956 9,137 10,628Production & repairing motor vehicles 3,232 4,265 5,774 8,306 8,692 9,753 12,030Production & repairing other transport means 6,414 7,090 8,534 9,676 12,172 15,834 20,077Furnitures 3,931 4,759 6,057 7,846 10,179 13,411 18,155Recycled products 150 151 174 204 261 267 287Electricity and gas 11,828 13,551 15,741 18,071 20,385 23,427 26,798Water supply 1,066 1,152 1,328 1,361 1,409 1,570 1,701
Source : GSO (2007)
Table 8.1: INDUSTRIAL PRODUCTION OUTPUT(VND billion at constant 1994 prices)

Rev PrelProduct Unit 2000 2001 2002 2003 2004 2005 2006
Assembled automobiles unit 13,547 20,526 29,536 47,701 50,954 59,152 41,557Assembled motorbikes 000' unit 643 610 1,052 1,180 1,828 1,982 2,094Assembled tivi sets 1,000 1,013 1,126 1,597 2,188 2,660 2,515 2,282
Beverage mil. liters 779 971 940 1,119 1,343 1,461 1,548Bicycle tires 000 Pieces 20,675 21,656 22,778 26,686 26,008 20,387 23,455
Bicycle tubes 000 pieces 21,917 22,997 24,032 36,083 32,386 26,848 31,625Bricks mil. pieces 9,087 9,811 11,365 12,810 14,661 16,530 19,893Cement 000 tons 13,298 16,073 21,121 24,127 26,153 30,808 32,690Chemical fertilizers 000 tons 1,210 1,270 1,158 1,294 1,714 2,190 2,176
Cigarettes mil. packs 2,836 3,075 3,375 3,871 4,192 4,485 4,030Coal mil. tons 11.6 13.4 16.4 19.3 27.3 34.1 38.9Crude oil mil. tons 16.3 16.8 16.9 17.7 20.1 18.5 17.2Diesel engines Pieces 15,623 18,721 32,570 184,418 182,443 201,593 171,508Electric engines Pieces 45,855 53,442 64,085 95,779 132,320 194,374 215,010
Electricity mil. kWh. 26,682 30,673 35,888 40,546 46,202 52,078 59,050Fabrics of all kinds mil. meters 356 410 470 496 502 561 575Glass products 000 tons 113 115 115 147 154 163 168Insecticides 000 tons 20.1 20.0 20.7 40.9 54,523 45,877 50,285
Paper and paper products 000 tons 408 445 490 687 809 901 997Porcelain mil. pieces 247 314 284 524 404 514 551Rice mill equipment pieces 12,484 18,298 13,433 10,112 5,749 2,734 2,960Salt 000 tons 590 699 974 909 906 898 955Sawn wood 000 m3 1,744 2,036 2,667 3,291 3,009 3,232 3,414
Soap and detergent 000 tons 247 326 361 377 401 421 493Steel 000 tons 1,583 1,914 2,503 2,954 3,280 3,403 3,827Sugar (refine) 000 tons 790 739 790 1,073 1,191 1,102 1,032Tea 000 tons 70 82 100 85 122 127 133Textile yans 000 tons 130 162 227 235 241 259 265
Tin (billet) Tons 1,803 1,728 1,565 1,915 2,356 1,766 1,830Transformers pieces 13,535 15,664 18,633 33,364 50,146 45,540 52,430Water pumps for agriculture pieces 3,496 4,238 3,578 7,787 10,038 8,298 9,730
Source: GSO (2007)
Table 8.2: MAJOR INDUSTRIAL PRODUCTS(VND billion at constant 1994 prices)