social wellbeig, inequality and social disadvantage · objective components based in the social,...
TRANSCRIPT


Abstract
In recent years policy makers and social scientists have turned their attention to the direct
measurement of social wellbeing, a multidimensional construct that refers to the capacity of
humans to live healthy, creative and fulfilling lives. In this approach, social wellbeing has
objective components based in the social, economic, political and environmental conditions of
individuals and households, and subjective components that are cognitive and affective
evaluations of these conditions. This paper uses three waves of a representative state-level
household panel study from Queensland, Australia to investigate how objective measures of
wellbeing are socially distributed by gender, class, age, ethnicity and Indigenous status. These
are major sources of categorical inequality in many countries. We next examine the relationships
between objective dimensions of social wellbeing and life satisfaction. The objective measures
of wellbeing investigated in the paper include degree of financial hardship, access to adequate
food, clothing, housing, care, health and social connections, and access to leisure time. The
results indicate that objective aspects of wellbeing are unequally distributed by gender, age,
class, ethnicity and Indigeneity in ways that imply these are categorical inequalities in Australia,
and that categorical inequalities and objective aspects of wellbeing also have strong and
persistent associations with life satisfaction.
Keywords: categorical inequalities; wellbeing; objective wellbeing; subjective wellbeing;
gender inequality; class inequality; ethnic inequality; Indigenous inequality.

1
1. Introduction
Among social scientists and policy makers there has been a growing interest in the nature and
consequences of inequality and the nature and determinants of social wellbeing. The interest in
inequality has been motivated by the increased economic disparities in many countries since the
late 1970s and early 1980s (cf Neckerman 2004a; Grusky and Kanbur 2006), stronger
international evidence of world-wide differences in poverty and inequality, and accumulating
evidence about the macro-level (e.g. Wilkinson 2005; Wilkinson and Pickett 2009) and
individual-level (including intergenerational) effects of poverty and inequality (Neckerman
2004b; Duncan and Murnane 2011). The interest in social wellbeing largely reflects conceptual
work in welfare economics by Amartya Sen (1973, 1976) about how to measure poverty and
inequality. From this base, Sen’s (1992, 1999) work broadened to address the capabilities
individuals should have to enable them to live fulfilling lives. Capabilities are valued ways of
living that are potentially realisable for individuals. Sen further argued that societal development
should aim to promote human capabilities and that capabilities indicated social progress and
social development goals more accurately than economic output indicators based on GDP or
National Income1.
These ideas have been extremely influential. In political theory, scholars such as Nussbaum
(2000) have listed human capabilities - life, bodily health, bodily integrity, the ability to use the
senses to think and to imagine, the ability to express emotions, to exercise practical reason and
autonomy with respect to one’s own life, to affiliate, to live with dignity, to live in and with
nature, to play, and to control one’s own political and economic environment, through education,
work and political and social participation - and argued they should be enshrined in
constitutional guarantees.
In social indicators measurement, Sen’s work informs national and international statistical
indicators such as The United Nations Development Programme Human Development Index, the
OECD’s Better Life initiative, and the French government’s Commission on the Measurement of
Economic Performance and Social Progress (Stiglitz, Sen, Fitoussi 2009).
1 Sen discusses social development and well-being in terms of capabilities and functionings. Capabilities refer to an individual’s ability across multiple domains to live the life she/he chooses (Robeyns 2005). Functionings refer to the actual life an individual lives from within her/his capability set (Sen and Dreze, 1989; Sen 1985).

2
In this paper we examine inequalities in dimensions of wellbeing in Australia. We adopt a broad
conception of wellbeing that includes objective dimensions measuring human capabilities in
different spheres of life (social, economic, political, environmental), and subjective aspects based
in cognitive evaluations of one’s satisfaction with life. Our objective measures include social,
economic and physical components noted by Stiglitz, Sen and Fitoussi (2009) and reflect the lists
of central capabilities proposed by Nussbaum (2006)2. We examine how objective aspects of
wellbeing are linked to gender, class, age, and Indigenous status and ethnicity, and importantly,
we examine how objective aspects of wellbeing are linked to life satisfaction, a key subjective
component of wellbeing. We also rely on longitudinal (panel) data, addressing calls (e.g.
Arthaud-Day & Near 2005, p. 536) for more research to examine changes in individual
wellbeing. Our approach allows us to examine changes in individual wellbeing and group
differences.
2. Research questions and hypotheses
We address three distinct but interrelated research questions in this paper:
1. How are objective features of social wellbeing distributed according to socioeconomic
and sociodemographic characteristics that indicate categorical relations of inequality or
“durable inequalities”, class, gender, age, Indigenous statusor ethnicity (Tilly 1998)?
2. How are objective aspects of wellbeing related to subjective assessments of social
wellbeing (life satisfaction)?
3. How is the relationship between the categorical inequalities and subjective wellbeing
mediated by objective aspects of wellbeing?
The socioeconomic and sociodemographic factors we examine are structural sources of
inequality in many societies. Social relations associated with them potentially lead to long-
lasting systematic differences in life-chances and social rewards. The primary categorical
inequalities we focus on are gender, age, class, ethnicity and Indigenous status. These are key
2 The key dimensions we do not consider include objective conditions based in the environment and politics.

3
stratifying principles in contemporary societies. The objective features of wellbeing we examine
are core economic, social and physical components including financial hardship, material
deprivation, household income, leisure time, social connections to family and friends, and health
(cf Nussbaum (2006)). With subjective wellbeing, they encapsulate a number of the quality of
life dimensions of the Stiglitz-Sen-Fitoussi (2009) report.
In common with other societies, in Australia, gender, class, age and ethnicity systematically
shape access to resources, rewards and life-chances. Rewards and outcomes in different social
domains are correlated, and advantages and disadvantages therefore potentially compound over
the lifecourse (Neckerman 2004b). For instance, socioeconomic and class differences in the
family of origin are associated with socioeconomic differences in educational achievement (De
Bortoli et al. 2010), and in health (Spurrier at al. 2003) which themselves are associated with
variations in employment outcomes in later life (Zucchelli et al. 2010). Tilly (1998) locates these
differences in long-lasting relations of inequality that allow privileged groups to secure
advantages through exploitation and opportunity hoarding. Exploitation arises when one group
secures a disproportionate amount of a reward at the expense of another, while opportunity
hoarding occurs when one group denies another access to an opportunity to secure a reward.
Given the nature of categorical inequalities we would expect those privileged by gender, class,
age, ethnicity and Indigenous status to be advantaged with respect to objective measures of well-
being. However we also anticipate particular links between some inequality relations and some
objective aspects of wellbeing. Class relations are fundamentally linked to the economic
conditions of people’s lives, whether through mechanisms such as opportunity hoarding
associated with market-based skills and processes of social closure, or relationships of
domination and exploitation associated with owning and controlling economic resources such as
property, economic capital, or organisational resources (Goldthorpe 2007; Wright 2009). We
anticipate class relations to be most strongly related to economic aspects of objective wellbeing
with more privileged classes being more advantaged economically than less privileged classes.
In contemporary societies gender relations sharply stratify economic outcomes (Blau, Brinton
and Grusky 2006), and social outcomes involving interactions with others (Ridgeway 2013). The
ubiquity of gender-based inequalities reflects opportunity hoarding by men, but also depends on
pervasive cultural norms about gender-specific appropriate behaviours (e.g. Charles and Grusky

4
2004) which are linked to status-beliefs about competence and agentic capacity (Ridgeway
2013). Gender inequalities are ubiquitous across objective dimensions of well-being and in day-
to-day interactions because gender differences are typically seen as essentialist and because
cross-gender interactions occur frequently in most settings and social situations (e.g. work,
family, neighbourhood). We therefore anticipate men to be advantaged over women with respect
to most objective aspects of inequality.
We expect age stratification with respect to most objective inequalities for reasons noted by life
course theorists: life changes take place over long periods of human lives with prior life history
affecting later life outcomes; life course processes reflect individual and personal characteristics
and collective (e.g. families, organisations), institutional and cultural contexts, and occur across
multiple domains of life such as work and family (Mayer 2009). The implication of these
arguments is that life course structured outcomes occur throughout people’s lives across multiple
capability domains and that outcomes in different domains are linked because of the importance
of prior life history. These arguments do not translate into simple predictions, instead they
suggest that objective wellbeing measures will be age stratified but that specific differences will
reflect the objective wellbeing measure being examined, previous and current circumstances, and
institutional and contextual factors.
Ethnicity is categorical source of inequality in Australia, particularly when linked to English
language proficiency. English is the national language and the formal test for Australian
citizenship is both a knowledge test and a test of basic English language (Department of
Immigration and Border Protection, 2013). Australia’s immigration policy is also increasingly
selective on education and human capital (Markus and Semyonov 2010), and English proficiency
is linked to both economic and social outcomes (Chiswick and Miller 1995), among other things,
for instance, explaining a large part of the wage gap between immigrants and the native born
(Islam and Parasnis 2014). We expect English language proficiency to be positively related to all
objective wellbeing dimensions.
Finally, according to established research, Indigenous status is a profound source of inequality in
Australia on “almost any conceivable measure of socio-economic wellbeing” (Dockery 2010), in
part because Indigenous inequality is a “wicked problem” (Rittel and Webber 1973), in which

5
policy and program delivery is inherently difficult (Head 2009). We expect Indigenous status to
be associated with negative well-being on all objective measures.
We also investigate how categorical inequalities and objective aspects of social wellbeing are
related to life satisfaction. Conceptually, life satisfaction is an overall subjective assessment of
wellbeing arising from the different circumstances and conditions of one’s life. Domains such as
material well-being, work, health, leisure, social and family connections are particularly
important for subjective wellbeing (Cummins 1995). When economists, psychologists and
sociologists examine how categorical inequalities such as gender, age and class are related to life
satisfaction they assume that mechanisms are based in different life domains. For example,
economic research on the effects of unemployment and income on life satisfaction (Frijters et al.
2004) focuses on whether or not pecuniary or non-pecuniary mechanisms are at work. In other
words, are unemployment and income effects on life satisfaction the result of effects associated
with varying objective living conditions (material well-being) or psychological factors such as
depression, anxiety or self-esteem (Frijters et al 2004) (emotional well-being, linked to factors
such as leisure, family connectedness and so on). By incorporating direct measures of objective
well-being in different capability domains, along with categorical measures of inequality, we
examine whether or not durable categorical inequalities affect subjective wellbeing directly or
indirectly through their effects on objective dimensions of wellbeing. We hypothesise, in
particular, that if life-satisfaction is an overall cognitive evaluation reflecting the circumstances
of one’s life, there will be strong direct relationships between objective measures of well-being
and life-satisfaction. However, independently of objective circumstances, there is little reason to
believe that categorical inequalities will directly influence life satisfaction.
Our empirical analysis relies on 3 waves of a longitudinal household panel study conducted in
Queensland, the third largest state of Australia. Australia is a pertinent case in which to
investigate inequality in objective and subjective wellbeing. For the last five years, Australia has
ranked second behind Norway on the Human Development Index, and since 1980 Australia has
typically ranked either second or first (UNDP 2011, Table 2). Moreover Australia also ranks
second on the Inequality Adjusted HDI (UNDP 2011, Table 3), which incorporates inequalities
in each of the three dimensions of wellbeing (education, life expectancy, income) measured by
the HDI. As a country with very high levels of aggregate wellbeing and comparatively limited
inequality (i.e. variance) in at least some measures of objective wellbeing, we might anticipate

6
Australia to exhibit weaker associations between wellbeing dimensions than countries with
greater inequality. To the extent that we find robust associations between wellbeing dimensions,
and social and demographic variations in objective and subjective wellbeing we might expect
these associations and inequalities to be even more pronounced in other countries that show both
lower average wellbeing and more inequality.
2. Data and methods
2.1. Data and sample
We use data from the Living in Queensland Social Wellbeing Study, a new longitudinal
Australian panel survey that started in 2008, and follows a representative sample of Queensland
households. The study is designed to operationalise and examine multidimensional inequality
and wellbeing. The sample covers respondents aged 18 and over living in private households. At
the first wave of the survey, one person per household was selected using random sampling
stratified by region, age and gender and this person completed the Personal form. A person from
the sampled household was then asked to provide information about household as a whole. The
respondents to the personal questionnaire were followed over the course of three annual
interviews (2008, 2009, and 2010) with complementary household information obtained at each
wave. We used an unbalanced panel design, which resulted in 7,987 person-year observations
used for analyses in this paper (3,367 persons interviewed in wave 1, 2,403 in wave 2, and 2,217
in wave 3 of the survey).
Queensland is the third largest state in Australia, containing approximately 20 per cent of the
country’s population. It includes the fastest growing population region in the country, largely
because of internal migration linked to the strong state economy. In terms of age and sex,
Queensland is highly representative of Australia. In 2009 the Queensland median age was 36.2
years, while the median age of the Australian population was 36.9 years (Australian Bureau of
Statistics 2010: Table 3). Queensland’s sex ratio in 2009 was 100.0 while the Australian sex ratio
was 99.2 (Australian Bureau of Statistics, 2010: Table 5).

7
2.2. Key variables
Table 1 describes the key measures used in the paper – the indicators of objective and subjective
wellbeing. Our subjective wellbeing indicator is the Satisfaction With Life Scale (SWLS; Diener
et al. 1985), a widely used and well-validated instrument (e.g. Pavot et al.).
The objective aspects of wellbeing are included as individual indicators in our models, rather
than combined into an aggregate index as has been sometimes done (e.g. Bellani & D’Ambrosio
2010). This is because we are interested in how these are potentially differently distributed
among different groups, and also potentially relate differently to subjective wellbeing. We also
included two key control variables that are used in regression models predicting subjective
wellbeing: indicators of positive and negative events that the respondents experienced over the
past 12 months. In Western societies, responses to general subjective wellbeing or life
satisfaction questions, tend to be subject to “homeostasis”, that is most people report positive life
satisfaction with a tendency to return to the same values over time (a “set point”). Such
homeostatic “set point” for individuals can be altered in the short term by happy or sad events
(Cummins et al. 2003), and in the long term (Headey 2010) by major life events such as repeated
unemployment (Clark et al. 2004) or marriage (Lucas et al. 2003). To address this issue we add
controls for positive and negative life events.
Our analysis of categorical inequalities focuses particularly on gender, class, age, ethnicity and
Indigenous status with additional socio-structural and demographic control variables that are
likely related to objective and subjective well-being. The key predictors of wellbeing in our
analyses are:
Gender (Male, Female);
Age (coded as a categorical variable: 17-34, 35-44, 45-54, 55-64, 65+);
Class – based on labour force status, employment relations if employed, and occupation and skill
level as classified by the Australian and New Zealand Standard Classification of Occupations
(Australian Bureau of Statistics 2006)3. The measure has connections to the employment
3 The Australian and New Zealand Standard Classification of Occupations is the official statistical classification for occupations in Australia and New Zealand. ANZSCO is a skill-based classification that uses information about job title and job tasks to code jobs and occupations according to level of skill and area of skill specialisation. ANZSCO groups

8
relations based account of Goldthorpe (2000) and the relations of production account of Wright
(1997). Employer (self-employed and having employees), Petty bourgeoise (self-employed &
working on their own), Skilled managers (ANZSCO Major Group 1; skill Level 1), Other
managers (Major Group 1; other skill levels), Professionals (Major Group 2), Skilled technical
(Major Group 3; skill Level 1), Other technical (Major Group 3; other skill levels), Skilled white
collar (Major Groups 4,5 & 6; skill Level 2), Other white collar (Major Groups 4,5 & 6; other
skill levels), Skilled blue collar (Major Groups 7 & 8; skill Level 4), Other blue collar (Major
Groups 7 & 8; other skill levels), Not working
Aboriginal or Torres Strait Islander (ATSI; Yes, No)
Non-English Speaking Background (NESB; Yes, No); Note that this variable is proxying
English language proficiency, which is not measured directly in our data.
Our control variables include marital status; the presence of children in the household
(dependent children under 18; and preschool children under 6); education; labour force
attachment (whether work is main activity of the respondent) and home ownership status.,
Initially data were screened for outliers and inconsistencies.We used Confirmatory Factor
Analysis to test whether the measures of financial difficulties and material deprivation each
formed a single underlying construct. The results were satisfactory, with both measures
achieving high values of goodness-of-fit statistic (financial hardship: RMSEA=0.02, CFI>0.99;
TLI=0.99; material deprivation: RMSEA=0.05, CFI=0.99; TLI=0.99) and good
reliability(financial hardship: alpha=0.65; material deprivation: alpha=0.81).
occupations into 8 major groups at five levels of skill, ranging from level 1 (commensurate with a Bachelor degree or higher) to level 5 (commensurate with completed secondary skill or a level 1 vocational certificate).

9
Table 1 Wellbeing indicators
Dimension of wellbeing Measure
Subjective wellbeing
Life satisfaction Average of five items measured on a 7-point scale each (Satisfaction With Life Scale (SWLS)): (In most ways my life is close to my ideal; The conditions of my life are excellent; I am Satisfied with life in general; So far I have gotten the important things I want in life; If I could live my life over, I would change almost nothing) (higher score = more satisfied)
Objective wellbeing
Income Log total household income: before tax, last financial year, equivalized using square root household size;
Financial hardship Count of the number of problems over the past 12 months from a list of 5 items (Couldn’t keep up with payments for water, electricity, gas or telephone; Got behind with the rent or mortgage; Moved house because the rent/mortgage was too high; Had to pawn or sell something, or borrow money from a money lender; Had to ask a welfare agency for food, clothes accommodation or money). (higher score = more hardship)
Material deprivation Average score based on eight items measuring frequency the respondents’ family could not afford the following goods or services over the past 12 months on a 4-point scale (Warm clothes and bedding if it is cold; Decent meal; Medicines; A decent and secure home; Heating in at least one room of the house; Outings with friends; Visits to a doctor when you or a family member was sick; Visits to a dentist when you or a family member needed to). (higher score = more deprived)
Leisure time Log leisure time (in hours per week)
Health Self-reported health status, measured on a 5-point scale (Excellent, Very good, Good, Fair, Poor). (higher score = better health)
Contacts with family Self-reported variable measuring how often the respondent spends time with parents children or other relatives, measured on a 6-point scale (higher score = more contact)
Contacts with friends Self-reported variable measuring how often the respondent spends time with their friends measured on a 6-point scale (higher score = more contact)
Indicators of events potentially affecting wellbeing
Negative events Number of the following events experienced over the past 12 months: Family illness; Lost job; Experienced a major financial crisis; Failed an important exam; Serious illness; Separated; Immediate family member died; Close family member died; A friend died; Was a victim of a property crime; Was assaulted; Served a prison sentence; Family member served a prison sentence.
Positive events Number of the following events experienced over the past 12 months: Was promoted; Got married; Passed an important exam; Reconciled with a partner; Gave birth/adopted a child (either respondent or the partner.

10
To prevent the loss of data, we used imputation to eliminate missing values on the measures of
wellbeing4. Our statistical models included a set of dummy variables indicating imputation as
control variables. Those imputation controls are not reported in the regression tables because
their effects were – with one exception – not statistically significant; the exception is noted in a
relevant place.
2.3. Empirical strategy
Our empirical strategy is as follows. We begin by inspecting some distributional features of
objective and subjective wellbeing. Next we use regression models for longitudinal data to
examine the relationships between the sociodemographic variables and the wellbeing measures
to provide information about sociodemographic distribution of social wellbeing. Variations in
objective well-being by gender, class, age, ethnicity and Indigenous status provide some
evidence of the existence of durable categorical inequalities. Finally, we regress subjective
wellbeing on objective wellbeing and the sociodemographic variables, including our key
indicators of durable categorical inequalities. These last analyses enable us to assess whether
objective differences in wellbeing are mechanisms that link sociodemographic inequalities to
differences in life satisfaction.
The main analytical method used in the paper is a mixed effects hybrid model for longitudinal
data (Allison 2009), which can be expressed as:
𝑌𝑖𝑗 = 𝜇 + 𝛽1 ∗ (𝑋𝑖𝑗 − 𝑋𝑖) + 𝛽2 ∗ 𝑋𝑖 + 𝑣𝑖𝑗
In a longitudinal dataset for different individuals observed at different times (survey waves),
there are two sources of variation in the response variable. The between-individual variation is
the variation in respondents’ mean values (i.e. averaged over time) on the dependent variable.
The within-individual variation is the variation that a single respondent’s time-specific score
exhibits around his/her mean response score. A standard random effects estimator produces
regression coefficients that are a weighted average of the between-individual and within-
4 We used two methods of imputation: mean-values and within-person averages based on the data available for the same individual in other waves. Both methods yielded the same substantive results.

11
individual variation. A hybrid model extends a random effects model by transforming the
original independent variables into group-mean deviations and adding their group-means as
additional independent variables. This provides a way of relaxing the assumption in the random-
effects estimator that observed variables are uncorrelated with the unobserved variables, which
was originally proposed by Mundlak (1978) and allows estimates of the between and within-
effects.5
In the results section, we decompose the total variance into the between and within components
to gain insights into the cross-sectional and temporal distribution of inequalities in wellbeing,
and subsequently present the between- and within- effects estimated by the hybrid models. The
analytical strategy we employ enables us to integrate the random and fixed effects modelling
frameworks, which is important from the point of view of this paper. The within estimator,
typically obtained using a fixed effect model, provides a means of controlling for unobserved,
time-invariant characteristics of individuals, such as psychological profiles, depression, anxiety
or self-esteem. On the other hand, the between estimators provides us with coefficients for some
of the indicators of durable categorical inequalities, such as gender or ethnicity, which are stable
over time and therefore would not be estimated by the fixed effect model. Therefore, using
hybrid models allows us to benefit from both these analytical frameworks.
3. Results
We start the empirical section of the paper by presenting descriptive results on inequalities in
objective and subjective wellbeing in Australia. Table 2 shows two measures of inequality –
relative mean deviation and the coefficient of variation6 – calculated for all wellbeing
dimensions. Financial hardship shows the highest levels of inequality, although this is largely
due to the fact that it is a count variable. The dimension of objective wellbeing that is most prone
to direct interventions from policy, namely income, is characterised by the lowest level of
inequality. However, when material situation is measured more directly, using a material
deprivation indicator, we observe markedly higher inequality. The level of inequality in
5 A Stata command ‘mundlak’ offers a convenient way of estimating both the original Mundlak model and the hybrid model. 6 For discussion of these and other measures of inequality, see e.g. Temkin (1993).

12
subjective wellbeing (i.e. life satisfaction) is also relatively high – on par with inequalities in
aspects such as health or the frequency of contacts with family.
Table 2 Selected inequality measures of objective and subjective wellbeing
Relative mean deviation
Coefficient of variation
Income 0.07 0.20
Material depr 0.12 0.37
Financial hardship 0.79 2.68
Health 0.12 0.30
Leisure time 0.09 0.27
Contacts w/ family 0.14 0.33
Contacts w/ friends 0.10 0.28
Life satisfaction 0.13 0.32
What is important from the perspective of this paper is that various aspects of objective and
subjective wellbeing may overlap for certain groups of people, defined by particular socio-
demographic characteristics. This would be consistent with the existence of categorical
inequalities, to which analysis we now turn.
3.1. Investigating the socio-demographic distribution of objective wellbeing
The second stage of the analysis involved investigating how the objective wellbeing dimensions
are distributed according to key socio-demographic characteristics. We first decomposed the
total variance for each outcome variable into the between-person and within-person components
to gain insights into cross-sectional and temporal variation in objective wellbeing in our data
(Table 3).
Table 3 Decomposition of variance for objective wellbeing indicators
Income Financial hardship
Material depriv
Health Leisure C w/ family
C w/ friends
Variance
Between-persons 0.65 0.51 0.35 0.83 0.55 1.24 0.84
Within-persons 0.41 0.35 0.29 0.55 0.65 0.88 0.73

13
ICC 0.71 0.68 0.58 0.70 0.41 0.66 0.57
Looking at the variance components, overall, there is more variation in objective wellbeing
between persons than variation over time for the same persons, as evidenced by the intra-class
coefficient (ICC) values over 0.5. This is not surprising as the observation period in our study is
relatively short (3 years).Most objective components of wellbeing are rather stable over this time
period. Despite this, there is still a considerable within-person variation on all of these measures,
ranging from about 30% for health to 59% for leisure time. This indicates that objective
wellbeing is still quite fluid and there is considerable mobility over time with regards to all of its
dimensions.
We next estimated a hybrid model for each of the wellbeing measures.7 Table 4 presents the
‘between’ and ‘within’ effects estimated by the hybrid model for our key indicators of
categorical inequalities: gender, age, class, ethnicity and race.
As hypothesised, many dimensions of objective wellbeing are stratified by gender: women are
disadvantaged in terms of income, report higher levels of material deprivation and spend less
time on leisure. They do, however enjoy better health than men, and have more frequent contacts
with family.
The within-person estimator suggests significant changes in individuals’ circumstances as they
move through the lifecourse (the between-person estimator shows consistent albeit weaker
associations). Reported health status and contacts with friends worsen with age, compared to the
youngest age group. The oldest age groups, particularly those over 65, also experience a drop in
their incomes as well as less frequent contacts with family. Older people, however, have more
leisure time than younger age groups. They also report fewer financial problems and less
material deprivation, a pattern found previously in research on poverty (e.g. Gordon et al., 2000),
7 The models we estimate assume that the dependent variable is linear, which is potentially problematic for some of our measures of objective wellbeing, particularly financial hardship, material deprivation, health, contact with family, and contact with friends. To check the robustness of the estimates against non-linearity, we re-estimated models for these variables using ordinal random effects logit procedure and compared them with corresponding random effects linear models. The results of these analyses were substantively the same: the direction of all associations remained the same and all coefficients that were statistically significant in the linear model remained statistically significant in the ordinal logit model. This is consistent with findings reported previously in the wellbeing literature, whereby the error introduced by assuming cardinality for ordered variables has been shown to be negligible (Ferrer-i-Carbonell and Frijters 2004).

14
and typically explained by changes in expectations for, and perceptions of, their standard of
living, or the effects of unmeasured variables such as other wealth or savings.
Table 4 Between and within effects from mixed-effects hybrid regression models on objective
wellbeing indicators
Income Financial hardship
Material depriv
Health Leisure C w/ family
C w/ friends
BETWEEN EFFECTS
Female -0.05* 0.03 0.05** 0.08* -0.17*** 0.14** -0.05 Age 17-34 35-44 -0.05 -0.07 -0.07 -0.03 0.03 0.11 -0.11 45-54 -0.00 -0.13* -0.07 -0.16 -0.03 0.05 -0.27 55-64 0.02 -0.12 -0.13* -0.25* 0.02 -0.10 -0.37* 65+ -0.02 -0.10 -0.16* -0.33* 0.13 -0.19 -0.28 Class Petty bourgeoise 0.10 -0.07 0.03 0.10 -0.00 -0.14 -0.23* Employer 0.24*** -0.04 0.01 -0.02 -0.17* -0.29* -0.16 Skilled managers (L1)
0.20*** -0.03 -0.01 0.01 -0.25** -0.42*** -0.18
Other managers 0.28** -0.04 -0.06 0.13 -0.02 0.01 -0.07 Professionals 0.17*** 0.03 0.01 0.09 -0.12 -0.15 -0.17* Skilled technical (L2)
0.16 0.03 0.04 -0.16 -0.16 -0.06 -0.18
Other technical 0.21** 0.05 0.04 0.20 -0.27* -0.36* -0.39** Skilled white-c (L2) 0.20** -0.02 -0.01 0.06 -0.15 -0.27* -0.19 Other white-c 0.14** 0.08* 0.08** 0.03 -0.22** -0.17 -0.26** Skilled blue-c (L4) 0.16* -0.03 -0.00 0.28** 0.07 -0.07 -0.11 Other blue-c 0.24*** -0.10 -0.01 0.02 -0.13 -0.24 -0.25* Not working ATSI -0.23* 0.32*** 0.10 -0.21 -0.15 -0.26 -0.06 NESB -0.16*** 0.02 0.13*** -0.00 -0.20*** 0.13 -0.11
WITHIN EFFECTS
Female . . . . . . . Age 17-34 35-44 -0.04 -0.06 0.04 -0.22*** -0.01 -0.11 -0.15* 45-54 -0.02 -0.04 0.04 -0.31*** 0.07 -0.07 -0.24*** 55-64 -0.10* -0.13*** -0.02 -0.26*** 0.15** -0.44*** -0.27*** 65+ -0.27*** -0.19*** -0.07* -0.25*** 0.31*** -0.67*** -0.16 Class Petty bourgeoise -0.01 0.09 0.07 0.22 -0.26** -0.01 -0.01 Employer 0.28*** -0.03 -0.04 0.41*** -0.23** 0.11 -0.00 Skilled managers (L1)
0.48*** -0.10 -0.08 0.30** -0.13 0.09 -0.10
Other managers 0.21 -0.03 -0.03 0.24 -0.06 0.18 0.30 Professionals 0.27*** -0.11* -0.01 0.31*** -0.12 0.12 -0.11 Skilled technical (L2)
0.23* -0.19* -0.04 0.11 0.05 0.59** 0.07
Other technical 0.11 -0.08 -0.06 0.27* -0.07 -0.05 -0.10
15
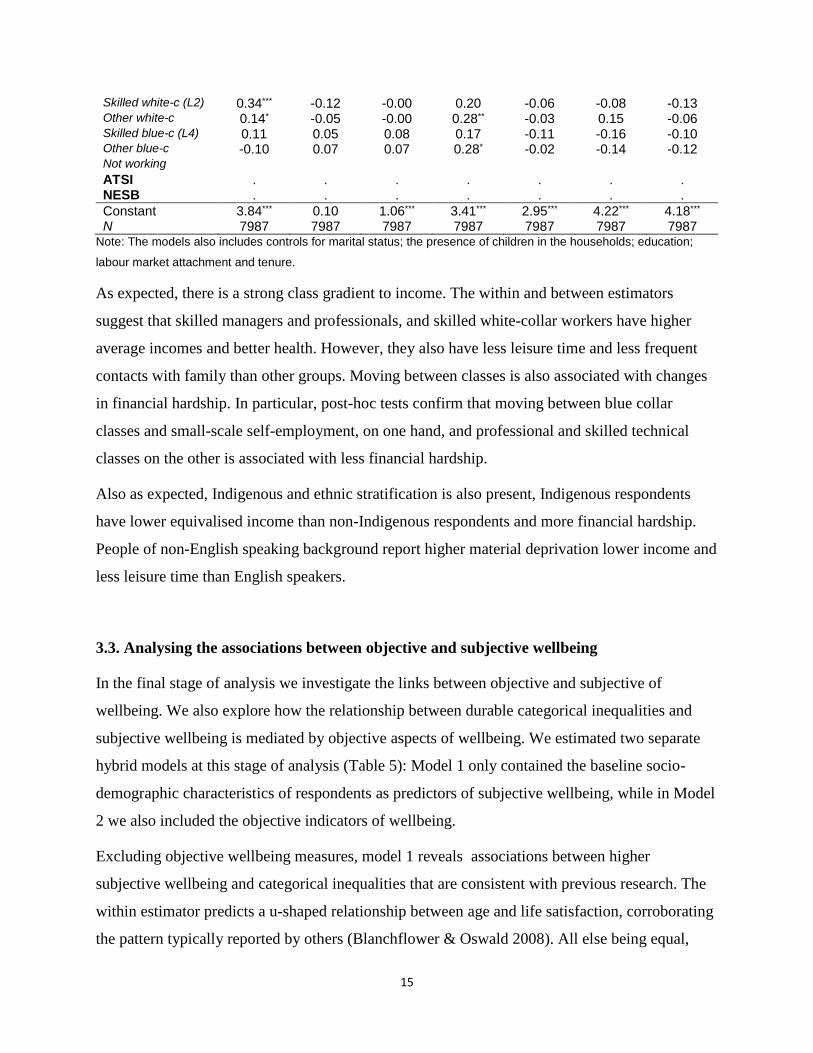
Skilled white-c (L2) 0.34*** -0.12 -0.00 0.20 -0.06 -0.08 -0.13 Other white-c 0.14* -0.05 -0.00 0.28** -0.03 0.15 -0.06 Skilled blue-c (L4) 0.11 0.05 0.08 0.17 -0.11 -0.16 -0.10 Other blue-c -0.10 0.07 0.07 0.28* -0.02 -0.14 -0.12 Not working ATSI . . . . . . . NESB . . . . . . .
Constant 3.84*** 0.10 1.06*** 3.41*** 2.95*** 4.22*** 4.18*** N 7987 7987 7987 7987 7987 7987 7987
Note: The models also includes controls for marital status; the presence of children in the households; education;
labour market attachment and tenure.
As expected, there is a strong class gradient to income. The within and between estimators
suggest that skilled managers and professionals, and skilled white-collar workers have higher
average incomes and better health. However, they also have less leisure time and less frequent
contacts with family than other groups. Moving between classes is also associated with changes
in financial hardship. In particular, post-hoc tests confirm that moving between blue collar
classes and small-scale self-employment, on one hand, and professional and skilled technical
classes on the other is associated with less financial hardship.
Also as expected, Indigenous and ethnic stratification is also present, Indigenous respondents
have lower equivalised income than non-Indigenous respondents and more financial hardship.
People of non-English speaking background report higher material deprivation lower income and
less leisure time than English speakers.
3.3. Analysing the associations between objective and subjective wellbeing
In the final stage of analysis we investigate the links between objective and subjective of
wellbeing. We also explore how the relationship between durable categorical inequalities and
subjective wellbeing is mediated by objective aspects of wellbeing. We estimated two separate
hybrid models at this stage of analysis (Table 5): Model 1 only contained the baseline socio-
demographic characteristics of respondents as predictors of subjective wellbeing, while in Model
2 we also included the objective indicators of wellbeing.
Excluding objective wellbeing measures, model 1 reveals associations between higher
subjective wellbeing and categorical inequalities that are consistent with previous research. The
within estimator predicts a u-shaped relationship between age and life satisfaction, corroborating
the pattern typically reported by others (Blanchflower & Oswald 2008). All else being equal,

16
women report higher subjective wellbeing, despite being objectively disadvantaged (cf. Table 4),
which mirrors the findings reported earlier for Australia (Cummins et al. 2003). There are also
within effects for class with movements between professional and petty bourgeois classes and
not working being associated with higher life satisfaction, and movements between professional
and petty bourgeois locations and other managerial classes being associated declining life
satisfaction.
Table 5 Between and within effects from mixed-effects hybrid regression models on subjective
wellbeing (Satisfaction with Life Scale)
BETWEEN EFFECTS WITHIN EFFECTS
Model 1 Model 2 Model 1 Model 2 Female 0.13** 0.16*** . . Age 17-34 35-44 0.00 -0.01 -0.28*** -0.12 45-54 0.01 0.04 -0.43*** -0.22** 55-64 -0.06 -0.02 -0.23* -0.05 65+ -0.14 -0.10 0.06 0.14 Class Pet bourg -0.21 -0.22 0.52** 0.52*** Employer -0.04 -0.02 0.25 0.08 Skilled managers (L1)
-0.03 -0.02 0.21 0.02
Other managers -0.01 -0.04 -0.25 -0.44* Professionals -0.10 -0.10 0.30* 0.15 Skilled technical (L2)
-0.03 0.02 0.09 -0.08
Other technical -0.34* -0.33 0.19 0.06 Skilled white-c (L2)
-0.13 -0.13 0.25 0.15
Other white-c -0.08 -0.05 0.20 0.07 Skilled blue-c (L4)
0.16 0.10 0.09 0.10
Other blue-c -0.12 -0.10 0.10 0.07 Not working ATSI 0.26 0.51** . . NESB -0.10 -0.02 . . Income 0.04 -0.04 Financial hardship
-0.08 -0.19***
Material deprivation
-0.14** -0.60***
Health 0.16*** 0.38*** Leisure 0.05* 0.13*** Contacts w/ family
0.02 0.03
Contacts w/ friends
0.06** 0.17***
Positive events -0.01 -0.01 Negative events 0.00 -0.09***

17
Constant 4.91*** 3.18*** 4.91*** 3.18*** N 7987 7987 7987 7987
Note: The models also includes controls for marital status; the presence of children in the households; education;
labour market attachment and tenure
The within effects for Model 2 reveals strong positive associations between several objective
measures of wellbeing and life satisfaction. Better health, more leisure time more frequent
contacts with friends and less material deprivation and less financial hardship were all
independently associated with higher subjective wellbeing. However, income and contacts with
family which did not appear to have independent effects on life satisfaction, once other aspects
of objective wellbeing have been accounted for. The lack of an income effect is noteworthy,
because there is substantial debate about whether income and life satisfaction are related
(Kahneman and Deaton 2010) but we do not know of studies that also control for changes in
deprivation and financial hardship when they measure shifts in relative income. We also find a
statistically significant association between the incidence of negative events and lower life
satisfaction, but we do not see a mirror effect for positive events.
Differences in life satisfaction associated with categorical inequalities generally persist even
once objective differences in wellbeing have been taken into account (Model 2), which is counter
to our expectations. In fact the positive coefficients on subjective wellbeing for women, and even
more so for Indigenous people, increase once the objective aspects of wellbeing are accounted
for. These findings imply processes of life satisfaction adaptation for women and Indigenous
respondents that are partly masked when gender and Indigenous differences in objective
wellbeing indicators are not taken into account. They can also suggest differences in expectations
and aspirations between gender and ethnic categories (Tomaszewski & Perales 2013). Finally,
although moving to the petty bourgeoisie from other classes was associated with lower objective
wellbeing on several measures, moving into the petty bourgeoisie from management, technical
work or not working is associated with higher life satisfaction.
4. Conclusions
This paper has provided one of the first longitudinal analyses of inequalities in objective and
subjective wellbeing in Australia and one of the first internationally to link objective wellbeing

18
measures with subjective evaluations of life satisfaction. We have attempted to capture a number
of aspects of objective and subjective wellbeing and take into account critical factors that could
moderate them, such as the incidence of positive and negative events in people’s lives. We were
also able to use multiple measures from the same individuals over time and decompose variation
in objective and subjective wellbeing into the between-persons and within-persons components.
Our research shows a number of key findings. First, objective features of wellbeing are not
equally distributed, even in a “highly developed” (on the HDI scale) and egalitarian society such
as Australia. Women, Aboriginal people and Torres Strait Islanders, people from non-English
speaking backgrounds and those in more disadvantaged classes experience worse objective
wellbeing than men, non-Indigenous Australians, English speaking Australians, and those in
middle class jobs. There are also some more nuanced differences in objective well- being with
respect to age. These results suggest that gender, age, class, ethnicity and Indigenous status are
sources of categorical inequality of the kind described by Tilly (1998). They confirm our first
hypotheses about structural sources of inequality.
Importantly, objective wellbeing is also strongly associated with subjective satisfaction with life
– better (worse) objective wellbeing linked to better (worse) life satisfaction. Thus even though
there is a strong tendency in Australia and other Western societies for people to report high
levels of life satisfaction (Cummins and Nistico 2002), subjective wellbeing is still strongly
shaped by the objective conditions of people’s lives. The within effects show that life satisfaction
varies with changes in people’s economic and social circumstances. We do not have enough data
to know if short or long term changes in people’s social and economic conditions (i.e. objective
wellbeing) have long term effects on their subjective wellbeing (cf. Headey 2010) but the fact
that changes in objective wellbeing net of short term life events influence subjective wellbeing
provides some evidence that individual life satisfaction is variable. This finding parallels cross-
national comparative findings that population subjective wellbeing at the country level varies
with country-level differences in objective wellbeing (Diener at al., 2010) and also indirectly
supports arguments that longitudinal variations in life-satisfaction imply that homeostatic set-
points can be reset (Headey 2010).
Furthermore, contrary to what we expected, durable categorical inequalities, such as gender,
Indigenous status and class have effects on life satisfaction that are independent of objective
19
differences in wellbeing. It is likely that various mechanisms are at work here. The Nussbaum
(2006) has argued that women’s generally high reported life satisfaction in many countries,
despite objectively worse circumstances, is very likely due to adaptive preference formation –
making do, in the presence of a bad situation. A similar gender difference is typically found with
respect to work satisfaction (Clark 1997) and with women’s satisfaction with the gender division
of labour in the home (Baxter and Western 1998). These findings are typically explained by
adaptive preference formation and lower expectations among women than men, or by related
arguments about women’s “intrinsic” or “constitutional” high levels of satisfaction (Cummins et
al. 2003). Because we find large positive effects of Indigenous status on life satisfaction, when
objective inequalities are controlled, a similar argument could apply to Australians from
Aboriginal and Torres Strait Islander backgrounds who experience arguably the most profound
disadvantage in Australia (Dockery 2010).
Moreover, although life-satisfaction is grounded in the circumstances and experiences of
people’s lives, our objective well-being measures do not necessarily capture all relevant elements
of these circumstances. In addition to objective conditions, peoples’ lives are grounded in
relationships of social evaluation, esteem and comparison in which they both judge and are
judged. Our research does not consider how these processes are related to life satisfaction. The
persistence of categorical differences in life-satisfaction despite controlling for objective
differences in well-being may reflect these kinds of unmeasured mechanisms, which if time
varying, would not be addressed through the hybrid models used here..
However, the very strong linkages between objective and subjective wellbeing imply that if we
address objective differences in wellbeing we will also improve subjective evaluations of
wellbeing for many members of the population. One of the critical target groups, for policy,
however, is the segment of the population experiencing the most profound levels of objective
disadvantage, that is, the lowest level of objective wellbeing on multiple indicators. In future
research we intend to identify this group, based on their relative positioning on each of the
objective measures, and track entry and exit into and out of this state. The policy responses to
extremely low objective wellbeing are quite different if it is a temporary rather than enduring
feature of people’s lives.

2
References
Arthaud-Day, M. L. and Near, J.P. 2005 ‘The wealth of nations and the happiness of nations:
Why "accounting" matters’, Social Indicators Research, 74:511-48.
Australian Bureau of Statistics 2006 ANZSCO - Australian and New Zealand standard
classification of occupations, Canberra: Australian Bureau of Statistics.
Australian Bureau of Statistics 2010 Demographic Statistics, June 2010, Canberra: Australian
Bureau of Statistics.
Baxter, J. H., and Western, M.C. 1998 ‘Satisfaction with Housework: Examining the Paradox’,
Sociology, 32:101-20.
Bellani, L. and D'Ambrosio, C. 2011 ‘Deprivation, social exclusion and subjective well-being’,
Social Indicators Research, 104(1): 67-86.
Blanchflower, D. & Oswald, A. 2008 ‘Is well-being U-shaped over the life cycle?’, Social
Science & Medicine, 66(8):1733-1749.
Blau, F, Brinton, M and Grusky D 2006, The Declining Significance of Gender? New York,
Russell Sage Foundation.
Charles, M. and Grusky, D. 2004. Occupational Ghettos: The World- wide Segregation of
Women and Men. Stanford, CA: Stanford University Press.
Chiswick, B. R., & Miller, P. W. (1995). TheEndogeneity Between Language and Earnings:
International Analyses. Journal of Labor Economics 13, 246-288.
Clark, A.E. 1997 ‘Job Satisfaction and Gender: Why are Women so Happy at Work?’ Labour
Economics, 4, 341-72.
Clark, A. E., Georgellis, Y., Lucas, R. E., and Diener, E. 2004 ‘Unemployment alters the set
point for life satisfaction’, Psychological Science, 15:8–13.
Cummins, R. A. 1995 ‘On the trail of the gold standard for subjective well-being’, Social
Indicators Research, 35:179-200.

3
Cummins, R. A., Eckersley, R., Pallant, J., Van Vugt, J., and Misajon, R. 2003 ‘Developing A
National Index Of Subjective Wellbeing: The Australian Unity Wellbeing Index’, Social
Indicators Research, 64:159-90.
Cummins, R. A., and Nistico, H. 2002 ‘Maintaining Life Satisfaction: The Role Of Positive
Cognitive Bias’, Journal Of Happiness Studies 3:37-69.
De Bortoli, L. and Thomson, S. 1010. ‘Contextual factors that influence the achievement of
Australia’s Indigenous students: Results from PISA 2000–2006’, Camberwell: ACER Press.
Department of Immigration and Border Protection 2013. Australian Citizenship: Our Common
Bond. Canberra: Commonwealth of Australia.
Diener, E., Helliwell, J. F., and Kahneman, D. (eds) 2010 International Differences in Wellbeing,
New York: Oxford University Press.
Diener, E., Emmons, R. A., Larsen, R. J., & Griffin, S. (1985). The Satisfaction with Life Scale.
Journal of Personality Assessment, 49, 71-75.
Dockery, A.M. 2010. Culture and Wellbeing: the Case of Indigenous Australians. Social
Indicators Research. 99: 315-332.
Duncan, G.J., & Murnane, R. (eds.), (2011). Whither Opportunity. New York: Russell Sage;
Ferrer-i-Carbonell, A. & Frijters, P. (2004). How Important is Methodology for the estimates of
the determinants of Happiness?, The Economic Journal, 114(497), 641-59.
Frijters, P., Haiskens-DeNew, J.P. and Shields, M. 2004. ‘Investigating the Patterns and
Determinants of Life Satisfaction in Germany Following Reunification’. The Journal of Human
Resources, XXXIX, 649-674.
Goldthorpe, J. H. 2007 On sociology (2nd ed.) Stanford, CA: Stanford University Press.
Gordon, D., Adelman, L., Ashworth, K., Bradshaw, J., Levitas, R., Middleton, S., Pantazis, C.,
Patsios, D., Payne, S., Townsend, P. and Williams, J. (2000) Poverty and social exclusion in
Britain, York: Jospeh Rowntree Foundation.

4
Grusky, D. B., and Kanbur, R. 2006 Introduction: The Conceptual Foundations of Inequality and
Poverty Measurement in D. B. Grusky and R. Kanbur (eds) Poverty and Inequality (pp. 1-29),
Stanford, CA: Stanford University Press.
Head, B.W. 2008. Wicked Problems in Public Policy. 3: 101-118.
Headey, B. 2010 ‘The Set Point Theory of Well-Being Has Serious Flaws: On the Eve of a
Scientific Revolution?’ Social Indicators Research, 97:7-21.
Islam, A. and Paransnis, J. 2014. Immigrant-Native Wage Inequality Across Occupational
Sectors in Australia. Department of Economics Discussion paper. Melbourne, Monash
University.
Kahneman, D and Deaton, A. 2010. High income improves evaluation of life but not emotional
well-being. Proceedings of the National Academy of Science. 107: 16489-16493. doi:
10.1073/pnas.1011492107.
Lucas, R. E., Clark, A. E., Georgellis, Y., and Diener, E. 2003 ‘Reexamining adaptation and the
set point model of happiness: Reactions to change in marital status’, Journal of Personality and
Social Psychology, 84:527–39.
Markus, A and Semyonov M 2010. Introduction in Immigration and National Buidling: Australia
and Israel Compared. Cheltenham, Edward Elgar.
Mayer, K. U. 2009. ‘New Directions in Life Course Research’. Annual Review of Sociology, 35:
413-433.
Mundlak, Y. 1978. On the pooling of time series and cross-section data. Econometrica, 46, pp.
69–86.
Neckerman, K. 2004a Introduction. In K. Neckerman (ed.) Social Inequality (pp. xvii-xxvi),
New York: Russell Sage.
Neckerman, K. 2004b Social Inequality, New York: Russell Sage.
Nussbaum, M. C. 2000 Women and human development: the capabilities approach, Cambridge:
Cambridge University Press.

5
Nussbaum, M. C. 2006 Poverty and Human Functioning: Capabilities as Fundamental
Entitlements in D. B. Grusky and R. Kanbur (eds), Poverty and Inequality (pp. 47-75), Stanford,
CA: Stanford University Press.
Pavot, W. G., Diener, E., Colvin, C. R., & Sandvik, E. (1991). Further validation of the
Satisfaction with Life Scale: Evidence for the cross-method convergence of well-being measures.
Journal of Personality Assessment, 57, 149-161.
Ridgeway, C 2014 Why status matters for inequality, American Sociological Review, 79, 1-16
Rittel, H.W.J, and Webber, M.M. 1973. Dilemmas in a General Theory of Planning. Policy
Sciences. 4(2): 155-169
Sen, A. 1973 On economic inequality, Oxford: Clarendon Press.
Sen, A. 1976 ‘Poverty: An Ordinal Approach to Measurement’, Econometrica, 44, 219-31.
Sen, A. 1985. Commodities and Capabilities, Amsterdam: North-Holland.
Sen, A. 1992 Inequality re-examined, New York: Russell Sage Foundation.
Sen, A. 1999 Development as freedom, Oxford: Oxford University Press.
Sen, A. and Drèze J. 1989. Hunger and Public Action. Oxford: Clarendon Press.
Spurrier, N. J., Sawyer, M. G., Clark, J. J. and Baghurst, P. 2003, ‘Socio-economic differentials
in the health-related quality of life of Australian children: results of a national study’. Australian
and New Zealand Journal of Public Health, 27: 27–33.
Stiglitz, J. E., Sen, A., and Fitoussi, J.-P. 2009. Report by the Commisson on the Measurement of
Economic Performance and Social Progress.
Temkin, L. 1993. Inequality, Oxford: Oxford University Press.
Tilly, C. 1998. Durable Inequality. Berkeley: University of California Press.
Tomaszewski, W. & Perales, F. 2013. 'Who Settles for Less? Subjective Dispositions, Objective
Circumstances, and Housing Satisfaction', Social Indicators Research, doi: 10.1007/s11205-013-
0420-x.

6
United Nations Development Programme (UNDP) 2011 Sustainability and Equity: A Better
Future for All, New York and Basingstoke: United Nations Development Programme and
Palgrave Macmillan.
Wilkinson, R. G. 2005 The impact of inequality: how to make sick societies healthier, New
York: The New Press.
Wilkinson, R. G., and Pickett, K. 2009 The spirit level: why more equal societies almost always
do better, London: Allen Lane.
Wright, E. O. 1997 Class counts: comparative studies in class analysis, Cambridge: Cambridge
University Press.
Wright, E. O. 2009 Understanding class: towards an integrated analytic account, New Left
Review, 101-116.
Zucchelli, E., Jones, A., Rice, N. and Harris. A. 2010. The effects of health shocks on labour
market exits: Evidence from the HILDA survey. Australian Journal of Labour Economics,
13(2):191-218.