socio-economic impact of fiber to the home in swedenmaguire/degree-project-reports/130226-… ·...
TRANSCRIPT

Degree project inCommunication Systems
Second level, 30.0 HECStockholm, Sweden
Z I Y I X I O N G
Socio-economic Impact ofFiber to the Home in Sweden
K T H I n f o r m a t i o n a n d
C o m m u n i c a t i o n T e c h n o l o g y

S
SoFibe
School o
ocio-er to
AcadInd
Cof Inform
KTH R
econthe
Ziy
2
Mast
Examinedemic Supedustrial Su
Communmation aRoyal In
Stockh
i
nomicHom
yi Xio
2013-02-2
ter’s T
er: G. Q. Mervisor: Gpervisor:
nication and Comnstitute oholm, Sw
c Impme in
ng
26
hesis
Maguire JrG. Q. Magu
Marco For
Systemmmunicaof Technweden
pact Swe
ire Jr rzati
s tion Tec
nology
of den
chnologyy

i
Abstract
Fiber-to-the-Home (FTTH) has been talked about since the introduction of fiber in the 1970s. It is nowadays shaping up to be the foundation of our new digital society, bringing economic prosperity and a multitude of business, social, and entertainment opportunities to its users. The increased consumer demand for high-speed network accessibility is being taken more and more seriously and a fiber-based network is able to cope with these growing demands due to its wide bandwidth and reliability. Today there is a practical need for quantitative analysis regarding the socio-economic impacts of fiber-based access networks. This analysis could be used as an indicator/reference for all the stakeholder entities as they consider future investments and developments. Sweden is a suitable target country for this analysis since it has adopted fiber for some years and the benefits that FTTH has brought seem to already be tangible.
The primary value of this thesis lies in investigation of its quantified evidence of the socio-economic impacts of FTTH deployment in Sweden. This has been achieved based on data from the Swedish Post and Telecommunications Authority (PTS), Statistics Sweden (SCB), previous related studies, and information collected on-line from operators involved in the fiber market, along with empirical analysis based on multivariate regression models.
The results of the study show that fiber penetration has had a significant impact on the population’s evolution, specially the net amount of migration into a municipality, which indicates the attractiveness of municipalities per se. It is therefore reasonable to suggest that local government and local authorities take fiber deployment into consideration, if they want to attract people to stay for further local development. The study also analyzed the competition in fiber-based open networks and the prices of subscribing for 10/10 Mbps symmetrical Internet Service. Study findings revealed that networks with multiple competing service providers have a wider range of services and a lower price: the more ISPs competing in a fiber network, the lower consumer prices. Specifically, for each new service provider present in the network, there will be 5 SEK per month decrease of the average price of the Internet services, and an approximately 7 SEK per month reduction in the lowest price.
Nevertheless, a number of socio-economic impacts remain unquantifiable as of the current time and due to the limited available data. It is recommended to incorporate more socio-economic effects in future research in order to draw a more complete picture for all the interested sectors, and to supplement the data with recent figures for 2012 and 2013.
Key Words: Fiber-to-the-home, FTTH, Broadband Technologies, Open Access Fiber Network, Socio-economic impact, Population Evolution, Migration, ISP competition, Price of Internet Service, Municipalities, Sweden


iii
Sammanfattning
Fiber till hemmet (Fiber-to-the-Home, FTTH) har talats om sedan fiber introducerades på 1970-talet. Det håller numera på att bli grunden för vårt nya digitala samhälle, och bidra till ekonomiskt välstånd och medföra en mängd affärsmässiga, sociala och underhållningsmässiga möjligheter till slutanvändare. Den ökade efterfrågan på höghastighetsnät tas mer och mer på allvar och ett fiberbaserat nät kan hantera dessa ökade krav på grund av dess breda bandbredd och tillförlitlighet. Idag finns ett praktiskt behov av kvantitativ analys av de socioekonomiska effekterna av fiberbaserade accessnät. Denna analys kan användas som en indikator och referens för alla intressenter när de överväger framtida investeringar. Sverige är ett lämpligt målland för denna analys eftersom den har antagit fiber i några år och de fördelar som FTTH har fört verkar redan vara synliga.
Det huvudsakliga värdet av denna avhandling ligger i utredningen av kvantifierade bevis för de socioekonomiska effekterna av FTTH utbyggnad i Sverige. Detta har uppnåtts på grundval av uppgifter från den Post- och telestyrelsen (PTS), Statistiska centralbyrån (SCB), tidigare liknande studier och information som samlats in på nätet från aktörer inom fiber, tillsammans med empirisk analys baserad på multivariate regressionsmodeller.
Resultatet visat att fiber har haft en betydande inverkan på befolkningens utveckling, speciellt netto in- och utflyttning till en kommun, vilket indikerar attraktionskraft kommunerna i sig. Det är därför rimligt att föreslå att kommunerna och de lokala myndigheterna överväger fiber driftsättning på allvar om de vill locka invånare att stanna för ytterligare lokal utveckling. Studien analyserar också konkurrensen på fiberbaserade öppna nät och priserna på 10/10 Mbps symmetrisk Internet-tjänst. Resultaten visar att nätverk med flera konkurrerande tjänsteleverantörer har ett bredare utbud av tjänster och ett lägre pris: ju fler Internetleverantörer i ett fibernät, desto lägre konsumentpriser. Mer specifikt, för varje ny tjänsteleverantör som finns i nätverket, minskar det genomsnittliga priset med 5 kronor per månad, och det lägsta priset med cirka 7 kronor per månad.
Ändå förblir ett antal socioekonomiska effekter omätbara på grund av begränsade tillgängliga data. Rekommendationen är att införliva fler socioekonomiska effekter i framtida forskning för att dra en mer komplett bild för alla berörda sektorer, och att komplettera data med färska siffror för 2012 och 2013.
Nyckelord: Fiber-to-the-home, FTTH, Bredband, Öppet access fibernät, Socioekonomiska konsekvenser, Population Evolution, Migration, ISP konkurrens, Internettjänst Pris, Kommuner, Sverige


v
Acknowledgements
First and foremost, I would like to express my profound gratitude and deepest regards to my academic supervisor Prof. Gerald Q. Maguire Jr. (School of ICT, KTH), for his valuable time and exemplary guidance throughout the course of this thesis. I cannot be more grateful for his elaborate and insightful comments that inspired me in improving the work. His rigorous attitude in scientific research has enlightening me and shall continuously benefit me in my future work.
This project would have been impossible without the extremely valuable support and guidance from Dr. Marco Forzati, my industrial supervisor at Acreo. I would like to express my heartfelt gratitude, for giving me the opportunity to present my skills, and constantly supporting me, and sharing his knowledge throughout the whole project. I very much appreciate it, as I was enriched every day, from every single discussion with him, which was the most invaluable experience to me.
I would also like to show my sincere gratitude to Mr. L Christer Lie (School of CSC, KTH), who is the best mentor I have ever met. The blessing, help and guidance given by him time to time during my master’s studies shall carry me a long way in my life.
Furthermore, I am obliged to Ms. May-Britt Eklund-Larsson for all her cordial help, and all the great teachers at KTH for equipping me with the latest knowledge in both technical and business fields. I also want to express my gratitude to Mr. Crister Mattson for confirming the value of my research, as well as Mr. Viktor Nordell, Mr. Walter Margulis, and all of the stuff at Acreo AB, I am highly grateful for all their invaluable supports and making me feel like at home.
Last but not least, I am especially grateful to my dear parents for their unconditional support, great understanding, constant encouragement and their infinite love. I would like to thank my special one, all my friends and everyone else who supported and inspired me during my life. I have been fortunate enough to have you by my side. Love you.
Ziyi Xiong
18th Feb 2013, Stockholm


vii
Table of Contents
Abstract .......................................................................................................................... i
Sammanfattning ......................................................................................................... iii
Acknowledgements ...................................................................................................... v
Table of Contents ....................................................................................................... vii
List of Figures .............................................................................................................. ix
List of Tables ............................................................................................................... xi
List of Acronyms and Abbreviations ..................................................................... xiii
1 Introduction .......................................................................................................... 1 1.1 Project overview ............................................................................................ 1 1.2 Thesis outline ................................................................................................. 2 1.3 Readers ........................................................................................................... 2
2 Background ........................................................................................................... 3 2.1 What is FTTH? .............................................................................................. 3
2.1.1 FTTH Network Environment ................................................................... 3 2.1.2 Fiber-based Access Network Architectures ............................................. 4 2.1.3 FTTH Topologies..................................................................................... 5
2.2 Why deploy Fiber-to-the-Home? ................................................................. 5 2.2.1 From a Technical Perspective .................................................................. 7 2.2.2 From a Socio-economic Perspective ...................................................... 10 2.2.3 From Environmental Perspective ........................................................... 13
2.3 Current Status of Fiber Penetration .......................................................... 14 2.3.1 Determinants of Fiber Penetration ......................................................... 16 2.3.2 Open Access Network............................................................................ 17
3 Methodology ........................................................................................................ 21 3.1 Selection of Parameters .............................................................................. 21 3.2 Econometric Methodology .......................................................................... 22 3.3 Data Processing ........................................................................................... 23
3.3.1 Data Collection ...................................................................................... 23 3.3.2 Applied Tools ......................................................................................... 24
4 Analysis and Results ........................................................................................... 27 4.1 Population Evolution .................................................................................. 27
4.1.1 Workplaces ............................................................................................ 30 4.1.2 Residential places................................................................................... 33 4.1.3 Excess of Migration ............................................................................... 36 4.1.4 Birth Rate ............................................................................................... 40
4.2 Competition and Price of Internet Service ............................................... 43
5 Conclusions and Future Work .......................................................................... 53 5.1 Conclusions .................................................................................................. 53 5.2 Future Work ................................................................................................ 54 5.3 Required Reflections ................................................................................... 55
References ................................................................................................................... 57

viii
Appendix A – Robustness Test .................................................................................. 63
A-I. Normality Test .................................................................................................... 63
A-II. Multicollinearity Test ....................................................................................... 64
A-III. Heteroskedasticity Test ................................................................................... 64
ix
List of Figures
Figure 2-1: Types of FTTH sites .......................................................................................................... 3 Figure 2-2: Different types of FTTx networks ..................................................................................... 4 Figure 2-3: Point-to-point network and Point-to-multipoint network[12] ........................................... 5 Figure 2-4: Various Broadband Technologies and Their Maximum Data Rates[28] ........................... 7 Figure 2-5: Fiber Subscriptions per 100 Inhabitants in OECD Countries (as of December 2011)
[46] ................................................................................................................................ 14 Figure 2-6: Development of Number of Subscriptions to Fixed Broadband by Access
Technologies in Sweden [48]......................................................................................... 15 Figure 2-7: Fiber Penetration at the County Level in Sweden (publicly available at PTS
website [44], [50]) ......................................................................................................... 16 Figure 2-8: Typical Open Access Value Chain ................................................................................... 18 Figure 2-9: Different Open Access Network Models[65] .................................................................. 19 Figure 3-1: Effects of FTTH Deployment [28] .................................................................................. 21 Figure 3-2: Screenshot of the phpMyAdmin GUI to our database .................................................... 25 Figure 4-1: Linear Prediction of Population Evolution 2007-2010 on FTTH Penetration at
Workplaces .................................................................................................................... 33 Figure 4-2: Linear Prediction of Population Evolution 2007-2010 on FTTH Penetration at
Residential Places .......................................................................................................... 35 Figure 4-3: Plot of FN Residential Places vs. FN Workplaces ........................................................... 35 Figure 4-4: Linear Prediction of Excess of Migration on FTTH Penetration at Workplaces ............. 39 Figure 4-5: Linear Prediction of Excess of Migration on FTTH Penetration at Households ............. 39 Figure 4-6: Linear Prediction of Birth Rate on FTTH Penetration at Workplaces ............................. 42 Figure 4-7: Linear Prediction of Birth Rate on FTTH Penetration at Residential Places .................. 42 Figure 4-8: Linear Prediction of Price vs. number of ISPs via Telia Öppen Fiber............................. 48 Figure 4-9: Linear Prediction of Lowest Price vs. Number of ISPs via Stadsnät .............................. 51 Figure 4-10: Plot of Average Price vs. Number of ISPs via Stadsnät ................................................ 52


xi
List of Tables
Table 2-1: FTTx variants ...................................................................................................................... 4 Table 2-2: Previous Research on Economic Impact of Traditional Broadband ................................... 6 Table 2-3: Previous Research on Socio-economic Benefits of FTTH ............................................... 12 Table 4-1: Regression: Population Change 2007-2010 vs. Population Change 1998-2007 ............... 29 Table 4-2: Regressing Results: Population Evolution 2007-2010 vs. FTTH Penetration 2007 at
Workplaces and Population Change 1998-2007 ............................................................ 30 Table 4-3: Regressing Results: Population Evolution 2007-2010 on FTTH Penetration 2007 at
Workplaces and 3 other factors ...................................................................................... 31 Table 4-4: Pearson Correlation of Population Evolution Regression Model ..................................... 32 Table 4-5: Regressing Results: Population Evolution 2007-2010 vs. FTTH Penetration 2007 at
Households and Population Change 1998-2007 ............................................................ 33 Table 4-6: Regressing Results: Population Evolution 2007-2010 on FTTH Penetration 2007 at
Households and 3 other factors ..................................................................................... 34 Table 4-7: Regressing Results: Excess of Migration 2008-2010 on FTTH Penetration 2007 at
Workplaces and 3 other factors ...................................................................................... 38 Table 4-8: Regressing Results: Excess of Migration 2008-2010 on FTTH Penetration 2007 at
Households and 3 other factors ..................................................................................... 38 Table 4-9: Regressing Results: Birth Rate 2008-2010 on FTTH Penetration 2007 at
Workplaces and 3 other factors ...................................................................................... 40 Table 4-10: Regressing Results: Birth Rate 2008-2010 on FTTH Penetration 2007 at
Households and 3 other factors ..................................................................................... 41 Table 4-11: Robust Regression: Price vs. Number of ISPs ................................................................ 44 Table 4-12: Robust Regressing Results: Price 2012 vs. Number of ISPs 2012 and
Population Change 2002-2011 ....................................................................................... 45 Table 4-13: Robust Regression Results: Given NP Flags .................................................................. 46 Table 4-14: Robust Regression Results: via Telia Öppen Fiber ......................................................... 47 Table 4-15: Robust Regression Results: Given Län Flags ................................................................. 48 Table 4-16: Pearson Correlation of Price Regression Model ............................................................. 49


xiii
List of Acronyms and Abbreviations
ARPU Average Revenue per User
CAPEX Capital Expenditures
DSL Digital Subscriber Line
FTTB Fiber to the building
FTTC Fiber to the curb
FTTH Fiber to the home
FTTN Fiber to the node
GDP Gross Domestic Product
ICT Information and Communication Technology
ISP Internet Service Providers
LAN Local Area Network
NP Network Provider
OECD Organization for Economic Co-operation and Development
OPEX Operational Expense
P2P Point to Point
PIP Physical Infrastructure Provider
POP Point of Presence
QoE Quality of Experience
QoS Quality of Service
SP Service Provider
UE User Experience


1
1 Introduction
This chapter introduces the problem area with a brief introduction, followed by a statement of the purpose of the research and the questions to be addressed. The thesis outline and necessary context are provided for readers who interested in this topic.
1.1 Project overview The Internet has emerged as a critical component of society’s communications
infrastructure in the last two decades. Of the many advanced technologies that fall under the Information and Communication Technology (ICT) umbrella, broadband communications is perceived as the future of Internet and the availability of broadband access is continuously driving the evolution of advanced communication services and overall economic growth[1,2]. Given the increasing importance of ICT in the knowledge-based and communications-intensive economy, people have realized that those who adapted to the revolution are increasingly at a competitive advantage. In many countries, this awareness has matured as an important national agenda to promote nationwide deployment of broadband services, in particular of fiber-based access technologies.
Compared to the traditional broadband connections, fiber-based access networks (often referred as Fiber-to-the-Home, FTTH * ) based upon its virtually unlimited capacity and future-proof nature, is considered to uncork the “last mile” † bottleneck in terms of Quality of Experience (QoE) and Quality of Service (QoS) that traditional broadband technologies have[3]. Yet there is still a debate among scholars and policy makers as to whether it is necessary to promote or invest in FTTH, as it is possible to deliver services over the existing copper-based broadband infrastructure or even broadband wireless access networks[4]. Therefore, there is a need to study what benefits FTTH has already brought. There have been some dedicated studies concerning the benefits of fiber-based access networks (see[5–7]), but there seems to have been almost no quantitative econometric study measuring the socio-economic impact of fiber-based access networks. This study aims to fill this information gap by quantifying the socio-economic effects of FTTH networks.
It is not surprising that there is little econometric analysis done on the impact of fiber-based access networks, due to the fact that relatively few fiber networks have been deployed and the data is scarce. Sweden has been a leading country in the adoption of FTTH over the past decade. According to Organization for Economic Co-operation and Development (OECD) statistics at the end of 2011, it is the OECD-EU country that has the highest proportion of fiber subscribers out of all fixed broadband subscribers[8,9]. Sweden is therefore considered as a good target for an analysis of the benefits of FTTH, because some of the social, economic, and environmental benefits that FTTH has brought are believed to already be tangible[10]. Looking at the effects at an inter-municipal level within the country will help us avoid variance due to cultural differences.
* Collectively named FTTx networks, where x refers to different cases, e.g. Cabinets (FTTC), Buildings (FTTB), and Homes (FTTH). All of these will be referred to as FTTH in this report, but we indicate which applies where it is relevant. † The final stretch of connection that delivers voice, data and video to end users’ homes and offices.

2
This Master’s project* was carried out at Acreo AB, a Swedish research institute providing leading edge solutions within the field of electronics, fiber optics, and communication technology. This research institute is based in Kista, Stockholm. Acreo is currently very active in enhancing fiber optic technologies and evaluating the effects of Next Generation Access technologies on society and the economy in Sweden. Acreo has performed an early stage study on FTTH’s impacts on population and employment[4].
The study reported in this thesis targets quantifying empirical evidence of the socio-economic impacts of FTTH deployment in the context of Sweden at a municipal level, with attempts to robustly extend the earlier research on population evolution and to look deeper into the market in terms of competition and the price of Internet service. On these networks, typically triple-play services are offered, which consist of Internet access, Television, and Telephony, and the service we are analyzing in the thesis is the Internet access † (specifically: 10/10Mbps symmetric Internet access speed). Because on one hand, Internet access is most commonly required and sold service; on the other hand, it is a well-specified commodity, which in principle has no service differentiation, meaning service value/quality (e.g., 10/10Mbps symmetric) is the same everywhere, hence the price differences are not due to the inherent value of the service, we can therefore analyze it on the equal term. These findings could serve as a reference to whoever is interested an in the future development of or making investments in fiber based access networks.
1.2 Thesis outline The thesis starts with a theoretical framework for FTTH, to equip readers with the
necessary background information. In Chapter two, the benefits of FTTH are illustrated from both technical and socio-economic perspectives in order to explain why it is worthwhile deploying FTTH and why consumers would like to pay for fiber-based Internet access. Chapter three introduces the methods utilized in the research, from data collection to processing and analysis. The calculations and findings are presented and discussed in detail in chapter four. Subsequently, the implications of this research, along with discussions of its constraints and possible directions for future work are provided in Chapter five.
1.3 Readers This thesis should be easily understood by readers who are interested in the socio-
economic impact of FTTH, with or without a prior background in ICT, networking, or economic issues related to FTTH. This thesis is specifically target for:
• Governments or municipalities, • Telecommunication operators, • Service providers, • Residential associations, • Venture capital investors, and • Scholars who is interested in FTTH
* Part of the European ICT-OASE project, which is financed by the European Commission’s FP7 programme. † VoIP and IPTV are not included in our analysis as the varied service differentiations (e.g., package definition, HD service) make it difficult to analyze on equal term.

3
2 Background
This chapter introduces the essential background information concerning FTTH. The aim is to explain why it FTTH is worth adopting by illustrating the benefits of FTTH from technical, socio-economic, and environmental perspectives.
2.1 What is FTTH? The theoretical background of FTTH and its environmental context, as well as the
difference between FTTH and other FTTx technologies are briefly introduced in this section.
2.1.1 FTTH Network Environment Fiber-to-the-home (FTTH) is a network connection using optical fiber directly
from the access network operator’s network to the home. Conceptually, FTTH is an access network architecture using optical fiber to extend optical interconnection to reach the boundary of a living or working space. The characteristics of optical fiber technology not only provided greater bandwidth, but also enhanced network transparency in regards to data format, rate, wavelength and protocol; relaxing the demands on the links’ environmental conditions and power supply; and simplifying maintenance and installation[11].
In a FTTH network, a central point, known as an access node or point of presence (POP), provides connectivity to the subscribers via one or more optical fibers. Each access node can connect to other access networks, for instance, wireless local area networks and mobile wide area networks. A FTTH network can be built as a part of wide area access networks. Depending upon the specific country’s policies & regulations and the geographic location of the subscribers, FTTH networks are normally deployed in different sites, such as cities, residential areas, rural areas, and for single family and multi-family dwellings[12]. These different types of FTTH sites are shown in Figure 2-1. Regardless of the FTTH site locations, the fiber optic communication signals are generally terminated at the subscriber’s endpoint.
Figure 2-1: Types of FTTH sites
4
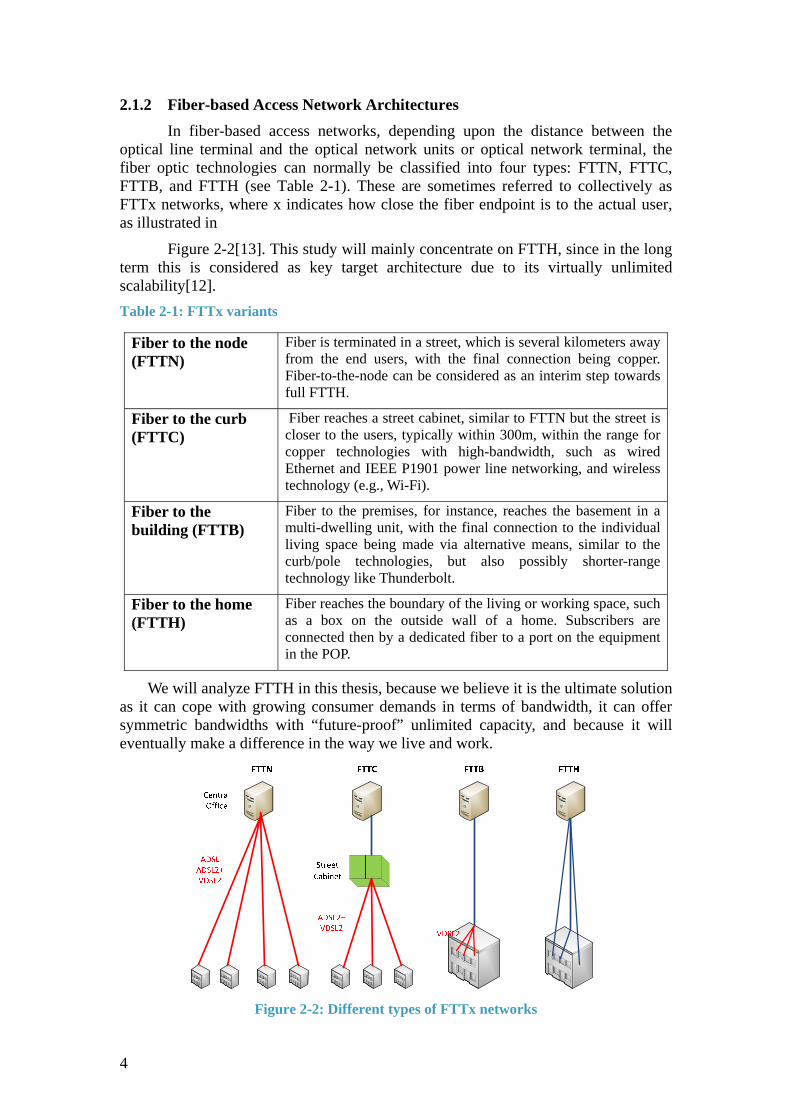
2.1.2 Fiber-based Access Network Architectures In fiber-based access networks, depending upon the distance between the
optical line terminal and the optical network units or optical network terminal, the fiber optic technologies can normally be classified into four types: FTTN, FTTC, FTTB, and FTTH (see Table 2-1). These are sometimes referred to collectively as FTTx networks, where x indicates how close the fiber endpoint is to the actual user, as illustrated in
Figure 2-2[13]. This study will mainly concentrate on FTTH, since in the long term this is considered as key target architecture due to its virtually unlimited scalability[12]. Table 2-1: FTTx variants
Fiber to the node (FTTN)
Fiber is terminated in a street, which is several kilometers away from the end users, with the final connection being copper. Fiber-to-the-node can be considered as an interim step towards full FTTH.
Fiber to the curb (FTTC)
Fiber reaches a street cabinet, similar to FTTN but the street is closer to the users, typically within 300m, within the range for copper technologies with high-bandwidth, such as wired Ethernet and IEEE P1901 power line networking, and wireless technology (e.g., Wi-Fi).
Fiber to the building (FTTB)
Fiber to the premises, for instance, reaches the basement in a multi-dwelling unit, with the final connection to the individual living space being made via alternative means, similar to the curb/pole technologies, but also possibly shorter-range technology like Thunderbolt.
Fiber to the home (FTTH)
Fiber reaches the boundary of the living or working space, such as a box on the outside wall of a home. Subscribers are connected then by a dedicated fiber to a port on the equipment in the POP.
We will analyze FTTH in this thesis, because we believe it is the ultimate solution as it can cope with growing consumer demands in terms of bandwidth, it can offer symmetric bandwidths with “future-proof” unlimited capacity, and because it will eventually make a difference in the way we live and work.
Figure 2-2: Different types of FTTx networks

5
2.1.3 FTTH Topologies Two topologies are widely used in FTTH networks: point-to-point (P2P) topology
(which normally uses Ethernet transmission technologies) and point-to-multipoint) topology (which is frequently combined with passive optical network (PON) technology). See Figure 2-3.
In P2P topologies each subscriber has a direct, uninterrupted connection to the access point or central office via a dedicated fiber (or fiber pair). Most P2P FTTH networks use Ethernet transmission technologies, since Ethernet is easier to configure and operate than other transmission technologies, especially for business applications. PON technology can also use a P2P topology by placing a passive optical splitter at the access point.
In point-to-multipoint topologies routing is accomplished optically using passive optical splitters with standardized PON technologies*. Only one fiber is needed in the shared feeder part in this architecture and time-sharing protocols are used to control the access of multiple subscribers[11]. In such a point-to-multipoint topology Active Ethernet technology can also be used to control subscriber by deploying Ethernet switches in the field.
Figure 2-3: Point-to-point network and Point-to-multipoint network[12]
2.2 Why deploy Fiber-to-the-Home? The world has witnessed the rapid development of the ICT sector and its impact
on society. It is doubtless that improvements due to the use of ICT technologies will stimulate economic growth (e.g. in terms of increased gross domestic product (GDP), increased employee productivity, etc.) at a certain level according to [14–16]. Among various technologies, the enhancement of the telecommunication infrastructure has been vital to both technical and economic changes[17]. Since late 1990s, broadband deployments sparked scholars’ interests into research on the potential economic impact of broadband access networks. Many of these researchers have highlighted the positive impact on the wider economy, such as [2,18]. Recent studies also indicates broadband is a driving factor that accelerates economic growth in terms of GDP, but the degree to which it does varies with the ICT maturity of the country[19–28]. The results of previous research on the economic impact of traditional broadband are summarized in Table 2-2. * GPON is today’s frontrunner standard in Europe, while EPON is most popular in Asia[12].

6
Table 2-2: Previous Research on Economic Impact of Traditional Broadband
Source Covered Scope Key Findings & Major Conclusions [19] Input-output calculation on
impacts of investments in broadband in the German economy
To achieve 75% household broadband penetration of at least 50Mb/s access speed by 2014, 407,000 new jobs will be created. A 10 year investment in broadband (2010-2020) would lead to 0.6% increase in annual GDP growth.
[20] Econometric investigation on productivity growth in 15 OECD nations (14 European nations, and USA)
Sweden has experienced the 2nd highest growth in broadband penetration among the target countries during 1998-2007. The economic impact of adding a broadband connection is greater in countries that have a good ICT environment and faster broadband diffusion. A 1% increase in broadband penetration results in a positive impact on GDP ranging from $160 million/year in Finland to $12 billion/year in USA.
[21] Cross-sectional model covers data of 120 countries
Broadband has a significant impact on economic growth and the significance is greater in developed countries than in developing countries, due to a longer track record of broadband diffusion.
[22] Effects of broadband penetration on Output and Employment: Cross-sectional data covers 2003-2005 period in 48 states of USA
Employment and Output in both manufacturing and services industries (especially finance, education, and health care) is positively correlated with broadband penetration. A 1% increase in broadband penetration is associated with an increase of ~300,000 jobs in the entire USA.
[23] Instrument Variable (IV) regression approach on 20 OECD countries panel data covering 1996-2007 period
Positive impact on GDP per capita: an increase of 10% in broadband penetration would stimulate GDP per capita growth by 0.9% – 1.5% in subsequent years.
[24] 15 European Union countries’ data between 2003-2006
There are increasing returns on broadband telecommunication investments, especially in Scandinavia countries.
[25] Cross-sectional data of communities in USA, covers 1998-2002 period
Broadband enhances economic activities (e.g., establishment and economic growth in IT intensive sectors, job positions, residential property values etc.)
[26] Econometric model on GDP per household for a developed country sample with panel data from 2005-2009
Positive direct effect on country GDP per household, especially in the high income samples. Significant effect on decreasing inefficiency.
[27] From a technological and political perspective analysis on the impact of increasing broadband penetration on trade in Sweden, by means of regression analysis
High broadband penetration is highly correlated with a high level of international trade in the context of broadband access in Sweden, which leads to the conclusion that high-speed Internet access has a positive impact on the economy in terms of increased international trade.

7
One may argue why we still need fiber, as we already have traditional broadband access networks, which already have had a positive impact on economic growth, i.e., the benefits of fiber-based access networks seems could also be attained by traditional broadband technologies (e.g. Cable*, DSL†, Wi-Fi/WiMax, and 3G/4G) over the existing infrastructure. This question will be answered from several different perspectives, in the following subsections.
2.2.1 From a Technical Perspective FTTH possesses the greatest capacity (due to its bandwidth) in comparison with
the traditional broadband technologies (see Figure 2-4). The virtually unlimited capacity of FTTH and the characteristics of optical fibers enable the user’s maximum data rate to not decrease with the distance between the access node and the end-user. Similarly the number of users who share the network does not have a large effect upon each of the user’s individual maximum data rates. The guaranteed bandwidth and unprecedented reliability are far beyond what traditional broadband access networks can offer.
Figure 2-4: Various Broadband Technologies and Their Maximum Data Rates[28]
People have grown dependent upon digital resources, with enriched experience due to increasingly unlimited storage and bandwidth; hence the “future proof” FTTH is perfectly aligned to meet these demands. A study regarding the potential economic benefit of widespread diffusion of high-speed access broadband indicates that both consumers and operators can benefit substantially from broadband access networks. These result suggests the annual consumer benefits can eventually reach $300 billion and the operators could easily earn another $100 billion per year from increased demand for services via broadband access networks[2]. Compared with traditional broadband access networks, FTTH’s superiority is expected to bring even greater benefits. The following paragraphs described some of these expected benefits for consumers and for operators.
* DOCSIS technology, which uses coaxial cable to carry both television and data signals connecting home users to the Internet[29]. † Often known as xDSL, which existing telephone lines (twisted pair wiring) are used[29], [30].

8
2.2.1.1 Benefits for Consumers As to the user experience (UE), nothing could better fulfill consumers’ demands
than good reliability and high capacity. Fiber has proven to possess highest bandwidth and unprecedented reliability among all of the broadband technologies. As a result:
• Users with a 100 Mbps FTTH connection can download content over 10 times faster than users with a typical 8 Mbps ADSL connection.
• With higher bandwidth in the uplink and downlink directions, multitasking, passive-networking (multiple on-line applications running passively in the background) demands can be fully met.
• The higher reliability ensures a more personalized touch, as well as greater privacy and security per service and user.
• Multiple choices of fast Ethernet access speed, limited only by the speed provided by the ISPs.
• QoS and QoE are assured within the access network, enabling high quality reception of the content that previously would have been carried by broadcast radio and TV signals.
• Adaption to standard radio and TV equipment, subscribers can use set-top boxes or another type of converter for additional services.
Moreover, the stability of FTTH means that users suffering less downtime, thus FTTH users show the highest satisfaction level with their internet service than users of other access methods according to a study carried by Troulos[31]. This study reported that the percentage of satisfied users of FTTH was 85%, whereas cable users had a 75% satisfaction rate and DSL users only 60%.
The Next Generation Access service portfolio study[10] showed that higher bandwidth leads consumers to spend more time using existing Internet services, as well as giving them the ability to use new services. This study found that FTTH subscribers are net contributors to the Internet, uploading more material than they download, while utilizing 3~5 times more bandwidth than ADSL users. It also suggests that with increasing bandwidth, there will be greater demands for new services and the consumer will spend more time using existing services, thus driving consumer adoption of new services and potentially leading to new usage patterns of value added services, such as e-learning, distance working, high quality and reliable e-health services, simpler and more transparent interaction with public services (e-government), etc.
2.2.1.2 Benefits for Operators In the massive and over-crowded telecommunications market, FTTH can be
considered as a perfect Blue Ocean Strategy[32] for operators who can gain a strong competitive advantage, by providing better technical performance, more economic solutions in terms of low Capital Expenditures (CAPEX) and Operational Expense (OPEX), and a strategically superior platform that can offer differentiated services at a lower cost[33].

9
As a future-proof infrastructure, FTTH offers:
• Longer life-time
Fiber itself is made of plastic or glass. The resulting fiber (and jacket) is robust and degrades extremely slowly, thus optic fiber and optic fiber cables can last in excess of 25 years (the uncertainty in this lifetime prediction is small[34] and is further supported by the fiber deployments that have already been in place for more than this period of time). When a bandwidth upgrade is needed, all one needs is to change the equipment on the ends of the fiber when the active equipment reaches the end of its lifespan, typically seven years (the same period as any other broadband technology). In contrast, alternative technologies (e.g. VDSL) have a limited operating life making payback challenging for the operator. No operators want to invest in repeated upgrades with a very short timeframe. As bandwidth demands increase rapidly with technological advances, fiber give service providers a future-proof network infrastructure with guarantees on bandwidth, versatility, and optimization that are needed for the future.
• Lower CAPEX and OPEX
A FTTH network has significantly lower operating costs than existing copper or coaxial cable networks. Fiber is considered the medium for long distance communication, because the cost of transmitting a single phone conversation over fiber optics is only about 1% the cost of transmitting the same call of over a copper wire. Great bandwidths combined with lower operating cost bring long distance communication in line with network operators’ large-scale using patterns. Additionally, fiber links are capable of supporting multiple protocols flexibly. The FTTH network consumes 20 times less electricity than a VDSL access network with the same number of subscribers. Fiber reduces the network operations and maintenance costs by simplifying control and troubleshooting, which leads to lowering the cost of hiring maintenance professionals since the process can be fully automated and software controlled.
• High competence on offering new services
Communication over fiber gives service providers future-proof network infrastructure guarantees. With FTTH, richer services can be delivered to the subscribers in a multi-room and multi-screen approach, which will increase the demand for service assurance and remote management solutions for in-home services. The ability to offer new services is a strong competence requirement for service providers (SPs) to stay ahead in a highly dynamic and competitive market, and can eventually attract and retain consumers with faster access data rates and enriched QoE.
• Capacity to meet future demands
Flexible network architecture design, excellent scalability, and relatively mature functionality (e.g. for P2P) allow fiber-based access networks to easily support future upgrades and expansion. Utilizing a passive optical network maximizes the capacity availability for future service demands, by directing connecting each end user to the operator’s active equipment. The tradeoff between technical and economic demands facing network owners and operators can be met with FTTH.
10
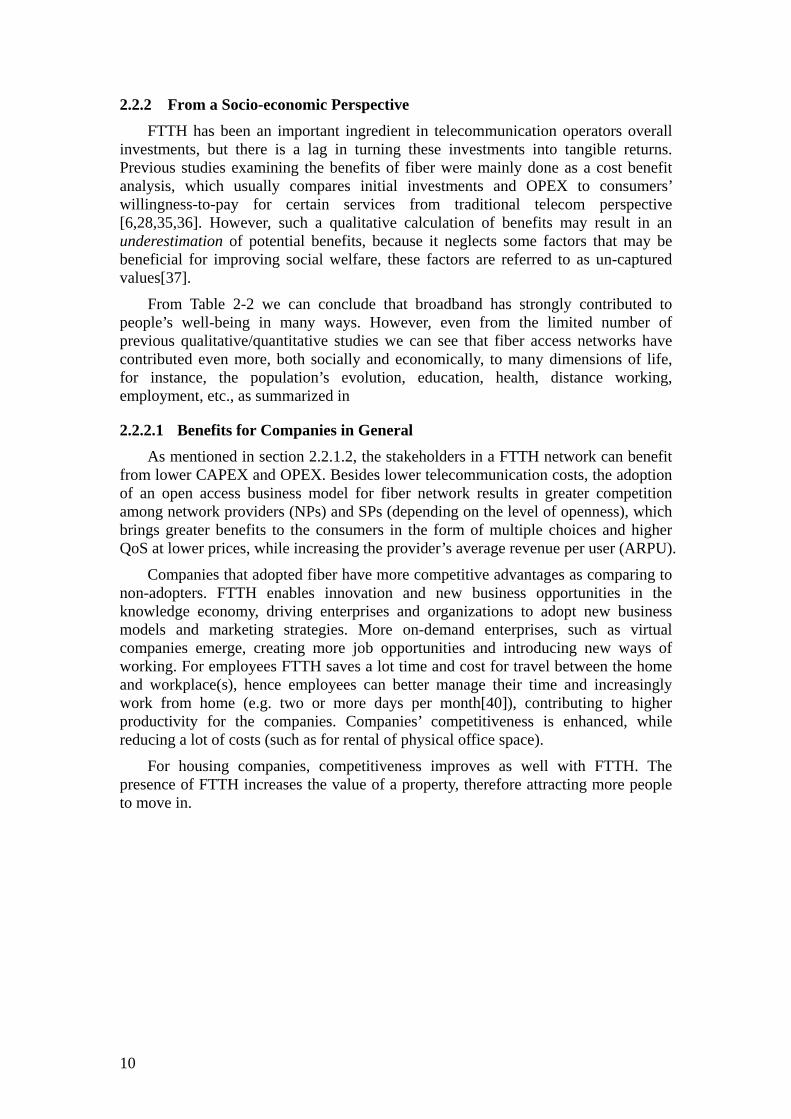
2.2.2 From a Socio-economic Perspective FTTH has been an important ingredient in telecommunication operators overall
investments, but there is a lag in turning these investments into tangible returns. Previous studies examining the benefits of fiber were mainly done as a cost benefit analysis, which usually compares initial investments and OPEX to consumers’ willingness-to-pay for certain services from traditional telecom perspective [6,28,35,36]. However, such a qualitative calculation of benefits may result in an underestimation of potential benefits, because it neglects some factors that may be beneficial for improving social welfare, these factors are referred to as un-captured values[37].
From Table 2-2 we can conclude that broadband has strongly contributed to people’s well-being in many ways. However, even from the limited number of previous qualitative/quantitative studies we can see that fiber access networks have contributed even more, both socially and economically, to many dimensions of life, for instance, the population’s evolution, education, health, distance working, employment, etc., as summarized in
2.2.2.1 Benefits for Companies in General As mentioned in section 2.2.1.2, the stakeholders in a FTTH network can benefit
from lower CAPEX and OPEX. Besides lower telecommunication costs, the adoption of an open access business model for fiber network results in greater competition among network providers (NPs) and SPs (depending on the level of openness), which brings greater benefits to the consumers in the form of multiple choices and higher QoS at lower prices, while increasing the provider’s average revenue per user (ARPU).
Companies that adopted fiber have more competitive advantages as comparing to non-adopters. FTTH enables innovation and new business opportunities in the knowledge economy, driving enterprises and organizations to adopt new business models and marketing strategies. More on-demand enterprises, such as virtual companies emerge, creating more job opportunities and introducing new ways of working. For employees FTTH saves a lot time and cost for travel between the home and workplace(s), hence employees can better manage their time and increasingly work from home (e.g. two or more days per month[40]), contributing to higher productivity for the companies. Companies’ competitiveness is enhanced, while reducing a lot of costs (such as for rental of physical office space).
For housing companies, competitiveness improves as well with FTTH. The presence of FTTH increases the value of a property, therefore attracting more people to move in.

11
Table 2-3.
According to these earlier studies, the resulting indirect and induced benefits of increasing FTTH penetration can be categorized in detail from different social beneficiaries’ perspectives. These are described in the following subsections.
2.2.2.2 Benefits for Companies in General As mentioned in section 2.2.1.2, the stakeholders in a FTTH network can benefit
from lower CAPEX and OPEX. Besides lower telecommunication costs, the adoption of an open access business model for fiber network results in greater competition among network providers (NPs) and SPs (depending on the level of openness), which brings greater benefits to the consumers in the form of multiple choices and higher QoS at lower prices, while increasing the provider’s average revenue per user (ARPU).
Companies that adopted fiber have more competitive advantages as comparing to non-adopters. FTTH enables innovation and new business opportunities in the knowledge economy, driving enterprises and organizations to adopt new business models and marketing strategies. More on-demand enterprises, such as virtual companies emerge, creating more job opportunities and introducing new ways of working. For employees FTTH saves a lot time and cost for travel between the home and workplace(s), hence employees can better manage their time and increasingly work from home (e.g. two or more days per month[40]), contributing to higher productivity for the companies. Companies’ competitiveness is enhanced, while reducing a lot of costs (such as for rental of physical office space).
For housing companies, competitiveness improves as well with FTTH. The presence of FTTH increases the value of a property, therefore attracting more people to move in.

12
Table 2-3: Previous Research on Socio-economic Benefits of FTTH
2.2.2.3 Benefits for Municipalities, Public Bodies, and Communities The participation of public authorities in FTTH deployment will positively
contribute to the social cohesion, and the promotion of FTTH would boost the degree of urbanization of a municipality, thereby enhancing its local competitiveness and attractiveness.
At a local level, efficient governance can be achieved with the adoption of FTTH. Public utilities can improve their intelligent power grids, while efficient public transportation control can reduce traffic congestion and cost of infrastructure maintenance. Public services can be delivered in an intelligent and efficient way that reduces (at least some) administration costs.
Source Covered Scope Key Findings & Major Conclusions [4] [28]
Multivariate regression analysis on effect of FTTH/FTTx in Sweden on employment and population evolution, based on data from 290 municipalities between 2007-2010
Fiber networks are showing statistically significant socio-economic impact with a lag of three years. A 10% increase in population living within 353 meters of a fiber-connected area has a 0.25% positive change in population after three years, and a 0% – 0.2% positive change in employment after two and a half years. Cost benefit analysis suggests that a total of 56 billion SEK invested on FTTH (with 30% fiber penetration) in Sweden will lead to an increase in GDP of up to 52 billion SEK.
[5] Qualitative studies based on interviews (2009) in Sweden and an analysis of the Eindhoven study
Fiber deployment brings distinct economic and social benefits to health, education, and other public services; it stimulates new ways of working and leads to GDP growth.
[7] [31]
Qualitative assessment based on surveys (2009 and 2010 respectively) in Bulgaria
FTTH users in 2009 had an average of 10% additional benefit compared to non-adopters. FTTH/FTTB users have the highest satisfaction level of all broadband users. FTTH/FTTB encourages distance working (tele-working). In 2010, 66% of Bulgarians agreed that availability of high-speed broadband connectivity affects their selection of a residence.
[38] Quantitative cross-sectional analysis for 16 experimental communities and 16 matched control cities in USA, between 1998-2002
Potential economic improvement (e.g. annual employment rate, mean annual household income, and educational attainment) could arise if FTTH is present in a community. Indicators, such as annual employment rate, mean annual household income, and educational attainment, are significantly higher in cities that have adopted FTTH than in cities that did not adopt FTTH.
[39] Cross-sectional data covers 25 countries over the period of 1999-2009
FTTx broadband has a positive impact on economy growth.

13
Closer collaboration in building up/sharing fiber networks (e.g. Stadsnät*) among municipalities, communities, and other public sectors, can consolidate social and business relationships, while providing a cooperation platform for new business opportunities and networked public services. This is especially good for rural areas, which could benefit to a greater extent from newly established business and investment, bring increased economic attractiveness in terms of increased job opportunities, increased immigration, and increased tax revenues while reducing welfare expenditures.
2.2.2.4 Benefits for Society at Large FTTH is a key economic driver that indirectly generates an overall annual
increase in GDP of a country, through various enhanced and newly attracted business - as well as through new investment. FTTH is cost-efficient in delivering public services, and can already save up to 1.5% of costs in the four main public economic sectors – Electricity, Transportation, Education, and Health, besides the direct benefits to the telecommunication industry[40].
High-speed network access and increased ICT maturity improve the way people live and work. An e-learning services pool of educational resources benefits knowledge seekers without limitations in time or space. E-health supports remote diagnostics, improving healthcare services with higher efficiency in information sharing and treatment. E-governance brings transparency of authorities. Distance working reduces physical transportation, resulting in reduced traffic congestion. People’s safety in traffic is enhanced while contributing to GDP with high productivity, and the increase in job opportunities leads to higher regional attractiveness in terms of increased immigration, especially of skilled labor. E-entertainment and social networking changes the way people entertain and communicate, while broadening their social groups, enrich their cultural and social experiences. All these effects have directly and indirectly improved people’s wellbeing in terms of their quality of life leading to a higher degree of satisfaction, while stimulating further innovation in public services. Together these effects produce visible economic growth and ultimately drive positive societal development.
2.2.3 From Environmental Perspective Fiber is a green technology that supports the transportation of data over one cable
and one network, ecologically eliminating the waste of raw materials, unnecessary parallel infrastructures, and extra power provisioning, which would be needed for other communication infrastructures. Unlike others, its future-proof characteristics minimize the environmental damage of future upgrades. Therefore the ecological contribution of FTTH is considered as a vital sustainable utility driver for low carbon economic development, as every one million users connected to FTTH save at least one million tons of CO2 [40], thus utilization of FTTH can save equivalent CO2 emission of 4,600 km car driving per year per household[41]. Furthermore, the FTTH induced effects of reduced commuting and reduced public traffic congestion as well as lower power utilization; positively contribute to a large extent to sustainable environmental development.
* Indicates the municipality fiber networks. We will use this term - stadsnät -throughout the thesis.
14
2.3 Current Status of Fiber Penetration According to OECD statistics, fixed broadband subscriptions reached 314 million
in the OECD area by the end of 2011. The overall share of DSL subscriptions continued to decrease to 55.8% with coaxial cable having a penetration rate of 30%, while FTTH subscriptions represent 13.7% of the total number of fixed broadband subscriptions[8]. A FTTH/B panorama across 35 countries in Europe, shows an increased average fiber take up rate of 18.4%, indicating FTTH/B is expanding its coverage with a 28% positive growth in FTTH/B subscribers and rollout progressed at an annual rate of 41% in 2011[9,42].
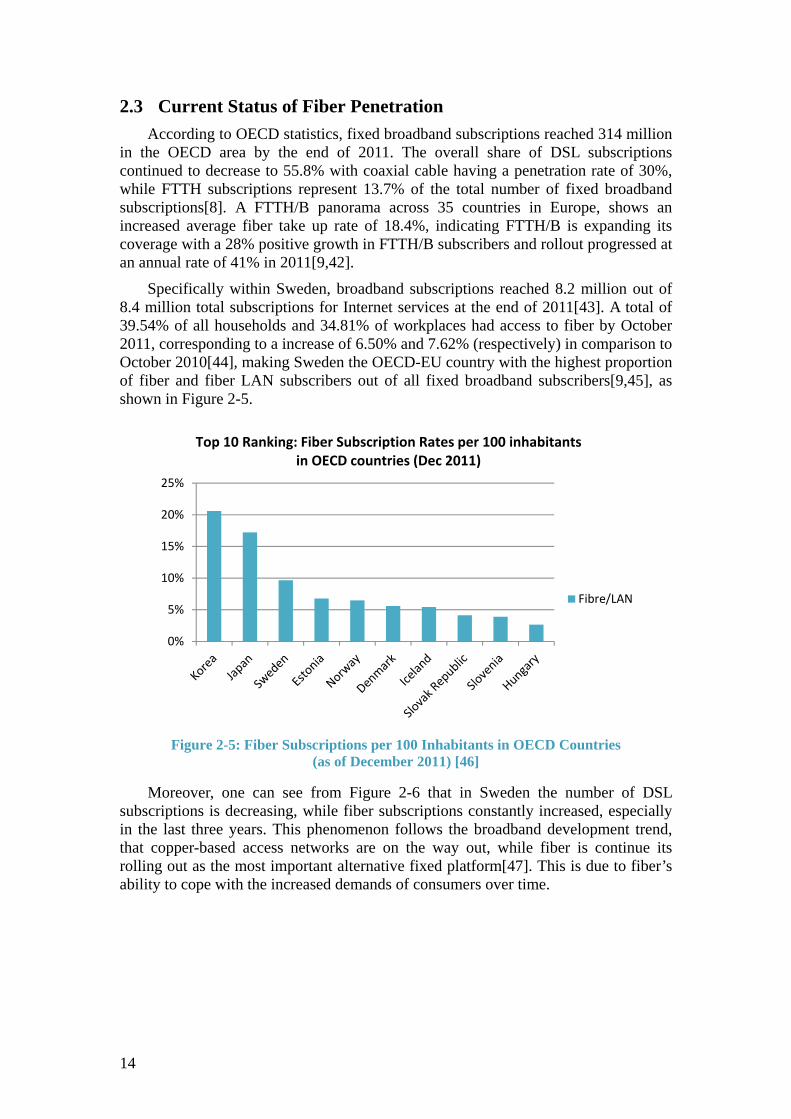
Specifically within Sweden, broadband subscriptions reached 8.2 million out of 8.4 million total subscriptions for Internet services at the end of 2011[43]. A total of 39.54% of all households and 34.81% of workplaces had access to fiber by October 2011, corresponding to a increase of 6.50% and 7.62% (respectively) in comparison to October 2010[44], making Sweden the OECD-EU country with the highest proportion of fiber and fiber LAN subscribers out of all fixed broadband subscribers[9,45], as shown in Figure 2-5.
Figure 2-5: Fiber Subscriptions per 100 Inhabitants in OECD Countries
(as of December 2011) [46]
Moreover, one can see from Figure 2-6 that in Sweden the number of DSL subscriptions is decreasing, while fiber subscriptions constantly increased, especially in the last three years. This phenomenon follows the broadband development trend, that copper-based access networks are on the way out, while fiber is continue its rolling out as the most important alternative fixed platform[47]. This is due to fiber’s ability to cope with the increased demands of consumers over time.
0%
5%
10%
15%
20%
25%
Top 10 Ranking: Fiber Subscription Rates per 100 inhabitants in OECD countries (Dec 2011)
Fibre/LAN

15
Figure 2-6: Development of Number of Subscriptions to Fixed Broadband*
by Access Technologies in Sweden [48]
Figure 2-7 vividly illustrated the fiber penetration at county (Län) level in Sweden. In Figure 2-7(a) the green areas indicate existing fiber connectivity, while the blue areas
indicate newly connected areas (between October 2010 and October 2011) with coverage at workplaces and households. It can be noticed that fiber deployment has a large geographical variation in densely populated areas and sparsely populated areas. Most newly fiber-connected areas are found on the west coast, in the southern part of
Värmland County, and in Stockholm County. More specifically, Sundbyberg municipality (Kommun) in Stockholm County possess the highest penetration of fiber accessibility in workplaces and households among all 290 municipalities in Sweden, while there is only one municipality that seems to completely lack fiber access[44].
Figure 2-7(b) illustrates fiber penetration in terms of access availability. Most regions are having at least 10%~40% of availability to access fiber as the orange areas have the largest proportion. This is in line with the general access performance of fixed broadband in Sweden, with a grown availability (accounting for 52.4% of all subscribers) of 10+ Mbps connectivity[47]. Based on the current fiber deployment trends, Sweden is forecasted to reach fiber maturity by 2014[42, 49], accompanied with a strong political interest in FTTH networks, as the increased broadband penetration is favorable for social and economic development. This interest has directly or indirectly translated into government engagement in the deployment of open access fiber networks in municipalities over the past 10 to 15 years.
* Fiber here includes fiber to the building + LAN within the building.
0200400600800
1,0001,2001,4001,6001,8002,000
NO
. of S
ubsc
riptio
ns (T
hous
ands
)
Development of No. of Subscription by Fixed Broadband Access Technologies
xDSL
Cable TV
Fibre LAN
Dial-upInternetOther

16
Nytillkommen fiber mellan oktober 2010 och oktober 2011
Fiber fanns i oktober 2011
Mer än 90%
40 - 55%
55 - 90%
10 - 40%
0 - 10%
Tillgång:
a FTTH Connectivity at County Level b FTTH Access Speed at County Level
Figure 2-7: Fiber Penetration at the County Level in Sweden
(publicly available at PTS website [44], [50])
2.3.1 Determinants of Fiber Penetration The deployment of fiber in a country is determined by various factors, such as:
• Industry factors
In the highly competitive telecommunication industry, access technologies with better performance but lower cost would always be the best option from both supply and demand perspectives. Thus technological competition and low cost of deploying infrastructure[51] would be the key factors influencing the adoption of high-speed broadband access networks, such as FTTH. Combined with high access data rates, low price is also an important factor contributing to the high level of broadband penetration as studied in [52–54]. The price may strongly affect consumers’ decisions of which access technology to adopt.
The lower cost of deploying infrastructure would be an advantage to attract greater investment in network deployment from both private and public sectors. Sweden has employed infrastructure investments from both private and public sectors as its national broadband deployment strategy[55, 56].
• Socio-demographic factors
Several studies has shown that population density[57], younger age[52, 53], urbanization[58], and the presence of children[59] are influential factors driving the penetration of high-speed broadband access.

17
In addition, households with higher income and higher educational level prefer to have higher speed access technologies[60, 61]. These factors are therefore believed that would influence the adoption decision of FTTH at a certain degree.
• Policy factors
The Swedish broadband market is regulated subject to the supervision of the Swedish National Regulatory Authorities (NRA) – Post och Telestyrelsen (PTS)[47].
The involvement of local government has been an increasingly important factor in the evolution of the “last-mile” infrastructure[1]. Many municipalities in Sweden have adopted policies to promote FTTH. Their initiatives to deploy municipal FTTH networks have brought tangible economic benefits back to them and made Sweden successful in overall rate of fiber penetration.
The Local Loop Unbundling * (LLU) policy has influenced fix-broadband deployment according to a regression analysis on OECD data[63]. This may bring consumer benefits through open access to competitors in a relatively short term[64].
• Other factors
There are many other factors that may also have impact FTTH penetration, such as user behaviors (e.g. PC, Internet, … usage), network size, service level, available content, etc. These factors also influence the fiber penetration rates.
Note that while these factors influence the rate of fiber adoption, they may also interact intimately in a complex way.
2.3.2 Open Access Network To date it is estimated that 95% of the municipal fiber networks in Sweden are
operating with an open access model[65]. The traditional telecommunication model is vertically integrated with a single entity that delivers a service, operates the network, and owns a network infrastructure that is dedicated to specific (telephony, radio, and television) services. Considering the specific geographical conditions of Sweden (i.e., that is large in area with 85% of population densely live in urban areas, while 15% live in more sparsely populated areas[45]), it is highly inefficient and unprofitable for traditional large operators to provide broadband access at sustainable prices in remote areas. However, the need for broadband access is as great in these rural areas as in other areas of the country. Therefore a large number of rural municipalities have deployed open access fiber networks, because the open access model is sufficient to meet their specific demands. Some of these municipal networks have formed regional associations to connect to different networks, in order to facilitate access by their users to various service providers and wholesale market actors.
Unlike the traditional telecommunications business model, the open access model maximizes the consumer’s benefits in terms of freedom of choice and presents the highest degree of competition on equal terms in order to avoid monopoly behaviors, by separating the roles of service provider and the infrastructure & network
* Includes all types of LLU: full unbundling, line sharing, and bit stream access[62].

18
provider[66]. Due to different nature (both technical and economic) of the different parts of the network, the open access model also optimizes resource allocation for a passive infrastructure and active equipment by further separating the roles of physical infrastructure provider (PIP) and network provider (NP). The PIP (e.g. municipalities or utilities) typically owns a passive infrastructure and takes care of its physical maintenance, as the PIP is normally highly local. A passive infrastructure requires high initial CAPEX, low OPEX, and is hard to duplicate and inherently subject to regulation[65]. The NP (e.g. incumbent operators and broadband companies), on the other hand, usually operates nationally with large economies of scale; hence they can afford the high OPEX of running the active equipment.
Figure 2-8[65] exhibits a typical value chain of the open access model. The PIP builds up the physical infrastructure of the network, lays cables to the premises of end users and charges a monthly connection fee to the NP for providing network access to the NP. In some cases end users pay a one-off connection fee of ~15–20 thousand SEK to the PIP in order to get their single home (i.e. a villa) connected; whereas in case of multi-dwelling units, especially if it is a public housing company, the end users pay ~47 SEK per month to their landlords for the FTTH connection[28]. The NP in the value chain provides users with access, ensures correct network operation, and receives revenue by allowing different SPs to offer services to end users via their (logical) network. In reality, the network is open at different levels depending on which roles different market actors take, and different business models will arise, as illustrated in Figure 2-9.
Figure 2-8: Typical Open Access Value Chain

19
Figure 2-9: Different Open Access Network Models[65]
Swedish fiber-based access networks have matured considerably and have progressively changed from vertical integrated model towards open access models over the years. For example, TeliaSonera is the biggest incumbent with the highest market share in the Swedish telecommunications market. It originally operated as a typical vertically integrated operator (as do most incumbents worldwide) and controlled the whole value chain from fiber infrastructure to network services (as in Figure 2-9(g)). However, today TeliaSonera also finds it profitable to utilize the open access model in different ways. For example, it opens its network at service level, e.g. Telia Öppen Fiber, to allow other SPs to provide attractive services and contents as in Figure 2-9(a), while Telia also offers its own services over the open fiber network, as in Figure 2-9(f). Telia’s LLUB allows multiple actors to work as combined NP and SP (for bundled services, e.g. Triple play), then the model becomes the one shown in Figure 2-9(e). To compete with other NPs, TeliaSonera operates Stadsnät as well, in which by collaborating with municipalities (PIP) who owns a network, Telia acts as NP and takes care of handling the SPs’ (e.g., attracting SPs), thereby openness at the infrastructure level is achieved as the roles of PIP and NP are separated, see Figure 2-9(c, d). If the NP acts as a SP as shown in Figure 2-9(b), the network is not really considered open as there is no competition at either the infrastructure or service levels, and thus the end users have no choice but to subscribe to this single operator. However, on the other hand it is still open because similarly to Figure 2-9(c), the PIP can decide which NP & SP they want to cooperate with for a fixed period of time, when this contract ends the PIP may choose another NP & SP to work with – although the active equipment may need to be replaced.
The Swedish fiber network market is not fully mature yet, but many municipalities have realized that they should focus on providing infrastructure rather than competing with commercial telecommunication companies, thus they have downwards in the value chain. Note that the definition of “open” is flexible and may vary to allow more subdivided roles with different network actors each operating in their own level of the network.


3
fibebeenmeabasetheyquanmunlarganal
3.1
impsoci
depnewsomresp
Method
Unsurprisier penetration deployedasurement, ed access ny should alrntified withnicipality lege enough slysis of sele
SelectioThe deploy
pacting variiety and the
Figure 3-loyment, w
w infrastructme of the effpect to tech
dology
ing there ison, given thd and meand time la
networks duready have h a large evel (specifset of obseected effects
on of Parayment of Fious aspectse economy a
Figur
1 shows thwhich effects
ture and dirfects (espechnological in
s little econhe fact that thodologica
ag issue exiuring recentproduced snumber offically, for ervations fos.
ameters TTH may bs that in tuas a whole,
re 3-1: Effec
he comples are basicarect economially for thennovations,
21
nometric anrelatively f
al limitatioist. Howevet years. For
some tangibf indicatorsthe 290 m
or a high q
bring a numurn would as illustrate
cts of FTTH
ex interactially categorimic activitye indirect an, and there
nalysis donefew fiber-baons pertainer, Sweden r this reaso
ble socio-ecs. Therefore
municipalitiequality mul
mber of beninduce add
ed in Figure
H Deploymen
on of the ized to three
y. Note that nd induced is no theor
e regardingased access
ning to dahas deploy
on, if there onomic effee we collees in Swedeltiple regres
nefits, directditional posi
3-1.
nt [28]
various ee types: higthere may effects) to bretical evide
g the impacs networks hata availabyed many fiare any eff
fects that caected data en) to obtassion statis
tly or indireitive effect
effects of fgh access sp
be time lagbe tangible ence can ai
ct of have ility,
fiber-ffects an be at a
ain a stical
ectly s on
fiber peed, g for with id in

22
determining the precise time lag. To ensure the hypothesis is testable with available data and in light of issue of time lag, a number of quantifiable effects were selected as the focus in this study, including:
• Population evolution In addition to the original population trend, we consider that the utilization of FTTH may increase the attractiveness of a municipality, attracting people to move to the municipality instead of moving out. The effect on population change is not instantaneous and may show up with a delay. We have to carefully avoid the potential problem of backward causality. The population evolution is subdivided into excess of migration and birth rates, as these are the two the main components of population change.
• Competition and price of Internet services: savings/added value for individuals Considering that the open access model of FTTH network has led to a functional separation of SP, NP, and PIP roles, the highly competitive open environment may benefit consumers in the short terms with better services at lower prices. In this study the price is computed as the number of SPs offering 10/10Mbps access services that compete in the same fiber network.
3.2 Econometric Methodology The classical methodology in economics[67] was adopted for this empirical
research. We stated an initial hypothesis, specified the mathematical model and extended this model to an econometric model, then we obtained the data, estimated the parameters of the model to test the hypothesis. Following this we were able to make a prediction based upon the current trend and thereby drew a conclusion.
As to the statistical analysis, a large amount of relevant data for the 290 municipalities of Sweden was collected. We related fiber penetration to our selected socio-economic indicators in order to find out how things have changed over time in these municipalities. In addition to fiber deployment, the socio-economic development of a municipality also depends on many other variables. Therefore a reliable analysis on the impact of fiber penetration must be based on a model that takes as many relevant factors into account, and for that reason multiple regress analysis* [67] is used. The regression model is described as a function shown below: = ( , , , … , )
Equation 3.1
is a dependent variable that denotes a function of the explanatory variables . In our study, is assumed to be a linear function of . The are the various factors that we believe have an impact on the socio-economic indicator ( ) that we want to explain.
Such a model must be evaluated in terms of how well it reflects reality through observations of the measurement collected from these municipalities. Given the probabilistic nature of these factors (e.g. there is an inexact relationship between the economic variables), the difference between and ( , , , … , ) gives a disturbance term: , which represents all those factors that affect but were not explicitly taken into account due to some limitation of the model or possible measurement errors[67].
* Also known as Multivariate regression analysis.

23
In our study Equation 3.1 is written as a multivariate linear function of parameters over which we want to optimize, generally by means of Ordinary Least Squares (OLS). In this way the sum of the square of for all observations is minimized. Equation 3.1 will be presented in exact form in Chapter 4, where the analysis of the effect of fiber deployment and some other influential socio-economic factors is performed.
3.3 Data Processing As a large dataset was essential for this research approach we needed to collect a
suitable amount of data. Due to limited data availability the data was hard to collect, hence data had to be collected through multiple channels. The collected data was processed and stored in a database for stability and security purposes. This data was employed in the regression analyses.
3.3.1 Data Collection Data used in the analysis was mainly collected through four ways:
• Online database of Statistics Sweden (Statistiska Centralbyrån - SCB)
Socio-economic and demographic data (e.g., degree of urbanization, population, regionalism, etc.) was obtained from SCB’s annual reports and their statistical database[68].
• Online database of Swedish Post and Telecommunications Authority (PTS*)
The data for the telecommunication industry (i.e., fiber penetration) was collected from PTS’s online database[44], where fiber penetration in each municipality of Sweden in 2007, 2008, 2009, 2010, and 2011 is provided. However, the data for fiber penetration is only available from 2007 (i.e., no earlier data available), and is defined differently by PTS as percentage of population living in or within 353 meters from a fiber-connected premise† prior to the year 2010 (i.e., 2007-2009). Since then (i.e., 2010 and 2011) fiber penetration is measured based upon the percentage of population with effective access to broadband via fiber or fiber LAN ‡, typically fiber connected to the households (FTTH) or terminated in the basement while households are connected with dedicated CAT 5 Ethernet cables within the building (i.e., a point-to-point network) in a FTTB deployment.
• Data collected manually from SPs, NPs, and Municipalities’ websites
Information concerning the main business sectors in the FTTH market (e.g., number of SPs, prices of subscribing to fiber-based Internet services, various fiber networks) is scarce, vague, and decentralized, and no integrated source was readily available. To ensure the accuracy and reliability of the data to be analyzed, the relevant data at a municipal level was manually collected using a joint search method, which was extensive, complex, and exceptionally time-consuming, but was carefully crafted to enable a more precise determination of the impact of fiber deployment.
* PTS – Post- och Telestyrelsen † In Swedish: “Andel i eller inom 353 meter av en fiberansluten fastighet ”. ‡ In Swedish: “Andel med faktiskt tillgång till bredband via fiber eller fiber-LAN”.

24
Different fiber networks operated by different NPs have different competition and different numbers of SPs. Initially we identified different fiber networks (mainly Öppna Stadsnäts) operated by various NPs in each municipality, as well as a number of the main competitors offering equal services (specifically focusing on 10/10 Mbps symmetric broadband access via fiber, since this access speed is available in most areas in Sweden) in the same fiber networks. Then we collected the service details (e.g. service price, binding period, notice period, etc.) of each SP for different fiber networks via the NPs’ websites. We compared the service details in each municipality with the information that was provided at each SP’s own website. Specifically, the service price was collected and calculated depending on what business model each NP was following. Two major models were identified. For model 1 the NP charges a network connection fee to SPs, which of course is passed on to the end users; hence the service prices found on the SPs’ websites were considered. Whereas for model 2, the NP directly charges end users a network connection fee, hence the final price is the sum of the service fee available on SPs’ websites plus the connection fee found on NPs’ websites. Nevertheless, the substance does not really change. Moreover, campaign prices were not considered in either case. Instead, the original price for subscribing for the same service was used in order to treat each SP equally. Afterwards for unmatched or unclear information, we double-checked via the municipal websites (including municipal owned utilities) and contacts, to verify the information. All the details collected were the latest information for the second half year of 2012.
• Other data sources
To clear up some of the contradictions in the price details and to ensure the information we collected is correct, we verified it through contacts with key players from stadsnät, NPs and SPs, municipalities and power utilities, as well as with the PTS.
3.3.2 Applied Tools This subsection describes the details of the tools used for storing the data and for
the data analysis.
3.3.2.1 Tools for data storage The collected data was originally stored in Excel sheets until it was realized that
this method would not be sufficient stable and secure enough for large-scale storage or future updates to this collection of data. For this reason a database was established and stored on a local server with a suitable configuration. The collected data was saved as a .csv formated file and imported into a MySQL™ open source database with Python™ scripts. The application phpMyAdmin was used for administration of the database. Figure 3-2 illustrates the phpMyAdmin web interface to our database.

3.3.
selemanstatifromcontscripmerinfoben
* OD† SQ
Fig
.2.2 Tools There are
ected as thnagement, aistical analym multiple staining all tpts were wrge it in to aormation abchmarking.
DBC – OpeQL – Structu
ure 3-2: Scr
for data ana number
he main toand compatysis, and offsheets (withthe needed
written to loa dataset (ebout the at
en Databaseured Query
reenshot of t
nalysis of program
ol in this tibility withfers a user-fhout startingvariables f
ad the desireven in the tributes. M
ConnectiviLanguage [
the phpMyA
ms availablstudy, due
h ODBC* afriendly integ with a clefrom our dired set of dexisting wo
Matlab® was
ity [69] [70]
Admin GUI
e for statise to its strand SQL†. erface. Howear dataset) fferent sourdata from oork set) in Ss also used
to our datab
stical analysrong capabIt provides
wever, it canand bcause
rces is esseour MySQLStata®, alond as an aux
base
ysis. Stata® bilities for s the necesnnot import e a large datential, PythoL™ databaseng with detaxiliary tool
25
was data
ssary data taset on™
and ailed l for


27
4 Analysis and Results
Given the expected extensive benefits of FTTH deployment, this chapter relates the theoretical framework to the empirical data for the analysis of the indirect socio-economic benefit of FTTH penetration, with respect of population evolution and network service price, by means of econometric models.
Extending the logical boundaries of an overall positive impact of broadband development on various dimensions of the society and economy, it is rational to propose the hypotheses that: The promotion and utilization of FTTH infrastructure would enhance the attractiveness of a municipality, particularly in terms of increased population change; and an FTTH network open to several market players leads to reduced Internet service prices. The hypotheses are tested in the following sections.
4.1 Population Evolution The trend of population evolution is affected by various factors, which may
influence the attractiveness of a municipality. One of these factors could be the availability of fiber infrastructure – as we argued in section 2.2, that more fiber can lead to more job opportunities and better social welfare, which are important to attract people to move into a municipality and to discourage people from moving out. The hypotheses to be tested are formally stated as: : FTTH penetration does not contribute to the population evolution in Sweden. : FTTH penetration does contribute to the population evolution in Sweden.
The evolution of population size is considered to have a tendency to continue in a trend, unless something else happens[71] , i.e.: =
Equation 4.1
Where is a factor defining the linear trend, and tends to be ( − )/ .
This trend may be influenced by various factors, such as tax rate, economic situation in the region, etc. The effect of these factors can be considered as contributing to the increase or decrease of the population, which therefore would be translated into an exponential term in our equation: = + +⋯+
Equation 4.2
By taking the logarithm on both sides of the equation, a simplified model is obtained: ∆ ,( ) = − = ∆ ,( ) + + +⋯+ +
Equation 4.3
Where is the municipality id and equals 1, 2, 3, ... 290

28
= 2010, = 2007, = 10 ∆ ,( ) is the population change between year 2007-2010 in municipality. ∆ ,( ) is the population change in the past 10 years, from year 1998 to 2007
in municipality . ε is an error term, which is the sum of all possible unknown factors that were not taking into account in this model.
are other various (influential) factors that have an impact on the indicator
are the parameters (to be optimized by the OLS) which quantify the impact of the respective factors .
As population size has a tendency to continue its trend as per Equation 4.1, a regression was obtained from the simplified Equation 4.3 using only the regressor ∆ ,( ). We have population change over the past 10 years ( = 10, which is the data that only available) as a measure of a relatively medium-long term trend, to predate the trend of population evolution that a municipality is have at this moment, which is beyond the short-term shocks/advances that may have impact on that. The results are shown in Table 4-1.

Tab
Wh
SdMRRt pLD_
popspec(Degrowbothpopare possbetwmeatimebetwbeli∆ * Alincl
ble 4-1: Regr
ere:
SS df MS Root MSE R-squared
stat p-value Log_popchanDelta_pop_1_cons
As can pulation betwcifically, a
elta_pop_19wth in the h represent
pulation chadisruptive sible, chosween accuraasurements.e-varying faween ( −ieve that one
,( ) =Where , lthough it lude, it none
ression: Pop
nge_07to10 998to2007
be seen froween 1998 10% popu
998to2007) population a roughly
ange is expefactors whien to be iacy of the m Since we actors are re
) and ( −e of these fa− is the fibe
is not neceetheless red
pulation Cha
Sum of Squdegrees of Mean of SuRoot MeanThe amounSignificancTwo-tailed∆ ,( )∆ ,( )Intercept, a
om Table 4to 2007 ha
lation increis correlatbetween 2
0.97% incrected to follich may chincluded inmodel, and twant to se
elevant to b− ), whereactors is fib= ∙er penetratio
essarily the
duces the ris
ange 2007-2
uares freedom um of Squarn Squared Ernt of variancece level, gread probability,
a constant va
4-1, those mave a tendeease over thted with 22007 and 20rease per yelow this trenhange that tn the modethe availabi
ee the popube included: e is the d
ber penetrati∆ ,( ) +on in the mu
e best guidsk of leaving
010 vs. Popu
es (RMS) rror e of Y explaiater than 1.96, lower than
alue
municipalitiency to remhe 10 years.9% (= co010 (Log_pear. If thingnd, but as wtrend. Theseel are deterility, reliabi
ulation chanspecifically
delay for thion, as given+ ∙ ,unicipality
e for the sg out signifi
ulation Cha
ined by X 6 (95% confi0.05 (coeffic
es which samain in that s between ef. 0.29
popchange_gs do not chwe mentionee factors, armined by ility and accnge betweeny, factors th
he effects ton by the Eq+ +⋯ in year
selection oficant factors
ange 1998-20
fidence) cient is not 0
aw a growtt positive tr1998 and 210% ) pos
_07to10), whange, thened before, t
among all tha comprom
curacy of fan and , hat are chano show up*.quation 4.4. ⋯+
Equation= 2007.
f the factors.
29
007
)
th in rend: 2007 itive
which n the there hose mise actor only
nging . We
+ n 4.4
rs to

30
whifromamoand say thata lafibeinvoapp
popand varivari
4.1.
prodmov
munsign201varihighthinevoas ssquathe Tab2007
Ideally, weich is 2004-m 2007 andount of fiber
the effects that fiber h
t is not too uarge scale. Ner potential olving morlications tha
In the follopulation evo
residentialiables wiiable at re
.1 Workp
We hypothductivity anve to this m
We say tnicipality hnificance of0 increasesiable. Seconher fiber pengs being elution (Logshown in thared in the model Equa
ble 4-2: Regr7 at Workpl
e should in-2007. Howd is differenr penetratioof fiber is a
had not beeunreasonab
Nonethelessis more he
re rapidly lat took adva
owing subseolution. We l units (as ill be given
esidential pl
places
hesize a hignd more job
municipality.
that ∆ ,( has been upf ∆ ,( )’ss when fibendly, we obnetration inequal - to
g_popchanghe table). Atable), whiation 4.3 is ressing Resulaces and Po
clude a chawever, as dantly definedon is assumeabout to shoen deployedle, because , even if theavily explolater, we cantage of fib
ection we ewill separatwe have a
n respectiveaces.
gh fiber penbs being av ) is a prp until nows ability to er penetratiobserve that
n workplacea 0.26%
e_07to10),Also observch as a mea0.76.
ults: Populatopulation Ch
anging fiberata for fiberd after 2009ed in the moow up in thd earlier tha in fact fibeere was som
oited in 200can expectber than the
examine whately measuravailable daely as fo
netration amvailable, wh
roxy variabw. From Tpredict pop
on at workt , has a es in 2007 (F(= coef. 0.with a 95%
ved that theasure of the
tion Evolutihange 1998-
r here betwr penetration9 (as mentioodel to be a
he next 3 yean 2007. Iter has been me fiber thr07 than 200
that there ey were in 2
hat the effecre the impaata for both
or variable
mong workphich natural
ble that inTable 4-2 wpulation ev
kplaces is inpositive im
FN_workpl0256 10% confidence coefficiene degree of
ion 2007-201-2007
ween ( −n is only avoned in Chaa new develoars; howeveis a roughonly recent
ree years pr4, and as ICwere mor
2004.
ct of fiber pct of FTTHh), and the at workpl
places will llly would a
ndicates howe can seeolution betwncluded as mpact, specace_2007) % ) improve interval (0
nt of determvariance[67
10 vs. FTTH
) and ( −vailable starapter 3.3.1)opment in 2er, this does
h approximatly deploye
rior to 2007CT servicesre services
penetration iH on workple coefficienlaces and
lead to a hiattract peopl
ow attractive the statisween 2007an explana
cifically a leads - all oved popula0.17% and mination 7] explaine
H Penetratio
− ), rting , the 2007 s not ation d on , the s are
and
is on laces nt of
for
gher le to
ve a stical
and atory 10% other ation 0.34% (R-d by
on

the of mun∆
signdegrthe alon
Tab2007
When consmunicipalit
, the denicipality in,( ) =Where: = 2007 ′ , is th
, is th
, is th
From Tablnificant withree of variaexplanatory
ng with thei
ble 4-3: Regr7 at Workpl
sidering whty is attractiegree of Un 2007 are ta−
he fiber penet
he Urbanizati
he number of
le 4-3, it ish a t-stat of ation ( ) iny variables ir 95% conf
ressing Resulaces and 3 o
hich other spive, in order
Urbanizationaken into ac= ∙ ∆
tration at wo
ion degree of
f people com
s clear thatf 4.05, whichn population
in the mofidence inter===== −ults: Populatother factor
pecific factor to complen and the ccount. The,( ) +
orkplaces in t
f municipalit
mmuting into
t fiber peneh together wn change fr
odel. The esrvals. . ± . ± . ±= . ±− . ±tion Evoluti
rs
ors can explete the mode
share of pe equation n∙ ′ , +
the municipa
ty in the ye
the municipa
etration at with other fom year 20stimated pa
. . . ± . ± .
ion 2007-201
lain why anel and to incpeople comow become∙ , +
ality in year
ar .
ality in the
workplacesfactors, show07 to 2010
arameters ar
10 on FTTH
nd in which crease the v
mmuting ines: ∙ , +
Equation
r .
year .
s is statisticw that nearlis explaine
are given be
H Penetratio
31
way value nto a
+
n 4.5
cally ly 80% ed by elow
on
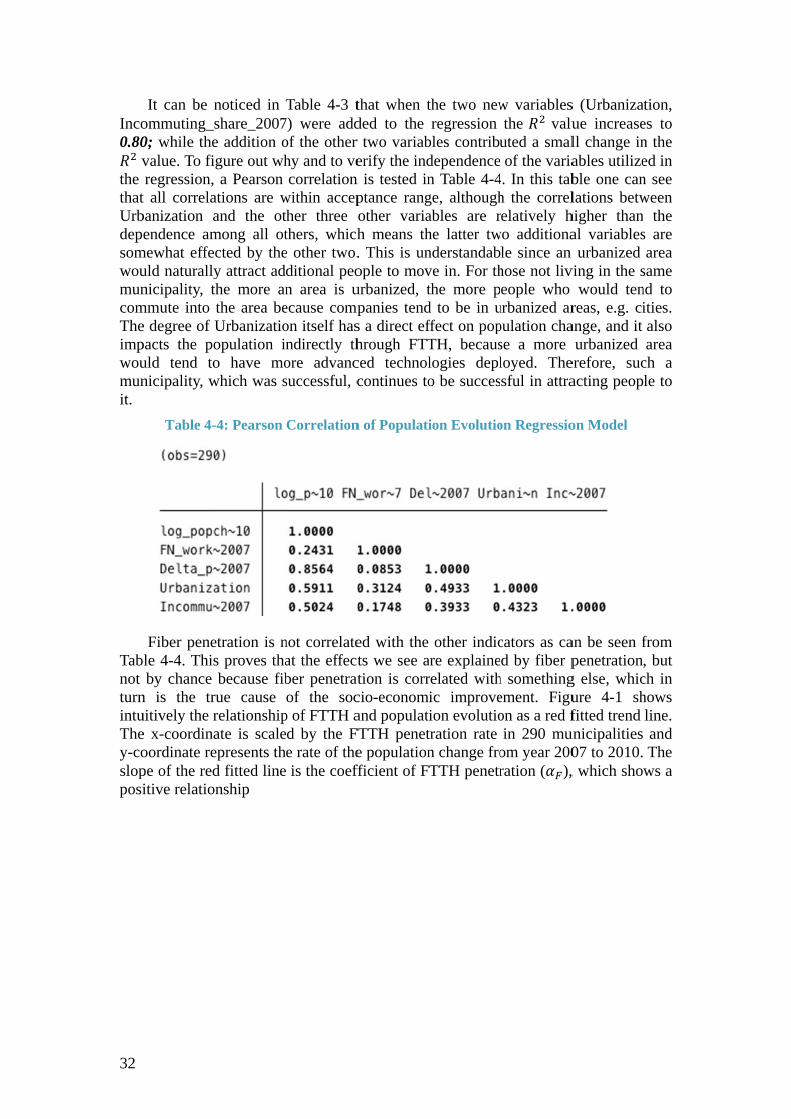
32
Inco0.80
vthe thatUrbdepsomwoumuncomTheimpwoumunit.
Tabnot turnintuThey-coslopposi
It can be nommuting_0; while thevalue. To firegression,
t all correlabanization aendence am
mewhat effeuld naturallynicipality, t
mmute into e degree of Upacts the pould tend tonicipality, w
Table 4-
Fiber penele 4-4. Thisby chance
n is the truitively the re x-coordinaoordinate repe of the reditive relatio
noticed in share_2007e addition ogure out wha Pearson
ations are wand the otmong all otcted by they attract adthe more anthe area beUrbanizatioopulation ino have mowhich was s
-4: Pearson
etration is ns proves thabecause fib
rue cause relationshipate is scaleepresents thd fitted line
onship
Table 4-3 t7) were addof the other hy and to vecorrelation
within accepther three thers, whiche other two.ditional peon area is uecause compon itself hasndirectly thore advancsuccessful, c
Correlation
not correlateat the effectber penetratof the soc
p of FTTH ad by the Fe rate of the is the coeff
that when tded to the r two variaberify the ind
n is tested inptance rangother variah means th. This is unople to movurbanized, tpanies tends a direct efhrough FTTced technolcontinues to
n of Populati
ed with the ts we see ation is corrcio-economand populat
FTTH penete populationfficient of F
the two newregression
bles contribudependencen Table 4-4ge, althoughables are rhe latter twnderstandabve in. For ththe more pd to be in uffect on popTH, becauslogies deplo be succes
ion Evolutio
other indicare explainerelated withic improveion evolutiotration rate n change froTTH penetr
w variablesthe valu
uted a smalof the varia
4. In this tabh the correlrelatively h
wo additionale since an
hose not liveople who
urbanized arpulation chase a more loyed. Thesful in attra
on Regressio
cators as cad by fiber p
h somethingement. Figuon as a red fin 290 mu
om year 200ration ( ),
s (Urbanizaue increasell change inables utilizeble one canlations betw
higher thanal variablesurbanized
ving in the swould ten
reas, e.g. ciange, and it
urbanized erefore, sucacting peop
on Model
an be seen fpenetration
g else, whicure 4-1 shfitted trend
unicipalities 07 to 2010., which sho
tion, es to n the ed in n see ween
the s are area
same nd to ities. also area
ch a le to
from , but ch in hows line. and The
ws a

Fig
4.1.
indishowworposither
fibeturnpopyearchanTab2007
gure 4-1: Lin
.2 ResidenHigh-speed
ividuals to cwn that, mrkplaces havitive growthre are simila
Based upoer penetrations out that tpulation char 2007 (FNnge in 2010
ble 4-5: Reg7 at Househ
near Predict
ntial placesd broadbanconsider whmunicipalitive a tendenh. We perfoar effects fo
on the simpon at residethe fiber peange, with aN_household0, with a higgressing Resholds and Po
tion of Popua
s nd connectihen moving ies with acy to have aorm the sam
or residentia
plified regreential placesnetration at
a 10% increds_2007) legh coefficiensults: Populopulation Ch
ulation Evolat Workplac
ivity at res into a resid
a 10% inca populationme type of al places.
ession modes in 2007 (t householdease in FTTeads to a 0nt of determlation Evoluhange 1998-
ution 2007-2es
sidential pldential area.crease in fn change thregression
el given in (i.e., ′′ , ),ds also has aTH penetrati0.18% posimination ution 2007-2-2007
2010 on FTT
aces is a g. The previofiber penetrhree years laanalysis in
Equation 4as shown i
a significanion in residtive growthof 75%.
2010 vs. FT
TH Penetra
great meritous analysistration at tater with 0.
n order to se
4.3, we incin Table 4-
nt impact ondential placeh in popula
TTH Penetra
33
tion
t for s has their 17% ee if
clude -5. It n the es in ation
ation

34
of aus turbaurbaurbawe d∆year
Tab2007
penworis hFN be worposireje simp
As mentioa municipalithat it is aanization inanized attraanization andid in the p
,( ) =Where ′′
r = 2007ble 4-6: Regr7 at Househ
As one canetration at rkplaces whhigher than
residential seen in Fi
rkplaces. Thitively cont
ected based and ) atply the scal
oned before,ity, it does nattractive. W
n addition toacted morend the sharerevious sec−, is the fib7.
ressing Resuholds and 3 o
n see after households
here it was 0in companiplaces, we gure 4-3, whe conclusitribute to pon a low pt both workling factor.
, ∆ ,( )not tell us wWhen we
o ∆ ,( ), e people. Ie of peopletion. The eq= ∙ ∆ber penetrat
ults: Populatother factors
= = = = =including t
s is 0.013,0.017. Is it ies? Lookinfound the twhere the ion is idenpopulation -value ( =kplaces and
is a casual why a munic
include adone is able In Table 4
e commutinquation bec
,( ) +tion at resid
tion Evolutis
= . ±= . ±= . ±= . ±− . ±the latter tw, which isbecause the
ng at the cortwo are highplot show
ntical to theevolution, = 0.000) for
d residentia
variable thcipality is atdditional va
to see that 4-6 we regg into a muomes: ∙ ′′ , +dential plac
ion 2007-201
. . . . .
wo regressoslightly lo
e fiber penerrelation behly correlats FN reside hypothesihence the coefficient
al places, a
hat explains ttractive, buariables, foa municipal
gress with unicipality i
∙ , +ces in the m
10 on FTTH
ors, the coefwer (aboutetration in retween FN wed (coef. =
dential placis 1 ( ) null Hypo
ts of fiber pand the onl
s the attractut it simply or instance,lity that is mthe degree
in 2007, ju
∙ , +Equation
municipality
H Penetratio
fficient of ft 30%) tharesidential aworkplaces0.9618), as
ces =1.3 as FTTH
othesis (penetration ly differenc
ivity tells the
more e of st as
+
n 4.6
y in
on
fiber an at areas s and s can
FN does ) is
(i.e., ce is

Fig
tren200(deat
gure 4-2: Lin
F
We observnd than othe07 and 20,( ~ths ( ,( ∆
near Predict
Figure 4-3: P
ve that somers. The cau10 is the ))and the ~ ))[72
,( − ) =
tion of Popuat R
Plot of FN R
me municipause for the p
net amounumber of
2], as shown
,( ~
ulation EvolResidential P
Residential P
alities havepopulation unt of peonew births
n in Equatio
) + ,(
ution 2007-2Places
Places vs. FN
e a more pin a municiople migra ( ,( ~
on 4.7. We a
~ ) −
2010 on FTT
N Workplace
positive popipality to inating into )), subtranalyze thes
,( ~
TH Penetra
es
pulation groncrease betw
municipaliracting the se in detail.
) Equation
35
tion
owth ween ty i total
n 4.7

36
Where: ∆ ,( ) is the population change of municipality between 2007 and 2010.
,( ~ ) is the total excess of migration into municipality in the years 2008, 2009, and 2010.
,( ~ ) is the total births in municipality in years 2008, 2009, and 2010.
,( ~ ) is the total deaths in municipality in years 2008, 2009, and 2010*.
4.1.3 Excess of Migration
According to Statistics Sweden, Excess of migration[74] is defined as the difference between immigration and emigration, i.e., the net number of people migrating into a municipality. This may explain the population change to a great extent. Taking the same indicators ∆ ,( ), , , and , in the regression, we have a similar model to that shown in Equation 4.8.
,( ~ ) = ∙ ∆ ,( − ) + ∙ , + ∙ , + ∙ , +
Equation 4.8
The results of the regression are summarized in
* The death rate was not available at the time of performing the analysis. Besides, it is the 2nd lowest in the world[73] and is therefore not considered further in this analysis.

37
Table 4-7 and in Table 4-8 for fiber penetration at work places and residential places (respectively). We can see that the impact on excess migration is explained by the model with approximately 58% of variance. The estimated parameters are given below along with their 95% confidence interval, with representing the coefficient of variable at workplaces and representing the coefficient of variable at residential places. = 0.012 ± 0.007 = 0.009 ± 0.006 = 0.127 ± 0.019 = 0.128 ± 0.019 = 0.013 ± 0.011 = 0.014 ± 0.011 = 0.026 ± 0.018 = 0.027 ± 0.018 = −0.007 ± 0.008 = −0.008 ± 0.007

38
Tab2007
Tab2007
worwithexcehouaccejob peopfibeFiguimmexce
ble 4-7: Reg7 at Workpl
ble 4-8: Regr7 at Househ
These regrrkplaces andh every 10%ess of migr
useholds in ess to fiber opportunitiple are also
er. Because ure 4-4 an
migration atess migratio
gressing Reslaces and 3 o
ressing Resuholds and 3 o
ression resud residentia% increase iration at wothe next thare able to
ies will leado happy to mthese two a
nd Figure t workplaceon and the r
sults: Excesother factor
ults: Excess other factors
ults tell us l places havn FTTH peorkplaces ahree years.
employ mod to more pmove to resare highly c4-5 illustra
es and at rered linear fi
ss of Migrars
of Migratios
that statistve a significenetration inand 0.09% This can b
ore people (people movisidential placorrelated wate the linesidential plfitted lines p
ation 2008-2
on 2008-2010
tically the Fcant impact n 2007 leadiof increase
be explained(as argued iing to thoseaces wherewe cannot s
near predictlaces respecpredict the t
2010 on FTT
0 on FTTH P
FTTH peneon the exce
ing to 0.12%in excess
d as workpin chapter 2e municipalihouseholdsseparate thetion of thectively. Thetrends based
TH Penetra
Penetration
etration in ess of migra% of increasof migratio
places that h2), the increities. In pars have accese two variabe share of e dots showd upon the f
ation
n
both ation, se in on at have
eased rallel ss to bles.
f net w the fiber

pen
we munthatleveare deatmayincr
etration in t
Figure 4-4
Figure 4-5
The originbelieve it
nicipality dut this trend el of approxthe main cths), and thy attract therease in the
the two sepa
4: Linear Pr
5: Linear Pr
nal trend of phas a posiuring the nedominates tximately 13constituent hese ones wheir families amount of e
arate types
rediction of
rediction of
population tive influenext couple othe trend of
3%. This is of populatiho already or relativesexcess of m
of places.
Excess of MWorkplaces
Excess of MHouseholds
growth wasnce on the of years. Thf excess of because th
ion change moved intos to move to
migration.
Migration ons
Migration ons
s considerednumber o
he results shmigration wose who mbeyond the
o and settledo this muni
FTTH Pen
FTTH Pen
d in the regrf people m
hown in botwith high soved into the number od down in thicipality, wh
netration at
netration at
gression becmoving intoth tables prosignificancehe municip
of births (mthe municiphich leads t
39
ause o the oved at a
ality minus
ality to an
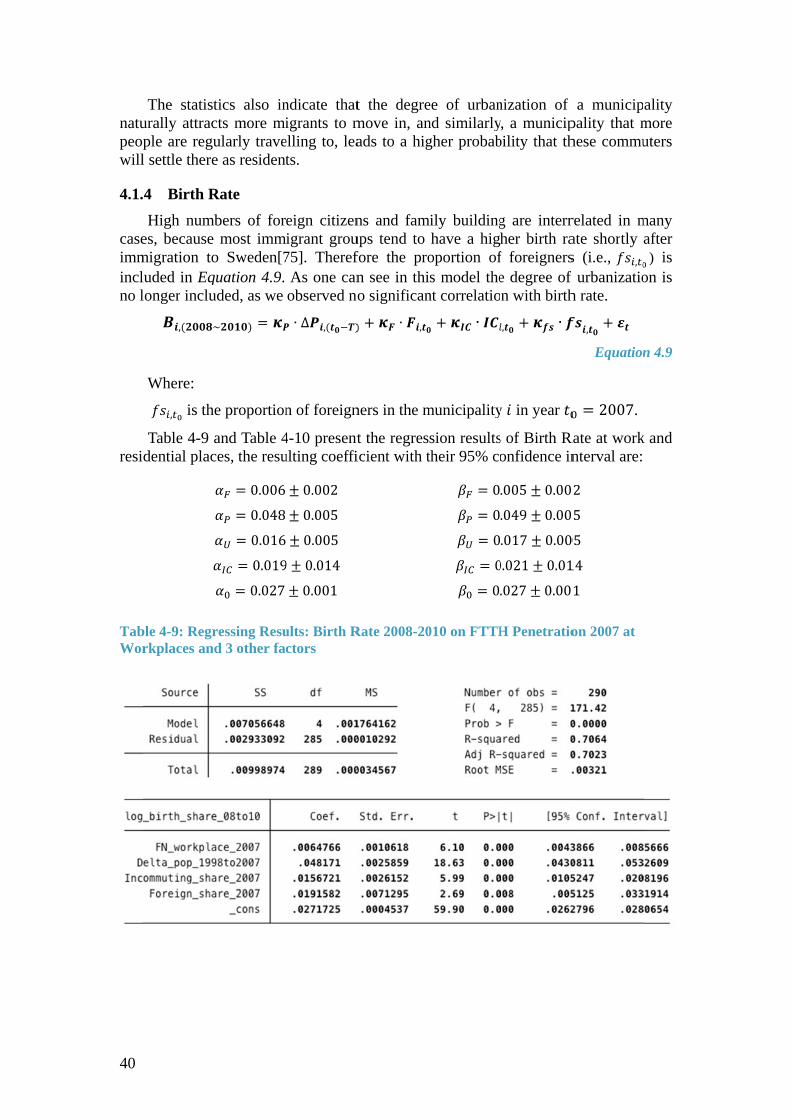
40
natupeopwill
4.1.
caseimminclno l
resi
TabWor
The statisturally attracple are regul settle there
.4 Birth RHigh numb
es, because migration toluded in Eqlonger inclu,( ~Where:
, is th
Table 4-9 adential plac
ble 4-9: Regrrkplaces and
tics also incts more miularly travee as resident
Rate bers of formost imm
o Sweden[7quation 4.9. uded, as we ~ ) =e proportion
and Table 4ces, the resu= 0.006= 0.048= 0.016= 0.019= 0.027ressing Resud 3 other fa
ndicate thatigrants to m
elling to, leats.
eign citizenigrant grou75]. Theref
As one canobserved no∙ ∆ ,( − )
n of foreign
4-10 presentulting coeffi± 0.002 ± 0.005 ± 0.005 9 ± 0.014 ± 0.001
ults: Birth Rctors
t the degremove in, anads to a hig
ns and famups tend to fore the pron see in thio significan
) + ∙ ,
ners in the m
t the regresicient with t
Rate 2008-20
ee of urbannd similarlygher probab
mily buildinghave a hig
oportion ofs model the
nt correlatio+ ∙municipality
sion resultstheir 95% co= 0= 0= 0= 0= 0010 on FTTH
nization of y, a municipbility that th
g are interrher birth raf foreignerse degree of n with birth
, + ∙y in year
s of Birth Ronfidence in.005 ± 0.00.049 ± 0.00.017 ± 0.000.021 ± 0.01.027 ± 0.00H Penetratio
a municippality that mhese commu
related in mate shortly s (i.e., ,f urbanizatioh rate.
, + Equation
= 2007.
Rate at worknterval are: 2 5 05 14 1
on 2007 at
ality more uters
many after ) is
on is
n 4.9
k and

TabHou
trenAs resibirthfibeSwewerthe As filleavaiof rwithhavcommorwouyou
otheimpand chil
to aimmshorcitizSwe * A thes
ble 4-10: Reguseholds and
One can send by the 95
for fiber pdential plach rate in th
er attract medish FTTHre carried ouintervieweeanecdotal e
ed after fibilability of aresidence[7,h older peoe children
mpanies, whre than aveuld tend to ung people w
A higher ber words, fproving qua
the conseqldren.
One can ala 0.21% in
migration byrtly after izenship incleden[77,78] study on f
sis assisted i
gressing Resd 3 other fac
ee that all th5% confidenpenetrationces in 2007 he followingmore peopleH deploymeut, fiber hades saw that evidence, itber was insa high-spee,31]; whichople that de
in a relathich typicalerage from move to a
would tend t
birth rate cfiber contri
ality of comquent increa
lso see that ncrease in y foreignermmigrationlude child f].
four Swedisin the data c
sults: Birth Rctors
he listed indnce interval,, a 10% iis respectivg three yeae in the bients* whered been instahaving fibe
t was obserstalled. Theed access coh suggests theploying fibtively shortly attract yofiber deplomunicipalitto have chil
could be mibutes to th
mmunicationsed disposa
a 10% incrbirth rate s tends to b
n. It shouldforeigners w
sh municipcollection.
Rate 2008-2
dicators are , and the moincrease in vely correlatars. This cairth-giving e interviewalled in all per attractedrved that ve regressiononnection (shat instead ber would art term. Anounger peooyment. Soty in order ldren.
mediated thrhe success ns) so they able income
rease in the in the nex
be correlated be notedwho may bu
al FTTH n
2010 on FTT
significantlodel explain
fiber peneted with a 0
an be interpage group.
ws in a sampublic housi
more younvacancies inn result susuch as FTTof having
attract younnother persople to workome peopleto reduce th
rough higheof compa
are able toe may make
proportionxt three yeed with a h
d that thoseuild familie
networks, in
TH Penetrat
ly influencinns the data wetration at 0.06% or 0.0preted as pla. In a rece
mple municing in the m
ng people ton the publicupports the TH) affects empty housng people tspective is k for them,
in this yoheir commu
er employmnies (e.g. r employ mit more aff
of foreigneears, whichhigher rate e who havs and contin
n which the
tion 2007 at
ng the birthwith =workplace
05% increasaces with m
ent researchipality – S
municipality,o live there[c housing wclaim that
people’s chsing or houto move in
that high-tend to be
oung age gruting, and t
ment rate[4]reducing c
more people[fordable to h
ers in 2007 h confirms of childbea
ve not acqunue to resid
e author of
41
h rate 0.70. s or se in more h on äffle , and [76]. were t the hoice using
and -tech nefit roup these
]. In osts, [71], have
lead that
aring uired de in
f this

42
grapshowbirthfore
Fig
caserateof prespmod
Figure 4-6phically. Thws the munh rate chanecast, and th= 0.006 in
Figure 4-6:
gure 4-7: Lin
It is worthe of excesse ( = 0.0population cpectively atdel as stated
6 and Figuhe points renicipality’s
nge betweenhe slope of tn Figure 4-6
Linear Pred
near Predict
h mentionings of migrat06 ± 0.002change fromt working pd in Equatio
re 4-7 showepresent eafiber penet
n 2008 and the fitted lin
6 and =
diction of B
tion of Birth
g that the sution ( =2, = 0.00m 2007 to 20places and ron 4.7.
w the effeach municiptration in 22010. The ne are the c0.005 in Fi
irth Rate on
h Rate on FT
um of the c0.012 ± 0.05 ± 0.002010 ( =residential
ct of fiber pality (2902007, and th
red fitted lcoefficients igure 4-7.
n FTTH Pen
TTH Penetr
coefficients 007, =2) are rough0.017 ± 0.0places. Thi
penetrationin total), thhe y-coordiline represeof FTTH pe
netration at
ration at Res
of fiber pe0.009 ± 0.hly equal to008, = 0is essentiall
n on birth he x-coordiinate showsents the modenetration,
Workplaces
sidential Pla
enetration in006) and bo the coeffic0.013 ± 0.0ly confirms
rate inate s the del’s with
s
aces
n the birth cient 007), s our

43
4.2 Competition and Price of Internet Service In the previous sections one can already see that fiber penetration has a
significant impact on population evolution, especially in terms of excess of migration. Looking at why people want to move to a municipality, the explanation goes beyond fiber penetration per se: possibly the open access model, which goes hand in hand with fiber deployment in Sweden, leads to lower prices due to competition which indirectly makes a municipality more attractive. Price is a crucial factor that directly affects broadband adoption. This could in turn also implicitly affect the economy and society. Therefore, we investigated the price of Internet service (specifically symmetric 10/10 Mbps Internet access, as it is the mostly accessed speed in Sweden) and the effect of competition in fiber networks across the country.
Open access is an open market. In light of basic market economics, more service providers in the fiber-based open market increase the competition, which will accordingly lead to better offers and lower prices. Therefore we set out (see Hypothesis 2) to verify whether price indeed is lower when there are more ISPs in the market providing fiber-based Internet services, with respect to the market disciplines.
Hypothesis 2: Competition and Price of Internet Service : More SPs competing in a FTTH open network does not lower the price of 10/10Mbps fiber-based Internet services in Sweden. : More SPs competing in a FTTH open network does lower the price of 10/10Mbps fiber-based Internet services in Sweden.
The estimated model is: , = + ∙ , + + …+ +
Equation 4.10
Where:
= 2012
is the municipality ID and equals 1,2,3,……290
, is the to date lowest price of subscribing to fiber-based high-speed Internet services (with 10/10 Mbps or above) in the municipality in 2012.
, is the number of ISPs that is presenting on the fiber network with high-speed Internet services (with 10/10Mbps or above) in the municipality in 2012.
is the error term, which is the sum of all possible unknown factors that were not taking into account in this model.
Regressing the simplest model given in Equation 4.10 with the only explanatory variable , , one can see the robust relation between price and the number of ISPs. As shown in Table 4-11, the price that ISPs charge for every subscription decreases statistically significantly with an increase in the number of ISPs (t-stat = -9.78) as expected. The price that the model predicts is 250.97 SEK per month if there is only one ISP present in the market; each additional SP leads to a 8.08 SEK per month (with a 95% Confidence Interval from 9.71 to 6.45 SEK per month) decrease in lowest price from the base line. From one can estimate that 41% of the variance in price can

44
alre
buyTabfibenetwvariin lmarsubs
nati201Tab
a rhypwhePopexpshowpophen
(as To Netwnetw
eady be expl
The equiliyer, due to tle 4-11 is b
er/fiber LANworks (i.e. ious NPs. Oine with thrket, the loscribers.
For compaional vertic2 [79], whi
ble 4-11: Rob
On the othough meas
pothesize thaen choosingpulation chalanatory vawn in Table
pulation in ce the more
One can se= 0.435improve thwork proviwork, theref
lained by th
ibrium pricethe interactbased upon N, offered bmostly Öpp
One can see he open marower the p
arison, the lally integrach is higherbust Regres
her hand, thesure of theat its reside
g an Internetange (i.e., Dariable (∆ ,(e 4-12. Thesa municipa
e favorable p
ee that the tw5) in price, he model aiders (NPs)fore we will
he number o
e is dependion betweenthe lowest
by different pna Stadsnäthat it is a hrket princip
price offere
owest priceated operator than our ession: Price v
e populatione attractive
ents are mort service pro
Delta_popch( )) in thse results suality, the grprice subscr
wo instrumbut there is
and to rais) are a big l consider th
of ISPs.
dent upon tn supply ant prices of ISPs who aät in our cahighly compple: the moed by SPs
e of symmeors was apstimated privs. Number
n change ofeness and re broadbanovider; hen
hange_2011 he model, aupports our reater the cribers can g
mental variabs still a lot se the v
stakeholdeheir effect.
the agreemend demand10/10 Mbpare competinase). These petitive fibere sellers (ias a strat
etrical 10/10pproximatelyice level in of ISPs
f a municipadynamicity
nd inclined,nce there is m
in the tableand the regr
hypothesiscompetitive get.
bles can expof variancevalue, we er in the va
ent between. The regres services sng in the opnetworks a
er-seller mai.e. SPs) coegy to attr
0 Mbps servy 280 SEKSweden.
ality in the y of a mu
therefore mmore compee) is includeession resuthat the mopressure o
plain 43.5%that remain
introduce malue chain
n the seller ession showsubscriptionpen-access fare operatedarket, and thompeting inract and re
vices offereK per mont
past 10 yeaunicipality. more disceretitive pressed as a poteults obtainedore dynamicon the supp
% of the varins unexplaimore variabof open ac
and wn in n via fiber d by his is n the etain
d by th in
ars is
We rning sure.
ential d are c the plier,
ance ined. bles.
ccess

TabPop
activprovchaieach
becamuncomalsoOPEsuchswitthatoptimaylowNP
netwthe Opeand the
the iTuxdegr
ble 4-12: Robpulation Cha
A NP in thve infrastruvider (PIP).in pays a mh subscriber
Sometimesause we benicipality o
mpanies are o local and EX may beh as Openntches rathert knows the imize their y be passed
wer monthlyflags in the
The NP flwork markecase where
enNet, iTuxPIP/NP, a
extended m
As shown NP flags arx among vree of varia
bust Regresange 2002-20
he open acucture over As already
monthly conr that an SP
s the PIP iselieve that tr possibly bgenerally
generally he higher thaet, iTux, Zitr than dozenequipment network, in
d on to the Sy service pri model.
lags are givet accordinge the PIP is x, Telia (staas well as Omodel.
in Table 4-re added. Avarious NPsation with a
sing Results011
cess networr a fixed
y introducednnection fee
P sells a subs
s also playsthe PIP norby other utsmall, henc
have little ICan the OPEXtius, etc., bens of switchvery well –
ntroduce neSPs who in ice. For all
ven to the g to our collalso operat
adsnät), ZitOthers repre
-13, the As a result o
s was founstatistically
s: Price 2012
rk model isperiod con
d in sectione to the PIPscription to
s the role ormally is a tility, such ce there areCT-specific X of largerecause the lhes, and hen– thus they cew technolo
turn pass i of these re
main NPs ected Stads
ting in the mtius, ViaEursenting netw
coefficient of robust regnd to contry high signif
2 vs. Numbe
s the businntract with2.3.2, the NP, and recei.
of NP. Thislocal compas a power
e small econcompetenc
r national platter compance they cacan fix netwogies, etc. Tit on to the easons we d
operatingsnät list, alomarket as a ropa, Quadworks oper
of determingression, theribute significance (t-st
er of ISPs 20
ess actor tha physica
NP in the opives revenu
may also pany that isr distributionomies of se. As a con
professional anies may r
an afford to work probleThe resultinend users idecided to
in the Sweong with the
NP. The NPdracom, Bigated by oth
nation raisee instrumenficantly in tat = -9.43).
012 and
hat operatesal infrastrucpen access vue from SPs
affect the ps owned by
on utility. Tscale. They
nsequence, tl NP comparun hundredhave perso
ems in less tng lower OPin the form include var
edish munice flag PIPNPP flags inclggnet, Open
her small NP
es to 51% wntal NP vari
explaining.
45
s the cture value s for
price y the
These y are their anies ds of onnel time, PEX of a
rious
cipal P for lude: nbit, Ps in
when iable
g the

46
Tab
comservoperbeinservbouIntecontmormeaanot12 thigha lo
marand theiof sspecintrolowÖppÖppargu
One(t-stbettlivinTeli
ble 4-13: Rob
This regrempared withvices to therated by iTung equal). Pvice packagund for a fixernet servicetract immedre) if they wans subscribther SP afteto 18 monthhest durationger period
On the othrket share).
long-standir loyal custsatisfaction.cific demanoduced in th
wer prices. Hpen fiber®; penfiber Viluably becau
Table 4-14e can see thtat = -8.46)ter than subng in a Lägia Öppen fi
bust Regres
ession resulh other NPseir subscribux, SP pricePart of thisge details oxed contractes via Stadsdiately, but would like bers are bouer the first hs, with a 3
ons of any Nd of guarant
her hand, TThey offer
ding good retomers cont. TeliaSonends, i.e. Tehe previous
Here we intrdifferentiat
lla for singluse of the hi
4 shows thehat the sign, yet instead
bscribing togenhet woulfiber networ
sion Results
lt tells us ts. In this wbers. From es tend to bes could be ef the differt period (vasnät. Meanwmust inforto terminatund for at lsecond of b3-month no
NP. This alloeed revenue
TeliaSonerahigher pric
eputation, altinue to buyera offers dlia Stadsnä
s regressionroduce anotted as Teliale homes, foigher install
robust linenificance of d of saying Telia Öppeld be lower rk is presen
s: Given NP
that iTux isway SPs wo
Table 4-13e lower (at explained brent NPs viaring from 0while, subscrm their conte their contleast 3 monbeing conneotice period ows iTux toe from the s
is the largces than avelthough it ay services frdifferent fibät and Telia
n. This NP sther detaile
a Öppenfibeor these offelation costs.
ear regressiof Telia Öppe
that subscrenfiber Villthan for a
nt. One may
Flags
s able to oould be abl3 one can 28.35 SEKby the longia Stadsnät0 to 18 moncribers are nntractor eartract or subnths even ifected. The cof termina
o offer lowersubscribers.
est provideerage. Yet calways offerfrom them, aer networka Öppen fieems not tod regressioner Lägenheering prices.
on within Tenfiber Lägribing to Tella, the subssubscriber
y also notic
offer a lowele to chargobserve thper month,
ger contract. Normally nths) when not allowedlier (typical
bscribe to anf they wish contract pertion. Theser prices, bec
r (i.e., theyonsidering irs a relativeas they havs to meet th
fiber®. Teliao significantn particular
et for apartmare conside
Telia Öppengenhet is stlia Öppenfibcription cosliving in a
ce that the n
er price to ge less for that in netw all other tht periods of
consumerssubscribing
d to cancel lly 3 month
another SP. to subscrib
riod for iTue are amongcause they h
y have the mits strong b
ely higher pve a high detheir customa Stadsnät tly contriburly for the Tments and Terably diffe
n fiber netwtatistically ber Lägenhst of subscrVilla wherenumber of
SPs
their works hings f the s are g for their hs or This
be to ux is g the have
most rand
price, egree mers’
was ute to Telia Telia rent,
work. high
het is riber e the ISPs

becois nTelilägethatvia aparloyain aand TelisubsTab
LooprespricmunAllTcomoffeare and
omes less snot present iaSonera moenhet or vilt the price lTelia Öppe
rtment) is lal customera price war,
the compeia Öppenfibscription fe
ble 4-14: Rob
To explainoking at thsenting in thce that is offnicipalities Tele always
mpetitor, theer lower pricpresent in Bredband2
significant ain this ta
ostly offers lla, withoutlevel on avenfiber Villower than f
r base meanconsequent
etition less pber, the coe, as presenbust Regres
n the outlierhe Figure he Telia Öppfered by thethat have
s has a highe price will ce, as they tthe Telia Ö2) have a re
and the indiable becaus
the same let geographierage is sli
la, simply bfor in a villns that Teliatly the numbpronouncednsumers be
nted in Figursion Results
s, it is inter4-8, in whpenfiber ne
ese ISPs. Wethe lowester price of stay high.
tend to offeÖppenfiber n
latively hig
icator of pose it is no evel of pricic or regionightly lowerbecause thela (i.e., singaSonera is n
mber of ISPsd, with everenefit by a
ure 4-8. s: via Telia Ö
resting to sehich x-cooretwork, and
We found Bixprices, it
299 SEK/mAdditionall
er the same pnetwork. A
gher price th
opulation chlonger sig
ce to variounal differencr via Telia e installatiogle home). Hnot necessar available v
ry additionaa 2.5 SEK
Öppen Fibe
ee which is rdinate shothe y-coord
xia is presenis Bixia th
month for vily, T3, Bredprice for all
As it happenhan others.
hange (in thgnificant. Tus SPs whences. The onÖppenfibern cost in aHaving a strily compet
via Telia Öpal ISP offerireduction i
r
the SP giveows the nudinate represnt elsewherehat is preseillas, so if thdband2, anl municipalins these two
he last 10 yeThis is becn present innly differencr Lägenhet a lägenhet trong brandting with otppenfiber ising servicesin the mon
es a lower pumber of sents the lowe, but for al
ent. In conthere is no o
nd others doities where o operators
47
ears) ause
n any ce is than (i.e.,
d and thers less s via nthly
price. ISPs west ll the trast, other o not they (T3

48
commun(e.gdevalsowerregr
Tab
Lännetw
Figure 4-8:
In our studmpletely difnicipalities g. economieelopment, a
o have variore considerression resu
ble 4-15: Rob
The result n have statisworks.
: Linear Pre
dy we foundfferent conare grouped
es of scale,and regionaous degreesed interesti
ult is shown
bust Regres
suggests thstically con
ediction of P
d there is a dnditions in d to 21 regi, demograpal authorities of impact ing indicatin Table 4-
sion Results
hat regionsntributed to
Price vs. num
discrepancydifferent
ions (Län). phic differenes’ cooperaon price, t
tors that m15.
s: Given Län
s such as Vdriving up
mber of ISPs
y, which cleamunicipalitWe assume
nce, urbaniation, etc.) therefore Re
might drive
n Flags
Västernorrlathe price o
s via Telia Ö
arly indicateties. In Swed that diffezation degrin differentegional dep
the price
ands Län aof Internet s
Öppen Fiber
es that thereweden the erent conditree, technot regions mpendent fac
up/down.
and Stockhoservice via f
r
e are 290
tions logy
might ctors The
olms fiber
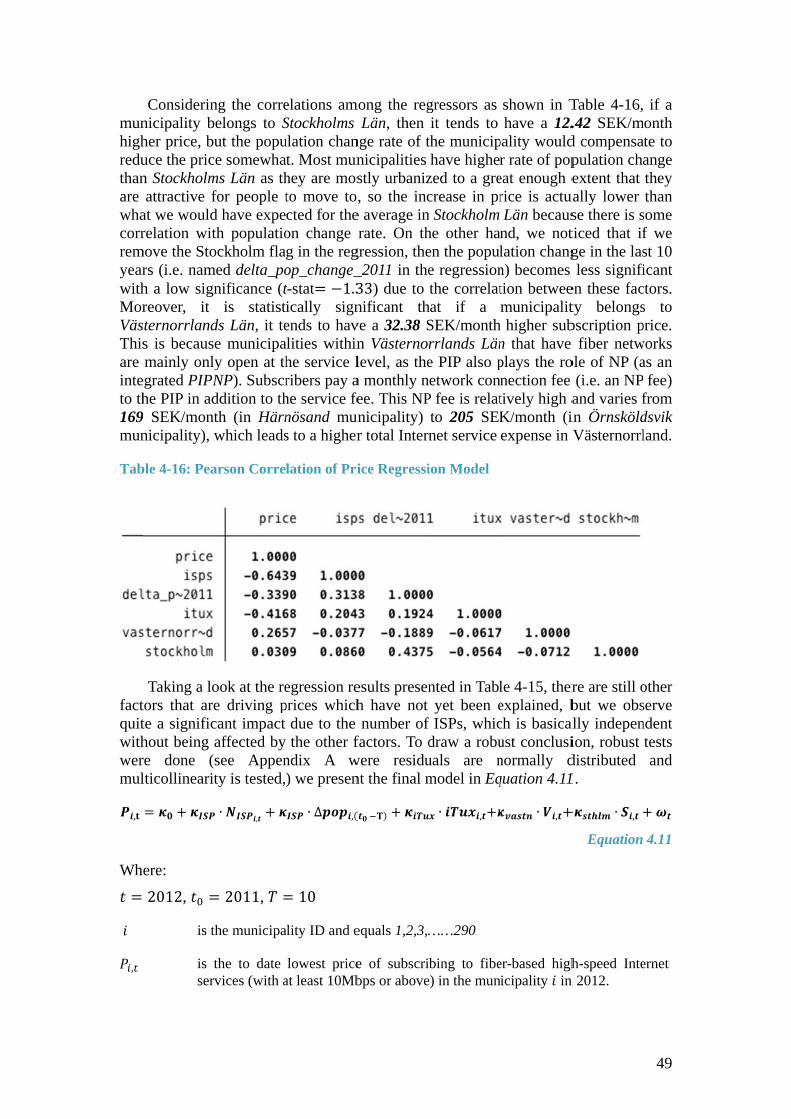
munhighreduthanare whacorrremyearwithMorVäsThisare inteto th169mun
Tab
factquitwithwermul
,Wh=
,
Considerinnicipality bher price, buuce the pricn Stockholmattractive f
at we wouldrelation wit
move the Stors (i.e. namh a low signreover, it
sternorrlands is becausmainly only
egrated PIPNhe PIP in ad
9 SEK/montnicipality), w
ble 4-16: Pea
Taking a lotors that arete a significhout being re done (lticollinearit= +ere: 2012, =
is t
is tserv
ng the correelongs to Sut the popue somewha
ms Län as thfor people td have expeth populatioockholm fla
med delta_ponificance (t
is statistds Län, it tee municipay open at thNP). Subscrddition to thth (in Härnwhich leads
arson Corre
ook at the ree driving pcant impact affected by see Appenty is tested,∙ , += 2011, =the municipa
the to date vices (with a
elations amStockholms ulation chant. Most munhey are mosto move tocted for theon change g in the regop_change_t-stat= −1.3ically signends to havalities withinhe service lribers pay ahe service fenösand muns to a higher
lation of Pri
egression reprices which
due to the the other f
ndix A w) we presen∙ ∆ ,(
= 10
ality ID and e
lowest priceat least 10Mb
mong the regLän, then
nge rate of tnicipalities stly urbaniz, so the inc
e average inrate. On th
gression, the_2011 in the33) due to nificant thve a 32.38 Sn Västernorlevel, as thea monthly nfee. This NPunicipality) r total Intern
ice Regressi
esults presenh have not number of
factors. To dwere residunt the final m
( ) +
equals 1,2,3,
e of subscribps or above
gressors as it tends to
the municiphave higher
zed to a grecrease in pr
n Stockholm he other haen the popule regressionthe correlat
hat if a SEK/monthrrlands Läne PIP also petwork con
P fee is relatto 205 SEKnet service
ion Model
nted in Tablyet been e
f ISPs, whicdraw a robuuals are nmodel in Eq∙ , +
……290
bing to fibee) in the mun
shown in Thave a 12.
pality wouldr rate of pop
eat enough erice is actuLän becausnd, we notlation changn) becomes tion betweemunicipalithigher sub
n that have plays the ronection fee tively high aK/month (iexpense in V
le 4-15, therexplained, bch is basicalust conclusinormally dquation 4.11∙ , +
er-based highicipality in
Table 4-16,.42 SEK/md compensapulation chaextent that
ually lower se there is sticed that ifge in the lasless signifi
en these facty belongsbscription p fiber netw
ole of NP (a(i.e. an NP and varies fin ÖrnsköldVästernorrl
re are still obut we obs
ally indepenion, robust distributed 1. + ∙ , +
Equation
h-speed Inten 2012.
49
if a month ate to ange they than
some f we st 10 icant
ctors. s to price. works as an
fee) from dsvik land.
other serve ndent tests and
+
4.11
ernet

50
, is the number of ISPs that is presenting on the fiber network with high-speed Internet services (with at least 10Mbps or above) in the municipality in 2012. ∆ ,( ) is the population change in the past 10 years, from year 2002 to 2011 in municipality .
, is a binary NP flag, in which 1 indicates that the network provider iTux is presenting in the market in the municipality in 2012, whereas 0 means not present.
, is a regional binary flag, in which 1 indicates that municipality belongs to the Västernorrlands Län while 0 means it does not.
, is another regional binary flag, in which 1 indicates that the municipality belongs to the Stockholms Län while 0 means it does not.
is the error term, which is the difference between what the model predicted and what the actual measurement is.
Based upon the statistics of robust regression that were illustrated in Table 4-15, the estimated parameters are then obtained as listed below with 95% confidence intervals, with 57% variance ( = 0.5700, = 0.000) explained by the introduced variables. = 245.673 ± 9.681 = −6.933 ± 1.486 = −50.87 ± 39.352 = −25.731 ± 6.139 = 32.379 ± 10.372 ℎ = 12.422 ± 9.624
One can now estimate that 245.67 SEK/month is the base line for monthly subscription price of 10/10 Mbps fiber-based Internet service, with every additional ISPs competing in a network lead to a reduction of 6.93 SEK/month from this base line. A one percent increase in the rate of population change brings a decrease of 50.87 SEK/month. Moreover, the monthly cost would be 25.73 SEK/month lower when subscribing via iTux’s fiber network. Furthermore, if the municipality one lives in belongs to Västernörrlands Län, one pay an extra 32.38 SEK/month more than in other regions, except for those living in Stockholms Län where an extra 12.42 SEK/month is charged on top of the base line. The variation in prices in these regions is because the economies of scale and geographical conditions are different, which in turn may influence the business models that are adopted (e.g. an externally contracted NP or a municipality-owned NP) thereby causing a price variation.
Figure 4-9 displays a plot in which each point represents a fiber network (i.e., Stadsnät), where the x-coordinate indicates the number of ISPs that is offering the same services in a network, and the y-coordinate indicates the lowest prices of among these ISPs that are competing in the same network. The red fitted line exhibits a linear prediction of our pricing model. One can observe graphically that the number of ISPs via Stadsnät negatively affects the price of subscribing to fiber-based network services, thus more ISPs competing in the same fiber network (i.e. Stadsnät) would eventually benefit the consumers with a lower price. The prices in the network with just one SP for the same service vary between 209 - 299 SEK per month, whereas the

samSEKbetwwithcomSEKmeaspecfluccon
busiprichighoper
pricevenpushpricnumthe the each5 SEmonexp
me service iK per montween 70 - 1h only one
mpetitors, giK/year for asurement ccific properctuations in sidered in o
Figure 4-9
Is the priciness sector
ces and the her, meaninrators? We
One can sces when then more. Hehed down d
ce. The subsmber of SPs
average prinumber of Sh new SP pEK per month. This isected to low
n networksth at most. 36 SEK per
e SP and tives a largethe same
can be slighrties of eac
prices, andour model.
9: Linear Pr
ce decreasinrs to reduce
probabilityng a price dewill perform
see from Fiere are mornce, we condue to the fscribers thu increases, hice. CompaSPs will red
present in anonth and thes in line wiwer prices.
s with moreIf one com
r month. A cthe lowest
e different oservice dep
htly differench individuad the error
ediction of L
ng (going de their pricey of havingecrease is mm a quick ch
gure 4-10 te competitionclude that fact that theus have a brhence the p
aring Figureduce the Intn open fibere lowest prith the trad
e than 10 dmpares the comparisonpriced op
of 160 SEKpending on
nt from the al price, whvariance is
Lowest Pric
down) becaes, or is the g a SP withmore probabheck of the
that on aveons, and the in Hyp
ere is comproader choi
possibility toe 4-9 and Fternet servicr network, trice will deditional mar
different SPlowest pric
n between thption in theK/month, hen where onprediction
hich are nos minimize
ce vs. Numbe
ause competcase that d
h a lower pble when thaverage pri
erage, all the lowest priothesis 2 isetitive presce in termso save moneFigure 4-10,ce price conthe averageecrease by rket law th
Ps cost betwce deals, thhe most expe network nce a highene lives. Nbecause the
ot modeled d by the ot
er of ISPs vi
tition puts different SPsrice presen
here are a laice.
he SPs tendice available
rejected, msure on SP of service ey is greate, it is clear
nsiderably. Iprice goes approximatat stronger
ween 139 - he differencpensive netw
with the mer cost by 1
Note the acere are possdue to ran
ther parame
ia Stadsnät
pressure ons have diffe
nt in networarger numbe
d to lower te is going d
meaning pris to lower tprice when
er even thanthat increa
In particulardown by a
tely 7 SEKr competitio
51
163 ce is work most 1920 ctual sibly
ndom eters
n all erent rk is er of
their down ce is their n the n just asing r, for about K per on is
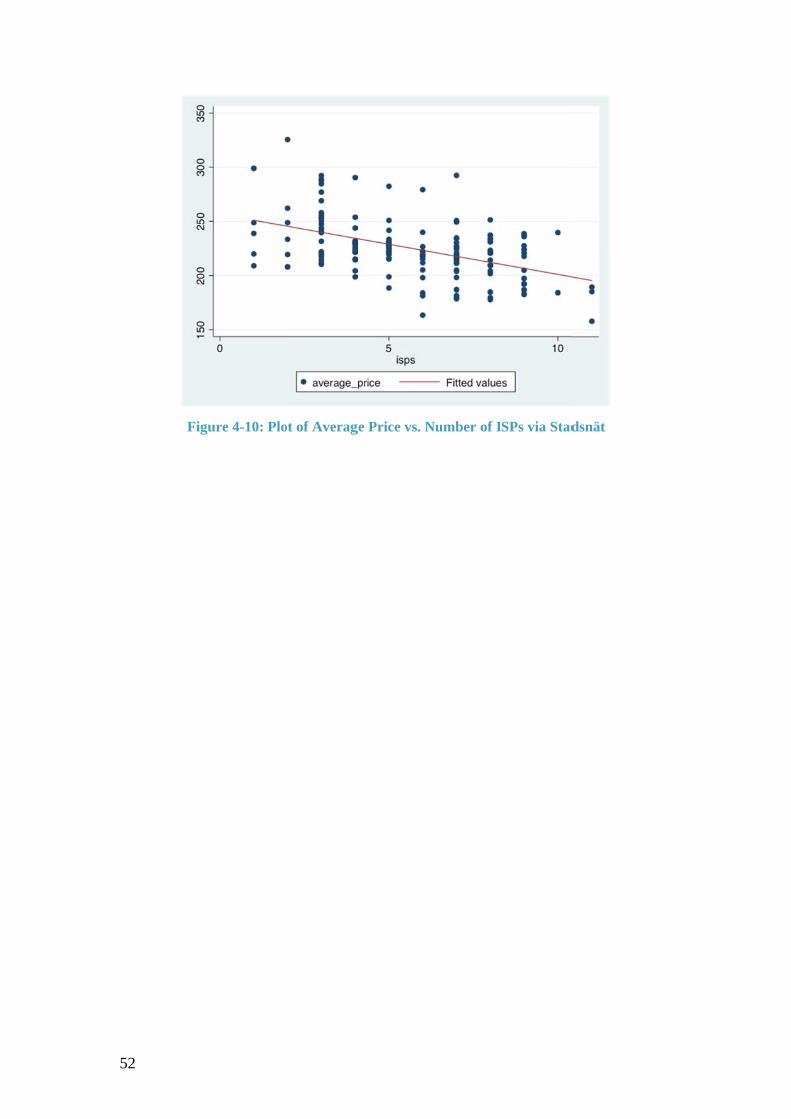
52
Figu
ure 4-10: Ploot of Averagge Price vs. NNumber of IISPs via Stad
dsnät
53
5 Conclusions and Future Work
This chapter summarizes the conclusions of this thesis project, along with discussions of the constraints during the research process and suggestions for possible future work. Reflections with respect to social, economic, and ethical issues associated with the project are reviewed as the end of the chapter.
5.1 Conclusions The aim of this study was to shed light on the impacts of FTTH on aspects of
society and the economy based upon quantitative evidence. This is important because FTTH as the next generation broadband access technology is considered a key ingredient in the development of knowledge economies and societies. While many studies have highlight the importance and effects of traditional broadband, little has been written based upon quantitative evidence from the perspective of FTTH deployment. Given the importance of filling this information gap in terms of the substantial benefits of FTTH, two earlier identified socio-economic indicators are examined empirically by means of multivariate regression analysis using the data collected from 290 municipalities in Sweden.
It is evident from the statistics presented in this thesis that fiber-based access networks have gradually replaced the copper-based access networks, and these fiber-based access networks have increasingly benefited society in recent years. Specifically, a higher fiber penetration of 10% at workplaces and 13% at residential places in a municipality in 2007 lead to a 0.17% improved population evolution between 2007 and 2010. The excess of migration and birth rate account for the majority of the population growth, respectively with a positive change of approximately 0.12% net immigration and 0.06% birth rates in the next three years.
Regarding the current FTTH network market, the study (included 282 different networks, both municipal and private ones) found that an open network with multiple competing service providers has a wider range of services and especially lower prices. Particularly, with 245.67 SEK as the base line of the monthly price for subscribing to Internet services via fiber, every additional ISP competing in a network leads to a reduction of around 5 SEK per month for the average service price and a decrease of approximately 7 SEK per month for the lowest service price, except for Telia Öppen Fiber. This result is in line with the traditional market discipline that stronger competition is expected to lower prices. However, Telia Öppen Fiber is found not to be influenced by the number of SPs presented in the network, although the price level on average is slightly lower via Telia Öppenfiber Lägenhet than via Telia Öppenfiber Villa, because the overall installation cost is lower for a lägenhet (i.e., apartment) than for a villa (i.e., single home).
Apart from FTTH, demographic factors such as the previous trend of population change, the proportion of foreigners, and proportion of people who commute regularly into a municipality for work, as well as socio-economic factors such as urbanization have effects on the population change in a municipality in Sweden since 2007. In particular, on top of the original population trend that a 10% population increase in 1998-2007 leads to an approximately 2.45% positive growth between 2007 and 2010, with all other things equal, the degree of urbanization was found to be significantly related to the population change of a municipality. This is reasonable because urbanized areas are currently still attracting people (including foreigners) to

54
work, commute, and reside in Sweden. Moreover, the study found that a 10% higher population who regularly commute into a municipality in 2007 contributes to more than 0.45% growth in population between 2007 and 2010, indicating this dynamic group commonly tends to settle down in a municipality to which they regularly commute. It was also noticed that in many cases a high portion of foreign citizens and family building are interrelated, because the significant statistic result supports the theory that immigrant groups tend to have a higher birth rate shortly after immigrated to Sweden, with a 10% more immigrants in 2007 tending to give at least 0.19% positive growth in births between 2008 and 2010. Part of the effects of both in-commuting and immigrants can also be explained by the degree of urbanization, as this may attract persons to move into a municipality to a great extent.
As to the FTTH open market, we clearly see that the competition is mainly on the service level (i.e., competition among SPs). Nonetheless, the price is not affected only by number of competing SPs. It was observed that competition exists also at the NP level, yet not as intensely as among SPs. Although we observe some difference in the price offered by various NPs, it should be noted that prices are always associated with a diverse bundle of services in the Swedish fiber open market. That is, a lower price is normally complemented by higher requirements on bundled services, with a longer contract period (e.g., 12 to 18 months) and a long required notice period for termination (e.g., 3 months). These NPs are able to offer lower price to SPs, which will eventually pass this savings on to their subscribers because they have guaranteed revenue from the associated bundled services. Moreover, the study found some regional factors that suggest that service prices varies depending on the overall development context of municipalities, the openness of the local fiber market, and more importantly the local authorities’ initiates and involvement. Demographically, increased dynamicity of population change in the past 10 years in a municipality was found conducive to more favorable prices due to further competitive pressure on the suppliers, as this group of people is considered more broadband inclined and discerning in their choice of Internet services.
All results presented in this thesis are found statistically sound according to the robustness tests (see the Appendix).
5.2 Future Work In this study we are able to capture some early positive impacts of FTTH in
Sweden, particularly on population evolution, and more specifically on the benefit to subscribers of lower service costs. Nevertheless, a number of economic impacts are not observable yet. Part of this is due to the fact that the rapid deployment of FTTH in recent past has not yet allowed for wide availability of data that focus on different aspects related to the FTTH technology, which is also the main limitation of this study. As to the telecommunication market, the available information is unfortunately a mess. The lack of an integrated data source (e.g. price and other service details) increases the difficulties in regards to data collection, in this study information was collected manually from the websites of each NP, SP, and each municipality, and it requires quite extensive work and is very time consuming to collect this data. During the study, a database was established for data stability and security purposes, and an analysis method (i.e. econometric regression model) for quantifying effects was developed. It is believed a more advanced/intelligent mechanism for data collection would simplify the data processing to a certain degree and would save a lot of time.
55
This study could be extended by incorporating richer and more descriptive variables to see if FTTH impacts many other aspects, such as policies/decisions of authorities, location of newly created companies, etc. These aspects were not found statistically significant at the early stage of our study due to the lack of data. It is highly recommended to incorporate as many socio-economic effects in the analysis as possible in order to draw a complete picture for all interested sectors, including concerned authorities, local governments, market players, and private investors.
In addition, our findings on the price level (base line: 245.67 SEK per month) that we obtained is coincidently found to be generally in accordance with the very latest report published by PTS[79], which collected data in a different way, yet it supports our results to a great extent – but gives us greater confidence in our data collection and analysis. Nevertheless, one should be aware that some of the effects observed in this study, especially the practical competition in the open access network and the price of Internet service have certain provisionally, because the statistics obtained are based on the information (e.g. price) currently available online. It is noticed that market information such as prices of Internet services vary frequently on SPs’ websites (as the latest data for the prices have been updated 2 to 3 times during our research). Although the price changes could be in the order of 10 to 20 SEK magnitudes, they occur seldom enough to change anything significantly; especially the regression results have never been changed. Nevertheless it would be interesting to take this into consideration in a further study, to figure out whether these changes in prices are due to changes in marketing strategies based upon the current market and economic situation, or if these changes in prices are due only to periodically price adjustments for all SPs, thereby enhancing the current econometric model for a more comprehensive analysis.
Furthermore, the competition in the open access fiber network is measured in this study in terms of the number of competing SPs for the 10/10Mbps Internet service, NPs operating different fiber networks, and regional dependent factors. The study draws a clear picture of the main influential factors; however, it is not a complete picture of the competition, as some variance still remains unexplained. We noticed from the study that besides lowering prices, networks with more SPs seemed also leading to increased service differentiation (e.g., 10 Mbps, 100 Mbps, 1Gbps, 10 Gbps, Triple-play, etc.), however, we were not able to investigate in more detail and will leave for future work. Prices of a specific operator (e.g., Broadband2, Bahnhof, etc.) when plotted as a function of the number of competitors they have would also be interesting to explain the competition and change in price from another angle. Last but not least, what other external factors influence the Internet service price (e.g., construction costs for fiber infrastructure, local socio-economic situation and hence market size as well as price elasticity, other potential strategic and commercial factors) and current pricing mechanism from SPs’ internal perspective (e.g., aggressive pricing) are worth further studies, as SPs could therefore create corresponding pricing strategies with more structure and greater service differentiation.
5.3 Required Reflections This study acts as a starting point for assessing the macroeconomic impact of
fiber-based access technologies (i.e. FTTH) on social development and economic growth. We have identified the main benefits of having FTTH, their beneficiaries, and the mutual interactions among them. The positive analysis results indicate a great potential for FTTH, which specifically, may significantly benefit smaller

56
municipalities in terms of improved population evolution (less people are forced to move away), as well as benefit consumers by decreasing the cost of Internet service but with better QoS and this may stimulate consumption and hence economic growth. For instance, to give an idea of the magnitude of savings that open access on full competition leads to, a closed network changing to full openness to attract many service providers (e.g., from 1 SP to 11 SPs), would lead to a lower prices of 50 SEK/month at the lowest price and 70 SEK/month as an average price, meaning one could potentially induce 600 to 840 SEK/year in savings per end user. Making a very rough calculation, assuming 15% out of 4 million households who do not currently have access to an open network[80] would have access to a fully competing open network, this might lead to an approximately 500 million SEK/year in savings.
The substantial benefits of having FTTH suggest that there is a need for local authorities and investors to take these benefits into consideration, since the promotion and adoption of such ICT advancement will both benefit them and eventually benefit the whole society via development and economic growth.

57
References
[1] S. E. Gillett, W. H. Lehr, and C. Osorio, “Local government broadband initiatives”, Telecommunications Policy, vol 28, no 7–8, pp 537–558, 2004.
[2] C. Robert W. and J. Charles L., “The $500 billion opportunity: The potential economic benefit of widespread diffusion of broadband internet access”, Washington DC: Criterion Economics, 2001.
[3] P. E. Green, “Fiber to the home: the next big broadband thing”, Communications Magazine, IEEE, vol 42, no 9, pp 100–106, Sep 2004.
[4] M. Forzati and C. Mattsson, “Socio-economic effects of FTTH/FTTX in Sweden”, in Transparent Optical Networks (ICTON), 2012 14th International Conference on Transparent Optical Networks, 2012, pp 1–8.
[5] Ovum, “Socio-economic Benefits of FTTH. Ovum draft report to the Market intelligence Committee of the FTTH Council Europe”, Feb 2009.
[6] T. Ida and Y. Horiguchi, “Consumer Benefits of Public Services Over FTTH in Japan: Comparative Analysis of Provincial and Urban Areas by Using Discrete Choice Experiment”, The Information Society, vol 24, no 1, pp 1–17, 2008.
[7] B. Felton, “Yankee Group, Socioeconomic Benefits, FTTH Bulgaria”, Jan 2010.
[8] OECD, “Press Release: OECD Broadband Statistics (December 2011)”, 2012. [Online]. Available: http://www.oecd.org/sti/broadbandandtelecom/broadband portal-pressrelease-dec2011.htm. [Accessed: 30th Jul 2012].
[9] R. Montagne, “IDATE: FTTH/B Panorama - Europe (39 countries) at December 2011”, FTTH Council Europe, Munich, FTTH Council Europe Conference, Feb 2012.
[10] “FTTH Business Guide, 3rd Edition”, Fiber To The Home Council Europe, vol 7, 2012.
[11] T. Koonen, “Fiber to the Home/Fiber to the Premises: What, Where, and When?”, Proceedings of the IEEE, vol 94, no 5, pp 911–934, May 2006.
[12] “FTTH Handbook - FTTH Council Europe Wiki”. [Online]. Available: http://wiki.ftthcouncil.eu/index.php/FTTH_Handbook. [Accessed: 29th Jul 2012].
[13] G. Keiser, FTTX concepts and applications, vol 91. Wiley-IEEE Press, 2006.
[14] H. Hagemann, “Consequences of the new information and communication technologies for growth, productivity and employment”, Competitiveness Review: An International Business Journal incorporating Journal of Global Competitiveness, vol 18, no 1/2, pp 57–69, 2008.
[15] F. Mamaghani, “The social and economic impact of information and communication technology on developing countries: An analysis”, International Journal of Management, vol 27, no 3, p 607, 2010.

58
[16] E. A. Cortés and J.-L. A. Navarro, “Do ICT Influence Economic Growth and Human Development in European Union Countries? - Springer”, International Advances in Economic Research, vol 17, no 1, pp 28–44, Feb 2011.
[17] L. H. Röller and L. Waverman, “Telecommunications infrastructure and economic development: A simultaneous approach”, American Economic Review, pp 909–923, 2001.
[18] R. W. Crandall, C. Jackson, and H. Singer, “The Effect of Ubiquitous Broadband Adoption on Investment, Jobs, and the US Economy”, Washington DC: Criterion Economics, 2003.
[19] R. Katz and S. Suter, “Estimating the economic impact of the broadband stimulus plan”, Columbia Institute for Tele-Information Working Paper, 2009.
[20] LECG, “Economic Impact of Broadband: An Empirical Study.”, 2009.
[21] C. Z. W. Qiang, C. M. Rossotto, and K. Kimura, “Economic impacts of broadband”, Information and Communications for Development 2009: Extending Reach and Increasing Impact, pp 35–50, 2009.
[22] R. W. Crandall, R. E. Litan, and W. Lehr, “The Effects of Broadband Deployment on Output and Employment: A Cross-sectional Analysis of US Data”, Economic Policy, The Brookings Institution, no 6, 2007.
[23] N. Czernich, O. Falck, T. Kretschmer, and L. Woessmann, “Broadband Infrastructure and Economic Growth”, The Economic Journal, vol 121, no 552, pp 505–532, 2011.
[24] P. Koutroumpis, “The economic impact of broadband on growth: A simultaneous approach”, Telecommunications Policy, vol 33, no 9, pp 471–485, 2009.
[25] W. H. Lehr, C. A. Osorio, S. E. Gillett, and M. A. Sirbu, “Measuring Broadband’s Economic Impact”, in Measuring Broadband’s Economic Impact, Arlington, VA, 2006.
[26] H. G. Thompson Jr. and C. Garbacz, “Economic impacts of mobile versus fixed broadband”, Telecommunications Policy, vol 35, no 11, pp 999–1009, 2011.
[27] M. Forzati and C. P. Larsen, “Broadband access and its impact on the economy, a Swedish perspective”, in Transparent Optical Networks, ICTON, Athens, Greece, 2008, vol 2, pp 190–193.
[28] M. Forzati and C. Mattsson, “Socio–economic return of FTTH investement in Sweden, a prestudy”. Acreo study by appointment of PTS/Bredbandsforum, 2011. [Online]. Available: https://www.acreo.se/publications/socio-economic-return-of-ftth-investment-in-sweden-a-prestudy. [Accessed: 23th Oct 2012]
[29] M. Dischinger, A. Haeberlen, K. P. Gummadi, and S. Saroiu, “Characterizing residential broadband networks”, in Internet Measurement Conference: Proceedings of the 7 th ACM SIGCOMM conference on Internet measurement, 2007, vol 24, pp 43–56.
[30] Cisco, “Internetworking technology handbook”. 2006.
[31] C. Troulos, “Bulgaria: Socio-economic Benefits of Broadband”, 2010.
59
[32] W. C. Kim and R. Mauborgne, Blue Ocean Strategy. Giland Media Corporation by arrangement with Harvard Business School Press, 2006.
[33] M. Zuhdi, E. T. Pereira, and A. Teixeira, “Utilization of fiber to the home as a Blue Ocean Strategy to gain competitive advantage”, in Transparent Optical Networks (ICTON), 2010 12th International Conference on, 2010, pp 1–4.
[34] M. J. Matthewson, “Fiber lifetime predictions”, in Proc. Soc. Photo-Opt. Instrum. Eng, 1991, vol 1580, pp 30–141.
[35] B. Lannoo, K. Casier, J. Van Ooteghem, B. Wouters, S. Verbrugge, D. Colle, M. Pickavet, and P. Demeester, “Economic benefits of a community driven Fiber to the Home rollout”, Broadband Communications, Networks and Systems, 2008. BROADNETS 2008. 5th International Conference on, pp 436–443, 8.
[36] K. Takachi, T. Otsuka, and H. Mitomo, “A cost benefit analysis of the nationawide FTTH development in Japan”, presented at the 16th Biennial Conference of the ITS, June, 2006.
[37] M. Forzati, C. Mattsson, K. Wang, and C. P. Larsen, “The uncaptured value of FTTH networks”, in 13th International Conference on Transparent Optical Networks (ICTON), 2011, pp 1–4.
[38] B. N. Guidry, P. P. Carson, and C. Haon, “Economic implications of FTTH networks: A cross-sectional analysis”, Journal of Economic and Social Policy, vol 15, no 1, p 5, 2012.
[39] S. K. Samanta, K. Guild, H. Pan, and R. Martin, “Adoption of FTTx Broadband: A Cross-Country Analysis”, SSRN, May 2011.
[40] J. Schindler, “Creating a brighter future: The socio-economic impact of Fibre to the Home”, Turin, Italy, Sep 2010.
[41] Ecobilan, “Life cycle assessment for the different used tyres recycling methods”, PricewaterhouseCoopers, 2009.
[42] FTTH Council Europe, “Annual Report FTTH Council Europe: April 2011 - April 2012”, 2012.
[43] B. G. Kojo, P. Davidsson, and K. Fransén, “The Swedish Telecommunications Market 2011”, PTS The Swedish Post and Telecom Authority, PTS-ER-2012:17, May 2012.
[44] O. Holmström and B. G. Kojo, “PTS bredbandskartläggning 2011 – En geografisk översikt av bredbandstillgången i Sverige”, PTS The Swedish Post and Telecom Authority, PTS-ER-2012:11, Mar 2012.
[45] Government Offices of Sweden and PTS Statistikportalen, “Broadband strategy for Sweden”, Ministry of Enterprise, Energy and Communications, Nov 2009.
[46] OECD Broadband Statistics, “Fixed and wireless broadband subscriptions per 100 inhabitants by technology (December 2011)”, OECD. [Online]. Available: http://www.oecd.org/sti/interneteconomy/oecdbroadbandportal.htm. [Accessed: 30th Jul 2012].

60
[47] European Commission, “Sweden 2011 Telecommunication Market and Regulatory Developments”, Information Society and Media Directorate-General, Brussel, part of the Scoreboard 2012, Jun 2012.
[48] P. Davidsson, B. K. Gustafsson, and K. Fransén, “The Swedish Telecommunications Market first half--year 2012”, PTS The Swedish Post and Telecom Authority, Stockholm, Sweden, PTS-ER-2012:24, Nov 2012.
[49] G. Finnie, “European FTTH Forecast: 2011-2016”, presented at the FTTH Council Europe Conference, 2012.
[50] “PTS Bredbandskartan”. [Online]. Available: http://www.bredbandskartan.se/. [Accessed: 16th Nov 2012].
[51] I. Cava-Ferreruela and A. Alabau-Munoz, “Broadband policy assessment: A cross-national empirical analysis”, Telecommunications Policy, vol 30, no 8, pp 445–463, 2006.
[52] J. D. Ridder, “Catching-Up in Broadband–What Will It Take?”, presented at the 35th Research Conference on Communication, Information and Internet Policy, Arlington, VA, 2007.
[53] R. D. Atkinson, D. K. Correa, and J. A. Hedlund, “Explaining International Broadband Leadership”, presented at the Information Technology and Innovation Foundation, Washington, DC., 2008.
[54] S. Lee and J. S. Brown, “Examining broadband adoption factors: an empirical analysis between countries”, Info, vol 10, no 1, pp 25–39, 2008.
[55] T. Reynolds and G. Sacks, “Promoting Broadband: Background Paper”, presented at the ITU New Initiatives Workshop on Promoting Broadband, Geneva, Switzerland, 2003.
[56] International Telecom Union, “ITU Internet Reports 2003: Birth of Broadband”, Geneva, Switzerland, 2003.
[57] P. Trkman, B. Jerman Blazic, and T. Turk, “Factors of broadband development and the design of a strategic policy framework”, Telecommunications Policy, vol 32, no 2, pp 101–115, 2008.
[58] S. J. Wallsten, “Broadband and Unbundling Regulations in OECD Countries”, AEI-Brookings Joint Center for Regulatory Studies Working Paper, 2006.
[59] M. Clements and A. Abramowitz, “The development and adoption of broadband service: A household level analysis.”, presented at the 35th Research Conference on Communication, Information and Internet Policy, Arlington, VA, 2006.
[60] S. J. Savage and D. Waldman, “Broadband Internet access, awareness, and use: Analysis of United States household data”, Telecommunications Policy, vol 29, no 8, pp 615–633, 2005.
[61] A. Chaudhuri, K. S. Flamm, and J. Horrigan, “An analysis of the determinants of internet access”, Telecommunications Policy, vol 29, no 9, pp 731–755, 2005.
[62] A. Umino, “Development in local loop unbundling”, presented at the Working Party on Telecommunications and Information Services Policy (TISP), 2003.
61
[63] M. Grosso, “Determinants of broadband penetration in OECD nations”, in Australian Communications Policy and Research Forum, 2006.
[64] R. Frieden, “Unbundling the local loop: a cost/benefit analysis for developing nations”, Info, vol 7, no 6, pp 3–15, 2005.
[65] M. Forzati, C. P. Larsen, and C. Mattsson, “Open access networks, the Swedish experience”, in Transparent Optical Networks (ICTON), 2010 12th International Conference on, 2010, pp 1–4.
[66] R. Battiti, R. L. Cigno, F. Orava, and B. Pehrson, “Global growth of open access networks: from warchalking and connection sharing to sustainable business”, presented at the WMASH ’03 The 1st ACM international workshop on Wireless mobile applications and services on WLAN hotspots, New York, NY, USA, 2003, pp 19–28.
[67] D. N. Gujarati, Basic Econometrics, 4th Edition. New York, NY, USA: McGraw-Hill, 2004.
[68] “SCB - Statistics Sweden”. [Online]. Available: http://www.scb.se/default____2154.aspx. [Accessed: 19th Jun 2012].
[69] S. Robert, S. Michael O., and C. John, The ODBC Solution: Open Database Connectivity in Distributed Environmens. New York, NY, USA: McGraw-Hill, Inc., 1995.
[70] C. J. Date and H. Darwen, A Guide to the SQL Standard, vol 3. Addison-Wesley Reading (Ma) et al., 1987.
[71] M Forzati, et al. “Early effects of FTTH/FTTx on employment and population evolution, an analysis of the 2007-2010 time period in Sweden”. [Online]. Available: http://www.acreo.se/publications/early-effects-of-ftthfttx-on-emplo yment-and-population-evolution-an-analysis-of-the. [Accessed: 14th Dec 2012].
[72] “Death rate; crude (per 1;000 people) in Sweden”. [Online]. Available: http://www.tradingeconomics.com/sweden/death-rate-crude-per-1-000-people-wb-data.html. [Accessed: 18th Dec 2012].
[73] “Sweden’s mortality rates world’s second lowest”. [Online]. Available: http://www.swedishwire.com/economy/4256-swedens-mortality-rates-worlds-second-lowest. [Accessed: 18th Dec 2012].
[74] “Statistics Sweden”, SCB Statistics Sweden. [Online]. Available: http://www.scb.se/Pages/SSD/SSD_TablePresentation____340508.aspx?rxid=77d0b325-2ee8-4e28-b6dd-1f8559490671&px_tableid=&productcode=&men u=2. [Accessed: 17th Dec 2012].
[75] G. Andersson, “Childbearing after Migration: Fertility Patterns of Foreign-born Women in Sweden1”, International Migration Review, vol 38, no 2, pp 747–774, 2004.
[76] M. Forzati and C. Mattsson, “Swedish FTTH deployments and lessons for the Trentino context”. 15th Oct 2012.
[77] K. Vasileva, “Population and social conditions”, Eurostat, no Statistics in Focus no. 34, p pp. 2, 2011.

62
[78] M. Rendall and J. Salt, “The foreign-born population”, Focus on People and Migration, London: Palgrave Macmillan, pp 131–152, 2005.
[79] O. Holmström and K. Fransén, “Prisutvecklingen på mobiltelefoni och bredband: till och med första kvartalet 2012”, PTS The Swedish Post and Telecom Authority, Stockholm, Sweden, PTS-ER-2012:26, Dec 2012.
[80] E. Mikael and J. Camilla, “Öppna Nät: Svenska Stadsnätsföreningens syn på stadsnätens roll”, SSNF, Stockholm, Sweden, Svenska Stadsnätsföreningen 2010, Jun 2010.
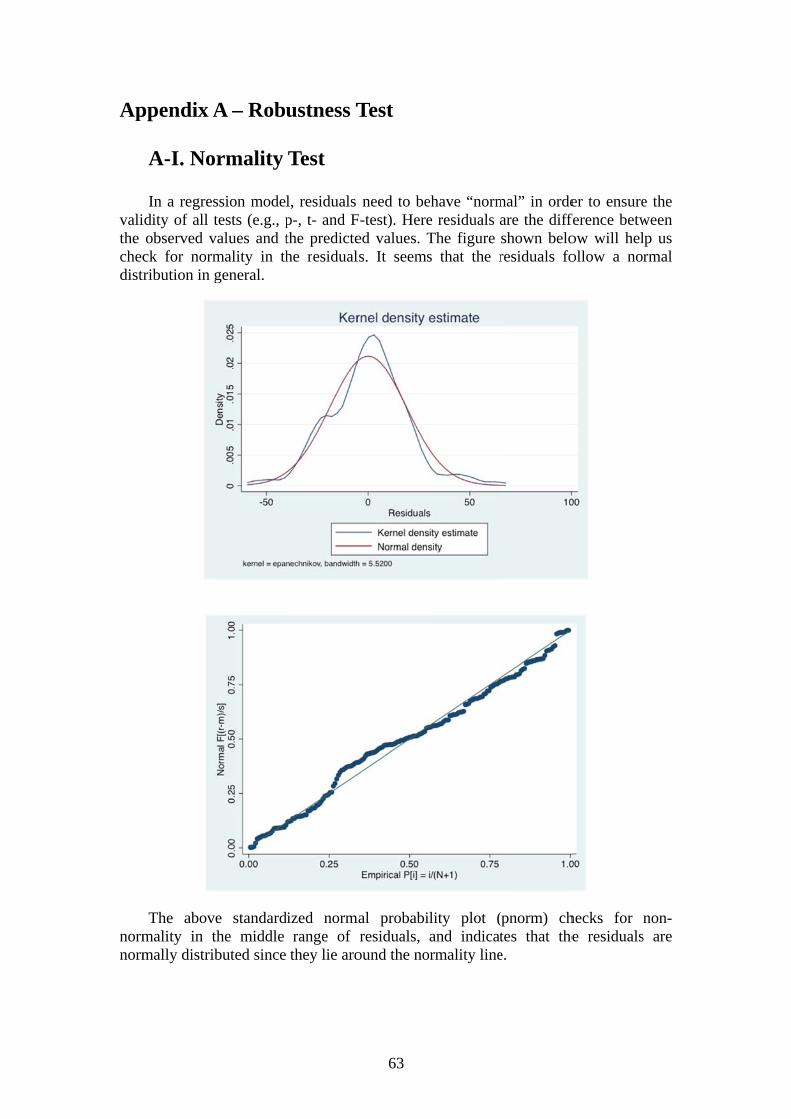
Ap
valithe checdistr
normnorm
ppendix A
A-I. No
In a regresidity of all tobserved vck for normribution in g
The abovmality in tmally distrib
A – Rob
ormality
ssion modetests (e.g., p
values and tmality in thgeneral.
ve standardthe middle buted since
ustness T
Test
l, residuals p-, t- and Fthe predictehe residual
dized normrange of
they lie aro
63
Test
need to beF-test). Hereed values. Tls. It seems
mal probabiresiduals,
ound the no
ehave “norme residuals The figure s that the r
lity plot (and indicat
ormality line
mal” in ordeare the diffshown beloresiduals fo
(pnorm) chtes that thee.
er to ensureference betwow will helollow a nor
hecks for ne residuals
e the ween lp us rmal
non-s are

64
shoutest
used
grap
all tany pred
We hav
A-II. M
It is impould not be ais performe
VIF test red in our reg
A-III. H
There are phical meth
Homoskedthe explana
alarming dicted value
do not see e any issues
Multicolli
ortant for oa linear funced:
esult suggesgression of p
Heterosk
plenty of hod was cho
dasticity meatory variab
pattern in e of the estim
a specific ps of heteros
inearity T
our multiplction of eac
sts no multiprice model
kedasticit
ways to teosen in order
eans that theles, otherwour model
mated mode
pattern of thkedasticity.
Test
le regressioch other. He
icollinearity, as the VIF
ty Test
est Heterosr to detect i
e variance iswise heterosk
l, a visual el is plotted
the scattered.
on model tence a Varia
y among insF value is w
skedasticity t intuitively
s constant okedasticity
inspectiond as shown b
d residuals,
hat indepenance Inflatio
strumental vithin the acc
in Economy.
over the rangexists. To e
n of residubelow:
suggesting
ndent variaon Factor (V
variables thceptable ran
metrics. He
nge of valueexam if the
uals against
g that we do
ables VIF)
hat is nge.
ere a
s for re is
t the
o not

www.kth.se
TRITA-ICT-EX-2013:35