socio economic profile - hudphed.punjab.gov.pk policy brief .pdf · province during last three...
TRANSCRIPT

1
SOCIOECONOMICPROFILEPunjabwithapopulationof101.4millionisthemostpopulousprovinceofPakistan,withapproximately55.6%ofthecountry'stotalpopulation.Thepopulationgrowthratein1998was2.64%,whichdecreasedto1.9%in2011.Itisestimatedthatthepopulationofprovincewillbe130millionin2030,andaround181millionin2050.Rapidurbanisationandagrowingpopulationwillcontinuetoincreasedemandforwater,sanitationandhygiene(WASH)services,asthecurrentshareofurbanpopulationis32%.
InfantMortalityRate(IMR)andUnder5MortalityRate(U5MR)remainhighinPunjab.TheMICS2014foundanIMRof76per1000livebirthsandU5MRof96per1000livebirths.Evidencesuggeststhatpneumonia,diarrhoeaandmalariacauseabout50%ofalldeathsinchildreninPakistan.
Around53,000childrendieeveryyearfromdiarrhoeainPakistan,ofwhich27,000inthePunjabonly.Inadditionaboutonethirdofchildrenunder5yearsinPunjabareunderweight(33.7%)andstunted(33.5%)
GOVERNANCEFRAMEWORKTheGovernmentofPunjabhasapproveddrinkingwaterpolicy2011,andadraftsanitationpolicy2013thatispendingforapprovalwithcabinetofGovernmentofPunjab.BothpoliciesprovidedtheoverarchingvisionandframeworkforWater,SanitationandHygiene(WASH)intheprovince.ThePlanningandDevelopmentBoard,GovernmentofPunjabhasdevelopedagrowthstrategyfortheprovinceentitled“PunjabGrowthStrategy2018-AcceleratingEconomicGrowthandSocialOutcomes”.ThedocumentendorsesPunjab’shealthsector’svisionandstrategy,whichemphasisesimprovementofwater,sanitationandhygieneservicestopreventcommunicablediseases.ThegovernmentofPunjabdevelopedatenyearsWASHSectorDevelopmentPlanforWater,SanitationandHygiene2014-2024thatwasformallylaunchedinFebruary2016.Thisservesastheimplementationframeworkfordrinkingwater,sanitationandhygieneintheprovincewithshort,mediumandlong-termstrategicactions.
TheHousing,UrbanDevelopment,PublicHealthEngineeringDevelopment(HUD-PHED)incollaboration
withUNICEFconductedWASHCapacityAssessmentanddevelopedStrategicRoadmapforWASHHumanResourceDevelopment,forserviceprovidersinPunjab.Further,thecapacitydevelopmentforPakistanApproachtoTotalSanitation(PATS)isbeinginstitutionalizedthroughLocalGovernmentAcademyandformationofdistrictWASHCoordinationCommittees.Moreover,WASHhasbeenaddedinthecurriculumandtrainingmodulesofLadyHealthWorkersandSchoolHealth&NutritionSupervisors.Veryrecently,PunjabSchoolWASHstrategyhasbeendeveloped,andthisisbeingintegratedintheschooleducationroadmap.
ThePunjabLocalGovernmentAct2013envisagestheresponsibilitiesofprovision,access,operationandmaintenanceofdrinkingwaterandimprovedsanitationservicestorespectivecouncilswithintheirjurisdictionsincludingurbanandruralareas.However,overalllegalframeworkfordrinkingwater,sanitationandhygieneisfragmentedespeciallyaroundoperationandmaintenance(O&M),communityparticipation,andresourceallocationscriterion.
ACCESSTODRINKINGWATERAsperthePunjabMultipleIndicatorClusterSurvey(MICS)2014,about94%ofthepopulationusesanimprovedsourceofdrinkingwater–89%inurbanareasand97%inrural.Around72.3%populationoftheprovinceusesgroundwaterasdrinkingwatersourceextractedbyhand-pumpsormotorisedpumps.Overall,19.2%populationhasaccesstotapwater;with39.2%inurbanareas,and9.6%inruralareas.Overall,80.8%ofthepopulationhasaccesstoimprovedwatersourceslocatedattheirpremisesthatishigherinruralareas(84.3%)comparedtourbanareas(73.7%).
FIGURE1:IMPROVEDWATER-INCOMEGROUPS
Areviewofaccesstoimprovedwaterindifferentincomequintilesrevealsthatthecoveragegoesdown
97.6 98.0 96.3
91.688.5
80.0
85.0
90.0
95.0
100.0
Percent
Urban
Rural
Overall

2
fromthepooresttotherichest,anditismorevisibleinurbanareascomparedtoruralareas,andthisismainlybecausetherichestareusinglocalvendorsorbottledwaterthatisconsideredunimprovedunderdefinitiondefinedbyJointMonitoringProgramme(JMP)ReportthatrecordsandtracksprogressofWASHintheworld.
ACCESSTOWATERQUALITYAsperVision2025documentofGovernmentofPakistan,watercontaminationandpoorwaterqualityhavedirectandverysignificantimpactonthenation’shealthwithwaterbornediseasesaccountingfor70%ofallcommondiseasesthatimpactthenationalhealth.ThishasbeenfurtherrecognizedinthenewlylaunchedSustainableDevelopmentGoals(SDGs)asoneofthekeyparametersforthenewlydefinedtargetofsafelymanagedwatersources.Thetechnicalassessmentofwatersupplyschemesin21districtsinnorthandcentralPunjab,conductedbythePakistanCouncilofResearchinWaterResourcesin2011revealedthatmorethan80%ofthepopulationusesgroundwaterand43%offunctionalschemessuppliedwaterforlessthan5hoursperday,while31%suppliedbetween5-10hoursperday.In80%oftheschemes,thereisnowatertreatmentfacility,whileonly12%providesometreatment.AsperdraftNationalWaterQualityMonitoringReport2014-2015,around35%watersourcesinPunjabaresafefordrinkingpurposes-freefrommicrobiologicalandchemicalcontamination(iron,fluoride,nitrates)andphysicalcharacteristics(turbidity,hardness,totaldissolvedsolids)comparedto31%intherestofthecountry.EffortstoaddresswaterqualityissuesarebeingtakenintoaccountpartlythroughinstallationofwaterfiltrationplantsthatdoesnotfallundernewdefinitionofsafelymanagedwaterasgiveninSustainableDevelopmentGoals(SDGs).TheGovernmentofPunjabiscommittedtoestablishfourcentersofexcellenceand32waterqualitylaboratoriesatthedistrictlevelsinnextfewyearstostrengthenwaterqualityasintegralcomponentofsafelymanagedwaterservices.
ACCESSTOIMPROVEDSANITATIONAsperPunjabMICS2014,around3/4thofthepopulation(75%)isusingimprovedsanitationfacilitiesi.e.,urban(92%)andruralareas(67%).TheGovernmentofPunjabrecognizedtheframeworkofPakistanApproachtoTotalSanitation(PATS)withakeyfocustoendopendefecationby2018.Presently,PATSisbeingimplementedinall36districtsofPunjabwithfinancingfromGovernmentofPunjabaswellascollaborationwithlocalandinternationalpartners.In2014/2015,nearly18%populationwaspractisingopendefecationcomparedto23%in2011,anditisexpectedthatPunjabshallbeopendefecationfreeby2020.PATSfocusesonimprovingbehaviourandcreatingdemandsforsafelymanagedsanitationsystemsthatincludeappropriatesewerageandfaecalsludgemanagement.
FIGURE2:IMPROVEDSANITATION-INCOMEGROUPS
Thedataofimprovedsanitationdemonstratedthatonly24.7%ofthepoorestpopulation(lowestquintile)isusingimprovedsanitationascomparedto97%oftherichestpopulation(highestquintiles).Further,only33.8%ofHHsinurbanareasand49.1%inruralareasindicatedtheirflushconnectionwithseptictanks.Theaccesstoseweragesystemsis56.3%inurbanareasand4.1%inruralareasthatshowsnotonlyhugedisparitybutalsoindicatesanurgentcallforaction.Punjabcurrentlydoesnothaveanyfacilityforsewage/wastewatertreatmentexceptforoneinFaisalabad,resultinginmajordamagetopublichealth,environmentandproductivityofourcitiesanddownstreamagricultureareas.Investmentinthesefacilitiesisrequiredonaprioritybasis.
WASHSECTORFINANCINGDespitemanyotherdevelopmentprioritiesandemergencyresponsesinlastfewyears,theGovernmentofPunjabhassteadilybeenincreasingitsinvestmentsonwatersupplyandsanitation.Theinvestmenttrendsshowathree-foldincreasefromPKR9billionin2009-10toPKR26billionin2015-16excludingPKRs10billionspentonSaafPaniduring2015-2016.
FIGURE3:INVESTMENTTRENDSFROM2010TO2016
Inlastfewyears,GovernmentofPunjabrealizedthesignificanceofstrategicinvestmentonsanitation.During2015-2016,66%oftotalWASHbudgetwithoutSaafPaniCompanywasspentonsanitationwhilethisratiowaslessthan30%in2013-2014.HoweverevenwithadditionofSaafPaniCompany,theshareofsanitationis48%indicatinggreaterownershipbypoliticalleadership.Similarly,theshareofspendinginruralareasincreasedi.e.,around48%oftotalWASHbudgetisbeingspentinruralareas
24.7
71.988.9 92.9 97.3
0.020.040.060.080.0100.0120.0
Percent
Urban
Rural
Overall
1
9 11 129
14
27
36
0.0
10.0
20.0
30.0
40.0
2009-10 2010-11 2011-12 2012-13 2013-14 2014-15 2015-16
BillionRupees
CurrentRevenueExpenditu
3
TABLE1:WASHSPENDING2015-2016Expenses Urban-PKR
BillionRural-PKRBillion
Total
Water Sanitation Water Sanitation
ActualWithoutSaafPani
5.93 13.03 2.95 4.03 25.95
23% 50% 11% 16% 100%
ActualwithSaafPani
5.93 13.03 13.1 4.03 36.03
16% 36% 36% 11% 100%
Thereisgrowingemphasisonwaterquality,evidentfromspendingofPKRs10billiononwaterfiltrationplantsduring2015-2016inruralareasofPunjab.ThisspendingwillbeincreasingincomingyearsbutstillshareofWASHinprovincialbudgetissignificantlylowcomparedtoothersocialsectors.
Areviewof2015-2016budgetofPunjabindicatesthatexpendituresonwatersupplyandsanitationare1.75%comparedto8.3%onhealth,6.8%oneducationand3.7%onsocialprotection.
FIGURE4:PERCAPITAWASHSPENDING-DISTRICTS
ThoughthereissignificantprogressintermsofreducinginequitiesbetweenruralandurbanaswellaswaterandsanitationssectorattheprovinciallevelbuttherearesignificantdisparitiesbetweendistrictsintermsofWASHspendingforlastthreeyears.
TheaveragepercapitaspendingonWASHintheprovinceduringlastthreeyearsisPKRs264.
ThedistrictswithaveragespendinglessthanRs200percapitaareJhang,Muzaffargarh,Layyah,VehariandPakpattan.
SUSTAINABLEDEVELOPMENTGOALSInSeptember2015,theworldadoptedtheSustainableDevelopmentGoals(SDGs)ascontinuityofMillenniumDevelopmentGoals(MDGs).TheSDGswereformallylaunchedinPakistaninOctober2015bytheMinistryofPlanning,DevelopmentandReforms.On19thFebruary2016,PakistanbecamethefirstcountryintheworldwhoseNationalAssemblypassedaunanimous
ResolutionadoptingSDGsAgendaasPakistan’sDevelopmentAgendai.e.,PakistanDevelopmentGoals(PDGs).TheSDGshaveseventeengoalswith169indicators.
TheGoal6ofSDGsis:ensureavailabilityandsustainablemanagementofwaterandsanitationforall.TheGoal6goesbeyondaccesstodrinkingwater,sanitationandhygieneandalsoaddressesthequalityandsustainabilityofwaterresources.AchievingthisGoal,whichiscriticalforthesurvivalofpeople,anditmeansexpandingcooperationamongstakeholdersandgarneringthesupportoflocalcommunitiesinimprovingwaterandsanitationmanagement.
SAFELYMANAGEDWATERSDG6.1:Achieveuniversalandequitableaccesstosafeandaffordabledrinkingwaterforall.Thisisdefinedaspopulationusingimproveddrinkingwatersource,whichis:i)Locatedonpremises;ii)Availablewhenneeded;iii)Andfreeoffaecaandprioritychemicalcontamination.
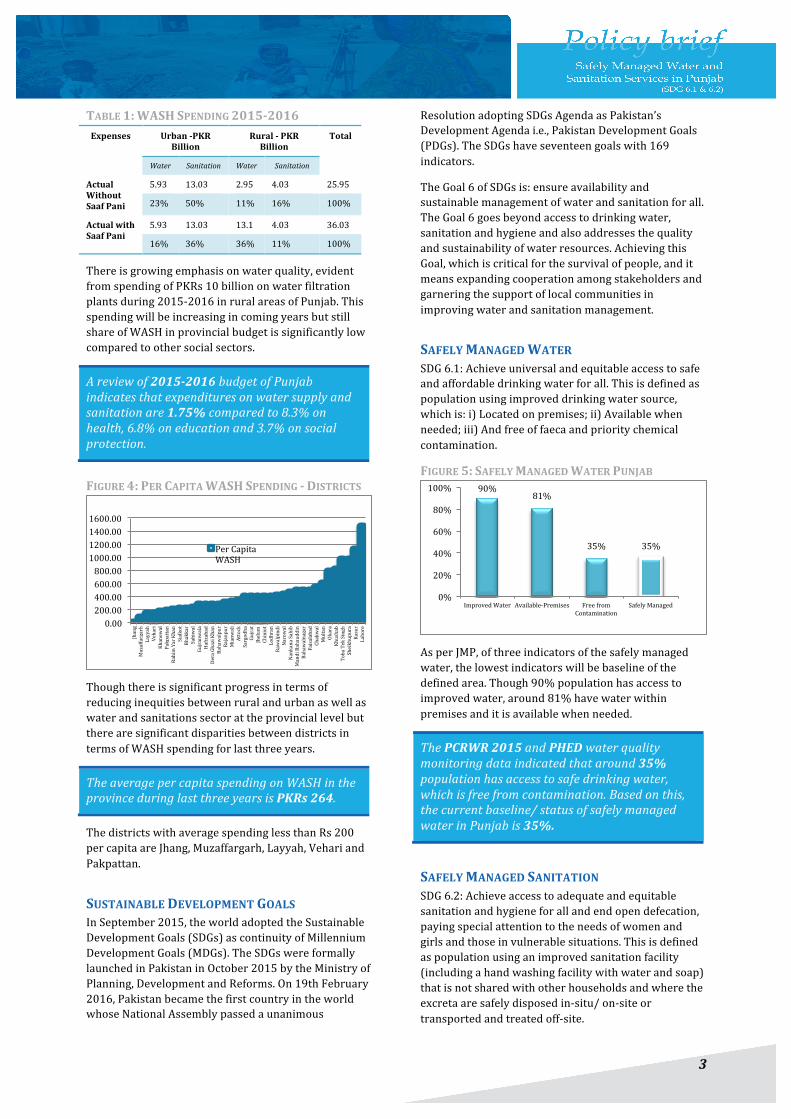
FIGURE5:SAFELYMANAGEDWATERPUNJAB
AsperJMP,ofthreeindicatorsofthesafelymanagedwater,thelowestindicatorswillbebaselineofthedefinedarea.Though90%populationhasaccesstoimprovedwater,around81%havewaterwithinpremisesanditisavailablewhenneeded.
ThePCRWR2015andPHEDwaterqualitymonitoringdataindicatedthataround35%populationhasaccesstosafedrinkingwater,whichisfreefromcontamination.Basedonthis,thecurrentbaseline/statusofsafelymanagedwaterinPunjabis35%.
SAFELYMANAGEDSANITATIONSDG6.2:Achieveaccesstoadequateandequitablesanitationandhygieneforallandendopendefecation,payingspecialattentiontotheneedsofwomenandgirlsandthoseinvulnerablesituations.Thisisdefinedaspopulationusinganimprovedsanitationfacility(includingahandwashingfacilitywithwaterandsoap)thatisnotsharedwithotherhouseholdsandwheretheexcretaaresafelydisposedin-situ/on-siteortransportedandtreatedoff-site.
0.00200.00400.00600.00800.001000.001200.001400.001600.00
Jhang
Muzaffargarh
Layyah
Vehari
Khanewal
Pakpattan
RahimYarKhan
Sialkot
Bhakkar
Sahiwal
Gujranwala
Hamizabad
DeraGhaziKhan
Bahawalpur
Rajanpur
Mianw
ali
Attock
Sargodha
Gujrat
Jhelum
Chiniot
Lodhran
Rawalpindi
Narowal
NankanaSahib
MandiBahauddin
Bahawalnagar
Faisalabad
Chakwal
Multan
Okara
Khushab
TobaTekSingh
Sheikhupura
Kasur
Lahore
PerCapitaWASH
90%81%
35% 35%
0%
20%
40%
60%
80%
100%
ImprovedWater Available-Premises FreefromContamination
SafelyManaged

4
FIGURE6:SAFELYMANAGEDSANITATIONINPUNJAB
Around75%populationinPunjabhasimprovedsanitation,whichisnotsharedwithothers,andaround78%populationindicatedhandwashingwithsoap&water.Apparently,around51.5%HHsinPunjabareconnectedeitherwithseptictanksorsewerlines.Consideringthison-sitetreatment,Punjabprovincehasaround51.5%coverageofsafelymanagedsanitationathouseholdslevels.However,thereisnoreliabledatainformationabouteffectivefaecalsludgemanagementeitheron-siteoroff-site.AsperJMP,ofthreeindicatorsofthesafelymanagedsanitationservices,thelowestindicatorwillbebaselineofthedefinedarea.Socurrentbaseline/statusofsafelymanagedsanitationinPunjabcannotbesetatthisstage.
SDGINVESTMENTNEEDSTheinvestmentneedstoachieveSDGsofwaterandsanitationarebeingdefinedfortheprovince.TheWASHSectorDevelopmentPlan2014-2024identifiedthatannualPKR40billionwillberequiredfornext10yearstoreach85%populationforsafelymanageddrinkingwaterand65%populationforsafelymanagedsanitation.
FIGURE7:INVESTMENTNEEDSFORWATERAND
SANITATIONINPUNJAB
Theabovegraphdepictsannualamountoffundsincluding8%inflationthatisrequiredfornext10years.TheGovernmentofPunjabspentPKR36billionduringfinancialyear2015-2016.BasedontheSDGcostingtooldevelopedbyWorldBankandUNICEF,itisestimatedthatPakistanwillneedPKRs200billionannuallytomeetSDGtargetofwaterandsanitation,andthecalculationsforPunjabhavenotyetbeenmade.
RECOMMENDATION/WAYFORWARD1. TransformingthenewSDGdevelopment
frameworkintoanactionframeworkrequiresrevisioninexistingpolicies,resourcingtheSDG,redefiningmonitoringframeworkandrealigningthegovernancestructure.RevisionofdrinkingwaterpolicyandsanitationpolicyforalignmentwithSDGsisrecommended.
2. Reviewandrefinetheexistinglegislativeandoperationalframeworksrelatedtosafelymanagedwaterandsanitationservicesespeciallyaroundavailability,operationandmaintenance,tariffrationalizationincludingwatermetering,sludgemanagementandcommunityparticipation.
3. DeviseaformulafordistributionofWASHfundsatthedistrictandregional(divisional)levels.Thisformulashouldincludeweightageofpoverty,WASHaccessandgeographicalsizeofthedistrictsandshouldbebasedonnewlyagreedSDGsbaselinewiththreeyearsrollinginvestmentplans.
4. Institutionalizewaterqualityandwastewater/sewagetreatmentinallstagesofprojectplanning,developmentandexecutionforensuringaccessandavailabilityofsafewaterandsanitationservicesintheprovinces.
5. Communityawarenessandmobilizationshouldbeinitiatedforsafelymanagedwaterandsanitationserviceswithakeyemphasisondevelopingandimplementingcosteffectivetechniques/approachespreferablythroughpublicprivatepartnershipsandcommunityinvestmentmodels.
6. TheperiodicJointSectorReviewforWASHshouldbeinstitutionalized,bybringingdifferentstakeholderstogetherespeciallyseniorpoliticalleadership,withacommonperformancereviewframeworkandM&EforWASHaspertheSDGscriterion.TheGovernmentofPunjabshallcalculatetheSDGcostsforsafelymanagedwaterandsanitationservicesbyJuly2017.
REFERENCES1. PunjabWASSectorDevelopmentPlan2014-2024,P&D,
GovernmentofPunjab-20162. MultipleIndicatorsClusterSurvey2014,PunjabBureau
ofStatistics,GovernmentofPunjab3. PakistanDemographicHealthSurvey2012-2013,NIPS,
Islamabad4. SecondaryMICS2014AnalysisforWASH,HUD-PHED,
GovernmentofPunjab-20165. PunjabWASHBudgetAnalysis,2015-2016,HUD-PHED,
GovernmentofPunjab-20166. NationalWaterQualityMonitoringReport2014-2015,
PCRWR,GovernmentofPakistan7. PunjabWASHSectorStatusReport2016,HUD-PHED,
GovernmentofPunjab-2016
17.57.4
75.1 78.1
51.5
NA0102030405060708090
15
27
3632.4 34.9937.7940.81
44.0847.61
51.4155.53
59.9764.77
0
10
20
30
40
50
60
70
2015 2016 2017 2018 2019 2020 2021 2022 2023 2024
BillionRupees
Currentsectoralinvestment