socio-economic status and fertility: a study of selected ... · malaysian journal of economic...
TRANSCRIPT

Malaysian Journal of Economic Studies Vol. 54 No. 1, 2017 119
Malaysian Journal of Economic Studies 54(1): 119–140, 2017 ISSN 1511-4554
Socio-economic Status and Fertility:A Study of Selected ASEAN Countries
Siow-Li Laia
Nai-Peng Teyb Sor-Tho Ngc
University of Malaya
Abstract: This study analyses fertility differentials and factors affecting childbearing in Cambodia, Indonesia and the Philippines. Although socio-economic development has resulted in the desire for smaller family size, the availability of family planning services has also played an important role in fertility decline in the three countries under study. Of the three countries, Indonesia has the lowest fertility due to its strong family planning program, while the relatively higher fertility in the Philippines can be attributed to strong opposition of the Catholic Church against the use of modern contraception. With fertility approaching replacement level, especially in Indonesia and Cambodia, the differentials in fertility across various sub-groups tend to be rather insignificant. Nevertheless, the number of children was inversely related with educational level and non-agricultural work among women in Cambodia and the Philippines. The poor in all three countries tended to have more children than those who were better off. Of the proximate determinants of fertility, contraceptive use and delayed marriage have by far the strongest fertility-inhibiting effects. Greater efforts are needed to step up information, education and communication activities and to ensure equal access to contraceptive information and services to allow couples to plan childbearing accordingly.
Keywords: Children ever born (CEB), fertility, socio-economic factors, wealth, women’s educationJEL classification: J10, J13
1. IntroductionThe Association of Southeast Asian Nations (ASEAN) countries are at different stages of demographic transition. Since the 1960s when most developing countries started to launch family planning programs, fertility levels have been declining steadily. For Southeast Asia as a whole, the total fertility rate (TFR) had declined from 5.5 children per woman in the period 1970-75 to about 2.4 children per woman by 2010-15 (UN, 2015). However, the pace of fertility reduction is not uniform across countries. Of the ten ASEAN countries, six have attained below replacement level fertility. The fertility
a Department of Applied Statistics, Faculty of Economics and Administration, University of Malaya, 50603 Kuala Lumpur, Malaysia. Email: [email protected]
b Department of Applied Statistics, Faculty of Economics and Administration, University of Malaya, 50603 Kuala Lumpur, Malaysia. Email: [email protected] (Corresponding author)
c Department of Applied Statistics, Faculty of Economics and Administration, University of Malaya, 50603 Kuala Lumpur, Malaysia. Email: [email protected]

120 Malaysian Journal of Economic Studies Vol. 54 No. 1, 2017
Siow-Li Lai, Nai-Peng Tey and Sor-Tho Ng
in Cambodia, Indonesia, the Philippines and Laos is still above replacement level. This study aims to shed some light on factors affecting the divergence in fertility transition in Cambodia, Indonesia and the Philippines, which have very different religious and socio-cultural settings, and where the Demographic and Health Surveys (DHS) were conducted.
The three countries under study have undergone significant economic progress and human development as reflected by the rise in human development index (HDI), a composite that combines economic growth, improvement in health status and educational level. All three were classified under the medium HDI countries. Between 1990 and 2014, the HDI rose from 0.364 to 0.555 in Cambodia, 0.586 to 0.668 in the Philippines and 0.531 to 0.684 in Indonesia (UN Development Programme, 2015). Socio-economic development, in particular the rise in educational level and improvement in women’s status with increased female labour force participation in the modern sector have brought about the desire for smaller family size.
Besides socio-economic development, the availability of contraception has a strong impact on fertility decline. The Indonesian family planning program has been recognised as one of the world’s notable demographic success stories of the 20th century. Since its inception in 1968, contraceptive prevalence rate (CPR) of modern methods in Indonesia rose from under 5 percent to 58 percent in 2012, and the total fertility rate (TFR) had declined from 4.8 in 1973 to 2.6 in 2011 (Badan Pusat Statistik, BKKBN, Kementerian Kesehatan (Kemenkes-MOH), & ICF International, 2013; UN, 2013). The Philippines launched its family planning program in 1971, but strong opposition from the Catholic Church prevented the implementation of a stronger and sustained program that involved the use of modern contraceptives (Herrin, 2007). Compared to Indonesia, the increase in CPR for modern methods in the Philippines has been much more modest, from 16.2 percent in 1978 to 37.6 percent in 2013 (UN, 2012; Philippine Statistics Authority (PSA) [Philippines] & ICF International, 2014). Nevertheless, family planning availability still contributed to the decline in TFR in the Philippines from 6 children per woman in 1968 to 3 in 2012 (UN, 2013). In Cambodia, the family planning program was launched in 1994 after many years of civil unrest during the Khmer Rouge period. Following the launching of the program, the CPR for modern methods in Cambodia rose from 11.5 percent in 1990 to 38.8 percent in 2014, resulting in a sharp drop of TFR from 5.4 in 1990 to 2.7 in 2014 (UN, 2013; National Institute of Statistics, Directorate General for Health, & ICF International, 2015). It has to be mentioned that while a sizable proportion of currently married women in the Philippines and Cambodia (about 17 percent in each country) were using a traditional method, the corresponding figure in Indonesia was only 4.5 percent.
A study by Ross and Smith (2010) showed that the Philippines has the lowest family planning efforts score1 of 29.8, as compared to 59.9 for Indonesia and 55.8 for Cambodia. Clearly, family planning efforts have a strong effect on contraceptive
1 Family planning efforts score is measured through four components, including policy and stage-setting activities, service and service-related activities, recordkeeping and evaluation, and availability and accessibility of fertility control methods (Ross & Smith, 2010).

Malaysian Journal of Economic Studies Vol. 54 No. 1, 2017 121
Socio-economic Status and Fertility: A Study of Selected ASEAN Countries
prevalence which in turn has a direct impact on fertility. The fertility-inhibiting effect of contraceptive use will be examined later in this paper.
Within each country, fertility level varies widely across socio-economic groups. Rising female education has been one of the major causes of fertility reduction in many countries (Martin, 1995; Mturi & Hinde, 2001; Gubhaju, 2007; Jones, 2007; Skirbekk, 2008). With educational improvement, more women are engaged in the modern labour market, where work and maternal roles are incompatible, and this has a direct impact on childbearing (Blake, 1979; Hull, 2003; Engelhardt, Kogel, & Prskawetz, 2004; Jones, 2007). Women empowerment has been shown to exert considerable impact on reproductive behaviour (Jejeebhoy, 1995, 1996; Gudbrandsen, 2013). The inverse relationship between fertility and urbanisation is also well established (Watkins, 1987; Bhat & Zavier, 2005; Gubhaju, 2007; Jones, 2007; Veron, Horko, Kneipp, & Rogers, 2008). The concept of “quality-quantity tradeoff” introduced by Becker (1960) underlined higher household income may lower the demand for children as couples place more importance in producing children with higher quality rather than number of children. Many of these socio-economic factors are inter-correlated and have confounding effects on fertility. This study will examine both the gross and net effects of socio-economic variables on fertility in the bivariate and multivariate contexts, with the aim of identifying factors that contribute to fertility differentials within and across these three countries. Given that socio-economic factors can only affect fertility through intermediate variables, the fertility-inhibiting effects of contraceptive use, delayed marriage, breastfeeding and abortion will also be examined. The paper concludes with some discussions on the social implications of fertility differentials.
2. Data and Methods
2.1 Data Sources
The data for this study come from the 2014 Cambodia Demographic and Health Survey (CDHS), 2012 Indonesia DHS (IDHS) and 2013 Philippines DHS (NDHS). Since 1984, more than 260 DHS were conducted in over 90 countries (Measure DHS, 2011). All these surveys were based on nationally representative samples that gather information on fertility, family planning and topics relating to demographic and health conditions in each country. This study is based on all currently married women aged 15 to 49 years, covering 11,668 Cambodian, 32,706 Indonesian and 9,866 Filipino women, including those who were cohabitating. Details of the sample selection for each of these surveys can be read from the country reports (Badan Pusat Statistik et al., 2013; Philippine Statistics Authority (PSA) [Philippines] & ICF International, 2014; National Institute of Statistics et al., 2015).
2.2 Study Variables
The main dependent variable used is the number of children ever born (CEB), a cohort measure that indicates the total number of children born to women at the time of the survey. The number of CEB is a cumulative measure that increases with both women’s

122 Malaysian Journal of Economic Studies Vol. 54 No. 1, 2017
Siow-Li Lai, Nai-Peng Tey and Sor-Tho Ng
current age and duration of marriage. In order to adjust for the differences in these two factors in comparing the fertility levels across the social background characteristics for each country, respondent’s current age and duration of first marriage are entered as covariates in the multivariate models as control variables. The socio-economic factors selected for this study include place of residence, the educational level and work status of women and that of their partner, wealth index, and two women empowerment indicators – household decision-making autonomy and level of disagreement towards wife beating. The wealth index is created by allocating a weight to each household asset through Principal Component Analysis (PCA). Assets are evaluated based on household ownership of durable goods, dwelling characteristics, and other characteristics associated with the household’s socio-economic status. A detailed description on the construction of women empowerment indicators is shown in Appendix A1 section.
Although religious practice may have a strong effect on contraceptive use which affect childbearing directly, religion was not included in the list of independent variables due to the highly skewed sample distribution. The overwhelming majority of respondents in Cambodia are Buddhists, while most respondents in Indonesia are Muslim and Roman Catholics make up most of the respondents in the Philippines. The distributions of sample size (n) by each selected variable are shown in Table 1.
2.3 Data Analysis Techniques
Childbearing is affected by a host of inter-correlated socio-economic variables (Bon-gaarts, 2003; Hirschman, 2003; Gubhaju, 2007; Jones, 2007). The effects of selected independent/predictor variables on number of CEB will be analysed individually and jointly, using Negative Binomial Regression analysis. This technique is preferred when the dependent variable is treated as a count variable, as in the case of number of CEB. Negative Binomial Regression is a better alternative to Poisson Regression when the assumption of equidispersion (response variance is equivalent to the mean) is not met (Allison, 1999; Agresti, 2002), as in the case of data used in this study (refer Appendix A2 section). The model equation for Negative Binomial distributed number of CEB with log of the mean is expressed as below:
(1)
where µ is the mean number of CEB, xji is the jth predictor of the ith woman, β0 is the intercept term, βj represent measures of effects or coefficients of the predictors, and α is the dispersion coefficient. Exponentiations of both sides give the mean number of CEB as below:
(2)
Negative Binomial Regression analysis provides several useful outputs for analysis. The likelihood ratio chi-square test is used to examine the significance of each factor in explaining the dependent variable. The incidence rate ratio (IRR) measures the difference in the exponentiated expected log-count of one level compared with another
lnE(y xi jj=1
K
ji) ln( )= = + +∑µ β β αι 0 ι
µ = β β α0exp( xj ji ij=1
K+ +∑ )

Malaysian Journal of Economic Studies Vol. 54 No. 1, 2017 123
Socio-economic Status and Fertility: A Study of Selected ASEAN Countries
Table 1. Distributions of selected variables by survey
2014 CDHS 2012 IDHS 2013 NDHS
% n % n % n
All married women 100.0 11,668 100.0 32,706 100.0 9,866
Place of residence (PLACE) Urban 28.5 3,330 46.7 15,268 42.7 4,216 Rural 71.5 8,338 53.3 17,438 57.3 5,650
Women’s educational level (WOMENEDU) No schooling/Primary 65.9 7,690 40.3 13,173 24.2 2,391 Secondary 30.8 3,588 48.3 15,802 46.2 4,554 Tertiary 3.3 390 11.4 3,731 29.6 2,921
Partner’s educational level (PARTEDU) No schooling/Primary 52.5 6,108 37.6 12,255 30.9 3,042 Secondary 40.4 4,693 50.9 16,585 40.5 3,990 Tertiary 7.1 830 11.5 3,765 28.6 2,820
Women’s work status (WOMENWORK) Not working 18.2 2,116 36.4 11,891 39.1 3,855 Agricultural sector 38.3 4,453 15.7 5,119 11.9 1,171 Non-agricultural sector 43.5 5,064 47.9 15,653 49.0 4,831
Partner’s work status (PARTWORK) Not working 0.6 72 2.2 710 1.2 119 Agricultural sector 47.0 5,439 26.7 8,736 31.7 3,118 Non-agricultural sector 52.4 6,052 71.1 23,201 67.1 6,602
Wealth index (WEALTH) Poorest 18.8 2,190 25.0 8,191 23.7 2,335 Poorer 18.7 2,180 20.6 6,722 20.8 2,054 Middle 16.6 1,942 18.8 6,148 19.9 1,960 Richer 19.4 2,267 18.3 5,994 18.7 1,846 Richest 26.5 3,089 17.3 5,651 16.9 1,671
Household decision-making autonomy (DECISION) No autonomy 1.4 159 6.1 1,993 2.3 228 Some autonomy 12.2 1,424 22.3 7,278 4.7 459 Full autonomy 86.4 10,079 71.6 23,320 93.0 9,157
Level of disagreement towards wife beating (BEATING) Low disagreement 12.7 1,411 4.0 1,252 1.1 103 Moderate disagreement 27.5 3,047 19.2 5,962 5.3 519 High disagreement 59.8 6,636 76.8 23,844 93.6 9,161
Note: Missing values are excluded from the calculations.

124 Malaysian Journal of Economic Studies Vol. 54 No. 1, 2017
Siow-Li Lai, Nai-Peng Tey and Sor-Tho Ng
for each factor when other predictor variables are held constant. An IRR of greater than 1 for a particular study group shows a higher probability of having more children than the reference group, while a ratio of less than 1 indicates a lower likelihood as compared to the reference group. The computed means for response will be used to assess the individual and combined effects of selected predictors on the dependent variable. The statistical significance of the difference is then analysed using Wald Chi-square test.
In general, interaction terms are necessary in statistical model building. However, Hilbe (2011) argued that while the interaction term is very important in regression models, it is not particularly essential in count models. Bar charts are used to study the confounding effects of socio-economic variables on the mean number of CEB.
Bongaarts’ model is used to estimate the fertility-inhibiting effects of the four main proximate determinants of fertility. According to Bongaarts (1978, 1982), the TFR of a population is a function of the total fecundity rate (TF), index of marriage (Cm), index of contraception (Cc), index of post-partum infecundability (C i), and index of induced abortion (Ca), as shown below:
TFR = Cm x Cc x C i x Ca x TF (3)
Each index ranges between 0 and 1. The lower the value of an index, the greater the fertility-reducing impact due to that proximate determinant. The DHS for the three countries do not provide data on the total abortion rate. Hence, the index of induced abortion is estimated as the residue, given that the indices of marriage, contraception and post-partum infecundability were known, and total fecundity was assumed at 15.3 based on the extensive study by Bongaarts.
The fertility-reducing effects of the proximate determinants can be used to determine the relative contribution of each of the variable to the fertility reduction. The magnitude of the fertility-inhibiting effect contributed by each proximate deter-minant was prorated by the proportion of the logarithm of each index to the sum of logarithms of all indices (Odimegwu & Zerai, 1996). The proportional contribution of each proximate determinant (Cx) to the reduction of fertility from the TF to the TFR is calculated based on the following formula:
(4)
3. Results
3.1 Levels and Trends of Number of CEB
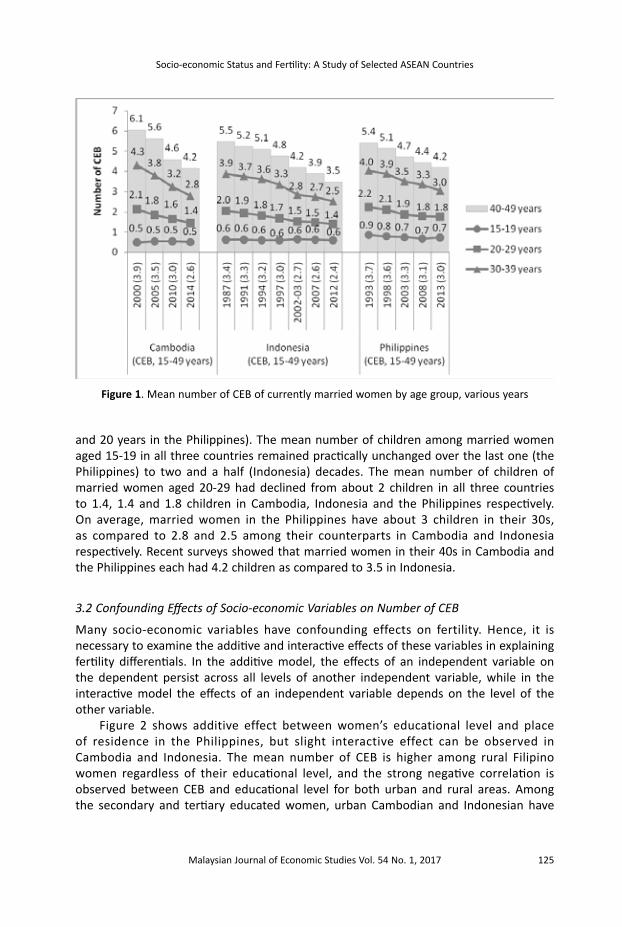
The mean number of CEB ranges from 2.4 in Indonesia, 2.6 in Cambodia and 3.0 in the Philippines (Figure 1). Since the beginning of the new millennium, the mean CEB in Cambodia had declined more rapidly than the other two countries, from 3.9 in 2000 to 2.6 in 2014. In contrast, the mean number of children in Indonesia and the Philippines has declined more gradually, a reduction of 29.4 percent (1 child) and 18.9 percent (0.7 children) respectively over a relatively long period of time (25 years in Indonesia
C CC C C Cx
x
m c i a
=+ + +100*ln( )
ln( ) ln( ) ln( ) ln( )
Malaysian Journal of Economic Studies Vol. 54 No. 1, 2017 125
Socio-economic Status and Fertility: A Study of Selected ASEAN Countries
and 20 years in the Philippines). The mean number of children among married women aged 15-19 in all three countries remained practically unchanged over the last one (the Philippines) to two and a half (Indonesia) decades. The mean number of children of married women aged 20-29 had declined from about 2 children in all three countries to 1.4, 1.4 and 1.8 children in Cambodia, Indonesia and the Philippines respectively. On average, married women in the Philippines have about 3 children in their 30s, as compared to 2.8 and 2.5 among their counterparts in Cambodia and Indonesia respectively. Recent surveys showed that married women in their 40s in Cambodia and the Philippines each had 4.2 children as compared to 3.5 in Indonesia.
3.2 Confounding Effects of Socio-economic Variables on Number of CEB
Many socio-economic variables have confounding effects on fertility. Hence, it is necessary to examine the additive and interactive effects of these variables in explaining fertility differentials. In the additive model, the effects of an independent variable on the dependent persist across all levels of another independent variable, while in the interactive model the effects of an independent variable depends on the level of the other variable.
Figure 2 shows additive effect between women’s educational level and place of residence in the Philippines, but slight interactive effect can be observed in Cambodia and Indonesia. The mean number of CEB is higher among rural Filipino women regardless of their educational level, and the strong negative correlation is observed between CEB and educational level for both urban and rural areas. Among the secondary and tertiary educated women, urban Cambodian and Indonesian have
Figure 1. Mean number of CEB of currently married women by age group, various years

126 Malaysian Journal of Economic Studies Vol. 54 No. 1, 2017
Siow-Li Lai, Nai-Peng Tey and Sor-Tho Ng
Figure 2. Mean number of CEB by place of residence and women’s educational level
Figure 3. Mean number of CEB by women’s educational level and women’s work status
slightly higher mean CEB than their rural counterparts, but the reverse is true among those with primary or no education. These results suggest that it is appropriate to use a multivariate analysis – Negative Binomial Regression – to determine the net effect of each independent variable on fertility.

Malaysian Journal of Economic Studies Vol. 54 No. 1, 2017 127
Socio-economic Status and Fertility: A Study of Selected ASEAN Countries
The recent DHS for all three countries show absence of interaction between women’s educational level with (i) women’s work status (Figure 3), and (ii) wealth index (Figure 4) on childbearing. The number of CEB decreases monotonically with education for all work and wealth categories.
3.3 Negative Binomial Regression on Number of CEB
The Negative Binomial Regression analyses show that all selected variables, except for household decision-making autonomy in Indonesia, have significant effects on the number of CEB (p-value<0.01) in the single predictor model (M1) for all three countries (Table 2). However, the effect of place of residence becomes insignificant after adding other predictors and covariates into the model (M2), and this is true for Cambodia and Indonesia. In Indonesia, women’s education is another insignificant variable along with place of residence and household decision-making autonomy in the multivariate context. Both women empowerment variables and partner’s work status were insignificant in affecting the number of CEB in Cambodia and the Philippines, holding other independent variables and covariates constant.
Generally, number of CEB is influenced by socio-economic variables in all the three countries in this study, but the effects are not uniform across countries (Table 3). The significant urban-rural CEB differentials in Cambodia and Indonesia at the bivariate level became insignificant after holding other variables and covariates constant. Rural Filipino would have 0.1 children fewer than urban women after controlling for other variables, age and duration of first marriage, although urban women were found to have fewer children than their rural counterparts at the bivariate level. This suggests that rural Filipino women tend to marry for a longer duration as compared to the urban women.
Figure 4. Mean number of CEB by women’s educational level and wealth index

128 Malaysian Journal of Economic Studies Vol. 54 No. 1, 2017
Siow-Li Lai, Nai-Peng Tey and Sor-Tho Ng
The negative association between women’s education and number of CEB remains significant even after adjusting for other variables and covariates in Cambodia and the Philippines. However, in Indonesia, women’s education does not provide significant differential in the number of CEB once other variables and covariates are held constant. Filipino women have the most number of children across all educational categories in both bivariate and multivariate contexts.
Controlling for other predictors, age and duration of first marriage, the negative effect of partner’s education on number of CEB remained discernible in Cambodia and the Philippines. Indonesian women whose partners have tertiary education were more likely to have more children than those whose partners have primary or no education once other socio-economic variables and covariates are held constant. This suggests that the smaller mean number of CEB among Indonesian women with tertiary educated husbands at the bivariate level is due to the younger age structure and shorter marital duration.
At the bivariate level, the mean number of CEB was highest among women who were engaged in the agricultural sector for all three countries. However, working women in both agricultural and non-agricultural sectors had fewer children than non-working women when other predictors, age and duration of first marriage were controlled in Indonesia and the Philippines, and Cambodian women engaged in the non-agricultural sector have significantly fewer children than their non-working counterparts.
Partner’s work status was not significant in affecting the number of CEB in Cambodia and the Philippines, taking into account other independent variables and covariates in the model. However, Indonesian women whose husbands were currently working have more children than those whose husbands who were not working, after controlling for other variables and covariates.
The differences in mean number of CEB across wealth quintiles remained sig-nificant, even after controlling for all other factors and covariates. For instance, the
Table 2. Likelihood ratio chi-square tests on number of CEB
2014 CDHS 2012 IDHS 2013 NDHS
M1 M2 M1 M2 M1 M2
PLACE 133.21** 0.24 265.15** 0.56 161.45** 8.03**WOMENEDU 1,021.77** 27.28** 2,419.70** 2.10 1,275.14** 7.28*PARTEDU 707.19** 16.81** 1,237.59** 62.15** 1,062.38** 6.14*WOMENWORK 553.93** 8.13* 496.82** 86.53** 380.13** 28.22**PARTWORK 370.74** 4.11 661.29** 13.61** 544.52** 0.36WEALTH 389.84** 138.76** 661.09** 693.24** 972.98** 422.00**DECISION 15.16** 0.56 2.72 1.30 53.96** 2.03BEATING 226.44** 5.57 40.71** 21.92** 38.01** 1.07
Notes: (i) Model 1 (M1) indicates the model with single predictor variable. (ii) Model 2 (M2) indicates the model is adjusted for other predictor variables and covariates. (iii) **p<0.01, *p<0.05.

Malaysian Journal of Economic Studies Vol. 54 No. 1, 2017 129
Socio-economic Status and Fertility: A Study of Selected ASEAN CountriesTa
ble
3. IR
R an
d co
mpu
ted
mea
n nu
mbe
r of C
EB o
f cur
rent
ly m
arrie
d w
omen
by
sele
cted
var
iabl
es
20
14 C
DHS
2012
IDHS
20
13 N
DHS
M
1 M
2 M
1 M
2 M
1 M
2
IR
R m
ean
IRR
mea
n IR
R m
ean
IRR
mea
n IR
R m
ean
IRR
mea
n
PLAC
E
U
rban
(ref
.) 1.
00
2.3
1.00
2.
1 1.
00
2.2
1.00
2.
2 1.
00
2.6
1.00
2.
6
Rura
l 1.
19**
2.
7 0.
99
2.1
1.13
**
2.5
0.99
2.
2 1.
21**
3.
2 0.
96**
2.
5
WO
MEN
EDU
N
o sc
hool
ing/
Prim
ary
(ref
.) 1.
00
3.0
1.00
2.
2 1.
00
2.9
1.00
2.
2 1.
00
4.2
1.00
2.
6
Seco
ndar
y 0.
66**
1.
9 0.
92**
2.
1 0.
72**
2.
1 1.
01
2.2
0.67
**
2.8
0.98
2.
6
Terti
ary
0.46
**
1.4
0.87
**
2.0
0.61
**
1.8
1.01
2.
2 0.
51**
2.
1 0.
94**
2.
5
PART
EDU
N
o sc
hool
ing/
Prim
ary
(ref
.) 1.
00
3.0
1.00
2.
2 1.
00
2.8
1.00
2.
0 1.
00
4.0
1.00
2.
6
Seco
ndar
y 0.
75**
2.
2 0.
94**
2.
0 0.
77**
2.
2 1.
06**
2.
2 0.
69**
2.
7 0.
96*
2.5
Te
rtiar
y 0.
55**
1.
7 0.
94
2.0
0.73
**
2.0
1.12
**
2.3
0.56
**
2.2
0.97
2.
5
WO
MEN
WO
RK
N
ot w
orki
ng (r
ef.)
1.00
2.
4 1.
00
2.1
1.00
2.
3 1.
00
2.3
1.00
2.
8 1.
00
2.6
Ag
ricul
tura
l sec
tor
1.31
**
3.1
0.98
2.
1 1.
26**
2.
9 0.
94**
2.
1 1.
48**
4.
2 0.
96*
2.5
N
on-a
gric
ultu
ral s
ecto
r 0.
95**
2.
2 0.
95**
2.
0 1.
01
2.3
0.93
**
2.1
0.98
2.
8 0.
93**
2.
5
PART
WO
RK
Not
wor
king
(ref
.) 1.
00
3.3
1.00
1.
9 1.
00
2.7
1.00
2.
1 1.
00
2.4
1.00
2.
5
Agric
ultu
ral s
ecto
r 0.
90
2.9
1.15
2.
2 1.
04
2.8
1.09
**
2.2
1.54
**
3.7
1.04
2.
6
Non
-agr
icul
tura
l sec
tor
0.70
**
2.3
1.14
2.
2 0.
84**
2.
2 1.
06*
2.2
1.08
2.
6 1.
04
2.6
WEA
LTH
Poor
est (
ref.)
1.
00
3.1
1.00
2.
4 1.
00
2.8
1.00
2.
7 1.
00
4.0
1.00
3.
3
Poor
er
0.90
**
2.8
0.90
**
2.2
0.86
**
2.4
0.83
**
2.2
0.81
**
3.2
0.88
**
2.9
M
iddl
e 0.
83**
2.
6 0.
84**
2.
0 0.
82**
2.
3 0.
79**
2.
1 0.
70**
2.
8 0.
76**
2.
5
Rich
er
0.79
**
2.5
0.81
**
2.0
0.78
**
2.2
0.75
**
2.0
0.59
**
2.3
0.67
**
2.2
Ri
ches
t 0.
69**
2.
2 0.
77**
1.
9 0.
78**
2.
2 0.
73**
2.
0 0.
54**
2.
1 0.
62**
2.
0

130 Malaysian Journal of Economic Studies Vol. 54 No. 1, 2017
Siow-Li Lai, Nai-Peng Tey and Sor-Tho NgTa
ble
3. C
ontin
ued
20
14 C
DHS
2012
IDHS
20
13 N
DHS
M
1 M
2 M
1 M
2 M
1 M
2
IR
R m
ean
IRR
mea
n IR
R m
ean
IRR
mea
n IR
R m
ean
IRR
mea
n
DECI
SIO
N
N
o au
tono
my
(ref
.) 1.
00
2.6
1.00
2.
1 1.
00
2.5
1.00
2.
2 1.
00
2.7
1.00
2.
5
Som
e au
tono
my
0.94
2.
4 1.
01
2.1
0.98
2.
4 0.
99
2.2
0.86
* 2.
3 0.
98
2.5
Fu
ll au
tono
my
1.02
2.
6 1.
02
2.1
0.97
2.
4 1.
00
2.2
1.12
* 3.
0 1.
02
2.6
BEAT
ING
Low
disa
gree
men
t (re
f.)
1.00
3.
2 1.
00
2.1
1.00
2.
7 1.
00
2.2
1.00
3.
7 1.
00
2.6
M
oder
ate
disa
gree
men
t 0.
85**
2.
7 1.
00
2.1
0.90
**
2.4
0.98
2.
2 0.
93
3.4
0.97
2.
5
High
disa
gree
men
t 0.
75**
2.
4 0.
97
2.0
0.88
**
2.4
0.94
**
2.1
0.79
**
2.9
0.96
2.
5
Not
es: (
i) M
odel
1 (M
1) in
dica
tes
the
mod
el w
ith s
ingl
e pr
edic
tor v
aria
ble.
(ii
) M
odel
2 (M
2) in
dica
tes
the
mod
el is
adj
uste
d fo
r oth
er p
redi
ctor
var
iabl
es a
nd c
ovar
iate
s.
(iii)
**p<
0.01
, *p<
0.05
bas
ed o
n W
ald
Chi-s
quar
e te
st.

Malaysian Journal of Economic Studies Vol. 54 No. 1, 2017 131
Socio-economic Status and Fertility: A Study of Selected ASEAN Countries
differentials in number of CEB between the poorest-richest would have reduced from 0.9 to 0.5 in Cambodia, 1.9 to 1.3 in the Philippines, but increased from 0.6 to 0.7 in Indonesia at the bivariate level and the multivariate level respectively.
Household decision-making autonomy was found to be associated with larger family size in the Philippines, but the relationship became insignificant after controlling for other variables and covariates. There was no significant differential in the number of CEB across the household decision-making autonomy groups at both bivariate and multivariate levels in Cambodia and Indonesia. On the other hand, level of disagreement with wife beating was negatively correlated with the number of CEB in all three countries at the bivariate level, but the relationship became insignificant at the multivariate level for the case in Cambodia and the Philippines.
3.4 The Fertility-Inhibiting Effects of Proximate Determinants
Contraceptive use cannot be utilised to explain the differentials in the number of CEB at the individual level due to the inverse causation, as high parity women are much more likely than low parity women to use a method. Hence, taken at face value, one may come to the wrong conclusion that contraceptive use results in large family size! However, Bongaarts’ model has been widely used to estimate the fertility-inhibiting effects of the proximate determinants of fertility, including contraceptive use.
Table 4 summarises the estimated indices and the percentage of fertility reduction by the four main proximate determinants based on all the surveys available in each country. The TFR had fallen by about 32.5 percent, 21.2 percent and 26.7 percent respectively in Cambodia, Indonesia and the Philippines between the first and recent surveys. Marriage postponement and non-marriage had the highest fertility-reducing effect in Cambodia and the Philippines in the 1990s and 2000s, but the recent surveys revealed that contraception had emerged as the leading fertility-reducing factor in these two countries. The fertility-reducing effect of contraception remained the highest in Indonesia since late 1980s and accounted for about 40 percent of the fertility reduction in the country. It is interesting to note that the proportion of fertility reduction contributed by post-partum infecundability had declined between the first and recent surveys in Cambodia and Indonesia, but the reverse was true in the Philippines. Another interesting observation is that the proportion of fertility reduction contributed by induced abortion had decreased between the first and recent surveys in the Philippines, but the opposite was true in Cambodia and Indonesia. Between 1987 and 2012, the fertility-reducing effect of induced abortion had doubled in Indonesia, which shows the rising importance and the likelihood of this variable in explaining fertility reduction. However, lack of reliable data on induced abortion precludes a more detailed analysis.
4. Discussion and ConclusionFertility level is falling in Cambodia, Indonesia and the Philippines. The three countries under study has undergone significant decline in the fertility rate of more than 40 percent from their pre-transition level of more than 5 children per woman in the

132 Malaysian Journal of Economic Studies Vol. 54 No. 1, 2017
Siow-Li Lai, Nai-Peng Tey and Sor-Tho Ng
1960s in all three countries to 2.8, 2.3 and 3.0 children in Cambodia, Indonesia and the Philippines respectively as of 2014 (ESCAP, 2014). The near replacement fertility level achieved in Indonesia and rapid fertility transition in Cambodia were mainly attributed to the successful implementation of national family planning programs in these two countries, with a contraceptive prevalence rate of 61.9 percent in Indonesia (2012) and 56.3 percent in Cambodia (2014). Although 55.1 percent of Filipino couples in the reproductive age groups were using a contraceptive method in 2013, the pace of fertility reduction has been relatively slow, partly due to the weaker family planning efforts in the country as a result of opposition from the Catholic Church and persistently high level of use of inefficient contraceptive method.
Negative Binomial Regression analyses based on the recent DHS survey in each country show that not all socio-economic factors have significant effects on the number of CEB among women aged 15-49 in Cambodia, Indonesia and the Philippines, and
Table 4. Indices and percent of fertility reduction by proximate determinants for each country, various years
Marriage Contraception Post-partum Induced TFR infecundability abortion
Cm % Cc % Ci % Ca %
Cambodia 2000 4.0 0.57 41.4 0.80 17.0 0.68 29.2 0.85 12.4 2005 3.4 0.58 36.2 0.66 27.6 0.72 21.4 0.80 14.7 2010 3.0 0.56 35.4 0.57 34.7 0.69 22.6 0.89 7.3 2014 2.7 0.60 29.2 0.51 38.4 0.73 18.0 0.78 14.4
% change (2000-2014) -32.5 -29.5 125.8 -38.4 16.8
Indonesia 1987 3.3 0.64 29.2 0.53 41.7 0.70 23.0 0.91 6.2 1991 3.0 0.64 27.2 0.55 37.3 0.70 21.6 0.80 13.8 1994 2.9 0.64 26.8 0.51 40.1 0.69 22.3 0.83 10.7 1997 2.8 0.65 25.6 0.50 40.7 0.69 22.1 0.82 11.7 2002-03 2.6 0.62 26.7 0.49 40.8 0.72 18.4 0.78 14.2 2007 2.6 0.62 26.6 0.48 41.0 0.75 16.3 0.75 16.1 2012 2.6 0.63 25.9 0.48 41.3 0.70 20.1 0.80 12.7
% change (1987-2012) -21.2 -11.3 -0.8 -12.3 104.6
Philippines 1993 4.1 0.54 47.0 0.63 34.9 0.91 7.0 0.86 11.1 1998 3.7 0.52 46.3 0.58 38.2 0.91 6.7 0.88 8.9 2003 3.5 0.56 39.3 0.56 39.8 0.88 9.0 0.84 11.9 2008 3.3 0.54 40.0 0.54 39.8 0.87 8.8 0.84 11.4 2013 3.0 0.51 40.9 0.50 42.0 0.81 13.0 0.93 4.2
% change (1993-2013) -26.7 -13.0 20.4 84.9 -62.2

Malaysian Journal of Economic Studies Vol. 54 No. 1, 2017 133
Socio-economic Status and Fertility: A Study of Selected ASEAN Countries
the impacts differ across different sub-groups of population within each country. Multivariate analyses revealed that much of the effects of the socio-economic variables were rather small after controlling for age and duration of marriage. However, the differentials in mean number of CEB remain very substantial across the wealth quintiles even after taking into account the demographic variables.
Studies in Asian countries have found negative relationship between urbanisation and childbearing (Gubhaju, 2007; Veron et al., 2008; Islam, 2009). However, the negative relationship between urbanisation and number of CEB is only significant at the bivariate level in all three countries under study. Contrary to expectation, rural women in the Philippines would actually have fewer children than the urban women after controlling for socio-economic characteristics, women empowerment and covariates. Hence, an important lesson is that empowering women with education and greater job opportunities can reduce the urban-rural differentials in fertility and reduce the overall fertility rate.
Women’s education has been found to be a strong predictor of childbearing in many countries (Shapiro, 1996; Mturi & Hinde, 2001; Bratti, 2003; Gubhaju, 2006; Jones, 2007), and this is particularly true for the case in Cambodia and the Philippines. The rising educational level among women enhances their status as they participate in the modern sector labour market; and they are exposed to contraceptive knowledge and modernisation. Moreover, they would also have been exposed to family life education in elementary and secondary schools to better prepare themselves for planned parenthood.
At the multivariate level, partner’s education is inversely correlated with the number of CEB among the Filipino and Cambodian women. In Indonesia, women whose partners have at least secondary education tended to have larger family size than those whose partners have lesser education after the demographic controls, due to younger age and shorter duration of marriage among women whose partners have higher education.
In the multivariate context, working women in Indonesia and the Philippines have significantly smaller family size than those who were not working; and Cambodian women engaged in the non-agricultural sector have significantly fewer children than their non-working counterparts. This finding is in line with Leibenstein’s (1957) theory, in which working women, especially those engaged in the non-agricultural sector have fewer children than non-working women, due to the higher opportunity costs and wages foregone in childbearing and childrearing. Since more and more women are participating in the labour force, especially in the modern sector, future emphasis should be placed on providing childcare support to allow women to combine work with their maternal roles.
The findings from this study corroborate with previous research that provide ample evidence of the negative relationship between household income and demand for children (Bloom, Canning, & Malaney, 2000; Aarssen, 2005; El-Ghannam, 2005; Jones & Tertilt, 2006; Bollen, Glanville, & Stecklov, 2007), and higher level of household wealth was related to lower fertility (Weerasinghe & Parr, 2002; Akpa & Ikpotokin, 2012; Namubiru, 2014). This can be explained by the reformulated economic theory of fertility by Becker and Barro (1988), in which rising income was related to higher opportunity

134 Malaysian Journal of Economic Studies Vol. 54 No. 1, 2017
Siow-Li Lai, Nai-Peng Tey and Sor-Tho Ng
cost of childbearing, resulting in the desire for fewer children. Higher income families had a demand for children with higher quality rather than quantity, also known as the “quality-quantity tradeoff” (Becker, 1960, 1981). Women from the poorest families tended to have larger family size than those who are better off in all three countries, especially in the Philippines, and this trend is expected to perpetuate the vicious cycle of poverty. Greater efforts are thus required to provide reproductive health information, education and communication activities to the disadvantaged groups and to ensure equal access to contraceptive information and services to enable them to plan for the number and timing of childbearing.
Many studies have found the negative relationship between women empowerment indicators and childbearing (Jejeebhoy, 1995; Sathar, Callum, & Jejeebhoy, 2001; Al-Riyami & Afifi, 2003; Hakim, Salway, & Mumtaz, 2003; Gudbrandsen, 2013). In this study, both women empowerment indicators, however, show different effects on the number of CEB. The results suggest that attitude towards wife beating is an important factor affecting the number of children in Indonesia, but not in the case of Cambodia and the Philippines. Both women empowerment indicators have no effect on the number of CEB among the Cambodian and Filipino women after controlling for other socio-economic variables and covariates.
Socio-economic factors can only affect fertility through the proximate deter-minants. Our analysis shows that in all the three countries, contraceptive use has the strongest fertility-inhibiting effect. Hence, the inverse relationship between CPR and fertility has been well established (Angeles, Guilkey, & Mroz, 2005; Gubhaju, 2006; Moreland, 2006).
The Indonesian family planning program was acclaimed as a success story (Rahayu, Utomo, & McDonald, 2009; Hayes, 2010), and provides an important lesson of the need to sustain a high level of contraceptive use to reduce the fertility level. Nevertheless, the policy of decentralisation implemented since 2004 has brought about the levelling off/stagnation in contraceptive use over the past ten years and has prompted the government to step up efforts to revitalise family planning.
Although the fertility rate in Cambodia has declined substantially since the launching of the family planning program in the mid-1990s and is expected to achieve replacement fertility level in the next one to two decades, there is a need to substantially improve access to better quality of health care services and education for the vast number of rural and poor Cambodians. Public and private partnerships in providing family planning services is strongly encouraged to ensure the public can access these services.
The constantly high level of use of traditional (less effective) contraceptive methods, low family planning efforts and opposition over the use of contraceptive methods and sterilisation from the Catholic Church are some of the reasons for the slower fertility decline in the Philippines compared to the other two countries, and thus, Filipinos will probably take a longer duration to reach replacement fertility level as compared to their Indonesian and Cambodian counterparts. Besides, socio-economic and regional inequalities in the Philippines also explain the implausibility of replacement levels in the near future. Couples who opt to use traditional methods should be taught the proper way to improve effective use and avoid unwanted

Malaysian Journal of Economic Studies Vol. 54 No. 1, 2017 135
Socio-economic Status and Fertility: A Study of Selected ASEAN Countries
pregnancy, and this is particularly important in the Philippines because of the high prevalence of traditional contraceptive methods (remaining above 15 percent since the first DHS conducted in 1993).
ReferencesAarssen, L.W. (2005). Why is fertility lower in wealthier countries? The role of relaxed fertility-
selection. Population and Development Review, 31(1), 113-126. Acharya, D.R., Bell, J.S., Simkhada, P., Teijlingen, E.R., & Regmi, P.R. (2010). Women’s autonomy in
household decision-making: A demographic study in Nepal. Reproductive Health, 7, 15-26. Agresti, A. (2002). Categorical data analysis. New York: Wiley.Akpa, O.M., & Ikpotokin, O. (2012). Modeling the determinants of fertility among women
of childbearing age in Nigeria: Analysis using generalized linear modeling approach. International Journal of Humanities and Social Science, 2(18), 167-176.
Al-Riyami, A.A., & Afifi, M. (2003). Determinants of women’s fertility in Oman. Saudi Medical Journal, 24(7), 748-753.
Allison, P. (1999). Logistic regression using the SAS system: Theory and applications. Cary, NC: SAS Institute.
Altman, D.G. (1991). Practical Statistics for Medical Research. London, UK: Chapman & Hall.Angeles, G., Guilkey, D.K., & Mroz, T.A. (2005). The effects of education and family planning
programs on fertility in Indonesia. Economic Development and Cultural Change, 54(1), 165-201.
Badan Pusat Statistik, BKKBN, Kementerian Kesehatan (Kemenkes-MOH), & ICF International. (2013). Indonesia demographic and health survey 2012. Jakarta, Indonesia, and Calverton, Maryland, USA: Authors.
Becker, G.S. (1960). An economic analysis of fertility. In National Bureau of Economic Research (Ed.), Demographic and economic change in developed countries (pp. 209-231). Princeton, New Jersey, USA: Princeton University Press.
Becker, G.S. (1981). A treatise on the family. Cambridge, Massachusetts, USA: Harvard University Press.
Becker, G.S., & Barro, R.J. (1988). A reformulation of the economic theory of fertility. The Quarterly Journal of Economics, 103(1), 1-25.
Bhat, P.N.M., & Zavier, A.J.F. (2005). Role of religion in fertility decline: The case of Indian Muslims. Economic and Political Weekly, 40(5), 385-402.
Blake, J. (1979). Is zero preferred? American attitudes toward childlessness in the 1970s. Journal of Marriage and Family, 41(2), 245-257.
Bloom, D.E., Canning, D., & Malaney, P.N. (2000). Population dynamics and economic growth in Asia. Population and Development Review, 26 (Supplement: Population and Economic Change in East Asia), 257-290.
Bollen, K.A., Glanville, J.L., & Stecklov, G. (2007). Socio-economic status, permanent income, and fertility: A latent-variable approach. Population Studies, 61(1), 15-34.
Bongaarts, J. (1978). A framework for analyzing the proximate determinants of fertility. Population and Development Review, 4(1), 105-132.
Bongaarts, J. (1982). The fertility-inhibiting effects of the intermediate fertility variables. Studies in Family Planning, 13(6/7), 179-189.
Bongaarts, J. (2003). Completing the fertility transition in the developing world: The role of educational differences and fertility preferences. Population Studies, 57(3), 321-335.
Bratti, M. (2003). Labour force participation and marital fertility of Italian women: The role of education. Journal of Population Economics, 16(3), 525-554.

136 Malaysian Journal of Economic Studies Vol. 54 No. 1, 2017
Siow-Li Lai, Nai-Peng Tey and Sor-Tho Ng
El-Ghannam, A.R. (2005). An examination of factors affecting fertility rate differentials as compared among women in less and more developed countries. Journal of Human Ecology, 18(3), 181-192.
Engelhardt, H., Kogel, T., & Prskawetz, A. (2004). Fertility and women’s employment reconsidered: A macro-level time-series analysis for developed countries, 1960-2000. Population Studies, 58(1), 109-120.
ESCAP. (2014). Population and development indicators for Asia and the Pacific, 2014 (2014 ESCAP population data sheet). Bangkok, Thailand: Author.
Gubhaju, B. (2006). Fertility transition in Asia: An overview of levels and trends. Paper presented at the Seminar on Fertility Transition in Asia: Opportunities and Challenges, Bangkok, Thailand.
Gubhaju, B. (2007). Fertility decline in Asia: Opportunities and challenges. The Japanese Journal of Population, 5(1), 19-42.
Gudbrandsen, N.H. (2013). Female autonomy and fertility in Nepal. South Asia Economic Journal, 14(1), 157-173. doi: 10.1177/1391561413477945
Hakim, A., Salway, S., & Mumtaz, Z. (2003). Women’s autonomy and uptake of contraception in Pakistan. Asia-Pacific Population Journal, 18(1), 63-82.
Hayes, A.C. (2010). The status of family planning in Indonesia today: A story of success and fragmentation. Paper presented at the UNFPA and ICOMP Regional Consultation on Family Planning in Asia and the Pacific: Addressing the Challenges, Bangkok. Retrieved from www.icomp.org.my/new/uploads/fpconsultation/Adrian%20Hayes_Indonesia.pdf
Herrin, A.N. (2007). Development of the Philippines’ family planning program: The early years, 1967-80. In W.C. Robinson & J.A. Ross (Eds.), The global family planning revolution: Three decades of population policies and programs (pp. 277-298). Washington DC, USA: World Bank.
Hilbe, J.M. (2011). Negative binomial regression (2nd ed.). Cambridge, UK: Cambridge University Press.
Hirschman, C. (2003). Fertility transition, socioeconomic determinants of. In P. Demeny & G. McNicoll (Eds.), Encyclopedia of Population (Vol. 1, pp. 425-431). New York: Macmillan Reference USA.
Hull, T.H. (2003). Demographic perspectives on the future of the Indonesian family. Journal of Population Research, 20(1), 51-66.
Islam, T.M. (2009). Influence of socio-demographic variables on fertility in Bangladesh: Application of path model analysis. Pakistan Journal of Social Sciences, 6(5), 313-320.
Jejeebhoy, S.J. (1995). Women’s education, autonomy, and reproductive behaviour: Experience from developing countries. Oxford, England: Clarendon Press.
Jejeebhoy, S.J. (1996). Women’s education, autonomy and reproductive behavior: Assessing what we have learned. Honolulu, Hawaii: East-West Center.
Jones, G.W. (2007). Delayed marriage and very low fertility in Pacific Asia. Population and Development Review, 33(3), 453-478.
Jones, L.E., & Tertilt, M. (2006). An economic history of fertility in the U.S.: 1826-1960. In P. Rupert (Ed.), NBER Working Paper Series. Cambridge, Massachusetts, USA: National Bureau of Economic Research.
Leibenstein, H. (1957). Economic backwardness and economic growth. New York, USA: John Wiley and Sons.
Martin, T.C. (1995). Women’s education and fertility: Results from 26 Demographic and Health Surveys. Studies in Family Planning, 26(4), 187-202.
Measure DHS. (2011). Measure Demographic and Health Surveys. Calverton, USA: Author.Moreland, S. (2006). Egypt’s population program: Assesing 25 years of family planning.
Washington DC, USA: United States Agency for International Development. Retrieved from www.policyproject.com/pubs/countryreports/Egypt%2025%20yr%20retro%20Final.pdf

Malaysian Journal of Economic Studies Vol. 54 No. 1, 2017 137
Socio-economic Status and Fertility: A Study of Selected ASEAN Countries
Mturi, A.J., & Hinde, A. (2001). Fertility levels and differentials in Tanzania. Paper presented at the Workshop on Prospects for Fertility Decline in High Fertility Countries, New York, USA. Retrieved from www.un.org/esa/population/publications/prospectsdecline/mturi.pdf
Namubiru, L. (2014). Effect of household poverty on women’s fertility and child nutritional status in Uganda (Doctor of Philosophy thesis, University of Nairobi, Nairobi, Kenya). Retrieved from http://erepository.uonbi.ac.ke/handle/11295/77099
National Institute of Statistics, Directorate General for Health, & ICF International. (2015). Cambodia demographic and health survey 2014. Phnom Penh, Cambodia, and Rockville, Maryland, USA: Authors.
Nunally, J.C. (1978). Psychometric theory. New York, NY, USA: McGraw-Hill.Odimegwu, C.O., & Zerai, A. (1996). Understanding the proximate determinants of fertility of a
Nigerian ethnic group. Genus, 52(3/4), 67-87. Philippine Statistics Authority (PSA) [Philippines], & ICF International. (2014). Philippines national
demographic and health survey 2013. Manila, Philippines, and Rockville, Maryland, USA: Authors.
Rahayu, R., Utomo, I., & McDonald, P. (2009). Contraceptive use pattern among married women in Indonesia. Paper presented at the International Conference on Family Planning: Research and Best Practices, Kampala, Uganda. Retrieved from fpconference.org/2009/media/DIR_169701/15f1ae857ca97193ffff83a6ffffd524.pdf
Ross, J., & Smith, E. (2010). The family planning effort index: 1999, 2004, and 2009. Washington DC, USA: Futures Group, Health Policy Initiative, Task Order I.
Sathar, Z., Callum, C., & Jejeebhoy, S. (2001). Gender, region, religion and reproductive behaviour in India and Pakistan. Paper presented at the 24th IUSSP General Population Conference, Salvador, Brazil. Retrieved from archive.iussp.org/Brazil2001/s80/S87_03_sathar.pdf
Shapiro, D. (1996). Fertility decline in Kinshasa. Population Studies, 50(1), 89-103. Skirbekk, V. (2008). Fertility trends by social status. Demographic Research, 18(5), 145-180. Streiner, L.D., & Norman, G.R. (2008). Health measurement scales: A practical guide to their
development and use. New York, NY, USA: Oxford University Press.UN. (2012). World contraceptive use 2012 (Department of Economic and Social Affairs, Population
Division). New York, NY: Author.UN. (2013). World fertility data 2012 (Department of Economic and Social Affairs, Population
Division). New York, NY: Author.UN. (2015). World population prospects: The 2015 revision, key findings and advance tables
(Working Paper No. ESA/P/WP.241,Department of Economic and Social Affairs, Population Division). New York, NY: Author.
UN Development Programme. (2015). Human development report 2014: Work for human development. New York, NY: Author.
Veron, J., Horko, K., Kneipp, R., & Rogers, G. (2008). The demography of South Asia from the 1950s to the 2000s: A summary of changes and a statistical assessment. Population (English Ed., 2002-), 63(1), 9-89.
Watkins, S.C. (1987). The fertility transition: Europe and the Third World compared. Sociological Forum, 2(4), (Special Issue: Demography as an Interdiscipline), 645-673.
Weerasinghe, D.P., & Parr, N.J. (2002). Effect of wealth on marital fertility in Sri Lanka. Journal of Health, Population and Nutrition, 20(2), 112-119.

138 Malaysian Journal of Economic Studies Vol. 54 No. 1, 2017
Siow-Li Lai, Nai-Peng Tey and Sor-Tho Ng
Appendix
A1. Women Empowerment Variables
(a) Household decision-making autonomy (DECISION)
The roles of women in household decision-making varied across countries. Information pertaining to women’s roles in decision-making within the household in each of the country is shown in Table 5.
Table 5. Roles of women in decision-making
Aspects of decision-making 2014 CDHS 2012 IDHS 2013 NDHS
Own health care √ √ √Making large household purchases √ √ √Making household purchases for daily needs – – √Visits to family or relatives √ √ √
The decision makers for each of the above mentioned aspects are initially grouped into six categories as below:
(a) Respondent alone (d) Partner alone(b) Respondent and partner (e) Someone else(c) Respondent and other person (f) Other A dichotomous variable is created for each of these aspects to measure whether
a woman is involved in the decision-making, with a code of “1” if she is involved in decision-making and a code of “0” if she is not involved in the decision-making (Acharya, Bell, Simkhada, Teijlingen, & Regmi, 2010). This component consists of 3 items in 2014 CDHS, 3 items in 2012 IDHS and 4 items in 2013 NDHS. Hence, the value ranges from 0 to 3 in Cambodia and Indonesia and 0 to 4 in the Philippines. Since the number of variables on women’s autonomy varied across countries, mean index will be constructed, with a value ranging from 0 to 1 in each country. Women who scored 0 are classified as “No” autonomy, those who scored 1 are grouped as “Full” autonomy, and those with values that fall within this range are deemed to have “Some” autonomy. Higher value indicates women are actively involved in household decision-making, and this indicates higher empowerment.
(b) Level of disagreement towards wife beating (BEATING)
The surveys collected information on women’s perception on the grounds that justify wife beating. Women in societies that are strongly against wife beating are deemed to have higher status than those from societies that condone wife beating by partner/

Malaysian Journal of Economic Studies Vol. 54 No. 1, 2017 139
Socio-economic Status and Fertility: A Study of Selected ASEAN Countries
husband. Respondents were asked to answer “Yes” or “No” to each of the following five circumstances regarding wife beating justification:
(a) if she goes out without telling him (d) if she refuses to have sex with him(b) if she neglects the children (e) if she burns the food(c) if she argues with him
Respondents who answered “Yes” to each of the justification is coded as “0” as they accept the behaviour and those who responded “No” is coded as “1” as they do not think that it is acceptable for husband to beat the wife. The index ranges from 0 to 5. Women who scored between 0 and 1 are grouped under “Low” disagreement, between 2 to 3 are grouped under “Moderate” disagreement, and between 4 to 5 are grouped under “High” disagreement towards wife beating. Women with higher scores suggest that they are against domestic violence listed above, and therefore possess higher status in their societies.
Cronbach’s reliability test is used to validate the consistency of each of the two components of women empowerment. Cronbach’s alpha is an index of reliability that determines the average correlation or internal consistency of items in a survey instrument to measure its consistency. A Cronbach’s alpha value ranges from 0 to 1. The generated scale is defined as more reliable if the score is closer to 1. The items were considered to represent an adequate level of internal consistency if the Cronbach’s alpha value lies within 0.5 to 0.7 and good level if the value is 0.7 and above (Nunally, 1978; Altman, 1991; Streiner & Norman, 2008). Table 6 shows that all coefficients are at least at the acceptable level.
Table 6. Reliability analysis
2014 CDHS 2012 IDHS 2013 NDHS
Component Number of Cronbach’s Number of Cronbach’s Number of Cronbach’s items alpha items alpha items alpha
DECISION 3 0.561 3 0.707 4 0.546BEATING 5 0.802 5 0.746 5 0.687
A2. Lagrange Multiplier Test
Lagrange Multiplier test is used to determine whether the data should be modelled as Poisson or Negative Binomial. Based on the null hypothesis of equidispersion, Lagrange Multiplier test examines the significance of two alternative hypotheses, which are overdispersion (response variance is greater than the mean) and underdispersion (response variance is smaller than the mean).
Table 7 shows that the alternative hypothesis of overdispersion is significant when the number of CEB is regressed against each independent variable for each of the three

140 Malaysian Journal of Economic Studies Vol. 54 No. 1, 2017
Siow-Li Lai, Nai-Peng Tey and Sor-Tho Ng
countries. This suggests that Negative Binomial model is a more appropriate technique over Poisson model.
Table 7. Lagrange Multiplier test on overdispersion/underdispersion for Cambodia, Indonesia and the Philippines data
2014 CDHS 2012 IDHS 2013 NDHS
Sig. Sig. Sig. Sig. Sig. Sig. (under–) (over–) (under–) (over–) (under–) (over–)
PLACE 1.000 0.000 1.000 0.000 1.000 0.000WOMENEDU 1.000 0.000 1.000 0.000 1.000 0.000PARTEDU 1.000 0.000 1.000 0.000 1.000 0.000WOMENWORK 1.000 0.000 1.000 0.000 1.000 0.000PARTWORK 1.000 0.000 1.000 0.000 1.000 0.000WEALTH 1.000 0.000 1.000 0.000 1.000 0.000DECISION 1.000 0.000 1.000 0.000 1.000 0.000BEATING 1.000 0.000 1.000 0.000 1.000 0.000
Notes: Under– means underdispersion. Over– means overdispersion.