software process automation: interviews, survey, and ... · software process automation:...
TRANSCRIPT
Software Process Automation:Interviews, Survey, and Workshop ResultsAlan ChristieLinda LevineEdwin J. MorrisBill RiddleDavid ZubrowSoftware Engineering Institute
Teresa BeltonLarry ProctorNolan Norton and Company
Denis CordelleJean-Eloi FerotinJean-Philippe SolvayCap Gemini Segoti
October 1997
TECHNICAL REPORTCMU/SEI-97-TR-008
ESC-TR-97-008
Software Engineering InstituteCarnegie Mellon University
Pittsburgh, Pennsylvania 15213
Unlimited distribution subject to the copyright.
Technical ReportCMU/SEI-97-TR-008
ESC-TR-97-008October 1997
Software Process Automation:Interviews, Survey, and Workshop Results
Alan ChristieLinda Levine
Edwin J. MorrisBill Riddle
David ZubrowSoftware Engineering Institute
Teresa BeltonLarry Proctor
Nolan Norton and Company
Denis CordelleJean-Eloi Ferotin
Jean-Philippe SolvayCap Gemini Segoti
Transition Enabling

This report was prepared for the
SEI Joint Program OfficeHQ ESC/AXS5 Eglin StreetHanscom AFB, MA 01731-2116
The ideas and findings in this report should not be construed as an official DoD position. It is published in theinterest of scientific and technical information exchange.
FOR THE COMMANDER
(signature on file)
Jay Alonis, Lt Col, USAFSEI Joint Program Office
This work is sponsored by the U.S. Department of Defense.
Copyright © 1997 by Carnegie Mellon University.
Permission to reproduce this document and to prepare derivative works from this document for internal use isgranted, provided the copyright and “No Warranty” statements are included with all reproductions and derivativeworks.
Requests for permission to reproduce this document or to prepare derivative works of this document for externaland commercial use should be addressed to the SEI Licensing Agent.
NO WARRANTY
THIS CARNEGIE MELLON UNIVERSITY AND SOFTWARE ENGINEERING INSTITUTE MATERIALIS FURNISHED ON AN “AS-IS” BASIS. CARNEGIE MELLON UNIVERSITY MAKES NO WARRAN-TIES OF ANY KIND, EITHER EXPRESSED OR IMPLIED, AS TO ANY MATTER INCLUDING, BUT NOTLIMITED TO, WARRANTY OF FITNESS FOR PURPOSE OR MERCHANTABILITY, EXCLUSIVITY, ORRESULTS OBTAINED FROM USE OF THE MATERIAL. CARNEGIE MELLON UNIVERSITY DOESNOT MAKE ANY WARRANTY OF ANY KIND WITH RESPECT TO FREEDOM FROM PATENT,TRADEMARK, OR COPYRIGHT INFRINGEMENT.
This work was created in the performance of Federal Government Contract Number F19628-95-C-0003 withCarnegie Mellon University for the operation of the Software Engineering Institute, a federally funded researchand development center. The Government of the United States has a royalty-free government-purpose license touse, duplicate, or disclose the work, in whole or in part and in any manner, and to have or permit others to do so,for government purposes pursuant to the copyright license under the clause at 52.227-7013.
This document is available through SAIC/ASSET: 1350 Earl L. Core Road; PO Box 3305; Morgantown, WestVirginia 26505 / Phone: (304) 284-9000 / FAX: (304) 284-9001 / World Wide Web: http://www.as-set.com/sei.html / e-mail: [email protected]
Copies of this document are available through the National Technical Information Service (NTIS). For informa-tion on ordering, please contact NTIS directly: National Technical Information Service, U.S. Department ofCommerce, Springfield, VA 22161. Phone: (703) 487-4600.
This document is also available through the Defense Technical Information Center (DTIC). DTIC provides accessto and transfer of scientific and technical information for DoD personnel, DoD contractors and potential contrac-tors, and other U.S. Government agency personnel and their contractors. To obtain a copy, please contact DTICdirectly: Defense Technical Information Center / Attn: BRR / 8725 John J. Kingman Road / Suite 0944 / Ft. Bel-voir, VA 22060-6218. Phone: (703) 767-8274 or toll-free in the U.S. — 1-800 225-3842).
Use of any trademarks in this report is not intended in any way to infringe on the rights of the trademark holder.

Table of Contents
1 Purpose and Structure of the Study 1
2 The Interviews 32.1 The Interviewees 32.2 How the Interviews Were Conducted 32.3 Overview of the Projects 42.4 Interview Findings 62.5 Drivers and Inhibitors 72.6 Contributors to Success 112.7 Technology Issues 182.8 Conclusions on the Interviews 24
3 The Survey 273.1 Organizational Characteristics 273.2 Characteristics of Individuals 293.3 Application Focus 303.4 Process Characteristics 333.5 Development Technology 373.6 Transition and Adoption 403.7 Impacts and Insights 463.8 Conclusions from the Survey 49
4 The Process Automation Workshop 534.1 Context for the Workshop 534.2 Issue Scoping 544.3 Action Plans 54
Appendix A The Interview Script 57
Appendix B The Survey 61
Appendix C Procedure Used to Compute Measures of Effectiveness 77
Appendix D Position Papers for Workshop 79
Appendix E Output from the Workshop 97
Appendix F Workshop Participants 121
References 123
CMU/SEI-97-TR-008 i

ii CMU/SEI-97-TR-008
List of Figures
Figure 3-1 Correlation Between Success Rates and Cultural Characteristics 28Figure 3-2 Distribution of Roles 29Figure 3-3 Distribution of Experience (Years) 30Figure 3-4 Automation Applications 31Figure 3-5 Management Motivation 31Figure 3-6 Correlation Between Duration and Frequency of Execution 32Figure 3-7 Process Automation Success vs. Process Duration 33Figure 3-8 Practices Reflecting Process Maturity 34Figure 3-9 Process Automation Success vs. Management Effectiveness 35Figure 3-10 Documented Processes in Target Organizations 36Figure 3-11 Process Definition Notations Used in Target Organization 37Figure 3-12 Process Automation Tool Used 38Figure 3-13 Perceived Strengths/Weaknesses of Automation Tools - 1 39Figure 3-14 Perceived Strengths/Weaknesses of Automation Tools - 2 39Figure 3-15 Characteristics of Process Automation Tools 40Figure 3-16 Length (Months) for Transition to Automated Environment 41Figure 3-17 Time (Months) Automated System Has Operated
in Production Environment 41Figure 3-18 Process Automation Success vs. End-User Involvement 42Figure 3-19 Responses to Adoption Support Questions 43Figure 3-20 End-User Operational Experience - 1 44Figure 3-21 End-User Operational Experience - 2 44Figure 3-22 Management Sponsorship 45Figure 3-23 Process Automation Success vs. Management Sponsorship 46Figure 3-24 Planned vs. Actual Schedule 47Figure 3-25 Benefits of Process Automation - 1 48Figure 3-26 Benefits of Process Automation - 2 48Figure 3-27 Insights Gained 49Figure 4-1 Approach to Developing Action Plans - 1 55Figure 4-2 Approach to Developing Action Plans - 2 56Figure E-1 Issues—Performer Concerns 98Figure E-2 Desirable States—Performer Concerns - 1 98Figure E-3 Desirable States—Performer Concerns - 2 99Figure E-4 Target States—Performer Concerns 99Figure E-5 Action—Performer Concerns 100Figure E-6 Issues—Organizational Dynamics 100Figure E-7 Desirable States—Organizational Dynamics - 1 101Figure E-8 Desirable States—Organizational Dynamics - 2 101Figure E-9 Target States—Organizational Dynamics 102Figure E-10 Actions—Organizational Dynamics - 1 102Figure E-11 Actions—Organizational Dynamics - 2 103Figure E-12 Actions—Organizational Dynamics - 3 103Figure E-13 Actions—Organizational Dynamics - 4 104Figure E-14 Actions—Organizational Dynamics - 5 104
CMU/SEI-97-TR-008 iii

Figure E-15 Actions—Organizational Dynamics - 6 105Figure E-16 Issues—System Functionality - 1 105Figure E-17 Issues—System Functionality - 2 106Figure E-18 Desirable States—System Functionality - 1 106Figure E-19 Desirable States—System Functionality - 2 107Figure E-20 Desirable States—System Functionality - 3 107Figure E-21 Desirable States—System Functionality - 4 108Figure E-22 Desirable States—System Functionality - 5 108Figure E-23 Desirable States—System Functionality - 6 109Figure E-24 Desirable States—System Functionality - 7 109Figure E-25 Desirable States—System Functionality - 8 110Figure E-26 Target States—System Functionality - 1 110Figure E-27 Target States—System Functionality - 2 111Figure E-28 Actions—System Functionality - 1 111Figure E-29 Actions—System Functionality - 2 112Figure E-30 Actions—System Functionality - 3 112Figure E-31 Actions—System Functionality - 4 113Figure E-32 Issues—Process Articulation - 1 113Figure E-33 Issues—Process Articulation - 2 114Figure E-34 Desirable States—Process Articulation - 1 114Figure E-35 Desirable States—Process Articulation - 2 115Figure E-36 Desirable States—Process Articulation - 3 115Figure E-37 Desirable States—Process Articulation - 4 116Figure E-38 Target States—Process Articulation 116Figure E-39 Actions—Process Articulation - 1 117Figure E-40 Actions—Process Articulation - 2 117Figure E-41 Actions—Process Articulation - 3 118Figure E-42 Actions—Process Articulation - 4 118Figure E-43 Issues—System Realization - 1 119Figure E-44 Issues—System Realization - 2 119
iv CMU/SEI-97-TR-008
List of Tables
Table 2-1 Application Characteristics of Projects 4Table 2-2 Technology Characteristics of Projects 5Table 2-3 Risk Categories 17Table C-1 Measures of Effectiveness 77
CMU/SEI-97-TR-008 v

vi CMU/SEI-97-TR-008

Acknowledgments
This report could not have been possible without the support we received from the many individuals that we interviewed, those who responsed to our questionnaire, and those who participated in our Symposium workshop. We appreciate the time they spent on our behalf, and how direct and honest these individuals were with us. Because we guaranteed their anonymity, we cannot name the interviewees or the questionnaire respondents. However, you know who you are! Thank you. The workshop participants are listed in Appendix F. To these people, our thanks also.
The following trademarks and servicemarks are used in the report:
AutoPlan is a registered trademark of Digital Tools, Inc.
Capability Maturity Model is a registered service mark of Carnegie Mellon University
CMM is registered in the U.S. Patent and Trademark Office
InConcert is a trademark of the Xerox Corporation
Interleaf is a registered trademark of Interleaf, Inc.
FlowMark is a trademark of International Business Machines Coproration
Foundation is a pending trademark of Foundation Software , Inc.
FrameMaker is a registered trademark of Adobe, Inc.
Lotus Notes is a registered trademark of Lotus Development Corporation
Oracle is a registered trademark of Oracle Corporation
PCMS is a registered trademake of SQL Software inc.
Pentium is a registered trademark of Intel Corporation
PowerBuilder is a registered trademark of Sybase Inc.
ProcessWeaver is a registered trademark of Cap Gemini Sogeti
Schedule Publisher is a registered trademark of Advanced Management Solutions
Software Through Pictures is a registered trademark of IDE, Inc.
Sun is a registered trademark of Sun Microsystems, Inc.
Synervision is a registered trademark of Hewlett-Packard Inc.
TeamWare is a registered trademark of International computers Limited
Unix is a registered trademark exclusively licensed through X/Open Company, Ltd.
WordPerfect is a registered trademark of the Corel Corporation
WorldView is a registered trademark of Interleaf Inc.
CMU/SEI-97-TR-008 vii

viii CMU/SEI-97-TR-008

Software Process Automation: Interviews, Survey, and Workshop
Abstract: This report describes the results of a two-year study of experienceswith the adoption and use of software process automation. The work wasmotivated by a desire to provide insights and guidelines to those planning toimplement this technology. The focus of the study was primarily, but notexclusively, on end-user organizations. The study was conducted in threestages: First, in-depth interviews were conducted to assess the state of thepractice. Second, a survey questionnaire was distributed to a wider number oforganizations to obtain more quantitative data. The populations in these twogroups turned out to be quite different—a fact that we believe enriches thecontent of this report. Finally, a one-day workshop was held, the objective ofwhich was to explore with practitioners why the gap between the theory andpractice of software process automation is as large as it is. A previous reportby Alan Christie, et al. [Christie 96] documented the results of the in-depthinterviews in detail. This report now summarizes the results of the interviews,and describes in more detail the questionnaire survey and the workshop. It alsoprovides both insight for process automation tool developers and guidelines foradoption to process-automation end users.
1 Purpose and Structure of the Study
Software process automation is a technology that may be viewed as a two-edged sword. Onthe one hand it can be viewed as a productivity and quality enhancer, while on the other hand,it can be viewed as a mechanism to control, routinize, and de-skill work. These views bothhave elements of truth, but with appropriate design and adoption considerations, we believethat it is possible to enhance the positive elements while reducing the negative ones.
This report looks at the issues that have arisen for the early adopters of process automation.These people are the innovators, the ones who have been through the “school of hardknocks,” taken the brunt of an immature technology, and suffered from the fact that there arefew experienced people to guide them. Some of the projects we saw succeeded, some failed,but few found the going easy. This technology is not for the feint of heart—at least not yet.However, we hope, through this report, to document experiences and lessons learned. Wehope that we have extracted practical insights to provide insights to the developers of processautomation tools and guidance to those who wish to automate their processes.
CMU/SEI-97-TR-008 1

As described by Christie [Christie 96], the specific objectives of the study are to
• Identify the technical, social, and organizational inhibitors to the adoption of process automation:
– Assess the prevalence and scope of software process automation.
– Categorize the technologies and practices that are currently being used.
– Identify effective and ineffective technologies and practices.
– Develop guidelines for process automation implementers.
• Support vendors and researchers in developing products more in tune with end-user needs:
– Develop guidelines for researchers and vendors to improve producteffectiveness.
– Foster effective communications between researchers, vendors, developersand end users.
These general objectives have been met through a series of activities that include in-depth in-terviews followed by a questionnaire survey and a workshop. The specific objectives of theseactivities are as follows:
• The interviews are aimed at gathering practitioner experiences in a relatively unstructured way, to identify what individuals believe are the important issues in the adoption of software process automation, and to establish a basis for the more structured questionnaire survey. Some of the interviewees were contacted about a year after the initial interviews. This allowed us to estimate what progress (or lack thereof) organizations had made over an extended period of time, and to identify why some projects had been successful and others failed.
• The questionnaire survey assesses a wider cross-section of those involved with process automation and includes individuals outside the software community. Because the questionnaire respondents are following a standard format, the data in this phase of the study will be analyzed in a more quantitative fashion.
• Finally, the workshop was aimed at identifying success strategies for the introduction of software automation. The workshop brought together a widely diverse group of individuals with experience in research and development, adoption, management and end use of process automation, and to raise awareness of critical issues across these communities.
The following three sections of this report deal with the above items respectively. Appendix Aprovides a copy of the script that supported the interviews, Appendix B contains the surveyquestionnaire in its original form, while Appendix C describes how some composite measuresassociated with the survey questionnaire data were derived. Appendix D documents the posi-tion papers of workshop presenters, while Appendix E provides the output generated by theworkshop participants. Appendix F lists the workshop participants.
2 CMU/SEI-97-TR-008

2 The Interviews
This report is based upon interviews with individuals who are knowledgeable about and expe-rienced with process automation. We performed a qualitative analysis of these interviews toarrive at the findings reported here. The material in this section closely follows that presentedin an earlier report [Christie 96]. Readers interested in the details of the interviews should con-sult Appendix C of that report.
Three independent organizations were involved in performing the interviews reported here:the SEI, Nolan Norton and Company (a division of KPMG Peat Marwick), and Cap Gemini So-geti (located in Grenoble, France).
2.1 The Interviewees
An extensive list of candidates was identified early on, including end-user organizations, com-mercial and in-house developers, and researchers. Our original goal was to interview mostlyend users of process automation. However, that was not to be. Because of the immaturity ofthe technology, we interacted with relatively few experienced end users of the technology.Most of our interviews were with people who were involved in developing and implementingprocess-centered environments (PCEs).
These individuals came from a wide variety of organizations including
• a vendor of a major process-oriented configuration management (CM) product
• four DoD sites implementing process-centered environments (PCEs)
• two U.S. government contractors who were developing process tools and implementing PCEs
• two French government contractors who were implementing PCEs
• a French bank that is operating with a PCE
• a university group with strong ties to industry
2.2 How the Interviews Were Conducted
A total of 14 interviews were conducted with 12 projects.1 In the large majority of these inter-view sessions, two interviewers were present. The number of interviewees in each interviewranged from one to eight. All interviews were taped to ensure that the comments were record-ed accurately. The interviews took approximately 36 hours with an average length of 2.4 hoursper interview. All in all, the interviews yielded 150 pages of transcripts.
1. In one organization, two different projects were interviewed. With two other projects, multiple interviews wereconducted.
CMU/SEI-97-TR-008 3

A standard script supported each interview. This script provided a consistent framework andensured that we would have comparable information from each of the interviews. While thequestions were used to support the interviews and to ensure coverage, they were not followedmechanically; areas of interest were often probed in depth. Christie provides further details ofthe interview format [Christie 96].
2.3 Overview of the Projects
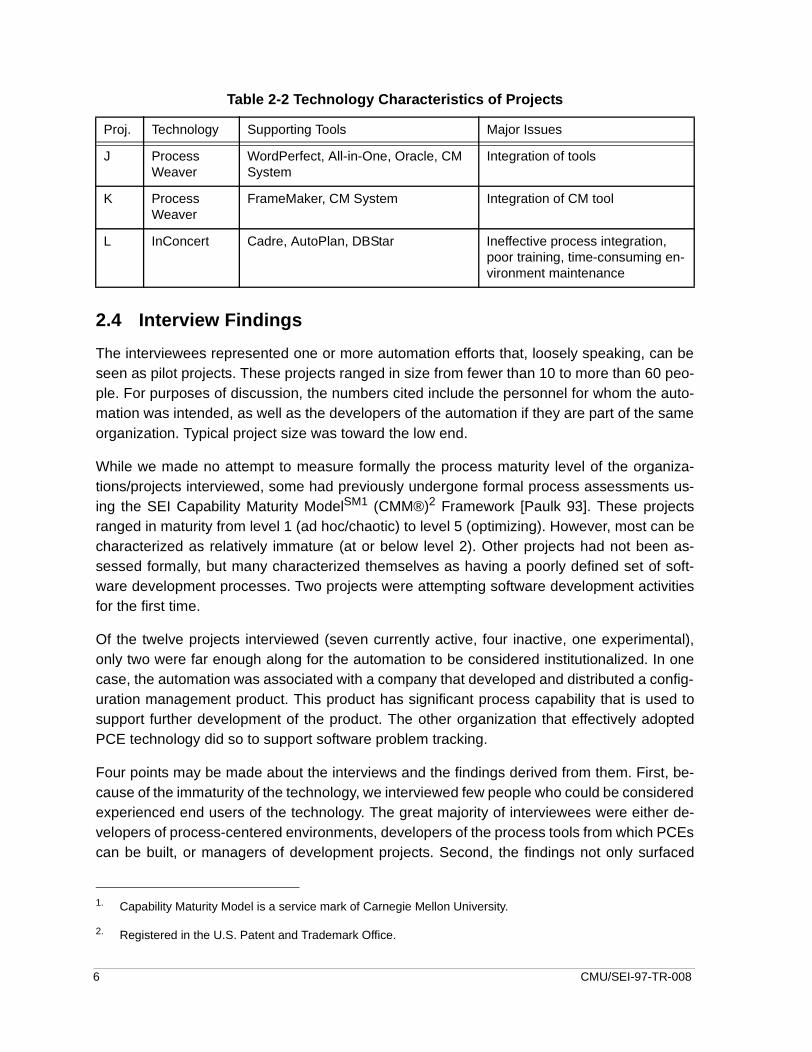
Table 2-1 provides a summary of the projects studied. In addition, we identify whether theproject is a commercial or military activity and provide its current status. Table 2-2 summarizesthe major tools, technologies employed, and significant issues that were identified by the in-terviewees.
These tables are provided to introduce the reader to the individual projects, which we refer tothroughout this discussion.
Table 2-1 Application Characteristics of Projects
Project Activity Duration Org. Size Org. Type Lifecycle Component
A Developing a process cen-tered environment intended for general use
Jan 91 - Present
60-80 Military Maintenance
B Developing process tool 5 years Commercial/ gov. funded
Maintenance
C Developing a PCE, intend-ed for commercial sale
1 year Commercial Project scheduling
D Command/Control, inactive Oct 92 +3 years
Military
E Creating simplified (less process-centered) version of the tool
5 years? Commercial tool vendor
Full
F Experimental research Ongoing 1 prof.+ students
Academic n/a
G MIS, inactive (abandoned) 2.5 years 10-15 Military Cleanroom, Maintenance
H Inactive, but some effort to find commercialization in-terest
5 years 10 - 100 potential
Commercial 2167A S/W development
I Automated problem track-ing
Ongoing 5-10 Commercial Maintenance
J Automating specifica-tion/quality control and de-velopment/validation
Experi-mental/on-going
1-5 Commercial Develop-ment/Mainte-nance
4 CMU/SEI-97-TR-008

K Automating a problem tracking/maintenance sce-nario
Pilot Effort 1-5 Commercial Maintenance
L Automating a reverse engi-neering scenario
Ongoing, Pilot
10-15 Military Maintenance
Table 2-2 Technology Characteristics of Projects
Proj. Technology Supporting Tools Major Issues
A Synervision CM, Language parsing (reengineer-ing), static/dynamic analysis, docu-ment preparation, project management, requirements traceabili-ty
Process definition, selective use, support
B Process Weaver, FlowMark, building own
Software Through Pictures, Interleaf, Paradigm Plus, Oracle
Money unavailable to buy licenses
Not-invented-here syndrome
C Process Weaver
Schedule Publisher, Oracle, Interleaf, Worldview, OpenInterface
D Process Weaver, and Custom pro-cess front ends
CAT/Compass, Amadeus, and con-tractor-developed software products
Resistance to massive amount of technology
Integration of technologies, con-flicting points of view between adopting org. and consultants
E CM FrameMaker Labor/resource intensive, time consuming adoption, complex tool demands significant effort for adoption
F System Fac-tory Project
Internally developed tools to support modeling, analysis, simulation, visual-ization, enactment
G Process Weaver
ProcessWeaver, Oracle, Tool instability, design restrictions placed on end users
H CASE Atherton S/W backplane Development time exceeded sponsorship and customer pa-tience, expectation drift.
I Process Weaver
Database (supporting problems and solutions)
Integration of problem database
Table 2-1 Application Characteristics of Projects
Project Activity Duration Org. Size Org. Type Lifecycle Component
CMU/SEI-97-TR-008 5
2.4 Interview Findings
The interviewees represented one or more automation efforts that, loosely speaking, can beseen as pilot projects. These projects ranged in size from fewer than 10 to more than 60 peo-ple. For purposes of discussion, the numbers cited include the personnel for whom the auto-mation was intended, as well as the developers of the automation if they are part of the sameorganization. Typical project size was toward the low end.
While we made no attempt to measure formally the process maturity level of the organiza-tions/projects interviewed, some had previously undergone formal process assessments us-ing the SEI Capability Maturity ModelSM1 (CMM®)2 Framework [Paulk 93]. These projectsranged in maturity from level 1 (ad hoc/chaotic) to level 5 (optimizing). However, most can becharacterized as relatively immature (at or below level 2). Other projects had not been as-sessed formally, but many characterized themselves as having a poorly defined set of soft-ware development processes. Two projects were attempting software development activitiesfor the first time.
Of the twelve projects interviewed (seven currently active, four inactive, one experimental),only two were far enough along for the automation to be considered institutionalized. In onecase, the automation was associated with a company that developed and distributed a config-uration management product. This product has significant process capability that is used tosupport further development of the product. The other organization that effectively adoptedPCE technology did so to support software problem tracking.
Four points may be made about the interviews and the findings derived from them. First, be-cause of the immaturity of the technology, we interviewed few people who could be consideredexperienced end users of the technology. The great majority of interviewees were either de-velopers of process-centered environments, developers of the process tools from which PCEscan be built, or managers of development projects. Second, the findings not only surfaced
1. Capability Maturity Model is a service mark of Carnegie Mellon University.
2. Registered in the U.S. Patent and Trademark Office.
J Process Weaver
WordPerfect, All-in-One, Oracle, CM System
Integration of tools
K Process Weaver
FrameMaker, CM System Integration of CM tool
L InConcert Cadre, AutoPlan, DBStar Ineffective process integration, poor training, time-consuming en-vironment maintenance
Table 2-2 Technology Characteristics of Projects
Proj. Technology Supporting Tools Major Issues
6 CMU/SEI-97-TR-008

problems but identified potential solutions to these problems. We hope that this informationwill be useful to organizations intending to build and use PCEs. Third, interviewees’ experienc-es were not always consistent, and these inconsistencies may at times be reflected in the re-port. Fourth, as might be expected, we found that many of the adoption issues we identifiedhave much in common with adoption issues associated with other technology areas.
The findings fall into three major categories
• drivers and inhibitors
• contributors to success
• technology issues
In the following discussions, we make heavy use of quotes (indicated in italics) from the inter-views. A major reason for this is that interviewees were surprisingly frank in giving us theirviews about process automation and how their organizations were dealing with it.
2.5 Drivers and Inhibitors
2.5.1 Drivers
The following drivers were identified:
• cost reduction
• quality improvement
• maintaining process capability
• training
• project management support
We found that the most common issues driving organizations to process automation were theneeds to remain competitive, improve quality, and reduce costs. As a manager with a largegovernment contractor stated
The ideal is to do it cheaper, faster and improve quality. That’s the reality oftoday’s budgets.
In another government-related organization we heard
The organization is currently downsizing, primarily by attrition. As personnelare transferred out, they are not replaced.
In an era of shrinking government budgets and increasing commercial competitive pressures,it is not surprising that solutions such as process automation are being explored.
Another automation project was motivated strongly by cost reductions. It estimated that thereturn on investment would be 17 times the initial investment over a period of 10 years, withthe break-even point occurring in the first year. Numbers were also generated to suggest thatwithout automation, 48 people would be needed; with automation, half that number would be
CMU/SEI-97-TR-008 7

adequate. Given the current state of the project, these estimates are likely to be highly unre-alistic, but they did convince management that automation was the way to go.
Another driver that we identified was related to the issue of maintaining process capability, par-ticularly in organizations that were experiencing high turnover. In one DoD organization weheard
Process is critical to organizations because there is such a high turnover ofpersonnel. I have been on this program for two and one half years and almosteveryone is new. There is a going-away party every week or two. Anothermanager indicated: Management is pushing the sharing of information becauseyou do not know how long you are going to be here... Younger people aresaying “I have skills that can get me more money outside,” so they are leaving.
Thus organizations are finding that they cannot afford to maintain processes in people’sheads, even if there is adequate documentation and training.
Training was identified as an area that process automation could support. Guidance providedby the automated environment was seen as a benefit. One interviewee stated
Training/ education will be greatly reduced with online context-sensitive help inleading you down the process. Instead of taking two years to get up to speed,it may take six months to get someone producing code.
Project managers may be motivated to view process automation as a means to take controlof the activities in the project. One interviewee suggested that senior management would liketo see automated processes being schedule driven. Speaking in this role, he indicated
Any time you get a new work item it will key on a template that says... a changerequires you to do these things and that will initiate lower level activities. Thiswill allow me to track how many errors are being generated.
Other expected drivers, such as support for process improvement or the automated collectionof metrics, did not appear to be such significant factors. One example was described in whicha drive was made to move a brand new project very quickly to CMM level 3. A process toolwas introduced in an attempt to fix the resulting chaos; this simply compounded the problem.
2.5.2 Inhibitors
The following inhibitors were identified:
• reluctance to use someone else’s technology
• lack of acceptance of external consultants
• resistance from “old hands”
• fears of first-line supervisors
• discrepancy between predicted and actual times for implementation
• inability to achieve consensus on process definition
• inability to predict return on investment
8 CMU/SEI-97-TR-008
These are discussed in more detail below.
A major inhibitor uncovered was the reluctance of people in an organization to accept processautomation if it is perceived as being driven from outside that organization. As one intervieweestated
Organizations are real resistant to change if it is perceived as being driven fromoutside the organization. “You developed that? then I won't use it.” They maythink they have a better idea and attempt to implement it. Then managementedicts it and they use it as minimally as possible to be compliant. “I'll use it butuse the minimal number of mouse clicks.”
In one case intergroup resentment pitted groups in the organization against each other. Theissue that arose was the perception by some groups that those chosen to be in the test groupfor automation were not pulling their weight. The interviewee characterized the attitude withmock resentment:
These people have extra time on their hands, and we’re over here dying!
We heard from two consultants who independently voiced their frustration when working withclients. In one case, the consultant stated
We put all our energies into developing the environment and went down andgave it to them. And they said “that’s nice but we don’t want it.” That was aneye-opener.
In the other case, the consultant, who joined the project after it had started, said
In my opinion, a good consultant will never come in and say “everything you aredoing is bad.” You can't say that, so what you have to do is back into thesethings.... The only way you can reach people is through education. I have towrite things out for you and make them so painfully obvious that if you ignorethem you get what you deserve. If I haven't done that then I have not done myjob as a consultant.
In several organizations, “old hands” resisted the imposition of process automation, as theyperceived this to be an intrusion into processes they knew well. This inhibitor was not presentwith less-experienced staff who more often welcomed the guidance that automation provided.One interviewee stated
The new people were enthusiastic, but experienced analysts said “I hate thescreens that tell me what I have to do—can you make it so that there is a novicemode and an expert mode?” Another interviewee stated: Adoption is hardbecause some of the “old hands” are extremely resistant.
The same interviewee also stated
It's the first, second, and third line coordinators who really fear this stuff. Inreality these are the people who should be contributing to this, because theyreally understand the process best.
Clearly, more senior people may resent the intrusion of process automation, as they havemore to lose by its introduction. However, these may be the very people who can make themost valuable contributions to the design of the automated processes. Fear of being made re-
CMU/SEI-97-TR-008 9

dundant by automation may be very legitimate and could be a significant inhibitor if not ad-dressed appropriately.
Consistently we saw that it took people much longer than they anticipated to develop effectiveautomated processes. One interviewee stated
I think one reason why it’s frustrating not getting product out is that it’s takingmuch longer than everyone expects to go up the process automation learningcurve.
Management expectations with respect to the investments required in process automation canbe unrealistic. Thus we heard
A reason for failure is the perception that process automation involves littlemore than the purchase of appropriate tools, and that tools are the major costcomponent. In reality, we found that adoption takes longer than everyoneexpects and that technical integration problems frequently cause unforeseendelays.
This was supported by one of the few cases where process automation was institutionalizedsuccessfully, and where technical issues outweighed organizational/people issues. In thiscase we heard
The implementation has been quite long and difficult (eight months) but only fortechnical reasons.
One of the activities for which schedules were delayed significantly was process definition; ob-taining a consensus on what the detailed process should look like was often a long, drawn-outtask. In one case, significant delays (i.e., years) were incurred:
While consensus can be reached at the higher levels of process, consensus ondetails was elusive. This appears to be due to differences in projects,differences in groups within a project, and differences in individuals.
The same interviewee indicated that
The effort has involved two to six integrators/toolsmiths. A total of 19 person-years of effort was expended. However, the majority of the effort was in processdefinition. Most of the work had to be thrown away.
However, another interviewee identified the same problem and offered some insight:
The interesting thing is that the actual implementation step is not that difficult ifyou take a structured, engineering approach... What we’ve seen is manypeople spinning up front for years until they reach some definition of a process.The catch is: architecture first, then a phased process definition plan, and thendo it a piece at a time.
This issue will be discussed further under Section 2.6.6, Using an Incremental Approach.
10 CMU/SEI-97-TR-008

With respect to financial resources, one tool vendor we interviewed suggested that an inhibitorfaced by management occurs because
Most companies have no way of figuring return-on-investment (ROI) in theirown organization. It is easy to identify up-front costs, but difficult to figure theROI over a long period.
2.6 Contributors to Success
The following contributors that improve the chances for success were identified:
• obtaining management commitment
• addressing process definition issues
• encouraging communication
• providing training
• building effective development teams
• using an incremental approach
• minimizing risk
None of these issues is unique to process automation—each has to be faced when most com-plex technologies are introduced. However, because of the strong social impact of process au-tomation, these issues are particularly challenging. Each issue is discussed below.
2.6.1 Obtaining Management Commitment
There is a need to sustain management commitment at all levels and throughout all phases ofthe automation project. Thus management expectations must be set appropriately. While dif-ferent managers may react differently to process automation, we heard
The people who were going to use the technology seemed to appreciate it –especially the system engineers. They are really tool-oriented. The first-linemanager was against it, while the second-line manager was for it.
This may reflect the fact that first-line managers have to take the impact of an unproven tech-nology directly, potentially disrupting their schedules and commitments. Another intervieweeindicated
Make sure at the executive level that the expectations are set right, and that thelimitations of the technology are understood. Many managers have the silverbullet syndrome – they all listen to the first good story they hear from a salesrep, and don’t have anything to base their decision on other than the toolsounds good. Then it becomes law. That’s how politics happens.
CMU/SEI-97-TR-008 11
Because process automation is still not a mature technology, convincing upper managementto spend money may be challenging. We heard the opinion
It’s difficult to get management to spend money on something that they are notsure they see the value in. They have so many hot irons in the fire anyway...The main reason that we were successful was that we had a strong proponentover in the contractor office, and in the system area that was going to use it. Hetook a lot of initiative, maybe exceeding his authority in some cases.
2.6.2 Addressing Process Definition Issues
As mentioned previously, one of the most time-consuming activities is defining processes thatare acceptable to all interested parties. In one organization, the process was intended to sup-port a wide range of individuals. This diversity made it extremely difficult to reach consensus.Initially, a detailed 13-step process was developed, but consensus could not be reached. Cur-rently they have a seven-step, less-detailed process, and even with this more general process,obtaining consensus was difficult. Developers of the automated process felt that the primaryproblem was identifying requirements—as the processes changed over time, so did the re-quirements. Developers noted that even seemingly trivial changes to the process could havesignificant ripple effects on the system’s implementation.
Consistent with that experience, an interviewee from another project stated
Once the process is written down, review is a lot of trouble. I don’t see any wayaround that. I don’t see that improving the notation would help.
Implementers may become carried away with the flexibility of a process technology and defineprocesses that are too detailed. One interviewee stated
Some of our customers get carried away with the flexibility of the tool to thepoint that they define very convoluted, sophisticated, complex processes,because they know what they can do with the tool. However, there is a start-upcost associated with implementing that model. They use the model and find thatthey don’t need all the bells and whistles they built in.
One organization had developed a simple, low-tech approach to process definition that isworth repeating. Paraphrasing the interviewer’s words
We took their process step by step with free input. If I say the input is a frog,then nobody else challenges that. So I start with “what do you call the firstprocess step?” Since they know their jobs, they all know what they do first andwe put that activity’s name at the top of the stack. And then I’ll ask what triggersthis and usually they’ll say – it’s some management directive. Generally I’ll havetwo or three people writing “sticky notes”1 because people are frequentlythrowing out ideas. Initially I was sticking them on to a large sheet of paper, butthen Jose had the idea of arranging the sticky notes on the paper into a processsequence—while the others were thinking up ideas. As they were throwing outscenarios, I just tried to keep them from going too deep into subprocesses.
1. 3M Post-It Notes™
12 CMU/SEI-97-TR-008

After the process is defined, I set the paper aside and put up a new one for thenext phase. Then they may say, “Oh, the exit criteria for the last phase are theentrance criteria for the next phase.” From here on they usually get the hang ofit. About one and a half hours is all that anybody can take of this at one stretch.
On the issue of trying to extract process definitions from naive process users, there may beproblems of completeness or enactability. One interviewee stated
What they had was a process, but when we asked them to write it down, theydid so in what they believed was a very detailed fashion. When you started tolook at it, you would come to dead ends in the process. When you asked themabout that, they’d say “well sometimes we do this and sometimes we do that.”We told them when you put it into a computer you have to state this way or that,or flip a coin... Just the idea of having to code the process into a computercaused them to sit down and define the process to the level that the computerneeded.
2.6.3 Encouraging Communication
More than most software technologies, process automation requires close communicationamong those who are involved with it. This communication may be between technical staff andmanagers, or between members of different organizations. Mismatches in perception of whatthe technology will do for different roles may result in conflict. One interviewee stated
The person leading the effort (one of the senior bean counters) said “here is myidea of a process architecture – it will be schedule driven. Any time you get anew work item it will key on a template that says: a change [request] requiresyou to do these things, and that will initiate lower activities, and I will be able totrack how many errors are being generated.” People said this does not help medo my job. So his challenge at the end of the meeting was if you can come upwith something better let me know, otherwise we are going to go forward anddo this. That’s when Bill and Mike came in from opposite ends of the spectrumand they went ahead and collaborated. Once we found out what real peopleneeded to do their jobs, every bit of the data that the manager needed to viewcame from what they put in. When there are 240 worker bees to a dozenmanagers, I want the worker bees on my side. You show the managers that themetrics are going to be collected etc., you just need an SQL query to pull it out.Then the manager’s light goes on.
Another issue was isolation of the group developing the processes from those who will subse-quently use the process. One interviewee stated
The [end-user] group was reluctant because they were not included along theway. They perceived that processes were being developed off in a vacuum,then bestowed upon them.
CMU/SEI-97-TR-008 13

Voicing the need to involve all aspects of the organization that will be involved in process au-tomation, another interviewee suggested
You really need some technology advocates – people who can go proselytizeout to the organization, people who are trusted in the organization. It’s easy toget someone who wants to get on your band wagon, but who does not interfacewell with the group. So when you form your team get someone who is excitedabout it, and can go back and spread the word.
2.6.4 Providing Training
Training developers in the technology and end users in the use of the automated processesis key to successful implementation. Because process automation technology does not pro-duce a product (as does a compiler), it is harder to describe. One interviewee related the dif-ficulty of describing process automation using a made-up dialog:
But what does [process automation] do?
It does your process.
Well, is it an editor?
No.
Is it a CASE tool?
No.
You mean I have to generate my own outputs?
Yes.
Then what advantage is it?
Well, it’s a process tool.
In a similar vein, another interviewee stated
There was a small group who understood [process automation’s] value. Therewas a smaller group that even understood what it was trying to do. And a lot ofpeople said, “I just don’t know what it is, but I don’t even need it.”
These experiences indicate that end-user training needs to start with explaining the funda-mental nature of process automation, and that training should not focus only on the detailedmechanics of what buttons to push and screens to fill in. Two other interviewees also suggest-ed that simply holding training classes is not sufficient. One interviewee stated
Training has been conducted for individual tools. Also the automation groupspends much time doing hand holding, consulting in order to facilitate tool use.The other interviewee said: Training was provided in both tools and process.Initial training was provided four to five months before actually starting the job.Personnel had to be retrained and lots of hand holding provided.
This last statement also suggests that timing of the training is critical to its effective use.
14 CMU/SEI-97-TR-008
2.6.5 Building Effective Development Teams
Implementing process automation requires a development team with the correct mix of tech-nical and organizational skills and a strong team leader. One interviewee saw that the credi-bility of a strong leader made a significant difference to acceptance:
He said “trust me, this will be good for you,” and they believed him. This is notalways going to happen, but this was a small tight team and it worked.
Another interviewee suggested that having a sufficiently senior person on the team was im-portant:
You need a sufficiently senior person to capture the process to decide howdeep or detailed you want to go. The tool can do anything you ask it to, but youdo not want to have to excuse yourself to go to lunch.
However another interviewee was hesitant about having management on the process defini-tion team:
Representatives come from across the organization, all different levels ofpeople. In the development group, we have one of the senior coordinators, fourdevelopers from different areas of systems software, generic coding. Managersare not there – managers inhibit that kind of thing.
Two other team-related items were heard. In the first, the interviewee indicated that
A special project room was set up to force project personnel to come togetherin one place and develop team spirit. Such structural changes are criticalbecause you must break up the organization in order to get the necessarychanges.
Another interviewee suggested the following strategy:
The biggest advantage that we have and admittedly most companies don’t isthat the people we hire for development are people who are really into process,and want to do process automation.
2.6.6 Using an Incremental Approach
The majority of people we interviewed indicated that their process automation strategy was ofthe “great leap forward” variety. However most felt, in retrospect, that an incremental adoptionapproach should have been taken and that, given the state of the practice, the initial effort hadbeen overly ambitious. As described by one interviewee
The baby steps approach says—get them so far, get them acclimated, thenbring in the new technology as they can appreciate it. If you try to bring anorganization a big bag of technology, the first thing they will do is take the bagand put it in the garbage. So you have to bring in a piece at a time. It's got tobe supportive of human activity and it’s got to be very goal oriented andproduce immediate results.
CMU/SEI-97-TR-008 15

With respect to an incremental approach, we also heard
You need to bring [process automation] in a piece at a time. You need to seewhere they are at and how they are doing. Then pick one of their problems andtry to solve that – so it’s not too big. I think this is what we would do differentlybecause we really didn’t have a way to scale.
A warning came from one interviewee with respect to management’s expectations:
Management wants to see big bangs when they spend their money, not smallsteps. But the big bang approach doesn’t work... They have to understand.Maybe software management education is needed to help them cross thechasm.
The same interviewee voiced the opinion
If you are used to doing things in a certain way on your PC and they bring in aSUN Workstation with Interleaf and CADRE, it’s too much. They can’t changethat fast. If you then tell them they are going to get a list, and you can only openthe tools when the system tells you, people have a hard time with that.
With respect to tool introduction, another interviewee suggested
Process comes before [process] tools. We are very strong over that. A tool is atool...You can’t throw a switch and enact a process. Tools should be chosen tomatch your needs.
However, one interviewee indicated that having experience with application tools prior to au-tomating the process made sense:
Get [application] tools in use ASAP, even before automation is available. Thisgives users some experience, acceptance of the technology, as well as helpingthem define the real requirements.
Finally, one interviewee suggested the following step-by-step adoption strategy:
I believe in starting on a pilot basis, defining a manually enactable process first.I’d be very reluctant to jump on [process] tools first. By manually implementingfirst, you wring out a whole lot of methodology issues and end up with goodappreciation of what a balanced approach to the definition and enactment is.That will arm you with the ability to impose a set of quite realistic requirementson the next tool developer/ vendor who comes along and says I can solve yourprocess problems. Talk to tool developers based on sound knowledge of what'sreally involved so that you will be less inclined to accept at face value what thetool developer says. Another thing—you don't have to swallow processautomation all in one go. You can start with a database for metrics, definingartifacts and their states in repository—manage the artifacts, and let processdrift by itself. Have people own and be responsible for changing artifacts fromthis state to that state by that date. Later add prescribed methods for doingthese things, add process activities, link them together, define exit criteria, andform a process network. By keeping process definition. divorced frommanagement of artifacts, you get the flexibility to throw out a process that's notworking well and substitute a new process without perturbing the products orartifacts that you are working on. You can add several processes, working frommultiple viewpoints on the same artifact without perturbing the artifactsthemselves. These things you learn from first enacting manually. Users may
16 CMU/SEI-97-TR-008
say, “You didn't prioritize any of my activities but I wish you would. I have 30activities I need help in prioritizing.” But don't tell them what they have to do orit will be rejected. These things allow you to gradually work your way up theautomation scale.
2.6.7 Minimizing Risk
Because experience with process automation is still limited, implementing a risk minimizationstrategy makes sense. Risks can come from many places, and one project’s risks may be quitedifferent from another’s. One tool vendor we interviewed was quite strong in suggesting thatrisk assessment should be part of the adoption effort, to be applied not only at the start of theautomation project, but on a periodic basis throughout.The interviewee stated
When I do risk management with the customer, out of it comes a set of risks.Generally I find that everyone gets about 30 risks. It always seems to work outto about 30. Even in-house for us, we came up with 30 risks when changingover to Lotus Notes. Only 10 percent to 25 percent came from the tool. Othersare related to:
•What are the politics?
•What is the culture?
•What are the people issues?
•What are the legacy problems that people have never had the courage, or been able to solve?
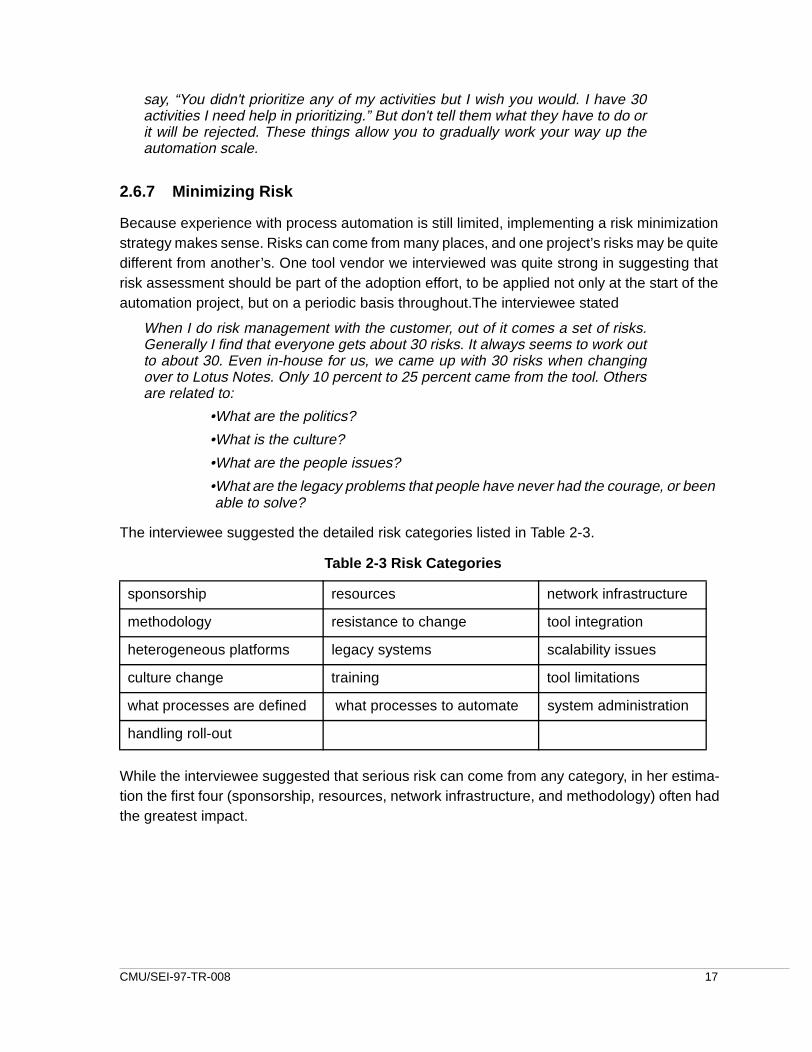
The interviewee suggested the detailed risk categories listed in Table 2-3.
While the interviewee suggested that serious risk can come from any category, in her estima-tion the first four (sponsorship, resources, network infrastructure, and methodology) often hadthe greatest impact.
Table 2-3 Risk Categories
sponsorship resources network infrastructure
methodology resistance to change tool integration
heterogeneous platforms legacy systems scalability issues
culture change training tool limitations
what processes are defined what processes to automate system administration
handling roll-out
CMU/SEI-97-TR-008 17

2.7 Technology Issues
Process automation technology is still in its early days and interviewees (primarily PCE devel-opers) suggested areas where capability could be improved. These areas are
• end-user support
• tool/data integration
• technology support for process
• prototypes
• control driven versus artifact-state driven
• system performance
2.7.1 End-User Support
Several interviewees felt that the less imperative a process-centered environment was with theend user, the better. One interviewee stated
The key is being unobtrusive. If you can do it and be unobtrusive then it is a winall around.
Supporting this sentiment was the view
People, especially creative people, don’t respond to a tool which says “you willstart the activity now.” For example, you cannot start implementing until yourlow-level design has been approved.
In other words, people feel more comfortable performing multiple tasks concurrently. ThusPCEs (and the underlying process-centered frameworks1) should provide mechanisms to al-low this and should not place unnecessary restrictions on task sequencing.
A variety of other functional issues were raised and are quoted below:
On “to-do” lists
We originally had the concept of a to-do list. We would check off tasks andother tasks would appear. This is a very narrow view. Now we have theconcept, not just of looking at today’s to-do list but you can look at tomorrow,or next week, based on what we know now. It will be a best guess, based ondurations and planning for future tasks.
1. Process framework is used here to connote the product with which process-centered environments can bebuilt. See Appendix A for a more detailed definition.
18 CMU/SEI-97-TR-008

On interfacing with email and office scheduling
An interface to email and a calendaring system would be very nice, becausewe like to keep online calendars to schedule meetings etc. You can go out andsay “find for me between this day and this day, a conference for a design reviewwith these five people for an hour” and this could all be done automatically bythe tool because it has all the information. Why should I pay a librarian to makea thousand phone calls?
On managing processes
Every time someone had an instance of a process, they would take one ofthese forms, copy it, and put it in the book. So the process now becomes a bookof forms. I said “This is silly—let’s automate it and use that as a front end withwhich to manage the processes.”
2.7.2 Tool/Data Integration
Unfortunately tools often do not have consistent or compatible capabilities—a design tool mayhave overlapping functionality with a development tool, and each tool may present its informa-tion through a very different user interface. In addition, two tools that need to share data mayuse different data schema. These technical challenges can result in an integrated system thatneither looks nor performs in an integrated manner. Unfortunately resolving functional, data,and user interface incompatibilities is usually a very hard problem. Another integration problemthat surfaced in one organization was incompatibilities between two process definition nota-tions that were used, and between these and the notations that were implemented in other pro-cess support tools.
Some of these problems were voiced by developers of PCEs, particularly the challenge of dataintegration between application tools embedded in the PCE. One interviewee stated
The big data integration problem was between two tools. These had totallydifferent views of process.
Another interviewee stated a similar opinion:
The technical problems can be worked but data integration is an exception—it’sa hard problem.
Tool integration concerns were described by a third interviewee:
Like a lot of other things in the PCE, you find tools are not very well separated...As soon as you have a lot of different tools, all of which have their uniqueknowledge of process and artifact management, how do you get them to worktogether? If you take a total system view, there are encapsulation decisions youwould ideally make if you were the PCE god, but which you can’t do, becauseyou are getting software off the shelf that has a lot of built-in assumptions.
CMU/SEI-97-TR-008 19
The process management component provided primarily textual guidance on task activitieswhile the application tools environment provided the technical means to carry out the task. Inthis way some of the integration issues were separated. As the interviewee stated
We were not originally thinking this way. Then we saw that the application toolsseem to cluster here while the process tools seem to cluster there. And thereare some ties between them. Metrics are collected and displayed up here[through the process component] for management purposes. So there is acoupling through metrics.
2.7.3 Technology Support for Process
A process-centered framework must provide a range of capabilities that help the PCE devel-oper do his/her job. Areas where interviewees indicated that such support is desirable were
• graphical modeling capability with which to build processes
• support for multiple role perspectives
• a library of standardized process components that can be incorporated into larger processes
One interviewee felt strongly that graphical support was needed both in the process develop-ment and process execution phases. The next three quotes are from one interviewee who hadexperiences with both ProcessWeaver and FlowMark®. With respect to process developmenthe stated
I think one of the great advantages to both of these tools is the graphical wayyou can build a process.
He also noted the advantage of minimizing the time necessary to develop user interfaces:
ProcessWeaver has a feature that I really like. I don’t need a GUI builder tobuild all the screens to interface – it builds its own forms, it has its own agendas,and work contexts, and that was very nice. In FlowMark, we had to go out andbuild our own screens, because it is only a process tool. If you want to put apanel in front of someone you have to build it yourself (there is no interfacetool).
This interviewee also suggested that both tools were harder to learn than he would have liked:
One of the things that people around here didn’t like about both tools was thatyou had to be an expert. In other words, they would like a process tool whichhas a very simple English-like language.
Another interviewee supported the need for a graphical development environment to supportprocess design reviews:
We felt we needed a tool we could use during process design. We needed todesign a process, have someone come in and take a look at it, see if theyapproved of the way the tool interactions worked given, of course, that theyrecognized automation was coming.
20 CMU/SEI-97-TR-008

Finally one interviewee voiced the need for role-based views in the process:
If you are a developer you only see developer steps, not management or QAviews, for example. The user just interacts through a to-do list. It would comeup and sort priority. The person could see it and select the task to do. Theprocess manager would get the artifacts from the repository, check them outand return them to the user. It would also open up the tool.
2.7.4 Prototypes
Divergent views were heard on the use of PCE prototypes. On the one hand we heard the view
Prototypes are very formal around here. They are a big part of what we do.Fundamentally I don’t trust anything but a prototype. I don’t trust my ownopinion, let alone anyone else about that something will be useful.
On the other hand we heard the view
We unfortunately used the word prototype the other day, but that’s a bad wordaround here. It has a bad connotation—it implies that you get a half-wayproduct and then it becomes the real product.
Clearly different cultures see prototypes in quite different lights.
Being a new technology, PCEs are more prone to being developed in an ad hoc, exploratorymanner. For this reason, a third interviewee emphasized that PCE prototypes have to be man-aged in a disciplined way if they are to be effective. Perhaps this provides an insight into thedifferent views expressed above:
You need to interject some notions of functional decomposition and functionalverification for each of the prototype levels, so that you can say “given the factthat I’m going to make this my prototype goal, I’ll actually do some algorithmicdevelopment on paper, reason about it and then I can go deeper into theprototyping.” In that way you can probably eliminate much of the code-and-goactivities.
With respect to a disciplined approach, the same interviewee also made the following com-ment about managing prototypes:
We had the issue of having to manage prototypes as prototypes—you’d bettermake sure of configuration management. That’s a lesson we forgot a couple oftimes.
2.7.5 Control Driven Versus Artifact-State Driven
Process end users need to feel that they are in control of their immediate work, not micro-man-aged by their supervisors or unreasonably constrained by an arbitrarily imposed process se-quence.
This issue translates into whether the automated process should be driven purely by changesin artifact state, or whether the process should also allow for the explicit modeling of external
CMU/SEI-97-TR-008 21

control.1 We found that interviewees generally had a desire to minimize the amount of overt,externally imposed control. One interviewee stated
[Software developers] see changes between states. They don’t think of this asprocess, but the natural progression of their software through the organization.
However, another interviewee suggested that overt control could not, realistically, be entirelyeliminated:
Bob and I spent a lot of time talking to [an organization] and Bob convincedthem that state-change architecture was a good thing. They got this idea thatthey could handle all process enactment by just modeling artifact states. Thereis no notion of process control – they thought that process control could all bederived from artifact state.
The fear of an all-controlling machine was allayed in one case after the end user had a chanceto actually get some hands-on experience.
A representative of a trade union who was on the team said that the tool wassomething like big brother, but he said this only once and then forgot it, becausethe manager took care of the problem. The tool is very open to everybody andis not used to control people.
The concern over unnecessary machine constraints was voiced by another interviewee:
People, especially creative people, don't respond to a tool which says “you willstart the activity now.” For example, you cannot start implementation until yourlow-level design has been approved. They cannot work this way. It is better todefine the artifacts that are to be produced and the goal states that theseartifacts can be in. As a process definer, I can say, ‘here are the exit criteriawhich I will impose on you under which you can officially declare that a goalstate has been reached.’ As a project manager I have every right to imposethese criteria on you. I overstep my bounds if I tell you to use this method, oryou will start this process at that point, and not do so until you have finishedsomething else.
The same interviewee provided some further insights into this area. He indicated
Typically a programmer has 20 things going on at once, none of which arefinished. An engine that assumes things are serial or sequential will notwork—it will last about two days. In a similar vein, he stated: End users maysay [to the manager] “you didn't prioritize any of my activities but I wish youwould. I have 30 activities and need help in prioritizing.” But don't tell the endusers what they have to do or it will be rejected.
1. For example, a state-change driven approach implies that the new activity, build, can be initiated when a codemodule is transformed from the state not-debugged to the state debugged. The control-driven approach im-plies that a manager (or the machine) deems, somewhat arbitrarily from the end-user perspective, when it isappropriate to start the build.
22 CMU/SEI-97-TR-008

2.7.6 System Performance
Slow performance, indicative of immature systems, was a common theme. One intervieweeindicated
We had a problem that the environment was incredibly slow – we had anunderpowered processor. We were doing a lot of processing so this added aburden to the workers who were trying to code as fast as they could on theirprojects but they found that they had to spend 15, 20, or even 30 minutes a daymessing with process enactment stuff. We thought that was too much of aburden. One of the requirements of process enactment is that it can’t make lifea lot more difficult for the individual workers. If we want them to get through afew screens to get to their work then it can’t take too long for them to do that.
The same interviewee indicated
Every time there was an actively running process, we would actually have twooperating system processes running on the server. The server has a limit.These were all running off the same administration ID, not the worker’s IDs. Sothere would be 50, 60, or 70 processes running, and eventually the systemwould hit a limit.
This problem has not been overcome in an improved version of the process-centered frame-work, but it does point out practical issues with the implementation of large-scale processes.
Another interviewee voiced similar frustrations:
One of the things we are trying to do is to keep the tool very small on the clientside because PCs just don’t have the power, memory etc. FlowMark took a bigwad of disk space even for the client.
The same interviewee indicated
Some of the difficulties we had were with tools. We had many people with 386machines and didn’t have large hard disks. Anything we had to do with the X-windows emulator really slowed things down. There was a lot of network traffic.People don’t want slow response times. You have to make sure that whateversolution you give them is going to fit into their environment. No way can peoplearound here afford to go out and buy 250 Pentium processors, or X stations.That’s not going to happen.
With respect to crash recovery, several interviewees voiced difficulties. In one case, thunder-storms frequently initiated system crashes. The interviewee stated
Of course that was not only a burden to the administrator, but was a hassle foreveryone. People would have to check files out, while in the middle ofperforming tasks and would have to figure out what the status of each of thesetasks was.
CMU/SEI-97-TR-008 23

With another system, crashes also occurred fairly regularly at first:
The system administrator didn’t feel too confident in the architecture due to theimplementation of the database, and the fact that in the beginning he had toreboot the system regularly. However, despite these problems, users weresatisfied with the system response times and the reboot rate has decreased,currently to five reboots per month.
A third interviewee indicated similar frustrations:
There were problems with graceful recovery from power loss. Each time weneeded to bring the system back up, an expert was needed to put things backin order.
2.8 Conclusions on the Interviews
We originally set out to focus on end users but found ourselves talking more often to process-centered environment developers. The reason for this was that we found few software orga-nizations using process automation on a day-to-day basis. We talked mostly to quite large gov-ernment-funded efforts, and while we would like to have examined small “home grown”initiatives, we did not find many. To date, experience with software process automation ap-pears to be limited, but we did find some people who were struggling with many of the technicaland non-technical issues pertaining to the adoption of process automation. These experienceswere the subject of this section of the report. The following points summarize what we heardfrom interviewees:
• On institutionalization: We interacted with many pilot projects, but saw few successfully institutionalized environments. Many organizations were building prototypes and doing technology assessment. However, in only two organizations did we see automated processes that were institutionalized. These organizations were a bank (where process automation helped maintain their software) and a commercial company (where their process-oriented CM product was used to upgrade this product).
• On primary motivators: Productivity and cost reduction were primary motivators, while quality and process improvement appeared to be secondary motivators. Because of high turnover (particularly in the military) there was interest in support for training and maintenance of legacy systems.
• On maturity of the technology: Process automation tools do not yet appear to be stable or mature. Some interviewees experienced frequent crashes with resulting restart difficulties. GUI builders were limited in some tools, while in others there was a limited ability to query information graphically. There were also some performance and network traffic problems.
• On process definition: Process definition was identified as being one of the most time-consuming aspects of process automation. It requires a level of precision that is very time consuming, and obtaining consensus can be a quite contentious process. The devil is in the details.
24 CMU/SEI-97-TR-008

• On external consultants: We found that resistance could be high to process automation if it was perceived as being imposed by outside agents or consultants.
• On application to software development: Some people viewed themselves as innovative and viewed process automation as inhibiting this creativity. This was particularly true when process automation was applied in a software development area, as software processes are often nonroutine, and end users are highly educated. Software tasks tend to be of low frequency, and software processes vary too much from project to project.
CMU/SEI-97-TR-008 25

26 CMU/SEI-97-TR-008
3 The Survey
The aim of the questionnaire survey was to gather a consistent set of data from a wide varietyof organizations that were involved with the application of process automation. This data al-lowed us to obtain quantitative profiles of PCE users and generate correlations between dif-ferent groups. The discussions below reflect this: The first subsection provides profiles of therespondent organizations, the second subsection describes the organizations’ automationcharacteristics, and the third subsection analyzes some correlations that were made betweenthe data. Finally some conclusions are drawn.
The questionnaire is quite long, consisting of over 120 questions, and the interviews conduct-ed earlier were invaluable in scoping out its content. The questionnaire (see Appendix B, page61) was broken down into seven sections:
• business/product characteristics
• implementation team characteristics
• application focus
• process characteristics
• the development technology
• transition and adoption
• impacts and insights
The questionnaire was distributed to a large number of organizations (approximately 150), but,despite follow-up letters, the return rate was somewhat disappointing; we received only 35.Part of this we believe is due to the size of the questionnaire, and part of it may be due to thefact that many questions dealt with issues of adoption and use that respondents had not yethad much experience with. In analyzing the results, there are two kinds of bias with which wehave to deal. The first relates to the population to whom the questionnaire was distributed. Be-cause of the relatively specialized area and widely varying organizational cultures, it would beclose to impossible to select a controlled population for the study. The second type of bias isintroduced as a result of who, among the first population, returns the completed questionnaire.Because of the low return rate, there is always a question of bias (e.g., were successful groupsmore motivated that unsuccessful groups to return their responses?). Bias may also havebeen introduced by the fact that the large majority of respondents were managers and ana-lysts, and not those who were directly supported by the automation (i.e., end users). Thus,when interpreting the results, the exploratory nature of this study should be kept in mind.
3.1 Organizational Characteristics
We first look at the business and product characteristics of the organizations surveyed. Of par-ticular interest are the organizations’ cultural characteristics and how these relate to the abilityto adopt process automation successfully. The results, shown in Figure 3-1, are derived fromthe survey questions A.5.1—A.5.10 (see Appendix B). These questions each asked, “Howwould you characterize your organization’s culture?” along different cultural dimensions—for
CMU/SEI-97-TR-008 27

example, high turnover vs. stable staff. A neutral category (not shown in the figure) was alsoincluded in the questionnaire. The main point to note in the figure is the fact that, along all di-mensions, the organizations with the more “innovative” characteristics tended to be more suc-cessful in adopting process automation than organizations with “laggard” characteristics.1
Figure 3-1 Correlation Between Success Rates and Cultural Characteristics
Summarizing other characteristics of the organizations, we found that a large majority of par-ticipants developed one-of-a-kind products (37 percent), while the next largest category wascustomized products (20 percent). The software and aerospace businesses dominated the in-dustries (42 and 33 percent, respectively) while other industries represented were electronics,science, finance, communications, energy, transportation, and weather. With respect to the re-sponsibilities of the participants, analysts made up the largest category (34 percent), followedby first-line managers (31 percent). We wanted to get significant representation from the end-user community but (as with the interviews) found that such individuals were very hard to comeby.
1. It should be noted that the somewhat judgemental descriptors “innovator” and “laggard” were not used in thequestionnaire.
0 10 20 30 40 50 60 70 80 90 100
“laggard”“innovator
risk-taking /conservative
informal / formal
flat /many layers
hands-off /controlling
dynamic envir. / static envir.
energetic/complacent
open minded/closed minded
non-political / political
jobs are exciting / jobs are routine
high turnover / stable staff
Percent of respondents indicating success”“innovator”
28 CMU/SEI-97-TR-008

3.2 Characteristics of Individuals
In this section, we look at characteristics of the people involved in the process automationproject. This primarily covers the roles of those who responded to the questionnaire and thelength and breadth of experience of the respondents and the automation team leads.
Figure 3-2 indicates that the great majority of the respondents were analysts or managers. Thelack of end-user participation was disappointing, but is consistent with our interview experi-ence. We believe that this reflects both the immaturity of the technology and the fact that endusers may lack the seniority in their organizations. In interpreting the results, this distributionof respondents should be kept in mind.
Figure 3-2 Distribution of Roles
Figure 3-3 shows that the people involved in the development of the automated process(es)are mostly quite experienced, the majority having over 10 years of experience in software de-velopment.
Percent of respondents
0 5 10 15 20 25 30 35
analyst
first-line manager
senior manager
external consultant
academic
process end-user
programmer
CMU/SEI-97-TR-008 29

Figure 3-3 Distribution of Experience (Years)
Most implementation teams were small; 43 percent of the respondents indicated that theywere in a team of one to five persons, while 23 percent indicated that there were between sixto ten team members. The teams appeared to have a broad range of applicable skills; thebreakdown of team skills was: process definition (85 percent), tool integration (70 percent),PCE development (68 percent), networking (62 percent), adoption (55 percent), and training(52 percent).
3.3 Application Focus
A motivating factor behind this investigation is how process automation can help in the devel-opment of software. However, it is clear that in many ways process automation helps not bydirectly supporting the production of code, but in supporting the attendant management activ-ities. This can be seen in Figure 3-4. Software development is clearly important but not thepredominant activity.
1-5
6-10
11-20
over 20
DK/NA
0 5 10 15 20 25 30
Percent of respondents
1-5
6-10
11-20
over 20
DK/NAY
ears
of
exp
erie
nce
team lead
respondent
30 CMU/SEI-97-TR-008

Figure 3-4 Automation Applications
Unlike in our interview results, the questionnaire results indicate that process improvementwas the most common motivation behind the use of process automation. This is shown in Fig-ure 3-5. Productivity improvement came in a close second. Interestingly, management over-sight was quite low in the priority list—perhaps indicating that management “control” oversubordinates is not being abused.
Figure 3-5 Management Motivation
0 5 10 15 20 25 30 35 40 45 50
Percent of respondents
project tracking
S/W development
project planning
CM
defect tracking
QA
document rev.
document mgmt.
require mgmt.
other
subcont. mgmt.
Percent of respondents
process improvement
productivity improve.
quality
metrics
time-to-market
management oversight
other
DK/NA
0 10 20 30 40 50 60 70
CMU/SEI-97-TR-008 31

We also looked at the duration and frequency characteristics of the processes that were auto-mated. Results are shown in Figure 3-6 and Figure 3-7. Figure 3-6 correlates the duration ofprocesses with how frequently these processes are performed. It is clear that most commonly,processes are both of short duration and frequently performed and that long duration (greaterthen 100 days), low frequency (less than one execution per month) are rare. Figure 3-7 thencorrelates the time it takes to complete the process with the success of the process automationproject. In this case, however, the correlation among these variables appears to be weak. Thislack of good correlation may be because we did not have a sufficient number of long durationprocesses in the study.
Figure 3-6 Correlation Between Duration and Frequency of Execution
>10010-100
1-9<1
>100
10-100
1-9
<1
0
5
10
15
20
25
30
35
pre
cent
of r
espo
nde
nts
duration(elapse days)from initiation tocompletiontimes per month
process is executed
32 CMU/SEI-97-TR-008

Figure 3-7 Process Automation Success vs. Process Duration
In summary, we found that process automation was applied to a wide range of managementactivities, although there was also a significant focus on software development. Process andproduct improvement were primary goals and most applications were of short duration and ofhigh frequency. While process duration appeared to correlate with frequency of use, the re-sults did not indicate any clear correlation between process duration and success with processautomation.
3.4 Process Characteristics
The goal of the questions in this section is to assess the process characteristics of the re-sponding organizations. We wanted to know if
• management practices of the organizations were effective
• documented processes were being followed
• organizations were using known process definition notations to define their processes
With respect to the first item, respondents were asked if they agreed to the six statementsshown in Figure 3-8 (with respect to practices in place prior to the automation implementation).These data clearly indicate a variety of capabilities, although the number of “no” responseswould imply that many of the organizations are at CMM level 1. These results were correlated
very successful
successful
unsuccessful
very unsuccessful
<1
1-9
10-100
>100
0
2
4
6
8
10
12
14
16
18
20pr
ecen
t of
res
pond
ents
degree of success
elapse time (days) frominitiation to completion
CMU/SEI-97-TR-008 33

with the success of the automation projects and the results are shown in Figure 3-9. (See Ap-pendix C for an explanation of the scale used to assess management effectiveness.)
Figure 3-8 Practices Reflecting Process Maturity
The use of documented processes appears to be quite high. However, this could be a reflec-tion of the fact that a significant percent (46) of respondents were managers whose percep-tions of the use of documented processes may be unrealistically high.
Figure 3-9 indicates that organizations with effective management practices (ME<11) were alleither successful or very successful in applying process automation.1 (There were no unsuc-cessful cases.) On the other hand, organizations with less effective management practices(ME>11) were either in the unsuccessful or successful categories. (There were no very suc-cessful cases.) The implication is that effective management practices are contributors to thesuccessful application of process automation.
1. See Appendix C for the definition of degree of management effectiveness.
Percent of respondents0% 20% 40% 60% 80% 100%
use documented processes
meet external schedules
meet cost estimates
collect project mgmt. metrics
collect process impr. metrics
meet external schedules
meet cost estimates
provide technical training
(right) DK/NA
(center) no
(left) yes
Target projects routinely:
34 CMU/SEI-97-TR-008

Figure 3-9 Process Automation Success vs. Management Effectiveness
Figure 3-10 indicates the breadth of processes that were documented and performed manu-ally. Most of the applications focus on work-flow support, rather than on actual software devel-opment (although the latter case is well represented). While it is not surprising to see qualityassurance and document review processes high on the list, it is somewhat surprising to seedefect tracking and document management so meagerly represented (three and eight per-cent, respectively). It is interesting to compare these data to the data in Figure 3-4: AutomationApplications, on page 31, where defect tracking and document management show much high-er representation (34 and 26 percent, respectively).
very successfulsuccessfulunsuccessful
7
8
9
10
11
12
1314
0
5
10
15
20
25
30
pre
cent
of
resp
ond
ents
success rate
management effectiveness(6: Best; 24: Worst)
(ME)
CMU/SEI-97-TR-008 35

.
Figure 3-10 Documented Processes in Target Organizations
For process definition support, it is clear from Figure 3-11 that tried and true approaches aremost popular. By far the most common method to describe processes was flow charts (20 per-cent). Given the familiarity that most software engineers have with this diagramming techniqueand the availability of templates to draw such diagrams, this is not surprising.
We also looked into the issue of whether prior manual operation of the process was an impor-tant precursor to success in its automation and whether that process should have been oper-ated in a stable manner. While the large majority of respondents indicated that their processwas indeed performed manually (69 percent), and a similar number indicated that the processwas documented (66 percent), a much smaller percentage indicated that the process was sta-ble (34 percent). Performing a chi squared test on these data against success in process au-tomation did not reveal any systematic association between prior operation of the process andsuccess in automation.
In summary, while most organizations appeared to be of low process maturity, effectivenessin applying process automation appeared to correlate with factors dealing with managementeffectiveness. Organizations generally used simple process formalisms such as flowcharts todefine their processes. However, most respondents indicated that process definition (for theautomation project) was more challenging than they anticipated (83 percent). Prior manual op-eration of the process did not appear to correlate strongly with success in automation.
Percent of respondents0 5 10 15 20 25 30 35
QA
doc. review
project planning
S/W development
proj. tracking
requ. mgmt.
subcont. mgmt.
doc. mgmt.
other
defect tracking
DK/NA
QA
doc. review
project planning
S/W development
CM
proj. tracking
requ. mgmt.
subcont. mgmt.
doc. mgmt.
other
defect tracking
DK/NA
36 CMU/SEI-97-TR-008

Figure 3-11 Process Definition Notations Used in Target Organization
3.5 Development Technology
We wanted to find out which tools people were using to support their automation efforts andhow they felt about the effectiveness of these tools. We were surprised to find the diversity ofapproaches used. A minority of respondents implemented their processes with commerciallyavailable automation tools such as ProcessWeaver or InConcert, and in fact a few respon-dents did not appear to know which tools were being applied. The distribution of tools used isshown in Figure 3-12. In correlating the perceived success of these projects against the typeof tool used (i.e., process automation tools vs. “other,” as listed in Figure 3-12), no significantdifference was observed. However, it is interesting to note that there was a bias towards usingcommercial automation tools for larger processes, “larger” being defined by the number of endusers involved in these processes.
Percent of respondents
Flow Chart
other
EVTX
Process BreakdownStructure
Petri Net
Role-Activity Diagrams
Flow Chart
other
IDEF0/SADT
EVTX
Process Breakdown
Petri Net
Role-Activity Diagrams
0 2 4 6 8 10 12 14 16 18 20
Examples of “other” :Teamware/activity networkAAAIDEF3Yourdon SA
CMU/SEI-97-TR-008 37

Figure 3-12 Process Automation Tool Used
Addressing the issue of satisfaction with their chosen tools, respondents indicted a fair degreeof satisfaction with the process automation tool used. The responses are shown in Figure 3-13 and Figure 3-14. The degree of “don’t know” may either be because the respondent was amanager and was not familiar with this level of technical detail, or it may have been becausethere was not yet sufficient experience with the tool. Of particular interest (and somewhat dis-concerting) is the relatively small number (about 40 percent) who felt that, despite generallypositive feelings towards the chosen process automation tool, the tool was not cost effective.However, this category did have a high “don’t know” response rate (40 percent), indicating thatthe jury may still be out on this issue.
It was surprising to see that many respondents (over 70 percent) felt that the ability to integrateapplication tools into the environment was either good or excellent. This is in contrast to therespondents who we interviewed, who in general felt that such integration was a hard problem.
Percent of respondents0 5 10 15 20 25 30 35 40 45 50
Cap Gemini/ Process Weaver
Continuus/ Caseware
Xerox/ InConcert
other
DK/NA
Cap Gemini/ Process Weaver
Continuus/ Caseware
Xerox/ InConcert
Hewlett Packard/ SynerVision
Process automation tool used
Examples of “other” :PowerBuilderPCMSTeamWareVisual Basic/LinkWordsFoundationFoxProExcelAutoPlan scheduler
38 CMU/SEI-97-TR-008

Figure 3-13 Perceived Strengths/Weaknesses of Automation Tools - 1
Figure 3-14 Perceived Strengths/Weaknesses of Automation Tools - 2
Finally, Figure 3-15 indicates experiences that respondents had with automation tools. Fromthese data, it appears that, while system crashes and recovery from such crashes were not amajor problem (as they were with some of the interviewees), tool defects were more common.
0% 20% 40% 60% 80% 100%Percent of respondents
process developmentenvironment
debugging capabilities
ability to integrate app. tools
ability to design effectiveuser-interfaces
ability to collect metrics
performance
process development
debugging capabilities
ability to integrate app. tools
ability to design effective
ability to collect metrics
performance
DK/NA
unacceptable
poor
good
excellent
Percent of respondents
100%0% 20% 40% 60% 80%
cross platform compatibilities
customer support
availability of tool training
documentation
ease of use of dev. environ.
cost effectiveness
DK/NAstrongly disagree
disagree
agree
strongly agree
CMU/SEI-97-TR-008 39

Figure 3-15 Characteristics of Process Automation Tools
In summary, we found that a wide variety and sophistication of tools were used to implementprocess automation. Most users were satisfied with the technology support for process auto-mation, but there was still considerable uncertainty about cost effectiveness. It appeared that,while tool defects were a problem, system crashes were less so.
3.6 Transition and Adoption1
During the interviews we heard that transitioning to an automated environment took “longerthan expected.” However, transitioning times that the questionnaire respondents reported(shown in Figure 3-16) do not seem unreasonably long—typically three to twelve months. Thedifference may be due to the fact that the projects on which the interviews focused tended tobe larger and more ambitious than those reported in the questionnaire. Note that for many ofthe cases, transition was still ongoing. In a surprising number of cases, the system was in ac-tual production use—only 20 percent indicated that they were not yet up and running (see Fig-ure 3-17). In the majority of cases, end users participated quite widely in the design of thesystem and specification of its user-interface characteristics. Training also appeared to bequite extensive—less than ten percent indicated that they received no training. These resultsare shown in Figure 3-18.
1. The results in this section that focus on end users should be tempered by the fact that there were very few endusers in the responding population (see Section 3.2 for this distribution).
Percent of respondents
0% 20% 40% 60% 80% 100%
Tool defects affecteddevelopment effort
System crashesaffected development
Difficult to recover fromcrashes
Support for good rangeof H/W platforms
Tool defects affecteddevelopment effort
System crashesaffected development
Difficult to recover fromcrashes
Support for good rangeof H/W platforms
DK/NA
strongly disagree
disagree
agree
strongly agree
40 CMU/SEI-97-TR-008

Figure 3-16 Length (Months) for Transition to Automated Environment
Figure 3-17 Time (Months) Automated System Has Operated in Production Environment
To assess the impact of user involvement on the success of the automated environment, a “de-gree of success” criterion was defined, based on the responses to the six “involvement” issuesidentified in Figure 3-18.1 These data were correlated with how the projects’ personnel per-ceived their level of success. The results are shown in Figure 3-19. While the data are skewedby the fact that most of the projects reported success, it is interesting to note that there wereno failures with organizations exhibiting a high degree of end-user involvement. On the other
transition not completed
0 5 10 15 20 25 30
Percent of respondents
over 12
DK/NA
0-2
3-6
7-12
over 12
DK/NA
0 5 10 15 20 25 30Percent of respondents
not yet in production
0-2
3-6
7-12
13-24
over 24
DK/NA
0-2
3-6
7-12
13-24
over 24
DK/NA
CMU/SEI-97-TR-008 41

hand, there were some successes when little end-user support was evident. These observa-tions may indicate tentatively that end-user involvement is a sufficient but not necessary con-dition for “success.”
Figure 3-18 Process Automation Success vs. End-User Involvement
1. See Appendix C for an explanation of this success measure.
0% 20% 40% 60% 80% 100%
Percent of respondents
training provided to PCEimplementers
process design had end-user input
process design reviewed byend-users
end-users reviewed screens
simulations
implementers
training provided to PCE
process design reviewed by
end-users reviewed screens
end-users reviewed process
end-users
DK/NA
strongly disagree
disagree
agree
strongly agree
42 CMU/SEI-97-TR-008
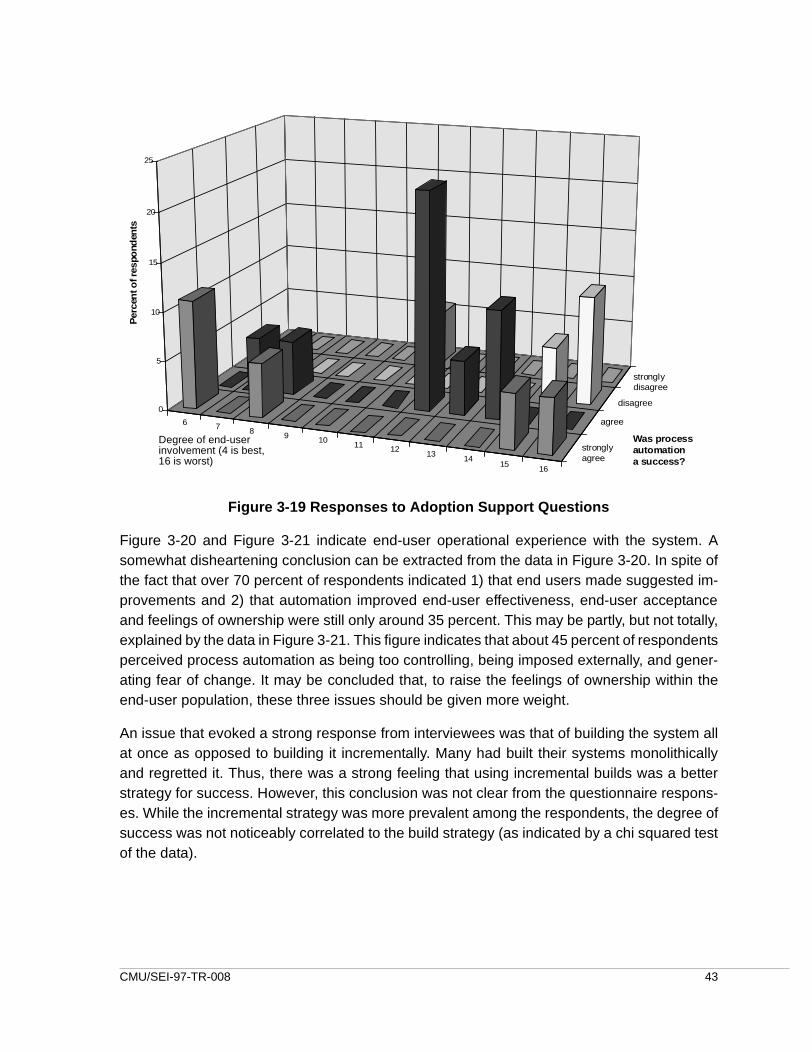
Figure 3-19 Responses to Adoption Support Questions
Figure 3-20 and Figure 3-21 indicate end-user operational experience with the system. Asomewhat disheartening conclusion can be extracted from the data in Figure 3-20. In spite ofthe fact that over 70 percent of respondents indicated 1) that end users made suggested im-provements and 2) that automation improved end-user effectiveness, end-user acceptanceand feelings of ownership were still only around 35 percent. This may be partly, but not totally,explained by the data in Figure 3-21. This figure indicates that about 45 percent of respondentsperceived process automation as being too controlling, being imposed externally, and gener-ating fear of change. It may be concluded that, to raise the feelings of ownership within theend-user population, these three issues should be given more weight.
An issue that evoked a strong response from interviewees was that of building the system allat once as opposed to building it incrementally. Many had built their systems monolithicallyand regretted it. Thus, there was a strong feeling that using incremental builds was a betterstrategy for success. However, this conclusion was not clear from the questionnaire respons-es. While the incremental strategy was more prevalent among the respondents, the degree ofsuccess was not noticeably correlated to the build strategy (as indicated by a chi squared testof the data).
6 7 89 10
11 1213
1415
16
strongly agree
agree
disagree
stronglydisagree
0
5
10
15
20
25
Per
cen
t of r
espo
nden
ts
Degrss of end-userincolvement (4 is best, 16 isworst)
Was processautomationa success?
Degree of end-userinvolvement (4 is best,16 is worst)
CMU/SEI-97-TR-008 43

Figure 3-20 End-User Operational Experience - 1
Figure 3-21 End-User Operational Experience - 2
Finally, in this section, we look at issues dealing with management sponsorship. The data inthis area are presented in Figure 3-22. It is clear that sponsorship from senior and first-linemanagement was very high (79 and 69 percent, respectively) and that the number of projects
Percent of respondents
0% 20% 40% 60% 80% 100%
automation improved end-user effectiveness
end-users accepted theautomated process
end-users felt ownershipto automated process
end-users madesuggested improvements
metrics used to improveautomated process
automation improved end-
end-users felt ownership
end-users made
metrics used to improve
DK/NA (RHS)
strongly disagree
disagree
agree
strongly agree (LHS)
Percent of respondents
0% 20% 40% 60% 80% 100%
automation viewed asexternally imposed
fear of job loss
fear of change
end-users not sufficientlyconsulted
fear of metrics in jobevaluations
automation was too
DK/NA
strongly disagree
disagree
agree
strongly agree
controlling
44 CMU/SEI-97-TR-008

supported by a champion was also perceived as high (60 percent). While this strength is a verypositive sign, it should be tempered by the fact that nearly half of all respondents were man-agers. We correlated the strength of management sponsorship against the perceived successof process automation projects. This result is shown in Figure 3-23. This figure indicates a re-lationship between these variables; namely where sponsorship was strong, success was likelyand where sponsorship was weak, success was less likely. (The “degree of sponsorship” pa-rameter was determined by combining the responses from Figure 3-22 as discussed in Ap-pendix C.)
Figure 3-22 Management Sponsorship
DK/NA (RHS)strongly disagreedisagreeagreestrongly agree (LHS)
Percent of respondents
0% 20% 40% 60% 80% 100%
senior management supportive
first-line management supportive
PA business plan developed
development plan agreed to by management
design reviewed with management
project received sufficient transition funds
project has champion with authority
CMU/SEI-97-TR-008 45

Figure 3-23 Process Automation Success vs. Management Sponsorship
In summary, it appeared that most projects transitioned their environment into use within threeto twelve months. The degree of end-user involvement seemed to be a factor for success.There were indications that the projects received very high management support, and thatstrong management sponsorship is also an indicator of success. End-user involvement wasapparently quite high, while feelings of end-user ownership were not reflected by this level ofinvolvement. Incremental system builds (as opposed to all-at-once builds) were most com-mon, although it was not obvious from the limited data that this in itself was an indicator of suc-cess. This is contrary to the strong responses supporting incremental builds as a successfactor that we heard during our interviews.
3.7 Impacts and Insights
We asked respondents what lessons they learned from their experiences with process auto-mation. This section reviews these responses. First, we found that delays were common. Infact, over 60 percent suffered delays of varying severity. Only 12 percent indicated on-timeperformance while no one was ahead of schedule. This is certainly consistent with the generalexperience that introducing process automation was harder than first anticipated.
9 10 11 12 13 14 15 16 17 18 19 20 21 22 23 24 25 26 27 28
stronglyagree
agree
disagree
0
2
4
6
8
10
12
14
Per
cent
of
resp
ond
ents
Degree of sponsorship(7 is best, 28 is worst)
Was Process Automation a
Success?
46 CMU/SEI-97-TR-008

Figure 3-24 Planned vs. Actual Schedule
Next we look at the perceived benefits (or lack thereof) of process automation. These issuesare summarized in Figure 3-25 and Figure 3-26. Almost equal numbers of respondents felt thatprocess automation either improved or decreased end-user team building. One can only sus-pect that process automation may have the effect of isolating individuals since there is moreof a focus on computer terminal operations. A similar conclusion may be drawn from the ap-proximately equal numbers who indicated increases and decreases in end-user job satisfac-tion. Indicators reflecting management issues were more positive. Thus process automationappeared to preferentially support project management, quality, and productivity activities.Just over half of the respondents indicated that process automation reduced their costs, whileabout 70 percent indicated that process automation provided timely information, provided use-ful process guidance, and helped prevent errors. The highest response category was “sup-ports administrative efforts” (about eighty percent). This high positive response rate isconsistent with the popularity of work-flow applications for routine business tasks. The per-ceived bias that managers benefit primarily from process automation is of concern; the tech-nology is likely to be successful only if it is seen as supporting all who use it. Thus there is aneed to make sure that non-managerial benefits (e.g., reduction of tedium, improved informa-tion access, more effective task prioritization) are emphasized in the implementation of thesystem.
some delays
significant delays
DK/NA
on time
ahead of schedule
0 5 10 15 20 25 30 35 40 45
Percent of respondents
some delays
significant delays
DK/NA
on time
ahead of schedule
CMU/SEI-97-TR-008 47

.
Figure 3-25 Benefits of Process Automation - 1
Figure 3-26 Benefits of Process Automation - 2
Figure 3-27 provides some insights gained from the process automation experiences. Only aquarter of the respondents indicated that they would be automating additional processes. Thisis quite surprising given the fact that process automation was viewed very positively in termsof cost reduction (twice as many respondents feel that it reduced costs as increased them),
Percent of respondents
0% 20% 40% 60% 80% 100%
productivity improved
quality improved
projects managed moreeffectively
end-user communicationimproved
end-user job satisfactionimproved
end-user team-buildingimproved
DK/NA
strongly disagree
disagree
agree
strongly agree
0% 20% 40% 60% 80% 100%
Percent of respondents
helps reduce tedium
helps prevent errors
supports administrative efforts
provides useful process guidance
provides timely information status
provides useful metric data
reduces costs
DK/NA
strongly disagree
disagree
agree
strongly agree
48 CMU/SEI-97-TR-008

perceived success (over 65 percent indicated that the process automation project was a suc-cess), and its effectiveness in supporting many tasks (nearly 80 percent indicated it helped ad-ministrative tasks). On the negative side are the idea that process automation is challengingto put in place (over 60 percent felt this way), and the doubt that it improves job satisfaction.
Figure 3-27 Insights Gained
In summary, most projects (65 percent) experienced delays, while no project was ahead ofschedule. While quality and productivity improved, on average, job satisfaction did not. Manybenefits were indicated strongly, such as providing timely status information, process guid-ance, administrative support, and, to a lesser extent, cost reduction. Finally, and somewhatsurprisingly given the perceived benefits and the fact that automation was used routinely, onlyabout 25 percent indicated that further automation would be implemented.
3.8 Conclusions from the Survey
As indicated earlier, the results from the questionnaire survey should be viewed with somecaution because of the limited return rate and limited end-user input. While additional confir-mation of the conclusions would certainly be desirable, the results reported here provide initialinsights into the types of organizations involved with process automation, their process matu-rity, the tools and techniques they are using, transition experiences with the technology, andfinally, insights gained through the use of the technology.
The following summarizes some of the observations from the completed questionnaires:
• Analysts were the largest category of respondents followed by first-line managers.
• There was little representation from the end-user community.
Percentage of respondents
0% 20% 40% 60% 80% 100%
PCE used on day-to-day
consider automation a
automation helped enforcedefined process
technical implementationwas challenging
additional processes willbe automated
basis
success
DK/NA (RHS)
strongly disagree
disagree
agree
strongly agree (LHS)
CMU/SEI-97-TR-008 49

• Process and product improvement were primary goals in automating processes.
• Most organizations appeared to be of low process maturity.
• Process definition (for the automation project) was more challenging than they anticipated.
• Projects transitioned their environment into use within three to twelve months.
• End-user involvement was apparently quite high, while feelings of end-user ownership were not reflected by this level of involvement.
• Most projects experienced delays – some significant.
• Quality and productivity improved while, on average, job satisfaction did not.
• There was considerable uncertainty about the cost effectiveness of process automation.
• Only about a quarter of respondents indicated that further automation would be implemented.
From the results of the survey, the following factors appear to be important in promoting suc-cess:1
• Organizations exhibiting characteristics such as risk taking and being dynamic and informal appear to have had greater success than those exhibiting “laggard” characteristics, such as being conservative, closed minded, and political.
• Effective management practices were seen to correlate with success. Practices identified included the ability to meet costs and schedules and support for training.
• The survey data indicated a weak correlation between project size and success. This is consistent with the interviewed projects, where many of the larger projects were overly ambitious and not used on a production basis.
• The involvement of end users in automation projects appeared to correlate with success. We saw no project failures where end-user involvement was significant, although we also saw some successes where end-user involvement was not emphasized.
• Providing strong management sponsorship was seen as an important element in encouraging success. Indicators of sponsorship included first-line and senior management support. Transition funding was provided, and a development plan was agreed to by management.
1. Note that there may be other factors – we are only identifying those that are derived from correlations in thequestionnaire data.
50 CMU/SEI-97-TR-008

Finally, it is interesting to compare the interviewee and the questionnaire-respondent popula-tions, which provided very different perspectives:
• government/commercial funding. A total of 73 percent of the interviews were conducted at sites that were either managed by the government or were contractors to government organizations. On the other hand, only 32 percent of the questionnaire respondents were government sponsored.
• all-at-once/incremental construction. Many of the interviewed sites were attempting to build PCEs using more traditional approaches to software development. There was insufficient recognition that, in a new field such as this, preliminary experimentation was needed to uncover problems early and in a manageable way.
• ambitious/small scale. This is similar to the all-at-once/incremental construction issue. Many of the government-funded efforts aimed at supporting major software development efforts, and hence they tended to be large and complex. Many of the questionnaire respondents had less ambitious goals and were developing smaller, more focussed systems where the human factors issues were less challenging.
• commercial PA tools/use what is available. The government-funded efforts often attempted to integrate existing tools that were large in their own right and were not integrated easily. Some of these organizations did develop their own process automation tools, but they were in the minority. The questionnaire respondents tended to be attached to organizations that used whatever tools were available and familiar to them, and not necessarily those developed for process automation. The funding levels for these projects were on average much less that those used to support the interviewee organizations.
• development oriented/“delivery” oriented. The level of expertise in the interviewed organizations was high, and there was a strong focus on the technology challenges. The questionnaire respondent organizations were less visionary and were focussed more on implementing operational systems within tighter time constraints.
• unsuccessful/successful. The interviewee organizations tended to have much more visionary goals than the questionnaire-respondent organizations; the former set much higher challenges for themselves and in many cases fell short of these goals. This does not diminish the excellent work that they performed. We hope that lessons learned from these projects will significantly reduce the likelihood that similar future projects will fail. We saw greater success levels with the questionnaire-respondent organizations. Perhaps this is to be expected given the more modest goals of many of these projects.
CMU/SEI-97-TR-008 51

52 CMU/SEI-97-TR-008

4 The Process Automation Workshop
4.1 Context for the Workshop
A workshop was held in 1996 during the Software Engineering Institute’s (SEI) annual Sym-posium to confirm, refine, and augment the study’s findings. An additional goal was to developinitial, rough “game plans” for improving process automation capabilities and identifying theextent of their use.
The workshop was organized into three major segments:
• Presentations: An overall context was established by a presentation of the study’s findings to date, followed by presentations by people who have worked actively on transitioning process automation capabilities into common practice.
• Issue Scoping: A focus for the development of action plans (see next bullet) was established by identifying issues in five major areas: performer concerns, organizational dynamics, system functionality, process articulation, and system realization.
• Action Plans: The participants worked in small groups to develop organized sets of activities to address the issues listed above.
Position papers written by the presenters are provided in Appendix D. Detailed outputs fromthe workshop, as reflected in Section 4.2, Issue Scoping and Section 4.3, Action Plans, areprovided in Appendix E. Finally, Appendix B lists the workshop participants.
The workshop began by explaining the workshop’s purpose and agenda and establishing acommon definition of process automation. This definition stated that process automation is atechnology (strategies, methods, and tools) that provides automated support for process per-formance in which the computer is more than trivially involved in
• performing some of the process steps
• supporting
– information flow among process performers
– control flow among process steps
– assuring adherence to role obligations and permissions
– assessing progress towards goals and milestones
This introduction was followed by a overview of the results of the study’s interviews and sur-vey. The presentation materials are not included here since they duplicate the material pre-sented in previous sections of this report.
Next, a number of presentations were given by people who had provided position papers ear-lier and indicated an interest in talking about their experiences about transitioning process au-tomation technology to common practice.
CMU/SEI-97-TR-008 53

4.2 Issue Scoping
The study’s results to date and the comments of the presenters were used to identify issuesthat need to be addressed to make process automation technology more acceptable and re-move the barriers inhibiting adoption of this technology.
The issues were identified by a group discussion focussed on five areas:
• Performer Concerns: Issues related to the feelings of the personnel performing the process regarding the need for, and personal impact of process automation.
• Organizational Dynamics: Issues related to the changes in organizational structure that follow from, or are required for, process automation.
• System Functionality: Issues related to providing attractive, effective functionality in process automation systems.
• Process Articulation: Issues related to defining and evaluating the automated process.
• System Realization: Issues related to implementing and realizing process automation systems that support well-articulated processes and have attractive, effective functionality.
Discussion of these topics led to the issues listed in the briefing charts that are provided in Ap-pendix E.
4.3 Action Plans
Workshop participants formed four groups to develop initial, rough “game plans” for address-ing issues in the areas of performer concerns, organizational dynamics, system functionality,and process articulation.1
Each group was asked to follow the approach depicted in Figure 4-1 and Figure 4-2. As shownin Figure 4-1, each group was asked to identify realistic approaches to adopting process au-tomation over the next five years. With respect to making the approaches realistic, the groupswere asked to consider issues such as feasibility (as reflected by current state-of-the-art,state-of-the-practice, and state-of-the-marketplace), resource requirements, and cost effec-tiveness. In focusing on adoption, the groups were asked to consider all the stakeholder audi-ences (technology producers, transfer agents, and adopters) and consider not only the factorsthat would inhibit and facilitate adoption, but also the basic factors which motivate adoption.The focus on a five-year period was intended to make the groups consider longer range issuesand implied that the activities would be rather coarse-grained. For this reason, the groups wereasked to give rough estimates for each activity’s duration and specify the dependenciesamong the activities.
1. Only a few workshop participants were interested in the system realization area; these people joined the groupaddressing the issues in the system functionality area.
54 CMU/SEI-97-TR-008

The specific approach to action plan development is depicted in Figure 4-2. The groups wereasked to first identify a set of desirable states which would characterize the situation five yearsfrom now. They were then asked to prioritize the desirable states and pick the three targetstates that they collectively thought were the most important. In prioritizing, they were askedto factor in consideration of feasibility, resource requirements, and cost effectiveness. Finally,the groups were asked to develop a set of activities for each target state that would allow thestates to be achieved. In defining the activities, they were asked to consider the needs of allaudiences and specify what might motivate, facilitate, and inhibit accomplishing the activity.
All groups identified and prioritized desirable states. The group working on system functional-ity issues identified so many desirable states that they grouped them into six themes for thepurpose of prioritizing them. All of the groups also identified activities for the target states, al-though only a few of the groups were able to identify durations and dependencies for the ac-tivities. The desirable future states, target states, and action plans developed by the groupsappear in the briefing charts in Appendix E
Figure 4-1 Approach to Developing Action Plans - 1
Purpose: With respect to some
major theme of issues, identify
realistic approaches to
facilitating Process Automation
adoption over the next five yearsfive years
Audience (Producers,Intermediaries and
Consumers)
Focus (Motivators, Inhibitorsand Facilitators)
Breakout Groups Five-to-six GroupsTheme Leader Location____________ _________ ____________________ _________ ____________________ _________ ____________________ _________ ____________________ _________ ____________________ _________ ________
Feasibility(SOA, SOP & SOM)
Resource Req’ts
Pain/Gain Ratios
Impact Time Frame(Five Years)
Action Initiation andDuration
major theme
realistic approaches
adoption
CMU/SEI-97-TR-008 55
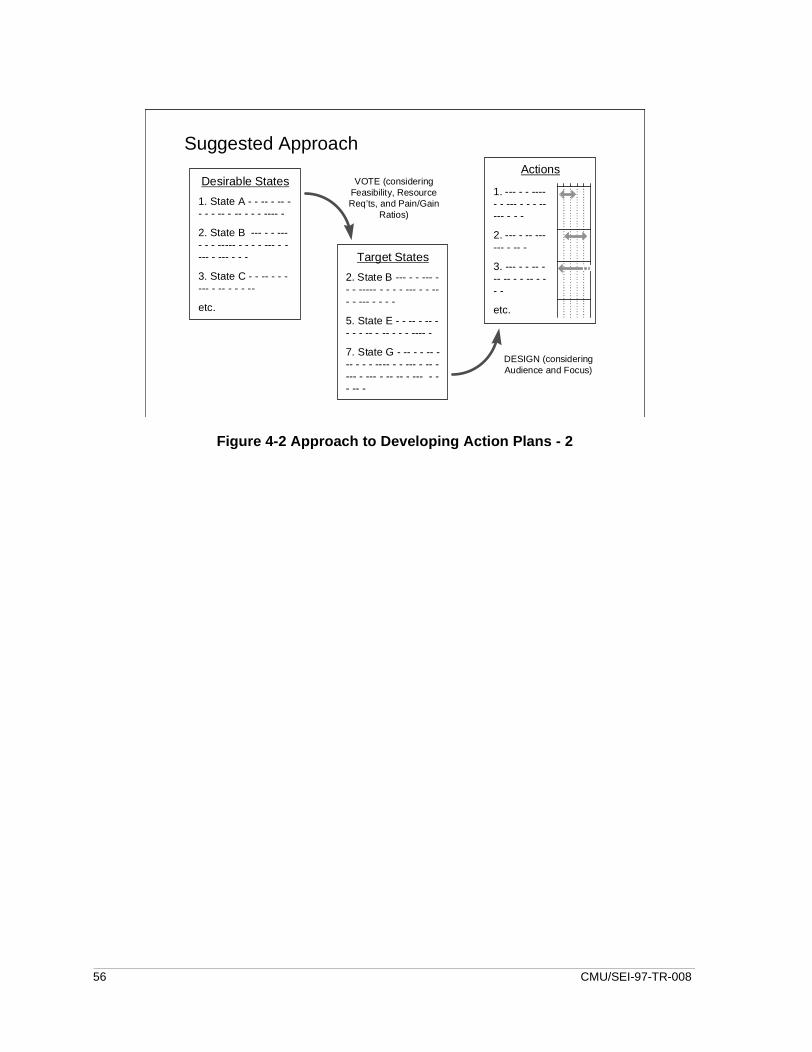
Figure 4-2 Approach to Developing Action Plans - 2
Suggested Approach
Desirable States
1. State A - - -- - -- -- - - -- - -- - - - ---- -
2. State B --- - - ---- - - ----- - - - - --- - ---- - --- - - -
3. State C - - -- - - ---- - -- - - - --
etc.
Target States
2. State B --- - - --- -- - ----- - - - - --- - - --- - --- - - - -
5. State E - - -- - -- -- - - -- - -- - - - ---- -
7. State G - -- - - -- --- - - - ---- - - --- - -- ---- - --- - -- -- - --- - -- -- -
Actions
1. --- - - ----- - --- - - - ----- - - -
2. --- - -- ------ - -- -
3. --- - - -- --- -- - - -- - -- -
etc.
VOTE (consideringFeasibility, ResourceReq’ts, and Pain/Gain
Ratios)
DESIGN (consideringAudience and Focus)
56 CMU/SEI-97-TR-008

Appendix A The Interview ScriptThe interview script appears below in its original form.
Question Script for the Software Process Automation Interviews
March 23, 1995
The following identifies a set of topics to facilitate discussions during the in-depth interviews.Each topic is supported by a hypothesis (a statement to be supported or refuted by the gath-ered evidence) conjecturing a relationship between the topic and its effect on the organiza-tion’s ability to implement the technology. Suggested questions to probe these relationshipsare listed for each topic. The topic areas are arranged into three parts.
The in-depth interviews will likely be conducted by different people. It is therefore necessaryto have some consistent approach for these interviews, so that comparative analysis of thedata can be performed. Given this approach, it seems desirable that the topic areas are usedby all teams to structure the interviews. However, note that the questions are only for guid-ance; it is important that, to some extent, the probing is open-ended.
These site interviews should be augmented by demonstrations of the technology itself. Suchdemos will be very useful
• to get a feel for the behavior of the automated process
• as a check on what we are told about the system
It would probably be best to get a demo before the interviews begin.
Some of the question groups are relevant to some roles but not to others. The following break-down of roles is identified:
• Senior managers 1 (SM1) (i.e., those who have financial control over the development of the automated processes
• Senior managers 2 (SM2) (i.e., those who have financial control over the use of the automated processes
• Project managers 1 (PM1) (i.e., those who manage implementation of the automated processes
• Project managers 2 (PM2) (i.e., those who manage the personnel who use the automated processes
• Process developers (PD) (the software engineers who implement the automated processes)
• Adoption support (AS) (those who are responsible for transitioning the automated processes to the end users)
• End-users (EU) (those who are supported by the automated processes)
Each question grouping identifies which of the roles are appropriate to that grouping.
CMU/SEI-97-TR-008 57

While all organizations should be able to answer the questions in Part 1, some organizationswill not have sufficient experience operating automated processes to answer all the Part 2 orPart 3 questions. This is to be expected.
The Question Script
1. Introduction1. Thank interviewee2. Introduce team members3. Purpose of interview4. Confidentiality/attribution statement5. Can we tape?6. What the roles are7. Review interview topics8. Length of session, time constraints9. Ask if there are any questions before we begin
2. Business/Product characteristics (All)Hypothesis: Business/product environment defines the types of processes and hence the ef-fectiveness of automated processes.General question: Describe the nature of your business 1. Who are your customers? 2. How large is your business unit and how is it organized? 3. How would you describe your organization’s culture?
3. Process maturity (All)Hypothesis: One must be a process-mature organization to effectively use process automa-tion.General question: Describe any process improvement efforts in your organization 1. Have you had a process assessment or capability evaluation? - Please describe 2. Do you have a process improvement plan in place? 3. Do things usually run smoothly when developing your products? 4. How do you plan and manage projects? 5. Do you use a CM system to manage your products? 6. Describe project management or product metrics that you track (if any)
4. Application focus (All) Hypothesis: Some types of processes are more appropriate for automation than othersGeneral question: Describe the process that you are automating 1. Why did you choose this particular process to automate? 2. What benefit do you expect to get from automating the process? 3. Were the processes that were automated typically ad hoc, prior to automation? 4. Describe any metric data you are collecting automatically.
58 CMU/SEI-97-TR-008
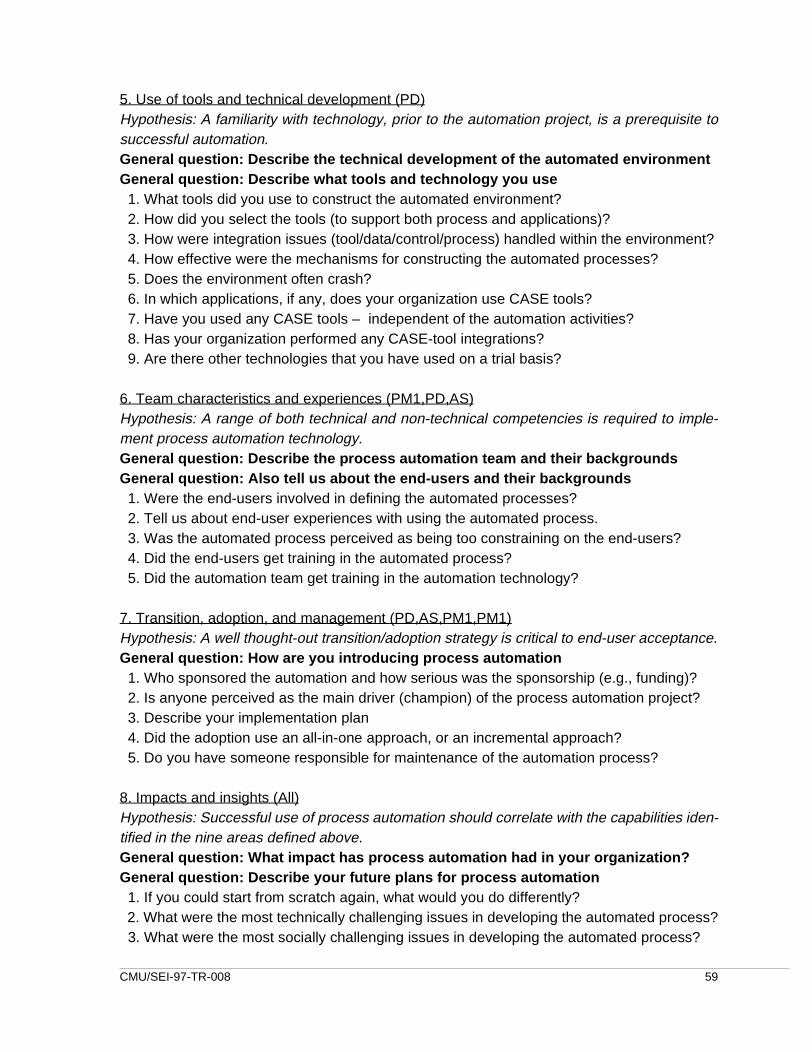
5. Use of tools and technical development (PD)Hypothesis: A familiarity with technology, prior to the automation project, is a prerequisite tosuccessful automation.General question: Describe the technical development of the automated environmentGeneral question: Describe what tools and technology you use 1. What tools did you use to construct the automated environment? 2. How did you select the tools (to support both process and applications)? 3. How were integration issues (tool/data/control/process) handled within the environment? 4. How effective were the mechanisms for constructing the automated processes? 5. Does the environment often crash? 6. In which applications, if any, does your organization use CASE tools? 7. Have you used any CASE tools – independent of the automation activities? 8. Has your organization performed any CASE-tool integrations? 9. Are there other technologies that you have used on a trial basis?
6. Team characteristics and experiences (PM1,PD,AS)Hypothesis: A range of both technical and non-technical competencies is required to imple-ment process automation technology.General question: Describe the process automation team and their backgroundsGeneral question: Also tell us about the end-users and their backgrounds 1. Were the end-users involved in defining the automated processes? 2. Tell us about end-user experiences with using the automated process. 3. Was the automated process perceived as being too constraining on the end-users? 4. Did the end-users get training in the automated process? 5. Did the automation team get training in the automation technology?
7. Transition, adoption, and management (PD,AS,PM1,PM1)Hypothesis: A well thought-out transition/adoption strategy is critical to end-user acceptance.General question: How are you introducing process automation 1. Who sponsored the automation and how serious was the sponsorship (e.g., funding)? 2. Is anyone perceived as the main driver (champion) of the process automation project? 3. Describe your implementation plan 4. Did the adoption use an all-in-one approach, or an incremental approach? 5. Do you have someone responsible for maintenance of the automation process?
8. Impacts and insights (All)Hypothesis: Successful use of process automation should correlate with the capabilities iden-tified in the nine areas defined above.General question: What impact has process automation had in your organization?General question: Describe your future plans for process automation 1. If you could start from scratch again, what would you do differently? 2. What were the most technically challenging issues in developing the automated process? 3. What were the most socially challenging issues in developing the automated process?
CMU/SEI-97-TR-008 59
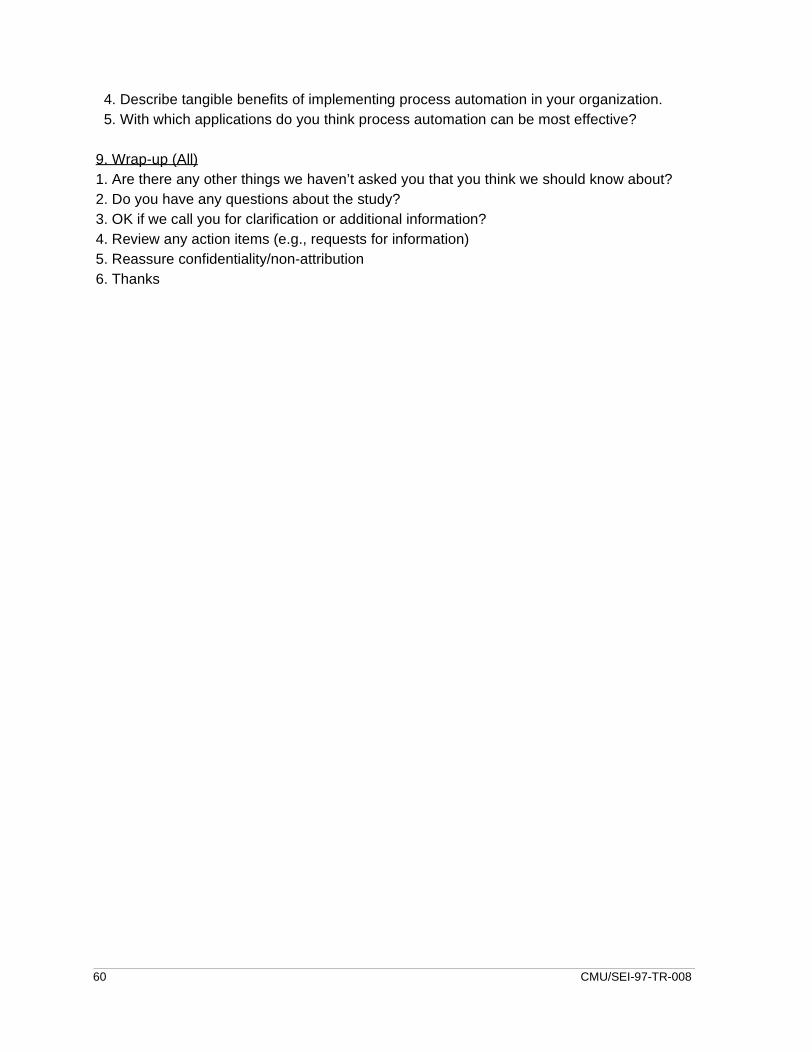
4. Describe tangible benefits of implementing process automation in your organization. 5. With which applications do you think process automation can be most effective?
9. Wrap-up (All)1. Are there any other things we haven’t asked you that you think we should know about?2. Do you have any questions about the study?3. OK if we call you for clarification or additional information?4. Review any action items (e.g., requests for information)5. Reassure confidentiality/non-attribution6. Thanks
60 CMU/SEI-97-TR-008

Appendix B The Survey The Survey appears on the following pages in its original form.
CMU/SEI-97-TR-008 61

62 CMU/SEI-97-TR-008
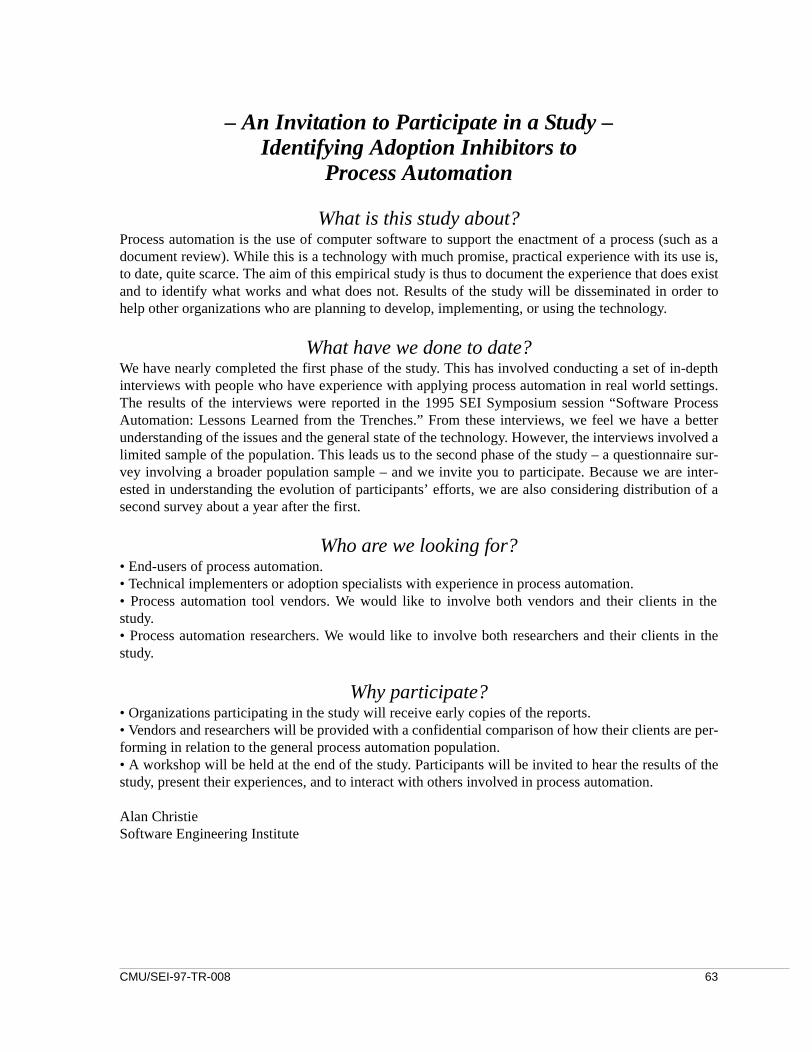
rocess betterolved a
aire sur- inter-n of a
in the
s in the
re per-
of the
– An Invitation to Participate in a Study – Identifying Adoption Inhibitors to
Process Automation
What is this study about?Process automation is the use of computer software to support the enactment of a process (such as adocument review). While this is a technology with much promise, practical experience with its use is,to date, quite scarce. The aim of this empirical study is thus to document the experience that does existand to identify what works and what does not. Results of the study will be disseminated in order tohelp other organizations who are planning to develop, implementing, or using the technology.
What have we done to date?We have nearly completed the first phase of the study. This has involved conducting a set of in-depthinterviews with people who have experience with applying process automation in real world settings.The results of the interviews were reported in the 1995 SEI Symposium session “Software PAutomation: Lessons Learned from the Trenches.” From these interviews, we feel we have aunderstanding of the issues and the general state of the technology. However, the interviews invlimited sample of the population. This leads us to the second phase of the study – a questionnvey involving a broader population sample – and we invite you to participate. Because we areested in understanding the evolution of participants’ efforts, we are also considering distributiosecond survey about a year after the first.
Who are we looking for?• End-users of process automation.• Technical implementers or adoption specialists with experience in process automation.• Process automation tool vendors. We would like to involve both vendors and their clients study. • Process automation researchers. We would like to involve both researchers and their clientstudy.
Why participate?• Organizations participating in the study will receive early copies of the reports.• Vendors and researchers will be provided with a confidential comparison of how their clients aforming in relation to the general process automation population.• A workshop will be held at the end of the study. Participants will be invited to hear the results study, present their experiences, and to interact with others involved in process automation.
Alan ChristieSoftware Engineering Institute
CMU/SEI-97-TR-008 63

factorsaniza-
t it willeturn it distrib-
e withautoma-. If youck the
y wish to
ed pro-ted pro-
ies, we
lectroni-
rocess- on theom-stion-mes
o Alan
Instructions for the Survey Questionnaire
We encourage more than one person from an organization to complete the questionnaire. In this waywe hope to obtain views of process automation as seen by roles as developers, managers, end-users etc.To this end, feel free to duplicate the questionnaire, or request additional copies from Teresa Belton(see Support below).
ConfidentialityPlease answer the questions on the following sheets as honestly as you can. Your answers will bestrictly non-attributable to you on a personal level, or to your company. Only aggregate figures will bepublished.
Completing the questionnaireThere are no right or wrong answers to these questions – we are attempting to identify the which correlate with the effective use of process-centered environments, not to “score” an orgtion’s capability.
Important points to note: • While there are many questions to answer, they are all multiple choice, and we estimate thatake you about 30 minutes to complete the questionnaire. When you have filled it out, please rin the pre-addressed envelope provided, or to the product vendor or research organization whouted it to you. • If you can’t answer all the questions below, don’t be concerned. We expect this will be the casmany respondents, in part because not everyone will have been involved in all aspects of the tion project, and in part because some automation projects will not have completed all phasesfeel that you don’t know the answer to a question, or it is not applicable in your situation, cheDK/NA box. • Sections B and E of the questionnaire focus on development issues – these questions you maignore if your experience does not include development.• The questionnaire is written in a manner that assumes you are involved in only one automatcess. If you have been involved with more that one, your responses should reflect the automacess with which you have been most recently involved.• You can expand on any of your answers on the last sheet of the questionnaire. • Some of the terms in the questionnaire have specific meanings. In order to minimize ambiguithave included a section called Terms Used in the Questionnaire.• Please check the boxes in the questionnaire as unambiguously as possible, as they will be ecally scanned.
Note to Product Vendors and Researchers.If your organization has developed a process tool that is being used by your clients to build pcentered environments, then we would like to involve these clients in the study. As mentionedfirst page of this survey, if you participate in the study, we will provide you with a confidential cparison of your client base relative to all study participants. You may either administer the quenaire to your clients yourself (to maintain client confidentiality), or if you supply us with the nawith clients who have volunteered, we will administer the questionnaire for you.
SupportIf you have any questions regarding the survey or the questionnaire, please send e-mail tChristie at [email protected], or Teresa Belton at [email protected].
64 CMU/SEI-97-TR-008

Terms Used in the Questionnaire
There are several terms used in the questionnaire that have specific meaning in the context of the questionnaire. These terms are defined below:
Automation tool is the software product or language through which the process-centered environmentis built and executed. Thus tools such as ProcessWeaver, SynerVision or InConcert are process auto-mation tools. It may also be possible to build PCEs using, for example, UNIX scripts that are enhancedwith process-oriented functions (e.g., to support communications, controls and end-user interfacecapabilities). Such augmented scripting languages may also be considered process automation tools.
Champion is a person who is an enthusiastic promoter of a technology and is sufficiently senior to influence management decisions with regard to that technology.
Development team is the group of people responsible for implementing and transitioning the processcentered environment to the end users of the environment. Such a group will certainly involve individ-ual with a technical background. It may also involve people who specialize in organizational change orspecialize in the social aspects of technology adoption.
End-user is a person who produces a product by interacting with the automated process. Thus, for example, if the automated process supports document review, then a person who performs document review is a process end-user.
First-line manager is a manager who is responsible for a project or business group. In general a first-line manager will not have other managers reporting to him or her.
Formal (or formally) are sometimes used as qualifiers. Either words implies there is a recognized, documented, and agreed to standard to which the associated concept conforms.
Process is a sequence of interdependent activities whose execution leads to a goal. Often (but not always) a process is initiated by an decision to take action (perhaps by a manager), and is completed when a product is generated.
Process automation is computer-based support for the flow of work between individual tasks. Pro-cesses (large or small) are said to be automated if manual control of task initiation or sequencing is transferred to the computer. It may be driven by a simple computer-based script or it may be based on a process-centered environment. Such assistance may involve only one person and one computer, or it may involve multiple persons supported by multiple computers terminals. However, for the purposes of this study, an essential component is human communication. Hence the automation shall allow com-munication between at least two people.
Process-centered environment (PCE) is an computer-based environment in which multiple peopleinteract under the management of a computer-based process, and in which there are well definedmechanisms for human and machine communications and control. It is likely to be built using a pro-cess execution tool that has a process programming language with which to express process executionconstructs. A PCE may, for example, enact a bug tracking process, a peer review process, a testing pro-cess, or a configuration management process. Organization is a set of projects or business groups that share that same basic corporate and technical
CMU/SEI-97-TR-008 65

cultures. They may or may not work in the same product line, but probably share the same values, use similar technologies and have open lines of communication. A project or business group is supervised by a first-line manager.
Senior manager is a manager who is responsible for a number of projects or business groups and has financial responsibility for and control over these projects or groups.
66 CMU/SEI-97-TR-008
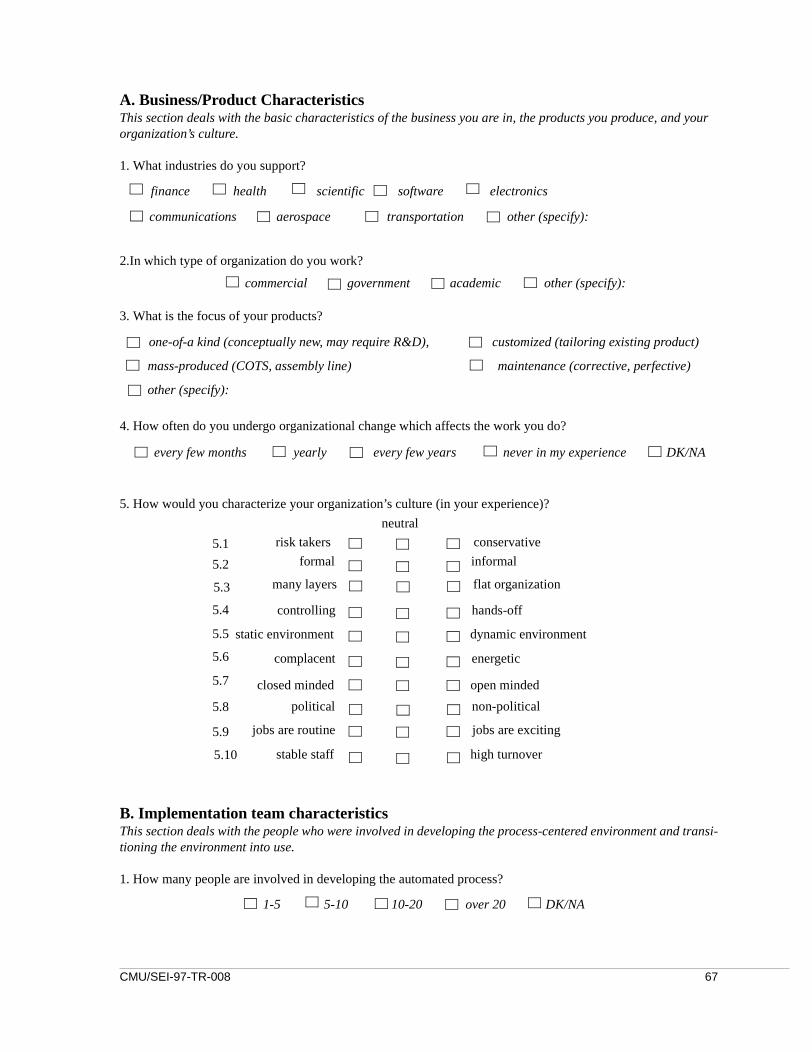
A. Business/Product CharacteristicsThis section deals with the basic characteristics of the business you are in, the products you produce, and your organization’s culture.
1. What industries do you support?
2.In which type of organization do you work?
3. What is the focus of your products?
4. How often do you undergo organizational change which affects the work you do?
5. How would you characterize your organization’s culture (in your experience)?
B. Implementation team characteristics This section deals with the people who were involved in developing the process-centered environment and transi-tioning the environment into use.
1. How many people are involved in developing the automated process?
finance health scientific software electronics
communications aerospace transportation other (specify):
commercial government academic other (specify):
one-of-a kind (conceptually new, may require R&D), customized (tailoring existing product)
mass-produced (COTS, assembly line) maintenance (corrective, perfective)
other (specify):
every few months yearly every few years never in my experience DK/NA
5.1
5.2
5.4
5.3
5.5
5.6
5.7
5.8
5.9
5.10
risk takers conservative
formal informal
many layers flat organization
controlling hands-off
static environment dynamic environment
complacent energetic
closed minded open minded
political non-political
jobs are routine jobs are exciting
stable staff high turnover
neutral
1-5 5-10 10-20 over 20 DK/NA
CMU/SEI-97-TR-008 67

2. How many years of software development experience does the process automation team leader have?
2. How many years of software development experience do you have?
3. People with experience in the following categories are part of the development team:
3.1 process definition,
3.2 process-centered environment development,
3.3 tool integration,
3.4 computer networking,
3.6 transition and adoption,
3.7 training.
4. There are representatives from each end-user project on the development team.
5. Some of the expertise is being provided by external consultants.
6. Some of the expertise is being provided by subcontractors.
C. Application focusThis section covers the process that was automated. If you have been involved in more than one automation project answer the questions with respect to that project with which you have greatest familiarity.
1. What general areas does the automated processes address?
2. What elements motivated the management to consider the use of a process automation?
3.Adequate funding for technical development was supplied.
4. Is the automated process currently being used on a day-to-day basis.
0-2 2-5 5-10 10-15 over 15 DK/NA
0-2 2-5 5-10 10-15 over 15 DK/NA
Yes No DK/NA
Yes No DK/NA
Yes No DK/NA
Yes No DK/NA
Yes No DK/NA
Yes No DK/NA
Yes No DK/NA
Yes No DK/NA
Yes No DK/NA
requirements management project planning project tracking & oversight
document review software development subcontractor management
quality assurance configuration management document management
defect/anomaly tracking other (specify):
time-to-market management oversight productivity improvement
process improvement quality metrics DK/NA
other (specify):
Yes No DK/NA
Yes No DK/NA
68 CMU/SEI-97-TR-008

5. How many process-users are (or will be) involved in the automated process?
6. Approximately how many times per month is (or will) the automated process be executed?
7. Approximately how many elapsed days does (or will) the automated process take from initiation to comple-tion?
8. How many processes are currently being automated?
9. How many automated processes are in operation?
10. To the best of my knowledge, our current automation activities include:
10.1: assessing the technology – no product purchases made,
10.2: organization is evaluating a specific commercial process automation tool,
10.3: defining first process to be automated.,
10.4: developing first implementation,
10.5: one implementation running – field trials being performed,
10.6: one implementation successfully deployed.
If the response to question 10.6 is “yes” then:
10.6.1: is automation of any additional process(es) planned,
10.6.2: is development of any additional automated process(es) underway,
10.6.3: are additional automated processes being implemented with end-users,
10.6.4: are additional automated processes successfully deployed?
D. Process characteristicsThis section covers issues associated with manually defined process in your organization.
1. A documented process improvement plan is in place.
2. Projects routinely:
2.1 collect metrics on project management data,
2.2 use metrics to support process improvement,
1-5 5-10 10-20 over 20 DK/NA
less than 1 1-9 10-100 over 100 DK/NA
less than 1 1-9 10-100 over 100 DK/NA
0 1 2 3 more than 3
DK/ NA
Yes No DK/NA
Yes No DK/NA
Yes No DK/NA
Yes No DK/NA
Yes No DK/NA
Yes No DK/NA
Yes No DK/NA
Yes No DK/NA
Yes No DK/NA
Yes No DK/NA
Yes No DK/NA
Yes No DK/NA
Yes No DK/NA
CMU/SEI-97-TR-008 69

2.3 use documented processes to perform their tasks,
2.4 meet external schedules,
2.5 meet cost estimates,
2.6 provide appropriate training on tools and methods.
3. Do you have any documented processes in manual operation?
3.1 – if ‘Yes’, in what areas are these processes documented?
4. Was a recognized process definition notation used to define the process?
5. If “Yes” please indicate which notation was used:
5. The process design is clearly and completely documented.
6. Functional requirements were used to define tools embedded in the process. 7. Metrics requirements are specified for the process.
8. The target process was either (check one):
• a new process (no prior manual operation),
• operated manually prior to the automation initiative,
• don’t know / not applicable.
If you checked ‘operated manually’ then:
8.1 was the manual process documented?
8.2 was the manual process operated in a stable manner?
9. Process definition (for automation) was more challenging than first thought.
Yes No DK/NA
Yes No DK/NA
Yes No DK/NA
Yes No DK/NA
Yes No DK/NA
requirements management project planning proj. track & oversight
document review software development subcontractor management
quality assurance configuration management document management
defect/anomaly tracking DK/NA other (specify):
Yes No DK/NA
IDEF0 /SADT Role Interaction Nets Role Activity Diagrams
Rummler-Brache StateMate Process Breakdown Structure
ProNet Petri-Net Flow chart
ETVX DK/NA other (specify):
Yes No DK/NA
Yes No DK/NA
Yes No DK/NA
Yes No DK/NA
Yes No DK/NA
Yes No DK/NA
70 CMU/SEI-97-TR-008

E. The development technology.This section deals with the capabilities of the tool that was used to build the process-centered environments. The section should be completed only by those who have knowledge of the implementation technology
1. With which automation tool(s) are you implementing process automation?
For questions 2 through 6, please check the category that you feel is most appropriate:
2. The major strengths of the process automation tool I used are:
2.1 the process development environment,
2.2 debugging capabilities,
2.3 ability to integrate application tools,
2.4 ability to design effective end-user interfaces,
2.5 ability to collect metrics,
2.6 performance (speed of response to end-users),
2.7 cross-platform compatibilities,
2.8 customer support,
2.9 availability of training in the tool,
2.10 documentation,
2.11 ease of use of the development environment,
2.12 cost-effectiveness.
3. Defects in the automation tool affected the development effort.
4. System crashes affected the development effort.
5. It is difficult to recover from system crashes.
6. The automation tool supports a good range of hardware platforms.
Continuus/CaseWare LBMS/Process Engineer CRI/ Life*Flow
ICL/ProcessWise Hewlett-Packard/SynerVision Xerox/InConcert
ADM/MATE Cap Gemini/ProcessWeaver ISI/ ProSLCSE
DK/NA other (specify)
stro
ngly
agre
e
agre
e
disa
gree
stro
ngly
disa
gree
DK
/NA
CMU/SEI-97-TR-008 71

DK
D
F. Transition and adoptionThis section deals with how the automated process was transitioned into use.
1. How long (in months) has it taken to transition the process to the production environment?
2. How long (in months) has the automated process been operating in a production environment (excluding tran-sitioning time)?
3. Training was provided to support:
3.1 implementers of the process-centered environment,
3.2 end-users of the automated process.
Statements 4 through 6 deal with end-users’ involvement in the development process.
4. The process design was developed in conjunction with end-users.
5. The process design was reviewed with the end-users.
6. The end-user screens have been evaluated by the end-users.
7. Process simulations have been performed with the end-users.
Statements 8 through 13 deal with your impressions of end-users’ operational experience.
8. The automated process improves the effectiveness of end-users in performing their task(s).
9 The end-users had difficulty in accepting the new process.
10.The end-users feel ownership towards the automated process.
11 End-users make suggestions to improve the automated process.
12. Metrics have been used to improve the automated process.
13. There was resistance to process automation for the following reasons:
13.1 automation was viewed as externally imposed,
13.2 fear of job loss,
13.3 fear of change,
13.4 the perception that process automation is too controlling,
0-2 2-6 6-12 over 12 (indicate how long) transition not completed /NA
not yet in production 0-2 2-6 6-12 12-24 over 24 (indicate how long) K/NA
stro
ngly
agre
e
agre
e
disa
gree
stro
ngly
disa
gree
DK
/NA
72 CMU/SEI-97-TR-008

13.5 end-users feel that they were not consulted sufficiently in process definition,
13.6 fear that metrics would be used in job evaluations.
Statements 14 through 20 deal with management sponsorship.
14. Senior management is supportive of the process automation project.
15. First-line management is supportive of the automation project.
16. An automation business plan was written
17. A development plan was agreed to by management.
18. The design was reviewed with management.
19. The project has received adequate funding for transitioning.
20. The automation project has a champion with designated authority. 21. The automation initiative came from:
Statements 21 through 23 deal with implementation strategy.
22. A documented transition strategy was developed.
23.A prototyping strategy is being used for implementation. 24. The process model is being implemented:
G. Impacts and InsightsThose automation projects that have progressed far enough will likely have practical insights of considerable value. We wish to capture some of these insights in this section. Respondents who have additional insights, not covered in this section, are encouraged to describe them textually.
1. To date, I consider the process automation project to be a success.
2. Based on my experience, process automation has helped:
2.1 improve end-user productivity. 2.2 improve product quality.
stro
ngly
agre
e
agre
e
disa
gree
stro
ngly
disa
gree
DK
/NA
technical staff management a bit of both DK/NA
all at once in multiple incremental phases other (specify): DK/NA
stro
ngly
agre
e
agre
e
disa
gree
stro
ngly
disa
gree
DK
/NA
CMU/SEI-97-TR-008 73
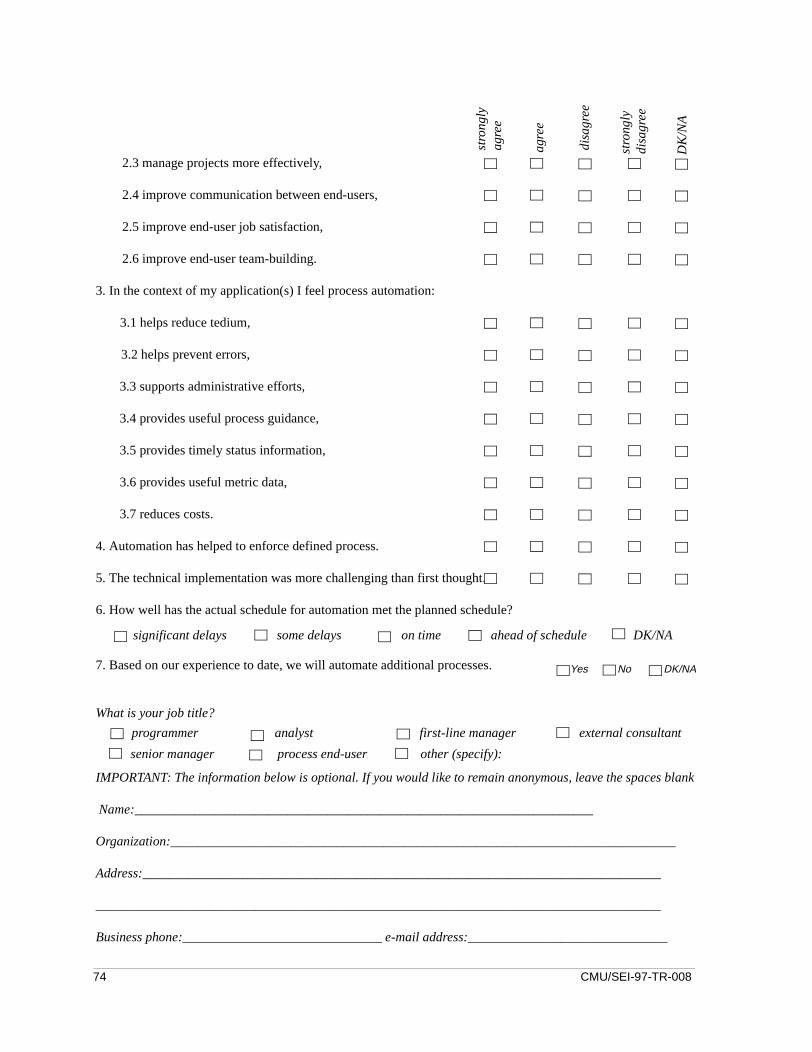
2.3 manage projects more effectively,
2.4 improve communication between end-users,
2.5 improve end-user job satisfaction,
2.6 improve end-user team-building.
3. In the context of my application(s) I feel process automation:
3.1 helps reduce tedium,
3.2 helps prevent errors,
3.3 supports administrative efforts,
3.4 provides useful process guidance,
3.5 provides timely status information,
3.6 provides useful metric data,
3.7 reduces costs.
4. Automation has helped to enforce defined process.
5. The technical implementation was more challenging than first thought.
6. How well has the actual schedule for automation met the planned schedule?
7. Based on our experience to date, we will automate additional processes.
What is your job title?
IMPORTANT: The information below is optional. If you would like to remain anonymous, leave the spaces blank
Name:_____________________________________________________________________
Organization:____________________________________________________________________________
Address:______________________________________________________________________________
_____________________________________________________________________________________
Business phone:______________________________ e-mail address:______________________________
stro
ngly
agre
e
agre
e
disa
gree
stro
ngly
disa
gree
DK
/NA
significant delays some delays on time ahead of schedule DK/NA
Yes No DK/NA
programmer analyst first-line manager external consultant senior manager process end-user other (specify):
74 CMU/SEI-97-TR-008

Please provide additional notes below, to amplify on your responses to the questions. Place the question number (e.g., F.3.1) before each response.
Thank you very much for taking the time to complete the questionnaire.
CMU/SEI-97-TR-008 75

76 CMU/SEI-97-TR-008

Appendix C Procedure Used to Compute Measures of Effectiveness
Several of the plots in Section 3 used variables such as “degree of management sponsorship”(Figure 3-22). The values of these variables are computed from primary variables that reflectactual responses. For example, the variable “degree of management sponsorship” is comput-ed using the responses from questions F.14 through F.20 (see Appendix B). For this set ofquestions, the responses could range from strongly agree to strongly disagree. These catego-ries are given 1 to 4 points. Thus if a respondent answered strongly agree to all the questions,a score of 7*1=7 would result; while if a respondent answered strongly disagree to all the ques-tions, a score of 7*4=28 would result. In this case, 7 and 28 represent the minimum and max-imum scores. This score provides a composite reading on the degree of end-user involvementfor that respondent. The following table defined the basis for scoring associated with each ofthe appropriate figures.
Table C-1: Measures of Effectiveness
Figure No. Description Questions for “degree of...”
Figure 3-9 degree of management effectiveness D.1, D.2 through 2.6
Figure 3-19 degree of end-user involvement F.4 through F.7
Figure 3-22 degree of management sponsorship F.14 through F.20
CMU/SEI-97-TR-008 77

78 CMU/SEI-97-TR-008

Appendix D Position Papers for WorkshopThe position papers appear below in their original form.
D.1 Defining Processes for Automation
Paul Arnold and Dick Phillips, Software Engineering Institute
Automation of a process is the last step in an effort to collect all relevant information to providefor process enactment. There are a number of issues that must be dealt with during the stagesof information gathering to ensure the success of the effort. Automation requires the mostcomplete set of data for the effort to be successful of all the ranges of process work. Key issuesfor a successful effort include
• defining the audience for, and the ultimate user of, the process
• collecting a complete set of data to build a process model
• layout and organization of data to support completeness and easy change for process improvement
• providing key additional data that supports process enactment
• standard formalisms that support the individuals in the performance of work and don't inhibit individuals
• flexible and dynamic properties in tools used to automate/support the process
These issues together with early end-user involvement to get buy-in are critical to the success-ful automation of any process. The process end user should be provided with a concise de-scription of the process in the form of a process guide to help the adoption effort as well astraining in the use of the tools and the process. Adoption and phase in of the use of the newautomated system is dependent upon the complexity of the process being automated. Themore complex and critical a process is to an organization, the more important a phased intro-duction that has been preceded by extensive, end-user familiarization becomes.
D.2 Endeavors: A Process Technology Infrastructure Supporting Incremental Adoption
Gregory Alan Bolcer and Richard N. Taylor, University of California, Irvine
Effective support of day-to-day software development activities is a central goal of many pro-cess automation projects. Success or failure of such efforts is at least dependent on how welladoption issues are addressed. Three of the most common complaints about support technol-ogies across projects are 1) lack of personnel training in the support technologies, 2) inabilityto reuse tools, processes, and objects across projects, and 3) insufficient or underpowered(software) infrastructure to support the actual processes used. Endeavors is an open, distrib-uted, extensible process execution environment designed to address these and other issues.It provides support for incremental adoption, ease of use by multiple stakeholders including
CMU/SEI-97-TR-008 79

both technically and non-technically trained project personnel, and broad customization andreuse.
I. Issues that affect process adoption:
A. Training
1. no incremental adoption policies, technology is pursued as all or nothing solution.
2. difficult to use
3. difficult to learn or train people in:
– object technologies
– client/server or distributed technologies
– programming or process specific languages
4. adoption requires changing work culture:
– technology is seen as getting in the way
– people find ways to get around a poorly implemented process
– use tools they need to accomplish process
– if can’t change or optimize, follow parallel process
5. shortage of talent and skills
6. no support for multiple stakeholders, tools assume only a single user model, limited sup-port for non-technical users
B. Reuse
1. tools are difficult to customize or integrate into a process
2. objects are over-specified and only relevant to particular process or project
– difficult to develop objects that are generic enough to be reused across anorganization
– special case object behaviors is the norm
3. few departments or projects are willing to pay overhead costs that benefit others down theline or are unable to incorporate global costs into project
4. context customization is difficult
C. Infrastructure
1. diverse machines, protocols, languages, software tools; no cross-platform coordination orstandard use
2. performance issues
3. deployment costs, high cost of installing minimum and consistent process tools and tech-nology on every relevant desktop
4. no integration of tools and data through coordinated hyperlinks or processes, i.e., howdoes this fit?
5. processes may not be tightly connected, mobile or disconnected users difficult to support,a lot of work happens offline
80 CMU/SEI-97-TR-008
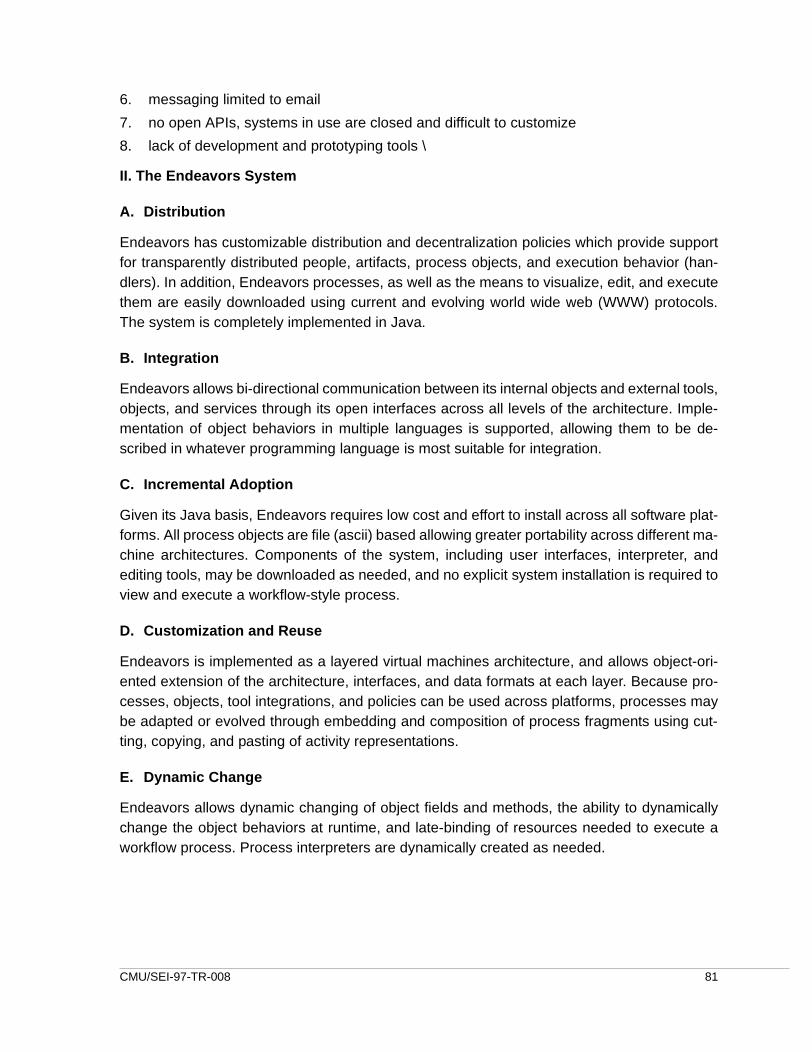
6. messaging limited to email
7. no open APIs, systems in use are closed and difficult to customize
8. lack of development and prototyping tools \
II. The Endeavors System
A. Distribution
Endeavors has customizable distribution and decentralization policies which provide supportfor transparently distributed people, artifacts, process objects, and execution behavior (han-dlers). In addition, Endeavors processes, as well as the means to visualize, edit, and executethem are easily downloaded using current and evolving world wide web (WWW) protocols.The system is completely implemented in Java.
B. Integration
Endeavors allows bi-directional communication between its internal objects and external tools,objects, and services through its open interfaces across all levels of the architecture. Imple-mentation of object behaviors in multiple languages is supported, allowing them to be de-scribed in whatever programming language is most suitable for integration.
C. Incremental Adoption
Given its Java basis, Endeavors requires low cost and effort to install across all software plat-forms. All process objects are file (ascii) based allowing greater portability across different ma-chine architectures. Components of the system, including user interfaces, interpreter, andediting tools, may be downloaded as needed, and no explicit system installation is required toview and execute a workflow-style process.
D. Customization and Reuse
Endeavors is implemented as a layered virtual machines architecture, and allows object-ori-ented extension of the architecture, interfaces, and data formats at each layer. Because pro-cesses, objects, tool integrations, and policies can be used across platforms, processes maybe adapted or evolved through embedding and composition of process fragments using cut-ting, copying, and pasting of activity representations.
E. Dynamic Change
Endeavors allows dynamic changing of object fields and methods, the ability to dynamicallychange the object behaviors at runtime, and late-binding of resources needed to execute aworkflow process. Process interpreters are dynamically created as needed.
CMU/SEI-97-TR-008 81

D.3 Discovery and Validation – Aiding the Deployment of Process Automation
Jonathan E. Cook and Alexander L. Wolf, University of Colorado
Process automation has yet to make a significant impact in real-world application for severalreasons. First, making a single step from no process support to a fully automated process istoo large; second, process automation systems are as yet not flexible enough in allowing ex-ceptions to the model driving the process; and third, there is not enough evidence of benefitfor organizations to implement such a heavy-weight solution.
The first step to support is that of creating the process model. We have developed methodsfor “process discovery” that automatically generate (partial) models of an executing processfrom data collected from that process. This helps lower the barrier of initially developing a for-mal process model.
The second step to support is that of ensuring that the process follows the model or, equally,that the model indeed reflects reality. It is this guidance that process automation has focussedon, by forcing the process to follow the model. With this, steps in the process that do not needhuman input are automatically done, but the problem of exceptions to the model remain.
We have developed a complementary framework for process guidance that measures howclosely the process, as seen through collected data, corresponds to what the model pre-scribes. We call this “process validation.” Our framework assumes that the model cannot rep-resent 100% of the real process and, therefore, that the process must deviate to some extentfrom the model. However, it is also assumed that the model does capture important aspectsof a good process, and it is desirable for a process to agree largely with what the model pre-scribes.
Process validation offers an alternative control model than automation, while not precludingallowing portions of the process to be automated.
We undertook an industrial case study in which the benefits of process validation techniqueswere shown. In our study, we applied the techniques to a set of process executions from arepetitive change-request process, and showed that closer correspondence of the processesto the prescribed model correlated significantly with the quality of the product produced by theprocess.
In summary, process discovery offers assistance in the first step of creating a process model,and process validation offers an alternative control model than process automation to using amodel to guide a process. These techniques have provided evidence of the benefit of formalmodels in a case study, and can thus pave the way for further deployment of all formal modeltechnologies, including process automation.
82 CMU/SEI-97-TR-008

D.4 Introducing Process Technology – An Analogy with the CASE-Tool Industry, the Numbers Game, and Why Things Can Get Better Quickly
Anthony Earl, Software Engineering Institute
In this note I wish to argue that, although it is currently very easy to point to failures in effec-tively applying process technology and to reasons that there are difficult problems to over-come, there are many reasons to believe that the near-future holds some promise for seeingsubstantial improvements. Before discussing some of those reasons, I would like to begin bycomparing some aspects of the CASE-tool industry with the process technology industry tocontrast their histories and states of progress. This will provide some basis for my later claimsthat hope lies around the corner.
A. Lessons from CASE-Tool History
I believe that the current state of the CASE-tool industry reflects two major aspects of its his-tory. The first being the progressive sets of ideas in design approaches from structured designand analysis to the latest use- and pattern-based object-oriented design techniques. Each ofthese generations has changed some of the requirements upon the facilities to be supportedby CASE tools. Each step has also found its followers and dissenters, thus dispersing thechampions and expertise for each approach. The economic aspect of CASE-tool history com-pounds the tool manufacturers’ problems brought about by the evolution of ideas. CASE-toolcompanies have been tiny compared to the giants of the software industry. Their resourceshave always been under pressure, and no runner has gained a substantial financial or techni-cal lead over the pack. Of course, some have fallen by the wayside, only to be replaced byoptimistic new-comers. Justifiably fluctuating consumer confidence has pressured the industryin combination with rapidly changing hardware and software platforms.
Some vendors have fought those pressures by creating meta-tool technology. But this is morecomplex to build and support in many ways. Resources to create the meta-facilities are con-sumed at the expense of providing the specific support for a user’s favorite design method.And user-customization, if not beyond consumer capabilities, is more likely than not to con-sume far too much of their available design-time to be worthwhile.
In many ways, the history of the CASE-tool industry can be seen repeating itself in the earlystages of the Process Technology (PT) industry. The most-primitive graphical process-designapproach, flowcharts, are still the most widely used and supported. The next wave of processdesign books arrived last year and support for them is beginning to appear in the process toolsmarketplace. But are there enough champions to take these better approaches into real-lifeprocess improvement projects and cause them to succeed? The process community lacksanyone with the design-guru status often found in the CASE community. Will the process tech-nology industry repeat the mistakes and suffer the misfortune of the CASE community?
CMU/SEI-97-TR-008 83
B. The Numbers
I think they will make many of the same mistakes and face many of the same problems. Theyare similar in many respects. However there are some key differences. I think it is those differ-ences that will enable the process technology industry to create a more successful market-place. And offer consumers a demonstrably useful set of facilities.
There are some obvious differences between the CASE and process communities, althoughthey are also similar in some ways. Process problems were around since before the age ofsoftware. Before software was being designed, world economics had seen the impact of fo-cusing on process improvement inspired by the quality movement. But it seems a relativelyrecent development to take a computing infrastructure and use it to model, support, and guideprocesses in an effort to make gains over methods of process improvement “by hand.”
This is not the place to fully compare and contrast the history of processes and CASE. Thereare many interesting relationships and interactions that can be identified. But I think there is asingle difference that will easily overshadow all others. Indeed, there is evidence that it alreadyhas. It is the numbers involved. In the following paragraphs I invite the reader to use her or hisown most reasonable numbers. Precision is not important. The critical factor is the scale ofmagnitude of the differences.
Think of all the software being created in the world. Now estimate what percentage of that isbeing designed in any real way. Now reduce that percentage to the amount being designed inany relatively formal way. At this point, I suggest that many such designs are being done withpencil and paper diagrams. Some may be presented better than others with the aid of someword-processors and basic diagramming tools. How many do you think are being supportedby CASE tools? I suggest very, very few. The reasoning is that few organizations can justifythe purchase of software from small producers that requires well-trained individuals in thetechniques and the tools. This is especially true when such software has to meet requirementssuch as supporting their chosen method, running on their chosen development platforms, us-ing version-controlled work-products, and producing configurable output that meets the con-straints of their customer commitments. The effective marketplace for CASE tools is thus verysmall. It may be a viable industry, but it is unlikely to make the headlines.
Now perform a similar reduction of the process technology marketplace. The one major differ-ence is that you start with not just all the software producers in the world, you start with all theorganizations in the world. You still make similar reductions based on analogous constraints,but I suggest that the resulting marketplace size for process technology is orders of magnitudegreater than for CASE technology.
C. Substantial Progress is Evident
So far, I've argued that there are reasons to believe that we should see somewhat better pro-cess technology because the numbers suggest it is a far more attractive place in which tomake progress than the CASE industry. But is there any concrete evidence to suggest that this
84 CMU/SEI-97-TR-008
is anything more than wishful thinking? There follow some reasons that make me believe thatevidence is present.
They say that doctors make the worst patients. Give a software engineer a piece of softwarewith which to improve their performance, and they may spend more time criticizing and abus-ing that software than attempting to use it for its intended purpose. This is despite the fact thatthey are the best equipped, both in infrastructure and training, to take advantages of the tech-nology. The CASE industry suffers from this syndrome. Process technology can be used ef-fectively by a wide range of communities. Benefits are being reported when processtechnology is used for its intended purposes. Once some users see the benefits, others areliable to follow without too much questioning of the underlying implementations.
Until recently, the platform of computing infrastructure required to support process technologyhas been beyond the reach of many industries. Now those platforms are cheaper and morepowerful than ever before. People now expect fast response times and connection to networkseven if they are not working in the corporations of the computer industry. This means that sub-stantial designs of real processes, along with their simulation and enactment become easilypossible on machines costing less than two thousand dollars. And prices are still headingdownwards.
The tools with which to accomplish the tasks referred to above have passed the very earlyadopter stage. Until recently, investing in process technology required being at the bleedingedge. Now the first true generation of process technology is available in a growing market-place. Some tools are gaining good reputations in their partition of the market. Indeed, thecommon partitioning of the market is a clue that progress is being made.
Although the process-based quality movement has been around for many decades, often be-ing overshadowed by the “latest management fads,” the basic message of the importance ofprocess in quality and productivity has rarely been seen to reach the critical mass of aware-ness as it seems to have reached today. It is easy to find articles in the mass media that dis-cuss the importance of process in the industries of today and tomorrow. The importance of thisawareness is that the producers do not have to spend all of their sales resources educatingthe customer-base. They can use it more effectively to explain the particular features and ben-efits of their own technology offerings.
Another recent technological development has occurred that will enable process enactment tobe more efficiently and naturally implemented. Through mechanisms such as CORBA andCOM, tool vendors are able to make their tools more integrable. Process enactment technol-ogy is able to take advantage of these standards without investing much effort in finding subtletechniques (a.k.a. “hacks”) to enable pre-existing tools to work naturally within the semi-auto-mated environment.
Again from the technological angle, there are clearly improvements to process technologyavailable in today's marketplace that were previously unseen except in research projects. Forexample, several tools offer multiple, editable views of the same design that are kept synchro-
CMU/SEI-97-TR-008 85

nized. The graphical support for non-experts is now very good (although it can vary widelyfrom tool to tool), some performing real-time checking as changes are made by the users. An-imated and/or annotated simulations can be run in real-time on cheap, desktop machines orlaptops.
There is still a long way to go. Process technology that covers more than one aspect of theprocess life-cycle is typically quite weak in some areas. While tools that are good in one areaare still designed as though they are the center of the world, making it difficult to integrate theminto an overall solution.
D. Conclusion
This has been a short note with the intent to provoke some thoughts from a particular viewpointand to raise some questions for discussion. I think there are useful lessons to be learned fromboth technological and economic perspectives by comparing CASE technology with processtechnology. The CASE community has clearly not found all the answers to their challenges. Ithink that the greater resources available to the process community will result in moreprogress.
I think that research and theory in the area of process is a long way ahead of the practice. Infact, it may be too far ahead in some respects. We are only now seeing the first real wave ofprocess technology in the general marketplace. We have yet to understand the drawbacks andlimitations of early implementations. We have yet to understand how people can make profit-able use of the technology. And we have yet to see what improvements need to be made tothe technology to make it more effective. It is true that we can add many more features andtechniques from the research communities, but which of these will provide the most usable,acceptable, and profitable benefits to our customers?
D.5 Focal Points for Successful Process Automation
Ed Guy and Carol Klingler, Lockheed Martin Tactical Defense Systems
While it may be fair to say that the process automation community has not achieved the goalswe set for itself, it is also true that the attempt has advanced the state of practice in softwareengineering. We have not introduced breakthrough technologies that have dramaticallychanged the way software is developed, but we have identified some existing technologiesthat can be applied to significant advantage. We have not fostered wide-spread developmentof software engineering environments that embody an organization’s development processes,but we have developed techniques for building such environments from available compo-nents. We have not convinced tool vendors to build tightly integrated, interoperable tool sets,but we have learned how to make effective use of the capabilities they provide. We have notcaused end users to think about their jobs in terms of the process being performed, but wehave learned a lot about how our end users think about their jobs. We have not succeeded infully automating development processes, but we have learned how to provide automated pro-
86 CMU/SEI-97-TR-008

cess support to the people who develop software. We have not failed, we just haven’t learnedto recognize our successes.
A. Focus on automating the exchange of process control and work products amongprocess performers, instead of on controlling the activities of one performer.
The technology exists to achieve any level of process automation desired. Commercial prod-ucts are immature, but given a sufficiently detailed process description, an open tool set, ex-pertise in several programming languages, lots of time and money, we have been able todevelop programs that automate every aspect of a particular development activity. Unfortu-nately, that’s not what the users need. Commercial tools provide capabilities that can guide,control, measure, restrict, or otherwise automate performance of individual process steps,when what users really want is help in managing their interactions with other users, their inter-actions with tools, and interactions between tools. They know how to do their part of the job;they want help handling the interface between their job and someone else’s.
B. Focus on using metaphors that reflect the users’ mental models.
The technology exists to build adequate process-centered environments. No such environ-ment may ever be purchased as an off-the-shelf product because no outside vendor can knowenough about how his potential customers do business to support them all. Various commer-cial products can be used to build process-centered environments that reflect task-driven,product-oriented, tool-oriented, and role-based process models. Unfortunately, the processpresentations used in most of the available tools reflect the way process engineers think aboutprocesses, not the way users think about software development. We try to make users thinkabout their jobs in terms of processes, when we should be thinking about processes in termsof their jobs.
C. Focus on effective integration of tools with the user’s processes, instead ofintegration of the tools, themselves.
The technology exists to achieve effective levels of tool/data integration, but it has been as-sumed that such integration must be done at an infrastructural level to be effective. While in-tegration within the environment infrastructure could solve a great many problems, the degreeof cooperation required of tool developers, or effort required of environment builders is prohib-itive. Effective integration of disparate tools and data can be achieved to a degree that will sup-port the most urgent process support needs of an organization.
D. Focus limited resources on critical processes whose automation can benefitmultiple organizations.
Cost-effective process automation depends greatly on identification of processes or fragmentswhose automation will significantly benefit the development organization. The resources re-quired to fully automate a process make identification of a suitable target critical to the effort.Initially, process automation resources should be concentrated on critical process needs with
CMU/SEI-97-TR-008 87
broad organizational impact. More detailed support can be added incrementally for succes-sively smaller process fragments and more specialized needs.
E. Focus on minimizing tedium and maximizing opportunities for creative work.
Our end-users know enough about what we do to avoid becoming the victims of our mistakes.They are justifiably reticent about embracing process automation, because we have not donea good job of understanding their needs. What the user wants us to do is eliminate the tedious,non-productive, repetitive tasks so he can concentrate on the creative, challenging parts of thejob.
F. Focus on solving real user problems by providing automated process support,rather than automating an abstract process.
We often speak of process automation as if processes had some inherent need to be auto-mated. Automation has no intrinsic value. It is only valuable if it solves a problem or otherwiseremoves an obstacle to effective development.
Process automation is not an end in itself, it is a means to an end. Our goal is to improve theeffectiveness of our development processes by providing automated support to the develop-ers. Process engineering principles and process automation techniques, while invaluable tous, should not be imposed on unsuspecting users. Our challenge is to use process automationto support users in performing their tasks more effectively without getting in their way.
D.6 Some Process Automation Approaches Before Their Time...
Hal Hart, TRW
As with the advent of other recent software technologies (e.g., CASE, AI/smart systems, Ada,IPSEs, perhaps even OO), process automation research and insertion efforts have thus farfallen short of the early hopes and promises. The following two “less-than-successful” phe-nomena of early process-automation activities are identified, and then compared and contrast-ed with analogous endeavors from earlier software innovations. From this we can attempt toextrapolate lessons-learned from those other software technology domains to process auto-mation activities.
(1) Full INTEGRATED life cycle process support automation all at once, & (2) INDEPENDENTmonolithic process-supportive environment frameworks (or, at least, in-control “process man-agers”).
The first is a natural extension of a goal identified in the 1970's (which consumed a large pro-portion of software engineering research resources in the 80's) for project support environ-ments. These provided automation on a common platform for software project activities acrossall life cycle phases (at least the “technical” ones). Emphasis was on tailorable modeling ofeach specific project's data/information needs, seamless transitions and conversions of tech-
88 CMU/SEI-97-TR-008

nical artifacts between life cycle phases, and user access to the environment in styles naturalto project personnel and their domains of discourse (not low-level cryptic commands). Over-ambition, failure to match up well to the most vexing problems encountered by practitioners,and insufficient enabling technology products are possible contributors to the fact that thisgoals is far from achieved in most software production organizations today.
The predecessor of (2) above was thought to be one of those enabling technologies – thetool/operating system independent environment “framework”. It was hoped that this frameworkwould facilitate project modeling and into which tools from multiple vendors could be insertedeasily, hence expeditiously achieving portability and interoperability. The framework wasthought to be key to platform-independence, commonality, and tailorability at the user-inter-face level, and for information integration between tools and activities. Only if those capabili-ties were implemented at the framework level (instead of in individual tools) could the neededuniformity be guaranteed and efficiencies implemented. Alas, environment framework specifi-ers and builders mis-read the tool vendor community's willingness to buy into this strategy, andinstead we see vendors each with expanding breadths of life cycle coverage (i.e., each tryingto provide the entire environment, but with a much more constrained notion of project supportthan the practitioners' needs); and, early framework implementations exhibited the opposite ofhoped-for efficiencies. Hence, real software development projects still realize minimum pros-pects of productivity-enhancing integration between tools from different vendors, and no oneeven considers procuring an environment framework any more.
The talk will identify selected specific projects representing both the cited process-automation“false starts” and the analogous predecessors upon which the observations and lessons-learned are based. As an alternative, a list of separate, pragmatic, real-user process-relatedactivities that are poorly automated (and not addressed much by this community) will beposed.
D.7 What is Impeding Process Automation?
James King, The Boeing Company
A. COST: Long-Term Support
Major companies that utilize software but are not necessarily considered as software compa-nies have concluded that it is not economical to develop and support unique system and soft-ware development tools such as operating systems, compilers, process engines, and processautomation tools. The trend is toward selecting “Open System” tools that provide essentialfunctionality that is maintained by a supplier. Attempts to develop and support “in-house” func-tionality have consistently failed. In some sense this is because the “in-house” solution repre-sents a single point of view while the industry is providing a vast array of solutions. As a result,the “in-house” support is only provided for a short period of time and ultimately abandoned be-cause it could not provide sufficient capability with the modest support provided and rapidly
CMU/SEI-97-TR-008 89

developing global technology. Organizations do not want to support complex software toolsthat are not directly related to the products that the organization produces and markets.
B. ADOPTION: End User Reaction
The end user must perceive value in the use of automated processes. The ultimate user ofprocess automation tends to view the situation as being “yet-another-tool-to-learn.” The userfinds it hard to see any benefit from process automation since it is viewed as restricting theuser's freedom to be creative. This reaction also applies to organizations in a large company.A large company has many different organizations that provide solutions for specific problemsorganized around large projects. These projects are managed from the top of the organizationand have little interaction among themselves. Each organization provides its own unique ap-proach for each project. These organizations react in much the same way as individuals to re-strictions on their freedom of choice. A complicating problem is that the organizations mayhave been in existence for a long period of time and as a result have institutionalized proce-dures and approaches for solving their own unique problems, therefore becoming very resis-tant to change. This resistance is often rooted in the cost necessary to convert to an entirelynew and unproven technology.
The word “automation” implies considerably more than “guidance” to the end user. In general,the end user sees process automation as a threat, not as an assistant or aid. Software pro-cesses are difficult to define when many possible exceptions are considered. The end userviews an automated process as a “Theory X” approach to restricting their job and their abilityto react to exceptions. Developers of automated processes interact organization to organiza-tion, largely with management of other projects but seldom with the real end user. This inter-action exacerbates the end user's impression of having management doing another thing tothe end user resulting in “no control” and “mandated from above” feelings. End users view pro-cess definitions and information as heuristics, not something that must be absolutely followed.
C. IMPLEMENTATION: Process Technology
Process automation technology often is provided by tools that have idiosyncrasies that arehard to learn and not intuitive. “If things are fun (like the Web), they will be adopted.” Howeversimplicity is important. Most people can build HTML home pages and information, few developJava. The major key to acceptability may be whether adaptability of process definitions andautomation is relatively easy to use and, to some extent, under the control of the end user.
90 CMU/SEI-97-TR-008

D.8 Identifying Success Strategies for Software Process Automation
S.J. Leadabrand, Lockheed Martin Vaught Systems
Summary: The present and future demands for software with ever increasing complexity andscope necessitates sophisticated means for its development and maintenance. Technologyadvances in language and design methodologies are rapidly approaching their limits in returnon investment. The next, and potentially last, high-return frontier is process automation. Cur-rent approaches to this automation are based on stove-pipe solutions, and not on a well-de-fined set of requirements accompanied by rigorous design based on a thorough understandingof the total problem. And, to make matters worse, large amounts of capital investment are be-ing poured into these ad-hoc approaches diverting correct solutions to the general problem.But, there is hope since the more general requirements and approaches are beginning to beunderstood. The question is, “Can we solve the general problem in time to prevent disaster?”
Point 1: Unless automation of process significantly reduces life-cycle costs, improves sched-ules (time-to-market) or results in product quality increases, there is no good business casefor doing it. Current approaches are management intensive. They require extensive trainingand maintenance of skill levels by the everyday users. The extent of these problems is so greatthat the currently deficient automation tools are sometimes forced into use, only to be laterabandoned when they cannot support the schedule required for delivering the product(s).
Point 2: Tool vendors jeopardize their existence in undertaking to develop software processautomation given the currently deficient set of requirements. This is presently a risky businessarea with many probable failures.
Point 3: Process automation specification and design is similar to that needed for developmentof a quality software product. Automation of an application within a domain necessitates botha depth of understanding of the domain and of software implementation engineering. In orderto automate the process of development and maintenance of software, it is essential that weboth understand the nature of process itself and be capable of engineering its implementation.As a community, we presently can do neither to the extent that we must.
Point 4: Because of the similarity between software development and implementing its auto-mation, the lessons learned through software development should be extended into processautomation. The following examples illustrate how software-development lessons learnedmay be extended into the process automation domain.
A. Avoid Large Units
Software-Development Lesson: Large units should generally be avoided.
Process-Automation Extension: Large process steps should generally be avoided.
CMU/SEI-97-TR-008 91

Solution: Define a “Quantum Process Step (QPS)” for the process, that is, the smallest pieceof a process step that we wish to consider. Add the requirement that a QPS must be madestable in the Statistical Process Control sense. Usually, a QPS will produce a single outputproduct and frequently will require only a single tool and only one person for its production. Inthe typical development of a software unit of reasonably high quality, about 30 QPSs will berequired. For a medium-sized product of 50K SLOC, assuming 100 SLOC per unit, there willbe 500 units requiring the execution of (50,000/100)*30 or 15,000 QPSs. This illustrates thetrue complexity of software product development and why no one can do it very efficiently orreliably without having automation (in combination with effective organization and defined pro-cesses).
A complete set of QPSs for implementation of a specific process can then be used to modelthe process. This should provide a picture of the resultant expectations in each of the cost,schedule and quality domains. With process automation correctly specified and implemented,the system can automatically collect the cost, duration and quality data for each QPS. Fromthese, statistical process characteristics can be derived.
B. Minimize Coupling
Software-Development Lesson: Internal coupling and other dependencies between unitsshould be minimized.
Process-Automation Extension: Internal coupling and other dependencies between QPSshould be minimized.
Solution: Design QPSs for parallel implementation. Use parallel processing concepts for pro-cess automation. In general, do not couple one QPS to another by embedding the necessityfor completion of a previous QPS to the start-up criteria of another. Instead, enable dynamicprocess flow-control via externally defining start-up criteria in terms of the necessary states ofits inputs. This will enable the QPSs within a total specific process to be easily changed.
C. Decouple the Tools
Software-Development Lesson: Software development tools should not be coupled across thedevelopment process, but should work with products and artifacts produced, or to be producedby different tools from different vendors.
Process-Automation Extension: Process automation implementation tools should not be cou-pled across the process, but should work with a variety of process steps dynamically adaptedas specific-process requirements may change throughout the project.
Solution: The process engine, work-product management, tool management, personnel man-agement functions should be decoupled. This process should not be embedded within theconfiguration management tool, personnel assignments should not be embedded into the toolmanagement function, etc. The total system should appear seamlessly integrated to its users,but should internally consist of totally decoupled parts. We need process-automation tool in-
92 CMU/SEI-97-TR-008

tegration standards before we progress any further toward ad hoc solutions. We need to definethe requirements for the process engine, and other parts of the integrated system in order tomake it possible for vendors to specialize in a piece of the system and thereby survive. Fornow, each piece is sufficiently risky for any one vendor. Biting off the whole at the start almostensures failure at this point. Further, development tools applied directly to the products (e.g.compilers, design, test, analyzers, etc.) should also be decoupled from the process, but builtto work within a process. Again, we need to develop some standards.
D. Understand and Apply the Process Domain
Software-Development Lesson: Successful development of software products requires some-one who understands the application domain sufficiently to formally communicate the soft-ware-product requirements to the designers. The designers must have the capability toengineer the product. The technologists must be capable and sufficiently trained for its imple-mentation.
Process-Automation Extension: Successful process automation requires someone who un-derstands the process domain sufficiently to formally communicate the process-automationrequirements to the designers. The designers must have the capability to engineer the pro-cess. The technologists must be capable and sufficiently trained for its implementation.
Solution: The process domain is mathematical in nature. Mathematics modelers who areknowledgeable in statistical methods and familiar with the development of software productsare needed to quantify the nature of process. (Such individuals are rare.) Engineers capableof interpreting the models need to translate the conceptual nature of process into implement-able constructs for software and other product development applications. Software engineersneed to apply the specific engineering results to the development of software process auto-mation implementations. We’re not there, yet. Instead of allowing ourselves to be pressed intoad hoc solutions and implementations due to “schedule constraints” (typically resulting in lowquality software with inherently high maintenance costs; similarly for process automation), let’sdo the job right!
D.9 Identifying Success Strategies for Software Process Automation
Steve Sorensen, Lockheed Martin Astronautics
I have been involved with several research projects within the last several years dealing withsoftware processes and process automation. There are several reasons why software processautomation has not taken off further than it has within our company.
CMU/SEI-97-TR-008 93

A. Immaturity of software process tools in being able to communicate with eachother.
Our concept of initial software process automation requires process definition and represen-tation, project planning, and work-flow control. We have found no tool that does all of thesefunctions to the extent needed. Therefore, individual tools are employed for each function. Tofacilitate automation, communication of process elements between these tools is highly desir-able. Last year we found that most of the tools do not facilitate this communication. Some toolswere beginning to incorporate translators from their tool to another tool performing a differentfunction, however these were not widely used, readily available or cost-effective. Vendors hadlittle motivation to pursue this.
This research was done in late 1994-early 1995, and I am assuming that tool communicationmaturity has improved within the year. I would be anxious to find out about the state-of-the-artin process tool communication now.
B. Low interest and priority placed on software process automation within uppermanagement.
I used to believe that software process issues could be pushed from the grass-roots level of acompany to effect change. I still believe that research can and should be done at this level, butfor a corporation built on traditional ways of doing business, a software process automationinitiative must be emphasized from upper management. It is difficult for employees to make achange to something new unless they are motivated to do so. This motivation can come frommandates, or from a display of importance by one’s supervisors. In either case, managementmust be on board. Priorities must be set such that research, development and implementationof a software process automation system can proceed without interruptions of funds or tasks.In all those places that I have seen progress in software process automation, managementcommitment has been strong.
To sell management, one must make a business case emphasizing potential cost savings,productivity increases, and a better view into the software development schedule. This caseis best made showing actual results done on a pilot project. I believe pilot projects are criticalin moving automated process environments from experimentation to the implementationstage.
D.10 Identifying Success Strategies for Software Process Automation
Jordan Vause, SEI Resident Affiliate
Software process automation will not work in a community that is only now coming around tothe idea of software process itself.
Any effort to implement an initiative as important or complicated as software process automa-tion in a large company must be predicated by a significant attempt to educate those who will
94 CMU/SEI-97-TR-008

be expected to use its products. In particular, these “end-users” must be told what the tech-nology means to them, how it will affect their work, how they can improve their productivity,how they can increase their skills, and so on. Furthermore, these users must first understandsomething of process theory itself, or else they will have no basis for understanding its auto-mation. Any such effort undertaken without this close attention to the end-user community isdoomed to failure.
Several years ago our company (which shall remain nameless) was swept away on the waveof CASE technology. Large amounts of time, resources, and money, were invested in the de-sign and implementation of a CASE system which would be used throughout the corporation.Regrettably the effort failed, and in retrospect it is not hard to see why. A small cadre of devel-opers and “innovators” had indeed become excited about CASE, and they produced a verygood product, but their progress within the company went almost unnoticed by the vast major-ity of what was to have been the “end-user” community. This is because nobody took the timeto explain why CASE was such a good idea or what it could do for the people who actuallywrote the code and made the money. It seems unnecessary to observe that the system builtat such a cost is not now in use - it died of apathy.
Now, with the evaluation of a tool called IDEF0, our company has begun the first steps towardsimplementing software process automation. I fear that it will all be for naught, however, sincethe engineers on the floor haven’t got a clue about what software process automation means,and in fact have only recently begun to understand the ideas and principles behind the soft-ware processes they are now using manually. Such a mistake should not be duplicated at theindustry level.
CMU/SEI-97-TR-008 95

96 CMU/SEI-97-TR-008
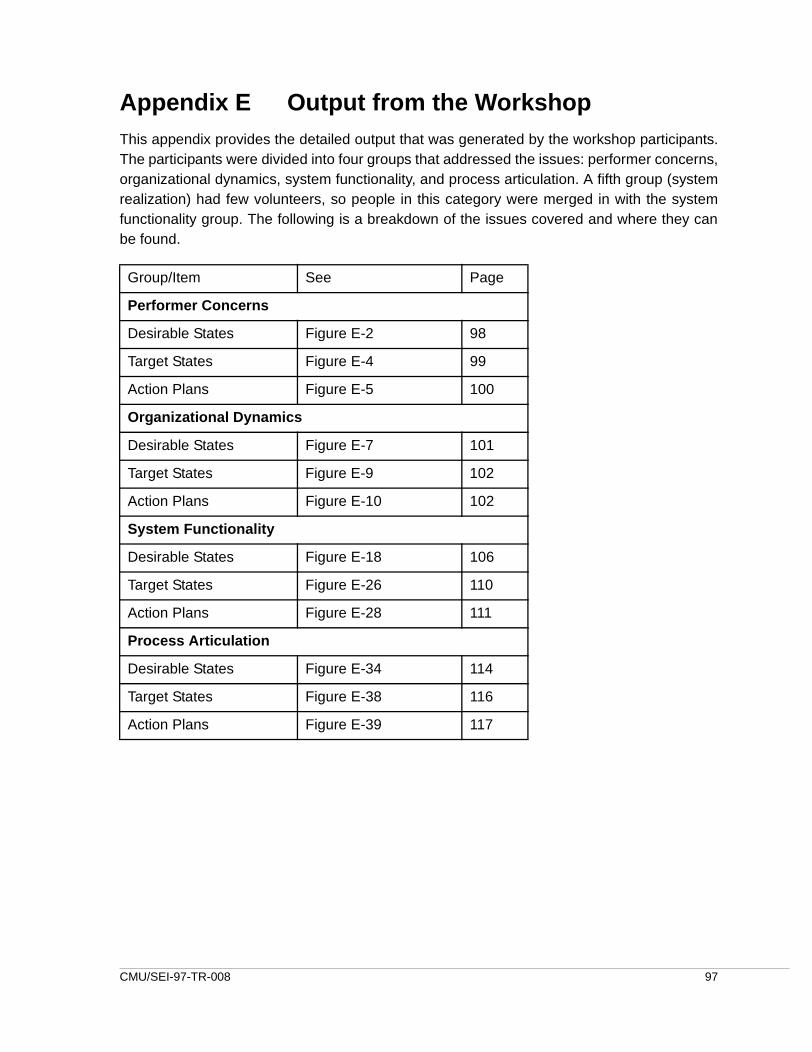
Appendix E Output from the WorkshopThis appendix provides the detailed output that was generated by the workshop participants.The participants were divided into four groups that addressed the issues: performer concerns,organizational dynamics, system functionality, and process articulation. A fifth group (systemrealization) had few volunteers, so people in this category were merged in with the systemfunctionality group. The following is a breakdown of the issues covered and where they canbe found.
Group/Item See Page
Performer Concerns
Desirable States Figure E-2 98
Target States Figure E-4 99
Action Plans Figure E-5 100
Organizational Dynamics
Desirable States Figure E-7 101
Target States Figure E-9 102
Action Plans Figure E-10 102
System Functionality
Desirable States Figure E-18 106
Target States Figure E-26 110
Action Plans Figure E-28 111
Process Articulation
Desirable States Figure E-34 114
Target States Figure E-38 116
Action Plans Figure E-39 117
CMU/SEI-97-TR-008 97

Figure E-1 Issues—Performer Concerns
Figure E-2 Desirable States—Performer Concerns - 1
Performer ConcernsIssues
Allaying Fears of “Something New”• Reluctance, Resistance, Fears of obsolescence, etc.
Addressing Feelings of Constraint• Stifling of creativity and innovation, Failure to support individual
differences, etc.
Handling Fears that System Will Be Intrusive• Disruptive attention to detail, Micro-management, Excessive
management oversight, etc.
Addressing Rejection of “Outside Help”• Pride in experience-based abilities, Suspicion of “expert opinion,”
etc.
Generating Feelings of Ownership
Theme: Performer ConcernsDesirable States
[1] Respect: Process automation supports and fosters
mutual respect within the the organization’s workforce
[2] Benefit: Personnel are motivated to use process
automation and generally report a benefit
[3] Creativity: Process preserves individuality and does not
stifle creativity
[4] Intrusion: Personnel feel that process automation is non-
intrusive
[5] Ownership: Personnel feel they have been involved in
defining the nature and extent of process automation
1
4
1
1
3
Votes
continued ...
98 CMU/SEI-97-TR-008

Figure E-3 Desirable States—Performer Concerns - 2
Figure E-4 Target States—Performer Concerns
Theme: Performer ConcernsDesirable States (continued)
[6] Management: Management actively and firmly sponsors
efforts to improve the organization’s workforce
[7] Appreciation: Efforts to improve the level and scope of
process automation are recognized and rewarded
[8] Measurement: Process automation supports and fosters
appropriate measurement of personnel capability and
productivity
2
0
0
Theme: Performer ConcernsTarget States
[2] Benefit: 80% of the users in the organization say that process
automation helps them do their job
[5] Ownership: 85% of the users feel their contribution affected the
success of process automation
[6] Management: The organization is at CMM Level 2
CMU/SEI-97-TR-008 99

Figure E-5 Action—Performer Concerns
Figure E-6 Issues—Organizational Dynamics
[1] Establish a reward system with specific
criteria for work in process automation
[2] Demonstrate quantifiable benefits withproductivity statistics and other data
[3] Establish a process improvement process
with feedback to originators of suggested
improvements
[4] Achieve CMM Level 2 throughout the
organization
Theme: Performer ConcernsActions
1 2 3 4 5
Organizational DynamicsIssues
Gaining & Maintaining Sponsor Commitment
Managing Cultural Change
Predicting, Demonstrating and Assessing Value
Mitigating Risk
Defining Migration Paths and Piloting
Defining Success Criteria
100 CMU/SEI-97-TR-008

Figure E-7 Desirable States—Organizational Dynamics - 1
Figure E-8 Desirable States—Organizational Dynamics - 2
Theme: Organizational DynamicsDesirable States
16
7
6
[1] Strategic Planning and Success Criteria: The
organization has a strategic plan for process automation
that includes success criteria
[2] Technology Transfer: New technology is systematically
acquired or developed and propagated throughout the
organization
[3] Cultural Change and Trust: The organization is one in
which change is accepted through trust in the
organization’s proven processes
Votes
continued ...
Theme: Organizational DynamicsDesirable States (continued)
5
5
[4] Marketing and Funding: Organizational change and
improvement is actively promoted and well supported
throughout the organization
[5] Sponsorship: All levels of management actively promote
and support organizational change and improvement
CMU/SEI-97-TR-008 101

Figure E-9 Target States—Organizational Dynamics
Figure E-10 Actions—Organizational Dynamics - 1
Theme: Organizational DynamicsTarget States
[1] Strategic Planning and Success Criteria: The organization has a
strategic plan for process automation and reflects: a business
case for process automation and its alignment with theorganization’s goals, 2) process automation success criteria, 3)
the organization’s readiness for process automation, 4) reasons
to automate, and 5) what to automate
[2] Technology Transfer: New technology is systematically acquiredor developed and propagated throughout the organization
[3] Cultural Change and Trust: The organization is one in which
change is accepted through trust in the organization’s proven
processes
[1] Develop a template to allow personnel to
easily provide process automation-related
information
[2] Develop and refine the strategy at offsite
planning sessions attended by sponsors and
process engineers
[3] Gather feedback on current versions of thestrategy from throughout the organization
Theme: Organizational DynamicsActions — “Strategic ...” Target State
1 2 3 4 5
continued ...
102 CMU/SEI-97-TR-008

Figure E-11 Actions—Organizational Dynamics - 2
Figure E-12 Actions—Organizational Dynamics - 3
[4] Develop a phased approach to introducing
process automation
[5] Articulate the rationale for a process-automation strategic plan that gains
management support for the effort
Theme: Organizational DynamicsActions — “Strategic ...” Target State (continued)
1 2 3 4 5
[1] Establish a technology transfer process for
selecting appropriate technology and getting
it used throughout the organization
[2] Form an organization-wide group, and a
supportive infrastructure, to administer the
technology transfer process
[3] Establish external relationships to providechannels for exchanging information
[Software Process Improvement Network
(SPIN), vendors, Web connection, user
groups, Software Engineering Institute, etc.]
Theme: Organizational DynamicsActions — “Technology ...” Target State
1 2 3 4 5
CMU/SEI-97-TR-008 103

Figure E-13 Actions—Organizational Dynamics - 4
Figure E-14 Actions—Organizational Dynamics - 5
[1] Arrange for participation by respected people
in the organization’s Software Process
Improvement (SPI) groups and Software
Process Engineering Groups (SEPGs)
[2] Enroll those who do not have a high degree
of trust in process improvement actions
[3] Identify and enroll middle managementpersonnel who must promote and support
improvement efforts
[4] Collect historical data
Theme: Organizational DynamicsActions — “Cultural ...” Target State
1 2 3 4 5
continued ...
[5] Arrange for a powerful, well-respected
sponsor to champion improvement plans
[6] Initially work with (and through) personnelwho have relatively high degrees of trust that
process change will be beneficial
[7] Establish and maintain high levels of
consistency and integrity with respect toorganizing and institutionalizing process
changes
Theme: Organizational DynamicsActions — “Cultural ...” Target State (continued)
1 2 3 4 5
continued ...
104 CMU/SEI-97-TR-008
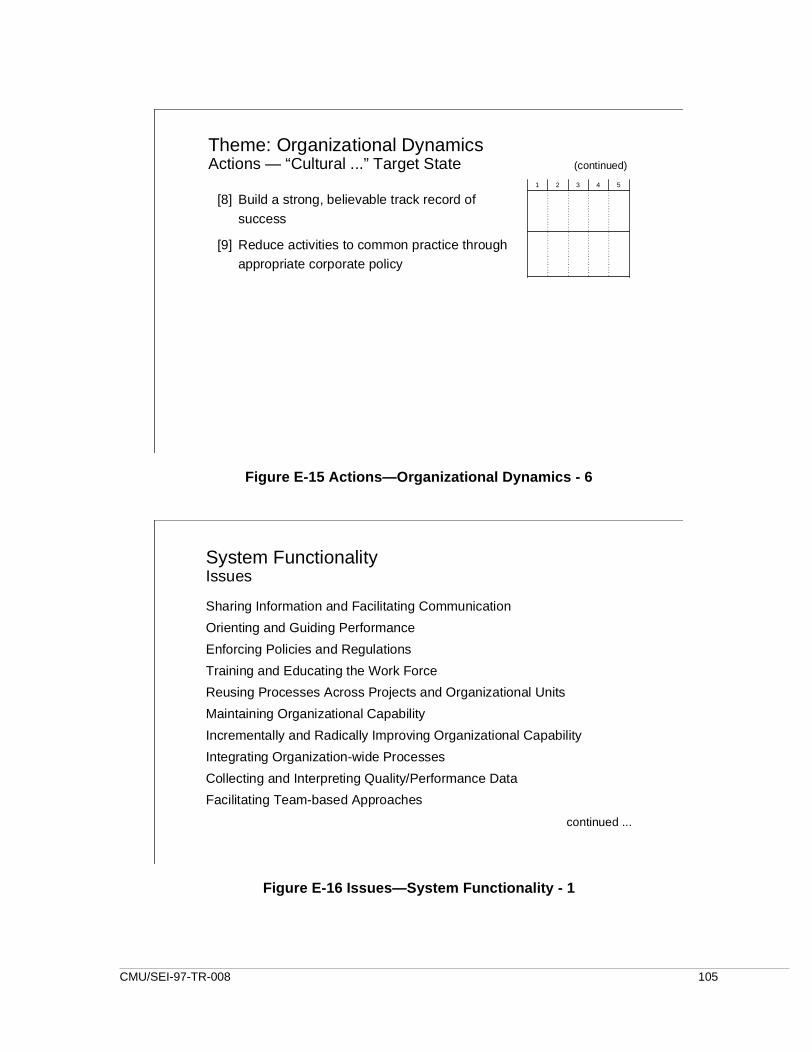
Figure E-15 Actions—Organizational Dynamics - 6
Figure E-16 Issues—System Functionality - 1
[8] Build a strong, believable track record of
success
[9] Reduce activities to common practice throughappropriate corporate policy
Theme: Organizational DynamicsActions — “Cultural ...” Target State (continued)
1 2 3 4 5
System FunctionalityIssues
Sharing Information and Facilitating Communication
Orienting and Guiding Performance
Enforcing Policies and Regulations
Training and Educating the Work Force
Reusing Processes Across Projects and Organizational Units
Maintaining Organizational Capability
Incrementally and Radically Improving Organizational Capability
Integrating Organization-wide Processes
Collecting and Interpreting Quality/Performance Data
Facilitating Team-based Approaches
continued ...
CMU/SEI-97-TR-008 105

Figure E-17 Issues—System Functionality - 2
Figure E-18 Desirable States—System Functionality - 1
System FunctionalityIssues (continued)
Managing Organization’s Infrastructure (People, Resources, etc.)
Providing Differing Views for Various Stakeholders
Providing Decision Support Assistance
Developing Appropriate User Interface
Integrating with Organization’s Management Information System
Supporting Relationships Among Processes
Theme: System FunctionalityDesirable States
[1] Analysis*: Process measurement and analysis — in
particular through simulation — are routine
[2] Marketplace: Process “parts” and fragments are
readily available and they can be used in a “plug &
play” fashion
[3] Marketplace, Adoption: Process-centered
environments can be installed incrementally; they can
also be used incrementally, i.e., simple features can
be used in isolation at first, and more complex
features can be learned and employed as needed
7
7
7/6
* Titles indicate a grouping of Desirable States used to rank order them. Desirable States falling into morethan one group have multiple ranks, one for each group into which they fall.
Votes
continued ...
106 CMU/SEI-97-TR-008

Figure E-19 Desirable States—System Functionality - 2
Figure E-20 Desirable States—System Functionality - 3
Theme: System FunctionalityDesirable States (continued)
[4] Marketplace: A “product line” of adaptable, tailorable
processes is commercially available
[5] Marketplace, Integration: Separate process steps are
independently supported by decoupled facilities
[6] Usability: Process definition tools support describing
coordination among groups
[7] Analysis: Estimation capabilities are an integral part of
process-centered environments
[8] Analysis: Collection of process and product data
capabilities are an integral part of process-centered
environments
7
7/0
4
7
7
continued ...
Theme: System FunctionalityDesirable States (continued)
[9] Marketplace: Process automation facilities support
domain engineering in general and architecture-driven
processes and product line product development in
particular
[10] Analysis: Resource expenditure data collection
capabilities are an integral part of process-centered
environments
[11] Evolution: Process automation fosters a synergy
between processes and products; for example, usage
processes can be embedded in products and processes
can be defined in terms of the products they produce
7
7
3
continued ...
CMU/SEI-97-TR-008 107
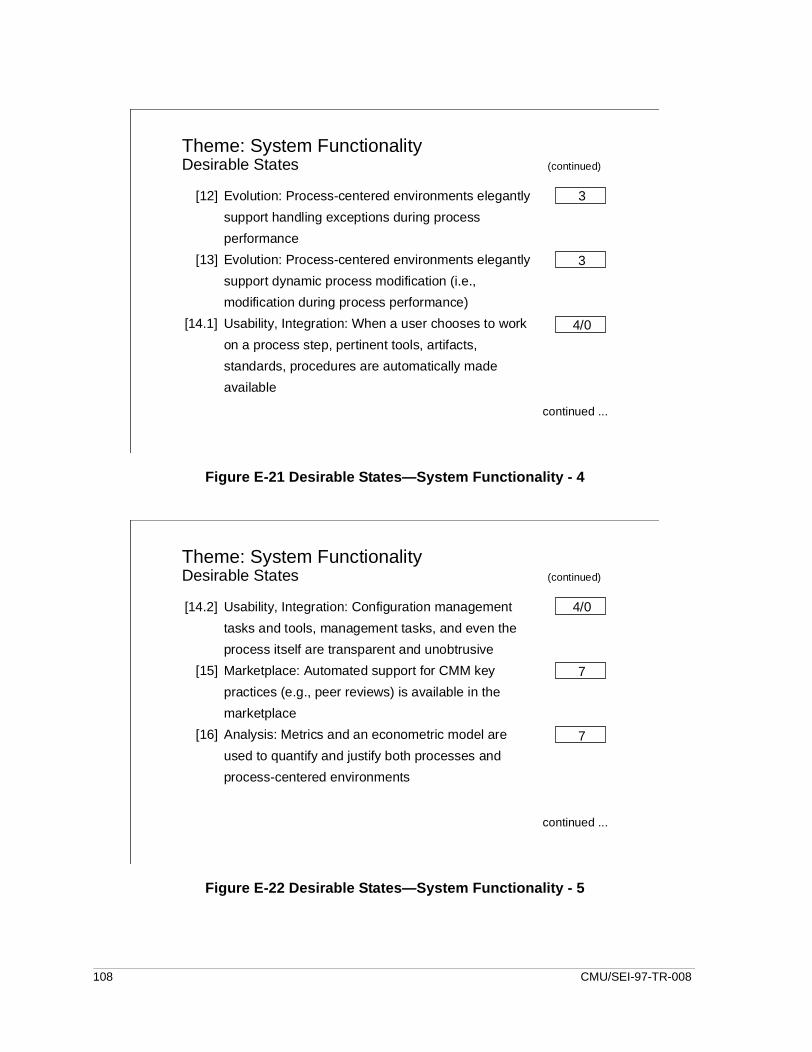
Figure E-21 Desirable States—System Functionality - 4
Figure E-22 Desirable States—System Functionality - 5
Theme: System FunctionalityDesirable States (continued)
[12] Evolution: Process-centered environments elegantly
support handling exceptions during process
performance
[13] Evolution: Process-centered environments elegantly
support dynamic process modification (i.e.,
modification during process performance)
[14.1] Usability, Integration: When a user chooses to work
on a process step, pertinent tools, artifacts,
standards, procedures are automatically made
available
3
3
4/0
continued ...
Theme: System FunctionalityDesirable States (continued)
[14.2] Usability, Integration: Configuration management
tasks and tools, management tasks, and even the
process itself are transparent and unobtrusive
[15] Marketplace: Automated support for CMM key
practices (e.g., peer reviews) is available in the
marketplace
[16] Analysis: Metrics and an econometric model are
used to quantify and justify both processes and
process-centered environments
4/0
7
7
continued ...
108 CMU/SEI-97-TR-008

Figure E-23 Desirable States—System Functionality - 6
Figure E-24 Desirable States—System Functionality - 7
Theme: System FunctionalityDesirable States (continued)
[17] Marketplace: There is a widely-used and well-
understood reference model for process-centered
environments (i.e., the situation is similar to the current
situation for operating systems)
[18] Analysis: Processes are reflexive and self-optimizing
(i.e., they contain steps that concern process change
and improvement)
[19] Marketplace, Integration: Process-centered
environments are “open,” allowing, among other things,
inquiries about status and invocation of functions by
other systems
7
7
7/0
continued ...
Theme: System FunctionalityDesirable States (continued)
[20] Integration: Collaboration among process-centered
environments is possible through the use of well-
defined interaction protocols
[21.1] Adoption, Evolution: Processes have architectures
that can be used to obtain a “top-down”
understanding of their primitive steps
[21.2] Adoption, Evolution: A process’ architecture can be
inferred from considering the process-centered
environment reference architecture and any
refinements made to support the process
0
6/3
6/3
continued ...
CMU/SEI-97-TR-008 109

Figure E-25 Desirable States—System Functionality - 8
Figure E-26 Target States—System Functionality - 1
Theme: System FunctionalityDesirable States (continued)
[22] Analysis: Quality quantification, specification and
tracking are an integral part of a process (similar to
the current situation for cost and schedule)
[23] Analysis: Process-centered environments make
process verification information visible and provide
automated support for process verification
7
7
Theme: System FunctionalityTarget States — The Top Three
[1,7,8,10,16,18,22,23] Analysis: Process measurement
and analysis capabilities
[2,3,4,5,9,15,17,19] Marketplace: Viable, active,
commercial marketplace for process
descriptions and process-centered
environments
[3,21] Adoption: Incremental adoption of
process-centered environments
7
7
6
Votes
110 CMU/SEI-97-TR-008

Figure E-27 Target States—System Functionality - 2
Figure E-28 Actions—System Functionality - 1
Theme: System FunctionalityTarget States — The Other Three
[6,14] Usability: Facilities supporting
individuals and groups
[11,12,13,21] Evolution: Support for evolving
processes over time
[5,14,19,20] Integration: Support for integrating
tools within a process-centeredenvironment and process-centered
environments themselves
4
3
0
Votes
[1] Establish well-integrated size-estimation
capabilities
[2] Develop econometric model to quantify andjustify process automation
[3] Integrate process, product and resource data
collection (effort, schedule and defect)
[4] Develop capability to analyze and model
using measurements to verify (static),
validate (dynamic) and optimize
[5] Automate KPA verification activities for SQA
Theme: System FunctionalityActions — “Analysis” Target State
1 2 3 4 5
CMU/SEI-97-TR-008 111

Figure E-29 Actions—System Functionality - 2
Figure E-30 Actions—System Functionality - 3
[1] (State 14) Develop process-centered
environment reference model
[2] (State 19) Create “open” process-centered
environments
[3] (State 4) Establish an adaptable, tailorable
product line of processes
[4] (State 9) Provide support for domain
engineering in general
Theme: System FunctionalityActions — “Marketplace” Target State
1 2 3 4 5
V1 V2 V3
continued ...
[5] (State 9) Support for architecture-driven
processes
[6] (State 15) Provide automated support for
CMM KPAs
[7] (State 5) Develop ability to independently
support process steps in a decoupled fashion
[8] (State 3) Develop ability to incrementally
install process-centered environments
Theme: System FunctionalityActions — “Marketplace” Target State (continued)
1 2 3 4 5
112 CMU/SEI-97-TR-008

Figure E-31 Actions—System Functionality - 4
Figure E-32 Issues—Process Articulation - 1
[1] Provide product and process measurement
support for use during manual process
enactment (without automation)
[2] Support deployment, integration, automation
and evolution of partial process models
[3] Support automation of generic processes
that are detailed and evolved during processenactment
Theme: System FunctionalityActions — “Adoption” Target State
1 2 3 4 5
Process ArticulationIssues
Obtaining Consensus on Details
Allowing Variation, Tailoring and “Shortcuts”
Clarifying Boundaries Between Major Organizational Processes
Reducing Apparent/Real Complexity
Defining Assumptions and Boundaries of Applicability
Flagging Assumption Violations
Fostering and Facilitating Rework, Work-ahead and OpportunisticActivities
Fostering and Facilitating End-user Involvement in Design andImplementation (e.g., GUI Design)
continued ...
CMU/SEI-97-TR-008 113

Figure E-33 Issues—Process Articulation - 2
Figure E-34 Desirable States—Process Articulation - 1
Process ArticulationIssues (continued)
Balancing Flexibility with Encouragement and Enforcement
Supporting Process Evaluation
Supporting User Involvement in Modeling
Allowing Process Inference
Describing Relationships Across Process Boundaries
[1] Tailorability: Generic organizational processes easily
tailored to specific project settings within six weeks
[2] Flexibility: Experts can modify, or even ignore, the
official process
[3] Enforcement: Personnel will be punished for not
following the “official” process
[4] Selection: Guidelines exist for selecting processes to
define and automate
[5] Granularity: Guidelines exist for determining
appropriate level of detail in process descriptions
Theme: Process ArticulationDesirable States
5
0
1
1
1
Votes
continued ...
114 CMU/SEI-97-TR-008

Figure E-35 Desirable States—Process Articulation - 2
Figure E-36 Desirable States—Process Articulation - 3
[6] Architecture: Capability exists to describe process
architectures, in particular, the relationships among
processes
[7] Reuse: Reuse of process components and
composition of processes from components are
supported, common practices [not feasible with the
next five years]
[8] Notations: “Next generation” notations are in common
use and well-supported with tools; IDEF is not
commonly used; notations allow clear, unambiguous
process descriptions
Theme: Process ArticulationDesirable States (continued)
0
1
5
continued ...
[9] Complexity: Capabilities exist to manage process
description complexity (e.g., role-oriented, editable
views; multiple notations are available; notations can
be used in tandem; etc.) [the cost of achieving this
state is high]
[10] Work Ahead and Rework: Notations (and automation)
can easily accommodate work ahead, rework,
conditionality, etc.
[11] Integrated Management: Project management
activities are an integrated part of an overall process
description
Theme: Process ArticulationDesirable States (continued)
0
1
4
continued ...
CMU/SEI-97-TR-008 115

Figure E-37 Desirable States—Process Articulation - 4
Figure E-38 Target States—Process Articulation
[12] Evaluation: Managers commonly make process-
related decisions based on business goals and
quantitative information obtained, in part, through
simulation
Theme: Process ArticulationDesirable States (continued)
4
[1] Tailorability: Generic organizational processes easily tailored to
specific project settings within six weeks
[8] Notations: “Next generation” notations are in common use and
well-supported with tools; IDEF is not commonly used; notations
allow clear, unambiguous process descriptions
[11] Integrated Management: Project management activities are an
integrated part of an overall process description
[12] Evaluation: Managers commonly make process-related decisions
based on business goals and quantitative information obtained, in
part, through simulation
Theme: Process ArticulationTarget States
116 CMU/SEI-97-TR-008

Figure E-39 Actions—Process Articulation - 1
Figure E-40 Actions—Process Articulation - 2
[1] Pilot trial versions of process tailoring
capabilities
[2] Provide ability to find and inspect exampleprocess descriptions along with information
about the context in which they have been
used
[3] Create a Process Control Board and a cyclicprocess for its operation
[4] Develop a reward system for suggestions
about improving processes through tailoring
Theme: Process ArticulationActions — “Tailorability” Target State
1 2 3 4 5
[1] Determine requirements for the next
generation of process description notations
[2] Identify factors affecting the understandabilityof process descriptions
[3] Sensitize process engineers to the variety of
alternative notations
[4] Develop standards for process descriptions
and process description notations
[5] Develop ability to tailor meta-tools to specific
process description notations
Theme: Process ArticulationActions — “Notations” Target State
1 2 3 4 5
CMU/SEI-97-TR-008 117

Figure E-41 Actions—Process Articulation - 3
Figure E-42 Actions—Process Articulation - 4
[1] Educate project managers about the
necessary and appropriate relationships
between management tasks and the tasks in
a managed process
[2] Educate process engineers about including
project management-oriented tasks in all
process descriptions
[3] Integrate process technology and project
management technology
Theme: Process ArticulationActions — “Integrated Management” Target State
1 2 3 4 5
[1] Develop guidance for managing process
change
[2] Conduct piloting and case studies to
generate value-demonstrating examples
[3] Reward managers who routinely manage
their projects’ process based on data (and
punish those who don’t)
[4] Develop a repository of appropriate data
[5] Foster use of simulation-based systems for
learning how to quantitatively manage
software projects
Theme: Process ArticulationActions — “Evaluation” Target State
1 2 3 4 5
118 CMU/SEI-97-TR-008
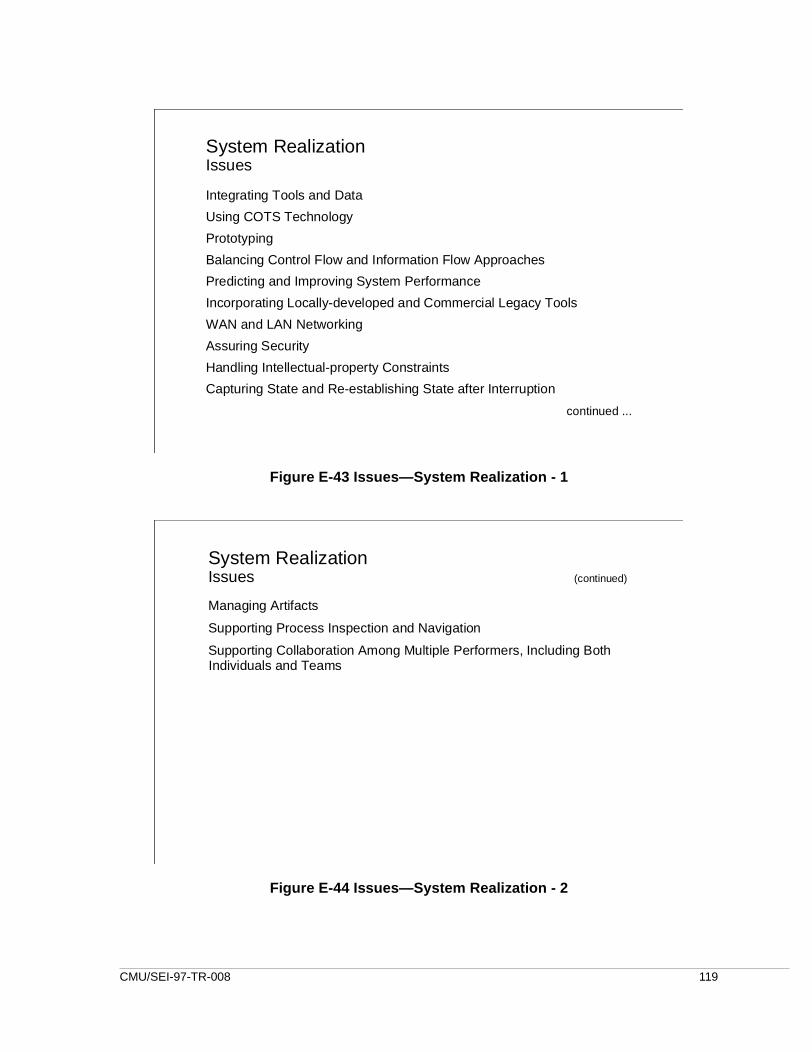
Figure E-43 Issues—System Realization - 1
Figure E-44 Issues—System Realization - 2
System RealizationIssues
Integrating Tools and Data
Using COTS Technology
Prototyping
Balancing Control Flow and Information Flow Approaches
Predicting and Improving System Performance
Incorporating Locally-developed and Commercial Legacy Tools
WAN and LAN Networking
Assuring Security
Handling Intellectual-property Constraints
Capturing State and Re-establishing State after Interruption
continued ...
System RealizationIssues (continued)
Managing Artifacts
Supporting Process Inspection and Navigation
Supporting Collaboration Among Multiple Performers, Including BothIndividuals and Teams
CMU/SEI-97-TR-008 119

120 CMU/SEI-97-TR-008

Appendix F Workshop Participants
Name Email
Paul Arnold [email protected]
Gregory Bolcer [email protected]
Kenneth Caudle [email protected]
Alan Christie [email protected]
Gary Coleman [email protected]
Jonathan Cook [email protected]
John D’Anniballe [email protected]
Vickie Dlugos [email protected]
Linda Drapela
Kerry Frederick
David Fugate [email protected]
Renu Gupta [email protected]
Charles Guy [email protected]
Tony Henderson
Clifford Huff [email protected]
Rhonda Jacobsen [email protected]
Nathaniel Johnson [email protected]
Marc Kellner [email protected]
James King [email protected]
Carol Klingler [email protected]
David Kuchler [email protected]
Larry LaBruyere [email protected]
Stephen Leadabrand [email protected]
Linda Levine [email protected]
Gururaj Managuli [email protected]
Joseph McNeer [email protected]
Franklin Nixon [email protected]
Michael Pait [email protected]
Samuel Redwine [email protected]
CMU/SEI-97-TR-008 121

James Reeb [email protected]
William Riddle [email protected]
Jennifer Scranton [email protected]
David Shepard [email protected]
Pamela Sisson [email protected]
F. Michael Tillman [email protected]
Stephen Tucker [email protected]
Jordan Vause [email protected]
Richard Werling [email protected]
Jean Wieland [email protected]
Kathryn Williams [email protected]
122 CMU/SEI-97-TR-008

References
[Christie 96] Christie, A., et al. Software Process Automation: Experience from theTrenches (CMU/SEI-96-TR-013, ADA310916). Pittsburgh, PA: Soft-ware Engineering Institute, Carnegie Mellon University, 1996.
[ISO 91] Quality Management and Quality Assurance Standards—Part 3:Guidelines for the Application of ISO-9001 to the Development, Sup-ply and Maintenance of Software. Geneva, Switzerland: InternationalOrganization for Standardization, 1991.
[Paulk 93] Paulk, M. C., et al. The Capability Maturity Model for Software, Ver-sion 1.1 (CMU/SEI-93-TR-24, ADA 263403). Pittsburgh, PA: Soft-ware Engineering Institute, Carnegie Mellon University, 1993.
CMU/SEI-97-TR-008 123

124 CMU/SEI-97-TR-008
ll
REPORT DOCUMENTATION PAGE Form ApprovedOMB No. 0704-0188
Public reporting burden for this collection of information is estimated to average 1 hour per response, including the time for reviewing instructions, searching existing data sources, gathering and maintaining the data needed, and completing and reviewing the collection of information. Send comments regarding this burden estimate or any other aspect of this collection of information, including suggestions for reducing this burden, to Washington Headquarters Services, Directorate for information Operations and Reports, 1215 Jefferson Davis Highway, Suite 1204, Arlington, VA 22202-4302, and to the Office of Management and Budget, Paperwork Reduction Project (0704-0188), Washington, DC 20503.
7. AGENCY USE ONLY (leave blank) 8. REPORT DATE
October 1997
9. REPORT TYPE AND DATES COVERED
Final
10. TITLE AND SUBTITLE
Software Process Automation: Interviews, Survey, and Workshop Results
11. FUNDING NUMBERS
C — F19628-95-C-0003
12. AUTHOR(S)
A. Christie, L. Levine, E. Morris, B. Riddle, D. Zubrow, T. Belton, L. Proctor, D. Cordelle, J. Ferotin, J. Solvay
13. PERFORMING ORGANIZATION NAME(S) AND ADDRESS(ES)
Software Engineering InstituteCarnegie Mellon UniversityPittsburgh, PA 15213
14. PERFORMING ORGANIZATIONREPORT NUMBER
CMU/SEI-97-TR-008
15. SPONSORING/MONITORING AGENCY NAME(S) AND ADDRESS(ES)
HQ ESC/AXS5 Eglin StreetHanscom AFB, MA 01731-2116
16. SPONSORING/MONITORING AGENCY REPORT NUMBER
ESC-TR-97-008
17. SUPPLEMENTARY NOTES
12.a DISTRIBUTION/AVAILABILITY STATEMENT
Unclassified/Unlimited, DTIC, NTIS12.b DISTRIBUTION CODE
13. ABSTRACT (maximum 200 words)
This report describes the results of a two-year study of experiences with the adoption and use of software process automation. The work was motivated by a desire to provide insights and guidelines to those planning to implement this technology. The focus of the study was primarily, but not exclusively, on end-user organizations. The study was conducted in three stages: First, in-depth interviews were conducted to assess the state of the practice. Second, a survey questionnaire was distributed to a wider number of organizations to obtain more quantitative data. The populations in these two groups turned out to be quite different—a fact that we believe enriches the content of this report. Finally, a one-day workshop was held, the objective of which was to explore with practitioners why the gap between the theory and practice of software process automation is as large as it is. A previous report by Alan Christie, et al. [Christie 96] documented the results of the in-depth interviews in detail. This report now summarizes the results of the interviews, and describes in more detail the questionnaire survey and the workshop. It also provides both insight for process automation tool developers and guidelines for adoption to process-automation end users.
14. SUBJECT TERMS
interviews, process automation, questionnaire, technology adoption, workshop
15. NUMBER OF PAGES
12416. PRICE CODE
17. SECURITY CLASSIFICATION OF REPORT
UNCLASSIFIED
18. SECURITY CLASSIFICATION OF THIS PAGE
UNCLASSIFIED
19. SECURITY CLASSIFICATION OF ABSTRACT
UNCLASSIFIED
20. LIMITATION OF ABSTRACT
UL
NSN 7540-01-280-5500 Standard Form 298 (Rev. 2-89)Prescribed by ANSI Std. Z39-18298-102
