software tool for the analysis of electromagnetic … catalonia institute for energy research...
TRANSCRIPT

European Association for the Development of Renewable Energies, Environment and Power Quality (EA4EPQ)
International Conference on Renewable Energies and Power Quality (ICREPQ’10)
Granada (Spain), 23rd to 25th March, 2010
Software tool for the analysis of electromagnetic disturbances propagation
M. Chindris1, A. Cziker1, A. Miron1, A. Sumper2,3, A. Sudrià-Andreu2,3 and R. Villafafila-Robles2
1 Department of Power Systems Electrical Engineering Faculty, Technical University of Cluj-Napoca
15th C. Daicoviciu Street, 400020 Cluj-Napoca (Romania) Phone number:+0040 264 401451, e-mail: [email protected], [email protected],
2 Universitat Politècnica de Catalunya, Centre d'Innovació Tecnològica en Convertidors Estàtics i Accionaments; (CITCEA-UPC), Departament d'Enginyeria Elèctrica.
EU d'Enginyeria Tècnica Industrial de Barcelona. Comte d'Urgell, 187; 08036 Barcelona, Spain; Email: sudriá@citcea.upc.edu; [email protected]; [email protected]
3 Catalonia Institute for Energy Research (IREC); C. Josep Pla 2, B2, planta baixa, 08019 Barcelona, Spain.
Abstract. The analysis of the conducted electromagnetic disturbances propagation is a complex issue, involving detection and analysis of electromagnetic disturbances, modelling of power grids’ elements, and study of the influence on the grids’ elements (electric lines and power transformers) of the existing disturbances.
The paper presents a software tool for analyzing the propagation of electromagnetic disturbances. It was implemented as a virtual instrument developed in the graphic programming environment LabVIEW, and helps for the study of propagation of harmonic and unbalanced current/voltages, over-currents and voltage dips caused by common faults in radial distribution power grids.
Key words Electromagnetic disturbances, virtual instrumentation, disturbances propagation, real operating state 1. Introduction The knowledge of power quality indices in all common coupling points of the distribution power grids has become very important in the last decades. This is especially due to the following aspects: (i) new standardized thresholds for power quality were imposed; (ii) the modern appliances and electronic equipment are very sensitive to the quality of power supply; (iii) the components of distribution grids are negatively influenced by the electromagnetic disturbances. The consideration of harmonic unbalanced currents and voltages is important during the analysis of steady-state operation as they increase the power and energy losses, introduce supplementary currents in the neutral conductor, etc.; consequently, proper measures have to be
taken into consideration so as to minimize all these negative effects of electromagnetic disturbances. In order to establish the accurate values of power quality indices in real power systems, a lot of complex measurements have to be performed at the same time; it is obvious that, for technological and economical reasons, it is almost impossible to accomplish this task. On the other hand, the complexity of electromagnetic phenomena imposes laborious and fineness activities for a truthful modelling of power system elements and of electromagnetic phenomena appearing in power systems. Because of these reasons, the development of software tools enabling the analysis of power quality aspects in the modern power systems is very appropriate. Therefore, the main objective of this work is to present the study of propagation of typical electromagnetic disturbances (basically harmonic distortion, unbalance, and voltage dips) in distribution power grids, using a dedicated software tool. The analysis of disturbances propagation is a complex issue, involving detection and analysis of electromagnetic disturbances, modelling of power grids’ elements, and study of existing disturbances influence upon the grids’ elements. The software tool described in the paper is a virtual instrument developed for analyzing the propagation of electromagnetic disturbances. It helps for the study of propagation of harmonic and unbalanced current/voltages, over-currents and voltage dips caused by common faults in radial distribution power grids. The paper refers the following aspects: theoretical support of the software tool, description of the created virtual instrument and its usage, ending with a section of

conclusions where the importance of developed virtual instrument is underlined. 2. Theoretical support The propagation of electromagnetic disturbances in power grids is influenced by grid’s topology and elements; it also depends on the type of the disturbance (harmonics, unbalance, voltage dips, etc.). As a result, the power quality indices have different values in miscellaneous points of the power grid if comparing with the PQ indices detected in the disturbance injection point. The supply of non-linear loads causes the appearance of harmonic currents that, in turn, determine harmonic voltages. The harmonic currents propagate from the injection point through the grid elements (electric lines and transformers); this phenomenon depends on transformer’s type, grid configuration, etc. On other hand, unbalanced loads enforce an unbalanced 3-phase system of currents that get through the grid impedances, causing different voltage drops on each phase and consequently an unbalanced voltage system. The superposition of these two disturbances implies a real operating state that is non-sinusoidal and unbalanced; this state influences the elements of the power grid that are located at different voltage levels. In this real operating state of the power grids, different overloads or faults cause over-currents and consequently, voltage dips. These disturbances also propagate through the power grid, their characteristics being influenced especially by the power transformers. Further on, the analysis methods regarding the propagation of these three main electromagnetic disturbances (harmonics, unbalance and voltage dips) are presented. A. Voltage dips propagation A voltage dip that appears at a voltage level propagates at the same voltage level, at higher voltage levels and/or lower voltage levels, too. The propagation at lower voltage levels takes place without a considerable change in amplitude; in contrast, the voltage dips that propagate upstream the source point suffer a decrease in the amplitude. The first step in the propagation analysis of voltage dips imposes the knowledge of dips characteristics; then it follows the study of the grid elements influence on voltage dip characteristics and vice-versa. Considering only the electric lines and transformers, the last ones have the biggest influence on the voltage dips propagation. The power transformers working on the power grids have different connections that influence the voltage dips; as a result, a voltage dip that propagate downstream, from the high voltage to the low voltage side of a transformer, has different characteristics in the primary if compares with the secondary. An accurate analysis of transformers influence upon the voltage dips propagation is made in
[Zhang, 1998]; in accordance with this study, transformers can be devided in three categories: 1). Transformers for which every secondary voltage is
the difference between two primary voltages. This category includes transformers with connections Dy, Yd and Yz.
2). Transformers that eliminates only the zero sequence components; this model applies for transformers with group connections YNy and Yyn, and Dd, Dzn, respectively;
3). Transformers that do not modify the voltage. For this kind of transformers, the secondary voltage (p.u.) is equal with the primary voltage (p.u.). This category encompasses transformers with YNyn connection.
B. Unbalance propagation In the analysis of the propagation of unbalanced voltages and/or currents, the sequence components theory was used. Applying this theory, and taking into account the characteristics of sequence components belonging to the power system elements, any power grid can be seen as three sequence independent grids: positive, negative and zero sequence, respectively. Fig. 1 illustrates a power grid along with its three sequence components.
Fig. 1. Decomposition of a power grid in its sequence components
Observation – in Figure 1, the grid parameters are in p.u. On the other hand, the power systems analysis supposes to establish the mathematical models of power grid elements; in this work, the electric lines and transformers have been also modelled considering the sequence components theory. The positive and negative impedances have the same values in the case of electric lines and power transformers, as follows: the electric line impedance at
G1 G2T1 T2electric lines
YNyn YNd
N+
VG1
Z
+
Z Z Z
Z
V
+
+ + +
+
+G2
G1
T1 L T2
G2
N-
Z
Z Z Z
Z-
- - -
-G1
T1 L T2
G2
N0
Z
Z Z
Z Z0G1
T1 L
T2 G2
0 0
00

rated voltage; the short-circuit impedance for power transformers. The electric lines zero sequence impedance depends on their type (cable or overhead line), configuration, respectively. The transformers zero sequence impedance depends on the nominal rating, magnetic circuit type and connection configuration. If the propagation of conducted disturbances is of interest, the unbalanced voltages and currents propagate totally along the electric lines; the only grid element influencing this phenomenon, are the power transformers. The positive and negative sequence components of power transformers behave in the same way, irrespective of magnetic core type and the connection scheme. The mathematical formula showing the relationship between the sequence voltages and currents are:
aUU
aUU
UkZIU
AC
AB
aAA
⋅=⋅=
⋅+⋅=
−+−+
−+−+
−+−+−+−+
//
2//
////
(1)
where k is a parameter depending on the transformer
connection, −+ /,, CBAU - positive/negative primary phase-to-
earth voltages, −+ /,, cbaU - positive/negative secondary
phase-to-earth voltages, −+ /Z - positive/negative
transformer impedance, −+ /AI - positive/negative sequence
currents that flow through the primary windings and are characterized by the following mathematical relationships:
.1
,1 −−++ ⋅=⋅= a
TAa
TA I
nII
nI (2)
In (2), +aI and −
aI are the positive and negative sequence
currents from the secondary winding, and Tn is the
transformer ratio. The zero sequence components of secondary currents produce important magnetic fluxes only if they can appear on the primary side, too. If the zero sequence secondary currents can appear in the transformer primary windings, from the point of view of this sequence component, the primary side is in short-circuit; consequently, the magnetic fluxes produced are insignificant, and they can be ignored. The zero sequence impedance, 000 XjRZ ⋅+= , has big
values in the case of three single-phase transformers and shell-core type transformers; for three-core types transformers, the zero sequence impedance has small values. The following formula can be used:
00
00
0000
AC
AB
aAA
UU
UU
UKZIU
==
⋅+⋅= (3)
where 0,, CBAU and 0
,, cbaU are the zero sequence primary
and secondary voltages, 0Z - the zero sequence transformer impedance;
0AI - the primary zero sequence current.
The usage areas of transformers can be established taking into consideration the behaviour of transformers with different connection schemes under unbalanced operating states, as follows: 1). Yy – for distribution in the case of decreasing or
increasing voltage transformers; 2). Dyn, Yzn – at power transformers used in domestic
and public lighting distribution, when the neutral conductor is 100% loaded for single-phase loads;
3). Yd – at power transformers in three-phase energy transport;
4). Yyn – for domestic distribution, only if there is a tertiary winding.
C. Harmonics propagation The level of voltage distortion in a specific point of the distribution power grid depends on the interaction between the system impedance at the characteristic frequency of the harmonic current sources, and the magnitude of these currents, respectively. In the analysis of harmonic propagation, the harmonic sources are considered to be constant; consequently their magnitude and phase are invariable in time. The power flow was performed using an iterative method known as the backward/forward sweep. In the proposed software tool, the iterative method was adapted to take into consideration the unbalanced operating state existing in the actual distribution power networks. This kind of approach supposes a three-phase modelling of the grid elements, in view of the fact that the electric quantities can be different for the three phases. In the propagation study the following assumptions have been accepted: (i) the electric lines and power transformers are linear elements, thus they do not cause harmonic currents or voltages; (ii) the consumers are considered invariant harmonic current sources (this means that the harmonic order, magnitude and phase do not vary in time); (iii) the distribution system is supplied with a symmetric system of sinusoidal voltages. The harmonic currents produce voltage drops that influence the supply voltage; therefore the voltage at different buses will not be sinusoidal. The voltage drops can be calculated using the following relationships:
.
,111
hhh IZU
IZU
⋅=∆⋅=∆
(4)
If the transformer primary voltage is Up, then the voltage at the load bus, Ul, is:
.UN
UU P
l ∆−= (5)
Where N is the transformer’s ratio, ∆U is the sum of the voltage drops on the grid elements that are downstream from the considered point. Due to the fact that the propagation analysis is made at different voltage levels, the electric quantities are transformed in relative values (using the per unit method). The harmonic propagation under an unbalanced operating state is studied considering that each three-phase harmonic current system can be decomposed in three independent sequence systems. As a conclusion to the entire theoretical support regarding the studied electromagnetic disturbances, the following remarks can be underlined: 1). The harmonic currents propagate from the distorted
consumer to the entire distribution grid. The power transformers that have Dyn, Yzn, YNd connections remove the triplen harmonics (if the three-phase current system is balanced). When the harmonic currents propagate downstream, their amplitudes do not change;
2). The values of the harmonic voltages depend on the frequency response of the power grid elements (harmonic impedance) and on the possible resonance phenomenon;
3). The unbalanced currents and voltages decrease when they propagate upstream and pass through transformers with Dyn, Yzn, YNd connections. If they propagate downstream, the magnitudes of the unbalanced voltages do not change and the unbalance factor remains the same as in the upper point;
4). If the voltage dips propagate upstream from the injection point, their amplitude decreases (rises the voltage amplitude); when they propagate downstream there are no considerable changes in dip’s characteristics. Taking into consideration the grid elements, the transformers influence the voltage dips characteristics; for instance, double-phase dips can change in single-phase dips depending on transformers connections;
5). Under unbalanced operation conditions, the harmonic currents and voltages propagate according to the same rules, but in this case the effects of unbalance will be superposed and users are supplied with an unbalanced system of non-sinusoidal voltages. In this situation, the propagation of voltage dips is analyzed considering as reference values the ones that characterize the existing real operating state. Consequently, in the case of unbalanced voltage dips, the unbalanced state is increased; on the other hand, the same propagation rules are followed as in ideal operating state (sinusoidal and balanced).
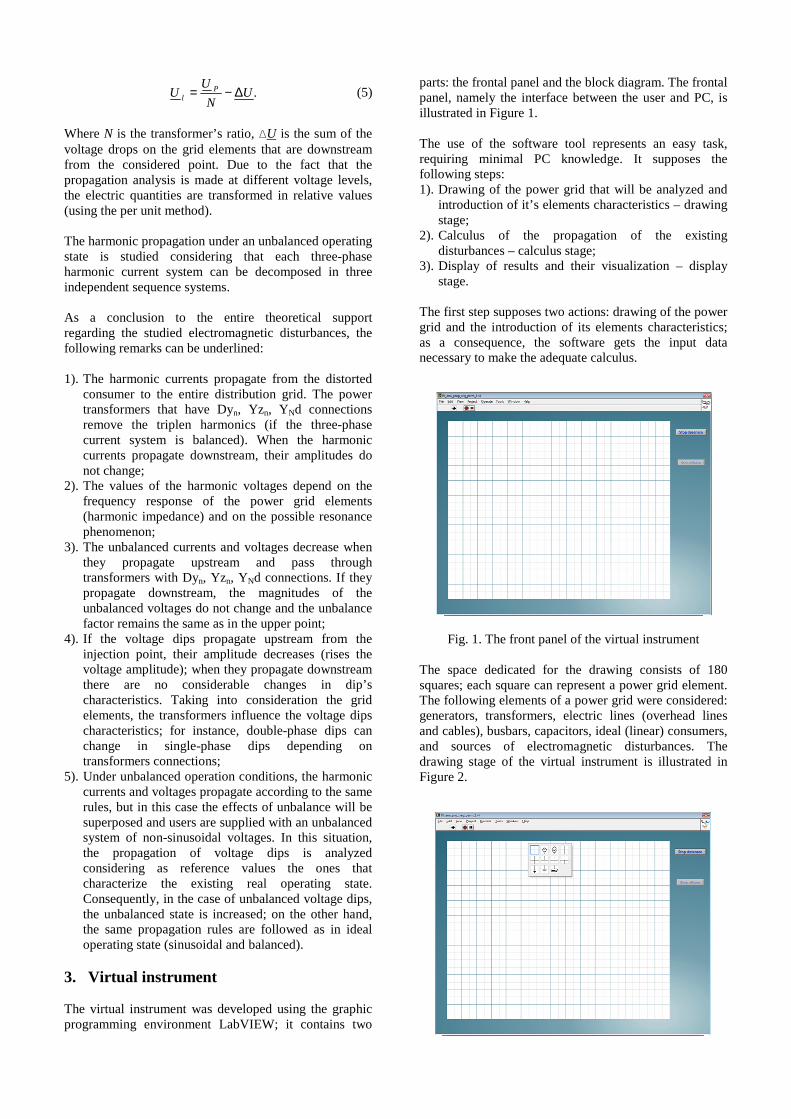
3. Virtual instrument The virtual instrument was developed using the graphic programming environment LabVIEW; it contains two
parts: the frontal panel and the block diagram. The frontal panel, namely the interface between the user and PC, is illustrated in Figure 1. The use of the software tool represents an easy task, requiring minimal PC knowledge. It supposes the following steps: 1). Drawing of the power grid that will be analyzed and
introduction of it’s elements characteristics – drawing stage;
2). Calculus of the propagation of the existing disturbances – calculus stage;
3). Display of results and their visualization – display stage.
The first step supposes two actions: drawing of the power grid and the introduction of its elements characteristics; as a consequence, the software gets the input data necessary to make the adequate calculus.
Fig. 1. The front panel of the virtual instrument The space dedicated for the drawing consists of 180 squares; each square can represent a power grid element. The following elements of a power grid were considered: generators, transformers, electric lines (overhead lines and cables), busbars, capacitors, ideal (linear) consumers, and sources of electromagnetic disturbances. The drawing stage of the virtual instrument is illustrated in Figure 2.

Fig. 2. Virtual instrument frontal panel in the drawing
stage The grid elements are taken from a palette with electric elements that appears every time when the user clicks on a free square (this is available only in the drawing stage). When a new element is put on the drawing grid, a dedicated window (distinctive for each element type) appears, and the user must introduce the input (required) data. These windows are displayed in Figure 3; the input data necessary for each element are as follows: 1). Generator: Rated voltage, Un, [kV] and short-circuit
power, Psc, [kVA]; 2). Transformer: rated power, SN [kVA]; primary and
secondary voltages; short-circuit power losses, ∆psc, [W]; short-circuit voltage, ∆usc, [%]; no-load current, i0, [%]; cooling system type, dry/oil; windings material, Cu/Al;
3). Electric line: type (overhead/cable), cross-section [mm2]; UN [kV] – rated voltage; length [km] – lowest and highest limits; conductor layout; ambient temperature T [˚C]; harmonics’ rang on each phase; conductor type, solid/segmental; constructive material, Cu/Al/Ol-Al; simple/double circuit of overhead line; cable type (user must choose from a data base).
4). Ideal consumer: rated power, Pn, [kW]; power factor; rated voltage, Un, [kV];
5). Disturbances source. These data may be obtained in three different ways: (i) on-line, that is directly from the power grid throughout a data acquisition board, (ii) off-line, using a virtual electric signals generator, or (iii) from txt format files which contain data obtained from a former measurement. In this case, the rated voltage, Un, [kV] of power grid at the connection point must be also indicated.
Fig. 3. Dedicated windows for different grid elements
After the electric scheme and the adequate input data are introduced (the drawing stage is finished) the button
“Stop desenare” must be pushed in order to continue the calculus; this action implies the next stage, namely the propagation analysis. Firstly, the introduced electric grid is decomposed in it’s corresponding positive, negative and zero sequence schemes and the electric quantities are transformed in relative quantities using the per unit method. Regarding the base quantities (in the per unit method), it must be underlined that the base electric power is considered to be 10 MVA, whereas the base voltage is the highest rated voltage of the studied power system. Based on these values, the base voltages, currents and impedances for each voltage level are calculated. The electric signal analysis is performed (as the IEC 61000 -4 – 30 standard recommends) on 10 cycles – 0.2 ms for 50 Hz. In the propagation study, firstly it is performed the analysis of voltages and current propagation at higher and at the same voltage level, respectively. Further on, the propagation downstream the disturbances source (that is at the same and lower voltage levels) is carried out. The propagation analysis is executed by a sub-virtual instrument; it receives as input data per unit sequence electric quantities and calculates both the voltages at all grid bus-bars and every line currents. In the same manner as the input data, the output data are expressed as per unit values. Once the results are obtained, they are transmitted to the sub-virtual instrument dealing with the display; when the calculus stage is complete, a message is displayed on the screen – Fig. 4, element 1.
Fig. 4. Frontal panel of the virtual instrument at the end
of the calculus stage The software continues to transmit the results once the user accesses the button of the message window. The third stage (display and visualization of obtained results) begins when the busbars of the power grid changes their colour from black to sky blue – Fig. 5. In this step, the user can see the characteristics of electric signals and the power quality indices at any busbar, by accessing the corresponding square of the specific busbar.
1

The output data can be visualized with the help of a display window, which is composed of four components presenting the electric signals, harmonic currents and voltages indices, unbalanced operating state indices and voltage dips characteristics. Fig. 6 presents the display windows indicating the obtained results for different disturbances: voltage dips in ideal conditions (sinusoidal and balanced operating state), unbalanced conditions and harmonic pollution. The captures from the left side of Fig. 6 illustrate the voltage (the upper graphic) and current (the lower graphic) waveforms in different points of the analyzed power grid.
Fig. 5. The frontal panel of the virtual instrument at the
end of calculus stage In the right upper part, the window displays the quality indices corresponding to a three-phase harmonic distorted signal; the middle graphic illustrates a sinusoidal unbalanced signal, whereas the right lower graphic shows a voltage dip and the corresponding over-current.
Fig. 6. Results display window for different situations
In every results window, dedicated buttons allow finding out the numerical values of interest. For instance, the “Harmonic pollution” field presents the main indices corresponding to this operating state: harmonic levels and orders, THD for each phase, and the rms of the fundamental for each phase. Using the button “U_I”, the user has the possibility to choose the electric quantities (voltages or currents) for which he wants to find out the harmonic state characteristics. The field “Unbalanced state” displays several characteristics of unbalanced voltages and currents systems (according to the position of “U_I” button): negative or zero unbalance factor, and the phasors system for the fundamental. The “k” element offers the possibility to visualize the characteristics of the unbalanced operating state in the case that exist voltage dips (temporary unbalanced operating state); the reference value indicates the value used to relate the modulus of the displayed phasors. The voltage dips characteristics are accessible in the field “Voltage dips”. Here, the user can see the shape, start time, duration and amplitude of voltage dips. The “Nr” element brings the possibility of passing from one voltage dip to another (in the case that there exists more than one voltage dip); in consequence, the characteristics of all voltage dips can be noticed. The advantages of the proposed software tool are: 1). Friendly graphic user interface, requiring minimal
operation PC knowledge;

2). Analysis of three-phase steady state in power systems (no only single-phase, as for existing commercial software);
3). It offers the possibility of determining the power quality indices in different points of a power grid without supplementary measurements (except the ones near the injection points of disturbances);
4). The input data can be read from an existing file, generated by a dedicated software or received directly from a measurement equipment, installed in-situ, throughout a data acquisition board;
5). The received electric signals are analyzed in order to establish the existence of one or more from the following disturbances: harmonics and interharmonics, unbalance, voltage dips and over-currents;
6). The electric parameters of the studied power grid are calculated considering the skin effect, proximity effect, and the influence of ambient temperature and of constructive characteristics of the grid elements. Due to the use of fuzzy logic in the electric parameters calculus, the user must introduce imprecise or incomplete data;
7). Offers the possibility of studying the propagation in radial power grids of the following electromagnetic disturbances: harmonic currents/voltages, unbalanced currents (voltages) and voltage dips (over-currents);
8). Shorter time in comparison with the time required for real measurements and necessary calculations to perform the propagation analysis.
4. Conclusion The propagation of conducted electromagnetic disturbances in distribution power grids is a complex phenomenon; its study requires great financial investments, because it supposes simultaneous in-situ measurements in different grid’s points. The use of PCs for the simulation of this phenomenon represents a simpler and accessible alternative. The paper presents the methods for the analysis of disturbances propagation and a dedicated virtual instrument developed for this purpose; mainly, it allows the study of harmonics, unbalance and voltage dips propagation through radial distribution grids. The virtual instrument procedure supposes: (i) the introduction of input data, whose effect is the generation of currents injected in the distribution grid; (ii) the propagation calculus for existing disturbances; (iii) display of output data, that is the power quality indicators at the grid transformers busbars. As a result of the performed analysis, the followings have been observed: 1). The disturbances propagate entirely along the electric
lines, but their characteristics change when they pass through the grid’s transformers, depending on the transformer connection;
2). The zero sequence components of harmonics from the secondary side of transformers that have the Dyn connection, can not be found on the primary side;
3). The harmonic currents produce harmonic voltages at the transformers busbars; as a result, the non-linear
customers influence the proper function of the linear ones.
The usage of the presented software tool offers the following advantages: 1). Simulation of harmonic polluted and unbalanced
operating states; 2). Friendly graphic interface; 3). Workable results in a short time. References [1] Golovanov, Carmen (editor) et al. Modern problems
regarding measurements in power systems (in Romanian), Editura Tehnică, Bucureşti, 2001
[2] Adamo F. et al. SCADA/HMI system in advanced educational courses, IEEE Transactions on Instrumentation and measurement, Vol.56, No. 1, February 2007, pp. 4-10
[3] Swain N.K., et al. Remote data acquisition, control and analysis using LabVIEW frontal panel and real time engine, Proceedings IEEE SoutheastCon 2003, ISBN 0-7803-7856-3/03
[4] Maier V. and Maier C.D., LabVIEW in Power Quality (in Romanian), Editura Albastră, Cluj-Napoca, 2000
[5] Robinson, D. Harmonic management in MV distri-bution systems, Ph.D. Thesys, Wollongog University, 2003
[6] Miron Anca, Chindriş, M. And Cziker, A. The Use of Artificial Intelligence in Electromagnetic Disturbances Identification (in Romanian), Energetica, anul 57, nr. 4/2009
[7] www.esls.lib.wi.us/glossary.html [8] srdc.msstate.edu./ecommerce/curricula/farm_mgmt/
glossary.htm [9] www.le.ac.uk/webcentre/help/glossary.html [10] Lundoquist, J. On harmonic distortion in power
systems, Degree thesis, Power Systems Department, Chalmers University, Goteburg, Sweden, 2001
[11] E. Styvaktakis, Automating Power Quality Analysis, PhD Thesis, Chalmers University of Technology, Goteborg, Sweden, 2002
[12] Anca Miron, M. Chindriş, A. Cziker, Virtual electrical signal generator, Acta Electrotehnica, Proceedings of the 2nd International Conference on Modern Power Systems, MPS 2008, pag.170 – 174
[13] M. Chindriş, E.Sudria, A.Cziker, Anca Miron, Propagation of unbalance in electric power systems, 9th International Conference Electrical Power Quality and Utilisation, EPQU’07, Barcelona, Spain, 9 – 11 October 2007, Session 4D – Improvment and distribution loads
[14] Miron Anca, Chindriş, M. And Cziker, A. Virtual Instrument for Electromagnetic Disturbances Classification and Analysis, 2009 IEEE Bucharest PowerTech, 28 iunie-2 July, Bucharest, Romania, paper 50