soil health deterioration: cause and remedies
TRANSCRIPT

Deteriorating soil health : Cause and
Remedies for improvement of soil
Fertility and Productivity
1
Content…..
• Introduction
• Soil health
• Cause of deteriorating soil health
• Remedies, soil fertility and productivity
• Conclusion
2
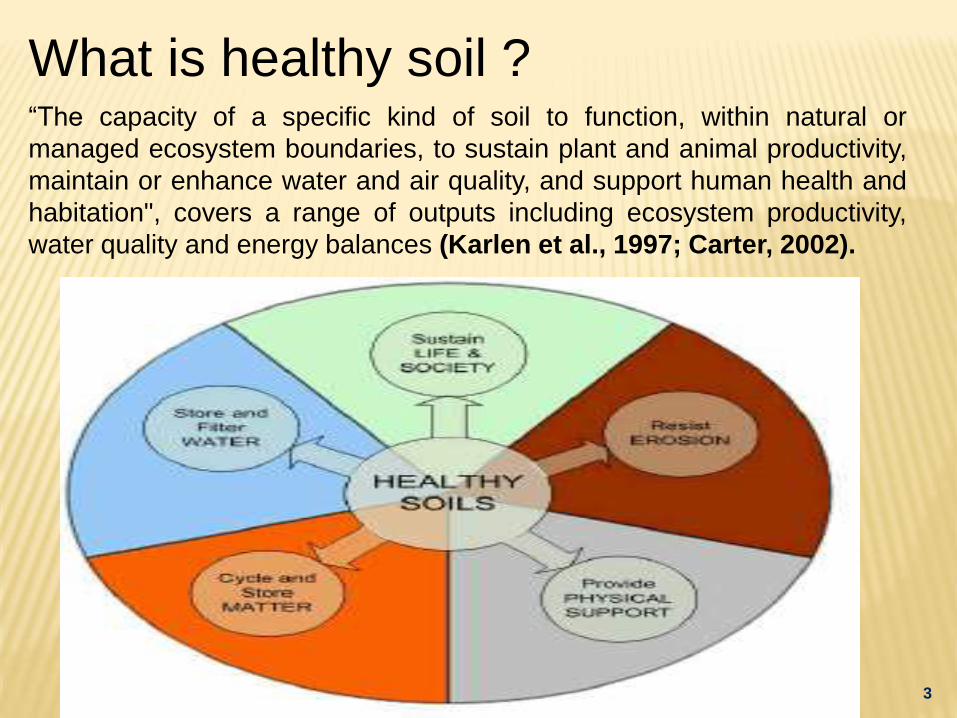
What is healthy soil ?“The capacity of a specific kind of soil to function, within natural or
managed ecosystem boundaries, to sustain plant and animal productivity,
maintain or enhance water and air quality, and support human health and
habitation", covers a range of outputs including ecosystem productivity,
water quality and energy balances (Karlen et al., 1997; Carter, 2002).
3

Physical indicators Chemical indicators Biological indicators
Passage of air
Structural stability
Bulk density
Clay mineralogy
Colour
Consistence (dry, moist,
wet)
Depth of root limiting layer
Hydraulic conductivity
Oxygen diffusion rate
Particle size distribution
Penetration resistance
Pore conductivity
Pore size distribution
Soil strength
Soil tilth
Structure type
Temperature
Total porosity
Water holding capacity
PBS
Cation exchange capacity
Contaminant availability
Contaminant concentration
Contaminant mobility
Contaminant presence
Electrical conductivity
Exchangeable sodium percentage
Nutrient cycling rates
pH
Plant nutrient availability
Plant nutrient content
Sodium adsorption ratio
Organic carbon
Microbial biomass carbon
C and N/Oxidizable carbon
Total biomass
Bacteria
Fungi
Actinomycetes
Potentially mineralizable N
Soil respiration
Enzymes
Dehydrogenase
Phosphatase
Arlysulfatase
Biomass C/total organic carbon/
Respiration /biomass
Microbial community
fingerprinting
Substrate utilization
Fatty acid analysis
Nucleic acid analysis
combining them in a meaningful way to a single index may assess soil quality more
precisely (Jaenicke and Lengnick, 1999; Bucher, 2002) which is used to gauge the level
of an improving or declining soil condition (Wienhold, 2004). 4

Major causes Other causes
Intensive farming / Nutrient
mining
Acid rain
Imbalanced fertilizer use Improper land fill and illegal dumping
Herbicide and Pesticide GM crops
Contaminated surface water
into soil
Accidental spills
Deforestation Improper discharge of Nuclear wastes
Electronic wastes
Industrial accidents
Causes of soil health deterioration
5

Processes 1997 in
Mha.
2020 in
mha.
Impact on soil health
Soil erosion 166.0 189.0 Loss of natural and
applied nutrients,
WHC,OM, structure,
texture affected
Water logging 12.7 22.3 Root tissue
decomposition, oxygen
level depletion,
nutrients lossed by
leaching and
denitrification
Salt infestation 11.0 15.1 Uneven and stunted
growth, less water
availability to plants
Total 189.7 226.4
Expected Land degradation scenario in India till
2020
Venkateswarlu (2005)
Effects on Soil Health
6

Year Water
Organic
carbon % pH
Nutrient status
N P K
1960s At the
surface
>2.0 <6.5 300 24.0 210
1970s 2 m 1.5 6.5-7.0 250 22.1 200
1980s 3 m 1.0 6.5-7.0 180 17.0 192
1990s 5 m 0.5 7.0-8.0 120 13.0 185
2000s 7.8 m <0.5 >8.5 80 11.0 180
Profile of water table, organic carbon,pH and nutrient status
in tarai region of uttarakhand
Singh and Tiwari
(2012)7

kumar (2012)
DECLINING CROP RESPONSE TO FERTILIZERS
Period Response ratio (Kg grains per kg
NPK)
5th Plan (1974-79) 15.0
8th Plan (1992-97) 7.5
9th Plan (1997-02) 7.0
10th Plan (2002-07) 6.5
11th Plan (2007-12) 6.0Reasons:Inadequate and imbalanced fertiliser use Increasing multi-nutrient deficiency Lack of farmers awareness about balanced plant nutritionLack of varietal breakthroughPoor crop management (Excess fertiliser dose not be the substitute of poor management)
8

Microflora Plot A ( NPK) Plot B ( NPK+Atrazine) Plot C
(NPK+Atrazine+
carbofuron)
Time of sampling Time of sampling Time of sampling
1st 2nd 3rd 4th 5th 1st 2nd 3rd 4th 5th 1st 2nd 3rd
Bacteria
(105/gm
of soil)
(y-1) 203 207 220 201 195 196 164 210 189 198 267 101 123
(y-2) 210 212 227 231 200 215 182 173 195 203 304 210 254
(y-3) 198 202 211 210 244 228
Fungi
(103/gm
of soil)
(y-1) 20 17 21 23 20 22 31 28 34 25 15 29 22
(y-2) 27 28 23 20 18 31 22 23 24 24 21 18 16
(y-3) 21 24 26 21 24 21
(y-1): First year; (y-2): Second year; (y-3): Third year Behki and Khan (1999)
• Bacteria and Fungi showed initial inhibition after the application of Atrazine in the first 2 years.
• Fungi increased in the first year after the application of the pesticides but followed a trend of
inhibition in the second year.
9

Low nutrient use efficiency by plants
Nutrient Efficiency
(%)
Cause of low efficiency
Nitrogen 30-50 Immobilization, volatilization,
denitrification, Leaching
Phosphorus 15-20 Fixation in soils Al – P, Fe – P,
Ca – P
Potassium 70-80 Fixation in clay - lattices
Sulphur 8-10 Immobilization, Leaching with
water
Micro
nutrients
(Zn, Fe, Cu,
Mn, B)
1-2 Fixation in soils
Sharma (2008)10

Intensive farming , fertilizer application and productivity in Tarai region of uttarakhand
Year Cropping system Fertilizer
application
Remarks
1960s Maize-barley/mustard/gram 60 kg N _ _ _
1970s maize/rice-wheat/barley 100:40:20 30kg S as
SSP
1980s Rice-wheat 120:40:20 20kg Zinc
1990s Rice-wheat 150:40:20 20kg Zinc
2000s Rice-wheat-rice
Rice-Veg. pea-rice
Rice-veg. Pea-sugarcane-ratoon-
wheat
180:40:20 20kg Zinc
Singh and Tiwari (2012) 11

Imbalanced fertilizer use evidenced by wider fertilizer consumption
ratios
Kumar (2011)
State 2007-08 2008-09 2009-10
N P2O5 K2O N P2O5 K2O N P2O5 K2O
Haryana 39.8 10.9 1 32.2 10.7 1 15.9 5.5 1
Punjab 34.3 9.0 1 23.6 6.7 1 18.4 5.9 1
U.P. 15.1 4.5 1 11.5 3.6 1 9.0 3.2 1
India 5.5 2.1 1 4.6 2.0 1 4.3 2.0 1
12

Pesticide Impact on soil health
Lindane(I) and endosulfan(I) Microbial count decreases Balwinder et al.(2006)
Diazinon(I), linuron (H),
mencozeb + dimethomorph
(F)
enzymetic,(dehydrogenase,ac
id and alkaline phosphatase
and urease) hindered
Cycon et al. (2005)
Hydroquinone and copper
sulphate and n-
thiophosphoric triamide
Hinders enzymatic hydrolysis
of urea
Kabat and panda
(2007)
Phosphomonoesterase (I)
and arginine deaminase(I)
Inhibits soil Enzymatic
dehydrogenase
Sushma and singh
(2006)
Fenvalerate (I) Catalase activities inhibited Shiyin et al. (2004)
13

NUTRIENT MINING IN SOILS OF INDIA (MT)
Addition Removal Balance
N 10.9 9.6 1.3
P2O5 4.2 3.7 0.5
K2O 1.4 11.6 -10.2
Total 16.5 24.9 -8.4
•Increased mining of soil potassium a cause of more rampant
decline in rice yields compared to wheat in IGP (data from 24
research stations)
Tandon (2004)14

Composition of sewage sludge from different cities in
IndiaCity N% P% K% O.M.
%
Cu
mg/kg
Zn
mg/kg
Cd
mg/kg
Cr
mg/kg
Ni
mg/kg
Pb
mg/kg
Ahmadabad 1.18 0.56 0.23 33.5 535 2147 3.5 60.4 32.3 76.8
Delhi 1.67 0.56 0.11 54.7 440 1610 5.5 53.5 81.5 34.5
Nagpur 1.08 0.51 0.21 39.1 272 832 1.5 49.2 14.9 24.3
Chennai 0.82 0.65 0.12 40.2 210 935 8.3 38.5 60.5 16.6
Jaipur 2.34 0.94 0.12 39.1 265 1710 7.3 176 37.5 66.9
Kolkata - - -
-
0.16 0.23 - - - 11.4 507 - - - 86.1 - - - - - -
Kanpur - - - 0.17 0.15 - - - 13.0 229 - - - 571 -- - - - - -
Bikaner - - - 0.11 0.19 - - - 13.6 49 - - - 35.6 - - - - - -
Mumbai - - - 0.23 0.11 - - - 108 234 - - - 378 - - - - - -
Juwarkar et al.(1997);Garg et al.(2000)
15

Location pH BOD(mg/L) Chromium
hexavalent
(ppm)
Nickel
(ppm)
Cyanides
(ppm)
Electroplating
industry
6.2-7.2 60-380 0.2-2.5 1-3 0.42-0.97
Sugar industry 7.1-7.9 1058-1640 - - -
Paper industry 7.0-10.1 560-1113 - - -
Households 6.7-7.8 80-460 0.1-0.2 0.2-2 0.05-0.07
Max. limits for
disposal on
agricultural lands
5.5-9.0 100 0.1 0.005 0.2
Characteristics of wastewater from domestic and industrial location in Ludhiana (PB.)
Tiwana et al.(1987)16

EFFECT OF SEWAGE SLUDGE APPLICATION ON DIFFERENT
SOIL PROPERTIES
17
Properties Effect
Soil aggregate stability Increase
Porosity Increase
Water holding capacity Increase
Bulk density Decrease
Humus content Increase
pH Decrease
Electrical conductivity Decrease
Total N Increase
Available P and K Increase
CEC Increase
Toxic elements Increase
Rai et al., 2011
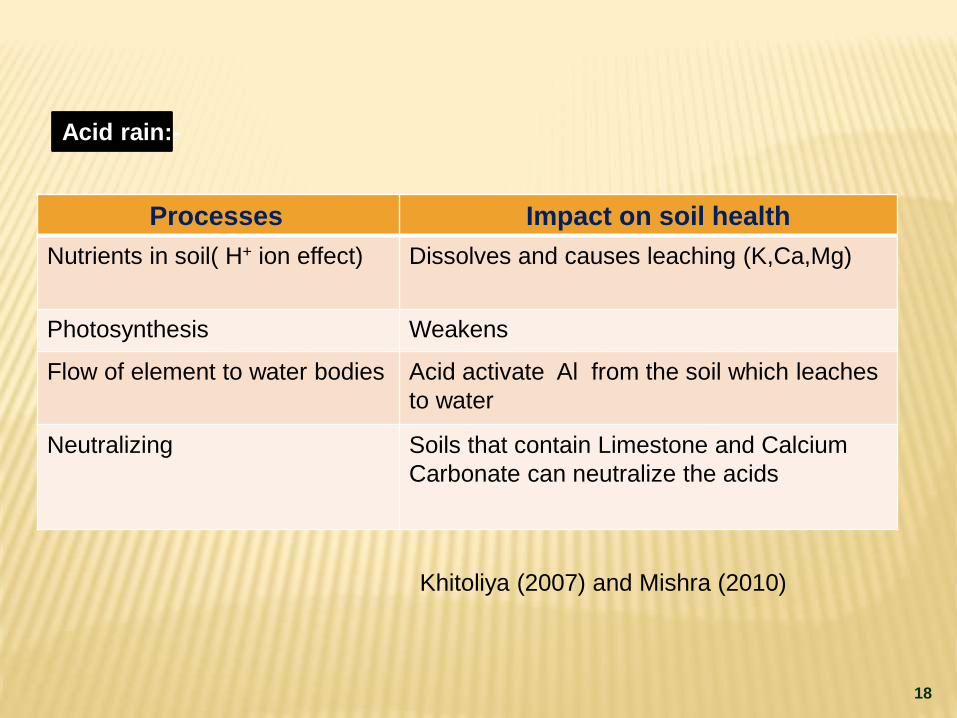
Processes Impact on soil health
Nutrients in soil( H+ ion effect) Dissolves and causes leaching (K,Ca,Mg)
Photosynthesis Weakens
Flow of element to water bodies Acid activate Al from the soil which leaches
to water
Neutralizing Soils that contain Limestone and Calcium
Carbonate can neutralize the acids
Khitoliya (2007) and Mishra (2010)
Acid rain:-
18

Remedies?
19

Practices Water run off
(cm depth)
Conserve
d water
(cm)
Increase
yield
(tons/ha)
Soil health
Corn stover vs. no
stover residue
0.06 1.24 0.34 Increases soil
productivity, soil
porosity, water
infiltration
Organic matter
increases water
infiltration,
enhances root growth.
1.30
Rye cover mulch vs.
residue burned
3.9 13.5 3.4
17.4
Manure mulch vs.
no manure
9.0 4.1 1.1
13.1
Corn/oats hay vs.
conventional
0.58 2.50 0.6
3.08
Level terraced vs.
contour planted
0.94 7.2 1.8
8.14
Dense planting vs.
bare soil
2.49 0.97 0.2
3.32
Reduced till vs.
conventional
2.1 1.5 0.4
3.6 Troeh et al.(2004)
Different agricultural practices combination to protect soil water
20

Integrated Nutrient Management (INM)
•INM envisaging conjunctive use of chemical
fertilizers, organic manures and biofertilizers
enhances nutrient use efficiency, soil health, crop
yields and profitability.
• Need to augment supplies of organic manures,
fortified, coated & customized fertilizers supplying
secondary and micronutrients, biofertilizers and
soil amendments to have INM on a sound footing.
And
•Site specific nutrient management for better soil21

Changes in soil organic C through INM for 20 years
in some soils in the IGP
Location Cropping
system
Initial
SOC
(mg/kg)
Soil Organic Carbon after 20
years (mg/kg)
Control NPK NPK+
FYM
Pantnagar Rice-wheat 14.8 5.0 9.5 15.1
Pantnagar Rice-wheat-
cowpea
14.8 6.0 9.0 14.4
Faizabad Rice-wheat 3.7 1.9 4.0 5.0
Karnal Fallow- Rice-
wheat
2.3 3.0 3.2 3.5
Nambiar (1995) and Swarup et al. (1998) 22

Effect of SSNM on productivity (t/ha) of Wheat
Location, State FP SR SSNM % increase over SR % increase over FP
Sabour, Bihar 3.92 4.97 5.82 17.1 48.7
Palampur, H.P. 2.64 3.76 3.87 2.92 46.5
Ranchi, Jharkhand 2.56 4.06 4.15 2.21 58.5
Ludhiana,Punjab 5.45 6.28 6.55 4.3 20.1
Kanpur
Uttar Pradesh4.72 5.45 6.0 10.1 27.1
Modipuram
U.P4.77 4.90 6.43 31.0 46.5
Pantnagar
Uttarakhand3.87 5.10 6.93 25.3 66.0
Tiwari et al.,(2006)23

Crop Treatment Nutrient dose (kg/ha) Yield
(kg/ha)N P2O5 K2O
Wheat STCR target 5 t/ha 126 41 49 4887
State Recommendation 120 40 60 4567
Farmers’ Practice 80 0 57 3662
Mustard STCR target 2.5 t/ha 97 35 75.5 2281
State Recommendation 100 40 40 1890
Farmers’ Practice 60 0 57 1312
STCR Approach
Subba Rao (2009)24

Enhancing availability of organic manures
• Recycling and composting/ vermi composting of urban,animal
and agro industrial waste• About 57MT of urban solid waste generated per annumwith
potential to supply 8MT of good quality compost.• Present availability 383 mt against the moderaterequirement
of 900 mt / annum (@5 t / ha on gross cropped area of185 mha).
FYM Rural
compost
Urban
Compost
Vermi
Compost
Others Total
186 169 15 3 9 383
25

Effect on soil health due to integrated use of FYM with different nutrients dose of N
and P on Rice (Ethiopia)
Tilahun Tadesse et al.(2011)
FYM rates (0,7.5 and 15 t/ha)
N rates (0,60,120 kg N/ha) and
P rates (0,50,100 kg/ha) were tested in 27
treatments 26
Fertilizer
combination(FYM
t/ha-N kg/ha-P2O5
kg/ha)
N in inorganic
fertilizer kg/ha
N in FYM kg/ha Total N added
kg/ha
Nitrogen uptake
kg/ha
N balance kg/ha
0-0-0 0 0 0 81.6 -81.6
0-60-100 60 0 60 112.2 -52.2
0-120-0 120 0 120 122.2 -2.2
0-120-50 120 0 120 145.5 -25.5
0-120-100 120 0 120 125.1 -5.1
7.5-60-100 60 144.4 204.4 161.5 42.9
15-0-0 0 288.8 288.8 138.7 150.1
15-0-50 0 288.8 288.8 135.0 153.8
15-60-100 60 288.8 348.8 246.6 102.2
15-120-0 120 288.8 408.8 194.0 214.8
15-120-50 120 288.8 408.8 225.1 183.7
15-120-100 120 288.8 408.8 272.6 136.2

FYM interaction with N,P and parameters after harvesting in
soil
FYM Organic
matter(%)
Bulk density
(g/cm3 )
Available WHC
0 t/ha 3.26 1.33 47.4
7.5 t/ha 3.84 1.13 49.1
15 t/ha 4.78 1.02 52.3
Tilahun Tadesse et al.(2011)
27

ACID SOILS
• About 12 m ha of arableacid soils with pH<5.5have low nutrient useefficiency and cropproductivity.
• Liming to enhancenutrient use efficiencyand productivity ofcrops, especially ofpulses and oilseeds.
• The practice saves 50%
fertilizers28

State Crop RDF 50% RDF +Lime
Assam Rapeseed 9.70 10.10
Summer green gram 4.42 5.17
Kerala Cowpea 8.57 10.65
Black gram 6.38 8.10
Meghalaya Maize 30.50 30.30
Groundnut 14.20 21.30
West
Bengal
Mustard 8.15 8.40
Wheat 16.70 17.15
Jharkhand Maize + Pigeon pea
(Maize equiv. yield)
69.0 65.0
Pea 38.4 50.8
Orissa Groundnut 22.5 23.6
Pigeon pea 12.0 12.2
Crop Response( q/ha) to lime & Fertilizer Application
Sharma (2008) 29

Practice applied Positive impact on soil By
Organic manure addition Microbial activity
increased
Dinesh et al. (2000)
Organic farming than
mixed
Biological activity
increased
Duffy et al. (1994)
Organic amendments Soil enzymes stimulated Marcote et al. (2001)
Effect of organic and inorganic sources of nutrients on biological
activities
30
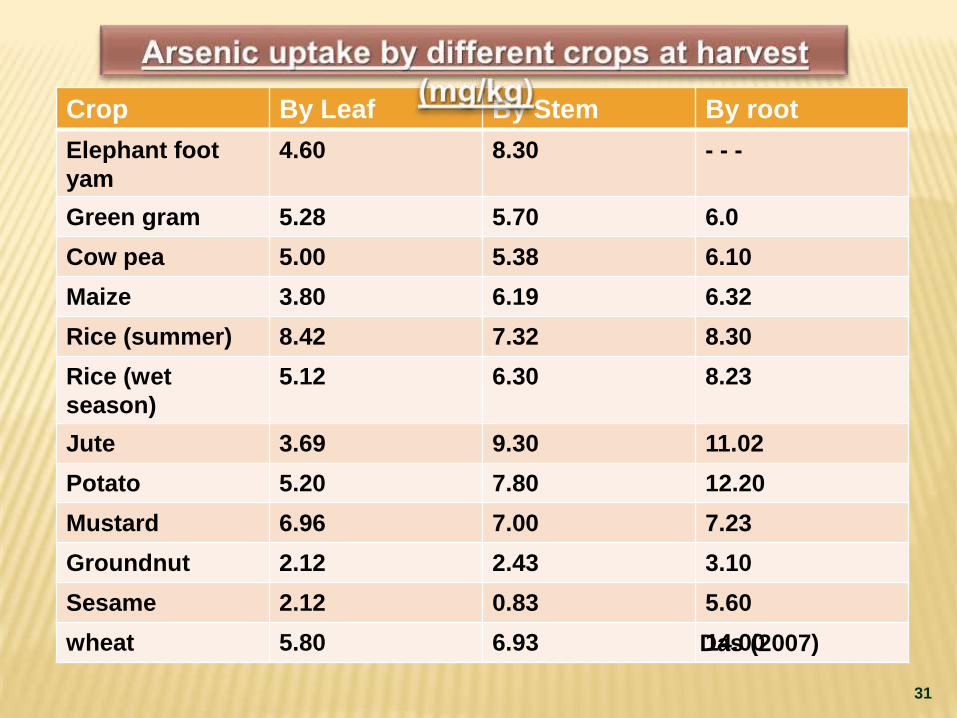
Crop By Leaf By Stem By root
Elephant foot
yam
4.60 8.30 - - -
Green gram 5.28 5.70 6.0
Cow pea 5.00 5.38 6.10
Maize 3.80 6.19 6.32
Rice (summer) 8.42 7.32 8.30
Rice (wet
season)
5.12 6.30 8.23
Jute 3.69 9.30 11.02
Potato 5.20 7.80 12.20
Mustard 6.96 7.00 7.23
Groundnut 2.12 2.43 3.10
Sesame 2.12 0.83 5.60
wheat 5.80 6.93 14.00Das (2007)
31

Strategic framework for effective steps for improving
soil Health, productivity and sustainability
1. Enhancing Nutrient and Water Use Efficiency
• Increasing inputs use efficiency
• Precision agriculture
• Nano-technology
• Fertilizer fortification
• Integrated nutrient management
2. Sustaining Soil and Produce Quality
• Efficient composting techniques and integrated plant nutrient supply
systems
• Organic farming
• Improving soil quality through organic matter additions and correcting
nutrient imbalances
• Development of a workable index of soil quality assessment imbibing
influence of different physical, chemical and biological soil attributes
• Understanding resilience of degraded soils and restoration of their
productivity
32

3. Soil Biodiversity and Genomics
• Characterization and prospecting of large soil bio-diversity
• Characterization of functional communities of soil organisms.
• Testing of mixed biofertilizers formulations
4. Climate change and carbon sequestration
• The carbon sequestration research in the context of sustainable
management of land and soil resources and conserving deteriorating
environment
• Conservation agriculture and carbon sequestration especially in semi-arid and
sub-humid regions.
• Tillage and nutrient interaction in soil
• Crop simulation modeling and remote sensing in climate change research
• Crop adaptation to climate change-rhizospheric studies
5. Minimizing Soil Pollution
• Bio-remediation/ phyto-remediation of contaminated soils
• Quality compost production and establishing quality standards
• Solid wastes and waste waters – quality assessment and recycling
33

SOIL FERTILITY MANAGEMENT/CORRECTIVE
MEASURES IN TARAI AREAS OF
UTTARAKHAND
The major problems depletion needed of the soil in the
area are:-
1 Balanced use of fertilizers in the Rice - Wheat
system
2. Management of Developed plough pan
3. Preventing Depletion of organic matter and ground
water
4. Shift of pests and pathogens
34

Conclusion…………
35

36