soil & tillage research - ars.usda.gov. gillette 2017.pdfgillettea,*, liwang mab, robert w....
TRANSCRIPT
Soil & Tillage Research 165 (2017) 268–278
Simulating N2O emissions under different tillage systems of irrigatedcorn using RZ-SHAW model
Katrina Gillettea,*, Liwang Mab, Robert W. Malonea, Q.X. Fangc, Ardell D. Halvorsond,Jerry L. Hatfielda, L.R. Ahujab
aUSDA-ARS National Laboratory for Agriculture and the Environment, Ames, IA, USAbUSDA-ARS, 2150 Centre Ave. Bldg. D, Ste.200, USDA-ARS, Fort Collins, CO, USAcQingdao Agricultural University, Qingdao, ChinadUSDA-ARS, 2150 Centre Ave. Bldg. D, Ste.100, Fort Collins, CO, USA
A R T I C L E I N F O
Article history:Received 17 February 2016Received in revised form 3 August 2016Accepted 30 August 2016Available online 15 September 2016
Keywords:Ecosystem modelNitrous oxide emissionsNo-till
A B S T R A C T
Nitrous oxide (N2O) is a potent greenhouse gas (GHG), and agriculture is a global source of N2O emissionsfrom soil fertility management. Yet emissions vary by agronomic practices and environmental factorsthat govern soil moisture and temperature. Ecosystem models are important tools to estimate N2Oemissions by accounting for such variables, and models can strengthen field research. The objective ofthis study was to test RZ-SHAW predictions of crop production and N2O emissions from conventional till(CT) and no-till (NT) systems at high (HN) rate and low nitrogen input (LN) treatments in an irrigated corn(Zea mays L.) field in Colorado from 2003 to 2006 growing seasons. The model was calibrated using theHN-CT, and other treatments were used as validations. Additionally, the SHAW model was run inconjunction with RZWQM2 to account for differences in soil surface temperatures. Simulated crop yieldswere within 0.7 and 0.9% of measured yield for HN-NT and CT treatments, and 32 and 3% of measuredyield for LN-NT and CT treatments, respectively. Spring soil temperatures were cooler by 2 �C in NTcompared to CT, and were correctly simulated using RZ-SHAW coupled model. RZ-SHAW simulated N2Oemissions were slightly under predicted by 0.10 (1.5%) and 0.56 (7.1%) kg N ha�1 for HN-NT and HN-CTtreatments, respectively. Results for LN treatments showed larger differences in simulated N2O emissionsand were over predicted by 0.11 (16%) kg N ha�1 in NT and under predicted by 0.29 (29%) g N ha�1 day�1 inCT. Annual emissions were in close agreement, with observed and simulated showing 12 and 10% lowerN2O emissions from HN-NT than HN-CT, respectively. Cooler surface soil temperature and higher soilwater content in the HN-NT treatment caused slower breakdown of crop residue and slightly moredenitrification than HN-CT, resulting in lower N2O emissions in HN-NT. This is the first test of the newlyadded GHG component in RZ-SHAW under no-till management, and results suggest with someimprovements the model could be applied to quantify N2O emissions from different managementpractices.
Published by Elsevier B.V.
Contents lists available at ScienceDirect
Soil & Tillage Research
journal homepage: www.else vie r .com/locate /s t i l l
1. Introduction
Nitrous oxide (N2O) is a greenhouse gas (GHG) with impendingenvironmental effects because of its persistence in the atmo-sphere, high radiative feedback, unchecked emissions, and lack of
Abbreviations: CT, conventional till; r2, coefficient of determination; GHG,greenhouse gas; GWP, global warming potential; MD, mean difference; NSME,Nash-Sutcliffe model efficiency; N2O, nitrous oxide; NO3-N, nitrate; NT, no-till; PCU,polymer coated urea; RMSE, root mean square error; RZWQM, root zone waterquality model; SHAW, simultaneous heat and water.* Corresponding author.E-mail address: [email protected] (K. Gillette).
http://dx.doi.org/10.1016/j.still.2016.08.0230167-1987/Published by Elsevier B.V.
terrestrial sinks (Ravishankara et al., 2009). Agricultural is a globalsource of N2O emissions through the use of fertilizer and manureapplications (Cavigelli et al., 2012). N2O is produced as one of theintermediate N gas byproducts due to the incomplete pathway ofnitrification and denitrification (Parton et al., 2001). Conventionalfarming systems are dependent on synthetic N fertilizer foreconomic yield return, therefore, as global population rises andfood demand increases emissions are expected to intensify(Keeney and Hatfield, 2008; Reay et al., 2012; Bouwman et al.,2013). One of the best predictors of N2O emissions is N fertilizerrate (Miller et al., 2010) which increases the availability of N formicrobial transformation (Bouwman et al., 1993). Yet, emissions

K. Gillette et al. / Soil & Tillage Research 165 (2017) 268–278 269
vary by crop type, management, N fertilizer type and applicationtiming, tillage, and irrigation practices (Mosier et al., 2006; Dobbieand Smith, 2003; Parkin and Kaspar, 2006). Emissions also vary byyear because climate factors play a significant role in regulating soilmoisture and temperature (Lesschen et al., 2011). Thereforestrategies to mitigate N2O emissions are complex and resultscan be difficult to predict.
Consequently, it is critical for process based models to reflect anappropriate response in soil N2O emissions caused by environ-mental factors and management practices (Metivier et al., 2009;Wang et al., 2012; Fang et al., 2015). In general, process basedmodels provide a systematic approach to understanding fieldresearch based on specific management (Ahuja and Hatfield, 2007)and allow comprehensive evaluation of multiple ecosystemprocesses (Zhang et al., 2013). Simulating the complexity of theprimary ecological drivers affecting the soil N cycle and itsinteraction with management, have often yielded mixed resultsfrom ecosystem models regarding N2O emissions (Del Grosso et al.,2008; David et al., 2009; Bessou et al., 2010). Therefore,continuously testing and updating the current knowledge ofN2O emissions kinetics is critical to improving models.
Root Zone Water Quality Model 2 (RZWQM2) is a comprehen-sive ecosystem model that simulates soil water, temperature andC/N dynamics as influenced by various agronomic managementpractices (Ahuja et al., 2000). RZWQM2 has been extensivelyapplied to better understand the effects of soil water and Nfertilizer management on crop yield and their interactions in theenvironment (Ma et al., 2007; Malone et al., 2007; Fang et al., 2008,2010, 2012). Detailed input data for weather, soil physical,chemical and hydraulic information, and agronomic managementare required to run the model (Ma et al., 2011; Malone et al., 2011),and Parameter Estimation Software (PEST) is included to supportefficient user calibration (Ma et al., 2012b). Recently, to betterquantify effects of alternative management practices and environ-mental impacts on nitrification and denitrification, Fang et al.(2015) modified RZWQM2 to simulate N2O emissions. Those
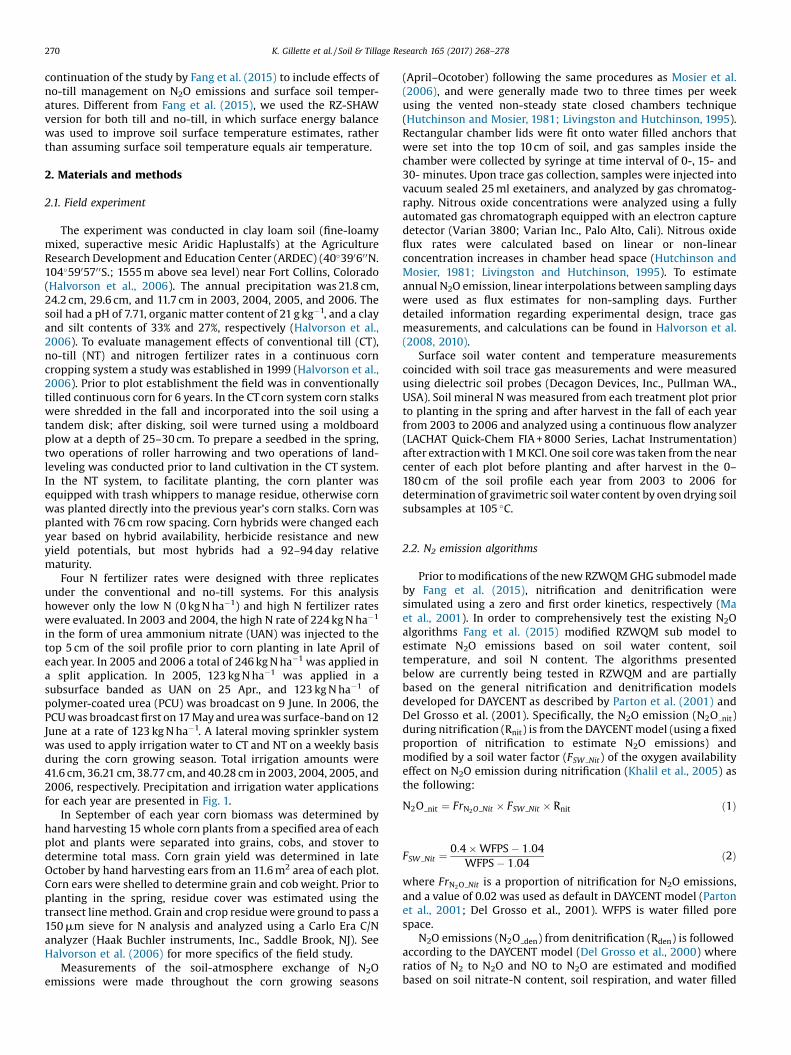
Fig. 1. Observed and RZ-SHAW simulated soil water (cm3 cm�3) (0–5 cm) and soil temprecipitation and irrigation water applications to field plots.
authors used algorithms for nitrification and denitrification as afunction of soil water, temperature and soil N levels (Parton et al.,2001; Khalil et al., 2005; Bessou et al., 2010). However, their studywas focused on conventional tillage only and the detailed surfaceenergy balance component (simultaneous heat and water (SHAW))was not used. The RZ-SHAW hybrid model adds the capability ofsimulating the effects of agriculture management on the surfaceenergy balance (Flerchinger et al., 2000), and has shownimprovement over the original RZWQM model in simulating theeffects of crop residue on soil moisture and soil temperature(Kozak et al., 2007; Ma et al., 2012a).
No-till is a common agronomic soil conservation practice thatreduces erosion and mitigates energy consumption in cropproduction (Halvorson et al., 2006). No-till management is arecognized and feasible soil conservation method for intensivelymanaged systems such as corn (Zea mays L.) (Halvorson andJantalia, 2011). There have been mixed findings however as towhether no-till reduces N2O emissions from cropping systems(Mosier et al., 2006; Liu et al., 2005). Tillage management affectssoil temperature and soil water content and finally crop yield(Halvorson et al., 2008; Halvorson and Jantalia, 2011). Correctlypredicting effects of tillage caused by changes in crop residue andsoil hydraulic properties should improve model results for soiltemperature (Ma et al., 2012a) and soil water content (Wang et al.,2010), and in turn improve simulated N2O emissions. Fang et al.(2014) showed that the RZ-SHAW was reasonable for simulatingsoil water content, soil temperature, evapotranspiration, surfaceenergy balance as well as crop growth under conventional tillageconditions. The influence of no-till management on soil tempera-ture and soil water content from surface residue cover and soilhydraulic properties has not been evaluated using RZ-SHAW(Ahuja et al., 2000).
The objective of this study was to test RZ-SHAW in predictingN2O emissions from no- tillage and conventional tillage manage-ment at two fertilizer application rates from an irrigatedcontinuous corn (Zea mays L.) system in Colorado. This is a
perature (0–5 cm) during the 2003–2006 study period, along with millimeters of
270 K. Gillette et al. / Soil & Tillage Research 165 (2017) 268–278
continuation of the study by Fang et al. (2015) to include effects ofno-till management on N2O emissions and surface soil temper-atures. Different from Fang et al. (2015), we used the RZ-SHAWversion for both till and no-till, in which surface energy balancewas used to improve soil surface temperature estimates, ratherthan assuming surface soil temperature equals air temperature.
2. Materials and methods
2.1. Field experiment
The experiment was conducted in clay loam soil (fine-loamymixed, superactive mesic Aridic Haplustalfs) at the AgricultureResearch Development and Education Center (ARDEC) (40�39060 0N.104�590570 0S.; 1555 m above sea level) near Fort Collins, Colorado(Halvorson et al., 2006). The annual precipitation was 21.8 cm,24.2 cm, 29.6 cm, and 11.7 cm in 2003, 2004, 2005, and 2006. Thesoil had a pH of 7.71, organic matter content of 21 g kg�1, and a clayand silt contents of 33% and 27%, respectively (Halvorson et al.,2006). To evaluate management effects of conventional till (CT),no-till (NT) and nitrogen fertilizer rates in a continuous corncropping system a study was established in 1999 (Halvorson et al.,2006). Prior to plot establishment the field was in conventionallytilled continuous corn for 6 years. In the CT corn system corn stalkswere shredded in the fall and incorporated into the soil using atandem disk; after disking, soil were turned using a moldboardplow at a depth of 25–30 cm. To prepare a seedbed in the spring,two operations of roller harrowing and two operations of land-leveling was conducted prior to land cultivation in the CT system.In the NT system, to facilitate planting, the corn planter wasequipped with trash whippers to manage residue, otherwise cornwas planted directly into the previous year’s corn stalks. Corn wasplanted with 76 cm row spacing. Corn hybrids were changed eachyear based on hybrid availability, herbicide resistance and newyield potentials, but most hybrids had a 92–94 day relativematurity.
Four N fertilizer rates were designed with three replicatesunder the conventional and no-till systems. For this analysishowever only the low N (0 kg N ha�1) and high N fertilizer rateswere evaluated. In 2003 and 2004, the high N rate of 224 kg N ha�1
in the form of urea ammonium nitrate (UAN) was injected to thetop 5 cm of the soil profile prior to corn planting in late April ofeach year. In 2005 and 2006 a total of 246 kg N ha�1 was applied ina split application. In 2005, 123 kg N ha�1 was applied in asubsurface banded as UAN on 25 Apr., and 123 kg N ha�1 ofpolymer-coated urea (PCU) was broadcast on 9 June. In 2006, thePCU was broadcast first on 17 May and urea was surface-band on 12June at a rate of 123 kg N ha�1. A lateral moving sprinkler systemwas used to apply irrigation water to CT and NT on a weekly basisduring the corn growing season. Total irrigation amounts were41.6 cm, 36.21 cm, 38.77 cm, and 40.28 cm in 2003, 2004, 2005, and2006, respectively. Precipitation and irrigation water applicationsfor each year are presented in Fig. 1.
In September of each year corn biomass was determined byhand harvesting 15 whole corn plants from a specified area of eachplot and plants were separated into grains, cobs, and stover todetermine total mass. Corn grain yield was determined in lateOctober by hand harvesting ears from an 11.6 m2 area of each plot.Corn ears were shelled to determine grain and cob weight. Prior toplanting in the spring, residue cover was estimated using thetransect line method. Grain and crop residue were ground to pass a150 mm sieve for N analysis and analyzed using a Carlo Era C/Nanalyzer (Haak Buchler instruments, Inc., Saddle Brook, NJ). SeeHalvorson et al. (2006) for more specifics of the field study.
Measurements of the soil-atmosphere exchange of N2Oemissions were made throughout the corn growing seasons
(April–Ocotober) following the same procedures as Mosier et al.(2006), and were generally made two to three times per weekusing the vented non-steady state closed chambers technique(Hutchinson and Mosier, 1981; Livingston and Hutchinson, 1995).Rectangular chamber lids were fit onto water filled anchors thatwere set into the top 10 cm of soil, and gas samples inside thechamber were collected by syringe at time interval of 0-, 15- and30- minutes. Upon trace gas collection, samples were injected intovacuum sealed 25 ml exetainers, and analyzed by gas chromatog-raphy. Nitrous oxide concentrations were analyzed using a fullyautomated gas chromatograph equipped with an electron capturedetector (Varian 3800; Varian Inc., Palo Alto, Cali). Nitrous oxideflux rates were calculated based on linear or non-linearconcentration increases in chamber head space (Hutchinson andMosier, 1981; Livingston and Hutchinson, 1995). To estimateannual N2O emission, linear interpolations between sampling dayswere used as flux estimates for non-sampling days. Furtherdetailed information regarding experimental design, trace gasmeasurements, and calculations can be found in Halvorson et al.(2008, 2010).
Surface soil water content and temperature measurementscoincided with soil trace gas measurements and were measuredusing dielectric soil probes (Decagon Devices, Inc., Pullman WA.,USA). Soil mineral N was measured from each treatment plot priorto planting in the spring and after harvest in the fall of each yearfrom 2003 to 2006 and analyzed using a continuous flow analyzer(LACHAT Quick-Chem FIA + 8000 Series, Lachat Instrumentation)after extraction with 1 M KCl. One soil core was taken from the nearcenter of each plot before planting and after harvest in the 0–180 cm of the soil profile each year from 2003 to 2006 fordetermination of gravimetric soil water content by oven drying soilsubsamples at 105 �C.
2.2. N2 emission algorithms
Prior to modifications of the new RZWQM GHG submodel madeby Fang et al. (2015), nitrification and denitrification weresimulated using a zero and first order kinetics, respectively (Maet al., 2001). In order to comprehensively test the existing N2Oalgorithms Fang et al. (2015) modified RZWQM sub model toestimate N2O emissions based on soil water content, soiltemperature, and soil N content. The algorithms presentedbelow are currently being tested in RZWQM and are partiallybased on the general nitrification and denitrification modelsdeveloped for DAYCENT as described by Parton et al. (2001) andDel Grosso et al. (2001). Specifically, the N2O emission (N2O nit)during nitrification (Rnit) is from the DAYCENT model (using a fixedproportion of nitrification to estimate N2O emissions) andmodified by a soil water factor (FSW Nit) of the oxygen availabilityeffect on N2O emission during nitrification (Khalil et al., 2005) asthe following:
N2O nit ¼ FrN2O Nit � FSW Nit � Rnit ð1Þ
FSW Nit ¼0:4 � WFPS � 1:04
WFPS � 1:04ð2Þ
where FrN2O Nit is a proportion of nitrification for N2O emissions,and a value of 0.02 was used as default in DAYCENT model (Partonet al., 2001; Del Grosso et al., 2001). WFPS is water filled porespace.
N2O emissions (N2O den) from denitrification (Rden) is followedaccording to the DAYCENT model (Del Grosso et al., 2000) whereratios of N2 to N2O and NO to N2O are estimated and modifiedbased on soil nitrate-N content, soil respiration, and water filled
K. Gillette et al. / Soil & Tillage Research 165 (2017) 268–278 271
pore space (WFPS) as the following.
N2O den ¼ FrN2O Den � Rden ð3Þ
FrN2O Den ¼ 11 þ RNO N2O þ RN2 N2O
ð4Þ
RNO N2O ¼ 4 þ 9 � tan�1 0:75 � p � 10 � D � 1:86ð Þð Þp
ð5Þ
RN2 N2O ¼ max 0:16k1; k1 � e�0:8 NO3½ �
co2½ �� �
� maxð0:1; 0:015 � WFPS � 100 � 0:32Þ ð6Þ
k1 ¼ max 1:5; 38:4 � 350 � Dð Þ ð7Þwhere FrN2O Den is the fraction of denitrification for N2O emissions;RNO N2O is the ratio of NO to N2O; RN2 N2O is the ratio of N2 to N2O;[NO3] is soil nitrate-N content; [CO2] is CO2 concentration; D is O2
diffusivity in soil (Davidson and Trumbore, 1995).Since the above described N2O emission simulation processes
from DAYCENT model do not account for N2O diffusion across soildepth, another modification is a diffusion factor (Fdepth N2O) of soildepth (depth, m) added to N2O emission from both nitrificationand denitrification based on Chatskikh et al. (2005) as following:
Fdepth N2O ¼ max 0; min 1; 1:0008 � 0:0343 � depth � 3:186 � depth2� �� �
ð8ÞBased on the Eq. (3), N2O from soil depth below 60 cm has no
contribution to measured N2O on the surface, which can beapplicable in simulating N2O emissions from deep soil layer inresponse to the irrigation or N fertilizer application methods (suchas N application by injection and or subsurface irrigation).
2.3. Model input and SHAW model description
The simulation started in 1999 to initialize soil C and N andhydrology prior to the calibration. The calibration and testing periodwas from2003to 2006 andusing the measureddata ofsoil water, soiltemperature, soil nitrate-N, crop yield, above ground biomass, andcrop N uptake from the HN-CT treatment, while other N ratetreatments in the CTsystemwere used for validation as described byFang et al. (2015). For this study, the calibrated RZWQM model fromFang et al. (2015) was used to further validate the experimentalresults from the high N (HN) and low nitrogen input (LN) treatmentsof the no-till system during the same measurement period of 2003–2006. Model input was based on the two corn systems described inthe aforementioned field experiment. The only difference inmanagement was tillage practices, inwhich no-till cropping systemswere simulated with surface residue at the time of planting.Additionally, the SHAW model was run in conjunction withRZWQM2 to account for differences in soil surface temperaturesdue to surface residue cover (Ma et al., 2012a).
The SHAW model was originally developed by Flerchinger et al.(2000, 2009) and was incorporated into RZWQM to improvesurface energy balance simulation (Li et al., 2012; Ma et al., 2012a;Fang et al., 2014). RZWQM provides SHAW soil water content, rootdistribution, soil evaporation, soil transpiration, leaf area index,and plant height at each time step. Then SHAW feeds back toRZWQM with soil ice content, updated soil water content due to iceand freezing, and soil temperature (Fang et al., 2014). Soilevaporation (AE) supplied by the RZWQM is used in SHAW to
compute the energy balance of the surface soil layer by forcingwater vapor flux from the soil surface, and therefore latent heatflux, to equal the soil evaporation. Soil heat flow and temperaturein the soil matrix, considering convective heat transfer by liquidand latent heat transfer by vapor for freezing soil is given by
Cs@T@t
� riLf@ui
@t¼ @@z
Kt sð Þ@T@z
� �� rici
@qiT@z
� Lv@qv
@zþ @rv
@t
� �ð9Þ
where Cs and T are volumetric heat capacity (J kg�1 K�1) andtemperature (�C) of the soil, ri is density of ice (kg m�3), ui isvolumetric ice content (m3m�3), Kt(s) is soil thermal conductivity(W m�1K�1), rl is density of water, cl is specific heat capacity ofwater (J kg�1 K�1), qi is liquid water flux (m s�1), qv is water vaporflux (kg m�2 s�1), Lf is latent heat of fusion (335,000 J/kg) and rv isvapor density (kg m�3) within the soil. The soil thermalconductivity and heat capacity are quantified using the theoryof de Vries (1963). SHAW also uses a Newton-Raphson algorithm(Campbell, 1985) to solve finite difference expressions of theenergy balance equation for soil temperature profiles. Soil surfacetemperature is solved through this iteration process by balancingradiation, sensible and latent heat fluxes from above with the soilheat flux (G) into the soil. G is calculated by rearranging Eq. (9) asthe sum of gradient and storage terms for a soil slab thickness(Dzs; m) as follows
G ¼ Ks tð ÞDzs
þ ciqi
� �Ts tð Þ � T̂z tð Þ
� �
�Dzs2Dt
Cs Ts tð Þ � Ts t�Dtð Þ� �
� riLf ui tð Þ � ui t�Dtð Þ� �h i
þ Lvqv ð10Þ
where Dt is time increment (s), Ts(t) is surface soil temperature attime t (�C), Ts(t-Dt) is previous surface soil temperature at time t-Dt
(�C), T̂z tð Þ is soil temperature expected at soil slab lower boundary zat time t (�C). Other information on RZ-SHAW can be found in Fanget al. (2014).
2.4. Evaluation criteria
RZ-SHAW performance of simulated crop yield, biomass, crop Nuptake, daily water content, soil temperature, and seasonal soilnitrate (NO3-N) was evaluated using the following statistics: rootmean square error (RMSE), mean difference (MD), coefficient ofdetermination (r2), and Nash-Sutcliffe model efficiency (NSME).The respective equations are shown below:
RMSE ¼ffiffiffiffiffiffiffiffiffiffiffiffiffiffiffiffiffiffiffiffiffiffiffiffiffiffiffiffiffiffiffiffiffi1=N
XNi¼1
Pi � Oi2
vuut ð11Þ;
MD ¼XN
i¼1Pi � Oið ÞN
ð12Þ;
r2 ¼ 1 �XN
i¼1Pi � Oið Þ2XN
i¼1Pi � Oið Þ2 þ
XN
i¼1Pi � Oað Þ2
ð13Þ;
NSME ¼XN
i¼1Pi � Oið Þ2XN
i¼1Oi � Oað Þ2
ð14Þ
272 K. Gillette et al. / Soil & Tillage Research 165 (2017) 268–278
Where Pi and Oi are paired simulated and observed results, Oa isthe average of observed values over the 2003–2006 measurementperiods, and N is the number of data pairs. The NSME wascalculated to statistically compare observed and simulatedcumulative N2O emissions from 2003 to 2006. NSME is a statisticalcalculation used to normalize residual variance between observedand simulated data and evaluate how well the data fit on a 1:1 linecomparison (Moriasi et al., 2007). Soil water content, soiltemperature and N2O emissions were averaged over the four year(2003–2006) during the early (April-June), mid (July-August), andlate (September–October) growing season, and correlations (R2)between observed and simulated results are used to compareddifferences.
3. Results and discussion
3.1. Tillage effects on yield and N uptake
Simulated crop yield during the four year simulation period(2003–2006) was in good agreement with the measured data forall HN and LN tillage treatments, with mean difference (MD) valuesof <0.9 Mg ha�1, root mean squared errors (RMSE) of <1.2 Mg ha�1,and Nash-Sutcliffe Model Efficiency (NMSE) values of >0.4(Table 1). Simulated aboveground biomass closely matchedmeasured data as well, with corresponding to RMSE values of1.7, 1.6, 1.5, and 1.3 Mg ha�1 for HN-NT, HN-CT, LN-NT, and LN-Cttreatments, respectively (Table 1). Overall, yield and biomass wereclosely simulated to the measured data among the various tillagetreatments, especially in that predicted crop production wasslightly lower in the NT treatments compared to CT treatments.Grain N content was over predicted for all tillage treatments, whichcorresponded to negative NMSE values (Table 1). Thorp et al.(2008) also reported an over prediction of grain N uptake by15and 40% using RZWQM. Similar to grain N content, RZ-SHAWsimulated plant N uptake was also over predicted, but was mostexaggerated in the HN-NT and HN- CT treatments, with RMSEvalues of 53.9 and 43.9 kg N ha�1 and negative NMSE values of 3.7and 3.5, respectively (Table 1). Fang et al. (unpublished) evaluateddifferent grain N concentrations algorithms for modern hybridcorn which may improve comparisons between measured andmodeled data.
3.2. Soil water, temperature, and nitrate
Although irrigation management was similar between the NTand CT treatments, tillage practices created differences in soil
Table 1Statistical (MD, mean difference; RMSE, root mean square error) results between obser(Mg ha�1), grain N content (kg N ha�1) and Plant N uptake (kg N ha�1) for no-till (NT) and
Tillage NRate
Yield Mg ha�1 Biomass Mg ha�1
Obs RZ MD RMSE r2 NMSE Obs RZ MD RMSE r2 N
NT HN 9.1 9.2 0.1 0.9 0.3 0.5 17.5 16.8 �0.7 1.7 0.6 �LN 4.2 5.5 0.9 1.2 0.5 0.6 10.0 11.1 1.7 1.5 0.3 �
CT HN 10.1 10.2 0.4 0.9 0.3 0.4 17.3 18.3 0.9 1.6 0.6 �LN 5.5 5.7 0.2 0.4 0.5 0.7 11.3 11.6 0.3 1.3 0.8 0
Table 2Statistical (MD, mean difference; RMSE, root mean square error; NSME, Nash-Sutcliffe mSHAW simulated soil water content at 10 cm, soil temperature at 5 cm, and profile soil
Variable Data Number Depth(cm)
Obs RZ MD
No-Till
Soil water content (cm�3 cm�3) 236 10 0.27 0.25 �0.02
Soil temperature (�C) 402 5 16.0 14.6 �1.4
Profile soil water (cDm) 16 180 54.4 52.6 �1.8
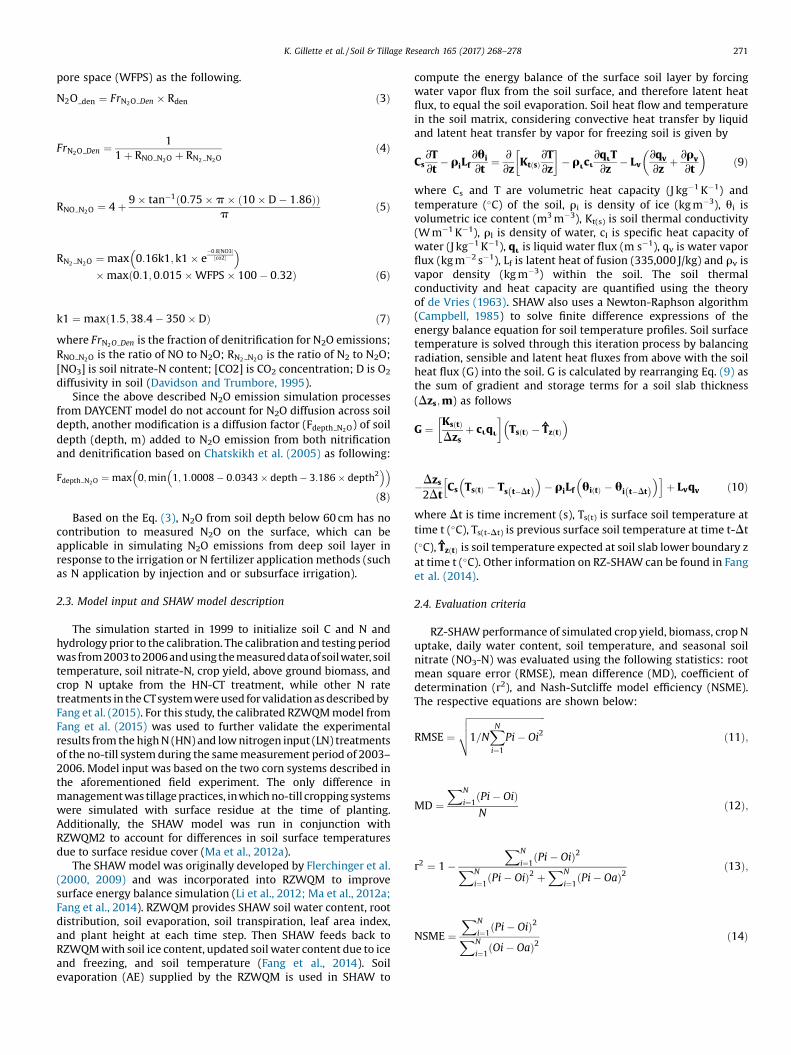
water content and soil temperature. Soil water content (0–10 cm)and soil temperature (0–5 cm) were similar among the N treat-ments within the two tillage systems, and were averaged across Ntreatments. In general, RZ-SHAW responded to field conditions inthe NT and CT systems, but simulated soil water content was underpredicted during 2003 and 2004 (Fig. 1). There was abnormallyhigh soil water content (>0.36) measured in the field during 2003and 2004 caused by high precipitation events of >4.5 cm during theearly growing season (Liu et al., 2005; Halvorson et al., 2014).Simulated field capacity in the 0–10 cm layer of the soil is 0.334 inthe calibrated model, but simulated soil water content rangedbetween 0.24 and 0.27 during the early growing seasons of 2003and 2004 (Fig. 1), suggesting that movement of water through thesoil profile was over predicted. The 1:1 comparison in Fig. 2a,demonstrates the tendency of the model to under predict surfacesoil water content (0–10 cm) on a seasonal basis, especially in theNT treatment, and illustrates the slightly drier soil conditionsmeasured for the CT treatment (Fig. 2b).
Averaged over the four year study period surface soil watercontent (0–10 cm) was under predicted in the NT treatments, withresidual mean differences (MD) of �0.02 cm3 cm�3 and RMSEvalues of 0.05 cm3 cm�3 (Table 2). Root mean square errors (RMSE)values from 0.02 to 0.05 cm3 cm�3 have been used for simulatedsoil water content in model tests using RZWQM (Cameira et al.,2005). By excluding surface water content during the early 2003growing season NMSE values are slightly improved from �0.14 to�0.03. Our results are similar to Fang et al. (2015), who alsoreported near zero NMSE values of 0.09 and 0.06 for soil watercontent in the calibration and validation CT treatments, respec-tively. Predicted soil water content for 2003–2006 was closer tomeasurements from CT treatments, with a MD and RMSE values of�0.006 and 0.02 cm3 cm�3 (Table 2).
By excluding the high profile soil water storage of 57 cmmeasured during spring of 2003, statistical comparisons betweenobserved and simulated water storage was improved from aninitial NMSE value of �0.34 (shown in Table 2) to 0.12. Averagedover the four year study period (2003–2006), water storage in the0–180 cm soil profile was under predicted for NT treatment bynearly 4%, with MD and RMSE values of �1.8 cm and 2.8 cm,respectively (Table 2). Fang et al. (2010) also reported adisagreement in stored soil water under wet soil conditions, witha RMSE value of 5.4 cm, a 15% difference between observed andpredicted profile soil water from a winter wheat maize doublecropping system in Northern China. There was a slight improve-ment (2–5%) using RZ-SHAW coupled model for simulated soilwater storage compared to the initial analysis of the conventional
ved and RZ-SHAW simulated (RZ)crop growth variable of yield (Mg ha�1), biomassconventional-till (CT) high N rate (HN) rate and low N input (LN) from 2003 to 2006.
Grain N kg N ha�1 Plant N kg N ha�1
MSE Obs RZ MD RMSE r2 NMSE Obs RZ MD RMSE r2 NMSE
0.9 125 164 39.9 43 0.5 �4.3 186 224 33.6 53.9 0.3 �3.70.6 41 51 10.1 18 0.2 �3.7 63 73 10.0 16.0 0.3 �0.60.2 130 172 42.6 63 0.6 �2.0 197 233 42.2 43.9 0.3 �3.5.7 53 57 3.6 14 0.2 �2.7 77 81 4.4 9.3 0.4 0.04
odel efficiency; r2, coefficient of determination) results between observed and RZ- water content in the 180 cm for no-till and conventional-till from 2003 to 2006.
RMSE NSME r2 Obs RZ MD RMSE NSME r2
Conventional-Till
0.04 �0.14 0.31 0.26 0.25 �0.006 0.04 �0.02 0.213.12 0.54 0.75 16.3 15.4 �0.81 2.8 0.64 0.773.3 �0.34 0.33 51.8 52.5 0.45 1.8 0.05 0.49
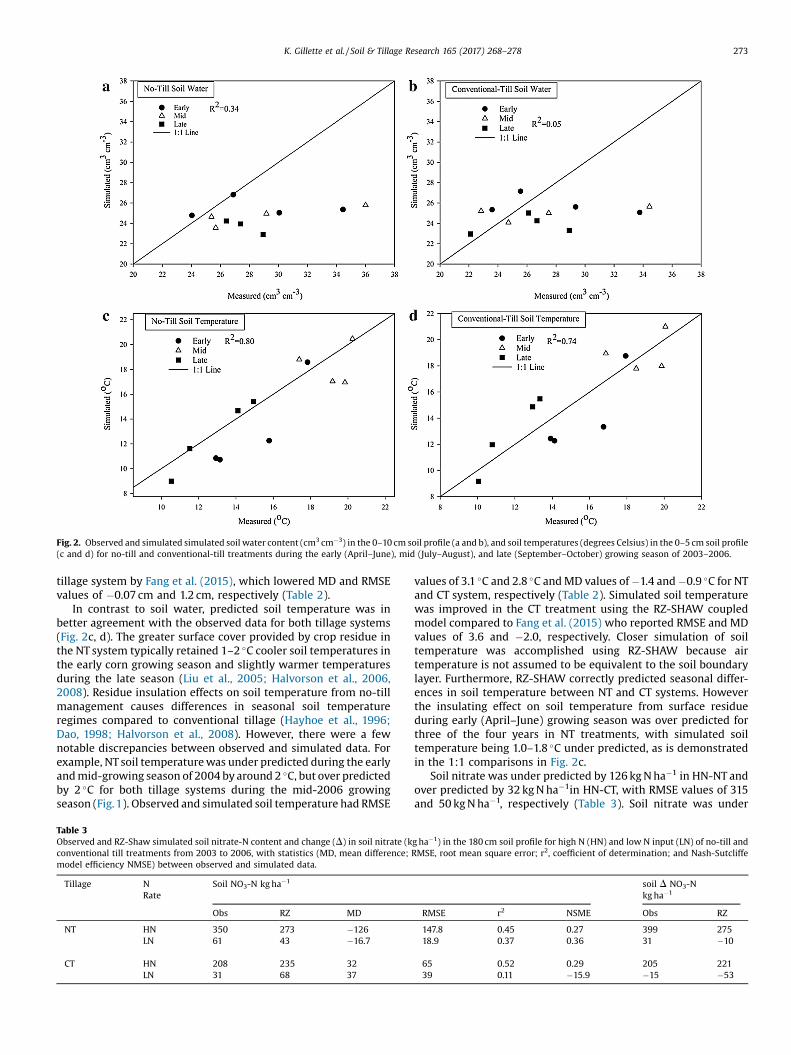
Fig. 2. Observed and simulated simulated soil water content (cm3 cm�3) in the 0–10 cm soil profile (a and b), and soil temperatures (degrees Celsius) in the 0–5 cm soil profile(c and d) for no-till and conventional-till treatments during the early (April–June), mid (July–August), and late (September–October) growing season of 2003–2006.
K. Gillette et al. / Soil & Tillage Research 165 (2017) 268–278 273
tillage system by Fang et al. (2015), which lowered MD and RMSEvalues of �0.07 cm and 1.2 cm, respectively (Table 2).
In contrast to soil water, predicted soil temperature was inbetter agreement with the observed data for both tillage systems(Fig. 2c, d). The greater surface cover provided by crop residue inthe NT system typically retained 1–2 �C cooler soil temperatures inthe early corn growing season and slightly warmer temperaturesduring the late season (Liu et al., 2005; Halvorson et al., 2006,2008). Residue insulation effects on soil temperature from no-tillmanagement causes differences in seasonal soil temperatureregimes compared to conventional tillage (Hayhoe et al., 1996;Dao, 1998; Halvorson et al., 2008). However, there were a fewnotable discrepancies between observed and simulated data. Forexample, NT soil temperature was under predicted during the earlyand mid-growing season of 2004 by around 2 �C, but over predictedby 2 �C for both tillage systems during the mid-2006 growingseason (Fig.1). Observed and simulated soil temperature had RMSE
Table 3Observed and RZ-Shaw simulated soil nitrate-N content and change (D) in soil nitrate (kconventional till treatments from 2003 to 2006, with statistics (MD, mean difference;
model efficiency NMSE) between observed and simulated data.
Tillage NRate
Soil NO3-N kg ha�1
Obs RZ MD
NT HN 350 273 �126
LN 61 43 �16.7
CT HN 208 235 32
LN 31 68 37
values of 3.1 �C and 2.8 �C and MD values of �1.4 and �0.9 �C for NTand CT system, respectively (Table 2). Simulated soil temperaturewas improved in the CT treatment using the RZ-SHAW coupledmodel compared to Fang et al. (2015) who reported RMSE and MDvalues of 3.6 and �2.0, respectively. Closer simulation of soiltemperature was accomplished using RZ-SHAW because airtemperature is not assumed to be equivalent to the soil boundarylayer. Furthermore, RZ-SHAW correctly predicted seasonal differ-ences in soil temperature between NT and CT systems. Howeverthe insulating effect on soil temperature from surface residueduring early (April–June) growing season was over predicted forthree of the four years in NT treatments, with simulated soiltemperature being 1.0–1.8 �C under predicted, as is demonstratedin the 1:1 comparisons in Fig. 2c.
Soil nitrate was under predicted by 126 kg N ha�1 in HN-NT andover predicted by 32 kg N ha�1in HN-CT, with RMSE values of 315and 50 kg N ha�1, respectively (Table 3). Soil nitrate was under
g ha�1) in the 180 cm soil profile for high N (HN) and low N input (LN) of no-till andRMSE, root mean square error; r2, coefficient of determination; and Nash-Sutcliffe
soil D NO3-Nkg ha�1
RMSE r2 NSME Obs RZ
147.8 0.45 0.27 399 27518.9 0.37 0.36 31 �10
65 0.52 0.29 205 22139 0.11 �15.9 �15 �53

274 K. Gillette et al. / Soil & Tillage Research 165 (2017) 268–278
predicted in the LN-NT, with MD and RMSE values of 16.7 and44 kg N ha�1, respectively. Soil nitrate was over predicted in the LN-CT treatment, with an MD of 37 kg N ha�1 (Table 3). RZ-SHAWmodel accurately simulated net change (D) in soil NO3-N over themeasurement period (2003–2006) by: (1) predicting a largerincrease in soil NO3 for HN-NT compared to HN-CT; (2) littlechange for the LN-NT and; (3) a net a loss in the LN-CT treatment(Table 3). No-till systems may be more efficient at conserving soil Ndue to a larger SOC pool compared to a conventionally tilled system(Follett and Schimel, 1989). Lower soil nitrate levels measured inCT soils were partly a result of higher plant N uptake and higherrates of N2O loss (Mutegi et al., 2010). Soil nitrate levels and crop Nuptake were over predicted, but N2O emissions were underpredicted in both CT treatments (see N2O discussion in Section 3.3),indicating that the soil N uptake routine may need furtherimprovement (Fang et al., unpublished).
3.3. N2O Emissions
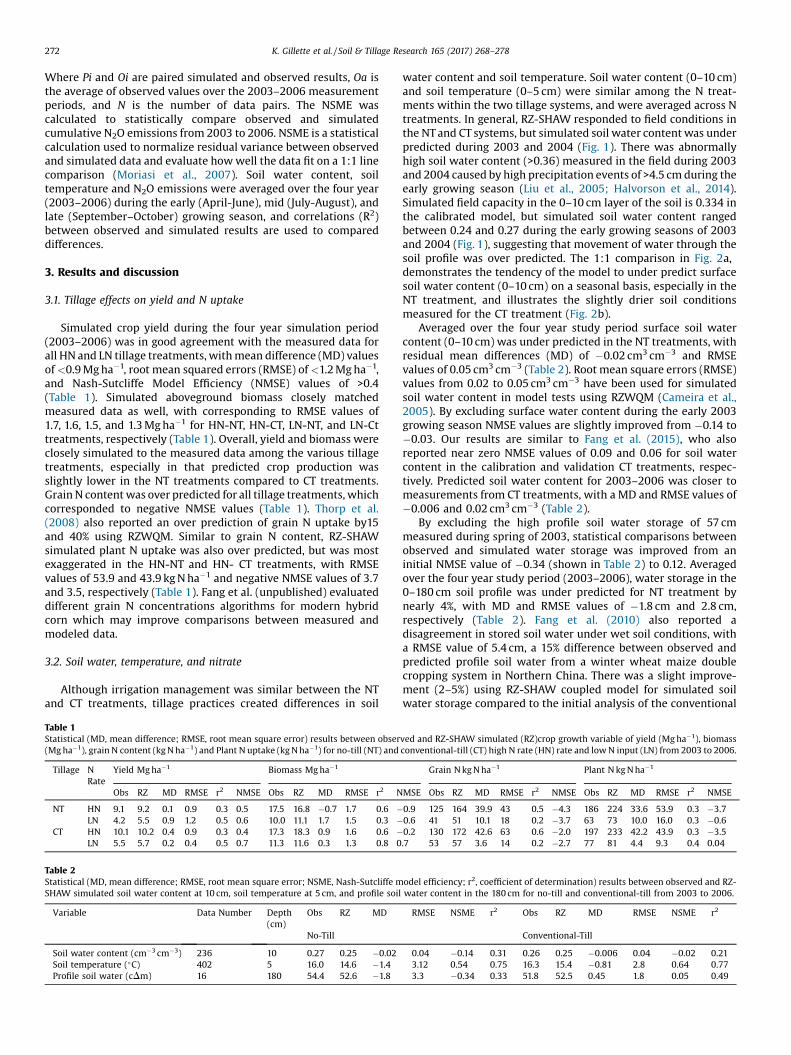
Observed and simulated daily N2O flux (g N ha day�1) arepresented in Fig. 3 during 2003–2006 for each tillage treatment.High precipitation led to rapid and sporadic N2O losses immedi-ately following N application in 2003 (Liu et al., 2005), leading tothe highest emissions and demonstrating the influence of climate
Fig. 3. Observed (closed circles) and RZ-SHAW (RZ) simulated (solid line) daily nitrous ox(HN) and low N input (LN) treatments in irrigated corn from 2003 to 2006. Second Y aemissions (kg N2O-N ha�1 yr�1). Arrows indicate fertilizer applications to HN tillage tre
on N2O emissions across years (Lesschen et al., 2011). The 2003measurement period is also a good example of the requirement tosimulate complex environmental interactions regulating microbialnitrification and denitrification (Bessou et al., 2010; Fang et al.,2015). Two N2O peaks were measured in 2003 from HN tillagetreatments following the urea fertilizer applications (Fig. 3). Thereare often two N2O peaks after fertilizer application, the first beingfrom nitrification during the transformation of urea to NH4-N; thenthe product of nitrification, NO3-N, provides the necessarysubstrate for N2O emissions from denitrification (Skiba and Smith,2000). RZ-SHAW predicted two N2O peaks from HN fertilizedtreatments, however while the model correctly predicted an initialhigh surge of N2O, the duration was under estimated, resulting inunder predicted cumulative emissions during 2003 (Fig. 3). Modelshave typically been unable to predict high N2O fluxes fromintensively managed agricultural systems of temperate region(Beheydt et al., 2007; Del Grosso et al., 2008). For this analysis,simulated N2O emissions were likely improved by the moresophisticated sub-hourly accounting of daily soil water content inthe RZ-SHAW model compared to the tipping bucket methodsimulated within the DAYCENT model as used by Del Grosso et al.(2008).
Lower N2O emissions were measured in both tillage systemsfollowing fertilizer application in 2004 compared to those
ide flux (g N2O-N ha�1 day�1) from high no-till (NT) and conventional-till (CT) high Nxis is observed (dotted line) and RZ-SHAW (RZ) simulated (solid) cumulative N2Oatments.

K. Gillette et al. / Soil & Tillage Research 165 (2017) 268–278 275
measured in 2003 (Fig. 3). There was no significant tillage effectover the 2003 and 2004 study period (Liu et al., 2005). Instead ofone low N2O peak that lasted for several weeks, as observed in theHN-NT treatment during 2004, RZ-SHAW simulated three smallN2O peaks, resulting in an under prediction of annual emissions by0.71 kg N2O-N ha�1 (Fig. 3). Conversely, peak fluxes were slightlyover-predicted in the HN-CT treatment and slightly underpredicted in the HN-NT (Fig. 3), causing simulated emissions inthe HN-CT to be twice as high as the HN-NT treatments during2004. High N2O fluxes were measured in the LN-CT treatmentduring the late season of 2004, increasing annual emission to0.5 kg N2O-N ha�1 (Fig. 3). The failure to simulate these late seasonfluxes in LN-CT treatment caused emissions to be under predictedby approximately 50% in 2004 (Fig. 3).
Halvorson et al. (2008) evaluated N2O emissions from the CTand NT tillage treatments during 2005 and 2006 using a spiltapplication of conventional (UAN in 2005 and urea in 2006) and anenhanced efficiency (polymer-coated urea (PCU)) fertilizer for highN rate treatments. Observed and simulated emissions rangedbetween 0.2 and 0.15 kg N2O ha�1 yr�1 in the LN tillage treatmentsduring 2005 and 2006 (Fig. 3). In the field experiment there was asignificant N rate by year interaction for the HN treatments causedby significantly higher emissions in 2005 than in 2006. Fieldmeasurements showed similar emissions between HN-CT and HN-NT during 2005, totaling 1.6 and 1.75 kg N2O-N ha�1, but the HN-CTtreatment had higher emissions than HN-NT treatment during2006, that totaled 1.25 and 0.75 kg N2O-N ha�1, respectively(Halvorson et al., 2008). In the field, the PCU fertilizer applicationsdid not result in rapid N2O fluxes from either HN treatment during2005 or 2006 (Fig. 3). The poly-coated technology is designed torelease more N as soil temperature increases, slowing the release ofurea and inhibiting N2O fluxes by limiting N availability tomicrobial processes (Halvorson et al., 2008; Olson-Rutz et al., 2011;Halvorson et al., 2014). The RZWQM model however does notsimulate slow N release mechanisms from enhanced efficiencyfertilizers such as those formulated in the PCU fertilizer; thereforethe low fluxes from the HN-NT treatment were over predictedespecially after the first fertilization 2006 simulation period,where predicted emissions were nearly twice as high as theobserved.
Cumulative emissions during the four years, 2003–2006, fellwithin the mean standard errors of the three field replicates overthe four year measurement period for all treatments (Table 4).Field measurements indicated HN-NT treatments had slightlylower N2O emissions (12%) than the HN-CT treatment. RZ-SHAWsimulated N2O emissions were slightly under predicted by 0.10(1.5%) and 0.56 (7.1%) kg N ha�1 for HN-NT and HN-CT treatments,respectively, with corresponding NSME values of 0.58 and 0.69.Overall, N2O fluxes in response to tillage were satisfactorilysimulated, especially in that RZ-SHAW predicted slightly lower
Table 4Observed and RZ-SHAW simulated N2O emissions (kg N ha�1) during the four year study pN input (LN) treatments. Comparisons between observed and RZ-SHAW simulated
determination; (MD, mean difference; RMSE, root mean square error. Greenhouse gas (Ginto carbon dioxide equivalent (CO2e) by using Global warming potential of 298) and d
Tillage N Rate N2O kg N ha�1 yr�1
Obs ste* RZ-SHAW MD
NT HN 6.88 5.67 6.78 0.05
LN 0.62 0.70 0.79 �0.05
CT HN 7.85 4.91 7.29 0.28
LN 0.98 0.80 0.69 0.15
Mean standard error (ste)* of three replications from daily N2O flux during 2003–2006
emissions (10%) from the HN-NT treatment compared to HN-CTtreatment (Table 4). However while simulated N2O emissions weresimilar to observed in HN-NT treatment, emissions were underpredicted during 2003 and 2004 and over predicted during 2005and 2006 (see HN-NT Fig. 3). Simulated N2O emissions were overpredicted in the LN-NT treatment by 0.11 (16%) kg N ha�1, with acorresponding NSME value of 0.87. RZ-SHAW under predictedemissions by 0.29 (29%) kg N ha�1 in the LN-CT treatment (Table 4),resulting in a slightly lower NSME value of 0.5. However, this wasmostly an effect of under predicted emissions during the late 2004growing season. By excluding the late 2004 measurement period,simulated emissions were within 1.3% of the observed, andincreased the NSME value to 0.97 for the LN-CT treatment.
In order to demonstrate the capability of the RZ-SHAW model topredict seasonal N2O emission trends throughout the growingseason, seasonal N2O emissions (early (April–June), mid (July–August), and late (September–October)) were averaged for eachtreatment (Fig. 4). Differences between measured and simulatedearly-season N2O emissions for HN-NT treatments are notable(Fig. 4a), but importantly high standard errors are often associatedwith high N2O fluxes from field measurements (Halvorson et al.,2008). There were strong positive correlations (R2) betweenmeasured and simulated for seasonal N2O emissions in the HNtillage treatments (�0.6), and slightly lower correlations for LNtreatments (�0.3), see Fig. 4. Theoretically process based modelsshould be able to predict seasonal variability of N2O emissions (Caiet al., 2003). Yet previous efforts to simulate emissions from thesefield plots using DAYCENT resulted in a 50% over prediction of N2Oemissions caused by high simulated mineralization rates duringthe latter part of the growing season (Del Grosso et al., 2008).
3.4. Emission factors and GHG intensity
Observed and simulated emission factors (EF) [=(N2O emissionat N rate – N2O emission at zero N rate)/N rate) were 0.66 and 0.65%for HN-NT and 0.75 and 0.70% for HN-CT treatments, respectively.The IPCC Tier I methodology uses an EF of 1% for applied fertilizer (IPCC, 2006). Because the Tier I approach does not account forspatial and temporal variation of climate and soil (Lesschen et al.,2011), N2O emissions would be over predicted by 30 and 20% usingthe Tier I approach for HN-NT and HN-CT, respectively. Contrary tothe Tier I approach, we show that using a validated ecosystemmodel in conjunction with measured data improves the reliabilityof simulated N2O emission, as suggested by IPCC Tier IIImethodology (IPCC, 2006; Metivier et al., 2009).
Greenhouse gas (GHG) intensity provides an estimate ofemissions per unit of yield (Mg ha�1), and are converted to kg ofcarbon dioxide equivalents (CO2e) based on the 100 year globalwarming potential of 298 for N2O (Eggleston et al., 2006).Measured GHG intensities were 54.8 and 57.8 kg CO2e Mg grain�1
eriod (2003–2006) from no-till (NT) and conventional-till (CT) high N (HN) and lowN2O emissions using Nash-Sutciffe model efficiency (NMSE); r2, coefficient ofHG) intensity is calculated from observed and simulated N2O emissions (convertedivided by the respective grain yields (Mg) over the 2003–2006 study period.
GHG intensityCO2e Mg grain yield�1
RMSE r2 NMSE Obs RZ-SHAW
1.85 0.77 0.58 54.8 54.50.20 0.52 0.87 11.9 10.7
1.98 0.50 0.69 57.8 53.00.31 0.50 0.51 13.1 8.9
.
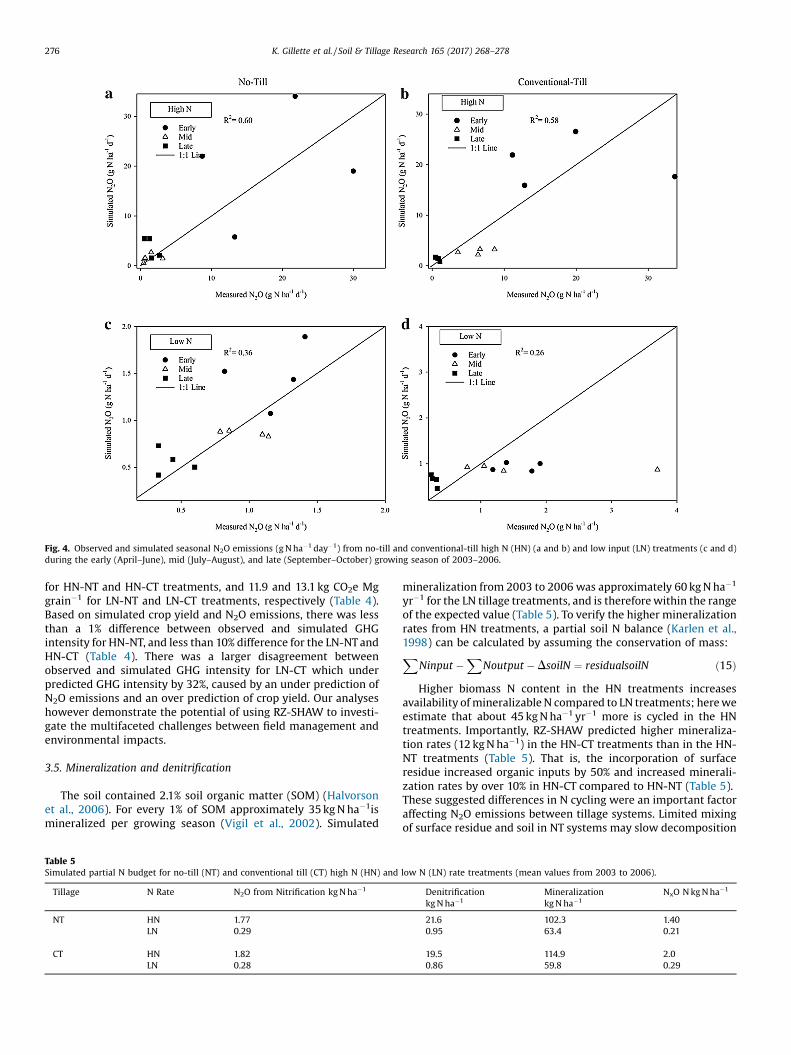
Fig. 4. Observed and simulated seasonal N2O emissions (g N ha�1 day�1) from no-till and conventional-till high N (HN) (a and b) and low input (LN) treatments (c and d)during the early (April–June), mid (July–August), and late (September–October) growing season of 2003–2006.
276 K. Gillette et al. / Soil & Tillage Research 165 (2017) 268–278
for HN-NT and HN-CT treatments, and 11.9 and 13.1 kg CO2e Mggrain�1 for LN-NT and LN-CT treatments, respectively (Table 4).Based on simulated crop yield and N2O emissions, there was lessthan a 1% difference between observed and simulated GHGintensity for HN-NT, and less than 10% difference for the LN-NT andHN-CT (Table 4). There was a larger disagreement betweenobserved and simulated GHG intensity for LN-CT which underpredicted GHG intensity by 32%, caused by an under prediction ofN2O emissions and an over prediction of crop yield. Our analyseshowever demonstrate the potential of using RZ-SHAW to investi-gate the multifaceted challenges between field management andenvironmental impacts.
3.5. Mineralization and denitrification
The soil contained 2.1% soil organic matter (SOM) (Halvorsonet al., 2006). For every 1% of SOM approximately 35 kg N ha�1ismineralized per growing season (Vigil et al., 2002). Simulated
Table 5Simulated partial N budget for no-till (NT) and conventional till (CT) high N (HN) and
Tillage N Rate N2O from Nitrification kg N ha�1
NT HN 1.77
LN 0.29
CT HN 1.82
LN 0.28
mineralization from 2003 to 2006 was approximately 60 kg N ha�1
yr�1 for the LN tillage treatments, and is therefore within the rangeof the expected value (Table 5). To verify the higher mineralizationrates from HN treatments, a partial soil N balance (Karlen et al.,1998) can be calculated by assuming the conservation of mass:X
Ninput �X
Noutput � DsoilN ¼ residualsoilN ð15Þ
Higher biomass N content in the HN treatments increasesavailability of mineralizable N compared to LN treatments; here weestimate that about 45 kg N ha�1 yr�1 more is cycled in the HNtreatments. Importantly, RZ-SHAW predicted higher mineraliza-tion rates (12 kg N ha�1) in the HN-CT treatments than in the HN-NT treatments (Table 5). That is, the incorporation of surfaceresidue increased organic inputs by 50% and increased minerali-zation rates by over 10% in HN-CT compared to HN-NT (Table 5).These suggested differences in N cycling were an important factoraffecting N2O emissions between tillage systems. Limited mixingof surface residue and soil in NT systems may slow decomposition
low N (LN) rate treatments (mean values from 2003 to 2006).
Denitrificationkg N ha�1
Mineralizationkg N ha�1
NxO N kg N ha�1
21.6 102.3 1.400.95 63.4 0.21
19.5 114.9 2.00.86 59.8 0.29

K. Gillette et al. / Soil & Tillage Research 165 (2017) 268–278 277
rates, causing differences in N cycling between tillage systems andinfluencing soil N2O emissions (Follett and Schimel, 1989;Quemada and Cabrera, 1997). Crop simulation models that canaccount for differences in N cycling through residue managementmay help improve estimates of N2O emissions (Delgado et al.,2010).
Biological nitrification was the main parameter adjusted in thenew RZWQM2-GHG simulation component (Fang et al., 2015), asthis was the primary pathway for N2O emission in this semi-aridsystem (Mosier et al., 1996). RZ-SHAW predicted that 90–95% ofN2O was emitted through microbial nitrification, and that HN-NThad nearly 10% higher denitrification rates (Table 5). At these fieldplots, Liu et al. (2005) measured lower nitric oxide (NO) emissionsfrom NT fertilized plots, caused by wetter and less aerated soilconditions which increased microbial denitrification. Gas diffusionis slowed in soils with higher soil water content or greatermicroporosity, enabling NO to be further reduced to N2O (Conrad,1996; McTaggart et al., 2002). Also, RZ-SHAW predicted 30% higheraerobic microbial activity in CT compared to NT treatments (datanot shown). Soil aggregates are reconsolidated within theRZWQM2 model due to fewer soil disturbances under NTmanagement. Soil disturbance from tillage management can alterthe functional groups of microbial communities causing differ-ences in denitrification rates (Cavigelli and Robertson, 2001).Ecosystem crop models enhance field research by offering acomprehensive evaluation of multiple biological processes (Ahujaand Hatfield, 2007; Zhang et al., 2013), and can lead to newinvestigative research (Oreskes et al., 1994). Model resultspresented here have shown that tillage management causeddifferences in N cycling and microbial communities between NTand CT systems.
4. Conclusion
This study is the first evaluation of the newly added GHGcomponent to RZ-SHAW under different tillage systems. RZ-SHAWclosely predicted crop yield and biomass over the four year studyperiod (2003–2006) for all tillage treatments. By accounting forresidue insulation effects on the soil surface, lower early seasonsurface soil temperatures were correctly predicted in NT comparedto CT treatments. However, there were several discrepanciesbetween observed and simulated daily N2O fluxes. For example,the initial surge of simulated N2O flux was too high and theduration was too short during the 2003 simulation period,resulting in an under prediction of N2O for HN treatments. Themodel failed to simulate the slightly higher annual emissions fromLN-CT compared to LN-NT, though this was primarily caused byhigh N2O measured during the late 2004 growing season.Emissions from HN-NT were over predicted in 2005 and 2006when enhanced efficiency fertilizers were applied as the respectivesecond and first treatment applications. Nevertheless, the strongcorrelations between measured and simulated N2O emissionsindicate the model made accurate predictions on a seasonal basis.Observed and simulated cumulative N2O emissions from 2003 to2006 were also in close agreement, with 12 and 10% loweremissions from HN-NT compared to HN-CT, respectively. Modeloutput showed differences in N cycling between tillage treatments,indicating lower organic residue inputs and higher denitrificationrates lowered simulated N2O emissions in HN-NT. Overall, RZ-SHAW simulated N2O emissions were reasonable between thedifferent N and tillage treatments of this irrigated corn system, andmay be applicable to other agricultural practices within the region.Deserving further attention is the slowed diffusion rates of ureahydrolysis when using enhanced efficiency fertilizers within RZ-SHAW model, as this would add model support to N2O mitigationstrategies.
References
Ahuja, L.R., Hatfield, J.L., 2007. Integrating soil and crop research with systemmodels in the Midwest USA: purpose and overview of the Special Issue.Geoderma 140 (3), 217–222.
Ahuja, L.R., Rojas, K.W., Hanson, J.D., Shaffer, M.J., Ma, L., 2000. The Root Zone WaterQuality Model. Water Resources Publications, Highlands Ranch Colo.
Beheydt, D., Boeckxa, P., Sleutelb, S., Lic, C., Van Cleemputa, O., 2007. Validation ofDNDC for 22 long term N2O field emission measurements. Atmos. Environ. 41,6196–6211.
Bessou, C., Mary, B., Leonard, J., Roussel, M., Grehan, E., Gabrielle, B., 2010. Modellingsoil compaction impacts on nitrous oxide emissions in arable fields. Eur. J. SoilSci. 61, 348–363.
Bouwman, A.F., Fung, I., Matthews, E., John, J., 1993. Global analysis of the potentialfor N2O production in the natural soils. Glob. Biogeochem. 7 (3), 557–597.
Bouwman, A.F., Beusen, A.H.W., Griffeoen, J., Van Groegnigen, J.W., Hefting, M.M.,Oenema, O., Van Puijenbroek, P.J.T.M., Seitzinger, S., Slomp, C.P., Stehfest, E.,2013. Global trends and ncerainties in terrestrial denitrification and N2Oemissions. Philos. Trans. R. Soc. Lond. Ser. B Biol. Sci. 368, 1–11.
Cai, Z., Sawamoto, T., Li, C., Kang, G., Boonjawat, J., Mosier, A., 2003. Field evaluationof the DNDC model for greenhouse gas emissions in East Asian croppingsystems. Glob. Biogeochem. Cycles 17, 1107.
Cameira, M.R., Fernando, R.M., Ahuja, L., Pereira, L., 2005. Simulating the fate ofwater in field soil-crop environment. J. Hydrol. 315, 1–24.
Campbell, G.S., 1985. Soil Physics With BASIC: Transport Models for Soil–plant Sys-tems. Elsevier, Amsterdam, pp. 150.
Cavigelli, M., Robertson, G., 2001. Role of denitrifier diversity in rates of nitrousoxide consumption in a terrestrial ecosystem. Soil Biol. Biochem. 33, 297–310.
Cavigelli, M.A., Del Grosso, S.J., Leibig, M.A., Snyder, C.S., Fixen, P.E., Venterea, R.T.,Leytem, A.B., McLain, J.E., Watts, D.F., 2012. US agricultural nitrous oxideemissions: context, status, and trends. Front. Ecol. Environ. 537–546.
Chatskikh, D., Olesen, J., Berntsen, J., Regina, K., Yamulki, S., 2005. Simulation ofeffects of soils, climate and management on N2O emission from grasslands.Biogeochemistry 76, 395–419.
Conrad, R., 1996. Soil microorganisms as controllers of atmospheric trace gases (H2,CO,CH4, OCS, N2O, and NO). Microbiol. Rev. 600–640.
Dao, T.H., 1998. Tillage and crop residue effects on carbon dioxide evolution andcarbon storage in a Paleustoll. Soil Sci. Soc. Am. J. 62, 250–256.
David, M., Del Grosso, S.J., Hu, X., Marshal, E.P., McIsaac, G.F., Parton, W.J., Tonitto, C.,Youssef, M.A., 2009. Modeling denitrification in a tile drained, corn and soybeanagroecosystem of Illinois, USA. Biogeochemistry 93, 7–30.
de Vries, D.A., 1963. Thermal properties of soils. In: van Wijk, W.R. (Ed.), Physics ofPlant Environment. North-Holland Publishing Company, Amsterdam, pp. 210–235.
Davidson, E.A., Trumbore, S.E., 1995. Gas diffusivity and production of CO2 in deepsoils of the eastern Amazon. Tellus B 47, 550–565.
Del Grosso, S.J., Parton, W.J., Mosier, A.R., Ojima, D.S., Kulmala, A.E., Phongpan, S.,2000. General model for N2O and N2 gas emissions from soils due todenitrification. Glob. Biogeochem. Cycles 14, 1045–1060.
Del Grosso, S.J., Parton, W.J., Halvorson, A.D., 2008. Testing DAYCENT modelsimulations of corn yields and nitrous oxide emissions in irrigated systems inColorado. J. Environ. Qual. 37, 1383–1389.
Delgado, J.A., Del Grosso, S.J., Ogle, S.M., 2010. 15N isotopic crop residue cyclingstudies and modelling suggest that IPCC methodologies to asses residuecontribution to N2O-N emission should be reevaluated. Nutr. Cycl. Agroecosyst.86, 383–390.
Dobbie, K.E., Smith, K.A., 2003. Impact of different forms of N fertilizer on N2Oemission from intensive grassland. Nutr. Cycl. 67, 37–46.
Eggleston, S., Buendia, L., Miwa, K., Ngara, T., Tanabe, K., 2006. IPCC Guidelines forNational Greenhouse Gas Inventories. Intergovernmental Panel on ClimateChange.
Fang, Q.X., Ma, L., Yu, Q., Malone, R.W., Saseendran, S.A., Ahuja, L.R., 2008. Modelingnitrogen and water management effects in a wheat-maize double croppingsystem. J. Environ. Qual. 37 (6), 2232–2242.
Fang, Q.X., Ma, L., Yu, Q., Ahuja, L.R., Malone, R.W., Hoogenbom, G., 2010. Irrigationstrategies to improve the water use efficiency of wheat–maize double croppingsystems in North China Plain. Agric. Water Manage. 97, 1165.
Fang, Q.X., Malone, R.W., Ma, L., Jaynes, D.B., Thorpe, K.R., Green, T.R., Ahuja, L.R.,2012. Modeling the effects of controlled drainage, N rate and weather on nitrateloss to subsurface drainage. Agric. Water Manage. 103, 150–161.
Fang, Q.X., Ma, L., Flerchinger, G.N., Qi, Z., Ahuja, L., Xing, H.T., Yu, Q., 2014. Modelingevapotranspiration and energy balance in a wheat- maize cropping systemusing the revised RZ-SHAW model. Agric. For. Meteorol. 194, 218–229.
Fang, Q.X., Ma, L., Halvorson, A.D., Malone, R.W., Ahuja, L.R., Del Grosso, S.J., 2015.Evaluating four nitrous oxide emission algorithms in response to N rate on anirrigated corn field. Environ. Model. Software 72, 56–70.
Flerchinger, G.N., Aiken, R.M., Rojas, K.W., Ahuja, L.R., 2000. Development of theRoot Zone Water Quality Model (RZWQM) for over-winter conditions. Trans.ASAE 43 (1), 59–68.
Flerchinger, G.N., Xiao, W., Sauer, T.J., Yu, Q., 2009. Simulation of within canopyradiation exchange. NJAS Wageningen J. Life Sci. 57 (1), 5–15.
Follett, R.F., Schimel, D.S., 1989. Effect of tillage practices on microbial biomassdynamics. Soil Sci. Soc. Am. J. 53 (4), 1091–1096.
Halvorson, A.D., Jantalia, C.P., 2011. Nitrogen fertilization effects on irrigation no-tillcorn production and soil carbon nitrogen. Agron. J. 103, 1423–1431.

278 K. Gillette et al. / Soil & Tillage Research 165 (2017) 268–278
Halvorson, A.D., Mosier, A.R., Reule, C.A., Bausch, W.C., 2006. Nitrogen and tillageeffects on irrigated continuous corn yields. Agron. J. 98, 63–71.
Halvorson, A.D., Del Grosso, S.J., Reule, C.A., 2008. Nitrogen, tillage, and crop rotationeffects from irrigated cropping systems. J. Environ. Qual. 37, 1337–1344.
Halvorson, Ardell D., Del Grosso, S.J., Alluvione, F., 2010. Tillage and inorganicnitrogen source effects on nitrous oxide emissions from irrigated croppingsystems. Soil Sci. Soc. Am. J. 74 (2), 436–445.
Halvorson, A.D., Snyder, C.S., Blaylock, A.D., Del Grosso, S.J., 2014. Enhanced-efficiency nitrogen fertilizers: potential role in nitrous oxide emissionmitigation. Agron. J. 106, 715e722.
Hayhoe, H.N., Dwyer, L.M., Stewart, D.W., White, R.P., Culley, J.L.B., 1996. Tillage,hybrid and thermal factors in corn establishment in cool soils. Soil Till. Res. 40(1–2), 39–54.
Hutchinson, G.L., Mosier, A.R., 1981. Improved soil cover method for fieldmeasurement of nitrous oxide fluxes. Soil Sci. Soc. Am. J. 45, 311–316.
IPCC (Intergovernmental Panel on Climate Change), 2006. Prepared by the NationalGreenhouse Gas Inventories Programme. In: Eggleston, H.S., Buendia, L., Miwa,K., Ngara, T., Tanabe, K. (Eds.), IPCC Guidelines for National Greenhouse GasInventories. Published: IGES, Japan.
Karlen, D.L., Kramer, L.A., Logsdon, S.D., 1998. Field-scale nitrogen balancesassociated with long-term continuous corn production. Agron. J. 90, 644–650.
Keeney, D.R., Hatfield, J.L., 2008. Chapter 1. The nitrogen cycle, historicalperspective, and current and potential future concerns, In: Hatfield, J.L., Follett,R.F. (Eds.), Nitrogen in the Environment: Sources, Problems, and Management.2nd ed. Elsevier, pp. 1–18.
Khalil, K., Renault, P., Guerin, N., Mary, B., 2005. Modelling denitrification includingthe dynamics of denitrifiers and their progressing ability to reduce nitrousoxide: comparison with batch experiments. Eur. J. Soil Sci. 56, 491–504.
Kozak, J.A., Aiken, R.M., Flerchinger, G.N., Nielsen, D.C., Ma, L., Ahuja, L.R., 2007.Comparison of modeling approaches to quantify residue architecture effects onsoil temperature and water. Soil Tillage Res. 95 (1–2), 84–96.
Lesschen, J.P., Velthof, G.L., de Vries, W., Kros, J., 2011. Differentiation of nitrous oxideemission factors for agriculture soils. Environ. Poll. 159, 3215–3222.
Li, Z.Z., Ma, L., Flerchinger, G.N., Ahuja, L.R., Wang, H., Li, Z., 2012. Simulation ofoverwinter soil water and soil temperature with SHAW and RZ-SHAW. Soil Sci.Soc. Am. J. 76 (5), 1548–1563.
Liu, X., Mosier, A.R., Halvorson, A.D., Zang, F.S., 2005. Tillage and nitrogenapplication effects on nitrous and nitric oxide emission from irrigated cornfields. Plant Soil 276, 235–249.
Livingston, G.P., Hutchinson, G.L., 1995. Enclosure-based measurement of trace gasexchange: applications and sources of error. In: Matson, P.A., Harriss, R.C. (Eds.),Biogenic Trace Gases: Measuring Emissions from Soil and Water, Methods inEcology. Blackwell Science/Cambridge Univ. Press, Cambridge, UK, pp. 14–51.
Ma, L., Shaffer, M.J., Ahuja, L.R., 2001. Application of RZWQM for soil nitrogenmanagement. In: Shaffer, M.J., Ma, L., Hansen, S. (Eds.), Modeling Carbon andNitrogen Dynamics for Soil Management. Lewis Publ., Boca Raton, FL pp.265e301.
Ma, L., Malone, R.W., Heilman, P., Karlen, D.L., Kanwar, R.S., Cambardella, C.A.,Saseendran, S.A., Ahuja, L.R., 2007. RZWQM simulation of longer-term cropproduction, water, and nitrogen balance in northeast Iowa. Geoderma 140 (3),284–296.
Ma, L., Ahuja, L.R., Saseendran, S.A., Malone, R.W., Green, T.R., Nolan, B.T., Bartling, P.N.S., Flerchinger, G.N., Boote, K.J., Hoogenboom, G., 2011. A protocol forparameterization and calibration of RZWQM in field research. In: Ahuja, L.R.,Ma, L. (Eds.), Methods of introducing system models into agricultural research.SSSA, Madison, Wisconsin, pp. 1–64.
Ma, L., Ahuja, R., Nolan, B.T., Malone, R.W., Trout, T.J., Qi, Z., 2012a. Root zone waterquality model (RZWQM2): model use, calibration and validation. Am. Soc. Agric.Biol. Eng. 55 (4), 1425–1446.
Ma, L., Fleringer, G.N., Ahuja, L.R., Sauer, T.J., Prueger, J.H., Malone, R.W., Hatfield, J.L.,2012b. Simulating the surface energy balance in a soybean canopy with theSHAW and RZ-SHAW models. Am. Soc. Agric. Biol. Eng. 55 (1), 175–179.
Malone, R.W., Ma, L., Heilman, P., Karlen, D.L., Kanwar, R.S., Hatfield, J.L., 2007.Simulated N management effects on corn yield and tile drainage nitrate loss.Geoderma 140, 272–283.
Malone, R.W., Meek, W.D.W., Ma, L., Jaynes, D.B., Nolan, B.T., Karlen, D.L., 2011.Quality assurance of weather data for agricultural system model output: A casestudy using the Walnut Creek watershed in central Iowa. In: Ahuja, L.R., Ma, L.(Eds.), Methods of Introducing System Model into Agricultural Research. SSSA,Madison Wisc, pp. 283–295.
McTaggart, I.P., Akiyama, H., Tsuruto, H., Ball, B.C., 2002. Influence of soil physicalproperties, fertilizer type, and moisture tension on N2O and NO emissions fromnearly saturated Japanese upland soil. Nutr. Cycl. Agroecosyst. 63, 207–211.
Metivier, K.A., Pattey, E., Grant, R.F., 2009. Using the ecosystem mathematical modelto simulate temporal variability of nitrous oxide emissions from a fertilizedagricultural soil. Soil Biol. Biochem. 41, 2370–2386.
Miller, N., Robertson, G.P., Grace, P.G., Gehl, R.J., Hoben, J.P., 2010. Nitrogen fertilizermanagement for nitrous oxide mitigation in intensive corn (Maize) production:an emission reduction protocol for US Midwest agriculture. Mitig. Adapt.Strateg. Glob. Change 15, 185–204.
Moriasi, D.N., Arnold, J.G., Van Liew, M.W., Ginger, R.L., Harmel, R.D., Veith, T.L., 2007.Model evaluation for systematic quantification of accuracy in watershedsimulations. Am. Soc. Agic. Biol. Eng. 885–900.
Mosier, A.R., Parton, W.J., Valentine, D.W., Ojima, D.S., Schimel, D.S., DelGado, J.A.,1996. Ch4 and N2O fluxes in the Colorado short grass steppe: 1. Impact oflandscape and nitrogen addition. Glob. Biochem. Cycles 10, 387–399.
Mosier, A.R., Halvorson, A.D., Reule, C.A., Liu, X.J., 2006. Net global warmingpotential of and greenhouse gas intensity in irrigated cropping systems inNortheastern Colorado. J. Environ. Qual. 35, 1584–1598.
Mutegi, J.K., Munkholm, L.J., Petersen, B.M., Hansen, E.M., Petersen, S.O., 2010.Nitrous oxide emission and controls as influenced by tillage and crop residuemanagement. Soil Biol. Biochem. 42, 1701–1711.
Olson-Rutz, K., Jones, C., Dinkins, C.P., 2011. Enhanced efficiency fertilizers. EB0188.Montana State Univ. Ext., Bozeman.
Oreskes, N., Shradderfrechette, K., Belitz, K., 1994. Verification, validation, andconfirmation of numerical models in the Earth sciences. Science 263 (5147),641–646.
Parkin, T.B., Kaspar, T.C., 2006. Nitrous oxide emission from corn-soybean rotation inthe Midwest. J. Environ. Qual. 35, 1495–1506.
Parton, W.J., Holland, E.A., Del Grosso, S.J., Hartman, M.D., Martin, R.E., Mosier, A.R.,Ojima, D.S., Schimel, D.S., 2001. Generalized model for NOx and N2O emissionsfrom soils. J. Geophys. Res. 106, 17403–17420.
Quemada, M., Cabrera, M.L., 1997. Temperature and moisture effects on C and Nmineralization from surface applied residue. Plant Soil 189, 127–137.
Ravishankara, A.R., Daniel, J.S., Portman, R.S., 2009. Nitrous oxide (n2O): thedominant ozone-depleting substance in the 21st century. Science 326, 123–125.
Reay, D.S., Davidson, E.A., Smith, K.A., Smith, P., Melillo, J.M., Dentener, F., Crutzen, P.J., 2012. Global agriculture and nitrous oxide emissions. Nature 1–7.
Skiba, U., Smith, K.A., 2000. The control of nitrous oxide emission from agriculturaland natural soil. Global Change Sci. 2, 378–386.
Thorp, K.R., Jaynes, D.B., Malone, R.W., 2008. Simulating the long-term performanceof drainage water management across the Midwestern United States. Trans.ASABE. 51 (3), 961–976.
Vigil, M.F., Eghball, B., Carbrera, M.L., Jakubowski, B.R., Davis, J.G., 2002. Accountingfor seasonal nitrogen mineralization: an overview. J. Soil Water Conserv. 464–469.
Wang, H., Fleringer, G.N., Lemke, R., Brandt, K., Goddard, T., Sprout, C., 2010.Improving SHAW long-term soil moisture prediction for continuous wheatrotations, Alberta, Canada. Canadian J. Soil Sci. 90 (1), 37–53.
Wang, J., Ahang, X., Liu, Y., Pan, X., Liu, P., Chen, Z., Huang, T., Xion, Z., 2012. Modelingimpacts of Alternative Practices on net global warming potential andgreenhouse gas intensity from rice-wheat annual rotation in China. PLoS ONE 7(9), e45668.
Zhang, Y., Qian, Y., Mecham, B., Parton, W.J., 2013. Development of best turfgrassmanagement practices using the DAYCENTR model. Agron. J. 105 (4), 1151–1159.