solar conversion of co prepared by atomic layer ... · solar conversion of co 2 to co using...
TRANSCRIPT

In the format provided by the authors and unedited.Supplementary Information
Solar conversion of CO2 to CO using Earth-abundant electrocatalysts prepared by atomic layer modification of CuO
Marcel Schreier1, Florent Héroguel2, Ludmilla Steier1, Shahzada Ahmad3, Jeremy S. Luterbacher2, Matthew T. Mayer1, Jingshan Luo1* and Michael Grätzel1*
1Laboratory of Photonics and Interfaces, Institute of Chemical Sciences and Engineering, École
Polytechnique Fédérale de Lausanne (EPFL), Lausanne, CH-1015 Switzerland
2Laboratory of Sustainable and Catalytic Processing, Institute of Chemical Sciences and
Engineering, École Polytechnique Fédérale de Lausanne (EPFL), Lausanne, CH-1015
Switzerland
3Abengoa Research, Abengoa, c/Energía Solar no 1, Campus Palmas, Altas, 41014, Sevilla,
Spain
*E-mail: [email protected]; [email protected]
Supplementary Notes 1. CuO and SnO2-modified CuO sample characterization
Detailed materials characterization of the pristine and SnO2-modified CuO samples was carried
out. The morphology of the samples and their phase composition were verified by scanning
electron microscopy (SEM), scanning transmission electron microscopy combined with energy-
dispersive X-Ray spectroscopy (STEM-EDX), X-Ray diffraction (XRD), X-Ray photoemission
spectroscopy (XPS) and Raman spectroscopy as shown in Main Text Figure 1. Electron
microscopy confirmed the nanowire morphology of freshly prepared Cu(OH)2 and the CuO
samples (Figure 1a, Supplementary Figure 28), and the morphology remained unchanged after
modification with five ALD cycles of SnO2 (Supplementary Figure 29). XRD patterns of bare
and SnO2-modified samples show the presence of the CuO-phase,1 as well as of metallic Cu,
which is present underneath the nanostructure (Figure 1b). These findings were supported by
Raman measurements (Figure 1c), detecting peaks at 282 cm-1, 333 cm-1 and 613 cm-1, as well
as a broad peak at 1095 cm-1, characteristic of CuO Ag, Bg and 2Bg modes, respectively.2 The
absence of any peak below 282 cm-1 indicates that no significant amount of Cu2O was present
on the surface. Interestingly, in the case of ALD-coated samples, no SnO2 could be detected by
XRD or Raman, which can likely be attributed to the ultrathin character of the SnO2 surface
© 2017 Macmillan Publishers Limited, part of Springer Nature. All rights reserved.
SUPPLEMENTARY INFORMATIONVOLUME: 2 | ARTICLE NUMBER: 17087
NATURE ENERGY | DOI: 10.1038/nenergy.2017.87 | www.nature.com/natureenergy 1
layer. To verify that Sn was successfully deposited, surface elemental analysis was carried out
by STEM-EDX and XPS. EDX measurements showed that Sn coated the CuO nanowires
homogenously (Figure 1d). XPS measurements further confirmed the presence of Sn at the
surface with Sn 3d core level peaks locating at binding energies of 495.0 and 486.6 eV (Figure
1e). The peak position of Sn, together with the presence of a shoulder at 531 eV at the oxygen
1s edge, indicate that Sn is likely in its +4 oxidation state.3 In contrast, no peaks corresponding
to Sn could be observed in the case of an unmodified CuO sample. Cu 2p XPS showed a peak
at 933.8 eV as well as strongly visible Cu2+ satellites between 939 and 946 eV, attributed to the
presence of Cu in a +2 oxidation state (Figure 1f). A similar spectrum was obtained for a sample
modified with SnO2. O 1s XPS spectra are provided in Supplementary Figure 30.
Supplementary Notes 2. Electrolyte composition on catalytic performance
To determine whether the electrolyte composition has an impact on catalytic performance, we
compared CuO nanowire samples modified with two ALD cycles of SnO2 in 0.1 M KHCO3 and
in 0.1 M CsHCO3 at -0.7 V vs. RHE. The results show similar behaviour to 0.1 M NaHCO3,
albeit with slightly higher selectivity for CO, as can be seen in Supplementary Figure 7. The
difference becomes more pronounced with increasing current densities in the order of Na < K
< Cs, in agreement with the literature.4 These data demonstrate that the composition of the
electrolyte plays a role on the product selectivity, which is influenced by the nature of the alkali
cation in bicarbonate based electrolytes. It has been suggested in previous literature that this is
due to the pKa of the hydrated cations, modifying the pH at the electrode surface under
operation.4
Supplementary Notes 3. Optimization of SnO2 ALD deposition
To optimize the ALD deposition of SnO2, the impact of precursor dose (exposure time) on
sample performance was investigated. As expected for an ALD process, the selectivity toward
CO was found to depend on the precursor dose when small amounts of precursor were used,
but reached a plateau at higher precursor doses (Supplementary Figure 10). All the other
samples in this manuscript used a 10 second exposure time.
Supplementary Notes 4. Chemisorption behavior
To allow for a better comparison of the chemisorption behaviour, Figure 3c and 3d show the
chemisorption data and Langmuir fits normalized to the amount adsorbed at saturation (S0),
while the raw data is shown in Supplementary Figure 31. In fact, while the H2 and CO
© 2017 Macmillan Publishers Limited, part of Springer Nature. All rights reserved.
NATURE ENERGY | DOI: 10.1038/nenergy.2017.87 | www.nature.com/natureenergy 2
SUPPLEMENTARY INFORMATION
adsorption isotherms from CuO after SnO2 deposition are fitted using a single Langmuir
isotherm with a small equilibrium constant (K < 0.01, low binding strength), a dual Langmuir
isotherm including an additional large equilibrium constant (K > 1, high binding strength) was
required to fit the data from unmodified CuO. The N2 physisorption isotherms at 77 K for Cu2O
and Cu2O-SnO2 were quasi-identical with comparable surface areas (8.27 and 8.54 m2/g,
respectively). The chemisorbed amounts can hence be attributed to the nature of the surfaces.
H2, CO, CO2 and H2O adsorption isotherms were fitted with single or dual Langmuir isotherms
according to the following equations:
Single Langmuir: Qads = Q2*K2*P/(1+K2*P)
Dual Langmuir: Qads = Q1*K1*P/(1+K1*P)+Q2*K2*P/(1+K2*P)
Total amount adsorbed at saturation: S0 = ΣQi.
In these equations Ki (1, 2) represent the adsorption equilibrium constants and K1 accounts for
strong chemisorption observed in the low pressure range (0-50 mbar) (K1 >1) while K2 accounts
for weak chemisorption (K2<0.01). Qi designates the quantity adsorbed at saturation. The fitted
data are provided in Supplementary Table 1.
Supplementary Notes 5. Sample characterization after electrochemical test
To better understand the electrochemically active catalyst, nanowire samples were subjected to
a large number of characterization techniques after operation for 3h at -0.7 V vs. RHE. After
electrochemical operation at -0.7 V vs. RHE for 3h the SnO2 modified samples showed, in
contrast to neat CuO, a slightly different morphology which was characterized by the
appearance of fibre-like extensions at the tips of the nanowires (Supplementary Figure 32).
STEM-EDX measurements of these fibres showed that they contain both Cu and Sn in a ratio
similar to the rest of the structure (Supplementary Figure 33). XPS profile analysis of samples
before and after testing at -0.7 V vs. RHE for 3 h showed that while Sn predominantly occurs
at the surface of the structure before testing, it was found to be more evenly distributed after
completion of the electrochemical runs (Supplementary Figure 34a). After testing, the peak of
Sn was observed at a smaller binding energy (486.19 eV) (Supplementary Figure 34b),
indicating reduction of its oxidation state from to +4 to +2. Changes were also observed in the
Cu 2p core level spectrum, where the appearance of a signal at 932.57 eV indicated the presence
of a Cu(I) species (Supplementary Figure 35a). Similarly, reflections corresponding to Cu2O
became visible in the XRD data, (Supplementary Figure 35b). Aberration corrected high
© 2017 Macmillan Publishers Limited, part of Springer Nature. All rights reserved.
NATURE ENERGY | DOI: 10.1038/nenergy.2017.87 | www.nature.com/natureenergy 3
SUPPLEMENTARY INFORMATION

resolution STEM-EDX measurements (Supplementary Figure 36) provided further support for
the mixing of Cu and Sn. These measurements showed that before testing, Sn was mainly found
on the perimeter of the CuO structure, giving way to a more uniform distribution after the
catalytic reaction. This indicates that despite having been deposited at the surface, Sn
redistributes during the electrocatalytic reaction, potentially leading to the formation of an
alloy.5 After testing, SEM analysis of the unmodified CuO samples showed the appearance of
a large number of cracks in the nanowire structure, which otherwise appeared to stay intact.
ICP-MS analysis of the electrolyte after electrochemical tests showed both Cu and Sn below
the detection limit (Supplementary Table 4). We acknowledge that post-electrolysis ex situ
analysis is sensitive to surface oxidation in air which may occur during sample transfer, and
that in situ measurements will be needed to reliably assess the metal oxidation states.
© 2017 Macmillan Publishers Limited, part of Springer Nature. All rights reserved.
NATURE ENERGY | DOI: 10.1038/nenergy.2017.87 | www.nature.com/natureenergy 4
SUPPLEMENTARY INFORMATION
Supplementary Figures
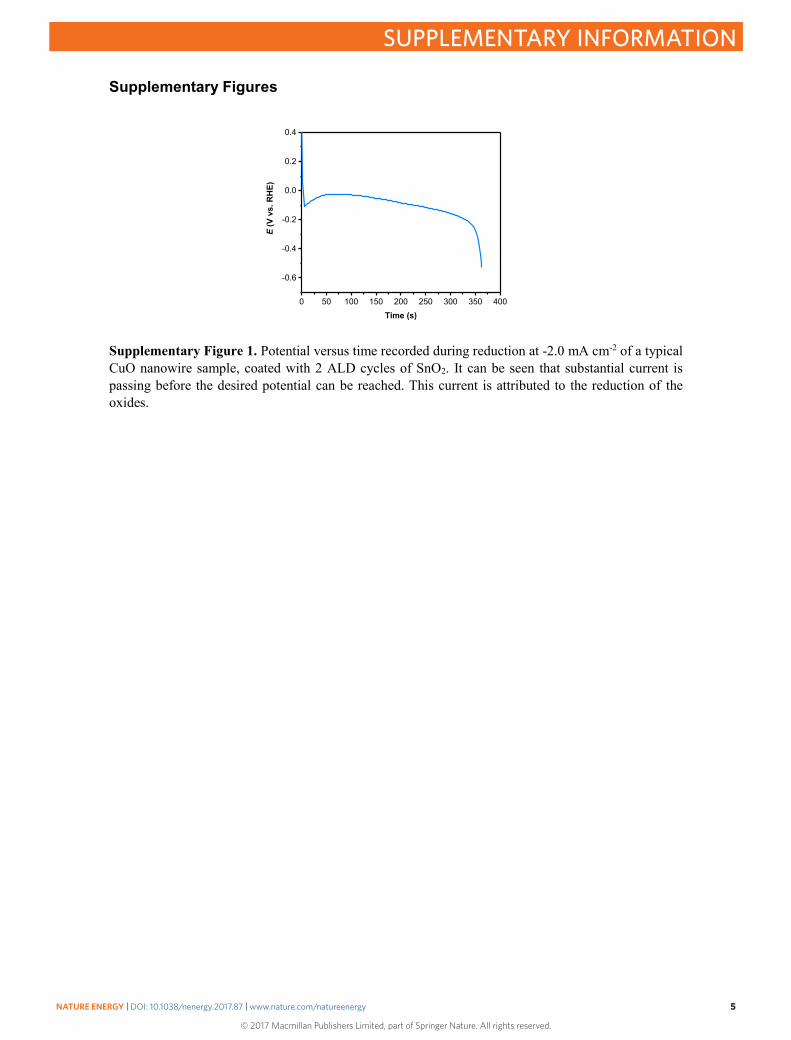
Supplementary Figure 1. Potential versus time recorded during reduction at -2.0 mA cm-2 of a typical CuO nanowire sample, coated with 2 ALD cycles of SnO2. It can be seen that substantial current is passing before the desired potential can be reached. This current is attributed to the reduction of the oxides.
0 50 100 150 200 250 300 350 400
-0.6
-0.4
-0.2
0.0
0.2
0.4
E (V
vs.
RH
E)
Time (s)
© 2017 Macmillan Publishers Limited, part of Springer Nature. All rights reserved.
NATURE ENERGY | DOI: 10.1038/nenergy.2017.87 | www.nature.com/natureenergy 5
SUPPLEMENTARY INFORMATION

Supplementary Figure 2. (a, b) Faradaic efficiency for different observed products versus applied potential and (c) current density versus applied potential for unmodified CuO samples. Dots represent individual measurements, and lines represent the averages. (d) Original chronoamperometry measurements from these samples as expressed by faradaic efficiency measurements of CO, H2, CH4, C2H4 and C2H6 and the geometric current density versus time.
-0.4 -0.5 -0.6 -0.7 -0.8 -0.9-10
0102030405060708090
100110
H2 CO C2H4 Formate Sum
Sele
ctiv
ity (%
)
E (V) vs. RHE-0.4 -0.5 -0.6 -0.7 -0.8 -0.9
0
2
4
6
8
10
Sele
ctiv
ity (%
)
E (V) vs. RHE
CH4
C2H6
Ethanol 1-Propanol
-0.4 -0.5 -0.6 -0.7 -0.8 -0.9-0.50.00.51.01.52.02.53.03.54.04.55.05.5
J (m
A c
m-2)
E (V) vs. RHE
-0.4 RHE
020406080
100 CO H2
Fara
daic
Effi
cien
cy (%
)
0.0
0.5
1.0 CH4
C2H4
C2H6
0 1 2 30.00.10.20.30.40.5
J (m
A c
m-2)
Time (h)
020406080
100 CO H2
Fara
daic
Effi
cien
cy (%
)
0.0
0.5
1.0 CH4
C2H4
C2H6
0 1 2 30.00.10.20.30.40.5
J (m
A c
m-2)
Time (h)
-0.5 RHE
020406080
100 CO H2
Fara
daic
Effi
cien
cy (%
)
0.0
0.5
1.0 CH4
C2H4
C2H6
0 1 2 30.00.10.20.30.40.5
J (m
A c
m-2)
Time (h)
020406080
100 CO H2
Fara
daic
Effi
cien
cy (%
)
0.0
0.5
1.0 CH4
C2H4
C2H6
0 1 2 30.00.10.20.30.40.5
J (m
A c
m-2)
Time (h)
-0.6 RHE
020406080
100 CO H2
Fara
daic
Effi
cien
cy (%
)
0.0
0.5
1.0 CH4
C2H4
C2H6
0 1 2 30.00.20.40.60.81.0
J (m
A c
m-2)
Time (h)
020406080
100 CO H2
Fara
daic
Effi
cien
cy (%
)
0.0
0.5
1.0 CH4
C2H4
C2H6
0 1 2 30.00.20.40.60.81.0
J (m
A c
m-2)
Time (h)
-0.7 RHE
020406080
100 CO H2
Fara
daic
Effi
cien
cy (%
)
0
5
10
15
20 CH4
C2H4
C2H6
0 1 2 30.0
0.5
1.0
1.5
2.0
J (m
A c
m-2)
Time (h)
020406080
100 CO H2
Fara
daic
Effi
cien
cy (%
)
0
5
10
15
20 CH4
C2H4
C2H6
0 1 2 30.0
0.5
1.0
1.5
2.0
J (m
A c
m-2)
Time (h)
-0.8 RHE
020406080
100 CO H2
Fara
daic
Effi
cien
cy (%
)
0
5
10
15
20 CH4
C2H4
C2H6
0 1 2 30
1
2
3
J (m
A c
m-2)
Time (h)
020406080
100 CO H2
Fara
daic
Effi
cien
cy (%
)
0
5
10
15
20 CH4
C2H4
C2H6
0 1 2 30
1
2
3
J (m
A c
m-2)
Time (h)
-0.9 RHE
020406080
100 CO H2
Fara
daic
Effi
cien
cy (%
)
01020304050
CH4
C2H4
C2H6
0 1 2 30123456
J (m
A c
m-2)
Time (h)
020406080
100 CO H2
Fara
daic
Effi
cien
cy (%
)
01020304050
CH4
C2H4
C2H6
0 1 2 30123456
J (m
A c
m-2)
Time (h)
a b
c
d
© 2017 Macmillan Publishers Limited, part of Springer Nature. All rights reserved.
NATURE ENERGY | DOI: 10.1038/nenergy.2017.87 | www.nature.com/natureenergy 6
SUPPLEMENTARY INFORMATION

-0.4 -0.5 -0.6 -0.7 -0.8 -0.9-10
0102030405060708090
100110
CO Formate H2
Sum
Fara
daic
Effi
cien
cy (%
)
E (V) vs. RHE
-0.4 -0.5 -0.6 -0.7 -0.8 -0.9
0
2
4
6
8
10
Fara
daic
Effi
cien
cy (%
)
E (V) vs. RHE
CH4
C2H4
C2H6
Ethanol 1-Propanol
-0.4 -0.5 -0.6 -0.7 -0.8 -0.90.0
0.5
1.0
1.5
2.0
2.5
3.0
3.5
J (m
A c
m-2)
E (V) vs. RHE
-0.4 RHE
0
20
40
60
80
100
CO H2
Fara
daic
Effi
cien
cy (%
)
0 1 2 3 4 5 60.00
0.05
0.10
0.15
0.20
J (m
A c
m-2)
Time (h)
0
20
40
60
80
100
CO H2
Fara
daic
Effi
cien
cy (%
)
0 1 2 3 4 5 60.00
0.05
0.10
0.15
0.20
J (m
A c
m-2)
Time (h)
0
20
40
60
80
100
CO H2
Fara
daic
Effi
cien
cy (%
)
0 1 2 3 4 5 60.00
0.05
0.10
0.15
0.20
J (m
A c
m-2)
Time (h)
-0.5 RHE
0
20
40
60
80
100
CO H2
Fara
daic
Effi
cien
cy (%
)
0 1 2 3 4 5 60.0
0.1
0.2
0.3
0.4
0.5
J (m
A c
m-2)
Time (h)
0
20
40
60
80
100
CO H2
Fara
daic
Effi
cien
cy (%
)
0 1 2 3 4 5 60.0
0.1
0.2
0.3
0.4
0.5
J (m
A c
m-2)
Time (h)
0
20
40
60
80
100
CO H2
Fara
daic
Effi
cien
cy (%
)
0 1 2 3 4 5 60.0
0.1
0.2
0.3
0.4
0.5
J (m
A c
m-2)
Time (h)
-0.6 RHE
0
20
40
60
80
100
CO H2
Fara
daic
Effi
cien
cy (%
)
0 1 2 3 4 5 60.0
0.2
0.4
0.6
0.8
1.0
J (m
A c
m-2)
Time (h)
0
20
40
60
80
100
CO H2
Fara
daic
Effi
cien
cy (%
)
0 1 2 3 4 5 60.0
0.2
0.4
0.6
0.8
1.0
J (m
A c
m-2)
Time (h)
0
20
40
60
80
100
CO H2
Fara
daic
Effi
cien
cy (%
)
0 1 2 3 4 5 60.0
0.2
0.4
0.6
0.8
1.0
J (m
A c
m-2)
Time (h)
a b
c
d
© 2017 Macmillan Publishers Limited, part of Springer Nature. All rights reserved.
NATURE ENERGY | DOI: 10.1038/nenergy.2017.87 | www.nature.com/natureenergy 7
SUPPLEMENTARY INFORMATION

Supplementary Figure 3. (a, b) Faradaic efficiency for different observed products versus applied potential and (c) current density versus applied potential for CuO samples, modified with 2 ALD cycles of SnO2. Dots represent individual measurements, and lines represent the averages. (d) Original chronoamperometry measurements from these samples as expressed by faradaic efficiency measurements of CO and H2 and the geometric current density versus time.
-0.7 RHE
0
20
40
60
80
100
CO H2
Fara
daic
Effi
cien
cy (%
)
0 1 2 3 4 5 60.0
0.5
1.0
1.5
2.0
J (m
A c
m-2)
Time (h)
0
20
40
60
80
100
CO H2
Fara
daic
Effi
cien
cy (%
)
0 1 2 3 4 5 60.0
0.5
1.0
1.5
2.0
J (m
A c
m-2)
Time (h)
0
20
40
60
80
100
CO H2
Fara
daic
Effi
cien
cy (%
)
0 1 2 3 4 5 60.0
0.5
1.0
1.5
2.0
J (m
A c
m-2)
Time (h)
-0.8 RHE
0
20
40
60
80
100
CO H2
Fara
daic
Effi
cien
cy (%
)
0 1 2 3 4 5 60
1
2
3
J (m
A c
m-2)
Time (h)
0
20
40
60
80
100
CO H2
Fara
daic
Effi
cien
cy (%
)0 1 2 3 4 5 6
0
1
2
3
J (m
A c
m-2)
Time (h)
0
20
40
60
80
100
CO H2
Fara
daic
Effi
cien
cy (%
)
0 1 2 3 4 5 60
1
2
3
J (m
A c
m-2)
Time (h)
-0.9 RHE
0
20
40
60
80
100
CO H2
Fara
daic
Effi
cien
cy (%
)
0 1 2 3 4 5 60
1
2
3
4
J (m
A c
m-2)
Time (h)
0
20
40
60
80
100
CO H2
Fara
daic
Effi
cien
cy (%
)
0 1 2 3 4 5 60
1
2
3
4
J (m
A c
m-2)
Time (h)
0
20
40
60
80
100
CO H2
Fara
daic
Effi
cien
cy (%
)
0 1 2 3 4 5 60.00.51.01.52.02.53.03.54.0
J (m
A c
m-2)
Time (h)
© 2017 Macmillan Publishers Limited, part of Springer Nature. All rights reserved.
NATURE ENERGY | DOI: 10.1038/nenergy.2017.87 | www.nature.com/natureenergy 8
SUPPLEMENTARY INFORMATION

Supplementary Figure 4. Representative chronoamperometry test of a sample with 2 cycles of SnO2/CuO operated at -0.7 V vs. RHE in 0.1 M NaHCO3. The performance stays stable over extended amounts of time.
0
20
40
60
80
100
CO H2
Fara
daic
Effi
cien
cy (%
)0 1 2 3 4 5 6
0.0
0.5
1.0
1.5
J (m
A c
m-2)
Time (h)
© 2017 Macmillan Publishers Limited, part of Springer Nature. All rights reserved.
NATURE ENERGY | DOI: 10.1038/nenergy.2017.87 | www.nature.com/natureenergy 9
SUPPLEMENTARY INFORMATION

Supplementary Figure 5. Isotopic CO2 test, observing the change in product isotope generated from switching the substrate from 12CO2 to 13CO2 in 0.1 M NaH12CO3 at -0.7 V vs. RHE. The lines labelled with 1, 2 and 3 in the chronoamperometric plot (left) designate the measurement times of the FTIR spectra shown in the right side of the graph. All infrared spectra are shown at the same scale. It can be seen that under 12CO2 (indicated as a blue surface under the chronoamperometric data) and in the presence of NaH12CO3, the product is solely 12CO (as seen by the appearance of the rovibrational signature corresponding to 12CO in spectrum no. 1). Upon switching to 13CO2 (indicated as a green surface) as substrate, the production of 13CO appeared and subsequently became the only observed product (characterized by the shift to lower wavenumbers of the CO-rovibrational signature in spectrum no. 3). In the absence of current, no product was detected under either CO2 isotope.
Supplementary Figure 6. Similar test carried out with 0.1 M NaH13CO3 as supporting electrolyte. Polarization was carried out at -1.295 V vs. Ag/AgCl (KCl sat.) for the whole experiment. Polarizing in the absence of substrate CO2 gas led to low currents and no substantial observation of CO. Only traces of 13CO could be observed (FTIR spectrum 1). Starting the flow of 12CO2 leads to a rapid increase of current and to the rapid appearance of 12CO. Switching the substrate gas to 13CO2 again leads to the observation of solely 13CO as a product, further confirming that the carbon source is indeed the gaseous CO2. All infrared spectra are shown at the same scale.
2250 2200 2150 2100 2050 2000
Wavenumber (cm-1)
12CO213CO2
12CO2 before polarization
1
2
3
13CO2 after polarization
1 2 3
0 1 2 3 4 5-2.0
-1.5
-1.0
-0.5
0.0
Cur
rent
den
sity
(mA
cm
-2)
Time (h)
12CO2 10 mLn min-1
13CO2 10 mLn min-1
12CO2 10 mLn min-1
2He 10 mLn min-1
20002050210021502200
Wavenumber (cm-1)
1 2 4
1
2
3
12CO213CO2He
4
3
0 1 2 3 4 5 6-2.0
-1.5
-1.0
-0.5
0.0
J (m
A c
m-2)
Time (h)
© 2017 Macmillan Publishers Limited, part of Springer Nature. All rights reserved.
NATURE ENERGY | DOI: 10.1038/nenergy.2017.87 | www.nature.com/natureenergy 10
SUPPLEMENTARY INFORMATION

Supplementary Figure 7. Current density (a) and Faradaic efficiencies (b) observed at -0.7 V vs. RHE on CuO nanowire samples, modified with 2 ALD cycles SnO2 in 0.1 M bicarbonate electrolyte with different alkali cations.
Na K Cs0.0
0.2
0.4
0.6
0.8
1.0
1.2
1.4
1.6
1.8
Cur
rent
Den
sity
(mA
cm
-2)
Na K Cs0
20
40
60
80
100
Fara
daic
Effi
cien
cy (%
)
Sum CO Formate H2
b a
© 2017 Macmillan Publishers Limited, part of Springer Nature. All rights reserved.
NATURE ENERGY | DOI: 10.1038/nenergy.2017.87 | www.nature.com/natureenergy 11
SUPPLEMENTARY INFORMATION

Supplementary Figure 8. Electrochemical surface area measurement. (a) Cyclic Voltammetry scans on flat copper sputtered on glass between -0.3 and -0.2 V vs. Ag/AgCl (KCl sat.) in pH 5 phosphate buffer between 10 and 100 mV s-1. (b) Extracted currents at -0.25 V vs. Ag/AgCl (KCl sat.) as a function of the scan rate, leading to a slope of 26.76 µF cm-2. (c, d) Equivalent plots for untreated CuO nanowires, leading to a capacitance of 461.8 µF cm-2. (e, f) Equivalent plots for 2 ALD cycle SnO2-coated CuO nanowires, leading to a capacitance of 462.3 µF cm-2.
-0.30 -0.28 -0.26 -0.24 -0.22 -0.20-7.16
-6.13
-5.11
-4.09
-3.07
-2.04
-1.02
0.00
1.02
2.04
3.07
4.09
J (
A c
m-2)
E (V) vs. Ag/AgCl (KCl sat.)
0.00 0.02 0.04 0.06 0.08 0.100
1
2
3
J (
A c
m-2)
Scanrate (V s-1)
Slope = 26.76 F cm-2
-0.30 -0.28 -0.26 -0.24 -0.22 -0.20
-90.00
-60.00
-30.00
0.00
30.00
60.00
J (
A c
m-2)
E (V) vs. Ag/AgCl (KCl sat.)
0.00 0.02 0.04 0.06 0.08 0.100
10
20
30
40
50
J (
A c
m-2)
Scanrate (V s-1)
Slope = 461.8 F cm-2
-0.30 -0.28 -0.26 -0.24 -0.22 -0.20-90.00
-60.00
-30.00
0.00
30.00
60.00
90.00
J (
A c
m-2)
E (V) vs. Ag/AgCl (KCl sat.)
0.00 0.02 0.04 0.06 0.08 0.100
10
20
30
40
50
J (
A c
m-2)
Scanrate (V s-1)
Slope = 462.3 F cm-2
c d
e
a b
f
© 2017 Macmillan Publishers Limited, part of Springer Nature. All rights reserved.
NATURE ENERGY | DOI: 10.1038/nenergy.2017.87 | www.nature.com/natureenergy 12
SUPPLEMENTARY INFORMATION

Supplementary Figure 9. (a) Total current densities based on the electrochemical surface area of the catalyst as determined by capacitance measurements for SnO2-modified and unmodified samples. (b) Partial current densities for CO and H2 formation based on the electrochemical surface area of the catalyst as determined by capacitance measurements. The right hand side axis indicates the corresponding turnover frequency based on the surface atom concentration.
-0.4 -0.5 -0.6 -0.7 -0.8 -0.9
0.00
0.05
0.10
0.15
0.20
J tot-rea
l (m
A c
m-2)
E (V) vs. RHE
CuO CuO + ALD SnO2
-0.4 -0.5 -0.6 -0.7 -0.8 -0.9
0.00
0.05
0.10
0.15
0.20
-0.4 -0.5 -0.6 -0.7 -0.8 -0.9
H2
J part-r
eal(m
A c
m-2)
E (V) vs. RHE
CuO CuO + SnO2
CO
E (V) vs. RHE
0.00
0.05
0.10
0.15
0.20
0.25
0.30
TOF
(s-1)
ba
© 2017 Macmillan Publishers Limited, part of Springer Nature. All rights reserved.
NATURE ENERGY | DOI: 10.1038/nenergy.2017.87 | www.nature.com/natureenergy 13
SUPPLEMENTARY INFORMATION
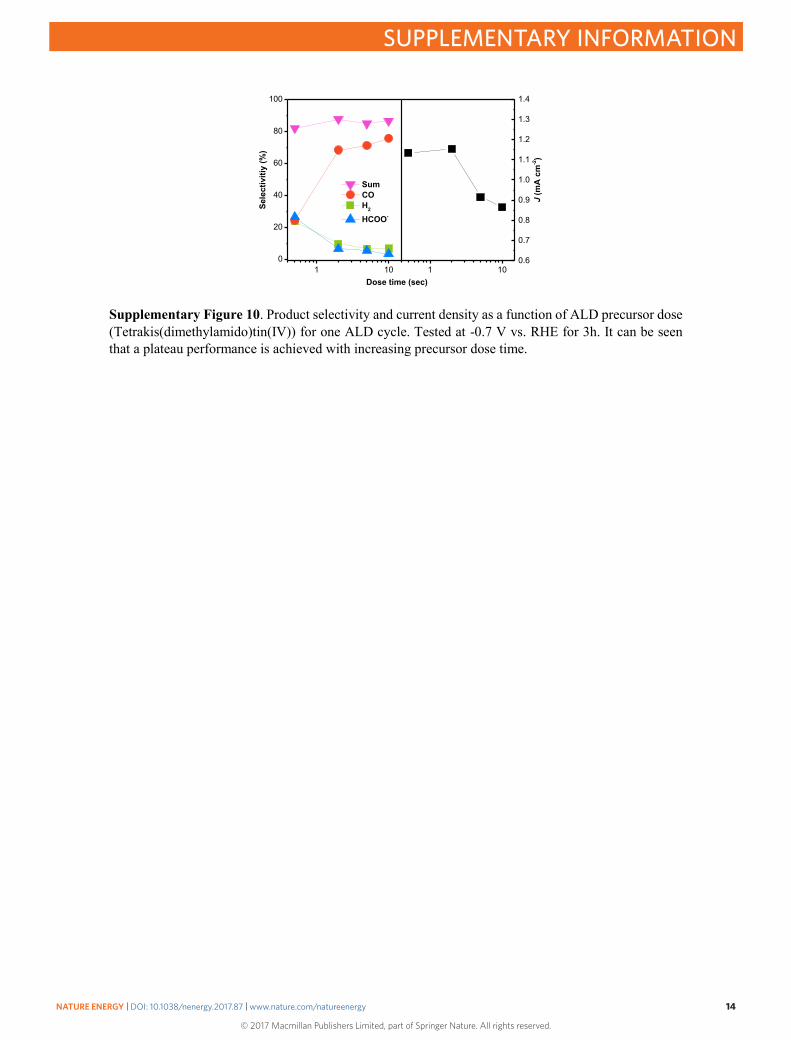
Supplementary Figure 10. Product selectivity and current density as a function of ALD precursor dose (Tetrakis(dimethylamido)tin(IV)) for one ALD cycle. Tested at -0.7 V vs. RHE for 3h. It can be seen that a plateau performance is achieved with increasing precursor dose time.
1 100
20
40
60
80
100
1 100.6
0.7
0.8
0.9
1.0
1.1
1.2
1.3
1.4
Sele
ctiv
itiy
(%)
Dose time (sec)
Sum CO H2
HCOO-
J (m
A c
m-2)
© 2017 Macmillan Publishers Limited, part of Springer Nature. All rights reserved.
NATURE ENERGY | DOI: 10.1038/nenergy.2017.87 | www.nature.com/natureenergy 14
SUPPLEMENTARY INFORMATION

Supplementary Figure 11. (a) TPR of FBR-ALD-Coated CuO particles (2 cycles of SnO2) compared to untreated CuO particles, confirming complete reduction by H2 before chemisorption measurements and (b) STEM-EDX of the same particles.
0 20 40 60 80
H2 C
onsu
med
(a.u
.)
Minutes
CuO CuO + SnO2 (2 cyc)
0
100
200
300
Tem
pera
ture
(°C
)
a b
© 2017 Macmillan Publishers Limited, part of Springer Nature. All rights reserved.
NATURE ENERGY | DOI: 10.1038/nenergy.2017.87 | www.nature.com/natureenergy 15
SUPPLEMENTARY INFORMATION

Supplementary Figure 12. Product selectivity (a) and current density (b) for CuO and CuO nanopowder (modified with 5 ALD cycles SnO2) on roughened Ti substrate. The substrate itself showed only a current density of 85 µA cm-2. Tested at -0.7 V vs. RHE. It can be seen that, similar to the case of CuO nanowires, the yield in CO is substantially enhanced upon FBR ALD SnO2 modification of CuO nanopowder. CuO and CuO + SnO2 (2nd) were measured for 3h, whereas CuO + SnO2 (1st) was measured for 10 h.
CuO CuO + SnO2 (1st)CuO + SnO2 (2nd)0
10
20
30
40
50
60
Fara
daic
Effi
cien
cy (%
)
H2
CO HCOOH
CuO CuO + SnO2 (1st)CuO + SnO2 (2nd)0.0
0.5
1.0
1.5
J (m
A c
m-2)
a b
© 2017 Macmillan Publishers Limited, part of Springer Nature. All rights reserved.
NATURE ENERGY | DOI: 10.1038/nenergy.2017.87 | www.nature.com/natureenergy 16
SUPPLEMENTARY INFORMATION

Supplementary Figure 13. Volcano plots of HER current vs. H binding strength, adapted from reference (6) (a) and CO2 reduction current vs. CO binding strength, adapted from reference (7) (b). Grey data points represent single crystal data.
-0.6 -0.4 -0.2 0.0 0.2 0.4 0.6
-8
-7
-6
-5
-4
-3
-2
-1
log
(J (m
A c
m-2))
GH*
Nb
W
Mo
Ni
Co
Re
Pd
Rh
Pt
Ir
Cu Au
Ag
-2.0 -1.5 -1.0 -0.5 0.0 0.5
0.01
0.1
1
10
Ag
Au
Zn
Cu
Ni
CO
2RR
Cur
rent
Den
sity
(mA
cm
-2)
CO Binding Strength (eV)
Pt
a b
© 2017 Macmillan Publishers Limited, part of Springer Nature. All rights reserved.
NATURE ENERGY | DOI: 10.1038/nenergy.2017.87 | www.nature.com/natureenergy 17
SUPPLEMENTARY INFORMATION

Supplementary Figure 14. Electron Energy Loss Spectroscopy (EELS). Cu L2,3 edge (a, c) and O K edge spectra (b, d) for 2 cycle ALD SnO2/CuO samples fresh (top) and tested at -0.7 V vs. RHE for 3h (bottom). The spectra clearly show that after testing the majority of the copper in the sample has been reduced from Cu(II) oxide to Cu(0).8 This conclusion is also supported by the EELS O edge, which initially shows three peaks, indicative of Cu(II) oxide and the intensity of which is substantially decreased after testing.8
920 940 960 980 1000 1020
Cou
nts
(-)
Energy Loss (eV)520 530 540 550 560 570 580 590 600
Cou
nts
(-)
Energy Loss (eV)
920 940 960 980 1000 1020
Cou
nts
(-)
Energy Loss (eV)520 530 540 550 560 570 580 590 600
Cou
nts
(-)
Energy Loss (eV)
a b
c d
Cu Fresh O Fresh
Cu Tested O Tested
© 2017 Macmillan Publishers Limited, part of Springer Nature. All rights reserved.
NATURE ENERGY | DOI: 10.1038/nenergy.2017.87 | www.nature.com/natureenergy 18
SUPPLEMENTARY INFORMATION

Supplementary Figure 15. (a) J-V curves characterizing the OER performance of bare and ALD-coated
CuO nanowires in 0.25 M KOH. (b) Quantification of oxygen produced at 1.25 mA cm-2 from a SnO2-
coated CuO nanowire sample in 0.25 M KOH. A near-quantitative Faradaic yield in oxygen was
observed.
1.2 1.3 1.4 1.5 1.6 1.7 1.8-1
0
1
2
3
4
5
6
7
8
9
10
J (m
A c
m-2)
E (V) vs. RHE
CuO + 2 cycles SnO2
CuO
0.0 0.5 1.0 1.5 2.0 2.50
102030405060708090
100110120
Fara
daic
Yie
ld O
2 (%
)
Time (h)
1.0
1.5
2.0
2.5
3.0
E (V
) vs.
RH
E
a b
© 2017 Macmillan Publishers Limited, part of Springer Nature. All rights reserved.
NATURE ENERGY | DOI: 10.1038/nenergy.2017.87 | www.nature.com/natureenergy 19
SUPPLEMENTARY INFORMATION

Supplementary Figure 16. Schematic presentation of testing configuration with bifunctional catalysts,
bipolar membrane and 3-j photovoltaic cell.
+++++++++++
-----------
H2O
OH-
H+
CO + H2O
O2
GaIn
P 2
GaAsGe
0.25 M KOH 0.1 M NaHCO3+++
---
Bipolar MembraneAnode Cathode
CuOSnO2
CO2 + H+
e-
OH-
O2 + H2O
e-
COhν
© 2017 Macmillan Publishers Limited, part of Springer Nature. All rights reserved.
NATURE ENERGY | DOI: 10.1038/nenergy.2017.87 | www.nature.com/natureenergy 20
SUPPLEMENTARY INFORMATION

Supplementary Figure 17. Real-time measurement of pH in anode and cathode compartments upon
application of 0.5 mA cm-2 (membrane area) to two Pt electrodes in 0.25 M KOH (Anode) and 0.1 M
NaHCO3 (Cathode). It can be seen that a substantial change in pH is observed when using an anion
exchange membrane, whereas only a weak change was observed in presence of a bipolar membrane.
The catholyte pH stays virtually unchanged in the case of the anion exchange membranes, because any
OH- reaching this CO2-saturated compartment will be transformed into HCO3-.
0 2 4 6 8 10 12 145
6
7
8
9
10
11
12
13
14
Anion Exchange Membrane (Catholyte)
Bipolar Membrane (Catholyte)
Anion ExchangeMembrane (Anolyte)
pH V
alue
Time (h)
Bipolar Membrane (Anolyte)
© 2017 Macmillan Publishers Limited, part of Springer Nature. All rights reserved.
NATURE ENERGY | DOI: 10.1038/nenergy.2017.87 | www.nature.com/natureenergy 21
SUPPLEMENTARY INFORMATION

Supplementary Figure 18. Photograph of 20 cm2 prototype cell.
© 2017 Macmillan Publishers Limited, part of Springer Nature. All rights reserved.
NATURE ENERGY | DOI: 10.1038/nenergy.2017.87 | www.nature.com/natureenergy 22
SUPPLEMENTARY INFORMATION

Supplementary Figure 19. Steady-state J-V data of the electrolysis cell using 0.25 M CsOH as anolyte and CO2-saturated 0.1 M CsHCO3 as catholyte, recorded with the same electrodes as used for the long-term solar-driven CO2 electrolysis experiment. The long-term operation point is designated by a dashed line.
0.0 0.1 0.2 0.3 0.4 0.5 0.6-0.8-0.6-0.4-0.2
1.6
1.8
Cathode vs. RHE Anode vs. RHE
E (V
) vs.
RH
E
0.0 0.2 0.4 0.6 0.8 1.0 1.2
0.00.20.40.60.81.0
Mem
bran
e Po
tent
ial (
V)
Current Density (mA cm-2)
© 2017 Macmillan Publishers Limited, part of Springer Nature. All rights reserved.
NATURE ENERGY | DOI: 10.1038/nenergy.2017.87 | www.nature.com/natureenergy 23
SUPPLEMENTARY INFORMATION

Supplementary Figure 20. Evolution of system potentials with time. (a) Anode and cathode potentials, relative to the RHE scale in their respective compartment. (b) Cell voltage and potential drop over the bipolar membrane as a function of time.
0 1 2 3 4 5
-0.5
0.0
0.5
1.0
1.5
2.0Anode
E (V
) vs.
RH
E
Time (h)
Cathode
0 1 2 3 4 50.0
0.5
1.0
1.5
2.0
2.5
3.0
(V)
Time (h)
Cell Voltage Membrane Voltage
a b
© 2017 Macmillan Publishers Limited, part of Springer Nature. All rights reserved.
NATURE ENERGY | DOI: 10.1038/nenergy.2017.87 | www.nature.com/natureenergy 24
SUPPLEMENTARY INFORMATION

Supplementary Figure 21. Evolution of solar to CO, solar to H2 and total solar to fuel conversion efficiencies over time.
0 1 2 3 4 50
2
4
6
8
10
12
14
16
18
20
Solar to CO Efficiency Solar to H2 Total solar to fuel
Sola
r to
fuel
effi
cien
cy (%
)
Time (h)
© 2017 Macmillan Publishers Limited, part of Springer Nature. All rights reserved.
NATURE ENERGY | DOI: 10.1038/nenergy.2017.87 | www.nature.com/natureenergy 25
SUPPLEMENTARY INFORMATION
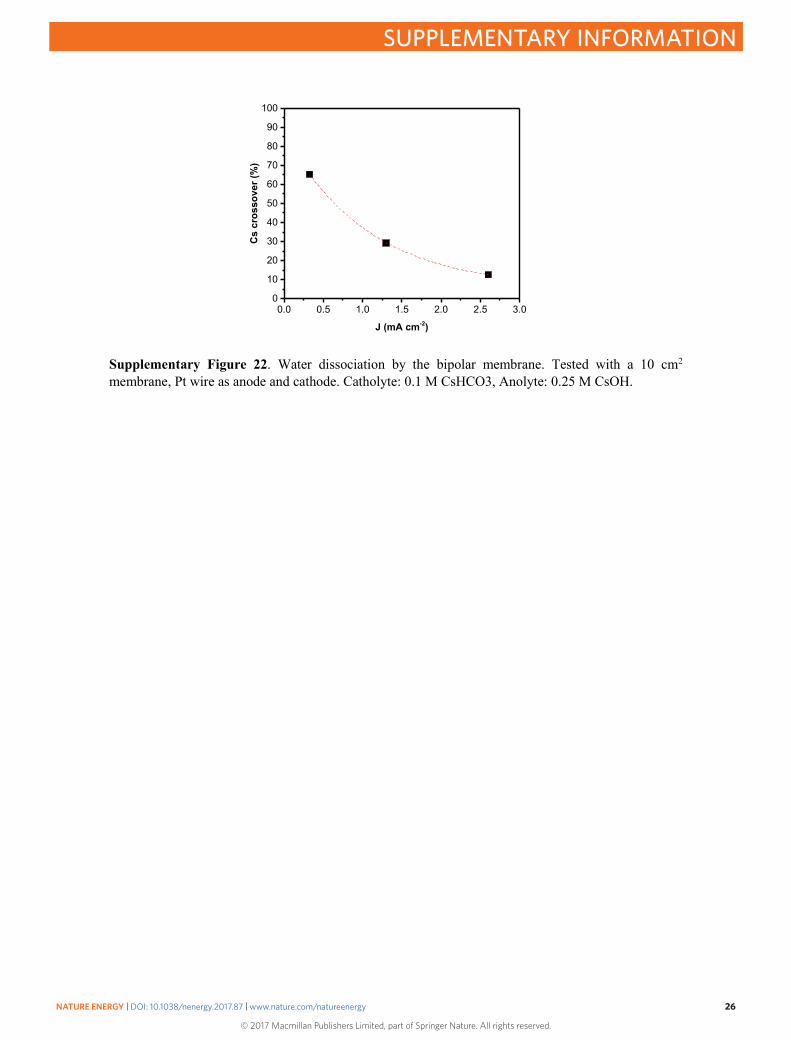
Supplementary Figure 22. Water dissociation by the bipolar membrane. Tested with a 10 cm2 membrane, Pt wire as anode and cathode. Catholyte: 0.1 M CsHCO3, Anolyte: 0.25 M CsOH.
0.0 0.5 1.0 1.5 2.0 2.5 3.00
10
20
30
40
50
60
70
80
90
100
Cs
cros
sove
r (%
)
J (mA cm-2)
© 2017 Macmillan Publishers Limited, part of Springer Nature. All rights reserved.
NATURE ENERGY | DOI: 10.1038/nenergy.2017.87 | www.nature.com/natureenergy 26
SUPPLEMENTARY INFORMATION

Supplementary Figure 23. Setup of the test cell used for electrocatalytic experiments. The working electrode is held within the working electrode compartment which is separated by a membrane from the counter electrode compartment which is open to air. A Pt wire is used as counter electrode. The reference electrode is separated from the catholyte by a double-junction of ceramic diaphragms. Gases are supplied and removed from the cell using the green tubes.
© 2017 Macmillan Publishers Limited, part of Springer Nature. All rights reserved.
NATURE ENERGY | DOI: 10.1038/nenergy.2017.87 | www.nature.com/natureenergy 27
SUPPLEMENTARY INFORMATION

Supplementary Figure 24. (a) Schematic of the measurement setup. Calibration curves for NMR measurements [Sodium Formate (b), Ethanol (c), 1-PrOH (d)], as well as validation of the hydrogen yield obtained in CO2-saturated 0.1 M NaHCO3 under 10.0 mL min-1 CO2 flow at 2.0 mA from a Pt wire, leading to an average faradaic efficiency for H2 of 97% (e).
CO210 mLn min-1
GCSample
0.0 0.5 1.0 1.5 2.0 2.5 3.0 3.5 4.00
2
4
6
8
10
12
14
16
18
20
Form
ate
NM
R In
tegr
al (-
)
Concentration (mM)0.0 0.1 0.2 0.3 0.4 0.5 0.6 0.7 0.8 0.9 1.0 1.1 1.2
0
2
4
6
8
10
12
14
16
18
20
Etha
nol N
MR
Inte
gral
(-)
Concentration (mM)
0.0 0.1 0.2 0.3 0.4 0.5 0.6 0.70
2
4
6
8
10
12
1-Pr
OH
NM
R In
tegr
al (-
)
Concentration (mM)
0.0 0.5 1.0 1.5 2.0 2.5 3.00
10
20
30
40
50
60
70
80
90
100
110
Sele
ctiv
ity H
2
Time (h)
b c
d e
a
© 2017 Macmillan Publishers Limited, part of Springer Nature. All rights reserved.
NATURE ENERGY | DOI: 10.1038/nenergy.2017.87 | www.nature.com/natureenergy 28
SUPPLEMENTARY INFORMATION

Supplementary Figure 25. Representative NMR spectrum for a CuO nanowire sample measured at -0.9 V vs. RHE for 3h.
© 2017 Macmillan Publishers Limited, part of Springer Nature. All rights reserved.
NATURE ENERGY | DOI: 10.1038/nenergy.2017.87 | www.nature.com/natureenergy 29
SUPPLEMENTARY INFORMATION

Supplementary Figure 26. 3-electrode EIS measurement of a CuO sample, coated with 2 cycles SnO2. The spectrum was recorded after an extended test at -0.7 V vs. RHE. Measurement conditions were hybrid galvanostatic-potentiostatic EIS between 1 MHz and 0.1 mHz at 10 points/dec and 10 mV perturbation. The catalyst was run at -0.3 mA cm-2 in CO2-saturated 0.1 M NaHCO3.
0 20 40 60 80 100 120 140 160 180 200 220 240 2600
20
40
60
80
100
Im(Z
) (
)Re(Z) ()
© 2017 Macmillan Publishers Limited, part of Springer Nature. All rights reserved.
NATURE ENERGY | DOI: 10.1038/nenergy.2017.87 | www.nature.com/natureenergy 30
SUPPLEMENTARY INFORMATION

Supplementary Figure 27. Illustration of the 3-junction photovoltaic cell.
© 2017 Macmillan Publishers Limited, part of Springer Nature. All rights reserved.
NATURE ENERGY | DOI: 10.1038/nenergy.2017.87 | www.nature.com/natureenergy 31
SUPPLEMENTARY INFORMATION

Supplementary Figure 28. SEM micrographs of Cu(OH)2 nanowires and CuO nanowires.
1 µm
Cu(OH)2 CuO
© 2017 Macmillan Publishers Limited, part of Springer Nature. All rights reserved.
NATURE ENERGY | DOI: 10.1038/nenergy.2017.87 | www.nature.com/natureenergy 32
SUPPLEMENTARY INFORMATION

Supplementary Figure 29. SEM micrographs of CuO nanowires before and after modification with 5 cycles of SnO2.
1 µm
CuO + 5 cycles SnO2CuO
© 2017 Macmillan Publishers Limited, part of Springer Nature. All rights reserved.
NATURE ENERGY | DOI: 10.1038/nenergy.2017.87 | www.nature.com/natureenergy 33
SUPPLEMENTARY INFORMATION
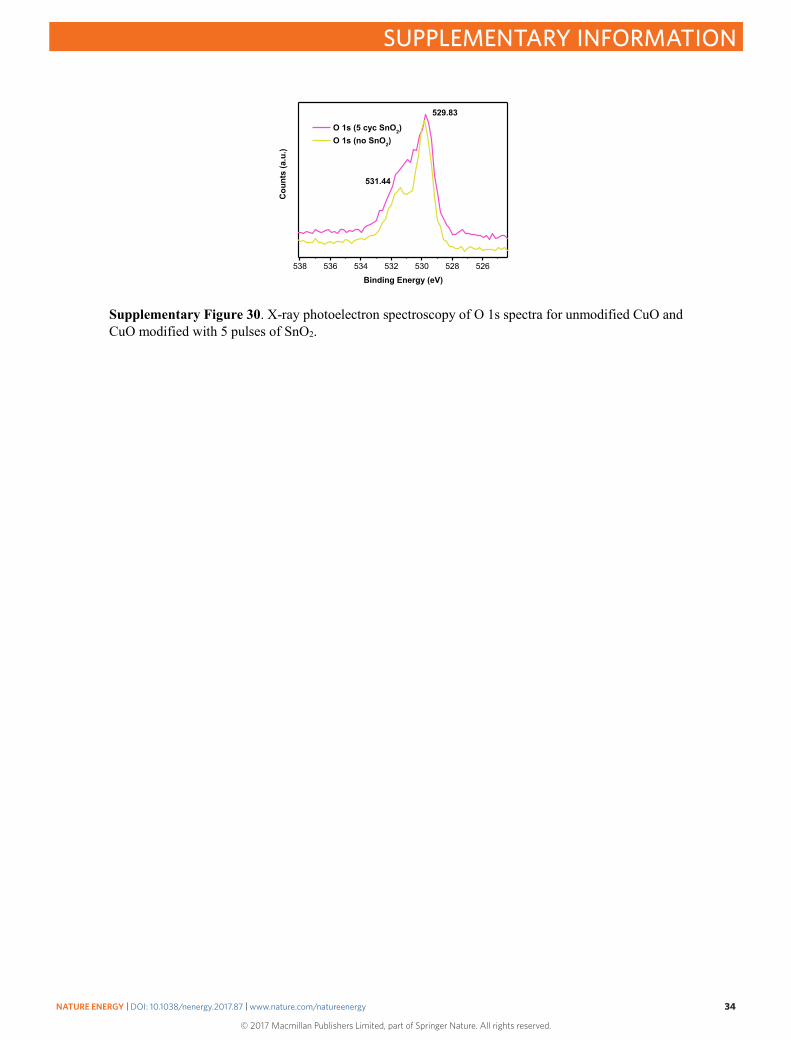
Supplementary Figure 30. X-ray photoelectron spectroscopy of O 1s spectra for unmodified CuO and CuO modified with 5 pulses of SnO2.
538 536 534 532 530 528 526
Cou
nts
(a.u
.)Binding Energy (eV)
O 1s (5 cyc SnO2) O 1s (no SnO2)
529.83
531.44
© 2017 Macmillan Publishers Limited, part of Springer Nature. All rights reserved.
NATURE ENERGY | DOI: 10.1038/nenergy.2017.87 | www.nature.com/natureenergy 34
SUPPLEMENTARY INFORMATION

Supplementary Figure 31. Raw data from chemisorption measurements for (a) H2 and (b) CO from SnO2-modified (2 ALD cycles) and unmodified CuO nanopowder. The solid lines correspond to the Langmuir fit of the data. Data of the fit is provided in Table S3. Adsorption on CuO is characterized by the fast chemisorption in the 0 to 10 mbar range, which indicates strong adsorption. Modified CuO, on the other hand does not show this feature but generally also shows a decreased amount of total sites.
0 50 100 150 200 250 300
0
1
2
3
4
5
6
7
8
9
10
CO
CuOCuO + SnO2C
O (
mol
g-1)
Pressure (mbar)
0 50 100 150 200 250 300
0
1
2
3
4 H2
CuOCuO + SnO2
H2 (m
ol g
-1)
Pressure (mbar)
a b
© 2017 Macmillan Publishers Limited, part of Springer Nature. All rights reserved.
NATURE ENERGY | DOI: 10.1038/nenergy.2017.87 | www.nature.com/natureenergy 35
SUPPLEMENTARY INFORMATION

Supplementary Figure 32. SEM micrographs of uncoated and ALD-coated CuO nanowires before- and after electrocatalytic testing at -0.7 V vs. RHE for 3h. After operation, the structures show more cracks, and in the case of SnO2-coated samples, showed the appearance of fibre-like extensions at the nanowire tips.
CuOBefore test
CuO + 5 pulse SnO2Before test
300 nm
CuO-0.7 V vs. RHE 3h
CuO + 5 pulse SnO2-0.7 V vs. RHE 3h
© 2017 Macmillan Publishers Limited, part of Springer Nature. All rights reserved.
NATURE ENERGY | DOI: 10.1038/nenergy.2017.87 | www.nature.com/natureenergy 36
SUPPLEMENTARY INFORMATION

Supplementary Figure 33. STEM-EDX map of fibre-like extension from CuO nanowires, modified with 5 ALD cycles of SnO2, after electrocatalytic testing at -0.7 V vs. RHE for 3h. The distribution of Cu and Sn are comparable to the bulk nanowires.
© 2017 Macmillan Publishers Limited, part of Springer Nature. All rights reserved.
NATURE ENERGY | DOI: 10.1038/nenergy.2017.87 | www.nature.com/natureenergy 37
SUPPLEMENTARY INFORMATION

Supplementary Figure 34. (a) XPS Sputtering Depth profile (Ar gun, 2kV, 2x2 mm, 9 nm/min on flat sample). In the case of untested samples, more Sn can be found at the surface of the structure. In the case of tested samples, Sn is more distributed towards the interior of the structure. Also, tested samples contain much less oxygen than untested ones, while oxygen is interestingly still present to deep within the structure. (b) Sn 3d surface XPS spectrum of fresh and tested samples with 5 cycles SnO2 on CuO. After reaction, Sn is found in a more reduced state. The peak energy is indicated.
0 2 4 6 8 10 120
10
20
30
40
50
60
70
80
905 pulse SnO2 / CuO- 0.7 V vs. RHE (3h)
Ato
mic
Fra
ctio
n (%
)
Sputter Time (min)
Cu O Sn
5 pulse SnO2 / CuOfresh
0 2 4 6 8 10 12 498 496 494 492 490 488 486 484 482 480
Cou
nts
(a.u
.)
Binding Energy (eV)
Sn (fresh) Sn (tested)
486.57
486.19
494.96
494.59
a b
© 2017 Macmillan Publishers Limited, part of Springer Nature. All rights reserved.
NATURE ENERGY | DOI: 10.1038/nenergy.2017.87 | www.nature.com/natureenergy 38
SUPPLEMENTARY INFORMATION

Supplementary Figure 35. (a) Cu 2p surface XPS spectrum of fresh and tested samples with 5 cycles SnO2 on CuO. The strong peak at 932.57 eV can be attributed to the appearance of Cu2O after electrocatalytic operation. (b) XRD diffractogram of CuO samples unmodified and modified with 5 ALD cycles of SnO2 as well as of modified samples after testing. While before operation, the presence of CuO is clearly observed, after testing, a reflection corresponding to Cu2O becomes visible while reflections relative to CuO disappear.
© 2017 Macmillan Publishers Limited, part of Springer Nature. All rights reserved.
NATURE ENERGY | DOI: 10.1038/nenergy.2017.87 | www.nature.com/natureenergy 39
SUPPLEMENTARY INFORMATION
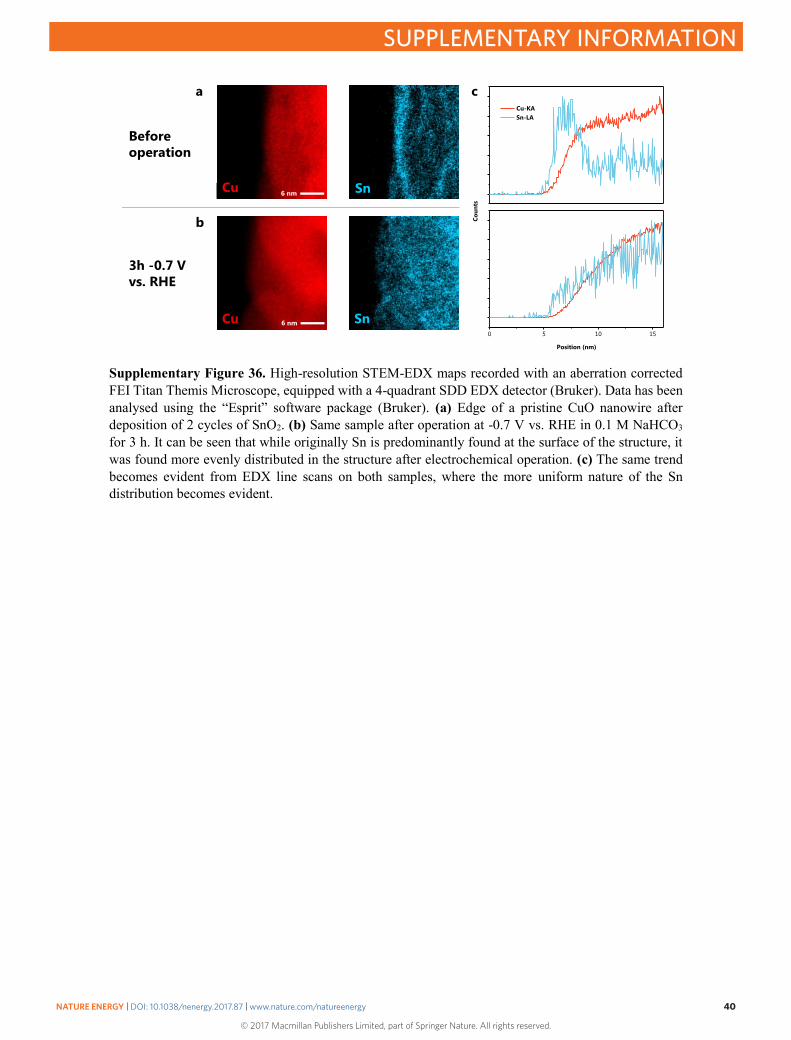
Supplementary Figure 36. High-resolution STEM-EDX maps recorded with an aberration corrected FEI Titan Themis Microscope, equipped with a 4-quadrant SDD EDX detector (Bruker). Data has been analysed using the “Esprit” software package (Bruker). (a) Edge of a pristine CuO nanowire after deposition of 2 cycles of SnO2. (b) Same sample after operation at -0.7 V vs. RHE in 0.1 M NaHCO3 for 3 h. It can be seen that while originally Sn is predominantly found at the surface of the structure, it was found more evenly distributed in the structure after electrochemical operation. (c) The same trend becomes evident from EDX line scans on both samples, where the more uniform nature of the Sn distribution becomes evident.
0 5 10 15
Cu-KA Sn-LA
Coun
ts
Position (nm)
Beforeoperation
3h -0.7 V vs. RHE
6 nm
6 nm
Cu
Cu
Sn
Sn
a
b
c
© 2017 Macmillan Publishers Limited, part of Springer Nature. All rights reserved.
NATURE ENERGY | DOI: 10.1038/nenergy.2017.87 | www.nature.com/natureenergy 40
SUPPLEMENTARY INFORMATION

Supplementary Tables
Potential vs. RHE (V)
Bare CuO 2 cycle SnO2 modified CuO
CO TOF (s-1) H2 TOF (s-1) CO TOF (s-1) H2 TOF (s-1)
- 0.4 0.003 0.011 0.003 0.001
- 0.5 0.010 0.009 0.011 0.002
- 0.6 0.017 0.007 0.039 0.003
- 0.7 0.019 0.030 0.101 0.005
- 0.8 0.012 0.088 0.137 0.011
- 0.9 0.005 0.190 0.246 0.020
Supplementary Table 1. Turnover Frequencies for CO and H2 at different potentials based on the copper surface atom density.
© 2017 Macmillan Publishers Limited, part of Springer Nature. All rights reserved.
NATURE ENERGY | DOI: 10.1038/nenergy.2017.87 | www.nature.com/natureenergy 41
SUPPLEMENTARY INFORMATION

H2 CO CuO CuO –
SnO2 CuO CuO –
SnO2 K1 (g µmol -1) 2.1 2.25 K2 (g µmol -1) 0.0084 0.0082 0.0052 0.0034 Q1 (µmol g-1) 0.63 0.99 Q2 (µmol g-1) 4.896 2.81 12.45 3.37 Qtot (µmol g-1) 5.53 2.81 13.44 3.37
Supplementary Table 2. Adsorption and Langmuir fits for hydrogen and carbon monoxide on SnO2 -modified (2 ALD cycles) and unmodified samples.
© 2017 Macmillan Publishers Limited, part of Springer Nature. All rights reserved.
NATURE ENERGY | DOI: 10.1038/nenergy.2017.87 | www.nature.com/natureenergy 42
SUPPLEMENTARY INFORMATION

Fe (ppm) Ni (ppm) Co (ppm) Pb (ppm) Pt (ppm) < 0.1 < 0.1 < 0.1 < 0.01 < 0.01
Supplementary Table 3. ICP-MS measurement results of electrolyte.
© 2017 Macmillan Publishers Limited, part of Springer Nature. All rights reserved.
NATURE ENERGY | DOI: 10.1038/nenergy.2017.87 | www.nature.com/natureenergy 43
SUPPLEMENTARY INFORMATION

Cu (ppm) Sn (ppm) < 0.1 < 0.1
Supplementary Table 4. ICP-MS measurement results of 0.1 M NaHCO3 electrolyte after 3h testing at -0.7 V vs. RHE.
© 2017 Macmillan Publishers Limited, part of Springer Nature. All rights reserved.
NATURE ENERGY | DOI: 10.1038/nenergy.2017.87 | www.nature.com/natureenergy 44
SUPPLEMENTARY INFORMATION
Supplementary References
1. Luo, J. et al. Cu2O Nanowire Photocathodes for Efficient and Durable Solar Water
Splitting. Nano Lett. 16, 1848–1857 (2016).
2. Wang, W., Wang, L., Shi, H. & Liang, Y. A room temperature chemical route for large
scale synthesis of sub-15 nm ultralong CuO nanowires with strong size effect and enhanced
photocatalytic activity. CrystEngComm 14, 5914 (2012).
3. Szuber, J., Czempik, G., Larciprete, R., Koziej, D. & Adamowicz, B. XPS study of the L-
CVD deposited SnO2 thin films exposed to oxygen and hydrogen. Thin Solid Films 391,
198–203 (2001).
4. Singh, M. R., Kwon, Y., Lum, Y., Ager, J. W. & Bell, A. T. Hydrolysis of Electrolyte
Cations Enhances the Electrochemical Reduction of CO2 over Ag and Cu. J. Am. Chem.
Soc. 138, 13006–13012 (2016).
5. Sarfraz, S., Garcia-Esparza, A. T., Jedidi, A., Cavallo, L. & Takanabe, K. Cu–Sn
Bimetallic Catalyst for Selective Aqueous Electroreduction of CO2 to CO. ACS Catal. 6,
2842–2851 (2016).
6. Nørskov, J. K. et al. Trends in the Exchange Current for Hydrogen Evolution. J.
Electrochem. Soc. 152, J23 (2005).
7. Kuhl, K. P. et al. Electrocatalytic Conversion of Carbon Dioxide to Methane and Methanol
on Transition Metal Surfaces. J. Am. Chem. Soc. 136, 14107–14113 (2014).
8. Leapman, R. D., Grunes, L. A. & Fejes, P. L. Study of the L 23 edges in the 3d transition
metals and their oxides by electron-energy-loss spectroscopy with comparisons to theory.
Phys. Rev. B 26, 614 (1982).
© 2017 Macmillan Publishers Limited, part of Springer Nature. All rights reserved.
NATURE ENERGY | DOI: 10.1038/nenergy.2017.87 | www.nature.com/natureenergy 45
SUPPLEMENTARY INFORMATION