solar energy generation potential of tompkins county
TRANSCRIPT

TOMPKINS COUNTY PLANNING DEPARTMENT
Solar Energy Generation Potential of Tompkins County
Andrew Curthoys
5152012
Table of Contents
Executive Summary 1
Overview of Solar Energy3
Focus of This Report 4
Solar Energy Trends 4
United States 4
Tompkins County 5
Resource Assessment 6
Photovoltaic Basics 8
PV Overview 8
Inverters 10
Current PV Materials10
Future PV Materials 11
Module Efficiencies12
Temperature Effects 13
Panel Degradation14
PV Manufacturers 14
Solar Thermal Systems20
Individual PV Systems 15
Location of Panels 15
Tilt Angle 17
Shading18
Solar Easements20
Tompkins County Solar Performance 20
Tompkins County PV Potential 25
Commercial Potential25
Industrial Potential28
School Building Potential 30
Residential Potential 32
Number of Homes32
Number of Homes with PV Potential 33
i
PV Potential Calculations 34
Urban Systems 34
Rural Systems34
Total Photovoltaic Potential 35
Solar System Costs 36
Module Prices 36
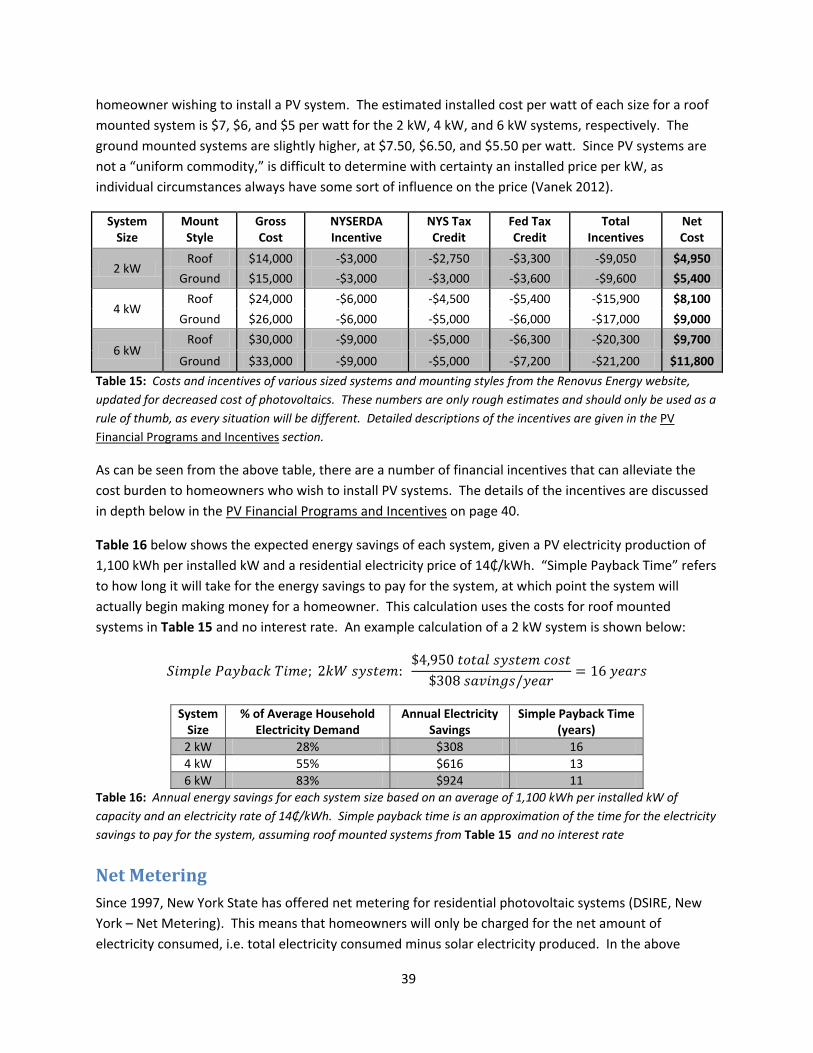
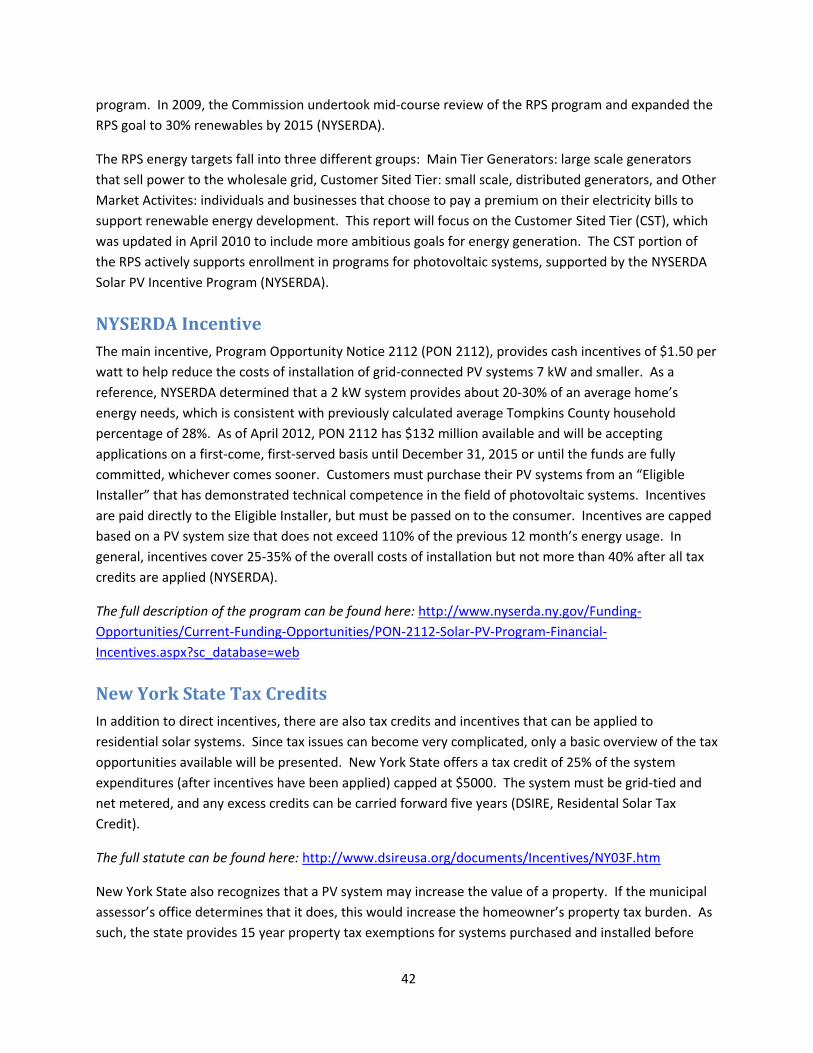
Installed System Prices37
Tompkins County System Prices 38
Net Cost Breakdown 38
Net Metering39
PV Financial Programs and Incentives 40
Traditional Financing Arrangements40
Alternative Financing Arrangements 40
Third Party Ownership Models 40
Property Tax Assessment Model 41
Solar Renewable Energy Certificates 41
NYSERDA Renewable Portfolio Standard41
NYSERDA Incentive 42
New York State Tax Credits42
Federal Tax Credits43
NYSERDA Clean Power Estimator 43
Grid Parity of Solar PV46
County Municipal Solar Installations 47
Tompkins County Public Library47
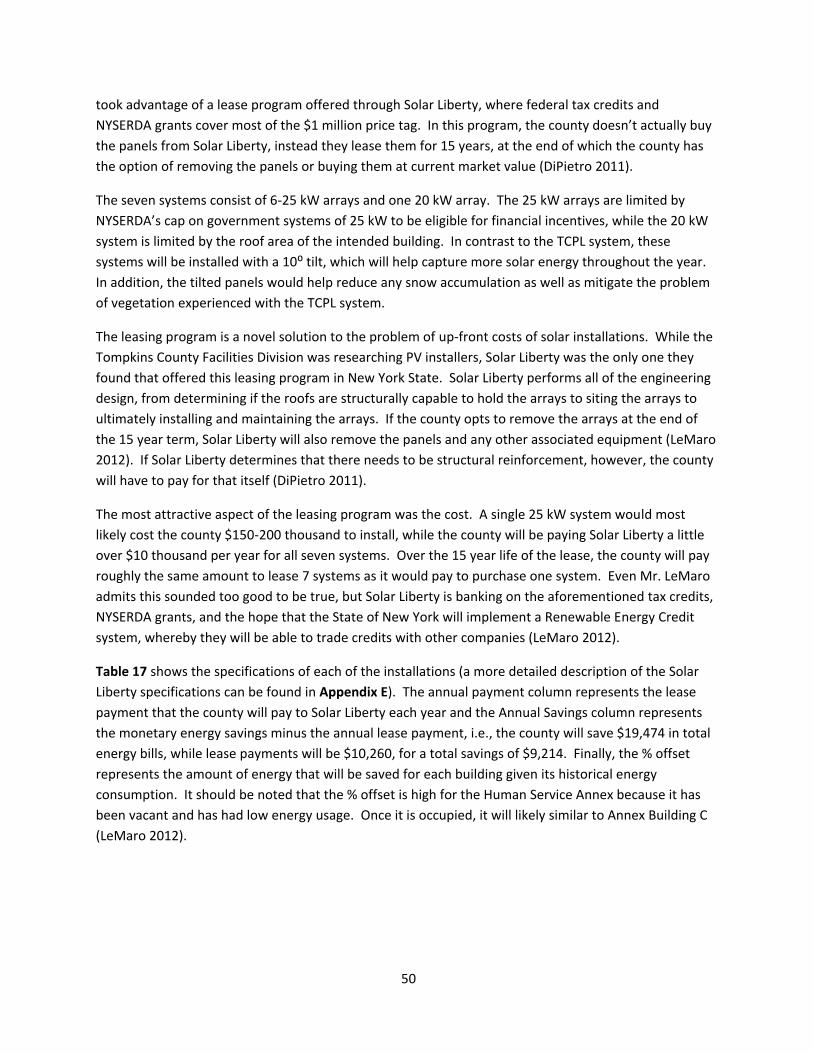
Solar Liberty Lease Program 49
Conclusions 51
Appendix A Image sources1
Appendix B Description of Variables Used by PVWatts 1
DC Rating 1
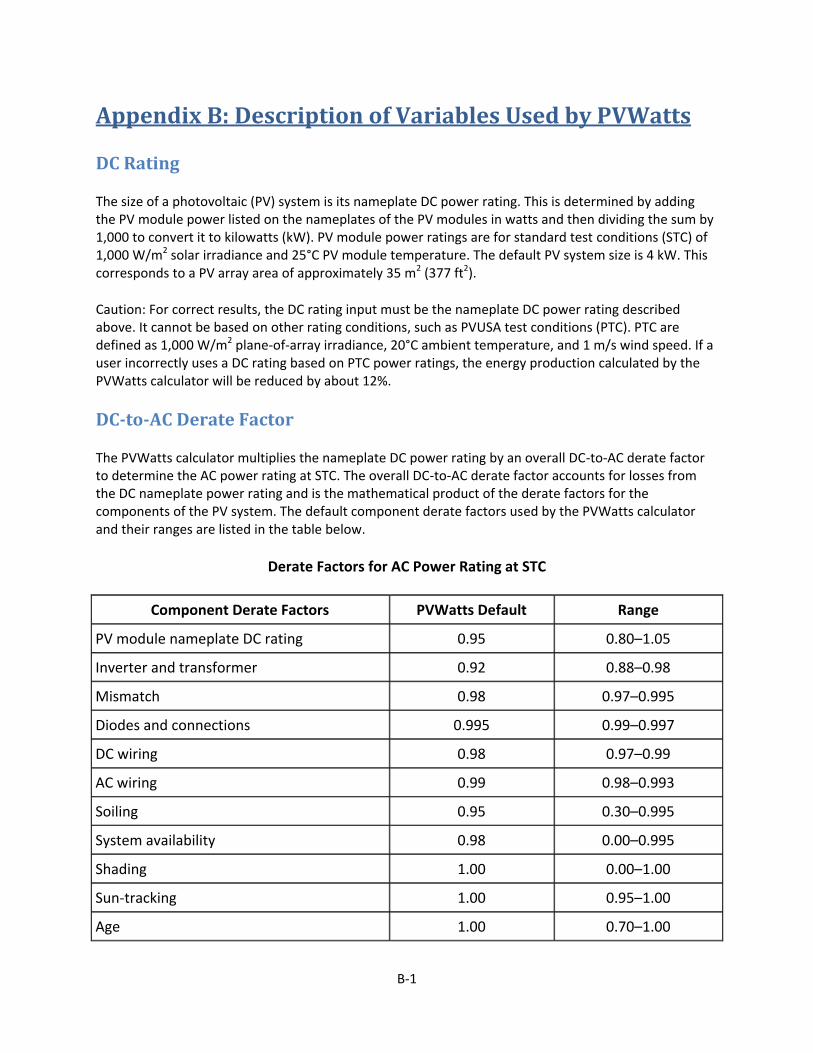
DC-to-AC Derate Factor 1
Appendix C Aerial Views of the 10 Largest Commercial Buildings in the County1
Appendix D Aerial Views of the 10 Largest Industrial Buildings in the County 1
ii
Appendix E Aerial Views of the 10 Largest School Buildings in the County 1
Appendix F Solar Liberty System Specifications 1
iii
Executive Summary
This report is intended to be used as a supplement to the Tompkins County Energy Road Map a
comprehensive strategy currently being developed by the Tompkins County Planning Department to
reduce the greenhouse gas emissions within the county The overall goal of this report is to quantify
Tompkins ountyrsquos solar photovoltaic potential
The solar potential of the county is broken down by sector into commercial industrial educational and
residential buildings shown in Table 1 It is easiest to quantify solar potential for commercialindustrial
buildings as they mainly have flat roofs with few obstructions The cumulative commercial rooftop PV
installation potential was calculated to be 86 MW which could result in an electricity production of
nearly 95 million kWh According to the Tompkins County Community Greenhouse Gas Emissions
Report 1998-2008 this potential electricity production could account for around 27 of the electricity
demand of commercial and school buildings (commercial and school buildings are grouped together in
the Tompkins County Greenhouse Gas report when calculating electricity usage)
Similarly industrial buildings typically have flat unobstructed roofs which provide ideal surfaces for
solar panels The cumulative industrial rooftop PV installed capacity potential was determined to be 22
MW which would result in an electricity production of roughly 24 million kWh or 17 of demand for
the industrial sector
It is a little more difficult to quantify the energy potential for school buildings because their roofs tend
to have more uneven surfaces and odd contours Despite this minor challenge the cumulative school
building PV installed capacity potential was calculated to be 40 MW which would result in an electricity
production of approximately 44 million kWh or 13 of the commercialschool sectorrsquos electricity
demand
It is most difficult to calculate PV potential for private homes Because homes in the county are
heterogeneous and do not typically have flat roofs like commercial industrial or school buildings it is
much more difficult to calculate their PV potential To do so it was assumed that 80 of residential
buildings in the county could install a PV system and rural houses could install bigger systems than
urban houses (for a full explanation of these assumptions see the Residential Potential section on page
32) As such the cumulative residential PV installation potential was determined to be 124 MW which
could generate approximately 136 million kWh annually or around 68 of the 2008 residential
electricity demand
Table 1 below shows a breakdown of the PV potential in the county by sector It should be noted that
the calculated PV potentials are merely estimates although it is reasonable to assume that the total
electricity generation potential across all sectors is on the order of hundreds of millions of kWh
1
Photovoltaic Potentials by Sector Capacity Potential
(MW) Energy Potential (million kWh)
Percent of Electricity Demand
Commercial 86 95 27
Industrial 22 24 17
Schools 39 43 13
Residential 124 136 46
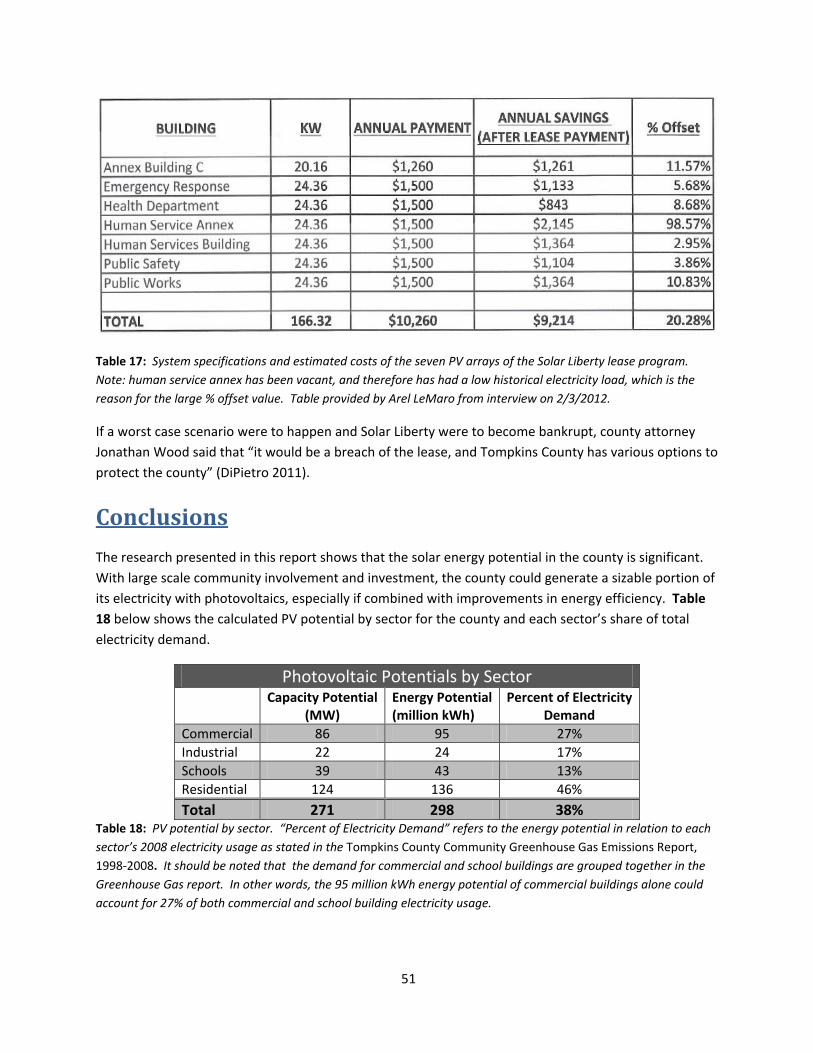
Total 271 298 38 Table 1 PV potential by sector ldquoPercent of Electricity Demandrdquo refers to the energy potential in relation to each
sectorrsquos 2008 electricity usage as stated in the Tompkins County Community Greenhouse Gas Emissions Report
1998-2008 It should be noted that the individual energy potential for commercial and school buildings are
described in terms of their ability to account for the demand by both sectors combined in the Greenhouse Gas
report In other words the 95 million kWh energy potential of commercial buildings alone could account for 27 of
both commercial and school building electricity usage
Unfortunately the calculations above are estimates of the countyrsquos solar potential and do not
necessarily represent an accurate prediction of the extent of future investment in solar photovoltaics
within the county The main deterrent against large scale solar energy development in Tompkins County
has been the up-front costs associated with purchasing a solar system However within the past year or
two the price of solar photovoltaics has dropped precipitously making solar energy systems more
affordable for home and business owners NYSERDA offers a solar energy financial incentive along with
tax incentives from the state of New York and the federal government Alternative financing
arrangements such as solar leases and power purchase agreements are becoming more popular and
some cities in the US have actually loaned money to residents to purchase and install solar systems
using a special property tax assessment to repay the loan
Tompkins County itself has already taken steps toward a greener future with two major solar energy
projects The first was the installation of 147 kW of solar photovoltaic panels on the roof of the public
library To date the system has generated 989000 kWh of electricity enough to power roughly 83
homes for a year More recently the county has entered into an agreement with Solar Liberty of Buffalo
to install solar photovoltaic systems on top of 7 county buildings Community leaders hope that these
systems will help reduce the overall greenhouse gas emissions within Tompkins County
2
Overview of Solar Energy
Solar energy is one of the most quickly evolving and exciting technologies available in the transition to a
sustainable future Although the cost of solar systems is rapidly decreasing and the efficiencies are
improving solar energy still faces some significant challenges One inherent challenge of solar energy
generation is its variability Throughout the course of the year the amount of sunlight in a given
location is subject to both diurnal and seasonal changes that make it difficult to get a consistent and
reliable supply of energy Fortunately since the sunrsquos daily and seasonal paths are both predictable and
mathematically calculable changes in energy generation can be estimated to a certain degree Weather
can also affect the output of solar energy but local historical averages can provide a reasonable
estimate of future weather patterns
The amount of energy that reaches the Earthrsquos surface also known as the incident solar energy or solar
insolation is very large Much of the energy emitted by the sun is scattered or reflected by the
atmosphere but about 21 of the sunrsquos energy reaches the Earth as direct radiation and about 29
reaches as scattered or diffuse radiation Over the course of a year over 40000 EJ (exajoules a unit of
energy defined as 11018 joules) are incident on the United States alone (Tester et al 2005) For
comparison this dwarfs the total US energy consumption of around 100 EJ per year If a 10 efficient
solar farm were installed over just 16 of the US land area (about 10 times the total area of all single-
family residential rooftops) it would meet all of the countryrsquos domestic energy needs (DOE 2005) While
solar insolation provides a huge energy potential the aforementioned variability low energy density
compared to other sources of energy land use requirements and high relative costs have traditionally
deterred large investments in solar energy
There are two main ways that the sunrsquos energy can be harvested One method is called photovoltaic
solar energy commonly referred to as ldquophotovoltaicsrdquo or simply ldquoPVrdquo This method uses light from the
sun to generate electricity directly which can be used just the same as electricity from a power plant
The majority of photovoltaic systems are grid tied meaning they are interconnected with the electricity
grid This helps alleviate the variability issue as the grid can supply electricity to a building if the PV
system does not meet the demand In addition the grid can act as a de facto battery accepting any
extra electricity the PV system produces that is higher than the demand of the building In more rare
cases usually in remote rural areas standalone PV systems are utilized meaning they are not
connected to the grid Because they are not grid tied standalone PV systems require large batteries to
store the PV electricity for use during the night or on cloudy days Due to the relatively high cost of
batteries these systems are more expensive than grid tied systems
The second method for generating solar energy is called solar thermal which uses thermal energy from
the sun to generate heat instead of electricity Oftentimes this energy is used to heat hot water which
can reduce the heating load of a home or business Unfortunately they generate the least amount of
energy during the winter when heating is needed the most They work very well during the summer
though and a large portion of a homersquos hot water needs during those months can be provided with a
solar thermal system
3
Focus of This Report
The main focus of this report will be an attempt to estimate the residential and commercial photovoltaic
solar energy potential of Tompkins County Additional information about solar thermal systems is also
included A basic overview of solar energy and the current state of photovoltaics is provided as an
introduction to solar energy for anybody who is unfamiliar with the technology followed by a more in-
depth analysis of the PV potential of Tompkins County in particular The PV potential of the county is
broken down by sector commercial industrial schools and residential buildings The commercial
industrial and school building potential is relatively easy to determine as most of these buildings have
flat roofs with little to no shading obstructions such as tall trees or neighboring tall buildings
The residential potential is a little more difficult however since houses generally donrsquot have flat roofs
and the amount of roof obstruction or potential for shading is unique to every house Some houses may
not have adequate roof space for a solar system or may have trees or neighboring houses that could
cast a shadow on the solar system Nonetheless an approximate estimate of the potential can be
determined It should be noted that this is merely a potential and there is a somewhat large amount of
uncertainty in the estimate Also it should not be mistaken for a prediction of the amount of solar
energy that will be installed in the county There is a wide range of variables that will affect the actual
amount of solar energy produced in the county and only the future will tell what the level of solar
energy investment in the county will be
Solar Energy Trends
United States
Over the past few decades the United States has shown an ever increasing interest and demand for
solar energy In 2011 the US more than doubled its solar PV capacity compared to 2010 adding enough
capacity to power more than 370000 homes (Shahan 2012) According to analysts at Ernst amp Young the
US is the second most attractive country in the world for renewable energy behind China and ahead of
Germany According to the same index the state of New York is tied with Maine Pennsylvania and
Nevada for 8th most attractive state in the country for renewable energy (Ernst amp Young 2012)
Leading the way last year in terms of number of PV systems installed were California and New Jersey
with New York in 7th place behind Pennsylvania (Shahan 2012) One main reason for the solar success of
New Jersey and Pennsylvania has to do with the statesrsquo implementation of Solar Renewable Energy
Certificates (SRECs) These are credits that owners of solar systems receive based on the amount of
energy generated by their solar systems Energy suppliers are required by the state to produce a given
amount of energy from solar energy and can buy SRECs from home or business owners who produce
solar energy (SREC Trade) These programs have been very successful in promoting the growth of solar
energy but may have become ldquovictims of their own successrdquo as the large number of solar installations is
pushing down the price of SRECs (Ernst amp Young 2012) The current low price of SRECs should slow
4
down the rate at which New Jersey and Pennsylvania solar installations advance at least for the short
term
Figure 1 The US Solar Year-In-Review This essentially sums up the big news and developments in the US solar
market during 2011
Tompkins County
Currently according to NYSERDA Tompkins County is a photovoltaic leader in central New York The
county has 211 solar PV systems overall while the surrounding counties are lagging significantly behind
as can be seen in Table 2 (PowerClerk)
5
Tompkins and Surrounding Counties County No of Systems
Tompkins 211
Tioga 33
Cayuga 32
Cortland 20
Chemung 19
Seneca 11
Schuyler 10
Table 2 Number of installed photovoltaic systems in Tompkins and surrounding counties It is clear that Tompkins
County is the PV leader in central New York (Data gathered from PowerClerk 2012)
Looking at the state as a whole Tompkins County currently ranks 7th in number of PV systems recently
passing Queens County (201) When accounting for population however the county ranks 2nd with
nearly 21 systems per 10000 residents as shown in Table 3
Leading PV Counties of New York County No of Systems Population Systems per
10000 Residents
Columbia 232 63096 368
Tompkins 211 101564 208
Ulster 376 182493 206
Dutchess 379 297488 127
Albany 232 304204 76
Westchester 352 949113 37
Erie 315 919040 34
Table 3 Table showing the top 7 counties in New York in terms of number of PV installations Tompkins County th ndranks 7 in number of installations but 2 in installations per 10000 residents (PV data gathered from PowerClerk
2012 Population data gathered from the US Census Bureau)
Of the 211 PV systems in Tompkins County 176 are residential 22 are commercialindustrial and 13 are
governmentnon-profit According to the 2010 census and GIS data obtained from the Tompkins County
Planning Department there are 38967 households 2118 commercial buildings 232 industrial
buildings and 937 school buildings As such there exists a huge potential for rooftop solar installations
in the county which will be discussed further in the Tompkins County PV Potential section
Resource Assessment
The most important aspect of generating solar energy is what is called solar insolation This is the
amount of solar energy that reaches the Earthrsquos surface for a given location This is usually expressed as
energy per unit area for a given time period For example an area that has an insolation of 1500
kWhm2year receives 1500 kWh of solar energy for every square meter of land area over the course of
a year This does not mean however that this area could annually generate 1500 kWh of solar
6
electricity for every square meter of land area This is limited by the efficiency of the PV cell converting
the sunrsquos light to electricity and this efficiency is relatively low (~11-15 for low to average cells and
~15-20 for top of the line cells)
At first glance Tompkins County may not seem like an ideal place for solar energy When compared to
Germany the worldwide leader in solar energy however Tompkins County actually proves to have a
better solar resource Much like Tompkins County Germany has a large number of cloudy days
throughout the year Overall Germany gets an average of 1500 hours of sunshine per year or a little
less than 63 full daysrsquo worth of sunlight (ldquoGermanyrdquo)
Figure 2 shows the average annual solar insolation of the United States and Germany The map shows
that nearly the entire contiguous United States receives more sunlight than Germany According to the
map Tompkins County receives around 1500 kWhm2year while Germany only receives around 1000shy
1100 kWhm2year Nevertheless Germany has an installed photovoltaic capacity of 17320 MW
compared to an installed capacity of 3954 MW in the US (German BMU amp GTM Research 2012) While
much of Germanyrsquos solar success is due to its more generous governmental funding programs it is
encouraging that solar energy can utilized in a country that has a lower-grade solar resource than
Tompkins County
Figure 2 Annual average solar insolation of the United States and Germany This figure shows that almost the
entire contiguous United States receives more sunlight than anywhere in Germany
7
Photovoltaic Basics
PV Overview
Solar photovoltaic systems utilize the photoelectric effect present in semiconductor materials to turn
solar energy directly into electricity When speaking of photovoltaics there are a number of
terminologies that are used to describe certain aspects of a system First the electricity is actually
generated in what is called a solar cell Each cell is only a few square inches (Figure 3) and only
generates a small amount of voltage However a number of cells wired together in series increases the
voltage in what are known as panels or modules Both terms are commonly used and will be used
interchangeably throughout this report A typical photovoltaic panel rectangular measuring a few
square feet and typically consists of 36 cells connected in series (Kissell 2012) Figure 4 shows how
individual cells are typically strung together to form a panel
Figure 3 Typical size of a solar cell These are what actually generate the electricity in a PV system and a number
of them are strung together to form a PV panel
8
Figure 4 A schematic of a typical photovoltaic panel 36 individual PV cells are connected in series to create the
panel also known as a module
Most of the time solar PV systems consist of more than one panel When a number of panels are
arranged in series this is referred to as a string Multiple strings can then be arranged at a single site to
form an array Figure 5 shows an example of a 6 panel array consisting of two 3 panel strings
Figure 5 An example of a PV array consisting of two strings of 3 panels each
In order for PV panels from different manufacturers to be compared on an equivalent basis they need
to be tested according to universal standards Each PV manufacturer must subject their panels to a
9
laboratory rating system where they are tested under 1000 Wm2 irradiation and 25 C temperature
The amount of power that the panel produces under these conditions is then referred to the panelrsquos
nameplate rating The nameplate rating is in units of Watts and referred to as the panelrsquos watt-peak
rating and given the symbol Wp Oftentimes the ldquopeakrdquo portion is understood and panels are referred to
in Watts For example a 250 W panel will produce 250 watts of power under laboratory conditions
However it will not necessarily produce 250 W of power when installed because conditions in the real
world are not always as ideal as in the laboratory Most of the time in Tompkins County the panel will
likely receive less sunlight than in the laboratory and will produce less than 250 W The system will
produce less than 2 kW most of the time but at times when the sun is very intense it could actually
produce more than 2 kW If this panel is combined with 7 other 250 W panels into an 8-panel array it
will have a nameplate rating of 2000 W (2kW)
Inverters
Panels are not the only piece of equipment associated with a photovoltaic system Because solar panels
produce direct current or DC power and the electricity grid uses alternating current or AC power the DC
current from the array needs to be converted to AC before it can be used by electrical appliances or sent
to the grid To convert the electricity a complex piece of electrical equipment called an inverter uses
various algorithms to operate the PV system at maximum power Inverters tend wear out much sooner
than PV panels and many are only warrantied for 5-10 years as compared to 20-25 years for most
panels As such many firms are looking into producing more reliable inverters that will have a longer
life (Cleantech 2009)
Current PV Cell Materials
Throughout the course of photovoltaic development there have been three generations of solar cells
broken down by the materials they use and their cost By far the most frequently used solar panels
today are first generation panels made from crystalline silicon (c-Si) This is because of the high
efficiency of silicon panels and the long history of silicon solar cell development and use
There are two types of crystalline silicon cells monocrystalline (mono-cSi) and polycrystalline (poly-cSi)
Mono-cSi cells are produced in a very highly specialized process identical to the process of developing
silicon computer chips These cells have the highest efficiency of silicon based cells but they are also
the most expensive Poly-cSi cells are made in a less exacting fashion and therefore have a lower
efficiency but also lower cost Mono-cSi panels require approximately 60 ft2 of panel area per kW of
installed capacity while poly-cSi cells need up to 120 ft2 of panel area for each kW of installed capacity
(Kissell 2012) Traditionally crystalline silicon panels have had a relatively high price but their price has
recently plummeted making these types of panels more cost effective in the short term
In addition to c-Si cells there are a number of different technologies being studied and developed that
show promise moving forward Second generation cells commonly referred to as ldquothin filmsrdquo have a
lower efficiency than c-Si cells but have also traditionally had a lower cost They are also much thinner
and lighter than c-Si cells and can contour to odd shapes and building angles Figure 6 provides typical
characteristics of c-Si cells and thin films
10
Figure 6 Characteristics of monocrystalline polycrystalline and thin film PV cells Below the table are pictures of
typical monocrystalline polycrystalline and thin film cells respectively IPV refers to ldquouilding Integrated PVrdquo
which incorporates PV panels into the construction of new buildings
The three main types of thin film solar cells are amorphous silicon (a-Si) cadmium telluride (CdTe) and
copper indium gallium selenide (CIGS) Amorphous silicon has struggled to gain market share because
of its low conversion efficiency and seems to have lost out to CdTe and CIGS as the main thin film
technologies CdTe was pioneered by First Solar which is now the worldwide leader in PV production
(Figure 8) This is currently the most cost effective technology but its lower efficiency has decreased its
popularity compared to crystalline silicon (PVInsights) CIGS has shown to have higher efficiencies in the
laboratory but it is much more complicated to produce than CdTe so it has lagged behind Many people
are optimistic about the future of CIGS because of its high efficiency but firms need to figure out how to
economically commercialize the process before it can gain significant market share (Grana 2010)
Future PV Materials
Third generation cells are cells that are mostly experimental at this point but show promise if they can
be commercialized There are a number of different types of third generation cells but they all have
higher efficiencies than silicon based cells and should be less expensive to produce If these cells do
happen to be developed and commercialized many of the limitations of solar energy would be lessened
namely cost and efficiency
A graph of the efficiency vs cost of the three generations of PV modules is shown below in Figure 7
The diagonal dashed lines represent the module cost per watt while the horizontal dashed lines
represent different physical limitations on PV cells The ldquoShockley-Queisser limitrdquo indicates the highest
theoretical efficiency that current generation 1 and 2 cells can reach Some cells have approached this
11
limit in the laboratory but commercially available cells only reach efficiencies in the upper teens and
recently 20 percent The ldquoultimate thermodynamic limit at 1 sunrdquo line indicates the theoretical
efficiency limit of advanced technology cells without the benefit of concentrators ie mirrors or lenses
that concentrate the sunlight Finally the ldquothermodynamic limit at 46200 sunsrdquo line indicates the
efficiency possible with advanced cells at the highest theoretical concentration level (Cartlidge 2007)
Figure 7 Efficiency vs cost of three generations of solar cells The dashed diagonal lines represent the module cost
per watt peak and the dashed horizontal lines represent the physical limitations of solar cells Note this is not the
total installed cost of the system just the module cost
The takeaways from this chart are the fact that second generation thin film cells are less expensive but
also less efficient than first generation cells while third generation cells are both less expensive and
more efficient Current c-Si cells range $1 per watt and around $3 per watt and ~12 efficiency to 20
efficiency (see Table 14 for a description of average module costs) If scientists and engineers are able
to develop third generation solar cells on a commercial scale they could be economically feasible
without any sort of government intervention or financial subsidy
Module Efficiencies
As mentioned before every commercially available PV module is tested according to standard test
conditions (STC) These conditions are specified as 1000 Wm2 (929 Wft2) irradiation at 25 C (77 F )
module temperature and the tests are carried out in a laboratory These conditions allow a direct
comparison between different modules from different companies and even different technologies The
efficiency of the module is related to its watt peak rating and surface area by the following equation
12
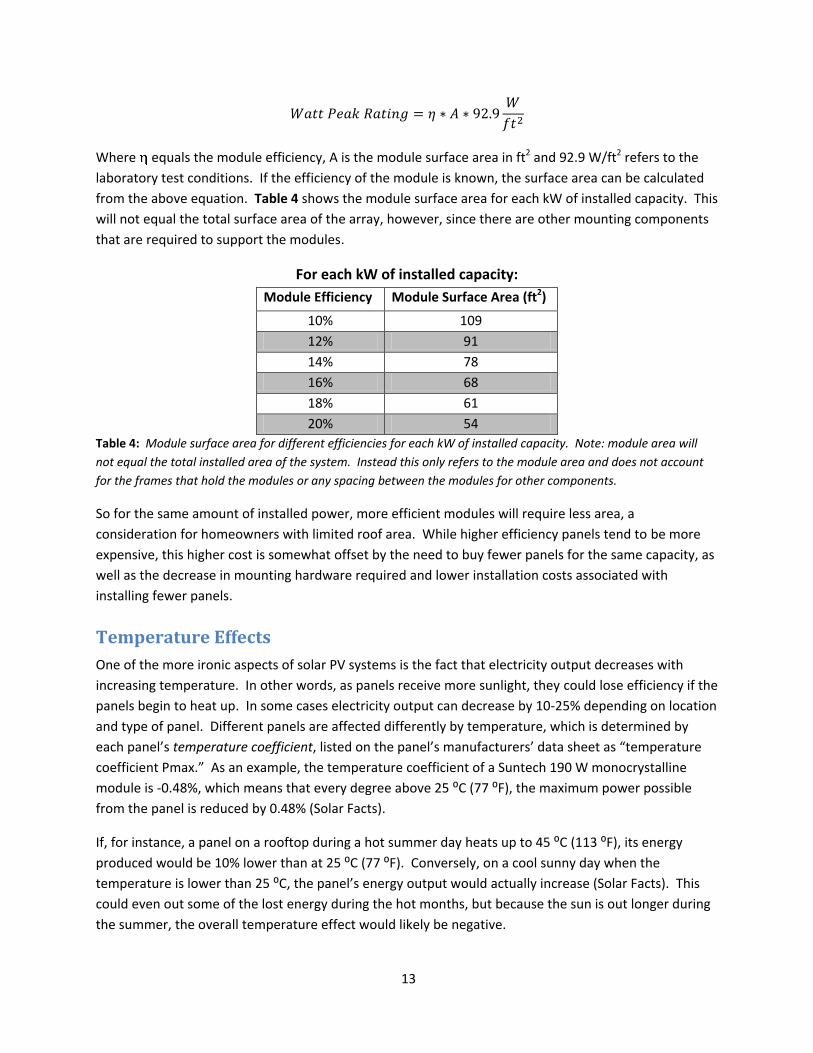
Where equals the module efficiency A is the module surface area in ft2 and 929 Wft2 refers to the
laboratory test conditions If the efficiency of the module is known the surface area can be calculated
from the above equation Table 4 shows the module surface area for each kW of installed capacity This
will not equal the total surface area of the array however since there are other mounting components
that are required to support the modules
For each kW of installed capacity
Module Efficiency Module Surface Area (ft2)
10 109
12 91
14 78
16 68
18 61
20 54
Table 4 Module surface area for different efficiencies for each kW of installed capacity Note module area will
not equal the total installed area of the system Instead this only refers to the module area and does not account
for the frames that hold the modules or any spacing between the modules for other components
So for the same amount of installed power more efficient modules will require less area a
consideration for homeowners with limited roof area While higher efficiency panels tend to be more
expensive this higher cost is somewhat offset by the need to buy fewer panels for the same capacity as
well as the decrease in mounting hardware required and lower installation costs associated with
installing fewer panels
Temperature Effects
One of the more ironic aspects of solar PV systems is the fact that electricity output decreases with
increasing temperature In other words as panels receive more sunlight they could lose efficiency if the
panels begin to heat up In some cases electricity output can decrease by 10-25 depending on location
and type of panel Different panels are affected differently by temperature which is determined by
each panelrsquos temperature coefficient listed on the panelrsquos manufacturersrsquo data sheet as ldquotemperature
coefficient Pmaxrdquo s an example the temperature coefficient of a Suntech 190 W monocrystalline
module is -048 which means that every degree above 25 C (77 F) the maximum power possible
from the panel is reduced by 048 (Solar Facts)
If for instance a panel on a rooftop during a hot summer day heats up to 45 (113 F) its energy
produced would be 10 lower than at 25 (77 F) onversely on a cool sunny day when the
temperature is lower than 25 the panelrsquos energy output would actually increase (Solar Facts) This
could even out some of the lost energy during the hot months but because the sun is out longer during
the summer the overall temperature effect would likely be negative
13
Typically c-Si solar panels have a temperature coefficient in the range of -044 to -050 Sunpowerrsquos
E20 series monocrystalline modules have the lowest commercially available temperature coefficient at shy
038 as well as the highest module efficiency at 201 (Solar Facts and Sunpower Data Sheet)
Panel Degradation
Over time photovoltaic panels slowly begin to degrade and produce less power than when they were
new One widely held assumption about PV systems degradation is that a panel will lose about 1 of its
efficiency per year (Note this does not mean that a panel with 15 efficiency will be 0 efficient in 15
years It means that it will produce 85 of the energy in year 15 as compared to year 1 ie reducing its
overall efficiency to 1275) Branker Pathak and Pearce found this assumption to be unreasonably
conservative and suggested a degradation rate of 02 to 05 per year Even older panels produced in
the 1980s have been shown to degrade slower than the customary 1 mark and some even still perform
to their original specifications (Trabish 2011 and Dankoff and Schwartz 2007) As technologies
advance panel degradation rates should only decrease and perhaps even disappear altogether
Current PV Manufacturers
Figure 8 shows the top 10 photovoltaic manufacturers in terms of market share First Solar is the only
thin film manufacturer as well as the current worldwide leader in production This is due to the
companyrsquos downstream-integrated business model that few other firms have been able to follow
(Colville 2012) It will be increasingly difficult for thin film manufacturers to compete moving forward
given the price competitiveness that c-Si panels have developed
14
Figure 8 Leading PV manufacturers in terms of market share First Solar is the largest and only thin film
manufacturer on the list Chinese and Taiwanese companies occupy 8 of the top 10 spots with Fist Solar (US) and
Canadian Solar (Canada) the only two exceptions
Residential Photovoltaic Systems
One aspect that makes photovoltaics appealing is the simplicity and minimal operating costs and
maintenance Once the panels are installed they are essentially left in place for about 20 to 30 years
with little to no maintenance The major stumbling block for large scale implementation of photovoltaic
systems is the high up front cost The monetary savings resulting from a solar system may be greater
than the initial cost of installation but oftentimes individuals donrsquot have the money up front to pay for
the system Fortunately there are a number of financial incentive and tax programs that individuals
who wish to install photovoltaic systems may utilize These programs are discussed in-depth in the PV
Financial Programs and Incentives section on page 40
Location of Panels
One of the first concerns when determining the feasibility of a photovoltaic system on a residence is the
location and orientation of the panels In general solar panels need to be located in areas with minimal
shading between the hours of 900 am and 300 pm (Renovus) Panels typically need to face South
and can be mounted either on the roof of the home or on the ground If homeowners have adequate
South-facing roof space they will likely elect to mount the panels on the roof
15
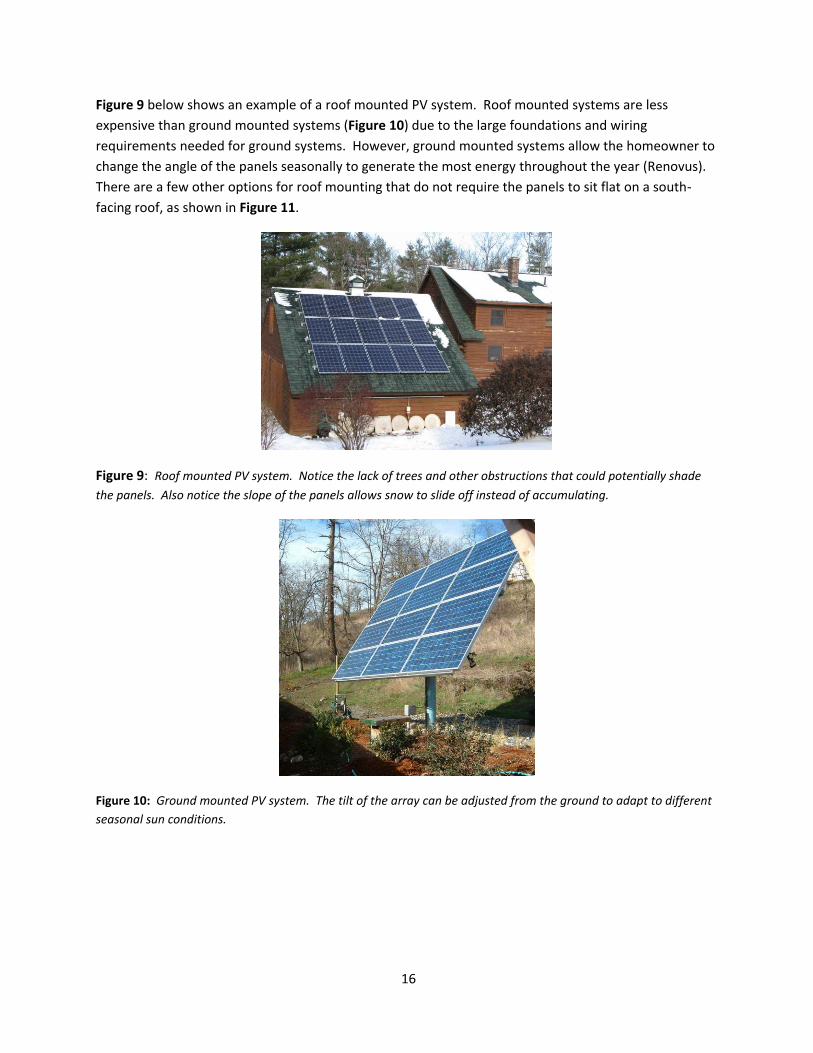
Figure 9 below shows an example of a roof mounted PV system Roof mounted systems are less
expensive than ground mounted systems (Figure 10) due to the large foundations and wiring
requirements needed for ground systems However ground mounted systems allow the homeowner to
change the angle of the panels seasonally to generate the most energy throughout the year (Renovus)
There are a few other options for roof mounting that do not require the panels to sit flat on a south-
facing roof as shown in Figure 11
Figure 9 Roof mounted PV system Notice the lack of trees and other obstructions that could potentially shade
the panels Also notice the slope of the panels allows snow to slide off instead of accumulating
Figure 10 Ground mounted PV system The tilt of the array can be adjusted from the ground to adapt to different
seasonal sun conditions
16
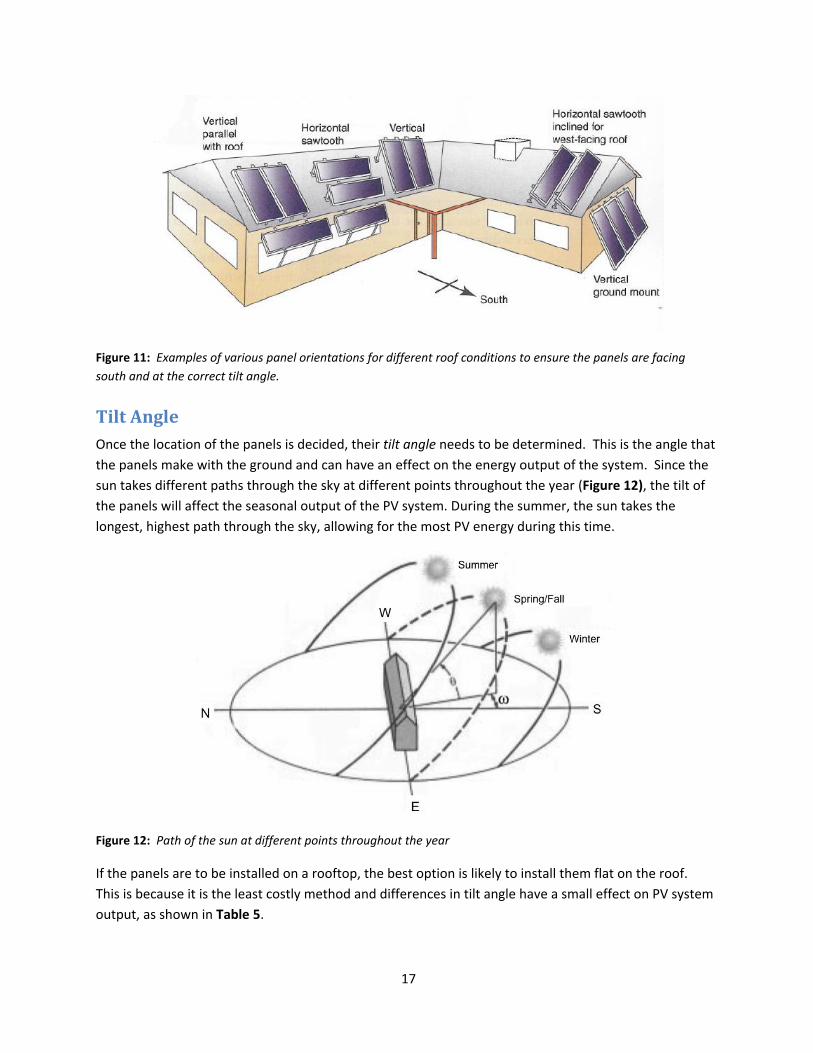
Figure 11 Examples of various panel orientations for different roof conditions to ensure the panels are facing
south and at the correct tilt angle
Tilt Angle
Once the location of the panels is decided their tilt angle needs to be determined This is the angle that
the panels make with the ground and can have an effect on the energy output of the system Since the
sun takes different paths through the sky at different points throughout the year (Figure 12) the tilt of
the panels will affect the seasonal output of the PV system During the summer the sun takes the
longest highest path through the sky allowing for the most PV energy during this time
Figure 12 Path of the sun at different points throughout the year
If the panels are to be installed on a rooftop the best option is likely to install them flat on the roof
This is because it is the least costly method and differences in tilt angle have a small effect on PV system
output as shown in Table 5
17
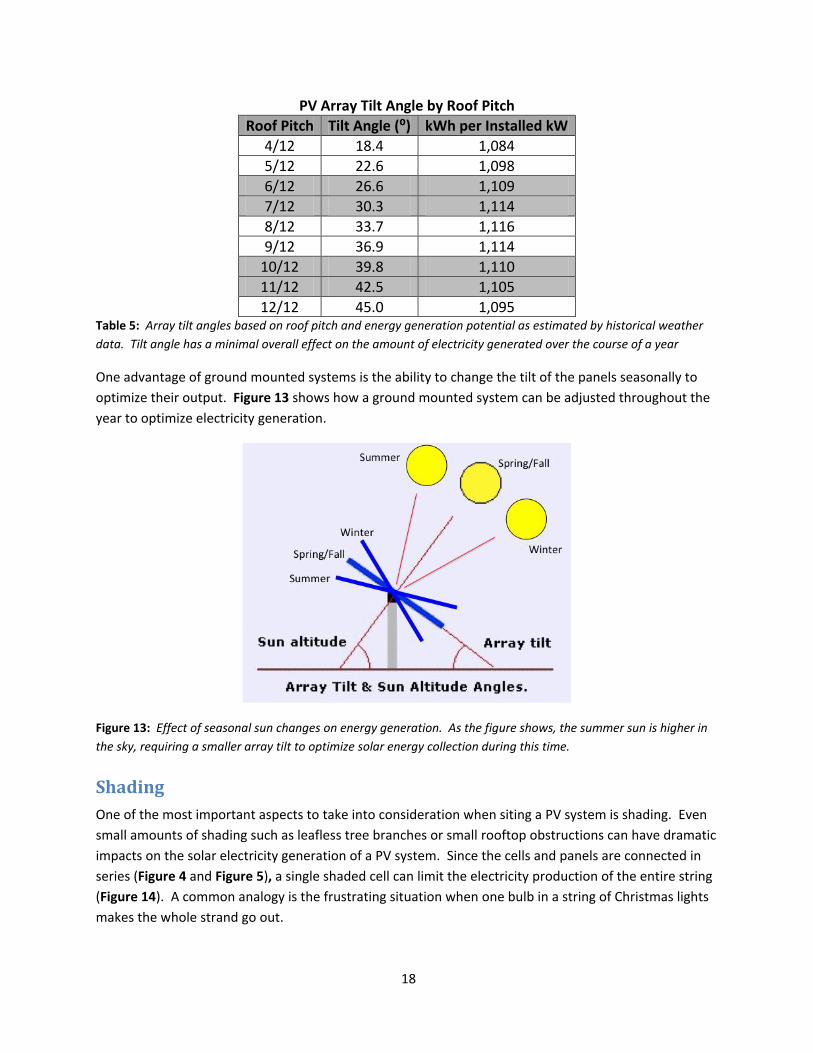
PV Array Tilt Angle by Roof Pitch
Roof Pitch Tilt ngle (⁰) kWh per Installed kW
412 184 1084
512 226 1098
612 266 1109
712 303 1114
812 337 1116
912 369 1114
1012 398 1110
1112 425 1105
1212 450 1095 Table 5 Array tilt angles based on roof pitch and energy generation potential as estimated by historical weather
data Tilt angle has a minimal overall effect on the amount of electricity generated over the course of a year
One advantage of ground mounted systems is the ability to change the tilt of the panels seasonally to
optimize their output Figure 13 shows how a ground mounted system can be adjusted throughout the
year to optimize electricity generation
Figure 13 Effect of seasonal sun changes on energy generation As the figure shows the summer sun is higher in
the sky requiring a smaller array tilt to optimize solar energy collection during this time
Shading
One of the most important aspects to take into consideration when siting a PV system is shading Even
small amounts of shading such as leafless tree branches or small rooftop obstructions can have dramatic
impacts on the solar electricity generation of a PV system Since the cells and panels are connected in
series (Figure 4 and Figure 5) a single shaded cell can limit the electricity production of the entire string
(Figure 14) A common analogy is the frustrating situation when one bulb in a string of Christmas lights
makes the whole strand go out
18
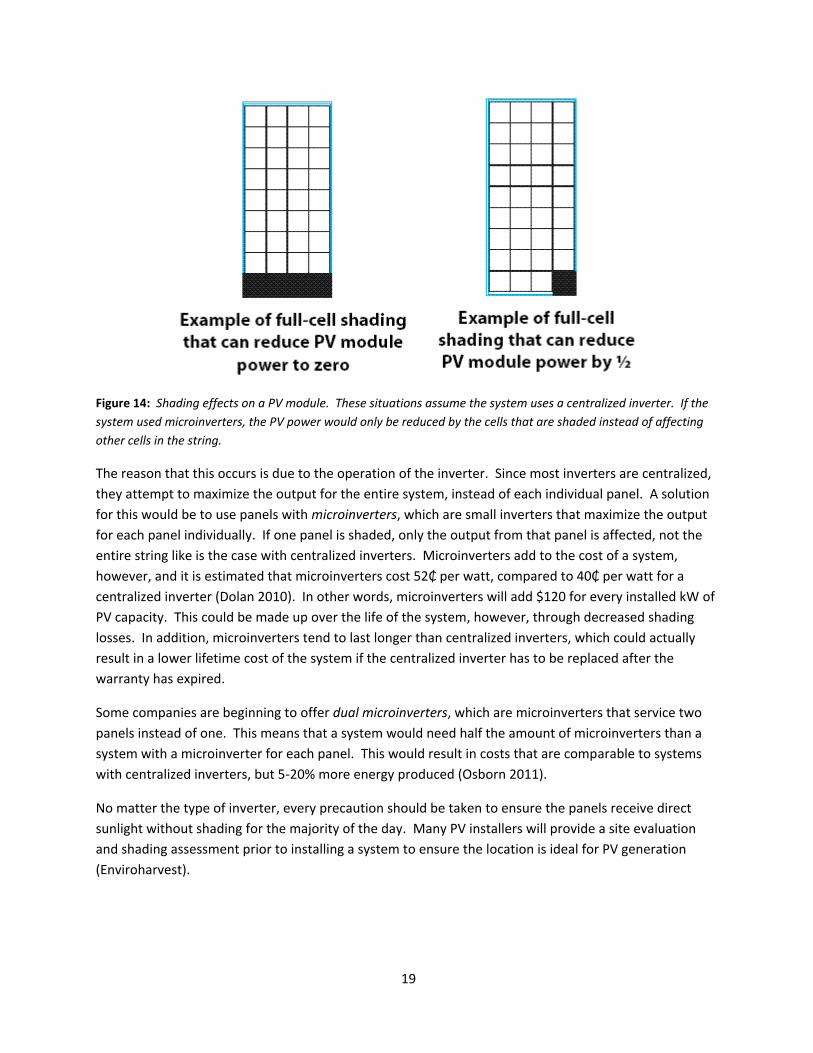
Figure 14 Shading effects on a PV module These situations assume the system uses a centralized inverter If the
system used microinverters the PV power would only be reduced by the cells that are shaded instead of affecting
other cells in the string
The reason that this occurs is due to the operation of the inverter Since most inverters are centralized
they attempt to maximize the output for the entire system instead of each individual panel A solution
for this would be to use panels with microinverters which are small inverters that maximize the output
for each panel individually If one panel is shaded only the output from that panel is affected not the
entire string like is the case with centralized inverters Microinverters add to the cost of a system
however and it is estimated that microinverters cost 52₵ per watt compared to 40₵ per watt for a
centralized inverter (Dolan 2010) In other words microinverters will add $120 for every installed kW of
PV capacity This could be made up over the life of the system however through decreased shading
losses In addition microinverters tend to last longer than centralized inverters which could actually
result in a lower lifetime cost of the system if the centralized inverter has to be replaced after the
warranty has expired
Some companies are beginning to offer dual microinverters which are microinverters that service two
panels instead of one This means that a system would need half the amount of microinverters than a
system with a microinverter for each panel This would result in costs that are comparable to systems
with centralized inverters but 5-20 more energy produced (Osborn 2011)
No matter the type of inverter every precaution should be taken to ensure the panels receive direct
sunlight without shading for the majority of the day Many PV installers will provide a site evaluation
and shading assessment prior to installing a system to ensure the location is ideal for PV generation
(Enviroharvest)
19
Solar Easements
One issue that may concern residents before installing a solar energy system is the possibility of
neighbors constructing or planting something that may obstruct the amount of sunlight incident on their
PV array A solar easement prohibits neighboring property owners from this ensuring the solar system
will not be blocked by the actions of neighboring residents A typical solar easement will contain a
description of the dimensions of the easement including horizontal and vertical angles measured from
the solar installation as well as conditions for revision and termination of the easement (Garrard 2011)
New York Statersquos solar easement provision is outlined in LS Real Property Statute 335-b which
describes the aforementioned terms and a request for provisions for compensation in the instance that
a solar installation is blocked (CLS 335-b) Like many other states solar easements are voluntary
contracts that can ensure uninterrupted solar access for solar energy systems They are required to
contain at a minimum information describing ldquothe easement location and orientation to real property
subject to the easement provisions for termination and provisions for compensation in the event that
interference occursrdquo (DSIRE Solar Easements)
The full text of CLS 335-b can be found here
httpwwwdsireusaorgdocumentsIncentivesNY01Rhtm
In addition to the general solar easement provision New York General City Town and Village codes
allow local zoning districts to enact regulations regarding solar access within a municipality The intent
of the legislation recognizes ldquoaccess to solar energy as a valid public purpose within the zoning authority
of local governmentsrdquo (DSIRE Solar Easements)
This full legislation regarding municipal zoning can be found below
General City httpwwwdsireusaorgdocumentsIncentivesNY01Rbhtm
Towns httpwwwdsireusaorgdocumentsIncentivesNY01Rchtm
Villages httpwwwdsireusaorgdocumentsIncentivesNY01Rdhtm
Solar Thermal Systems
Solar thermal systems differ from PV systems in the fact that they collect and store heat from the sun
instead of producing electricity One of the most typical and practical applications of a solar thermal
system is hot water heating The heat from the sun is collected with a solar thermal collector and the
heat is then transferred to water in the house reducing the heating load of the house
The most common type of solar thermal collector is a flat-plate collector which is similar in size to a PV
module but operates much differently It consists of a metal box with a tempered glass coating called
glazing to protect it from the elements Inside the collector is an absorber which is frequently a copper
plate with copper tubing fastened to it The top of the absorber is coated with a dark paint with a
special absorber to ensure it absorbs the most amount of solar heat possible As the plate heats up
20
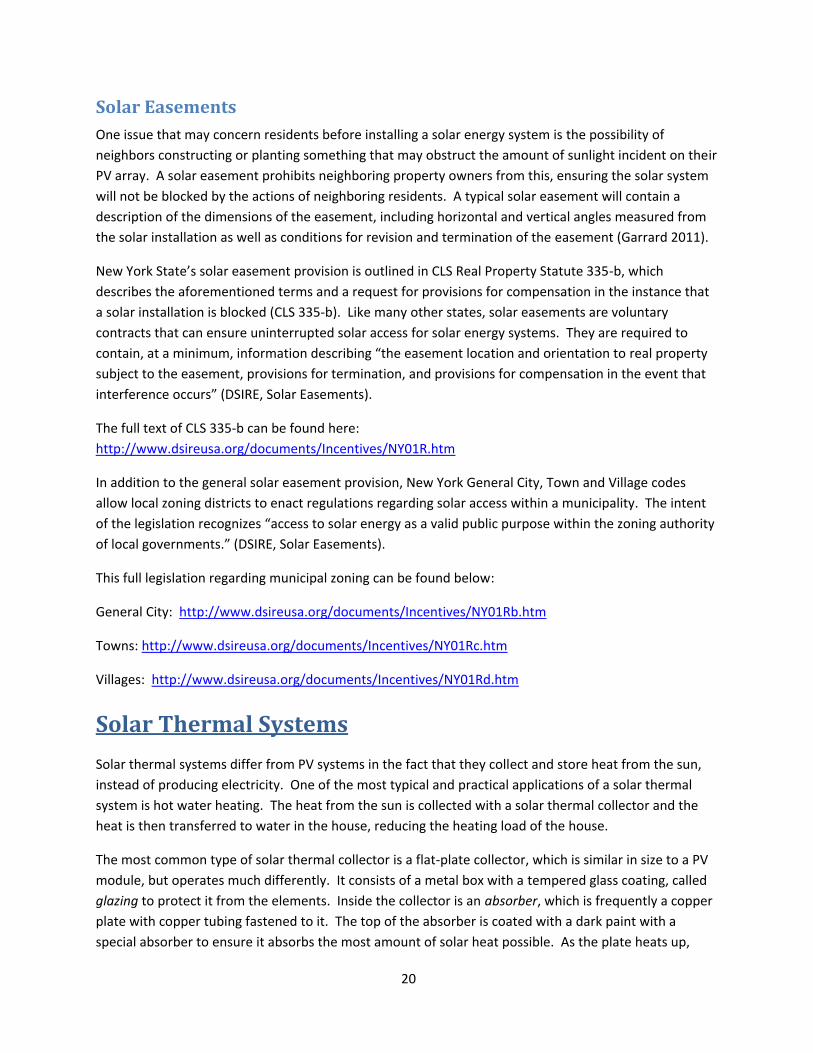
energy is transferred from the plate to a fluid circulating through the copper piping which is then either
pumped directly to the house to be used or to a heat exchanger that gives off its thermal energy to
water that is used in the house (Steeby 2012) Figure 15 shows the typical setup of a flat-plate solar
thermal collector
Figure 15 Typical arrangement of a flat plate collector The sunrsquos energy is absorbed by the absorber which is
then transferred to a fluid that is used to heat water in the home
A typical residential solar hot water system will need 100 to 120 ft2 of collector panels for hot water
needs If electricity or propane are currently used to heat water in a household electricity rates above 7
₵kWh or propane prices above $125 per gallon could make solar water heating an attractive
investment At these rates an average household could save between 50 and 80 of the total cost of
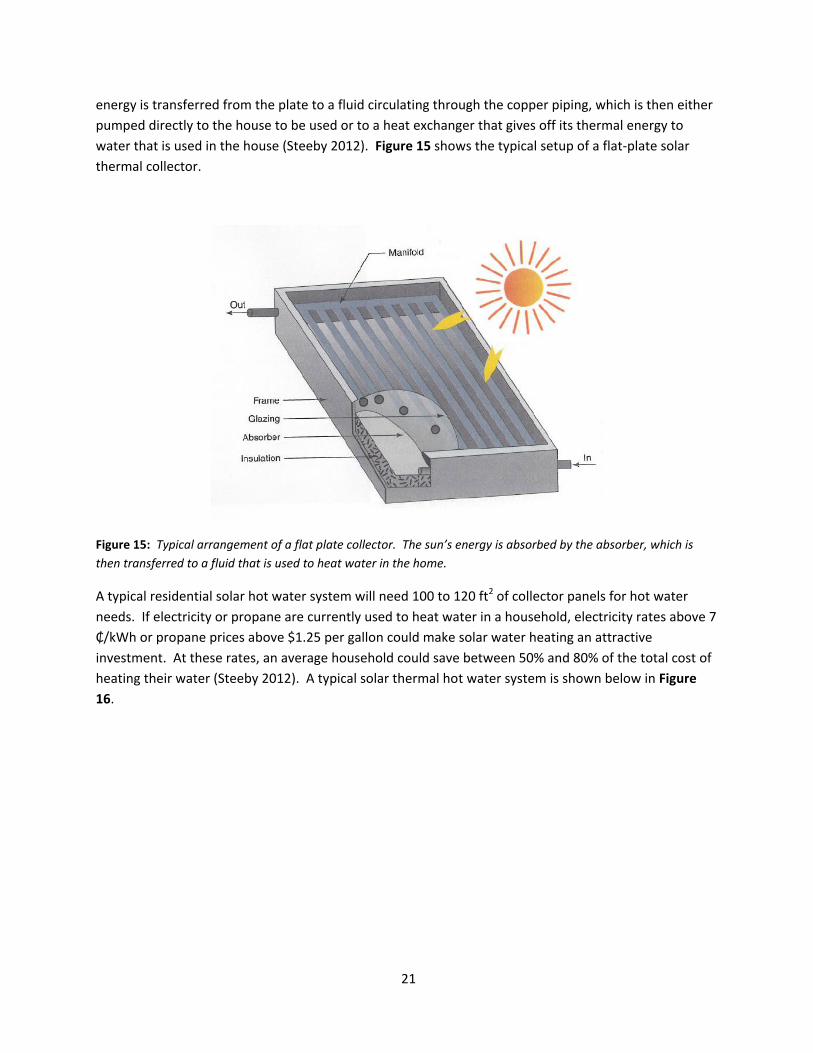
heating their water (Steeby 2012) A typical solar thermal hot water system is shown below in Figure
16
21
Figure 16 An example of a typical solar thermal hot water system The heated water is stored on the bottom
floor which is then circulated throughout the house for hot water uses such as bathing and washing clothes In
addition the hot water can be circulated through pipes in the floor or through radiators in the winter to heat the
home
An alternative use of solar water heating is pool andor spa heating The use of solar thermal heating
systems for swimming pools has grown to be the number one application of solar energy in the United
States today When a solar thermal pool heating system is appropriately sized and installed it can pay
for itself in 2 to 3 years (Steeby 2012)
Tompkins County PV Performance
In My Backyard Tool
In order to specifically assess the solar energy resource potential in Tompkins County NRELrsquos ldquoIn My
Backyardrdquo (IMY) tool was utilized
IMBY can be found here httpwwwnrelgoveisimby
This tool is a variation of NRELrsquos PVWatts tool that uses a model developed by Richard Perez from SUNY
Albany in conjunction with NREL for the US Department of Energy This model uses hourly radiance
22
images from geostationary weather satellites daily snow cover data and monthly averages of
atmospheric water vapor trace gases and the amount of aerosols in the atmosphere to calculate the
hourly insolation falling on a horizontal surface From there calculations are performed to determine
insolation for a specified tilt angle (NREL)
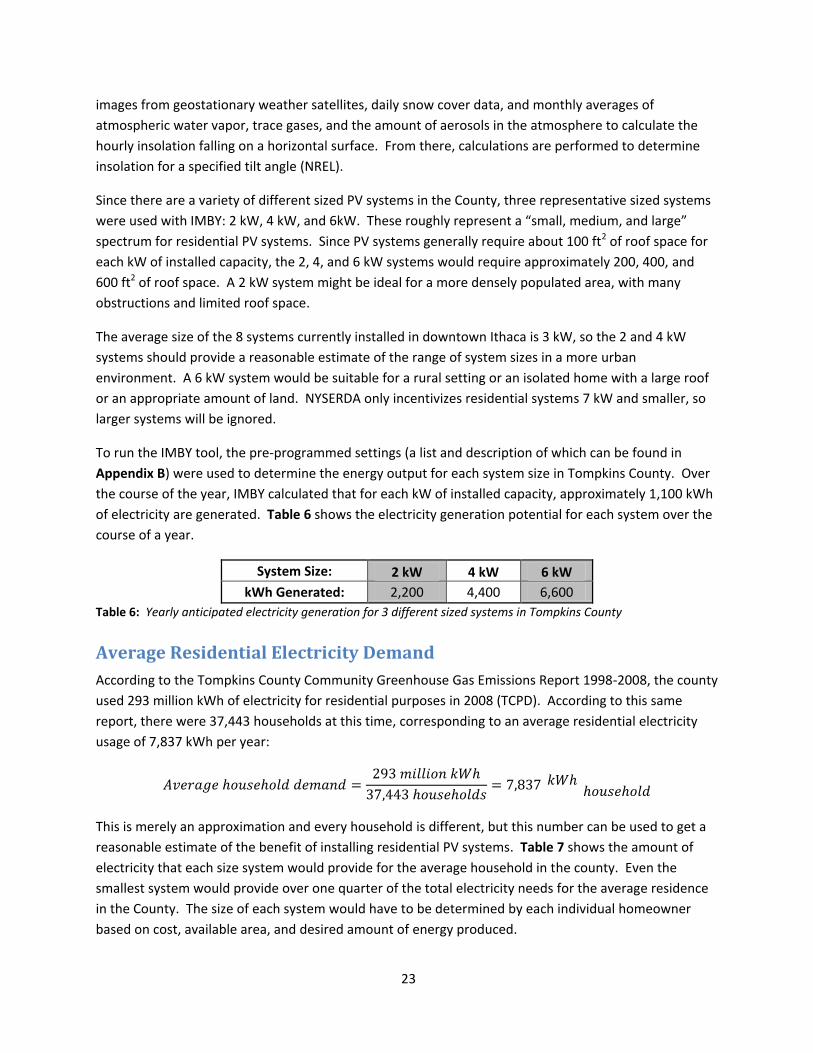
Since there are a variety of different sized PV systems in the County three representative sized systems
were used with IMBY 2 kW 4 kW and 6kW These roughly represent a ldquosmall medium and largerdquo
spectrum for residential PV systems Since PV systems generally require about 100 ft2 of roof space for
each kW of installed capacity the 2 4 and 6 kW systems would require approximately 200 400 and
600 ft2 of roof space A 2 kW system might be ideal for a more densely populated area with many
obstructions and limited roof space
The average size of the 8 systems currently installed in downtown Ithaca is 3 kW so the 2 and 4 kW
systems should provide a reasonable estimate of the range of system sizes in a more urban
environment A 6 kW system would be suitable for a rural setting or an isolated home with a large roof
or an appropriate amount of land NYSERDA only incentivizes residential systems 7 kW and smaller so
larger systems will be ignored
To run the IMBY tool the pre-programmed settings (a list and description of which can be found in
Appendix B) were used to determine the energy output for each system size in Tompkins County Over
the course of the year IMBY calculated that for each kW of installed capacity approximately 1100 kWh
of electricity are generated Table 6 shows the electricity generation potential for each system over the
course of a year
System Size 2 kW 4 kW 6 kW
kWh Generated 2200 4400 6600
Table 6 Yearly anticipated electricity generation for 3 different sized systems in Tompkins County
Average Residential Electricity Demand
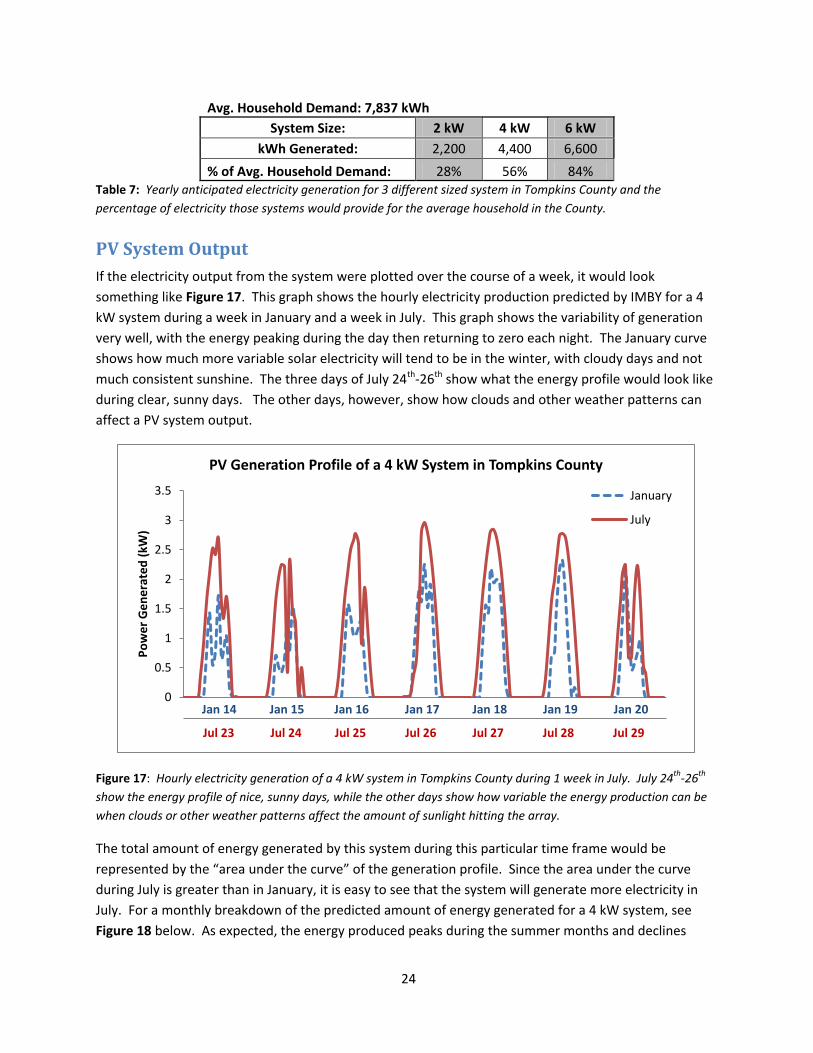
According to the Tompkins County Community Greenhouse Gas Emissions Report 1998-2008 the county
used 293 million kWh of electricity for residential purposes in 2008 (TCPD) According to this same
report there were 37443 households at this time corresponding to an average residential electricity
usage of 7837 kWh per year
This is merely an approximation and every household is different but this number can be used to get a
reasonable estimate of the benefit of installing residential PV systems Table 7 shows the amount of
electricity that each size system would provide for the average household in the county Even the
smallest system would provide over one quarter of the total electricity needs for the average residence
in the County The size of each system would have to be determined by each individual homeowner
based on cost available area and desired amount of energy produced
23
Jul Jul Jul Jul Jul Jul Jul Jul
Jan 14 Jan 15 Jan 16 Jan 17 Jan 18 Jan 19 Jan 20 Jan 21
Avg Household Demand 7837 kWh
System Size 2 kW 4 kW 6 kW
kWh Generated 2200 4400 6600
of Avg Household Demand 28 56 84 Table 7 Yearly anticipated electricity generation for 3 different sized system in Tompkins County and the
percentage of electricity those systems would provide for the average household in the County
PV System Output
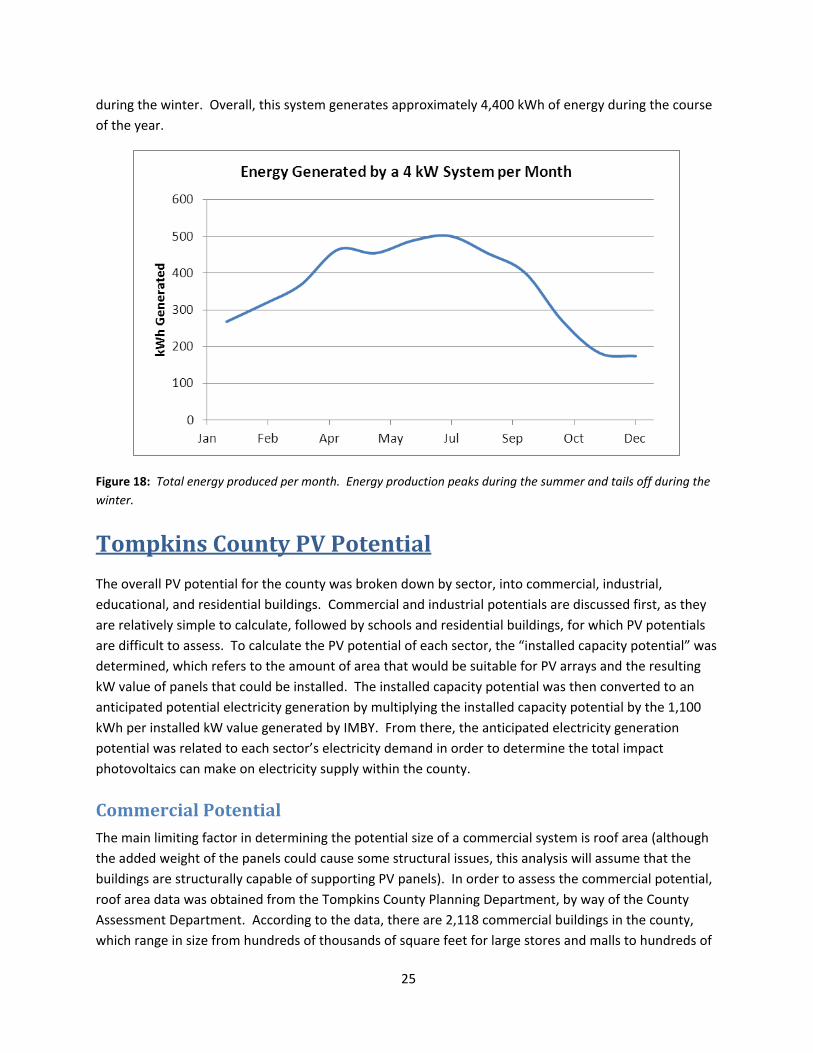
If the electricity output from the system were plotted over the course of a week it would look
something like Figure 17 This graph shows the hourly electricity production predicted by IMBY for a 4
kW system during a week in January and a week in July This graph shows the variability of generation
very well with the energy peaking during the day then returning to zero each night The January curve
shows how much more variable solar electricity will tend to be in the winter with cloudy days and not
much consistent sunshine The three days of July 24th-26th show what the energy profile would look like
during clear sunny days The other days however show how clouds and other weather patterns can
affect a PV system output
PV Generation Profile of a 4 kW System in Tompkins County
Po
we
r G
en
era
ted
(kW
)
35
3
25
2
15
1
05
0
January
July
Jan 14 Jan 15 Jan 16 Jan 17 Jan 18 Jan 19 Jan 20
Jul 23 Jul 24 Jul 25 Jul 26 Jul 27 Jul 28 Jul 29
Figure 17 Hourly electricity generation of a 4 kW system in Tompkins County during 1 week in July July 24th-26th
show the energy profile of nice sunny days while the other days show how variable the energy production can be
when clouds or other weather patterns affect the amount of sunlight hitting the array
The total amount of energy generated by this system during this particular time frame would be
represented by the ldquoarea under the curverdquo of the generation profile Since the area under the curve
during July is greater than in January it is easy to see that the system will generate more electricity in
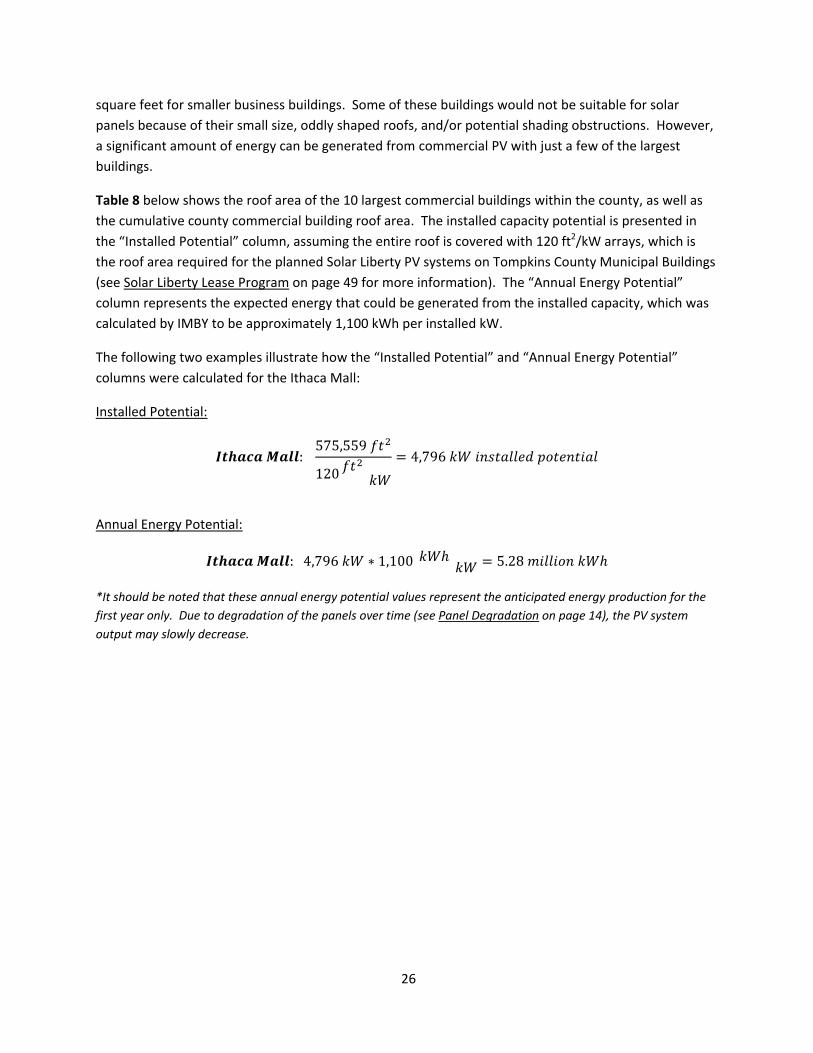
July For a monthly breakdown of the predicted amount of energy generated for a 4 kW system see
Figure 18 below As expected the energy produced peaks during the summer months and declines
24
during the winter Overall this system generates approximately 4400 kWh of energy during the course
of the year
Figure 18 Total energy produced per month Energy production peaks during the summer and tails off during the
winter
Tompkins County PV Potential
The overall PV potential for the county was broken down by sector into commercial industrial
educational and residential buildings Commercial and industrial potentials are discussed first as they
are relatively simple to calculate followed by schools and residential buildings for which PV potentials
are difficult to assess To calculate the PV potential of each sector the ldquoinstalled capacity potentialrdquo was
determined which refers to the amount of area that would be suitable for PV arrays and the resulting
kW value of panels that could be installed The installed capacity potential was then converted to an
anticipated potential electricity generation by multiplying the installed capacity potential by the 1100
kWh per installed kW value generated by IMBY From there the anticipated electricity generation
potential was related to each sectorrsquos electricity demand in order to determine the total impact
photovoltaics can make on electricity supply within the county
Commercial Potential
The main limiting factor in determining the potential size of a commercial system is roof area (although
the added weight of the panels could cause some structural issues this analysis will assume that the
buildings are structurally capable of supporting PV panels) In order to assess the commercial potential
roof area data was obtained from the Tompkins County Planning Department by way of the County
Assessment Department According to the data there are 2118 commercial buildings in the county
which range in size from hundreds of thousands of square feet for large stores and malls to hundreds of
25
square feet for smaller business buildings Some of these buildings would not be suitable for solar
panels because of their small size oddly shaped roofs andor potential shading obstructions However
a significant amount of energy can be generated from commercial PV with just a few of the largest
buildings
Table 8 below shows the roof area of the 10 largest commercial buildings within the county as well as
the cumulative county commercial building roof area The installed capacity potential is presented in
the ldquoInstalled Potentialrdquo column assuming the entire roof is covered with 120 ft2kW arrays which is
the roof area required for the planned Solar Liberty PV systems on Tompkins County Municipal Buildings
(see Solar Liberty Lease Program on page 49 for more information) The ldquonnual Energy Potentialrdquo
column represents the expected energy that could be generated from the installed capacity which was
calculated by IMBY to be approximately 1100 kWh per installed kW
The following two examples illustrate how the ldquoInstalled Potentialrdquo and ldquonnual Energy Potentialrdquo
columns were calculated for the Ithaca Mall
Installed Potential
Annual Energy Potential
It should be noted that these annual energy potential values represent the anticipated energy production for the
first year only Due to degradation of the panels over time (see Panel Degradation on page 14) the PV system
output may slowly decrease
26
Building Area (ft2) Installed Potential
(kW)
Annual Energy Potential
(million kWh)
1 Ithaca Mall 575559 4796 528
2 Cayuga Mall 211315 1761 194
3 Home Depot 198220 1652 182
4 Lowes 188861 1574 173
5 Triphammer Mall 173081 1442 159
6 Walmart 156883 1307 144
7 Tops Plaza 124966 1041 115
8 Wegmans 122195 1018 112
9 East Hill Plaza 117451 979 108
10 Big K-Mart 112934 941 104
Total (Top-10) 1981463 16512 182
Total (Entire County) 10273216 85610 942
Percent of 200 Commercial El8 ectricity Demand 27 Table 8 Footprint of the 10 largest commercial buildings in the County and the PV generation potential based on
120 ft2 per kW installed and 1100 kWh of electricity per kW installed ldquoPercent of 2008 Sector Electricity Demandrdquo
represents the Entire County Annual Energy Potential as a share of electricity demand in the commercialschools
sector An asterisk indicates that the building is currently vacant
It is unlikely that every square inch of a buildingrsquos roof can be covered with solar panels as obstructions
such as AC units and other rooftop devices will limit the available roof surface area In addition roofs
need to provide adequate space for maintenance staff so they can maintain the panels andor other
components of the building However the assumption that the roof is completely covered should
provide a reasonable estimate within an order of magnitude of the installed capacity potential of these
buildings Appendix C provides satellite images of the 10 largest commercial buildings in the county
Fortunately most of the buildings have flat relatively unobstructed roofs which would be ideal for solar
PV systems
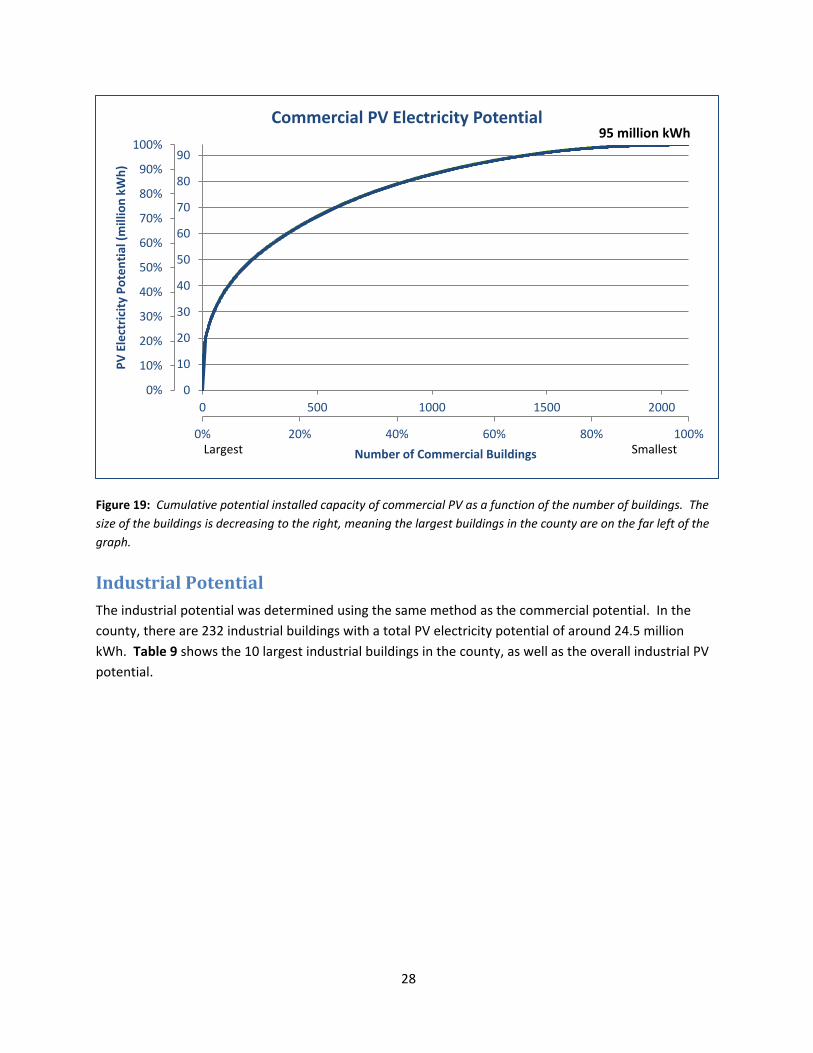
To illustrate the potential of the largest commercial buildings within the county Figure 19 shows the
cumulative PV electricity potential for all 2118 commercial buildings in the county The size of the
buildings is decreasing to the right meaning the largest buildings in the county are at the leftmost
portion of the chart The top 10 largest buildings in the county have the ability to cover nearly 20 of
the electricity potential at 182 million kWh The chart also shows that half of the commercial electricity
potential for the county (473 million kWh) can be provided with less than 10 of the buildings (180
buildings) Finally the largest 50 of buildings in the county represent roughly 87 of the potential
installed capacity (825 million kWh)
According to the Tompkins County Community Greenhouse Gas Emissions Report 1998-2008 total
electricity demand in the commercialschools sector in 2008 was 348 million kWh If the full potential of
commercial buildings were to be reached the buildings could produce around 27 of the sectorrsquos
electricity with photovoltaics
27
P
V E
lect
rici
ty P
ote
nti
al (
mill
ion
kW
h)
Commercial PV Electricity Potential 95 million kWh
100 90
90 80
80 70
70 60
60 50
50 4040
3030
2020
10 10
0 0
0 500 1000 1500 2000
0 20 40 60 80 100 Largest Smallest Number of Commercial Buildings
Figure 19 Cumulative potential installed capacity of commercial PV as a function of the number of buildings The
size of the buildings is decreasing to the right meaning the largest buildings in the county are on the far left of the
graph
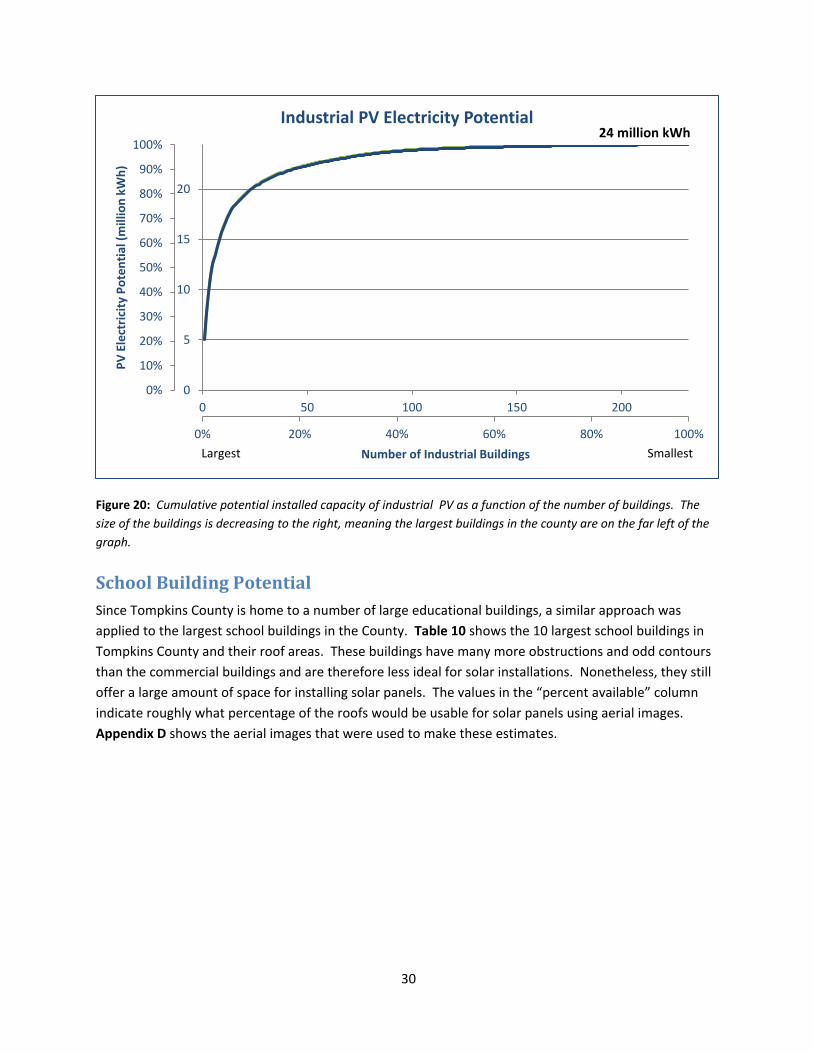
Industrial Potential
The industrial potential was determined using the same method as the commercial potential In the
county there are 232 industrial buildings with a total PV electricity potential of around 245 million
kWh Table 9 shows the 10 largest industrial buildings in the county as well as the overall industrial PV
potential
28
Building Area (ft2) Installed
Potential (kW)
Annual Energy Potential
(million kWh)
1 Borg Warner 552395 4603 528
2 Morse ChainEmerson Power Transmission Site 278409 2320 194
3 Borg Warner 227005 1892 182
4 Vanguard Printing 176082 1467 173
5 South Hill Business Campus 136574 1138 159
6 Morse ChainEmerson Power Transmission Site 106979 891 144
7 Cargill De-Icing Technology 87079 726 115
8 TransAct Technologies 75239 627 112
9 Therm Incorporated 73091 609 108
10 Cargill De-Icing Technology 63659 530 104
Total (Top-10) 1776511 14804 163
Total (Entire County) 2671386 22262 245
Percent of 2008 Industrial Electricity Demand 17 Table 9 Footprint of the 10 largest industrial buildings in the County and the PV generation potential based on 120
ft2 per kW installed and 1100 kWh of electricity per kW installed ldquoPercent of 2008 Sector Electricity Demandrdquo
represents the Entire County Annual Energy Potential as a share of electricity demand in the industrial sector An
asterisk indicates that the building is currently vacant
Similar to the commercial potential the majority of the industrial PV potential can be met with just the
largest buildings Figure 20 shows the cumulative PV electricity potential of all 232 industrial buildings
in the county Once again the size of the buildings is decreasing to the right meaning the largest
buildings in the county are at the very left of the chart The top 10 buildings in the county account for
roughly 67 of the potential PV energy or 163 million kWh The chart also shows that half of the
installed capacity potential for the county (121 million kWh) can be reached with only the 5 largest
buildings Furthermore the largest 50 of buildings in the county represent roughly essentially all of
the potential installed capacity
According to the Tompkins County Community Greenhouse Gas Emissions Report 1998-2008 total
electricity demand in the industrial sector in 2008 was 138 million kWh If the full potential of industrial
buildings were to be reached they could produce around 17 of their own electricity with
photovoltaics
29
P
V E
lect
rici
ty P
ote
nti
al (
mill
ion
kW
h)
Industrial PV Electricity Potential 24 million kWh
100
90
2080
70
1560
50
40 10
30
20 5
10
0 0
0 50 100 150 200
0 20 40 60 80 100
Largest Number of Industrial Buildings Smallest
Figure 20 Cumulative potential installed capacity of industrial PV as a function of the number of buildings The
size of the buildings is decreasing to the right meaning the largest buildings in the county are on the far left of the
graph
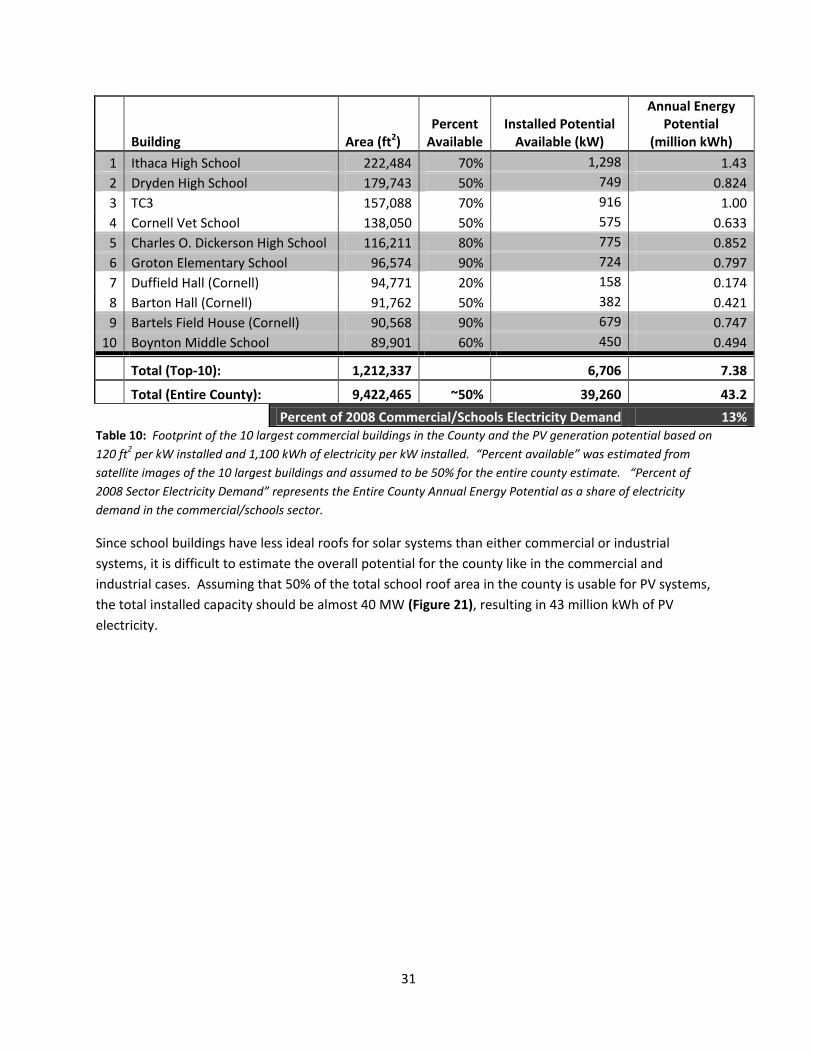
School Building Potential
Since Tompkins County is home to a number of large educational buildings a similar approach was
applied to the largest school buildings in the County Table 10 shows the 10 largest school buildings in
Tompkins County and their roof areas These buildings have many more obstructions and odd contours
than the commercial buildings and are therefore less ideal for solar installations Nonetheless they still
offer a large amount of space for installing solar panels The values in the ldquopercent availablerdquo column
indicate roughly what percentage of the roofs would be usable for solar panels using aerial images
Appendix D shows the aerial images that were used to make these estimates
30
Building Area (ft2) Percent
Available Installed Potential
Available (kW)
Annual Energy Potential
(million kWh)
Ithaca High School 1 222484 70 1298 143
Dryden High School 2 179743 50 749 0824
TC3
Cornell Vet School
3
4
157088
138050
70
50
916
575
100
0633
Charles O Dickerson High School 5 116211 80 775 0852
Groton Elementary School 6 96574 90 724 0797
Duffield Hall (Cornell)
Barton Hall (Cornell)
7
8
94771
91762
20
50
158
382
0174
0421
Bartels Field House (Cornell) 9 90568 90 679 0747
Boynton Middle School 10 89901 60 450 0494
Total (Top-10) 1212337 6706 738
Total (Entire County) 9422465 ~50 39260 432
Percent of 2008 CommercialSchools Electricity Demand 13 Table 10 Footprint of the 10 largest commercial buildings in the County and the PV generation potential based on
120 ft2 per kW installed and 1100 kWh of electricity per kW installed ldquoPercent availablerdquo was estimated from
satellite images of the 10 largest buildings and assumed to be 50 for the entire county estimate ldquoPercent of
2008 Sector Electricity Demandrdquo represents the Entire County Annual Energy Potential as a share of electricity
demand in the commercialschools sector
Since school buildings have less ideal roofs for solar systems than either commercial or industrial
systems it is difficult to estimate the overall potential for the county like in the commercial and
industrial cases Assuming that 50 of the total school roof area in the county is usable for PV systems
the total installed capacity should be almost 40 MW (Figure 21) resulting in 43 million kWh of PV
electricity
31
P
V E
lect
rici
ty P
ote
nti
al (
mill
ion
kW
h)
School Building PV Electricity Potential 43 million kWh
100
4090
3580
70 30
60 25
50 20
40 15
30 10
20
510
0 0
0 200 400 600 800
0 20 40 60 80 100
Largest Number of School Buildings Smallest
Figure 21 Cumulative potential installed capacity of school building PV as a function of the number of buildings
The size of the buildings is decreasing to the right meaning the largest buildings in the county are on the far left of
the graph
Residential Potential
Since there are so many variables involved with installing solar energy systems on homes it is difficult to
estimate the overall residential potential for the county Not every house has an ideal roof for solar
panels due to a wide range of factors including limited roof area roof obstructions or shading issues
Nevertheless it is possible to estimate the energy potential of residential PV systems within the county
when operating under a few calculated assumptions
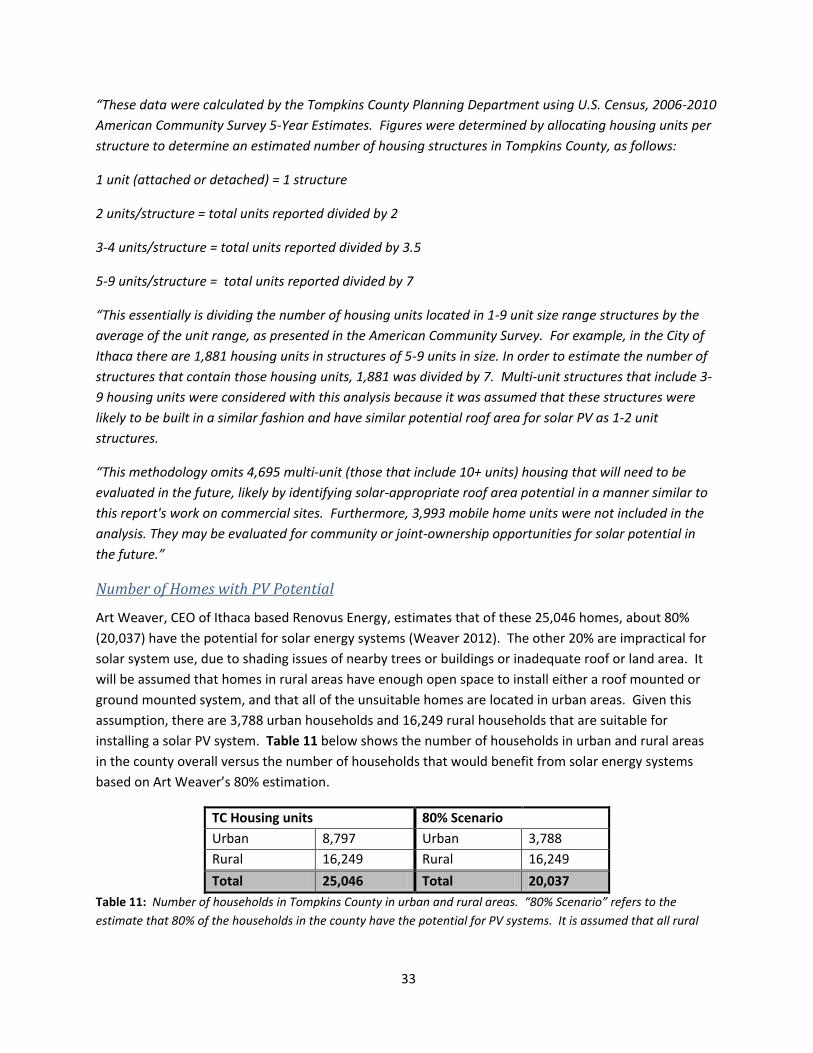
Number of Homes
Tompkins County Housing Units in Structures of 1-9 Units in Size
Urban 8797 housing units
Rural 16249 housing units
Total 25046 housing units
Katherine Borgella Principal Planner with the Tompkins County Planning Department issued the
following statement regarding the number of homes in the county
32
ldquoThese data were calculated by the Tompkins County Planning Department using US Census 2006-2010
American Community Survey 5-Year Estimates Figures were determined by allocating housing units per
structure to determine an estimated number of housing structures in Tompkins County as follows
1 unit (attached or detached) = 1 structure
2 unitsstructure = total units reported divided by 2
3-4 unitsstructure = total units reported divided by 35
5-9 unitsstructure = total units reported divided by 7
ldquoThis essentially is dividing the number of housing units located in 1-9 unit size range structures by the
average of the unit range as presented in the American Community Survey For example in the City of
Ithaca there are 1881 housing units in structures of 5-9 units in size In order to estimate the number of
structures that contain those housing units 1881 was divided by 7 Multi-unit structures that include 3-
9 housing units were considered with this analysis because it was assumed that these structures were
likely to be built in a similar fashion and have similar potential roof area for solar PV as 1-2 unit
structures
ldquoThis methodology omits 4695 multi-unit (those that include 10+ units) housing that will need to be
evaluated in the future likely by identifying solar-appropriate roof area potential in a manner similar to
this reports work on commercial sites Furthermore 3993 mobile home units were not included in the
analysis They may be evaluated for community or joint-ownership opportunities for solar potential in
the futurerdquo
Number of Homes with PV Potential
Art Weaver CEO of Ithaca based Renovus Energy estimates that of these 25046 homes about 80
(20037) have the potential for solar energy systems (Weaver 2012) The other 20 are impractical for
solar system use due to shading issues of nearby trees or buildings or inadequate roof or land area It
will be assumed that homes in rural areas have enough open space to install either a roof mounted or
ground mounted system and that all of the unsuitable homes are located in urban areas Given this
assumption there are 3788 urban households and 16249 rural households that are suitable for
installing a solar PV system Table 11 below shows the number of households in urban and rural areas
in the county overall versus the number of households that would benefit from solar energy systems
based on rt Weaverrsquos 80 estimation
TC Housing units 80 Scenario
Urban 8797 Urban 3788
Rural 16249 Rural 16249
Total 25046 Total 20037
Table 11 Number of households in Tompkins ounty in urban and rural areas ldquo80 Scenariordquo refers to the
estimate that 80 of the households in the county have the potential for PV systems It is assumed that all rural
33
households have enough area to install PV systems so the only homes in the county that are excluded are in urban
areas due to closely spaced houses limited roof area and numerous trees that could cause shading
PV Potential Calculations
As previously mentioned the county used 293 million kWh of electricity for residential purposes in 2008
(TCPD) Since IMBY calculated around 1100 kWh of electricity should be produced for every kW of
installed capacity the hypothetical installation capacity required to meet this entire demand would be
Since this value of 266000 kW (266 MW) is such a large number the county should make a point to
encourage energy efficiency in conjunction with renewable energy investment in order to lessen the
overall energy burden of the county Because energy efficiency is outside the scope of this report the
current energy usage patterns will be analyzed which could hopefully improve in the future with more
energy efficient buildings and appliances
To hypothetically meet the entire residential electricity demand from 2008 with photovoltaics every
house in the county would need to install a 133 kW system
This is an extremely large system that would generate about twice as much electricity as the average
Tompkins County household would require Since it is unlikely that 100 of the countyrsquos residential
electricity demand will be met with photovoltaics a few more assumptions will be applied to the
analysis as described below
Urban Systems
The current average size of a PV system in the downtown Ithaca area with closely spaced houses and
numerous trees is 3 kW (PowerClerk) Using the previous assumption that there are 3788 urban
households with the potential for PV systems and the average 3 kW installed system for each home the
urban residential installed capacity would be around 11000 kW (11 MW)
Rural Systems
In contrast to urban households rural homes tend to have much more roof andor land area upon
which to install a PV system Rural areas are typically unencumbered by shading obstructions and
should have enough roof or land area to install a system large enough to meet the majority of their
electricity demands Given that a 7 kW system will provide nearly 100 of the average Tompkins
ounty householdrsquos electricity it will be assumed that every rural household in the county has the
potential to install a 7 kW system As such this would result in a rural installed capacity of 113000 kW
(113 MW) and a total residential capacity of 136000 kW (136 MW) as shown below in Table 12 This
34
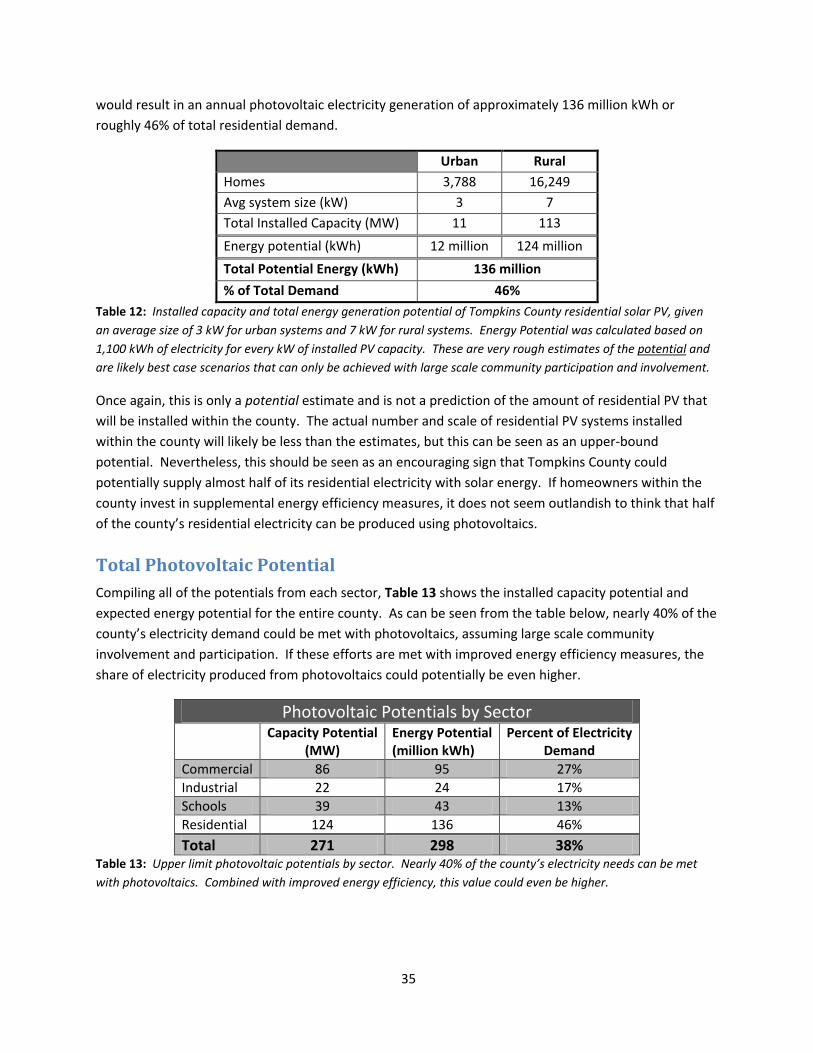
would result in an annual photovoltaic electricity generation of approximately 136 million kWh or
roughly 46 of total residential demand
Urban Rural
Homes 3788 16249
Avg system size (kW) 3 7
Total Installed Capacity (MW) 11 113
Energy potential (kWh) 12 million 124 million
Total Potential Energy (kWh) 136 million
of Total Demand 46
Table 12 Installed capacity and total energy generation potential of Tompkins County residential solar PV given
an average size of 3 kW for urban systems and 7 kW for rural systems Energy Potential was calculated based on
1100 kWh of electricity for every kW of installed PV capacity These are very rough estimates of the potential and
are likely best case scenarios that can only be achieved with large scale community participation and involvement
Once again this is only a potential estimate and is not a prediction of the amount of residential PV that
will be installed within the county The actual number and scale of residential PV systems installed
within the county will likely be less than the estimates but this can be seen as an upper-bound
potential Nevertheless this should be seen as an encouraging sign that Tompkins County could
potentially supply almost half of its residential electricity with solar energy If homeowners within the
county invest in supplemental energy efficiency measures it does not seem outlandish to think that half
of the countyrsquos residential electricity can be produced using photovoltaics
Total Photovoltaic Potential
Compiling all of the potentials from each sector Table 13 shows the installed capacity potential and
expected energy potential for the entire county As can be seen from the table below nearly 40 of the
countyrsquos electricity demand could be met with photovoltaics assuming large scale community
involvement and participation If these efforts are met with improved energy efficiency measures the
share of electricity produced from photovoltaics could potentially be even higher
Photovoltaic Potentials by Sector Capacity Potential
(MW) Energy Potential (million kWh)
Percent of Electricity Demand
Commercial 86 95 27
Industrial 22 24 17
Schools 39 43 13
Residential 124 136 46
Total 271 298 38 Table 13 Upper limit photovoltaic potentials by sector Nearly 40 of the countyrsquos electricity needs can be met
with photovoltaics Combined with improved energy efficiency this value could even be higher
35
Solar System Costs
Module Prices
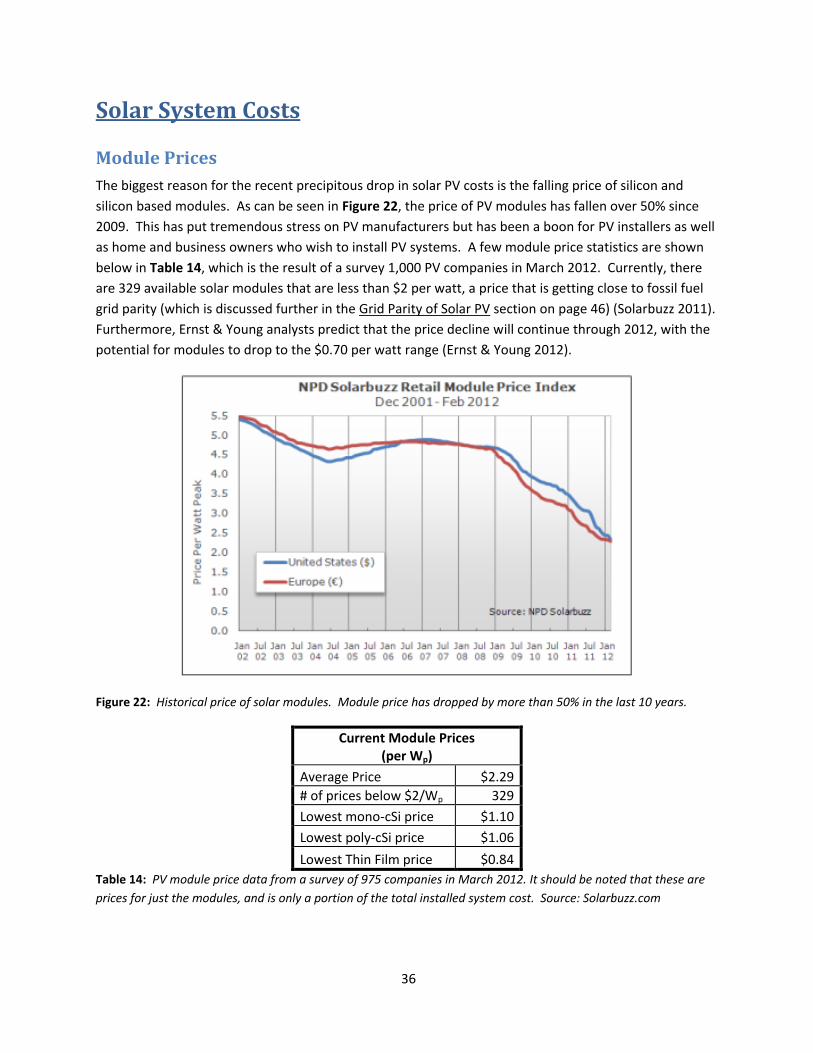
The biggest reason for the recent precipitous drop in solar PV costs is the falling price of silicon and
silicon based modules As can be seen in Figure 22 the price of PV modules has fallen over 50 since
2009 This has put tremendous stress on PV manufacturers but has been a boon for PV installers as well
as home and business owners who wish to install PV systems A few module price statistics are shown
below in Table 14 which is the result of a survey 1000 PV companies in March 2012 Currently there
are 329 available solar modules that are less than $2 per watt a price that is getting close to fossil fuel
grid parity (which is discussed further in the Grid Parity of Solar PV section on page 46) (Solarbuzz 2011)
Furthermore Ernst amp Young analysts predict that the price decline will continue through 2012 with the
potential for modules to drop to the $070 per watt range (Ernst amp Young 2012)
Figure 22 Historical price of solar modules Module price has dropped by more than 50 in the last 10 years
Current Module Prices (per Wp)
Average Price $229
of prices below $2Wp 329
Lowest mono-cSi price $110
Lowest poly-cSi price $106
Lowest Thin Film price $084
Table 14 PV module price data from a survey of 975 companies in March 2012 It should be noted that these are
prices for just the modules and is only a portion of the total installed system cost Source Solarbuzzcom
36
Installed System Prices
While the solar panels themselves actually turn the sunlight into electricity there are a number of other
costs that go into installing a photovoltaic system In addition to the cost of the modules are the cost of
the inverter balance of system (BOS) costs ie all of the mounting and other equipment that goes along
with installing the modules installation costs and ldquootherrdquo costs such as site evaluations tax or
regulatory work and any other expenses that go along with installing a PV system
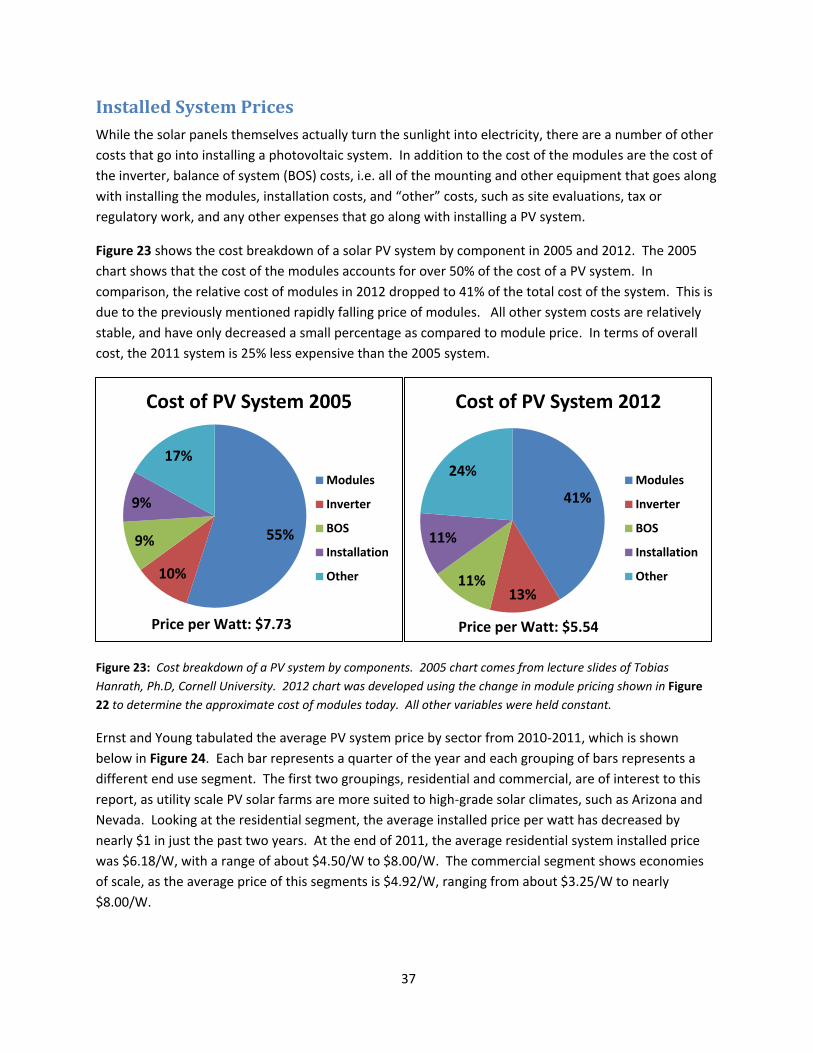
Figure 23 shows the cost breakdown of a solar PV system by component in 2005 and 2012 The 2005
chart shows that the cost of the modules accounts for over 50 of the cost of a PV system In
comparison the relative cost of modules in 2012 dropped to 41 of the total cost of the system This is
due to the previously mentioned rapidly falling price of modules All other system costs are relatively
stable and have only decreased a small percentage as compared to module price In terms of overall
cost the 2011 system is 25 less expensive than the 2005 system
55
10
9
9
17
Cost of PV System 2005
Modules
Inverter
BOS
Installation
Other
Price per Watt $773
41
13 11
11
24
Cost of PV System 2012
Modules
Inverter
BOS
Installation
Other
Price per Watt $554
Figure 23 Cost breakdown of a PV system by components 2005 chart comes from lecture slides of Tobias
Hanrath PhD Cornell University 2012 chart was developed using the change in module pricing shown in Figure
22 to determine the approximate cost of modules today All other variables were held constant
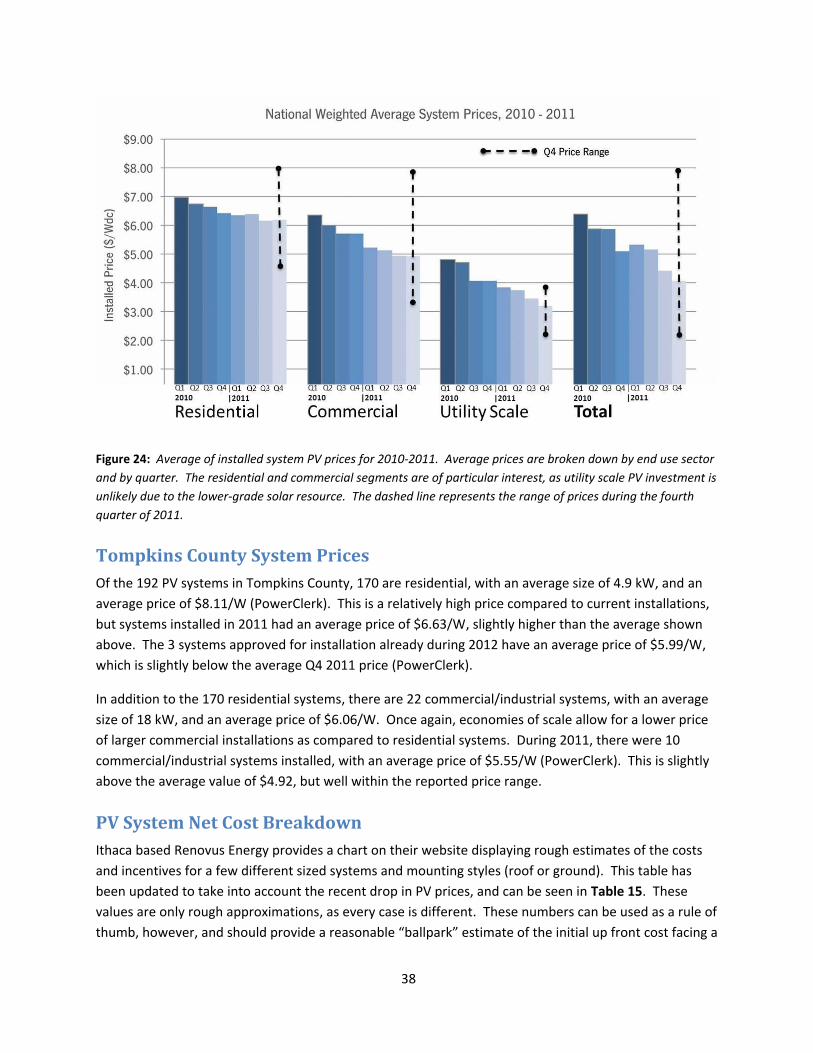
Ernst and Young tabulated the average PV system price by sector from 2010-2011 which is shown
below in Figure 24 Each bar represents a quarter of the year and each grouping of bars represents a
different end use segment The first two groupings residential and commercial are of interest to this
report as utility scale PV solar farms are more suited to high-grade solar climates such as Arizona and
Nevada Looking at the residential segment the average installed price per watt has decreased by
nearly $1 in just the past two years At the end of 2011 the average residential system installed price
was $618W with a range of about $450W to $800W The commercial segment shows economies
of scale as the average price of this segments is $492W ranging from about $325W to nearly
$800W
37
Figure 24 Average of installed system PV prices for 2010-2011 Average prices are broken down by end use sector
and by quarter The residential and commercial segments are of particular interest as utility scale PV investment is
unlikely due to the lower-grade solar resource The dashed line represents the range of prices during the fourth
quarter of 2011
Tompkins County System Prices
Of the 192 PV systems in Tompkins County 170 are residential with an average size of 49 kW and an
average price of $811W (PowerClerk) This is a relatively high price compared to current installations
but systems installed in 2011 had an average price of $663W slightly higher than the average shown
above The 3 systems approved for installation already during 2012 have an average price of $599W
which is slightly below the average Q4 2011 price (PowerClerk)
In addition to the 170 residential systems there are 22 commercialindustrial systems with an average
size of 18 kW and an average price of $606W Once again economies of scale allow for a lower price
of larger commercial installations as compared to residential systems During 2011 there were 10
commercialindustrial systems installed with an average price of $555W (PowerClerk) This is slightly
above the average value of $492 but well within the reported price range
PV System Net Cost Breakdown
Ithaca based Renovus Energy provides a chart on their website displaying rough estimates of the costs
and incentives for a few different sized systems and mounting styles (roof or ground) This table has
been updated to take into account the recent drop in PV prices and can be seen in Table 15 These
values are only rough approximations as every case is different These numbers can be used as a rule of
thumb however and should provide a reasonable ldquoballparkrdquo estimate of the initial up front cost facing a
38
homeowner wishing to install a PV system The estimated installed cost per watt of each size for a roof
mounted system is $7 $6 and $5 per watt for the 2 kW 4 kW and 6 kW systems respectively The
ground mounted systems are slightly higher at $750 $650 and $550 per watt Since PV systems are
not a ldquouniform commodityrdquo is difficult to determine with certainty an installed price per kW as
individual circumstances always have some sort of influence on the price (Vanek 2012)
System Size
Mount Style
Gross Cost
NYSERDA Incentive
NYS Tax Credit
Fed Tax Credit
Total Incentives
Net Cost
2 kW Roof $14000 -$3000 -$2750 -$3300 -$9050 $4950
Ground $15000 -$3000 -$3000 -$3600 -$9600 $5400
4 kW Roof $24000 -$6000 -$4500 -$5400 -$15900 $8100
Ground $26000 -$6000 -$5000 -$6000 -$17000 $9000
6 kW Roof $30000 -$9000 -$5000 -$6300 -$20300 $9700
Ground $33000 -$9000 -$5000 -$7200 -$21200 $11800
Table 15 Costs and incentives of various sized systems and mounting styles from the Renovus Energy website
updated for decreased cost of photovoltaics These numbers are only rough estimates and should only be used as a
rule of thumb as every situation will be different Detailed descriptions of the incentives are given in the PV
Financial Programs and Incentives section
As can be seen from the above table there are a number of financial incentives that can alleviate the
cost burden to homeowners who wish to install PV systems The details of the incentives are discussed
in depth below in the PV Financial Programs and Incentives on page 40
Table 16 below shows the expected energy savings of each system given a PV electricity production of
1100 kWh per installed kW and a residential electricity price of 14₵kWh ldquoSimple Payback Timerdquo refers
to how long it will take for the energy savings to pay for the system at which point the system will
actually begin making money for a homeowner This calculation uses the costs for roof mounted
systems in Table 15 and no interest rate An example calculation of a 2 kW system is shown below
System Size
of Average Household Electricity Demand
Annual Electricity Savings
Simple Payback Time (years)
2 kW 28 $308 16
4 kW 55 $616 13
6 kW 83 $924 11
Table 16 Annual energy savings for each system size based on an average of 1100 kWh per installed kW of
capacity and an electricity rate of 14₵kWh Simple payback time is an approximation of the time for the electricity
savings to pay for the system assuming roof mounted systems from Table 15 and no interest rate
Net Metering
Since 1997 New York State has offered net metering for residential photovoltaic systems (DSIRE New
York ndash Net Metering) This means that homeowners will only be charged for the net amount of
electricity consumed ie total electricity consumed minus solar electricity produced In the above
39
example for a 4 kW system the net amount of energy that the homeowner pays for during the year
would be 3496 kWh (7837 kWh consumed ndash 4341 kWh solar electricity produced) Any situation
where PV electricity exceeds demand will be carried over month to month
If there is still excess at the end of the year however the excess will be bought back at the wholesale
rate which is typically much lower than the retail rate that the customer pays As such it makes the
most economic sense to have a system that provides less electricity than the home or business uses
over the course of a year as any excess will be sold back at a much lower price
PV Financial Programs and Incentives
Traditional Financing Arrangements
Historically homeowners who wished to install PV systems on new homes have used home equity loans
mortgage loans or cash to pay for the leftover sum after federal state and utility incentives were
applied One benefit of using a home equity loan or a refinanced mortgage loan is that interest paid on
these loans may be tax deductible Much like other home improvements home owners can draw on
standard home equity lines of credit take out a home equity loan or take cash out of a home mortgage
refinance to help pay for the cost of their PV system The primary determinants of the amount of
money that can be borrowed are the equity value of the home combined with the credit score of the
homeowner (Coughlin and Cory 2009)
Alternative Financing Arrangements
In addition to the traditional financing arrangements mentioned there exist a few newer financial
models that can help lower the financial burden of a residential PV system Not all of these options are
available in New York State (I donrsquot think I will inquire with the contact I made at NYSERD) but they
are options that the state and county could look into in the future
Third Party Ownership Models
These are financing arrangements such as solar leases and residential power purchase agreements (PPA)
can take advantage of commercial tax benefits and reduce the up-front costs to the homeowner while
also relieving the homeowner of maintenance responsibilities In a solar lease program the homeowner
does not purchase the system instead they enter into a contract with the PV installer to make monthly
lease payments over a specified period of time At the end of the lease there may be a purchase
option whereby the homeowner can purchase the system Alternatively the homeowner may be able
to extend the lease or have the system removed at the end of the lease Leases may involve the PV
installer guaranteeing maintenance over the course of the lease relieving the homeowner of any
maintenance responsibilities (Coughlin and Cory 2009) This model could help homeowners who desire
a PV system but are intimidated by the large up-front costs
A PPA is an attractive model for large PV systems in the commercial and public sector and has begun to
work its way to residential customers as well Similar to a solar lease program a PPA takes advantage of
40
the federal PV tax incentives available to non-residential owners since the PV installer will own the
system The PV installer agrees to purchase install own operate and maintain the PV system while
the homeowner simply agrees to host the system The homeowner and PV installer will then agree on a
price the homeowner will pay the installer for the electricity that is produced from the system Once
again this relieves the homeowner of the large up-front cost of a PV system as well as the operation and
maintenance responsibilities At the end of the PPA the homeowner may elect to renew the contract
purchase the system or have the system removed As the PPA model is new however there may be
other end-of-term options that develop moving forward as the market matures (Coughlin and Cory
2009)
Property Tax Assessment Model
This model is being piloted in Berkeley California Palm Desert California and Boulder Colorado and
addresses two of the major barriers associated with residential PV systems high up-front cost and the
difficulty of recouping a 20-year investment when the homeowner may have moved in that time frame
The model involves loans made by a city to homeowners to purchase and install PV systems
The city raises the money for the program by issuing long-term bonds (Berkeley and Boulder) or tapping
into the cityrsquos general fund (Palm Desert) The city then makes loans to homeowners to finance the
installation of PV systems which are paid back over a long period of time (20 years in the case of
Berkeley) via a special property tax assessment that is collected annually or semi-annually The only upshy
front cost is a small administrative cost of entering into the agreement In addition if the homeowner
decides to sell the home before the term of the agreement is up the PV system and associated special
property tax remains with the house In this instance the homeowner only pays the associated tax
while living in the house and when the home is sold the new homeowner assumes the cost of the
system until the tax assessment is paid off or they move (Coughlin and Cory 2009)
Solar Renewable Energy Certificates
Solar Renewable Energy Certificates (SRECs) represent the environmental benefits of electricity being
produced from a PV system New Jersey is one state that has been utilizing this model through its
Renewable Portfolio Standard (RPS) One of its utilities PSEampG has declared that it will comply with the
statersquos RPS through obtaining SRECs through a new solar loan program The loan size for a PV system is
based on the expected total generation of SREs over the course of the systemrsquos life so that the revenue
from SREC sales closely matches the loan payments The homeowner agrees to sell all SRECs generated
by their system which would be supplemented by cash payments if the PV system does not generate
the expected SRECs
NYSERDA Renewable Portfolio Standard
In 2004 the New York State Public Service Commission issued an order adopting a Renewable Portfolio
Standard (RPS) with the goal of increasing the percentage of renewable energy used in the state to 25
by 2013 As part of the plan the Commission appointed NYSERDA the administrator for the RPS
41
program In 2009 the Commission undertook mid-course review of the RPS program and expanded the
RPS goal to 30 renewables by 2015 (NYSERDA)
The RPS energy targets fall into three different groups Main Tier Generators large scale generators
that sell power to the wholesale grid Customer Sited Tier small scale distributed generators and Other
Market Activites individuals and businesses that choose to pay a premium on their electricity bills to
support renewable energy development This report will focus on the Customer Sited Tier (CST) which
was updated in April 2010 to include more ambitious goals for energy generation The CST portion of
the RPS actively supports enrollment in programs for photovoltaic systems supported by the NYSERDA
Solar PV Incentive Program (NYSERDA)
NYSERDA Incentive
The main incentive Program Opportunity Notice 2112 (PON 2112) provides cash incentives of $150 per
watt to help reduce the costs of installation of grid-connected PV systems 7 kW and smaller As a
reference NYSERDA determined that a 2 kW system provides about 20-30 of an average homersquos
energy needs which is consistent with previously calculated average Tompkins County household
percentage of 28 As of April 2012 PON 2112 has $132 million available and will be accepting
applications on a first-come first-served basis until December 31 2015 or until the funds are fully
committed whichever comes sooner ustomers must purchase their PV systems from an ldquoEligible
Installerrdquo that has demonstrated technical competence in the field of photovoltaic systems Incentives
are paid directly to the Eligible Installer but must be passed on to the consumer Incentives are capped
based on a PV system size that does not exceed 110 of the previous 12 monthrsquos energy usage In
general incentives cover 25-35 of the overall costs of installation but not more than 40 after all tax
credits are applied (NYSERDA)
The full description of the program can be found here httpwwwnyserdanygovFundingshy
OpportunitiesCurrent-Funding-OpportunitiesPON-2112-Solar-PV-Program-Financialshy
Incentivesaspxsc_database=web
New York State Tax Credits
In addition to direct incentives there are also tax credits and incentives that can be applied to
residential solar systems Since tax issues can become very complicated only a basic overview of the tax
opportunities available will be presented New York State offers a tax credit of 25 of the system
expenditures (after incentives have been applied) capped at $5000 The system must be grid-tied and
net metered and any excess credits can be carried forward five years (DSIRE Residental Solar Tax
Credit)
The full statute can be found here httpwwwdsireusaorgdocumentsIncentivesNY03Fhtm
New York State also recognizes that a PV system may increase the value of a property If the municipal
assessorrsquos office determines that it does this would increase the homeownerrsquos property tax burden As
such the state provides 15 year property tax exemptions for systems purchased and installed before
42
January 1 2015 The total amount of the exemption is equal to the increase in assessed value
attributable to the solar system (DSIRE Local Option)
The full statute can be found here httpwwwdsireusaorgdocumentsIncentivesNY07Fhtm
A property tax exemption handbook can be found here
httpwwwdsireusaorgdocumentsIncentivesNY07Fbpdf
Federal Tax Credits
Finally the federal government also offers a tax credit of 30 for residential PV systems Due to
recently passed legislation there is now no cap on the amount that may be claimed The tax credit is
calculated from the net cost of the system after any direct incentives such as the NYSERDA incentive
which are not federally taxable (Boler 2012)
The full statute can be found here httpwwwdsireusaorgdocumentsIncentivesUS37F1pdf
The application for the tax credit (Federal tax form 5695) can be found here httpwwwirsgovpubirsshy
pdff5695pdf
There is a degree to subtlety to the federal tax credit though because it is only a credit against federal
taxes owed It is not a line item deduction to lower a homeownerrsquos tax liability nor an automatic refund
from the government The homeowner must owe federal taxes and the tax credit is simply carved out
of that If the tax credit is larger than the homeownerrsquos federal tax burden for the year the remaining
balance may be rolled over one more year but no more (Gordon 2010) So if for example a
homeowner owes $5000 in federal taxes in the two years following the installation of a PV system and
the federal tax credit comes to $6000 then the homeowner will have lost that extra $1000 credit This
is why it is imperative for homeowners to speak with tax professionals before committing to a PV
system to ensure they are receiving the full benefit
As mentioned before there is also a ldquoFederal Tax Increaserdquo that goes along with installing a PV system
This essentially negates part of the state tax credit because the state credit will likely increase the
homeownerrsquos federal tax liability due to a higher reported income This could cause the homeowner to
fall into a different tax bracket and pay more because of it (Boler 2012) Since this is such a complicated
issue and unique to each individual it is omitted from the previous calculations of net cost in Table 15
Furthermore every home or business owner should talk to his or her accountant before installing a
photovoltaic system to ensure the incentives are calculated properly
NYSERDA Clean Power Estimator
Since every situation is different and there are an endless amount of different variables that can
influence the cost performance and selection of a PV system NYSERDA has developed an online
calculator called the Clean Power Estimator to help home and business owners decide if a PV system is
right for them
43
The estimator can be found here httpnyserdacleanpowerestimatorcomnyserdahtm
With the Clean Power Estimator a home or business owner can input a variety of different variables
ranging from PV system specs to financial assumptions and tax considerations Figure 25 shows the
calculator with the default inputs for Ithaca and a system summary It shows a 4 kW system with an
overall cost before incentives of $24000 which is the same as a roof mounted system in the above
table Also the calculated annual electricity generation of 4304 kWh is close to the average estimate
used in this report of 4400 kWh The net cost is slightly different because of the ldquoTotal Federal Tax
Increaserdquo portion in the bottom right This is discussed above in the Federal Tax Credits section but
essentially this is dependent on the individual homeownerrsquos tax liability which will be different for each
situation
The Estimator allows individuals to tailor the PV system to their needs based on each home or
businessrsquos electricity usage and desired energy savings The tool allows for the adjustment of system
size tilt angle cost per watt and operation and maintenance costs among other things It also allows
the user to input a number of financial assumptions including the price of a typical electric bill how
much the user anticipates this price to increase and seven different methods of payment These
methods are pay cash new home loan refinance tax-deductible loan non-tax deductible loan lease
and power purchase agreement Each method has further settings that can be adjusted to better suit
each individual system
Once the Estimator has the required inputs it will calculate a system summary which includes a net cost
after benefits PV electricity production percentage of household electricity supplied by the PV system
and CO2 emission reduction In addition it shows internal rate of return net present value and years to
payback estimates This is a quick snapshot of the benefits of the system and can provide a quick
glimpse of what kind of investment a PV system would be given the selected parameters
The Estimator also includes more in depth tables in graphs which the user can click on and view It
allows users to see net cost for year 1 a monthly breakdown of the userrsquos electric bill and PV
generation a daily breakdown by month of both PV electricity production and net electricity usage four
different in-depth cash flow charts and a description of the PV systemrsquos environmental benefits and
pollution prevention Overall the Clean Power Estimator is a thorough easy to use tool that can offer a
great deal of insight to any home or business owner who is thinking about installing a PV system This
tool could be used as an educational instrument to show individuals the benefits of a PV system
installed at their home or place of business
44
Figure 25 NYSERDrsquos lean Power Estimator with default inputs for Ithaca and system summary
45
Grid Parity of Solar PV
Grid parity is a commonly used term within renewable energy circles and it refers to the time when the
lifetime cost of generating PV electricity is comparable to the cost of electricity from conventional
sources on the grid term called ldquolevelized cost of electricityrdquo (LOE) is used to relate costs on an
apples-to-apples basis between different energy sources The lower the LCOE the better so a main goal
of the solar industry is to lower the LCOE of solar energy equal to or below the LCOE of generating
electricity for the grid
If the total lifetime cost of generating electricity from a PV system is equal to the cost of receiving that
energy from the grid the system is said to have reached grid parity Solar systems in states with high
residential electricity prices (Hawaii 3621 ₵kWh Connecticut 1817 ₵kWh Alaska 1776 ₵kWh) will
reach grid parity much sooner than in states with low residential electricity prices (Idaho 745 ₵kWh
Louisiana 830 ₵kWh North Dakota ₵kWh) (EIA Electric Power Monthly) In this case the
homeowner is not only decreasing his or her carbon footprint but also saving money at the same time
It is easy to see why reaching grid parity has become a focus of many firms in the solar industry
A recent study has reviewed the LCOE of solar photovoltaics and has found that many of the
assumptions in previous LCOE calculations are outdated or incorrect They have found that PV has
reached a ldquotipping pointrdquo and that solar has gone past grid parity in some cases The study reviewed
over 40 PV LCOE calculations that have been done and analyzed the assumptions that were made as
well as their validity The LOE estimates ranged from a low of 62 ₵kWh to a high of 86 ₵kWh which
shows the large impact that different assumptions can have on these estimates (Branker Pathak and
Pearce 2011) The researchers were able to identify a few key parameters that affected every study
most notable being financing options module performance and module lifetime (Trabish 2011)
The study found that the largest and most important costs facing a homeowner are the upfront costs
and costs of financing They argue that policy and initiatives must be focused on these two areas in
order to make residential PV installations more affordable (Branker Pathak and Pearce 2011) Because
they found financing so crucial they posited that zero interest financing could be a more effective
incentive than a feed in tariff or tax credit Furthermore previous LCOE calculations are irrelevant to
todayrsquos systems because of the precipitous drop in module prices as well as decreasing BOS costs and
improvements along the supply chain and installation practices (Trabish 2011)
One widely held assumption about PV systems is related to the panelrsquos degradation over time It is
commonly assumed that a panel will lose about 1 of its efficiency per year (Note this does not mean
that a panel with 15 efficiency will be 0 efficient in 15 years It means that it will produce 85 of the
energy in year 15 as compared to year 1 ie reducing its overall efficiency to 1275) Branker Pathak
and Pearce found this assumption to be unreasonably conservative and suggested a degradation rate of
02 to 05 per year Even older panels produced in the 1980s have been shown to degrade slower
than the customary 1 mark and as technologies advance this rate should only decrease (Trabish
2011)
46
Finally the authors found that the common assumption of a 20 year panel lifetime was also too
conservative They assert that at least a 30 year lifetime should be used in predicting the economic
performance of a system If lending institutions correcting the aforementioned misguided assumptions
in PV financing arrangements they should be more willing to finance PV systems at more beneficial
terms (Trabish 2011)
County Municipal Solar Installations
Tompkins County Public Library
In January 2002 the Tompkins County Public Library (TCPL) began receiving electricity from a 147 kW
photovoltaic system on the roof of the library The system consists of 1430 modules and covers a
surface area of 17222 ft2 The system provides roughly 13 of the overall energy use of the library and
to date has produced 989000 kWh of energy enough to power 83 homes for a year (Sunpower) In
addition the system has reduced carbon dioxide emissions by 750 tons which is roughly equivalent to
driving 15 million miles in an average car (Sunpower)
The system was a result of a request by Tompkins County Legislator Dooley Kiefer who approached the
Tompkins County Engineering Division (which has now been incorporated into the Facilities Division) to
explore the possibilities of installing a PV system on the roof of library during renovation The
Engineering Division went out in search of firms to install a PV system who then selected a proposal
from Powerlight (now Sunpower) out of California to install the system The county wanted to maximize
the amount of energy available on top of the roof and Powerlight did all of the design and installation
(LeMaro 2012)
One of the challenges in designing the system was the structural limitations of the roof which couldnrsquot
support the added weight a tilted panel system Structural reinforcement would be needed to
accommodate a tilted array system but the PV design was performed late in the process of renovating
the library so reinforcing the libraryrsquos structure would have been time consuming and costly (LeMaro)
As such the panels lay flat on top of the roof which results in an overall reduction in output when
compared to a tilted system
A concern with the design of the system is the presence of the Holiday Inn hotel across the street
Figure 26 shows a picture taken from the roof of the hotel with the hotel shading a large portion of the
PV array Arel LeMaro the Tompkins County Facilities Director emphasized that the hotel has little to
no effect on the overall energy generation of the system A cursory analysis of the hourly electricity
generation data throughout the course of a year reveals that there is no significant drop in electricity
production in the afternoon when the system would be shaded by the hotel Although a rigorous
statistical analysis would be necessary to completely support this argument this brief analysis seems to
reinforce Mr LeMarorsquos claim that the hotel does not significantly harm the PV systemrsquos energy
generation
47
Figure 26 Photo of the Tompkins County Public Library taken from the roof of the Holiday Inn across the street
Notice the shadow of the hotel blocking a significant portion of the solar panels from sunlight This is a problem
that should have been foreseen and avoided
Another concern regarding the PV array was the construction of the Cayuga Street Parking Structure
Figure 27 shows an aerial view of the location of the PV array the Holiday Inn and the parking structure
When the PV system was installed the lot where the parking structure stands was only used as surface
parking A few years after the panels had been installed the city decided to turn the surface parking
into a garage There was concern that the parking facility would shade the panels but it has since been
determined that the structure had minimal impact on the amount of energy generated by the PV array
For the small impact that it does have on the array the County has worked out an arrangement with the
city whereby the city will pay the county some amount to compensate for shading which the county
then uses for additional energy improvement measures on the library (LeMaro 2012)
48
Figure 27 Aerial view of the TCPL PV array with the Holiday Inn and Cayuga Street Parking Garage and their
approximate distances from the array Both structures only contribute a minimum amount of shading to the array
and do not affect its output significantly
In terms of operation and maintenance the system has been quite reliable There were some issues
with the inverter soon after completion of the installation but these repairs were covered by
Powerlightrsquos warranty and were done free of charge The inverters were guaranteed for 10 years and
the panels themselves were guaranteed for 25 years The most significant although still minor
maintenance issue has been vandalism that has arisen since the construction of the Cayuga Street
Parking Garage People have thrown bottles and rocks off the garage and onto the library roof which
has necessitated the replacement about a dozen of the panels Another unexpected issue has been
vegetation growing up between the panels causing minor shading This has been especially challenging
because the vegetation needs to be removed by hand due to the libraryrsquos policy on herbicide use Since
the panels are too fragile to walk on maintenance workers need to crawl out on pads to remove the
weeds while protecting the integrity of the panels So far only 2 of the 1430 panels have been replaced
due to failure of the panels from normal operation
Solar Liberty Lease Program
Late in 2011 Tompkins County entered into a 15 year lease with Buffalo based Solar Liberty for the
installation and maintenance of seven solar PV systems on top of county owned buildings The county
49
took advantage of a lease program offered through Solar Liberty where federal tax credits and
NYSERD grants cover most of the $1 million price tag In this program the county doesnrsquot actually buy
the panels from Solar Liberty instead they lease them for 15 years at the end of which the county has
the option of removing the panels or buying them at current market value (DiPietro 2011)
The seven systems consist of 6-25 kW arrays and one 20 kW array The 25 kW arrays are limited by
NYSERDrsquos cap on government systems of 25 kW to be eligible for financial incentives while the 20 kW
system is limited by the roof area of the intended building In contrast to the TCPL system these
systems will be installed with a 10 tilt which will help capture more solar energy throughout the year
In addition the tilted panels would help reduce any snow accumulation as well as mitigate the problem
of vegetation experienced with the TCPL system
The leasing program is a novel solution to the problem of up-front costs of solar installations While the
Tompkins County Facilities Division was researching PV installers Solar Liberty was the only one they
found that offered this leasing program in New York State Solar Liberty performs all of the engineering
design from determining if the roofs are structurally capable to hold the arrays to siting the arrays to
ultimately installing and maintaining the arrays If the county opts to remove the arrays at the end of
the 15 year term Solar Liberty will also remove the panels and any other associated equipment (LeMaro
2012) If Solar Liberty determines that there needs to be structural reinforcement however the county
will have to pay for that itself (DiPietro 2011)
The most attractive aspect of the leasing program was the cost A single 25 kW system would most
likely cost the county $150-200 thousand to install while the county will be paying Solar Liberty a little
over $10 thousand per year for all seven systems Over the 15 year life of the lease the county will pay
roughly the same amount to lease 7 systems as it would pay to purchase one system Even Mr LeMaro
admits this sounded too good to be true but Solar Liberty is banking on the aforementioned tax credits
NYSERDA grants and the hope that the State of New York will implement a Renewable Energy Credit
system whereby they will be able to trade credits with other companies (LeMaro 2012)
Table 17 shows the specifications of each of the installations (a more detailed description of the Solar
Liberty specifications can be found in Appendix E) The annual payment column represents the lease
payment that the county will pay to Solar Liberty each year and the Annual Savings column represents
the monetary energy savings minus the annual lease payment ie the county will save $19474 in total
energy bills while lease payments will be $10260 for a total savings of $9214 Finally the offset
represents the amount of energy that will be saved for each building given its historical energy
consumption It should be noted that the offset is high for the Human Service Annex because it has
been vacant and has had low energy usage Once it is occupied it will likely similar to Annex Building C
(LeMaro 2012)
50
Table 17 System specifications and estimated costs of the seven PV arrays of the Solar Liberty lease program
Note human service annex has been vacant and therefore has had a low historical electricity load which is the
reason for the large offset value Table provided by Arel LeMaro from interview on 232012
If a worst case scenario were to happen and Solar Liberty were to become bankrupt county attorney
Jonathan Wood said that ldquoit would be a breach of the lease and Tompkins County has various options to
protect the countyrdquo (DiPietro 2011)
Conclusions
The research presented in this report shows that the solar energy potential in the county is significant
With large scale community involvement and investment the county could generate a sizable portion of
its electricity with photovoltaics especially if combined with improvements in energy efficiency Table
18 below shows the calculated PV potential by sector for the county and each sectorrsquos share of total
electricity demand
Photovoltaic Potentials by Sector Capacity Potential
(MW) Energy Potential (million kWh)
Percent of Electricity Demand
Commercial 86 95 27
Industrial 22 24 17
Schools 39 43 13
Residential 124 136 46
Total 271 298 38 Table 18 PV potential by sector ldquoPercent of Electricity Demandrdquo refers to the energy potential in relation to each
sectorrsquos 2008 electricity usage as stated in the Tompkins County Community Greenhouse Gas Emissions Report
1998-2008 It should be noted that the demand for commercial and school buildings are grouped together in the
Greenhouse Gas report In other words the 95 million kWh energy potential of commercial buildings alone could
account for 27 of both commercial and school building electricity usage
51
In order to reach the large scale levels of photovoltaic investment listed in the table above PV
technologies need to reach grid parity without financial subsidies or incentives For the time being
however a number of financial incentives exist to encourage solar energy investment NYSERDA offers
a direct financial incentive along with tax incentives from the state of New York and the Federal
government Alternative financing arrangements such as solar leases and power purchase agreements
are becoming more popular and some cities in the US have actually loaned money to residents to
purchase and install solar systems using a special property tax assessment to repay the loan
Every home and business owner should seriously consider installing a PV system and the In My
Backyard tool (page 22) and Clean Power Estimator (page 43) should provide sound technical and
financial information on what individuals can expect out of a PV system Individuals should consult a
qualified solar installer for a site evaluation and cost estimate before deciding to purchase a PV system
and contact an accountant to clarify any tax issues
Tompkins County itself has already taken steps toward meeting its aggressive climate goals with two
major solar energy projects The first was the installation of 147 kW of solar photovoltaic panels on the
roof of the public library and more recently the county has entered into an agreement with Solar
Liberty of Buffalo to install solar photovoltaic systems on top of 7 county buildings Community leaders
hope that these systems will help to reduce overall greenhouse gas emissions within the county and
provide an example of how solar energy can help individuals reduce their utility bills and minimize their
impact on the climate
52
References
Borgella Katie 2012 Personal communication via email on 272012
ranker K Pathak MJM and Pearce JM 2011 ldquo Review of Solar Photovoltaic Levelized ost of
Electricityrdquo Renewable and Sustainable Energy Reviews December 2011 15 (9)
CLS 335-b New York State Consolidated Law Service Real Property Law Statute 335-b Found online at
URL httpwwwdsireusaorgdocumentsIncentivesNY01Rhtm
artlidge Edwin 2007 ldquoright Outlook for Solar ellsrdquo Environmental Research Web URL
httpenvironmentalresearchweborgcwsarticlenews30489
leantech Investing 2009 ldquoSolarridge and PV Microinverter Reliabilityrdquo URL
httpwwwgreentechmediacomgreen-lightpostsolarbridge-and-pv-micro-inverter-reliability
olville Finlay 2012 ldquoNPD Solarbuzz- Top-10 PV cell producers in 2011rdquo PVTech URL httpwwwpvshy
techorgguest_blognpd_solarbuzz_top_10_pv_cell_producers_in_2011
oughlin Jason and ory Karlynn 2009 ldquoSolar Photovoltaic Financing Residential Sector Deploymentrdquo
NREL Technical Report NRELTP-6A2-44853 March 2009
DOE US Department of Energy 2005 ldquoasic Research Needs for Solar Energy Utilizationrdquo
DSIRE Database of State Incentives for Renewables amp Efficiency
---- ldquoLocal Option ndash Solar Wind amp iomass Energy Systems Exemptionrdquo URL
httpwwwdsireusaorgincentivesincentivecfmIncentive_Code=NY07Fampre=1ampee=1
---- ldquoNew York-Net Meteringrdquo URL
httpwwwdsireusaorgincentivesincentivecfmIncentive_Code=NY05RampRE=1ampEE=1
---- ldquoResidential Solar Tax reditrdquo URL
httpwwwdsireusaorgincentivesincentivecfmIncentive_Code=NY03Fampre=1ampee=1
---- ldquoSolar Easements amp Local Option Solar Rights Lawsrdquo URL
httpwwwdsireusaorgincentivesincentivecfmIncentive_Code=NY01Rampre=1ampee=1
Dankoff Windy and Schwartz Joe 2007 ldquosk the Experts PV Longevity amp Degradationrdquo Homepower
Magazine AprilMay 2007 118 p 12 URL
httphomepowercomarticlefile=HP118_pg12_AskTheExperts_1
DiPietro Louis 2011 ldquoTompkins ounty Preparing to dd Solar Panels to Seven uildingsrdquo Ithacacom
URL httpwwwithacacomnewsarticle_3cf741c2-25dd-11e1-9f1c-001871e3ce6chtmlusershy
comment-area
53
Dolan Kerry 2010 ldquoEnphasersquos Rooftop Solar Revolutionrdquo Forbes November 8 2010 URL
httpwwwforbescomforbes20101108technology-enphase-energy-solar-power-rooftopshy
revolutionhtml
EI US Energy Information dministration ldquoElectric Power Monthly Data for December 2011rdquo URL
http20525413524electricitymonthlyepm_table_graphercfmt=epmt_5_6_a
Enviroharvest ldquoPV Shadingrdquo URL httpwwwenviroharvestcapv_shadinghtm
Ernst amp Young 2012 ldquoUnited States Renewable Energy ttractiveness Indicesrdquo February 2012 URL
httpwwweycomPublicationvwLUAssetsUS_Attractiveness_Indices_Issue$FILEUS_Attractiveness
_Indices_Issuepdf
GTM Research 2012 ldquoUS Solar Market Insight Report 2011 Year-In-Reviewrdquo Greentech Media and
Solare Energy Industries Association
ldquoGermany Your Unlikely World Leader in Solar Powerrdquo alfinder Nationwide Home Solar Power
Contractors and Information URL httpsolarcalfindercomblogsolar-informationgermany-yourshy
unlikely-world-leader-in-solar-power
German BMU Federal Ministry for the Envirionment Nature Conservation and Nuclear Safety 2010
Renewable Energy Sources 2010
Gerrard Michael B 2011 The Law of Clean Energy Efficiency and Renewables American Bar
Association
Gilmore Jeff 2012 Personal communication via email on 2292012
Gordon Scott 2010 ldquoSolar Energy and Federal Tax redits for Residential Solar Systemsrdquo Energy
Solutions October 27 2010 URL httpblogheliopowercomcategoryfederal-tax-credits
HRS Hotel Reviews Holiday Inn Hotel Downtown Ithaca URL
httpwwwhrscomukbookingenusaithaca-new-yorkholiday-inn-ithaca-downtown-137885html
Ithaca NY City Data URL httpwwwcity-datacomcityIthaca-New-Yorkhtml
Kissell Thomas E 2012 Introduction to Solar Principles Upper Saddle River NJ Prentice Hall
LeMaro Arel 2012 Personal interview conducted on 232012
NYSERDA New York State Energy Research and Development Authority New York Renewable Portfolio
Standard URL httpnyserdanygovPage-SectionsEnergy-and-Environmental-MarketsRenewableshy
Portfolio-Standardaspx
NREL National Renewable Energy Laboratory URL httpwwwnrelgov
54
Osborne Mark 2011 ldquoEnecsys offers 360W dual micro-inverter that maintains individual MPPTrdquo PV-
Tech March 7 2011 URL httpwwwpvshy
techorgproduct_reviewsenecsys_offers_360w_dual_micro_inverter_that_maintains_individual_mppt
PowerClerk 2012 NYSERDA PV Report URL
httpnyserdapowerclerkreportscomDefaultaspxReportId=1
QPK Design ldquoTompkins ounty Library 2020rdquo URL
httpmidhudsonorgadminfacilities_resourcesgreenQPK_Designpdf
Renovus Energy website Solar Electric section URL httprenovusenergycomsolar_electrichtml
SRETrade ldquoSolar Renewable Energy ertificates (SREs)rdquo URL
httpwwwsrectradecombackgroundphp
Shahan Zachary 2012 ldquo2011 US Solar Market Report ndash Top 7 Findings and hartsrdquo
CleanTechnicacom March 15 2012 URL httpcleantechnicacom20120315us-solar-facts-charts
Solarbuzz Solar Market Research and nalysis 2011 ldquoRetail Price Summary ndash December 2011 Updaterdquo
URL httpsolarbuzzcomfacts-and-figuresretail-price-environmentmodule-prices
Solar Facts and dvice ldquoSolar Panel Temperature ffects Output ndash Herersquos what you need to knowrdquo URL
httpwwwsolar-facts-and-advicecomsolar-panel-temperaturehtml
Steeby Donald 2012 Alternative Energy Sources and Systems Clifton Park NY Delmar Cengage
Learning
Sunpower Data Sheet E20435 Solar Panel Manufacturerrsquos Data Sheet URL
httpglobalsunpowercorpcomproductssolar-panels
Sunpower Performance Monitoring ldquoTompkins ounty PowerGuard Photovoltaic Systemrdquo URL
httpwwwsunpowermonitorcomCommercialKioskaspx
TPD Tompkins ounty Planning Department 2010 ldquoTompkins ounty ommunity Greenhouse Gas
Emissions Report 1998-2008rdquo URL httpwwwtompkinsshy
coorgplanningenergyclimatedocumentsDraftCommunity10-yearGHGEmissionsReportpdf
Tester JT Drake EM Driscoll MJ Golay MW Peters WA 2005 Sustainable Energy Choosing
Among Options Cambridge MA The MIT Press
Trabish Herman K 2011 ldquoNew Study Solar Grid Parity is Here Todayrdquo Greentechsolar URL
httpwwwgreentechmediacomarticlesreadNew-Study-Solar-Grid-Parity-Is-Here-Today
Vanek Francis M 2012 Personal communication via email on 312012
Weaver Art 2012 Personal interview conducted on 442012
55
56
Appendix A Image sources
Figure 1 httpwwwgreentechmediacomresearchussmi
Figure 3 httpwwwitechnewsnetwp-contentuploads200905sanyo-hit-solar-cell-has-highestshy
energy-conversion-efficiencyjpg
Figure 4 Kissell 2012
Figure 5 Kissell 2012
Figure 6 Figure used with permission from lecture slides of KE ldquoMaxrdquo Zhang PhD ornell University
Figure 7 httpenvironmentalresearchweborgcwsarticlenews304891Generationgap
Figure 8 httpwwwpv-techorgguest_blognpd_solarbuzz_top_10_pv_cell_producers_in_2011
Figure 15 Steeby 2012
Figure 16 Kissell 2012
Figure 2 Figure used with permission from lecture slides of KE ldquoMaxrdquo Zhang PhD ornell University
Figure 9 httpnetzerorenewableresourcescomwp-contentuploads201010Roof-Mount-1jpg
Figure 10 httpwwwpowertripenergycomimages2009Pole-mount-for-webjpg
Figure 11 Steeby 2012
Figure 12 Image used with permission from lecture slides of Tobias Hanrath PhD Cornell University
Figure 13 httpwwwwattsuncommiscphotovoltaic_tilthtml
Figure 14 httpwwwenviroharvestcapv_shadinghtm
Figure 23 2005 chart developed with permission from data from lecture slides of Tobias Hanrath PhD
Cornell University
Figure 22 httpsolarbuzzcomfacts-and-figuresretail-price-environmentmodule-prices
Figure 24 GTM Research 2012
Figure 25 httpnyserdacleanpowerestimatorcomnyserdahtm
Figure 26 httpmidhudsonorgadminfacilities_resourcesgreenQPK_Designpdf
Figure 27 httpmapsgoogleco
B-1
Appendix B Description of Variables Used by PVWatts
DC Rating
The size of a photovoltaic (PV) system is its nameplate DC power rating This is determined by adding the PV module power listed on the nameplates of the PV modules in watts and then dividing the sum by 1000 to convert it to kilowatts (kW) PV module power ratings are for standard test conditions (STC) of 1000 Wm2 solar irradiance and 25degC PV module temperature The default PV system size is 4 kW This corresponds to a PV array area of approximately 35 m2 (377 ft2)
Caution For correct results the DC rating input must be the nameplate DC power rating described above It cannot be based on other rating conditions such as PVUSA test conditions (PTC) PTC are defined as 1000 Wm2 plane-of-array irradiance 20degC ambient temperature and 1 ms wind speed If a user incorrectly uses a DC rating based on PTC power ratings the energy production calculated by the PVWatts calculator will be reduced by about 12
DC-to-AC Derate Factor
The PVWatts calculator multiplies the nameplate DC power rating by an overall DC-to-AC derate factor to determine the AC power rating at STC The overall DC-to-AC derate factor accounts for losses from the DC nameplate power rating and is the mathematical product of the derate factors for the components of the PV system The default component derate factors used by the PVWatts calculator and their ranges are listed in the table below
Derate Factors for AC Power Rating at STC
Component Derate Factors PVWatts Default Range
PV module nameplate DC rating 095 080ndash105
Inverter and transformer 092 088ndash098
Mismatch 098 097ndash0995
Diodes and connections 0995 099ndash0997
DC wiring 098 097ndash099
AC wiring 099 098ndash0993
Soiling 095 030ndash0995
System availability 098 000ndash0995
Shading 100 000ndash100
Sun-tracking 100 095ndash100
Age 100 070ndash100
B-1
Overall DC-to-AC derate factor 077 009999ndash096001
The overall DC-to-AC derate factor is calculated by multiplying the component derate factors
For the PVWATTS default values
Overall DC to AC derate factor
= 095 x 092 x 098 x 0995 x 098 x 099 x 095 x 098 x 100 x 100 x 100
= 077
The value of 077 means that the AC power rating at STC is 77 of the nameplate DC power rating In most cases 077 will provide a reasonable estimate However users can change the DC-to-AC derate factor The first option is to enter a new overall DC-to-AC derate factor in the provided text box The second option is to click the Derate Factor Help button This provides the opportunity to change any of the component derate factors The derate factor calculator then calculates a new overall DC-to-AC derate factor
The component derate factors are described below
PV module nameplate DC rating This accounts for the accuracy of the manufacturers nameplate rating Field measurements of PV modules may show that they are different from their nameplate rating or that they experience light-induced degradation upon exposure A derate factor of 095 indicates that testing yielded power measurements at STC that were 5 less than the manufacturers nameplate rating Inverter and transformer This reflects the inverters and transformers combined efficiency in converting DC power to AC power A list of inverter efficiencies by manufacturer is available from the Consumer Energy Center The inverter efficiencies include transformer-related losses when a transformer is used or required by the manufacturer Mismatch The derate factor for PV module mismatch accounts for manufacturing tolerances that yield PV modules with slightly different current-voltage characteristics Consequently when connected together electrically they do not operate at their peak efficiencies The default value of 098 represents a loss of 2 because of mismatch Diodes and connections This derate factor accounts for losses from voltage drops across diodes used to block the reverse flow of current and from resistive losses in electrical connections DC wiring The derate factor for DC wiring accounts for resistive losses in the wiring between modules and the wiring connecting the PV array to the inverter AC wiring The derate factor for AC wiring accounts for resistive losses in the wiring between the inverter and the connection to the local utility service
B-2
Soiling The derate factor for soiling accounts for dirt snow and other foreign matter on the surface of the PV module that prevent solar radiation from reaching the solar cells Dirt accumulation is location- and weather-dependent There are greater soiling losses (up to 25 for some California locations) in high-trafffic high-pollution areas with infrequent rain For northern locations snow reduces the energy produced and the severity is a function of the amount of snow and how long it remains on the PV modules Snow remains longest when sub-freezing temperatures prevail small PV array tilt angles prevent snow from sliding off the PV array is closely integrated into the roof and the roof or another structure in the vicinity facilitates snow drift onto the modules For a roof-mounted PV system in Minnesota with a tilt angle of 23deg snow reduced the energy production during winter by 70 a nearby roof-mounted PV system with a tilt angle of 40deg experienced a 40 reduction System availability The derate factor for system availability accounts for times when the system is off because of maintenance or inverter or utility outages The default value of 098 represents the system being off 2 of the year Shading The derate factor for shading accounts for situations in which PV modules are shaded by nearby buildings objects or other PV modules and arrays For the default value of 100 the PVWatts calculator assumes the PV modules are not shaded Tools such as Solar Pathfinder can determine a derate factor for shading by buildings and objects For PV arrays that consist of multiple rows of PV modules and array structures the shading derate factor should account for losses that occur when one row shades an adjacent row
The figure below shows the shading derate factor as a function of the type of PV array (fixed or tracking) the ground cover ratio (GCR) defined as the ratio of the PV array area to the total ground area and the tilt angle for fixed PV arrays As shown in the figure spacing the rows further apart (smaller GCR) corresponds to a larger derate factor (smaller shading loss) For fixed PV arrays if the tilt angle is decreased the rows may be spaced closer together (larger GCR) to achieve the same shading derate factor For the same value of shading derate factor land area requirements are greatest for two-axis tracking as indicated by its relatively low GCR values compared with those for fixed or one-axis tracking If you know the GCR value for your PV array the figure may be used to estimate the appropriate shading derate factor Industry practice is to optimize the use of space by configuring the PV system for a GCR that corresponds to a shading derate factor of 0975 (or 25 loss)
B-3
Shading derate factor for multiple-row PV arrays as a function of PV array type and ground cover ratio
Sun-tracking The derate factor for sun-tracking accounts for losses for one- and two-axis tracking systems when the tracking mechanisms do not keep the PV arrays at the optimum orientation For the default value of 100 the PVWatts calculator assumes that the PV arrays of tracking systems are always positioned at their optimum orientation and performance is not adversely affected Age The derate factor for age accounts for performance losses over time because of weathering of the PV modules The loss in performance is typically 1 per year For the default value of 100 the PVWatts calculator assumes that the PV system is in its first year of operation For the eleventh year of operation a derate factor of 090 is appropriate
Note Because the PVWatts overall DC-to-AC derate factor is determined for STC a component derate factor for temperature is not part of its determination Power corrections for PV module operating temperature are performed for each hour of the year as the PVWatts calculator reads the meteorological data for the location and computes performance A power correction of -05 per degree Celsius for crystalline silicon PV modules is used
B-4
Appendix C Aerial Views of the 10 Largest Commercial Buildings in
the County
(contained in separate file)
C-1
Appendix D Aerial Views of the 10 Largest Industrial Buildings in
the County
(contained in separate file)
D-1
Appendix E Aerial Views of the 10 Largest School Buildings in the
County
(contained in separate file)
E-1
Appendix F Solar Liberty System Specifications
(contained in separate file)
F-1
Table of Contents
Executive Summary 1
Overview of Solar Energy3
Focus of This Report 4
Solar Energy Trends 4
United States 4
Tompkins County 5
Resource Assessment 6
Photovoltaic Basics 8
PV Overview 8
Inverters 10
Current PV Materials10
Future PV Materials 11
Module Efficiencies12
Temperature Effects 13
Panel Degradation14
PV Manufacturers 14
Solar Thermal Systems20
Individual PV Systems 15
Location of Panels 15
Tilt Angle 17
Shading18
Solar Easements20
Tompkins County Solar Performance 20
Tompkins County PV Potential 25
Commercial Potential25
Industrial Potential28
School Building Potential 30
Residential Potential 32
Number of Homes32
Number of Homes with PV Potential 33
i
PV Potential Calculations 34
Urban Systems 34
Rural Systems34
Total Photovoltaic Potential 35
Solar System Costs 36
Module Prices 36
Installed System Prices37
Tompkins County System Prices 38
Net Cost Breakdown 38
Net Metering39
PV Financial Programs and Incentives 40
Traditional Financing Arrangements40
Alternative Financing Arrangements 40
Third Party Ownership Models 40
Property Tax Assessment Model 41
Solar Renewable Energy Certificates 41
NYSERDA Renewable Portfolio Standard41
NYSERDA Incentive 42
New York State Tax Credits42
Federal Tax Credits43
NYSERDA Clean Power Estimator 43
Grid Parity of Solar PV46
County Municipal Solar Installations 47
Tompkins County Public Library47
Solar Liberty Lease Program 49
Conclusions 51
Appendix A Image sources1
Appendix B Description of Variables Used by PVWatts 1
DC Rating 1
DC-to-AC Derate Factor 1
Appendix C Aerial Views of the 10 Largest Commercial Buildings in the County1
Appendix D Aerial Views of the 10 Largest Industrial Buildings in the County 1
ii
Appendix E Aerial Views of the 10 Largest School Buildings in the County 1
Appendix F Solar Liberty System Specifications 1
iii
Executive Summary
This report is intended to be used as a supplement to the Tompkins County Energy Road Map a
comprehensive strategy currently being developed by the Tompkins County Planning Department to
reduce the greenhouse gas emissions within the county The overall goal of this report is to quantify
Tompkins ountyrsquos solar photovoltaic potential
The solar potential of the county is broken down by sector into commercial industrial educational and
residential buildings shown in Table 1 It is easiest to quantify solar potential for commercialindustrial
buildings as they mainly have flat roofs with few obstructions The cumulative commercial rooftop PV
installation potential was calculated to be 86 MW which could result in an electricity production of
nearly 95 million kWh According to the Tompkins County Community Greenhouse Gas Emissions
Report 1998-2008 this potential electricity production could account for around 27 of the electricity
demand of commercial and school buildings (commercial and school buildings are grouped together in
the Tompkins County Greenhouse Gas report when calculating electricity usage)
Similarly industrial buildings typically have flat unobstructed roofs which provide ideal surfaces for
solar panels The cumulative industrial rooftop PV installed capacity potential was determined to be 22
MW which would result in an electricity production of roughly 24 million kWh or 17 of demand for
the industrial sector
It is a little more difficult to quantify the energy potential for school buildings because their roofs tend
to have more uneven surfaces and odd contours Despite this minor challenge the cumulative school
building PV installed capacity potential was calculated to be 40 MW which would result in an electricity
production of approximately 44 million kWh or 13 of the commercialschool sectorrsquos electricity
demand
It is most difficult to calculate PV potential for private homes Because homes in the county are
heterogeneous and do not typically have flat roofs like commercial industrial or school buildings it is
much more difficult to calculate their PV potential To do so it was assumed that 80 of residential
buildings in the county could install a PV system and rural houses could install bigger systems than
urban houses (for a full explanation of these assumptions see the Residential Potential section on page
32) As such the cumulative residential PV installation potential was determined to be 124 MW which
could generate approximately 136 million kWh annually or around 68 of the 2008 residential
electricity demand
Table 1 below shows a breakdown of the PV potential in the county by sector It should be noted that
the calculated PV potentials are merely estimates although it is reasonable to assume that the total
electricity generation potential across all sectors is on the order of hundreds of millions of kWh
1
Photovoltaic Potentials by Sector Capacity Potential
(MW) Energy Potential (million kWh)
Percent of Electricity Demand
Commercial 86 95 27
Industrial 22 24 17
Schools 39 43 13
Residential 124 136 46
Total 271 298 38 Table 1 PV potential by sector ldquoPercent of Electricity Demandrdquo refers to the energy potential in relation to each
sectorrsquos 2008 electricity usage as stated in the Tompkins County Community Greenhouse Gas Emissions Report
1998-2008 It should be noted that the individual energy potential for commercial and school buildings are
described in terms of their ability to account for the demand by both sectors combined in the Greenhouse Gas
report In other words the 95 million kWh energy potential of commercial buildings alone could account for 27 of
both commercial and school building electricity usage
Unfortunately the calculations above are estimates of the countyrsquos solar potential and do not
necessarily represent an accurate prediction of the extent of future investment in solar photovoltaics
within the county The main deterrent against large scale solar energy development in Tompkins County
has been the up-front costs associated with purchasing a solar system However within the past year or
two the price of solar photovoltaics has dropped precipitously making solar energy systems more
affordable for home and business owners NYSERDA offers a solar energy financial incentive along with
tax incentives from the state of New York and the federal government Alternative financing
arrangements such as solar leases and power purchase agreements are becoming more popular and
some cities in the US have actually loaned money to residents to purchase and install solar systems
using a special property tax assessment to repay the loan
Tompkins County itself has already taken steps toward a greener future with two major solar energy
projects The first was the installation of 147 kW of solar photovoltaic panels on the roof of the public
library To date the system has generated 989000 kWh of electricity enough to power roughly 83
homes for a year More recently the county has entered into an agreement with Solar Liberty of Buffalo
to install solar photovoltaic systems on top of 7 county buildings Community leaders hope that these
systems will help reduce the overall greenhouse gas emissions within Tompkins County
2
Overview of Solar Energy
Solar energy is one of the most quickly evolving and exciting technologies available in the transition to a
sustainable future Although the cost of solar systems is rapidly decreasing and the efficiencies are
improving solar energy still faces some significant challenges One inherent challenge of solar energy
generation is its variability Throughout the course of the year the amount of sunlight in a given
location is subject to both diurnal and seasonal changes that make it difficult to get a consistent and
reliable supply of energy Fortunately since the sunrsquos daily and seasonal paths are both predictable and
mathematically calculable changes in energy generation can be estimated to a certain degree Weather
can also affect the output of solar energy but local historical averages can provide a reasonable
estimate of future weather patterns
The amount of energy that reaches the Earthrsquos surface also known as the incident solar energy or solar
insolation is very large Much of the energy emitted by the sun is scattered or reflected by the
atmosphere but about 21 of the sunrsquos energy reaches the Earth as direct radiation and about 29
reaches as scattered or diffuse radiation Over the course of a year over 40000 EJ (exajoules a unit of
energy defined as 11018 joules) are incident on the United States alone (Tester et al 2005) For
comparison this dwarfs the total US energy consumption of around 100 EJ per year If a 10 efficient
solar farm were installed over just 16 of the US land area (about 10 times the total area of all single-
family residential rooftops) it would meet all of the countryrsquos domestic energy needs (DOE 2005) While
solar insolation provides a huge energy potential the aforementioned variability low energy density
compared to other sources of energy land use requirements and high relative costs have traditionally
deterred large investments in solar energy
There are two main ways that the sunrsquos energy can be harvested One method is called photovoltaic
solar energy commonly referred to as ldquophotovoltaicsrdquo or simply ldquoPVrdquo This method uses light from the
sun to generate electricity directly which can be used just the same as electricity from a power plant
The majority of photovoltaic systems are grid tied meaning they are interconnected with the electricity
grid This helps alleviate the variability issue as the grid can supply electricity to a building if the PV
system does not meet the demand In addition the grid can act as a de facto battery accepting any
extra electricity the PV system produces that is higher than the demand of the building In more rare
cases usually in remote rural areas standalone PV systems are utilized meaning they are not
connected to the grid Because they are not grid tied standalone PV systems require large batteries to
store the PV electricity for use during the night or on cloudy days Due to the relatively high cost of
batteries these systems are more expensive than grid tied systems
The second method for generating solar energy is called solar thermal which uses thermal energy from
the sun to generate heat instead of electricity Oftentimes this energy is used to heat hot water which
can reduce the heating load of a home or business Unfortunately they generate the least amount of
energy during the winter when heating is needed the most They work very well during the summer
though and a large portion of a homersquos hot water needs during those months can be provided with a
solar thermal system
3
Focus of This Report
The main focus of this report will be an attempt to estimate the residential and commercial photovoltaic
solar energy potential of Tompkins County Additional information about solar thermal systems is also
included A basic overview of solar energy and the current state of photovoltaics is provided as an
introduction to solar energy for anybody who is unfamiliar with the technology followed by a more in-
depth analysis of the PV potential of Tompkins County in particular The PV potential of the county is
broken down by sector commercial industrial schools and residential buildings The commercial
industrial and school building potential is relatively easy to determine as most of these buildings have
flat roofs with little to no shading obstructions such as tall trees or neighboring tall buildings
The residential potential is a little more difficult however since houses generally donrsquot have flat roofs
and the amount of roof obstruction or potential for shading is unique to every house Some houses may
not have adequate roof space for a solar system or may have trees or neighboring houses that could
cast a shadow on the solar system Nonetheless an approximate estimate of the potential can be
determined It should be noted that this is merely a potential and there is a somewhat large amount of
uncertainty in the estimate Also it should not be mistaken for a prediction of the amount of solar
energy that will be installed in the county There is a wide range of variables that will affect the actual
amount of solar energy produced in the county and only the future will tell what the level of solar
energy investment in the county will be
Solar Energy Trends
United States
Over the past few decades the United States has shown an ever increasing interest and demand for
solar energy In 2011 the US more than doubled its solar PV capacity compared to 2010 adding enough
capacity to power more than 370000 homes (Shahan 2012) According to analysts at Ernst amp Young the
US is the second most attractive country in the world for renewable energy behind China and ahead of
Germany According to the same index the state of New York is tied with Maine Pennsylvania and
Nevada for 8th most attractive state in the country for renewable energy (Ernst amp Young 2012)
Leading the way last year in terms of number of PV systems installed were California and New Jersey
with New York in 7th place behind Pennsylvania (Shahan 2012) One main reason for the solar success of
New Jersey and Pennsylvania has to do with the statesrsquo implementation of Solar Renewable Energy
Certificates (SRECs) These are credits that owners of solar systems receive based on the amount of
energy generated by their solar systems Energy suppliers are required by the state to produce a given
amount of energy from solar energy and can buy SRECs from home or business owners who produce
solar energy (SREC Trade) These programs have been very successful in promoting the growth of solar
energy but may have become ldquovictims of their own successrdquo as the large number of solar installations is
pushing down the price of SRECs (Ernst amp Young 2012) The current low price of SRECs should slow
4
down the rate at which New Jersey and Pennsylvania solar installations advance at least for the short
term
Figure 1 The US Solar Year-In-Review This essentially sums up the big news and developments in the US solar
market during 2011
Tompkins County
Currently according to NYSERDA Tompkins County is a photovoltaic leader in central New York The
county has 211 solar PV systems overall while the surrounding counties are lagging significantly behind
as can be seen in Table 2 (PowerClerk)
5
Tompkins and Surrounding Counties County No of Systems
Tompkins 211
Tioga 33
Cayuga 32
Cortland 20
Chemung 19
Seneca 11
Schuyler 10
Table 2 Number of installed photovoltaic systems in Tompkins and surrounding counties It is clear that Tompkins
County is the PV leader in central New York (Data gathered from PowerClerk 2012)
Looking at the state as a whole Tompkins County currently ranks 7th in number of PV systems recently
passing Queens County (201) When accounting for population however the county ranks 2nd with
nearly 21 systems per 10000 residents as shown in Table 3
Leading PV Counties of New York County No of Systems Population Systems per
10000 Residents
Columbia 232 63096 368
Tompkins 211 101564 208
Ulster 376 182493 206
Dutchess 379 297488 127
Albany 232 304204 76
Westchester 352 949113 37
Erie 315 919040 34
Table 3 Table showing the top 7 counties in New York in terms of number of PV installations Tompkins County th ndranks 7 in number of installations but 2 in installations per 10000 residents (PV data gathered from PowerClerk
2012 Population data gathered from the US Census Bureau)
Of the 211 PV systems in Tompkins County 176 are residential 22 are commercialindustrial and 13 are
governmentnon-profit According to the 2010 census and GIS data obtained from the Tompkins County
Planning Department there are 38967 households 2118 commercial buildings 232 industrial
buildings and 937 school buildings As such there exists a huge potential for rooftop solar installations
in the county which will be discussed further in the Tompkins County PV Potential section
Resource Assessment
The most important aspect of generating solar energy is what is called solar insolation This is the
amount of solar energy that reaches the Earthrsquos surface for a given location This is usually expressed as
energy per unit area for a given time period For example an area that has an insolation of 1500
kWhm2year receives 1500 kWh of solar energy for every square meter of land area over the course of
a year This does not mean however that this area could annually generate 1500 kWh of solar
6
electricity for every square meter of land area This is limited by the efficiency of the PV cell converting
the sunrsquos light to electricity and this efficiency is relatively low (~11-15 for low to average cells and
~15-20 for top of the line cells)
At first glance Tompkins County may not seem like an ideal place for solar energy When compared to
Germany the worldwide leader in solar energy however Tompkins County actually proves to have a
better solar resource Much like Tompkins County Germany has a large number of cloudy days
throughout the year Overall Germany gets an average of 1500 hours of sunshine per year or a little
less than 63 full daysrsquo worth of sunlight (ldquoGermanyrdquo)
Figure 2 shows the average annual solar insolation of the United States and Germany The map shows
that nearly the entire contiguous United States receives more sunlight than Germany According to the
map Tompkins County receives around 1500 kWhm2year while Germany only receives around 1000shy
1100 kWhm2year Nevertheless Germany has an installed photovoltaic capacity of 17320 MW
compared to an installed capacity of 3954 MW in the US (German BMU amp GTM Research 2012) While
much of Germanyrsquos solar success is due to its more generous governmental funding programs it is
encouraging that solar energy can utilized in a country that has a lower-grade solar resource than
Tompkins County
Figure 2 Annual average solar insolation of the United States and Germany This figure shows that almost the
entire contiguous United States receives more sunlight than anywhere in Germany
7
Photovoltaic Basics
PV Overview
Solar photovoltaic systems utilize the photoelectric effect present in semiconductor materials to turn
solar energy directly into electricity When speaking of photovoltaics there are a number of
terminologies that are used to describe certain aspects of a system First the electricity is actually
generated in what is called a solar cell Each cell is only a few square inches (Figure 3) and only
generates a small amount of voltage However a number of cells wired together in series increases the
voltage in what are known as panels or modules Both terms are commonly used and will be used
interchangeably throughout this report A typical photovoltaic panel rectangular measuring a few
square feet and typically consists of 36 cells connected in series (Kissell 2012) Figure 4 shows how
individual cells are typically strung together to form a panel
Figure 3 Typical size of a solar cell These are what actually generate the electricity in a PV system and a number
of them are strung together to form a PV panel
8
Figure 4 A schematic of a typical photovoltaic panel 36 individual PV cells are connected in series to create the
panel also known as a module
Most of the time solar PV systems consist of more than one panel When a number of panels are
arranged in series this is referred to as a string Multiple strings can then be arranged at a single site to
form an array Figure 5 shows an example of a 6 panel array consisting of two 3 panel strings
Figure 5 An example of a PV array consisting of two strings of 3 panels each
In order for PV panels from different manufacturers to be compared on an equivalent basis they need
to be tested according to universal standards Each PV manufacturer must subject their panels to a
9
laboratory rating system where they are tested under 1000 Wm2 irradiation and 25 C temperature
The amount of power that the panel produces under these conditions is then referred to the panelrsquos
nameplate rating The nameplate rating is in units of Watts and referred to as the panelrsquos watt-peak
rating and given the symbol Wp Oftentimes the ldquopeakrdquo portion is understood and panels are referred to
in Watts For example a 250 W panel will produce 250 watts of power under laboratory conditions
However it will not necessarily produce 250 W of power when installed because conditions in the real
world are not always as ideal as in the laboratory Most of the time in Tompkins County the panel will
likely receive less sunlight than in the laboratory and will produce less than 250 W The system will
produce less than 2 kW most of the time but at times when the sun is very intense it could actually
produce more than 2 kW If this panel is combined with 7 other 250 W panels into an 8-panel array it
will have a nameplate rating of 2000 W (2kW)
Inverters
Panels are not the only piece of equipment associated with a photovoltaic system Because solar panels
produce direct current or DC power and the electricity grid uses alternating current or AC power the DC
current from the array needs to be converted to AC before it can be used by electrical appliances or sent
to the grid To convert the electricity a complex piece of electrical equipment called an inverter uses
various algorithms to operate the PV system at maximum power Inverters tend wear out much sooner
than PV panels and many are only warrantied for 5-10 years as compared to 20-25 years for most
panels As such many firms are looking into producing more reliable inverters that will have a longer
life (Cleantech 2009)
Current PV Cell Materials
Throughout the course of photovoltaic development there have been three generations of solar cells
broken down by the materials they use and their cost By far the most frequently used solar panels
today are first generation panels made from crystalline silicon (c-Si) This is because of the high
efficiency of silicon panels and the long history of silicon solar cell development and use
There are two types of crystalline silicon cells monocrystalline (mono-cSi) and polycrystalline (poly-cSi)
Mono-cSi cells are produced in a very highly specialized process identical to the process of developing
silicon computer chips These cells have the highest efficiency of silicon based cells but they are also
the most expensive Poly-cSi cells are made in a less exacting fashion and therefore have a lower
efficiency but also lower cost Mono-cSi panels require approximately 60 ft2 of panel area per kW of
installed capacity while poly-cSi cells need up to 120 ft2 of panel area for each kW of installed capacity
(Kissell 2012) Traditionally crystalline silicon panels have had a relatively high price but their price has
recently plummeted making these types of panels more cost effective in the short term
In addition to c-Si cells there are a number of different technologies being studied and developed that
show promise moving forward Second generation cells commonly referred to as ldquothin filmsrdquo have a
lower efficiency than c-Si cells but have also traditionally had a lower cost They are also much thinner
and lighter than c-Si cells and can contour to odd shapes and building angles Figure 6 provides typical
characteristics of c-Si cells and thin films
10
Figure 6 Characteristics of monocrystalline polycrystalline and thin film PV cells Below the table are pictures of
typical monocrystalline polycrystalline and thin film cells respectively IPV refers to ldquouilding Integrated PVrdquo
which incorporates PV panels into the construction of new buildings
The three main types of thin film solar cells are amorphous silicon (a-Si) cadmium telluride (CdTe) and
copper indium gallium selenide (CIGS) Amorphous silicon has struggled to gain market share because
of its low conversion efficiency and seems to have lost out to CdTe and CIGS as the main thin film
technologies CdTe was pioneered by First Solar which is now the worldwide leader in PV production
(Figure 8) This is currently the most cost effective technology but its lower efficiency has decreased its
popularity compared to crystalline silicon (PVInsights) CIGS has shown to have higher efficiencies in the
laboratory but it is much more complicated to produce than CdTe so it has lagged behind Many people
are optimistic about the future of CIGS because of its high efficiency but firms need to figure out how to
economically commercialize the process before it can gain significant market share (Grana 2010)
Future PV Materials
Third generation cells are cells that are mostly experimental at this point but show promise if they can
be commercialized There are a number of different types of third generation cells but they all have
higher efficiencies than silicon based cells and should be less expensive to produce If these cells do
happen to be developed and commercialized many of the limitations of solar energy would be lessened
namely cost and efficiency
A graph of the efficiency vs cost of the three generations of PV modules is shown below in Figure 7
The diagonal dashed lines represent the module cost per watt while the horizontal dashed lines
represent different physical limitations on PV cells The ldquoShockley-Queisser limitrdquo indicates the highest
theoretical efficiency that current generation 1 and 2 cells can reach Some cells have approached this
11
limit in the laboratory but commercially available cells only reach efficiencies in the upper teens and
recently 20 percent The ldquoultimate thermodynamic limit at 1 sunrdquo line indicates the theoretical
efficiency limit of advanced technology cells without the benefit of concentrators ie mirrors or lenses
that concentrate the sunlight Finally the ldquothermodynamic limit at 46200 sunsrdquo line indicates the
efficiency possible with advanced cells at the highest theoretical concentration level (Cartlidge 2007)
Figure 7 Efficiency vs cost of three generations of solar cells The dashed diagonal lines represent the module cost
per watt peak and the dashed horizontal lines represent the physical limitations of solar cells Note this is not the
total installed cost of the system just the module cost
The takeaways from this chart are the fact that second generation thin film cells are less expensive but
also less efficient than first generation cells while third generation cells are both less expensive and
more efficient Current c-Si cells range $1 per watt and around $3 per watt and ~12 efficiency to 20
efficiency (see Table 14 for a description of average module costs) If scientists and engineers are able
to develop third generation solar cells on a commercial scale they could be economically feasible
without any sort of government intervention or financial subsidy
Module Efficiencies
As mentioned before every commercially available PV module is tested according to standard test
conditions (STC) These conditions are specified as 1000 Wm2 (929 Wft2) irradiation at 25 C (77 F )
module temperature and the tests are carried out in a laboratory These conditions allow a direct
comparison between different modules from different companies and even different technologies The
efficiency of the module is related to its watt peak rating and surface area by the following equation
12
Where equals the module efficiency A is the module surface area in ft2 and 929 Wft2 refers to the
laboratory test conditions If the efficiency of the module is known the surface area can be calculated
from the above equation Table 4 shows the module surface area for each kW of installed capacity This
will not equal the total surface area of the array however since there are other mounting components
that are required to support the modules
For each kW of installed capacity
Module Efficiency Module Surface Area (ft2)
10 109
12 91
14 78
16 68
18 61
20 54
Table 4 Module surface area for different efficiencies for each kW of installed capacity Note module area will
not equal the total installed area of the system Instead this only refers to the module area and does not account
for the frames that hold the modules or any spacing between the modules for other components
So for the same amount of installed power more efficient modules will require less area a
consideration for homeowners with limited roof area While higher efficiency panels tend to be more
expensive this higher cost is somewhat offset by the need to buy fewer panels for the same capacity as
well as the decrease in mounting hardware required and lower installation costs associated with
installing fewer panels
Temperature Effects
One of the more ironic aspects of solar PV systems is the fact that electricity output decreases with
increasing temperature In other words as panels receive more sunlight they could lose efficiency if the
panels begin to heat up In some cases electricity output can decrease by 10-25 depending on location
and type of panel Different panels are affected differently by temperature which is determined by
each panelrsquos temperature coefficient listed on the panelrsquos manufacturersrsquo data sheet as ldquotemperature
coefficient Pmaxrdquo s an example the temperature coefficient of a Suntech 190 W monocrystalline
module is -048 which means that every degree above 25 C (77 F) the maximum power possible
from the panel is reduced by 048 (Solar Facts)
If for instance a panel on a rooftop during a hot summer day heats up to 45 (113 F) its energy
produced would be 10 lower than at 25 (77 F) onversely on a cool sunny day when the
temperature is lower than 25 the panelrsquos energy output would actually increase (Solar Facts) This
could even out some of the lost energy during the hot months but because the sun is out longer during
the summer the overall temperature effect would likely be negative
13
Typically c-Si solar panels have a temperature coefficient in the range of -044 to -050 Sunpowerrsquos
E20 series monocrystalline modules have the lowest commercially available temperature coefficient at shy
038 as well as the highest module efficiency at 201 (Solar Facts and Sunpower Data Sheet)
Panel Degradation
Over time photovoltaic panels slowly begin to degrade and produce less power than when they were
new One widely held assumption about PV systems degradation is that a panel will lose about 1 of its
efficiency per year (Note this does not mean that a panel with 15 efficiency will be 0 efficient in 15
years It means that it will produce 85 of the energy in year 15 as compared to year 1 ie reducing its
overall efficiency to 1275) Branker Pathak and Pearce found this assumption to be unreasonably
conservative and suggested a degradation rate of 02 to 05 per year Even older panels produced in
the 1980s have been shown to degrade slower than the customary 1 mark and some even still perform
to their original specifications (Trabish 2011 and Dankoff and Schwartz 2007) As technologies
advance panel degradation rates should only decrease and perhaps even disappear altogether
Current PV Manufacturers
Figure 8 shows the top 10 photovoltaic manufacturers in terms of market share First Solar is the only
thin film manufacturer as well as the current worldwide leader in production This is due to the
companyrsquos downstream-integrated business model that few other firms have been able to follow
(Colville 2012) It will be increasingly difficult for thin film manufacturers to compete moving forward
given the price competitiveness that c-Si panels have developed
14
Figure 8 Leading PV manufacturers in terms of market share First Solar is the largest and only thin film
manufacturer on the list Chinese and Taiwanese companies occupy 8 of the top 10 spots with Fist Solar (US) and
Canadian Solar (Canada) the only two exceptions
Residential Photovoltaic Systems
One aspect that makes photovoltaics appealing is the simplicity and minimal operating costs and
maintenance Once the panels are installed they are essentially left in place for about 20 to 30 years
with little to no maintenance The major stumbling block for large scale implementation of photovoltaic
systems is the high up front cost The monetary savings resulting from a solar system may be greater
than the initial cost of installation but oftentimes individuals donrsquot have the money up front to pay for
the system Fortunately there are a number of financial incentive and tax programs that individuals
who wish to install photovoltaic systems may utilize These programs are discussed in-depth in the PV
Financial Programs and Incentives section on page 40
Location of Panels
One of the first concerns when determining the feasibility of a photovoltaic system on a residence is the
location and orientation of the panels In general solar panels need to be located in areas with minimal
shading between the hours of 900 am and 300 pm (Renovus) Panels typically need to face South
and can be mounted either on the roof of the home or on the ground If homeowners have adequate
South-facing roof space they will likely elect to mount the panels on the roof
15
Figure 9 below shows an example of a roof mounted PV system Roof mounted systems are less
expensive than ground mounted systems (Figure 10) due to the large foundations and wiring
requirements needed for ground systems However ground mounted systems allow the homeowner to
change the angle of the panels seasonally to generate the most energy throughout the year (Renovus)
There are a few other options for roof mounting that do not require the panels to sit flat on a south-
facing roof as shown in Figure 11
Figure 9 Roof mounted PV system Notice the lack of trees and other obstructions that could potentially shade
the panels Also notice the slope of the panels allows snow to slide off instead of accumulating
Figure 10 Ground mounted PV system The tilt of the array can be adjusted from the ground to adapt to different
seasonal sun conditions
16
Figure 11 Examples of various panel orientations for different roof conditions to ensure the panels are facing
south and at the correct tilt angle
Tilt Angle
Once the location of the panels is decided their tilt angle needs to be determined This is the angle that
the panels make with the ground and can have an effect on the energy output of the system Since the
sun takes different paths through the sky at different points throughout the year (Figure 12) the tilt of
the panels will affect the seasonal output of the PV system During the summer the sun takes the
longest highest path through the sky allowing for the most PV energy during this time
Figure 12 Path of the sun at different points throughout the year
If the panels are to be installed on a rooftop the best option is likely to install them flat on the roof
This is because it is the least costly method and differences in tilt angle have a small effect on PV system
output as shown in Table 5
17
PV Array Tilt Angle by Roof Pitch
Roof Pitch Tilt ngle (⁰) kWh per Installed kW
412 184 1084
512 226 1098
612 266 1109
712 303 1114
812 337 1116
912 369 1114
1012 398 1110
1112 425 1105
1212 450 1095 Table 5 Array tilt angles based on roof pitch and energy generation potential as estimated by historical weather
data Tilt angle has a minimal overall effect on the amount of electricity generated over the course of a year
One advantage of ground mounted systems is the ability to change the tilt of the panels seasonally to
optimize their output Figure 13 shows how a ground mounted system can be adjusted throughout the
year to optimize electricity generation
Figure 13 Effect of seasonal sun changes on energy generation As the figure shows the summer sun is higher in
the sky requiring a smaller array tilt to optimize solar energy collection during this time
Shading
One of the most important aspects to take into consideration when siting a PV system is shading Even
small amounts of shading such as leafless tree branches or small rooftop obstructions can have dramatic
impacts on the solar electricity generation of a PV system Since the cells and panels are connected in
series (Figure 4 and Figure 5) a single shaded cell can limit the electricity production of the entire string
(Figure 14) A common analogy is the frustrating situation when one bulb in a string of Christmas lights
makes the whole strand go out
18
Figure 14 Shading effects on a PV module These situations assume the system uses a centralized inverter If the
system used microinverters the PV power would only be reduced by the cells that are shaded instead of affecting
other cells in the string
The reason that this occurs is due to the operation of the inverter Since most inverters are centralized
they attempt to maximize the output for the entire system instead of each individual panel A solution
for this would be to use panels with microinverters which are small inverters that maximize the output
for each panel individually If one panel is shaded only the output from that panel is affected not the
entire string like is the case with centralized inverters Microinverters add to the cost of a system
however and it is estimated that microinverters cost 52₵ per watt compared to 40₵ per watt for a
centralized inverter (Dolan 2010) In other words microinverters will add $120 for every installed kW of
PV capacity This could be made up over the life of the system however through decreased shading
losses In addition microinverters tend to last longer than centralized inverters which could actually
result in a lower lifetime cost of the system if the centralized inverter has to be replaced after the
warranty has expired
Some companies are beginning to offer dual microinverters which are microinverters that service two
panels instead of one This means that a system would need half the amount of microinverters than a
system with a microinverter for each panel This would result in costs that are comparable to systems
with centralized inverters but 5-20 more energy produced (Osborn 2011)
No matter the type of inverter every precaution should be taken to ensure the panels receive direct
sunlight without shading for the majority of the day Many PV installers will provide a site evaluation
and shading assessment prior to installing a system to ensure the location is ideal for PV generation
(Enviroharvest)
19
Solar Easements
One issue that may concern residents before installing a solar energy system is the possibility of
neighbors constructing or planting something that may obstruct the amount of sunlight incident on their
PV array A solar easement prohibits neighboring property owners from this ensuring the solar system
will not be blocked by the actions of neighboring residents A typical solar easement will contain a
description of the dimensions of the easement including horizontal and vertical angles measured from
the solar installation as well as conditions for revision and termination of the easement (Garrard 2011)
New York Statersquos solar easement provision is outlined in LS Real Property Statute 335-b which
describes the aforementioned terms and a request for provisions for compensation in the instance that
a solar installation is blocked (CLS 335-b) Like many other states solar easements are voluntary
contracts that can ensure uninterrupted solar access for solar energy systems They are required to
contain at a minimum information describing ldquothe easement location and orientation to real property
subject to the easement provisions for termination and provisions for compensation in the event that
interference occursrdquo (DSIRE Solar Easements)
The full text of CLS 335-b can be found here
httpwwwdsireusaorgdocumentsIncentivesNY01Rhtm
In addition to the general solar easement provision New York General City Town and Village codes
allow local zoning districts to enact regulations regarding solar access within a municipality The intent
of the legislation recognizes ldquoaccess to solar energy as a valid public purpose within the zoning authority
of local governmentsrdquo (DSIRE Solar Easements)
This full legislation regarding municipal zoning can be found below
General City httpwwwdsireusaorgdocumentsIncentivesNY01Rbhtm
Towns httpwwwdsireusaorgdocumentsIncentivesNY01Rchtm
Villages httpwwwdsireusaorgdocumentsIncentivesNY01Rdhtm
Solar Thermal Systems
Solar thermal systems differ from PV systems in the fact that they collect and store heat from the sun
instead of producing electricity One of the most typical and practical applications of a solar thermal
system is hot water heating The heat from the sun is collected with a solar thermal collector and the
heat is then transferred to water in the house reducing the heating load of the house
The most common type of solar thermal collector is a flat-plate collector which is similar in size to a PV
module but operates much differently It consists of a metal box with a tempered glass coating called
glazing to protect it from the elements Inside the collector is an absorber which is frequently a copper
plate with copper tubing fastened to it The top of the absorber is coated with a dark paint with a
special absorber to ensure it absorbs the most amount of solar heat possible As the plate heats up
20
energy is transferred from the plate to a fluid circulating through the copper piping which is then either
pumped directly to the house to be used or to a heat exchanger that gives off its thermal energy to
water that is used in the house (Steeby 2012) Figure 15 shows the typical setup of a flat-plate solar
thermal collector
Figure 15 Typical arrangement of a flat plate collector The sunrsquos energy is absorbed by the absorber which is
then transferred to a fluid that is used to heat water in the home
A typical residential solar hot water system will need 100 to 120 ft2 of collector panels for hot water
needs If electricity or propane are currently used to heat water in a household electricity rates above 7
₵kWh or propane prices above $125 per gallon could make solar water heating an attractive
investment At these rates an average household could save between 50 and 80 of the total cost of
heating their water (Steeby 2012) A typical solar thermal hot water system is shown below in Figure
16
21
Figure 16 An example of a typical solar thermal hot water system The heated water is stored on the bottom
floor which is then circulated throughout the house for hot water uses such as bathing and washing clothes In
addition the hot water can be circulated through pipes in the floor or through radiators in the winter to heat the
home
An alternative use of solar water heating is pool andor spa heating The use of solar thermal heating
systems for swimming pools has grown to be the number one application of solar energy in the United
States today When a solar thermal pool heating system is appropriately sized and installed it can pay
for itself in 2 to 3 years (Steeby 2012)
Tompkins County PV Performance
In My Backyard Tool
In order to specifically assess the solar energy resource potential in Tompkins County NRELrsquos ldquoIn My
Backyardrdquo (IMY) tool was utilized
IMBY can be found here httpwwwnrelgoveisimby
This tool is a variation of NRELrsquos PVWatts tool that uses a model developed by Richard Perez from SUNY
Albany in conjunction with NREL for the US Department of Energy This model uses hourly radiance
22
images from geostationary weather satellites daily snow cover data and monthly averages of
atmospheric water vapor trace gases and the amount of aerosols in the atmosphere to calculate the
hourly insolation falling on a horizontal surface From there calculations are performed to determine
insolation for a specified tilt angle (NREL)
Since there are a variety of different sized PV systems in the County three representative sized systems
were used with IMBY 2 kW 4 kW and 6kW These roughly represent a ldquosmall medium and largerdquo
spectrum for residential PV systems Since PV systems generally require about 100 ft2 of roof space for
each kW of installed capacity the 2 4 and 6 kW systems would require approximately 200 400 and
600 ft2 of roof space A 2 kW system might be ideal for a more densely populated area with many
obstructions and limited roof space
The average size of the 8 systems currently installed in downtown Ithaca is 3 kW so the 2 and 4 kW
systems should provide a reasonable estimate of the range of system sizes in a more urban
environment A 6 kW system would be suitable for a rural setting or an isolated home with a large roof
or an appropriate amount of land NYSERDA only incentivizes residential systems 7 kW and smaller so
larger systems will be ignored
To run the IMBY tool the pre-programmed settings (a list and description of which can be found in
Appendix B) were used to determine the energy output for each system size in Tompkins County Over
the course of the year IMBY calculated that for each kW of installed capacity approximately 1100 kWh
of electricity are generated Table 6 shows the electricity generation potential for each system over the
course of a year
System Size 2 kW 4 kW 6 kW
kWh Generated 2200 4400 6600
Table 6 Yearly anticipated electricity generation for 3 different sized systems in Tompkins County
Average Residential Electricity Demand
According to the Tompkins County Community Greenhouse Gas Emissions Report 1998-2008 the county
used 293 million kWh of electricity for residential purposes in 2008 (TCPD) According to this same
report there were 37443 households at this time corresponding to an average residential electricity
usage of 7837 kWh per year
This is merely an approximation and every household is different but this number can be used to get a
reasonable estimate of the benefit of installing residential PV systems Table 7 shows the amount of
electricity that each size system would provide for the average household in the county Even the
smallest system would provide over one quarter of the total electricity needs for the average residence
in the County The size of each system would have to be determined by each individual homeowner
based on cost available area and desired amount of energy produced
23
Jul Jul Jul Jul Jul Jul Jul Jul
Jan 14 Jan 15 Jan 16 Jan 17 Jan 18 Jan 19 Jan 20 Jan 21
Avg Household Demand 7837 kWh
System Size 2 kW 4 kW 6 kW
kWh Generated 2200 4400 6600
of Avg Household Demand 28 56 84 Table 7 Yearly anticipated electricity generation for 3 different sized system in Tompkins County and the
percentage of electricity those systems would provide for the average household in the County
PV System Output
If the electricity output from the system were plotted over the course of a week it would look
something like Figure 17 This graph shows the hourly electricity production predicted by IMBY for a 4
kW system during a week in January and a week in July This graph shows the variability of generation
very well with the energy peaking during the day then returning to zero each night The January curve
shows how much more variable solar electricity will tend to be in the winter with cloudy days and not
much consistent sunshine The three days of July 24th-26th show what the energy profile would look like
during clear sunny days The other days however show how clouds and other weather patterns can
affect a PV system output
PV Generation Profile of a 4 kW System in Tompkins County
Po
we
r G
en
era
ted
(kW
)
35
3
25
2
15
1
05
0
January
July
Jan 14 Jan 15 Jan 16 Jan 17 Jan 18 Jan 19 Jan 20
Jul 23 Jul 24 Jul 25 Jul 26 Jul 27 Jul 28 Jul 29
Figure 17 Hourly electricity generation of a 4 kW system in Tompkins County during 1 week in July July 24th-26th
show the energy profile of nice sunny days while the other days show how variable the energy production can be
when clouds or other weather patterns affect the amount of sunlight hitting the array
The total amount of energy generated by this system during this particular time frame would be
represented by the ldquoarea under the curverdquo of the generation profile Since the area under the curve
during July is greater than in January it is easy to see that the system will generate more electricity in
July For a monthly breakdown of the predicted amount of energy generated for a 4 kW system see
Figure 18 below As expected the energy produced peaks during the summer months and declines
24
during the winter Overall this system generates approximately 4400 kWh of energy during the course
of the year
Figure 18 Total energy produced per month Energy production peaks during the summer and tails off during the
winter
Tompkins County PV Potential
The overall PV potential for the county was broken down by sector into commercial industrial
educational and residential buildings Commercial and industrial potentials are discussed first as they
are relatively simple to calculate followed by schools and residential buildings for which PV potentials
are difficult to assess To calculate the PV potential of each sector the ldquoinstalled capacity potentialrdquo was
determined which refers to the amount of area that would be suitable for PV arrays and the resulting
kW value of panels that could be installed The installed capacity potential was then converted to an
anticipated potential electricity generation by multiplying the installed capacity potential by the 1100
kWh per installed kW value generated by IMBY From there the anticipated electricity generation
potential was related to each sectorrsquos electricity demand in order to determine the total impact
photovoltaics can make on electricity supply within the county
Commercial Potential
The main limiting factor in determining the potential size of a commercial system is roof area (although
the added weight of the panels could cause some structural issues this analysis will assume that the
buildings are structurally capable of supporting PV panels) In order to assess the commercial potential
roof area data was obtained from the Tompkins County Planning Department by way of the County
Assessment Department According to the data there are 2118 commercial buildings in the county
which range in size from hundreds of thousands of square feet for large stores and malls to hundreds of
25
square feet for smaller business buildings Some of these buildings would not be suitable for solar
panels because of their small size oddly shaped roofs andor potential shading obstructions However
a significant amount of energy can be generated from commercial PV with just a few of the largest
buildings
Table 8 below shows the roof area of the 10 largest commercial buildings within the county as well as
the cumulative county commercial building roof area The installed capacity potential is presented in
the ldquoInstalled Potentialrdquo column assuming the entire roof is covered with 120 ft2kW arrays which is
the roof area required for the planned Solar Liberty PV systems on Tompkins County Municipal Buildings
(see Solar Liberty Lease Program on page 49 for more information) The ldquonnual Energy Potentialrdquo
column represents the expected energy that could be generated from the installed capacity which was
calculated by IMBY to be approximately 1100 kWh per installed kW
The following two examples illustrate how the ldquoInstalled Potentialrdquo and ldquonnual Energy Potentialrdquo
columns were calculated for the Ithaca Mall
Installed Potential
Annual Energy Potential
It should be noted that these annual energy potential values represent the anticipated energy production for the
first year only Due to degradation of the panels over time (see Panel Degradation on page 14) the PV system
output may slowly decrease
26
Building Area (ft2) Installed Potential
(kW)
Annual Energy Potential
(million kWh)
1 Ithaca Mall 575559 4796 528
2 Cayuga Mall 211315 1761 194
3 Home Depot 198220 1652 182
4 Lowes 188861 1574 173
5 Triphammer Mall 173081 1442 159
6 Walmart 156883 1307 144
7 Tops Plaza 124966 1041 115
8 Wegmans 122195 1018 112
9 East Hill Plaza 117451 979 108
10 Big K-Mart 112934 941 104
Total (Top-10) 1981463 16512 182
Total (Entire County) 10273216 85610 942
Percent of 200 Commercial El8 ectricity Demand 27 Table 8 Footprint of the 10 largest commercial buildings in the County and the PV generation potential based on
120 ft2 per kW installed and 1100 kWh of electricity per kW installed ldquoPercent of 2008 Sector Electricity Demandrdquo
represents the Entire County Annual Energy Potential as a share of electricity demand in the commercialschools
sector An asterisk indicates that the building is currently vacant
It is unlikely that every square inch of a buildingrsquos roof can be covered with solar panels as obstructions
such as AC units and other rooftop devices will limit the available roof surface area In addition roofs
need to provide adequate space for maintenance staff so they can maintain the panels andor other
components of the building However the assumption that the roof is completely covered should
provide a reasonable estimate within an order of magnitude of the installed capacity potential of these
buildings Appendix C provides satellite images of the 10 largest commercial buildings in the county
Fortunately most of the buildings have flat relatively unobstructed roofs which would be ideal for solar
PV systems
To illustrate the potential of the largest commercial buildings within the county Figure 19 shows the
cumulative PV electricity potential for all 2118 commercial buildings in the county The size of the
buildings is decreasing to the right meaning the largest buildings in the county are at the leftmost
portion of the chart The top 10 largest buildings in the county have the ability to cover nearly 20 of
the electricity potential at 182 million kWh The chart also shows that half of the commercial electricity
potential for the county (473 million kWh) can be provided with less than 10 of the buildings (180
buildings) Finally the largest 50 of buildings in the county represent roughly 87 of the potential
installed capacity (825 million kWh)
According to the Tompkins County Community Greenhouse Gas Emissions Report 1998-2008 total
electricity demand in the commercialschools sector in 2008 was 348 million kWh If the full potential of
commercial buildings were to be reached the buildings could produce around 27 of the sectorrsquos
electricity with photovoltaics
27
P
V E
lect
rici
ty P
ote
nti
al (
mill
ion
kW
h)
Commercial PV Electricity Potential 95 million kWh
100 90
90 80
80 70
70 60
60 50
50 4040
3030
2020
10 10
0 0
0 500 1000 1500 2000
0 20 40 60 80 100 Largest Smallest Number of Commercial Buildings
Figure 19 Cumulative potential installed capacity of commercial PV as a function of the number of buildings The
size of the buildings is decreasing to the right meaning the largest buildings in the county are on the far left of the
graph
Industrial Potential
The industrial potential was determined using the same method as the commercial potential In the
county there are 232 industrial buildings with a total PV electricity potential of around 245 million
kWh Table 9 shows the 10 largest industrial buildings in the county as well as the overall industrial PV
potential
28
Building Area (ft2) Installed
Potential (kW)
Annual Energy Potential
(million kWh)
1 Borg Warner 552395 4603 528
2 Morse ChainEmerson Power Transmission Site 278409 2320 194
3 Borg Warner 227005 1892 182
4 Vanguard Printing 176082 1467 173
5 South Hill Business Campus 136574 1138 159
6 Morse ChainEmerson Power Transmission Site 106979 891 144
7 Cargill De-Icing Technology 87079 726 115
8 TransAct Technologies 75239 627 112
9 Therm Incorporated 73091 609 108
10 Cargill De-Icing Technology 63659 530 104
Total (Top-10) 1776511 14804 163
Total (Entire County) 2671386 22262 245
Percent of 2008 Industrial Electricity Demand 17 Table 9 Footprint of the 10 largest industrial buildings in the County and the PV generation potential based on 120
ft2 per kW installed and 1100 kWh of electricity per kW installed ldquoPercent of 2008 Sector Electricity Demandrdquo
represents the Entire County Annual Energy Potential as a share of electricity demand in the industrial sector An
asterisk indicates that the building is currently vacant
Similar to the commercial potential the majority of the industrial PV potential can be met with just the
largest buildings Figure 20 shows the cumulative PV electricity potential of all 232 industrial buildings
in the county Once again the size of the buildings is decreasing to the right meaning the largest
buildings in the county are at the very left of the chart The top 10 buildings in the county account for
roughly 67 of the potential PV energy or 163 million kWh The chart also shows that half of the
installed capacity potential for the county (121 million kWh) can be reached with only the 5 largest
buildings Furthermore the largest 50 of buildings in the county represent roughly essentially all of
the potential installed capacity
According to the Tompkins County Community Greenhouse Gas Emissions Report 1998-2008 total
electricity demand in the industrial sector in 2008 was 138 million kWh If the full potential of industrial
buildings were to be reached they could produce around 17 of their own electricity with
photovoltaics
29
P
V E
lect
rici
ty P
ote
nti
al (
mill
ion
kW
h)
Industrial PV Electricity Potential 24 million kWh
100
90
2080
70
1560
50
40 10
30
20 5
10
0 0
0 50 100 150 200
0 20 40 60 80 100
Largest Number of Industrial Buildings Smallest
Figure 20 Cumulative potential installed capacity of industrial PV as a function of the number of buildings The
size of the buildings is decreasing to the right meaning the largest buildings in the county are on the far left of the
graph
School Building Potential
Since Tompkins County is home to a number of large educational buildings a similar approach was
applied to the largest school buildings in the County Table 10 shows the 10 largest school buildings in
Tompkins County and their roof areas These buildings have many more obstructions and odd contours
than the commercial buildings and are therefore less ideal for solar installations Nonetheless they still
offer a large amount of space for installing solar panels The values in the ldquopercent availablerdquo column
indicate roughly what percentage of the roofs would be usable for solar panels using aerial images
Appendix D shows the aerial images that were used to make these estimates
30
Building Area (ft2) Percent
Available Installed Potential
Available (kW)
Annual Energy Potential
(million kWh)
Ithaca High School 1 222484 70 1298 143
Dryden High School 2 179743 50 749 0824
TC3
Cornell Vet School
3
4
157088
138050
70
50
916
575
100
0633
Charles O Dickerson High School 5 116211 80 775 0852
Groton Elementary School 6 96574 90 724 0797
Duffield Hall (Cornell)
Barton Hall (Cornell)
7
8
94771
91762
20
50
158
382
0174
0421
Bartels Field House (Cornell) 9 90568 90 679 0747
Boynton Middle School 10 89901 60 450 0494
Total (Top-10) 1212337 6706 738
Total (Entire County) 9422465 ~50 39260 432
Percent of 2008 CommercialSchools Electricity Demand 13 Table 10 Footprint of the 10 largest commercial buildings in the County and the PV generation potential based on
120 ft2 per kW installed and 1100 kWh of electricity per kW installed ldquoPercent availablerdquo was estimated from
satellite images of the 10 largest buildings and assumed to be 50 for the entire county estimate ldquoPercent of
2008 Sector Electricity Demandrdquo represents the Entire County Annual Energy Potential as a share of electricity
demand in the commercialschools sector
Since school buildings have less ideal roofs for solar systems than either commercial or industrial
systems it is difficult to estimate the overall potential for the county like in the commercial and
industrial cases Assuming that 50 of the total school roof area in the county is usable for PV systems
the total installed capacity should be almost 40 MW (Figure 21) resulting in 43 million kWh of PV
electricity
31
P
V E
lect
rici
ty P
ote
nti
al (
mill
ion
kW
h)
School Building PV Electricity Potential 43 million kWh
100
4090
3580
70 30
60 25
50 20
40 15
30 10
20
510
0 0
0 200 400 600 800
0 20 40 60 80 100
Largest Number of School Buildings Smallest
Figure 21 Cumulative potential installed capacity of school building PV as a function of the number of buildings
The size of the buildings is decreasing to the right meaning the largest buildings in the county are on the far left of
the graph
Residential Potential
Since there are so many variables involved with installing solar energy systems on homes it is difficult to
estimate the overall residential potential for the county Not every house has an ideal roof for solar
panels due to a wide range of factors including limited roof area roof obstructions or shading issues
Nevertheless it is possible to estimate the energy potential of residential PV systems within the county
when operating under a few calculated assumptions
Number of Homes
Tompkins County Housing Units in Structures of 1-9 Units in Size
Urban 8797 housing units
Rural 16249 housing units
Total 25046 housing units
Katherine Borgella Principal Planner with the Tompkins County Planning Department issued the
following statement regarding the number of homes in the county
32
ldquoThese data were calculated by the Tompkins County Planning Department using US Census 2006-2010
American Community Survey 5-Year Estimates Figures were determined by allocating housing units per
structure to determine an estimated number of housing structures in Tompkins County as follows
1 unit (attached or detached) = 1 structure
2 unitsstructure = total units reported divided by 2
3-4 unitsstructure = total units reported divided by 35
5-9 unitsstructure = total units reported divided by 7
ldquoThis essentially is dividing the number of housing units located in 1-9 unit size range structures by the
average of the unit range as presented in the American Community Survey For example in the City of
Ithaca there are 1881 housing units in structures of 5-9 units in size In order to estimate the number of
structures that contain those housing units 1881 was divided by 7 Multi-unit structures that include 3-
9 housing units were considered with this analysis because it was assumed that these structures were
likely to be built in a similar fashion and have similar potential roof area for solar PV as 1-2 unit
structures
ldquoThis methodology omits 4695 multi-unit (those that include 10+ units) housing that will need to be
evaluated in the future likely by identifying solar-appropriate roof area potential in a manner similar to
this reports work on commercial sites Furthermore 3993 mobile home units were not included in the
analysis They may be evaluated for community or joint-ownership opportunities for solar potential in
the futurerdquo
Number of Homes with PV Potential
Art Weaver CEO of Ithaca based Renovus Energy estimates that of these 25046 homes about 80
(20037) have the potential for solar energy systems (Weaver 2012) The other 20 are impractical for
solar system use due to shading issues of nearby trees or buildings or inadequate roof or land area It
will be assumed that homes in rural areas have enough open space to install either a roof mounted or
ground mounted system and that all of the unsuitable homes are located in urban areas Given this
assumption there are 3788 urban households and 16249 rural households that are suitable for
installing a solar PV system Table 11 below shows the number of households in urban and rural areas
in the county overall versus the number of households that would benefit from solar energy systems
based on rt Weaverrsquos 80 estimation
TC Housing units 80 Scenario
Urban 8797 Urban 3788
Rural 16249 Rural 16249
Total 25046 Total 20037
Table 11 Number of households in Tompkins ounty in urban and rural areas ldquo80 Scenariordquo refers to the
estimate that 80 of the households in the county have the potential for PV systems It is assumed that all rural
33
households have enough area to install PV systems so the only homes in the county that are excluded are in urban
areas due to closely spaced houses limited roof area and numerous trees that could cause shading
PV Potential Calculations
As previously mentioned the county used 293 million kWh of electricity for residential purposes in 2008
(TCPD) Since IMBY calculated around 1100 kWh of electricity should be produced for every kW of
installed capacity the hypothetical installation capacity required to meet this entire demand would be
Since this value of 266000 kW (266 MW) is such a large number the county should make a point to
encourage energy efficiency in conjunction with renewable energy investment in order to lessen the
overall energy burden of the county Because energy efficiency is outside the scope of this report the
current energy usage patterns will be analyzed which could hopefully improve in the future with more
energy efficient buildings and appliances
To hypothetically meet the entire residential electricity demand from 2008 with photovoltaics every
house in the county would need to install a 133 kW system
This is an extremely large system that would generate about twice as much electricity as the average
Tompkins County household would require Since it is unlikely that 100 of the countyrsquos residential
electricity demand will be met with photovoltaics a few more assumptions will be applied to the
analysis as described below
Urban Systems
The current average size of a PV system in the downtown Ithaca area with closely spaced houses and
numerous trees is 3 kW (PowerClerk) Using the previous assumption that there are 3788 urban
households with the potential for PV systems and the average 3 kW installed system for each home the
urban residential installed capacity would be around 11000 kW (11 MW)
Rural Systems
In contrast to urban households rural homes tend to have much more roof andor land area upon
which to install a PV system Rural areas are typically unencumbered by shading obstructions and
should have enough roof or land area to install a system large enough to meet the majority of their
electricity demands Given that a 7 kW system will provide nearly 100 of the average Tompkins
ounty householdrsquos electricity it will be assumed that every rural household in the county has the
potential to install a 7 kW system As such this would result in a rural installed capacity of 113000 kW
(113 MW) and a total residential capacity of 136000 kW (136 MW) as shown below in Table 12 This
34
would result in an annual photovoltaic electricity generation of approximately 136 million kWh or
roughly 46 of total residential demand
Urban Rural
Homes 3788 16249
Avg system size (kW) 3 7
Total Installed Capacity (MW) 11 113
Energy potential (kWh) 12 million 124 million
Total Potential Energy (kWh) 136 million
of Total Demand 46
Table 12 Installed capacity and total energy generation potential of Tompkins County residential solar PV given
an average size of 3 kW for urban systems and 7 kW for rural systems Energy Potential was calculated based on
1100 kWh of electricity for every kW of installed PV capacity These are very rough estimates of the potential and
are likely best case scenarios that can only be achieved with large scale community participation and involvement
Once again this is only a potential estimate and is not a prediction of the amount of residential PV that
will be installed within the county The actual number and scale of residential PV systems installed
within the county will likely be less than the estimates but this can be seen as an upper-bound
potential Nevertheless this should be seen as an encouraging sign that Tompkins County could
potentially supply almost half of its residential electricity with solar energy If homeowners within the
county invest in supplemental energy efficiency measures it does not seem outlandish to think that half
of the countyrsquos residential electricity can be produced using photovoltaics
Total Photovoltaic Potential
Compiling all of the potentials from each sector Table 13 shows the installed capacity potential and
expected energy potential for the entire county As can be seen from the table below nearly 40 of the
countyrsquos electricity demand could be met with photovoltaics assuming large scale community
involvement and participation If these efforts are met with improved energy efficiency measures the
share of electricity produced from photovoltaics could potentially be even higher
Photovoltaic Potentials by Sector Capacity Potential
(MW) Energy Potential (million kWh)
Percent of Electricity Demand
Commercial 86 95 27
Industrial 22 24 17
Schools 39 43 13
Residential 124 136 46
Total 271 298 38 Table 13 Upper limit photovoltaic potentials by sector Nearly 40 of the countyrsquos electricity needs can be met
with photovoltaics Combined with improved energy efficiency this value could even be higher
35
Solar System Costs
Module Prices
The biggest reason for the recent precipitous drop in solar PV costs is the falling price of silicon and
silicon based modules As can be seen in Figure 22 the price of PV modules has fallen over 50 since
2009 This has put tremendous stress on PV manufacturers but has been a boon for PV installers as well
as home and business owners who wish to install PV systems A few module price statistics are shown
below in Table 14 which is the result of a survey 1000 PV companies in March 2012 Currently there
are 329 available solar modules that are less than $2 per watt a price that is getting close to fossil fuel
grid parity (which is discussed further in the Grid Parity of Solar PV section on page 46) (Solarbuzz 2011)
Furthermore Ernst amp Young analysts predict that the price decline will continue through 2012 with the
potential for modules to drop to the $070 per watt range (Ernst amp Young 2012)
Figure 22 Historical price of solar modules Module price has dropped by more than 50 in the last 10 years
Current Module Prices (per Wp)
Average Price $229
of prices below $2Wp 329
Lowest mono-cSi price $110
Lowest poly-cSi price $106
Lowest Thin Film price $084
Table 14 PV module price data from a survey of 975 companies in March 2012 It should be noted that these are
prices for just the modules and is only a portion of the total installed system cost Source Solarbuzzcom
36
Installed System Prices
While the solar panels themselves actually turn the sunlight into electricity there are a number of other
costs that go into installing a photovoltaic system In addition to the cost of the modules are the cost of
the inverter balance of system (BOS) costs ie all of the mounting and other equipment that goes along
with installing the modules installation costs and ldquootherrdquo costs such as site evaluations tax or
regulatory work and any other expenses that go along with installing a PV system
Figure 23 shows the cost breakdown of a solar PV system by component in 2005 and 2012 The 2005
chart shows that the cost of the modules accounts for over 50 of the cost of a PV system In
comparison the relative cost of modules in 2012 dropped to 41 of the total cost of the system This is
due to the previously mentioned rapidly falling price of modules All other system costs are relatively
stable and have only decreased a small percentage as compared to module price In terms of overall
cost the 2011 system is 25 less expensive than the 2005 system
55
10
9
9
17
Cost of PV System 2005
Modules
Inverter
BOS
Installation
Other
Price per Watt $773
41
13 11
11
24
Cost of PV System 2012
Modules
Inverter
BOS
Installation
Other
Price per Watt $554
Figure 23 Cost breakdown of a PV system by components 2005 chart comes from lecture slides of Tobias
Hanrath PhD Cornell University 2012 chart was developed using the change in module pricing shown in Figure
22 to determine the approximate cost of modules today All other variables were held constant
Ernst and Young tabulated the average PV system price by sector from 2010-2011 which is shown
below in Figure 24 Each bar represents a quarter of the year and each grouping of bars represents a
different end use segment The first two groupings residential and commercial are of interest to this
report as utility scale PV solar farms are more suited to high-grade solar climates such as Arizona and
Nevada Looking at the residential segment the average installed price per watt has decreased by
nearly $1 in just the past two years At the end of 2011 the average residential system installed price
was $618W with a range of about $450W to $800W The commercial segment shows economies
of scale as the average price of this segments is $492W ranging from about $325W to nearly
$800W
37
Figure 24 Average of installed system PV prices for 2010-2011 Average prices are broken down by end use sector
and by quarter The residential and commercial segments are of particular interest as utility scale PV investment is
unlikely due to the lower-grade solar resource The dashed line represents the range of prices during the fourth
quarter of 2011
Tompkins County System Prices
Of the 192 PV systems in Tompkins County 170 are residential with an average size of 49 kW and an
average price of $811W (PowerClerk) This is a relatively high price compared to current installations
but systems installed in 2011 had an average price of $663W slightly higher than the average shown
above The 3 systems approved for installation already during 2012 have an average price of $599W
which is slightly below the average Q4 2011 price (PowerClerk)
In addition to the 170 residential systems there are 22 commercialindustrial systems with an average
size of 18 kW and an average price of $606W Once again economies of scale allow for a lower price
of larger commercial installations as compared to residential systems During 2011 there were 10
commercialindustrial systems installed with an average price of $555W (PowerClerk) This is slightly
above the average value of $492 but well within the reported price range
PV System Net Cost Breakdown
Ithaca based Renovus Energy provides a chart on their website displaying rough estimates of the costs
and incentives for a few different sized systems and mounting styles (roof or ground) This table has
been updated to take into account the recent drop in PV prices and can be seen in Table 15 These
values are only rough approximations as every case is different These numbers can be used as a rule of
thumb however and should provide a reasonable ldquoballparkrdquo estimate of the initial up front cost facing a
38
homeowner wishing to install a PV system The estimated installed cost per watt of each size for a roof
mounted system is $7 $6 and $5 per watt for the 2 kW 4 kW and 6 kW systems respectively The
ground mounted systems are slightly higher at $750 $650 and $550 per watt Since PV systems are
not a ldquouniform commodityrdquo is difficult to determine with certainty an installed price per kW as
individual circumstances always have some sort of influence on the price (Vanek 2012)
System Size
Mount Style
Gross Cost
NYSERDA Incentive
NYS Tax Credit
Fed Tax Credit
Total Incentives
Net Cost
2 kW Roof $14000 -$3000 -$2750 -$3300 -$9050 $4950
Ground $15000 -$3000 -$3000 -$3600 -$9600 $5400
4 kW Roof $24000 -$6000 -$4500 -$5400 -$15900 $8100
Ground $26000 -$6000 -$5000 -$6000 -$17000 $9000
6 kW Roof $30000 -$9000 -$5000 -$6300 -$20300 $9700
Ground $33000 -$9000 -$5000 -$7200 -$21200 $11800
Table 15 Costs and incentives of various sized systems and mounting styles from the Renovus Energy website
updated for decreased cost of photovoltaics These numbers are only rough estimates and should only be used as a
rule of thumb as every situation will be different Detailed descriptions of the incentives are given in the PV
Financial Programs and Incentives section
As can be seen from the above table there are a number of financial incentives that can alleviate the
cost burden to homeowners who wish to install PV systems The details of the incentives are discussed
in depth below in the PV Financial Programs and Incentives on page 40
Table 16 below shows the expected energy savings of each system given a PV electricity production of
1100 kWh per installed kW and a residential electricity price of 14₵kWh ldquoSimple Payback Timerdquo refers
to how long it will take for the energy savings to pay for the system at which point the system will
actually begin making money for a homeowner This calculation uses the costs for roof mounted
systems in Table 15 and no interest rate An example calculation of a 2 kW system is shown below
System Size
of Average Household Electricity Demand
Annual Electricity Savings
Simple Payback Time (years)
2 kW 28 $308 16
4 kW 55 $616 13
6 kW 83 $924 11
Table 16 Annual energy savings for each system size based on an average of 1100 kWh per installed kW of
capacity and an electricity rate of 14₵kWh Simple payback time is an approximation of the time for the electricity
savings to pay for the system assuming roof mounted systems from Table 15 and no interest rate
Net Metering
Since 1997 New York State has offered net metering for residential photovoltaic systems (DSIRE New
York ndash Net Metering) This means that homeowners will only be charged for the net amount of
electricity consumed ie total electricity consumed minus solar electricity produced In the above
39
example for a 4 kW system the net amount of energy that the homeowner pays for during the year
would be 3496 kWh (7837 kWh consumed ndash 4341 kWh solar electricity produced) Any situation
where PV electricity exceeds demand will be carried over month to month
If there is still excess at the end of the year however the excess will be bought back at the wholesale
rate which is typically much lower than the retail rate that the customer pays As such it makes the
most economic sense to have a system that provides less electricity than the home or business uses
over the course of a year as any excess will be sold back at a much lower price
PV Financial Programs and Incentives
Traditional Financing Arrangements
Historically homeowners who wished to install PV systems on new homes have used home equity loans
mortgage loans or cash to pay for the leftover sum after federal state and utility incentives were
applied One benefit of using a home equity loan or a refinanced mortgage loan is that interest paid on
these loans may be tax deductible Much like other home improvements home owners can draw on
standard home equity lines of credit take out a home equity loan or take cash out of a home mortgage
refinance to help pay for the cost of their PV system The primary determinants of the amount of
money that can be borrowed are the equity value of the home combined with the credit score of the
homeowner (Coughlin and Cory 2009)
Alternative Financing Arrangements
In addition to the traditional financing arrangements mentioned there exist a few newer financial
models that can help lower the financial burden of a residential PV system Not all of these options are
available in New York State (I donrsquot think I will inquire with the contact I made at NYSERD) but they
are options that the state and county could look into in the future
Third Party Ownership Models
These are financing arrangements such as solar leases and residential power purchase agreements (PPA)
can take advantage of commercial tax benefits and reduce the up-front costs to the homeowner while
also relieving the homeowner of maintenance responsibilities In a solar lease program the homeowner
does not purchase the system instead they enter into a contract with the PV installer to make monthly
lease payments over a specified period of time At the end of the lease there may be a purchase
option whereby the homeowner can purchase the system Alternatively the homeowner may be able
to extend the lease or have the system removed at the end of the lease Leases may involve the PV
installer guaranteeing maintenance over the course of the lease relieving the homeowner of any
maintenance responsibilities (Coughlin and Cory 2009) This model could help homeowners who desire
a PV system but are intimidated by the large up-front costs
A PPA is an attractive model for large PV systems in the commercial and public sector and has begun to
work its way to residential customers as well Similar to a solar lease program a PPA takes advantage of
40
the federal PV tax incentives available to non-residential owners since the PV installer will own the
system The PV installer agrees to purchase install own operate and maintain the PV system while
the homeowner simply agrees to host the system The homeowner and PV installer will then agree on a
price the homeowner will pay the installer for the electricity that is produced from the system Once
again this relieves the homeowner of the large up-front cost of a PV system as well as the operation and
maintenance responsibilities At the end of the PPA the homeowner may elect to renew the contract
purchase the system or have the system removed As the PPA model is new however there may be
other end-of-term options that develop moving forward as the market matures (Coughlin and Cory
2009)
Property Tax Assessment Model
This model is being piloted in Berkeley California Palm Desert California and Boulder Colorado and
addresses two of the major barriers associated with residential PV systems high up-front cost and the
difficulty of recouping a 20-year investment when the homeowner may have moved in that time frame
The model involves loans made by a city to homeowners to purchase and install PV systems
The city raises the money for the program by issuing long-term bonds (Berkeley and Boulder) or tapping
into the cityrsquos general fund (Palm Desert) The city then makes loans to homeowners to finance the
installation of PV systems which are paid back over a long period of time (20 years in the case of
Berkeley) via a special property tax assessment that is collected annually or semi-annually The only upshy
front cost is a small administrative cost of entering into the agreement In addition if the homeowner
decides to sell the home before the term of the agreement is up the PV system and associated special
property tax remains with the house In this instance the homeowner only pays the associated tax
while living in the house and when the home is sold the new homeowner assumes the cost of the
system until the tax assessment is paid off or they move (Coughlin and Cory 2009)
Solar Renewable Energy Certificates
Solar Renewable Energy Certificates (SRECs) represent the environmental benefits of electricity being
produced from a PV system New Jersey is one state that has been utilizing this model through its
Renewable Portfolio Standard (RPS) One of its utilities PSEampG has declared that it will comply with the
statersquos RPS through obtaining SRECs through a new solar loan program The loan size for a PV system is
based on the expected total generation of SREs over the course of the systemrsquos life so that the revenue
from SREC sales closely matches the loan payments The homeowner agrees to sell all SRECs generated
by their system which would be supplemented by cash payments if the PV system does not generate
the expected SRECs
NYSERDA Renewable Portfolio Standard
In 2004 the New York State Public Service Commission issued an order adopting a Renewable Portfolio
Standard (RPS) with the goal of increasing the percentage of renewable energy used in the state to 25
by 2013 As part of the plan the Commission appointed NYSERDA the administrator for the RPS
41
program In 2009 the Commission undertook mid-course review of the RPS program and expanded the
RPS goal to 30 renewables by 2015 (NYSERDA)
The RPS energy targets fall into three different groups Main Tier Generators large scale generators
that sell power to the wholesale grid Customer Sited Tier small scale distributed generators and Other
Market Activites individuals and businesses that choose to pay a premium on their electricity bills to
support renewable energy development This report will focus on the Customer Sited Tier (CST) which
was updated in April 2010 to include more ambitious goals for energy generation The CST portion of
the RPS actively supports enrollment in programs for photovoltaic systems supported by the NYSERDA
Solar PV Incentive Program (NYSERDA)
NYSERDA Incentive
The main incentive Program Opportunity Notice 2112 (PON 2112) provides cash incentives of $150 per
watt to help reduce the costs of installation of grid-connected PV systems 7 kW and smaller As a
reference NYSERDA determined that a 2 kW system provides about 20-30 of an average homersquos
energy needs which is consistent with previously calculated average Tompkins County household
percentage of 28 As of April 2012 PON 2112 has $132 million available and will be accepting
applications on a first-come first-served basis until December 31 2015 or until the funds are fully
committed whichever comes sooner ustomers must purchase their PV systems from an ldquoEligible
Installerrdquo that has demonstrated technical competence in the field of photovoltaic systems Incentives
are paid directly to the Eligible Installer but must be passed on to the consumer Incentives are capped
based on a PV system size that does not exceed 110 of the previous 12 monthrsquos energy usage In
general incentives cover 25-35 of the overall costs of installation but not more than 40 after all tax
credits are applied (NYSERDA)
The full description of the program can be found here httpwwwnyserdanygovFundingshy
OpportunitiesCurrent-Funding-OpportunitiesPON-2112-Solar-PV-Program-Financialshy
Incentivesaspxsc_database=web
New York State Tax Credits
In addition to direct incentives there are also tax credits and incentives that can be applied to
residential solar systems Since tax issues can become very complicated only a basic overview of the tax
opportunities available will be presented New York State offers a tax credit of 25 of the system
expenditures (after incentives have been applied) capped at $5000 The system must be grid-tied and
net metered and any excess credits can be carried forward five years (DSIRE Residental Solar Tax
Credit)
The full statute can be found here httpwwwdsireusaorgdocumentsIncentivesNY03Fhtm
New York State also recognizes that a PV system may increase the value of a property If the municipal
assessorrsquos office determines that it does this would increase the homeownerrsquos property tax burden As
such the state provides 15 year property tax exemptions for systems purchased and installed before
42
January 1 2015 The total amount of the exemption is equal to the increase in assessed value
attributable to the solar system (DSIRE Local Option)
The full statute can be found here httpwwwdsireusaorgdocumentsIncentivesNY07Fhtm
A property tax exemption handbook can be found here
httpwwwdsireusaorgdocumentsIncentivesNY07Fbpdf
Federal Tax Credits
Finally the federal government also offers a tax credit of 30 for residential PV systems Due to
recently passed legislation there is now no cap on the amount that may be claimed The tax credit is
calculated from the net cost of the system after any direct incentives such as the NYSERDA incentive
which are not federally taxable (Boler 2012)
The full statute can be found here httpwwwdsireusaorgdocumentsIncentivesUS37F1pdf
The application for the tax credit (Federal tax form 5695) can be found here httpwwwirsgovpubirsshy
pdff5695pdf
There is a degree to subtlety to the federal tax credit though because it is only a credit against federal
taxes owed It is not a line item deduction to lower a homeownerrsquos tax liability nor an automatic refund
from the government The homeowner must owe federal taxes and the tax credit is simply carved out
of that If the tax credit is larger than the homeownerrsquos federal tax burden for the year the remaining
balance may be rolled over one more year but no more (Gordon 2010) So if for example a
homeowner owes $5000 in federal taxes in the two years following the installation of a PV system and
the federal tax credit comes to $6000 then the homeowner will have lost that extra $1000 credit This
is why it is imperative for homeowners to speak with tax professionals before committing to a PV
system to ensure they are receiving the full benefit
As mentioned before there is also a ldquoFederal Tax Increaserdquo that goes along with installing a PV system
This essentially negates part of the state tax credit because the state credit will likely increase the
homeownerrsquos federal tax liability due to a higher reported income This could cause the homeowner to
fall into a different tax bracket and pay more because of it (Boler 2012) Since this is such a complicated
issue and unique to each individual it is omitted from the previous calculations of net cost in Table 15
Furthermore every home or business owner should talk to his or her accountant before installing a
photovoltaic system to ensure the incentives are calculated properly
NYSERDA Clean Power Estimator
Since every situation is different and there are an endless amount of different variables that can
influence the cost performance and selection of a PV system NYSERDA has developed an online
calculator called the Clean Power Estimator to help home and business owners decide if a PV system is
right for them
43
The estimator can be found here httpnyserdacleanpowerestimatorcomnyserdahtm
With the Clean Power Estimator a home or business owner can input a variety of different variables
ranging from PV system specs to financial assumptions and tax considerations Figure 25 shows the
calculator with the default inputs for Ithaca and a system summary It shows a 4 kW system with an
overall cost before incentives of $24000 which is the same as a roof mounted system in the above
table Also the calculated annual electricity generation of 4304 kWh is close to the average estimate
used in this report of 4400 kWh The net cost is slightly different because of the ldquoTotal Federal Tax
Increaserdquo portion in the bottom right This is discussed above in the Federal Tax Credits section but
essentially this is dependent on the individual homeownerrsquos tax liability which will be different for each
situation
The Estimator allows individuals to tailor the PV system to their needs based on each home or
businessrsquos electricity usage and desired energy savings The tool allows for the adjustment of system
size tilt angle cost per watt and operation and maintenance costs among other things It also allows
the user to input a number of financial assumptions including the price of a typical electric bill how
much the user anticipates this price to increase and seven different methods of payment These
methods are pay cash new home loan refinance tax-deductible loan non-tax deductible loan lease
and power purchase agreement Each method has further settings that can be adjusted to better suit
each individual system
Once the Estimator has the required inputs it will calculate a system summary which includes a net cost
after benefits PV electricity production percentage of household electricity supplied by the PV system
and CO2 emission reduction In addition it shows internal rate of return net present value and years to
payback estimates This is a quick snapshot of the benefits of the system and can provide a quick
glimpse of what kind of investment a PV system would be given the selected parameters
The Estimator also includes more in depth tables in graphs which the user can click on and view It
allows users to see net cost for year 1 a monthly breakdown of the userrsquos electric bill and PV
generation a daily breakdown by month of both PV electricity production and net electricity usage four
different in-depth cash flow charts and a description of the PV systemrsquos environmental benefits and
pollution prevention Overall the Clean Power Estimator is a thorough easy to use tool that can offer a
great deal of insight to any home or business owner who is thinking about installing a PV system This
tool could be used as an educational instrument to show individuals the benefits of a PV system
installed at their home or place of business
44
Figure 25 NYSERDrsquos lean Power Estimator with default inputs for Ithaca and system summary
45
Grid Parity of Solar PV
Grid parity is a commonly used term within renewable energy circles and it refers to the time when the
lifetime cost of generating PV electricity is comparable to the cost of electricity from conventional
sources on the grid term called ldquolevelized cost of electricityrdquo (LOE) is used to relate costs on an
apples-to-apples basis between different energy sources The lower the LCOE the better so a main goal
of the solar industry is to lower the LCOE of solar energy equal to or below the LCOE of generating
electricity for the grid
If the total lifetime cost of generating electricity from a PV system is equal to the cost of receiving that
energy from the grid the system is said to have reached grid parity Solar systems in states with high
residential electricity prices (Hawaii 3621 ₵kWh Connecticut 1817 ₵kWh Alaska 1776 ₵kWh) will
reach grid parity much sooner than in states with low residential electricity prices (Idaho 745 ₵kWh
Louisiana 830 ₵kWh North Dakota ₵kWh) (EIA Electric Power Monthly) In this case the
homeowner is not only decreasing his or her carbon footprint but also saving money at the same time
It is easy to see why reaching grid parity has become a focus of many firms in the solar industry
A recent study has reviewed the LCOE of solar photovoltaics and has found that many of the
assumptions in previous LCOE calculations are outdated or incorrect They have found that PV has
reached a ldquotipping pointrdquo and that solar has gone past grid parity in some cases The study reviewed
over 40 PV LCOE calculations that have been done and analyzed the assumptions that were made as
well as their validity The LOE estimates ranged from a low of 62 ₵kWh to a high of 86 ₵kWh which
shows the large impact that different assumptions can have on these estimates (Branker Pathak and
Pearce 2011) The researchers were able to identify a few key parameters that affected every study
most notable being financing options module performance and module lifetime (Trabish 2011)
The study found that the largest and most important costs facing a homeowner are the upfront costs
and costs of financing They argue that policy and initiatives must be focused on these two areas in
order to make residential PV installations more affordable (Branker Pathak and Pearce 2011) Because
they found financing so crucial they posited that zero interest financing could be a more effective
incentive than a feed in tariff or tax credit Furthermore previous LCOE calculations are irrelevant to
todayrsquos systems because of the precipitous drop in module prices as well as decreasing BOS costs and
improvements along the supply chain and installation practices (Trabish 2011)
One widely held assumption about PV systems is related to the panelrsquos degradation over time It is
commonly assumed that a panel will lose about 1 of its efficiency per year (Note this does not mean
that a panel with 15 efficiency will be 0 efficient in 15 years It means that it will produce 85 of the
energy in year 15 as compared to year 1 ie reducing its overall efficiency to 1275) Branker Pathak
and Pearce found this assumption to be unreasonably conservative and suggested a degradation rate of
02 to 05 per year Even older panels produced in the 1980s have been shown to degrade slower
than the customary 1 mark and as technologies advance this rate should only decrease (Trabish
2011)
46
Finally the authors found that the common assumption of a 20 year panel lifetime was also too
conservative They assert that at least a 30 year lifetime should be used in predicting the economic
performance of a system If lending institutions correcting the aforementioned misguided assumptions
in PV financing arrangements they should be more willing to finance PV systems at more beneficial
terms (Trabish 2011)
County Municipal Solar Installations
Tompkins County Public Library
In January 2002 the Tompkins County Public Library (TCPL) began receiving electricity from a 147 kW
photovoltaic system on the roof of the library The system consists of 1430 modules and covers a
surface area of 17222 ft2 The system provides roughly 13 of the overall energy use of the library and
to date has produced 989000 kWh of energy enough to power 83 homes for a year (Sunpower) In
addition the system has reduced carbon dioxide emissions by 750 tons which is roughly equivalent to
driving 15 million miles in an average car (Sunpower)
The system was a result of a request by Tompkins County Legislator Dooley Kiefer who approached the
Tompkins County Engineering Division (which has now been incorporated into the Facilities Division) to
explore the possibilities of installing a PV system on the roof of library during renovation The
Engineering Division went out in search of firms to install a PV system who then selected a proposal
from Powerlight (now Sunpower) out of California to install the system The county wanted to maximize
the amount of energy available on top of the roof and Powerlight did all of the design and installation
(LeMaro 2012)
One of the challenges in designing the system was the structural limitations of the roof which couldnrsquot
support the added weight a tilted panel system Structural reinforcement would be needed to
accommodate a tilted array system but the PV design was performed late in the process of renovating
the library so reinforcing the libraryrsquos structure would have been time consuming and costly (LeMaro)
As such the panels lay flat on top of the roof which results in an overall reduction in output when
compared to a tilted system
A concern with the design of the system is the presence of the Holiday Inn hotel across the street
Figure 26 shows a picture taken from the roof of the hotel with the hotel shading a large portion of the
PV array Arel LeMaro the Tompkins County Facilities Director emphasized that the hotel has little to
no effect on the overall energy generation of the system A cursory analysis of the hourly electricity
generation data throughout the course of a year reveals that there is no significant drop in electricity
production in the afternoon when the system would be shaded by the hotel Although a rigorous
statistical analysis would be necessary to completely support this argument this brief analysis seems to
reinforce Mr LeMarorsquos claim that the hotel does not significantly harm the PV systemrsquos energy
generation
47
Figure 26 Photo of the Tompkins County Public Library taken from the roof of the Holiday Inn across the street
Notice the shadow of the hotel blocking a significant portion of the solar panels from sunlight This is a problem
that should have been foreseen and avoided
Another concern regarding the PV array was the construction of the Cayuga Street Parking Structure
Figure 27 shows an aerial view of the location of the PV array the Holiday Inn and the parking structure
When the PV system was installed the lot where the parking structure stands was only used as surface
parking A few years after the panels had been installed the city decided to turn the surface parking
into a garage There was concern that the parking facility would shade the panels but it has since been
determined that the structure had minimal impact on the amount of energy generated by the PV array
For the small impact that it does have on the array the County has worked out an arrangement with the
city whereby the city will pay the county some amount to compensate for shading which the county
then uses for additional energy improvement measures on the library (LeMaro 2012)
48
Figure 27 Aerial view of the TCPL PV array with the Holiday Inn and Cayuga Street Parking Garage and their
approximate distances from the array Both structures only contribute a minimum amount of shading to the array
and do not affect its output significantly
In terms of operation and maintenance the system has been quite reliable There were some issues
with the inverter soon after completion of the installation but these repairs were covered by
Powerlightrsquos warranty and were done free of charge The inverters were guaranteed for 10 years and
the panels themselves were guaranteed for 25 years The most significant although still minor
maintenance issue has been vandalism that has arisen since the construction of the Cayuga Street
Parking Garage People have thrown bottles and rocks off the garage and onto the library roof which
has necessitated the replacement about a dozen of the panels Another unexpected issue has been
vegetation growing up between the panels causing minor shading This has been especially challenging
because the vegetation needs to be removed by hand due to the libraryrsquos policy on herbicide use Since
the panels are too fragile to walk on maintenance workers need to crawl out on pads to remove the
weeds while protecting the integrity of the panels So far only 2 of the 1430 panels have been replaced
due to failure of the panels from normal operation
Solar Liberty Lease Program
Late in 2011 Tompkins County entered into a 15 year lease with Buffalo based Solar Liberty for the
installation and maintenance of seven solar PV systems on top of county owned buildings The county
49
took advantage of a lease program offered through Solar Liberty where federal tax credits and
NYSERD grants cover most of the $1 million price tag In this program the county doesnrsquot actually buy
the panels from Solar Liberty instead they lease them for 15 years at the end of which the county has
the option of removing the panels or buying them at current market value (DiPietro 2011)
The seven systems consist of 6-25 kW arrays and one 20 kW array The 25 kW arrays are limited by
NYSERDrsquos cap on government systems of 25 kW to be eligible for financial incentives while the 20 kW
system is limited by the roof area of the intended building In contrast to the TCPL system these
systems will be installed with a 10 tilt which will help capture more solar energy throughout the year
In addition the tilted panels would help reduce any snow accumulation as well as mitigate the problem
of vegetation experienced with the TCPL system
The leasing program is a novel solution to the problem of up-front costs of solar installations While the
Tompkins County Facilities Division was researching PV installers Solar Liberty was the only one they
found that offered this leasing program in New York State Solar Liberty performs all of the engineering
design from determining if the roofs are structurally capable to hold the arrays to siting the arrays to
ultimately installing and maintaining the arrays If the county opts to remove the arrays at the end of
the 15 year term Solar Liberty will also remove the panels and any other associated equipment (LeMaro
2012) If Solar Liberty determines that there needs to be structural reinforcement however the county
will have to pay for that itself (DiPietro 2011)
The most attractive aspect of the leasing program was the cost A single 25 kW system would most
likely cost the county $150-200 thousand to install while the county will be paying Solar Liberty a little
over $10 thousand per year for all seven systems Over the 15 year life of the lease the county will pay
roughly the same amount to lease 7 systems as it would pay to purchase one system Even Mr LeMaro
admits this sounded too good to be true but Solar Liberty is banking on the aforementioned tax credits
NYSERDA grants and the hope that the State of New York will implement a Renewable Energy Credit
system whereby they will be able to trade credits with other companies (LeMaro 2012)
Table 17 shows the specifications of each of the installations (a more detailed description of the Solar
Liberty specifications can be found in Appendix E) The annual payment column represents the lease
payment that the county will pay to Solar Liberty each year and the Annual Savings column represents
the monetary energy savings minus the annual lease payment ie the county will save $19474 in total
energy bills while lease payments will be $10260 for a total savings of $9214 Finally the offset
represents the amount of energy that will be saved for each building given its historical energy
consumption It should be noted that the offset is high for the Human Service Annex because it has
been vacant and has had low energy usage Once it is occupied it will likely similar to Annex Building C
(LeMaro 2012)
50
Table 17 System specifications and estimated costs of the seven PV arrays of the Solar Liberty lease program
Note human service annex has been vacant and therefore has had a low historical electricity load which is the
reason for the large offset value Table provided by Arel LeMaro from interview on 232012
If a worst case scenario were to happen and Solar Liberty were to become bankrupt county attorney
Jonathan Wood said that ldquoit would be a breach of the lease and Tompkins County has various options to
protect the countyrdquo (DiPietro 2011)
Conclusions
The research presented in this report shows that the solar energy potential in the county is significant
With large scale community involvement and investment the county could generate a sizable portion of
its electricity with photovoltaics especially if combined with improvements in energy efficiency Table
18 below shows the calculated PV potential by sector for the county and each sectorrsquos share of total
electricity demand
Photovoltaic Potentials by Sector Capacity Potential
(MW) Energy Potential (million kWh)
Percent of Electricity Demand
Commercial 86 95 27
Industrial 22 24 17
Schools 39 43 13
Residential 124 136 46
Total 271 298 38 Table 18 PV potential by sector ldquoPercent of Electricity Demandrdquo refers to the energy potential in relation to each
sectorrsquos 2008 electricity usage as stated in the Tompkins County Community Greenhouse Gas Emissions Report
1998-2008 It should be noted that the demand for commercial and school buildings are grouped together in the
Greenhouse Gas report In other words the 95 million kWh energy potential of commercial buildings alone could
account for 27 of both commercial and school building electricity usage
51
In order to reach the large scale levels of photovoltaic investment listed in the table above PV
technologies need to reach grid parity without financial subsidies or incentives For the time being
however a number of financial incentives exist to encourage solar energy investment NYSERDA offers
a direct financial incentive along with tax incentives from the state of New York and the Federal
government Alternative financing arrangements such as solar leases and power purchase agreements
are becoming more popular and some cities in the US have actually loaned money to residents to
purchase and install solar systems using a special property tax assessment to repay the loan
Every home and business owner should seriously consider installing a PV system and the In My
Backyard tool (page 22) and Clean Power Estimator (page 43) should provide sound technical and
financial information on what individuals can expect out of a PV system Individuals should consult a
qualified solar installer for a site evaluation and cost estimate before deciding to purchase a PV system
and contact an accountant to clarify any tax issues
Tompkins County itself has already taken steps toward meeting its aggressive climate goals with two
major solar energy projects The first was the installation of 147 kW of solar photovoltaic panels on the
roof of the public library and more recently the county has entered into an agreement with Solar
Liberty of Buffalo to install solar photovoltaic systems on top of 7 county buildings Community leaders
hope that these systems will help to reduce overall greenhouse gas emissions within the county and
provide an example of how solar energy can help individuals reduce their utility bills and minimize their
impact on the climate
52
References
Borgella Katie 2012 Personal communication via email on 272012
ranker K Pathak MJM and Pearce JM 2011 ldquo Review of Solar Photovoltaic Levelized ost of
Electricityrdquo Renewable and Sustainable Energy Reviews December 2011 15 (9)
CLS 335-b New York State Consolidated Law Service Real Property Law Statute 335-b Found online at
URL httpwwwdsireusaorgdocumentsIncentivesNY01Rhtm
artlidge Edwin 2007 ldquoright Outlook for Solar ellsrdquo Environmental Research Web URL
httpenvironmentalresearchweborgcwsarticlenews30489
leantech Investing 2009 ldquoSolarridge and PV Microinverter Reliabilityrdquo URL
httpwwwgreentechmediacomgreen-lightpostsolarbridge-and-pv-micro-inverter-reliability
olville Finlay 2012 ldquoNPD Solarbuzz- Top-10 PV cell producers in 2011rdquo PVTech URL httpwwwpvshy
techorgguest_blognpd_solarbuzz_top_10_pv_cell_producers_in_2011
oughlin Jason and ory Karlynn 2009 ldquoSolar Photovoltaic Financing Residential Sector Deploymentrdquo
NREL Technical Report NRELTP-6A2-44853 March 2009
DOE US Department of Energy 2005 ldquoasic Research Needs for Solar Energy Utilizationrdquo
DSIRE Database of State Incentives for Renewables amp Efficiency
---- ldquoLocal Option ndash Solar Wind amp iomass Energy Systems Exemptionrdquo URL
httpwwwdsireusaorgincentivesincentivecfmIncentive_Code=NY07Fampre=1ampee=1
---- ldquoNew York-Net Meteringrdquo URL
httpwwwdsireusaorgincentivesincentivecfmIncentive_Code=NY05RampRE=1ampEE=1
---- ldquoResidential Solar Tax reditrdquo URL
httpwwwdsireusaorgincentivesincentivecfmIncentive_Code=NY03Fampre=1ampee=1
---- ldquoSolar Easements amp Local Option Solar Rights Lawsrdquo URL
httpwwwdsireusaorgincentivesincentivecfmIncentive_Code=NY01Rampre=1ampee=1
Dankoff Windy and Schwartz Joe 2007 ldquosk the Experts PV Longevity amp Degradationrdquo Homepower
Magazine AprilMay 2007 118 p 12 URL
httphomepowercomarticlefile=HP118_pg12_AskTheExperts_1
DiPietro Louis 2011 ldquoTompkins ounty Preparing to dd Solar Panels to Seven uildingsrdquo Ithacacom
URL httpwwwithacacomnewsarticle_3cf741c2-25dd-11e1-9f1c-001871e3ce6chtmlusershy
comment-area
53
Dolan Kerry 2010 ldquoEnphasersquos Rooftop Solar Revolutionrdquo Forbes November 8 2010 URL
httpwwwforbescomforbes20101108technology-enphase-energy-solar-power-rooftopshy
revolutionhtml
EI US Energy Information dministration ldquoElectric Power Monthly Data for December 2011rdquo URL
http20525413524electricitymonthlyepm_table_graphercfmt=epmt_5_6_a
Enviroharvest ldquoPV Shadingrdquo URL httpwwwenviroharvestcapv_shadinghtm
Ernst amp Young 2012 ldquoUnited States Renewable Energy ttractiveness Indicesrdquo February 2012 URL
httpwwweycomPublicationvwLUAssetsUS_Attractiveness_Indices_Issue$FILEUS_Attractiveness
_Indices_Issuepdf
GTM Research 2012 ldquoUS Solar Market Insight Report 2011 Year-In-Reviewrdquo Greentech Media and
Solare Energy Industries Association
ldquoGermany Your Unlikely World Leader in Solar Powerrdquo alfinder Nationwide Home Solar Power
Contractors and Information URL httpsolarcalfindercomblogsolar-informationgermany-yourshy
unlikely-world-leader-in-solar-power
German BMU Federal Ministry for the Envirionment Nature Conservation and Nuclear Safety 2010
Renewable Energy Sources 2010
Gerrard Michael B 2011 The Law of Clean Energy Efficiency and Renewables American Bar
Association
Gilmore Jeff 2012 Personal communication via email on 2292012
Gordon Scott 2010 ldquoSolar Energy and Federal Tax redits for Residential Solar Systemsrdquo Energy
Solutions October 27 2010 URL httpblogheliopowercomcategoryfederal-tax-credits
HRS Hotel Reviews Holiday Inn Hotel Downtown Ithaca URL
httpwwwhrscomukbookingenusaithaca-new-yorkholiday-inn-ithaca-downtown-137885html
Ithaca NY City Data URL httpwwwcity-datacomcityIthaca-New-Yorkhtml
Kissell Thomas E 2012 Introduction to Solar Principles Upper Saddle River NJ Prentice Hall
LeMaro Arel 2012 Personal interview conducted on 232012
NYSERDA New York State Energy Research and Development Authority New York Renewable Portfolio
Standard URL httpnyserdanygovPage-SectionsEnergy-and-Environmental-MarketsRenewableshy
Portfolio-Standardaspx
NREL National Renewable Energy Laboratory URL httpwwwnrelgov
54
Osborne Mark 2011 ldquoEnecsys offers 360W dual micro-inverter that maintains individual MPPTrdquo PV-
Tech March 7 2011 URL httpwwwpvshy
techorgproduct_reviewsenecsys_offers_360w_dual_micro_inverter_that_maintains_individual_mppt
PowerClerk 2012 NYSERDA PV Report URL
httpnyserdapowerclerkreportscomDefaultaspxReportId=1
QPK Design ldquoTompkins ounty Library 2020rdquo URL
httpmidhudsonorgadminfacilities_resourcesgreenQPK_Designpdf
Renovus Energy website Solar Electric section URL httprenovusenergycomsolar_electrichtml
SRETrade ldquoSolar Renewable Energy ertificates (SREs)rdquo URL
httpwwwsrectradecombackgroundphp
Shahan Zachary 2012 ldquo2011 US Solar Market Report ndash Top 7 Findings and hartsrdquo
CleanTechnicacom March 15 2012 URL httpcleantechnicacom20120315us-solar-facts-charts
Solarbuzz Solar Market Research and nalysis 2011 ldquoRetail Price Summary ndash December 2011 Updaterdquo
URL httpsolarbuzzcomfacts-and-figuresretail-price-environmentmodule-prices
Solar Facts and dvice ldquoSolar Panel Temperature ffects Output ndash Herersquos what you need to knowrdquo URL
httpwwwsolar-facts-and-advicecomsolar-panel-temperaturehtml
Steeby Donald 2012 Alternative Energy Sources and Systems Clifton Park NY Delmar Cengage
Learning
Sunpower Data Sheet E20435 Solar Panel Manufacturerrsquos Data Sheet URL
httpglobalsunpowercorpcomproductssolar-panels
Sunpower Performance Monitoring ldquoTompkins ounty PowerGuard Photovoltaic Systemrdquo URL
httpwwwsunpowermonitorcomCommercialKioskaspx
TPD Tompkins ounty Planning Department 2010 ldquoTompkins ounty ommunity Greenhouse Gas
Emissions Report 1998-2008rdquo URL httpwwwtompkinsshy
coorgplanningenergyclimatedocumentsDraftCommunity10-yearGHGEmissionsReportpdf
Tester JT Drake EM Driscoll MJ Golay MW Peters WA 2005 Sustainable Energy Choosing
Among Options Cambridge MA The MIT Press
Trabish Herman K 2011 ldquoNew Study Solar Grid Parity is Here Todayrdquo Greentechsolar URL
httpwwwgreentechmediacomarticlesreadNew-Study-Solar-Grid-Parity-Is-Here-Today
Vanek Francis M 2012 Personal communication via email on 312012
Weaver Art 2012 Personal interview conducted on 442012
55
56
Appendix A Image sources
Figure 1 httpwwwgreentechmediacomresearchussmi
Figure 3 httpwwwitechnewsnetwp-contentuploads200905sanyo-hit-solar-cell-has-highestshy
energy-conversion-efficiencyjpg
Figure 4 Kissell 2012
Figure 5 Kissell 2012
Figure 6 Figure used with permission from lecture slides of KE ldquoMaxrdquo Zhang PhD ornell University
Figure 7 httpenvironmentalresearchweborgcwsarticlenews304891Generationgap
Figure 8 httpwwwpv-techorgguest_blognpd_solarbuzz_top_10_pv_cell_producers_in_2011
Figure 15 Steeby 2012
Figure 16 Kissell 2012
Figure 2 Figure used with permission from lecture slides of KE ldquoMaxrdquo Zhang PhD ornell University
Figure 9 httpnetzerorenewableresourcescomwp-contentuploads201010Roof-Mount-1jpg
Figure 10 httpwwwpowertripenergycomimages2009Pole-mount-for-webjpg
Figure 11 Steeby 2012
Figure 12 Image used with permission from lecture slides of Tobias Hanrath PhD Cornell University
Figure 13 httpwwwwattsuncommiscphotovoltaic_tilthtml
Figure 14 httpwwwenviroharvestcapv_shadinghtm
Figure 23 2005 chart developed with permission from data from lecture slides of Tobias Hanrath PhD
Cornell University
Figure 22 httpsolarbuzzcomfacts-and-figuresretail-price-environmentmodule-prices
Figure 24 GTM Research 2012
Figure 25 httpnyserdacleanpowerestimatorcomnyserdahtm
Figure 26 httpmidhudsonorgadminfacilities_resourcesgreenQPK_Designpdf
Figure 27 httpmapsgoogleco
B-1
Appendix B Description of Variables Used by PVWatts
DC Rating
The size of a photovoltaic (PV) system is its nameplate DC power rating This is determined by adding the PV module power listed on the nameplates of the PV modules in watts and then dividing the sum by 1000 to convert it to kilowatts (kW) PV module power ratings are for standard test conditions (STC) of 1000 Wm2 solar irradiance and 25degC PV module temperature The default PV system size is 4 kW This corresponds to a PV array area of approximately 35 m2 (377 ft2)
Caution For correct results the DC rating input must be the nameplate DC power rating described above It cannot be based on other rating conditions such as PVUSA test conditions (PTC) PTC are defined as 1000 Wm2 plane-of-array irradiance 20degC ambient temperature and 1 ms wind speed If a user incorrectly uses a DC rating based on PTC power ratings the energy production calculated by the PVWatts calculator will be reduced by about 12
DC-to-AC Derate Factor
The PVWatts calculator multiplies the nameplate DC power rating by an overall DC-to-AC derate factor to determine the AC power rating at STC The overall DC-to-AC derate factor accounts for losses from the DC nameplate power rating and is the mathematical product of the derate factors for the components of the PV system The default component derate factors used by the PVWatts calculator and their ranges are listed in the table below
Derate Factors for AC Power Rating at STC
Component Derate Factors PVWatts Default Range
PV module nameplate DC rating 095 080ndash105
Inverter and transformer 092 088ndash098
Mismatch 098 097ndash0995
Diodes and connections 0995 099ndash0997
DC wiring 098 097ndash099
AC wiring 099 098ndash0993
Soiling 095 030ndash0995
System availability 098 000ndash0995
Shading 100 000ndash100
Sun-tracking 100 095ndash100
Age 100 070ndash100
B-1
Overall DC-to-AC derate factor 077 009999ndash096001
The overall DC-to-AC derate factor is calculated by multiplying the component derate factors
For the PVWATTS default values
Overall DC to AC derate factor
= 095 x 092 x 098 x 0995 x 098 x 099 x 095 x 098 x 100 x 100 x 100
= 077
The value of 077 means that the AC power rating at STC is 77 of the nameplate DC power rating In most cases 077 will provide a reasonable estimate However users can change the DC-to-AC derate factor The first option is to enter a new overall DC-to-AC derate factor in the provided text box The second option is to click the Derate Factor Help button This provides the opportunity to change any of the component derate factors The derate factor calculator then calculates a new overall DC-to-AC derate factor
The component derate factors are described below
PV module nameplate DC rating This accounts for the accuracy of the manufacturers nameplate rating Field measurements of PV modules may show that they are different from their nameplate rating or that they experience light-induced degradation upon exposure A derate factor of 095 indicates that testing yielded power measurements at STC that were 5 less than the manufacturers nameplate rating Inverter and transformer This reflects the inverters and transformers combined efficiency in converting DC power to AC power A list of inverter efficiencies by manufacturer is available from the Consumer Energy Center The inverter efficiencies include transformer-related losses when a transformer is used or required by the manufacturer Mismatch The derate factor for PV module mismatch accounts for manufacturing tolerances that yield PV modules with slightly different current-voltage characteristics Consequently when connected together electrically they do not operate at their peak efficiencies The default value of 098 represents a loss of 2 because of mismatch Diodes and connections This derate factor accounts for losses from voltage drops across diodes used to block the reverse flow of current and from resistive losses in electrical connections DC wiring The derate factor for DC wiring accounts for resistive losses in the wiring between modules and the wiring connecting the PV array to the inverter AC wiring The derate factor for AC wiring accounts for resistive losses in the wiring between the inverter and the connection to the local utility service
B-2
Soiling The derate factor for soiling accounts for dirt snow and other foreign matter on the surface of the PV module that prevent solar radiation from reaching the solar cells Dirt accumulation is location- and weather-dependent There are greater soiling losses (up to 25 for some California locations) in high-trafffic high-pollution areas with infrequent rain For northern locations snow reduces the energy produced and the severity is a function of the amount of snow and how long it remains on the PV modules Snow remains longest when sub-freezing temperatures prevail small PV array tilt angles prevent snow from sliding off the PV array is closely integrated into the roof and the roof or another structure in the vicinity facilitates snow drift onto the modules For a roof-mounted PV system in Minnesota with a tilt angle of 23deg snow reduced the energy production during winter by 70 a nearby roof-mounted PV system with a tilt angle of 40deg experienced a 40 reduction System availability The derate factor for system availability accounts for times when the system is off because of maintenance or inverter or utility outages The default value of 098 represents the system being off 2 of the year Shading The derate factor for shading accounts for situations in which PV modules are shaded by nearby buildings objects or other PV modules and arrays For the default value of 100 the PVWatts calculator assumes the PV modules are not shaded Tools such as Solar Pathfinder can determine a derate factor for shading by buildings and objects For PV arrays that consist of multiple rows of PV modules and array structures the shading derate factor should account for losses that occur when one row shades an adjacent row
The figure below shows the shading derate factor as a function of the type of PV array (fixed or tracking) the ground cover ratio (GCR) defined as the ratio of the PV array area to the total ground area and the tilt angle for fixed PV arrays As shown in the figure spacing the rows further apart (smaller GCR) corresponds to a larger derate factor (smaller shading loss) For fixed PV arrays if the tilt angle is decreased the rows may be spaced closer together (larger GCR) to achieve the same shading derate factor For the same value of shading derate factor land area requirements are greatest for two-axis tracking as indicated by its relatively low GCR values compared with those for fixed or one-axis tracking If you know the GCR value for your PV array the figure may be used to estimate the appropriate shading derate factor Industry practice is to optimize the use of space by configuring the PV system for a GCR that corresponds to a shading derate factor of 0975 (or 25 loss)
B-3
Shading derate factor for multiple-row PV arrays as a function of PV array type and ground cover ratio
Sun-tracking The derate factor for sun-tracking accounts for losses for one- and two-axis tracking systems when the tracking mechanisms do not keep the PV arrays at the optimum orientation For the default value of 100 the PVWatts calculator assumes that the PV arrays of tracking systems are always positioned at their optimum orientation and performance is not adversely affected Age The derate factor for age accounts for performance losses over time because of weathering of the PV modules The loss in performance is typically 1 per year For the default value of 100 the PVWatts calculator assumes that the PV system is in its first year of operation For the eleventh year of operation a derate factor of 090 is appropriate
Note Because the PVWatts overall DC-to-AC derate factor is determined for STC a component derate factor for temperature is not part of its determination Power corrections for PV module operating temperature are performed for each hour of the year as the PVWatts calculator reads the meteorological data for the location and computes performance A power correction of -05 per degree Celsius for crystalline silicon PV modules is used
B-4
Appendix C Aerial Views of the 10 Largest Commercial Buildings in
the County
(contained in separate file)
C-1
Appendix D Aerial Views of the 10 Largest Industrial Buildings in
the County
(contained in separate file)
D-1
Appendix E Aerial Views of the 10 Largest School Buildings in the
County
(contained in separate file)
E-1
Appendix F Solar Liberty System Specifications
(contained in separate file)
F-1
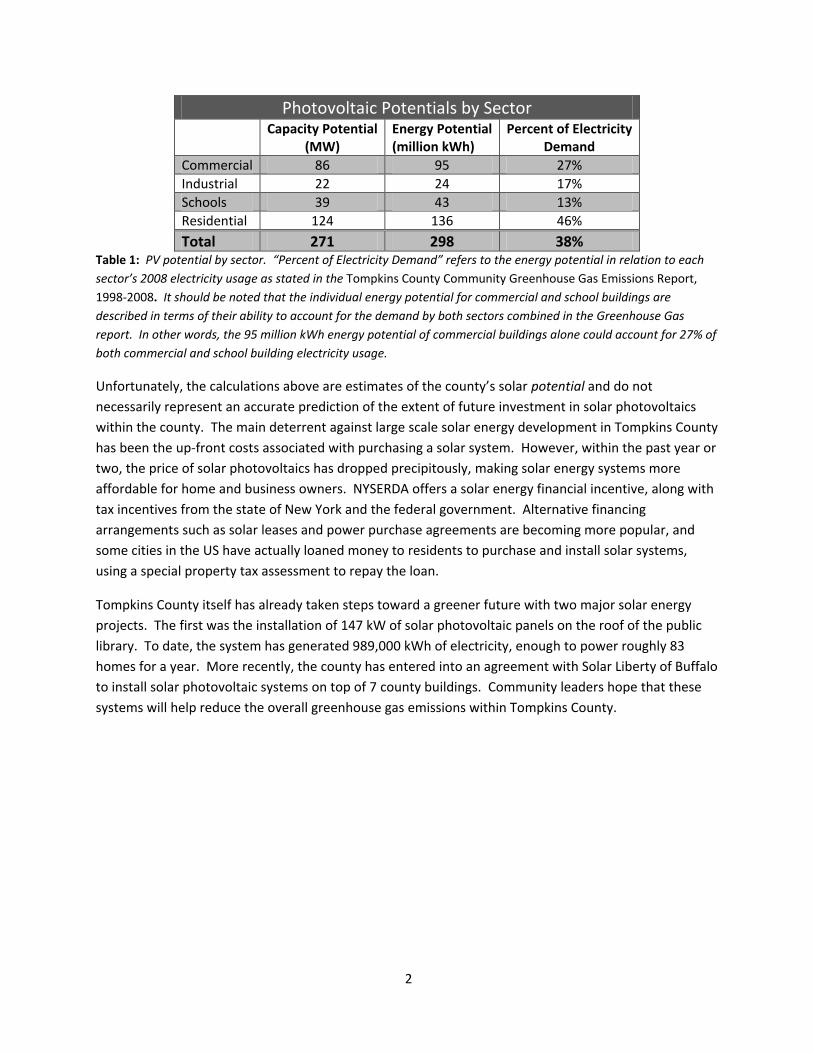
Photovoltaic Potentials by Sector Capacity Potential
(MW) Energy Potential (million kWh)
Percent of Electricity Demand
Commercial 86 95 27
Industrial 22 24 17
Schools 39 43 13
Residential 124 136 46
Total 271 298 38 Table 1 PV potential by sector ldquoPercent of Electricity Demandrdquo refers to the energy potential in relation to each
sectorrsquos 2008 electricity usage as stated in the Tompkins County Community Greenhouse Gas Emissions Report
1998-2008 It should be noted that the individual energy potential for commercial and school buildings are
described in terms of their ability to account for the demand by both sectors combined in the Greenhouse Gas
report In other words the 95 million kWh energy potential of commercial buildings alone could account for 27 of
both commercial and school building electricity usage
Unfortunately the calculations above are estimates of the countyrsquos solar potential and do not
necessarily represent an accurate prediction of the extent of future investment in solar photovoltaics
within the county The main deterrent against large scale solar energy development in Tompkins County
has been the up-front costs associated with purchasing a solar system However within the past year or
two the price of solar photovoltaics has dropped precipitously making solar energy systems more
affordable for home and business owners NYSERDA offers a solar energy financial incentive along with
tax incentives from the state of New York and the federal government Alternative financing
arrangements such as solar leases and power purchase agreements are becoming more popular and
some cities in the US have actually loaned money to residents to purchase and install solar systems
using a special property tax assessment to repay the loan
Tompkins County itself has already taken steps toward a greener future with two major solar energy
projects The first was the installation of 147 kW of solar photovoltaic panels on the roof of the public
library To date the system has generated 989000 kWh of electricity enough to power roughly 83
homes for a year More recently the county has entered into an agreement with Solar Liberty of Buffalo
to install solar photovoltaic systems on top of 7 county buildings Community leaders hope that these
systems will help reduce the overall greenhouse gas emissions within Tompkins County
2
Overview of Solar Energy
Solar energy is one of the most quickly evolving and exciting technologies available in the transition to a
sustainable future Although the cost of solar systems is rapidly decreasing and the efficiencies are
improving solar energy still faces some significant challenges One inherent challenge of solar energy
generation is its variability Throughout the course of the year the amount of sunlight in a given
location is subject to both diurnal and seasonal changes that make it difficult to get a consistent and
reliable supply of energy Fortunately since the sunrsquos daily and seasonal paths are both predictable and
mathematically calculable changes in energy generation can be estimated to a certain degree Weather
can also affect the output of solar energy but local historical averages can provide a reasonable
estimate of future weather patterns
The amount of energy that reaches the Earthrsquos surface also known as the incident solar energy or solar
insolation is very large Much of the energy emitted by the sun is scattered or reflected by the
atmosphere but about 21 of the sunrsquos energy reaches the Earth as direct radiation and about 29
reaches as scattered or diffuse radiation Over the course of a year over 40000 EJ (exajoules a unit of
energy defined as 11018 joules) are incident on the United States alone (Tester et al 2005) For
comparison this dwarfs the total US energy consumption of around 100 EJ per year If a 10 efficient
solar farm were installed over just 16 of the US land area (about 10 times the total area of all single-
family residential rooftops) it would meet all of the countryrsquos domestic energy needs (DOE 2005) While
solar insolation provides a huge energy potential the aforementioned variability low energy density
compared to other sources of energy land use requirements and high relative costs have traditionally
deterred large investments in solar energy
There are two main ways that the sunrsquos energy can be harvested One method is called photovoltaic
solar energy commonly referred to as ldquophotovoltaicsrdquo or simply ldquoPVrdquo This method uses light from the
sun to generate electricity directly which can be used just the same as electricity from a power plant
The majority of photovoltaic systems are grid tied meaning they are interconnected with the electricity
grid This helps alleviate the variability issue as the grid can supply electricity to a building if the PV
system does not meet the demand In addition the grid can act as a de facto battery accepting any
extra electricity the PV system produces that is higher than the demand of the building In more rare
cases usually in remote rural areas standalone PV systems are utilized meaning they are not
connected to the grid Because they are not grid tied standalone PV systems require large batteries to
store the PV electricity for use during the night or on cloudy days Due to the relatively high cost of
batteries these systems are more expensive than grid tied systems
The second method for generating solar energy is called solar thermal which uses thermal energy from
the sun to generate heat instead of electricity Oftentimes this energy is used to heat hot water which
can reduce the heating load of a home or business Unfortunately they generate the least amount of
energy during the winter when heating is needed the most They work very well during the summer
though and a large portion of a homersquos hot water needs during those months can be provided with a
solar thermal system
3
Focus of This Report
The main focus of this report will be an attempt to estimate the residential and commercial photovoltaic
solar energy potential of Tompkins County Additional information about solar thermal systems is also
included A basic overview of solar energy and the current state of photovoltaics is provided as an
introduction to solar energy for anybody who is unfamiliar with the technology followed by a more in-
depth analysis of the PV potential of Tompkins County in particular The PV potential of the county is
broken down by sector commercial industrial schools and residential buildings The commercial
industrial and school building potential is relatively easy to determine as most of these buildings have
flat roofs with little to no shading obstructions such as tall trees or neighboring tall buildings
The residential potential is a little more difficult however since houses generally donrsquot have flat roofs
and the amount of roof obstruction or potential for shading is unique to every house Some houses may
not have adequate roof space for a solar system or may have trees or neighboring houses that could
cast a shadow on the solar system Nonetheless an approximate estimate of the potential can be
determined It should be noted that this is merely a potential and there is a somewhat large amount of
uncertainty in the estimate Also it should not be mistaken for a prediction of the amount of solar
energy that will be installed in the county There is a wide range of variables that will affect the actual
amount of solar energy produced in the county and only the future will tell what the level of solar
energy investment in the county will be
Solar Energy Trends
United States
Over the past few decades the United States has shown an ever increasing interest and demand for
solar energy In 2011 the US more than doubled its solar PV capacity compared to 2010 adding enough
capacity to power more than 370000 homes (Shahan 2012) According to analysts at Ernst amp Young the
US is the second most attractive country in the world for renewable energy behind China and ahead of
Germany According to the same index the state of New York is tied with Maine Pennsylvania and
Nevada for 8th most attractive state in the country for renewable energy (Ernst amp Young 2012)
Leading the way last year in terms of number of PV systems installed were California and New Jersey
with New York in 7th place behind Pennsylvania (Shahan 2012) One main reason for the solar success of
New Jersey and Pennsylvania has to do with the statesrsquo implementation of Solar Renewable Energy
Certificates (SRECs) These are credits that owners of solar systems receive based on the amount of
energy generated by their solar systems Energy suppliers are required by the state to produce a given
amount of energy from solar energy and can buy SRECs from home or business owners who produce
solar energy (SREC Trade) These programs have been very successful in promoting the growth of solar
energy but may have become ldquovictims of their own successrdquo as the large number of solar installations is
pushing down the price of SRECs (Ernst amp Young 2012) The current low price of SRECs should slow
4
down the rate at which New Jersey and Pennsylvania solar installations advance at least for the short
term
Figure 1 The US Solar Year-In-Review This essentially sums up the big news and developments in the US solar
market during 2011
Tompkins County
Currently according to NYSERDA Tompkins County is a photovoltaic leader in central New York The
county has 211 solar PV systems overall while the surrounding counties are lagging significantly behind
as can be seen in Table 2 (PowerClerk)
5
Tompkins and Surrounding Counties County No of Systems
Tompkins 211
Tioga 33
Cayuga 32
Cortland 20
Chemung 19
Seneca 11
Schuyler 10
Table 2 Number of installed photovoltaic systems in Tompkins and surrounding counties It is clear that Tompkins
County is the PV leader in central New York (Data gathered from PowerClerk 2012)
Looking at the state as a whole Tompkins County currently ranks 7th in number of PV systems recently
passing Queens County (201) When accounting for population however the county ranks 2nd with
nearly 21 systems per 10000 residents as shown in Table 3
Leading PV Counties of New York County No of Systems Population Systems per
10000 Residents
Columbia 232 63096 368
Tompkins 211 101564 208
Ulster 376 182493 206
Dutchess 379 297488 127
Albany 232 304204 76
Westchester 352 949113 37
Erie 315 919040 34
Table 3 Table showing the top 7 counties in New York in terms of number of PV installations Tompkins County th ndranks 7 in number of installations but 2 in installations per 10000 residents (PV data gathered from PowerClerk
2012 Population data gathered from the US Census Bureau)
Of the 211 PV systems in Tompkins County 176 are residential 22 are commercialindustrial and 13 are
governmentnon-profit According to the 2010 census and GIS data obtained from the Tompkins County
Planning Department there are 38967 households 2118 commercial buildings 232 industrial
buildings and 937 school buildings As such there exists a huge potential for rooftop solar installations
in the county which will be discussed further in the Tompkins County PV Potential section
Resource Assessment
The most important aspect of generating solar energy is what is called solar insolation This is the
amount of solar energy that reaches the Earthrsquos surface for a given location This is usually expressed as
energy per unit area for a given time period For example an area that has an insolation of 1500
kWhm2year receives 1500 kWh of solar energy for every square meter of land area over the course of
a year This does not mean however that this area could annually generate 1500 kWh of solar
6
electricity for every square meter of land area This is limited by the efficiency of the PV cell converting
the sunrsquos light to electricity and this efficiency is relatively low (~11-15 for low to average cells and
~15-20 for top of the line cells)
At first glance Tompkins County may not seem like an ideal place for solar energy When compared to
Germany the worldwide leader in solar energy however Tompkins County actually proves to have a
better solar resource Much like Tompkins County Germany has a large number of cloudy days
throughout the year Overall Germany gets an average of 1500 hours of sunshine per year or a little
less than 63 full daysrsquo worth of sunlight (ldquoGermanyrdquo)
Figure 2 shows the average annual solar insolation of the United States and Germany The map shows
that nearly the entire contiguous United States receives more sunlight than Germany According to the
map Tompkins County receives around 1500 kWhm2year while Germany only receives around 1000shy
1100 kWhm2year Nevertheless Germany has an installed photovoltaic capacity of 17320 MW
compared to an installed capacity of 3954 MW in the US (German BMU amp GTM Research 2012) While
much of Germanyrsquos solar success is due to its more generous governmental funding programs it is
encouraging that solar energy can utilized in a country that has a lower-grade solar resource than
Tompkins County
Figure 2 Annual average solar insolation of the United States and Germany This figure shows that almost the
entire contiguous United States receives more sunlight than anywhere in Germany
7
Photovoltaic Basics
PV Overview
Solar photovoltaic systems utilize the photoelectric effect present in semiconductor materials to turn
solar energy directly into electricity When speaking of photovoltaics there are a number of
terminologies that are used to describe certain aspects of a system First the electricity is actually
generated in what is called a solar cell Each cell is only a few square inches (Figure 3) and only
generates a small amount of voltage However a number of cells wired together in series increases the
voltage in what are known as panels or modules Both terms are commonly used and will be used
interchangeably throughout this report A typical photovoltaic panel rectangular measuring a few
square feet and typically consists of 36 cells connected in series (Kissell 2012) Figure 4 shows how
individual cells are typically strung together to form a panel
Figure 3 Typical size of a solar cell These are what actually generate the electricity in a PV system and a number
of them are strung together to form a PV panel
8
Figure 4 A schematic of a typical photovoltaic panel 36 individual PV cells are connected in series to create the
panel also known as a module
Most of the time solar PV systems consist of more than one panel When a number of panels are
arranged in series this is referred to as a string Multiple strings can then be arranged at a single site to
form an array Figure 5 shows an example of a 6 panel array consisting of two 3 panel strings
Figure 5 An example of a PV array consisting of two strings of 3 panels each
In order for PV panels from different manufacturers to be compared on an equivalent basis they need
to be tested according to universal standards Each PV manufacturer must subject their panels to a
9
laboratory rating system where they are tested under 1000 Wm2 irradiation and 25 C temperature
The amount of power that the panel produces under these conditions is then referred to the panelrsquos
nameplate rating The nameplate rating is in units of Watts and referred to as the panelrsquos watt-peak
rating and given the symbol Wp Oftentimes the ldquopeakrdquo portion is understood and panels are referred to
in Watts For example a 250 W panel will produce 250 watts of power under laboratory conditions
However it will not necessarily produce 250 W of power when installed because conditions in the real
world are not always as ideal as in the laboratory Most of the time in Tompkins County the panel will
likely receive less sunlight than in the laboratory and will produce less than 250 W The system will
produce less than 2 kW most of the time but at times when the sun is very intense it could actually
produce more than 2 kW If this panel is combined with 7 other 250 W panels into an 8-panel array it
will have a nameplate rating of 2000 W (2kW)
Inverters
Panels are not the only piece of equipment associated with a photovoltaic system Because solar panels
produce direct current or DC power and the electricity grid uses alternating current or AC power the DC
current from the array needs to be converted to AC before it can be used by electrical appliances or sent
to the grid To convert the electricity a complex piece of electrical equipment called an inverter uses
various algorithms to operate the PV system at maximum power Inverters tend wear out much sooner
than PV panels and many are only warrantied for 5-10 years as compared to 20-25 years for most
panels As such many firms are looking into producing more reliable inverters that will have a longer
life (Cleantech 2009)
Current PV Cell Materials
Throughout the course of photovoltaic development there have been three generations of solar cells
broken down by the materials they use and their cost By far the most frequently used solar panels
today are first generation panels made from crystalline silicon (c-Si) This is because of the high
efficiency of silicon panels and the long history of silicon solar cell development and use
There are two types of crystalline silicon cells monocrystalline (mono-cSi) and polycrystalline (poly-cSi)
Mono-cSi cells are produced in a very highly specialized process identical to the process of developing
silicon computer chips These cells have the highest efficiency of silicon based cells but they are also
the most expensive Poly-cSi cells are made in a less exacting fashion and therefore have a lower
efficiency but also lower cost Mono-cSi panels require approximately 60 ft2 of panel area per kW of
installed capacity while poly-cSi cells need up to 120 ft2 of panel area for each kW of installed capacity
(Kissell 2012) Traditionally crystalline silicon panels have had a relatively high price but their price has
recently plummeted making these types of panels more cost effective in the short term
In addition to c-Si cells there are a number of different technologies being studied and developed that
show promise moving forward Second generation cells commonly referred to as ldquothin filmsrdquo have a
lower efficiency than c-Si cells but have also traditionally had a lower cost They are also much thinner
and lighter than c-Si cells and can contour to odd shapes and building angles Figure 6 provides typical
characteristics of c-Si cells and thin films
10
Figure 6 Characteristics of monocrystalline polycrystalline and thin film PV cells Below the table are pictures of
typical monocrystalline polycrystalline and thin film cells respectively IPV refers to ldquouilding Integrated PVrdquo
which incorporates PV panels into the construction of new buildings
The three main types of thin film solar cells are amorphous silicon (a-Si) cadmium telluride (CdTe) and
copper indium gallium selenide (CIGS) Amorphous silicon has struggled to gain market share because
of its low conversion efficiency and seems to have lost out to CdTe and CIGS as the main thin film
technologies CdTe was pioneered by First Solar which is now the worldwide leader in PV production
(Figure 8) This is currently the most cost effective technology but its lower efficiency has decreased its
popularity compared to crystalline silicon (PVInsights) CIGS has shown to have higher efficiencies in the
laboratory but it is much more complicated to produce than CdTe so it has lagged behind Many people
are optimistic about the future of CIGS because of its high efficiency but firms need to figure out how to
economically commercialize the process before it can gain significant market share (Grana 2010)
Future PV Materials
Third generation cells are cells that are mostly experimental at this point but show promise if they can
be commercialized There are a number of different types of third generation cells but they all have
higher efficiencies than silicon based cells and should be less expensive to produce If these cells do
happen to be developed and commercialized many of the limitations of solar energy would be lessened
namely cost and efficiency
A graph of the efficiency vs cost of the three generations of PV modules is shown below in Figure 7
The diagonal dashed lines represent the module cost per watt while the horizontal dashed lines
represent different physical limitations on PV cells The ldquoShockley-Queisser limitrdquo indicates the highest
theoretical efficiency that current generation 1 and 2 cells can reach Some cells have approached this
11
limit in the laboratory but commercially available cells only reach efficiencies in the upper teens and
recently 20 percent The ldquoultimate thermodynamic limit at 1 sunrdquo line indicates the theoretical
efficiency limit of advanced technology cells without the benefit of concentrators ie mirrors or lenses
that concentrate the sunlight Finally the ldquothermodynamic limit at 46200 sunsrdquo line indicates the
efficiency possible with advanced cells at the highest theoretical concentration level (Cartlidge 2007)
Figure 7 Efficiency vs cost of three generations of solar cells The dashed diagonal lines represent the module cost
per watt peak and the dashed horizontal lines represent the physical limitations of solar cells Note this is not the
total installed cost of the system just the module cost
The takeaways from this chart are the fact that second generation thin film cells are less expensive but
also less efficient than first generation cells while third generation cells are both less expensive and
more efficient Current c-Si cells range $1 per watt and around $3 per watt and ~12 efficiency to 20
efficiency (see Table 14 for a description of average module costs) If scientists and engineers are able
to develop third generation solar cells on a commercial scale they could be economically feasible
without any sort of government intervention or financial subsidy
Module Efficiencies
As mentioned before every commercially available PV module is tested according to standard test
conditions (STC) These conditions are specified as 1000 Wm2 (929 Wft2) irradiation at 25 C (77 F )
module temperature and the tests are carried out in a laboratory These conditions allow a direct
comparison between different modules from different companies and even different technologies The
efficiency of the module is related to its watt peak rating and surface area by the following equation
12
Where equals the module efficiency A is the module surface area in ft2 and 929 Wft2 refers to the
laboratory test conditions If the efficiency of the module is known the surface area can be calculated
from the above equation Table 4 shows the module surface area for each kW of installed capacity This
will not equal the total surface area of the array however since there are other mounting components
that are required to support the modules
For each kW of installed capacity
Module Efficiency Module Surface Area (ft2)
10 109
12 91
14 78
16 68
18 61
20 54
Table 4 Module surface area for different efficiencies for each kW of installed capacity Note module area will
not equal the total installed area of the system Instead this only refers to the module area and does not account
for the frames that hold the modules or any spacing between the modules for other components
So for the same amount of installed power more efficient modules will require less area a
consideration for homeowners with limited roof area While higher efficiency panels tend to be more
expensive this higher cost is somewhat offset by the need to buy fewer panels for the same capacity as
well as the decrease in mounting hardware required and lower installation costs associated with
installing fewer panels
Temperature Effects
One of the more ironic aspects of solar PV systems is the fact that electricity output decreases with
increasing temperature In other words as panels receive more sunlight they could lose efficiency if the
panels begin to heat up In some cases electricity output can decrease by 10-25 depending on location
and type of panel Different panels are affected differently by temperature which is determined by
each panelrsquos temperature coefficient listed on the panelrsquos manufacturersrsquo data sheet as ldquotemperature
coefficient Pmaxrdquo s an example the temperature coefficient of a Suntech 190 W monocrystalline
module is -048 which means that every degree above 25 C (77 F) the maximum power possible
from the panel is reduced by 048 (Solar Facts)
If for instance a panel on a rooftop during a hot summer day heats up to 45 (113 F) its energy
produced would be 10 lower than at 25 (77 F) onversely on a cool sunny day when the
temperature is lower than 25 the panelrsquos energy output would actually increase (Solar Facts) This
could even out some of the lost energy during the hot months but because the sun is out longer during
the summer the overall temperature effect would likely be negative
13
Typically c-Si solar panels have a temperature coefficient in the range of -044 to -050 Sunpowerrsquos
E20 series monocrystalline modules have the lowest commercially available temperature coefficient at shy
038 as well as the highest module efficiency at 201 (Solar Facts and Sunpower Data Sheet)
Panel Degradation
Over time photovoltaic panels slowly begin to degrade and produce less power than when they were
new One widely held assumption about PV systems degradation is that a panel will lose about 1 of its
efficiency per year (Note this does not mean that a panel with 15 efficiency will be 0 efficient in 15
years It means that it will produce 85 of the energy in year 15 as compared to year 1 ie reducing its
overall efficiency to 1275) Branker Pathak and Pearce found this assumption to be unreasonably
conservative and suggested a degradation rate of 02 to 05 per year Even older panels produced in
the 1980s have been shown to degrade slower than the customary 1 mark and some even still perform
to their original specifications (Trabish 2011 and Dankoff and Schwartz 2007) As technologies
advance panel degradation rates should only decrease and perhaps even disappear altogether
Current PV Manufacturers
Figure 8 shows the top 10 photovoltaic manufacturers in terms of market share First Solar is the only
thin film manufacturer as well as the current worldwide leader in production This is due to the
companyrsquos downstream-integrated business model that few other firms have been able to follow
(Colville 2012) It will be increasingly difficult for thin film manufacturers to compete moving forward
given the price competitiveness that c-Si panels have developed
14
Figure 8 Leading PV manufacturers in terms of market share First Solar is the largest and only thin film
manufacturer on the list Chinese and Taiwanese companies occupy 8 of the top 10 spots with Fist Solar (US) and
Canadian Solar (Canada) the only two exceptions
Residential Photovoltaic Systems
One aspect that makes photovoltaics appealing is the simplicity and minimal operating costs and
maintenance Once the panels are installed they are essentially left in place for about 20 to 30 years
with little to no maintenance The major stumbling block for large scale implementation of photovoltaic
systems is the high up front cost The monetary savings resulting from a solar system may be greater
than the initial cost of installation but oftentimes individuals donrsquot have the money up front to pay for
the system Fortunately there are a number of financial incentive and tax programs that individuals
who wish to install photovoltaic systems may utilize These programs are discussed in-depth in the PV
Financial Programs and Incentives section on page 40
Location of Panels
One of the first concerns when determining the feasibility of a photovoltaic system on a residence is the
location and orientation of the panels In general solar panels need to be located in areas with minimal
shading between the hours of 900 am and 300 pm (Renovus) Panels typically need to face South
and can be mounted either on the roof of the home or on the ground If homeowners have adequate
South-facing roof space they will likely elect to mount the panels on the roof
15
Figure 9 below shows an example of a roof mounted PV system Roof mounted systems are less
expensive than ground mounted systems (Figure 10) due to the large foundations and wiring
requirements needed for ground systems However ground mounted systems allow the homeowner to
change the angle of the panels seasonally to generate the most energy throughout the year (Renovus)
There are a few other options for roof mounting that do not require the panels to sit flat on a south-
facing roof as shown in Figure 11
Figure 9 Roof mounted PV system Notice the lack of trees and other obstructions that could potentially shade
the panels Also notice the slope of the panels allows snow to slide off instead of accumulating
Figure 10 Ground mounted PV system The tilt of the array can be adjusted from the ground to adapt to different
seasonal sun conditions
16
Figure 11 Examples of various panel orientations for different roof conditions to ensure the panels are facing
south and at the correct tilt angle
Tilt Angle
Once the location of the panels is decided their tilt angle needs to be determined This is the angle that
the panels make with the ground and can have an effect on the energy output of the system Since the
sun takes different paths through the sky at different points throughout the year (Figure 12) the tilt of
the panels will affect the seasonal output of the PV system During the summer the sun takes the
longest highest path through the sky allowing for the most PV energy during this time
Figure 12 Path of the sun at different points throughout the year
If the panels are to be installed on a rooftop the best option is likely to install them flat on the roof
This is because it is the least costly method and differences in tilt angle have a small effect on PV system
output as shown in Table 5
17
PV Array Tilt Angle by Roof Pitch
Roof Pitch Tilt ngle (⁰) kWh per Installed kW
412 184 1084
512 226 1098
612 266 1109
712 303 1114
812 337 1116
912 369 1114
1012 398 1110
1112 425 1105
1212 450 1095 Table 5 Array tilt angles based on roof pitch and energy generation potential as estimated by historical weather
data Tilt angle has a minimal overall effect on the amount of electricity generated over the course of a year
One advantage of ground mounted systems is the ability to change the tilt of the panels seasonally to
optimize their output Figure 13 shows how a ground mounted system can be adjusted throughout the
year to optimize electricity generation
Figure 13 Effect of seasonal sun changes on energy generation As the figure shows the summer sun is higher in
the sky requiring a smaller array tilt to optimize solar energy collection during this time
Shading
One of the most important aspects to take into consideration when siting a PV system is shading Even
small amounts of shading such as leafless tree branches or small rooftop obstructions can have dramatic
impacts on the solar electricity generation of a PV system Since the cells and panels are connected in
series (Figure 4 and Figure 5) a single shaded cell can limit the electricity production of the entire string
(Figure 14) A common analogy is the frustrating situation when one bulb in a string of Christmas lights
makes the whole strand go out
18
Figure 14 Shading effects on a PV module These situations assume the system uses a centralized inverter If the
system used microinverters the PV power would only be reduced by the cells that are shaded instead of affecting
other cells in the string
The reason that this occurs is due to the operation of the inverter Since most inverters are centralized
they attempt to maximize the output for the entire system instead of each individual panel A solution
for this would be to use panels with microinverters which are small inverters that maximize the output
for each panel individually If one panel is shaded only the output from that panel is affected not the
entire string like is the case with centralized inverters Microinverters add to the cost of a system
however and it is estimated that microinverters cost 52₵ per watt compared to 40₵ per watt for a
centralized inverter (Dolan 2010) In other words microinverters will add $120 for every installed kW of
PV capacity This could be made up over the life of the system however through decreased shading
losses In addition microinverters tend to last longer than centralized inverters which could actually
result in a lower lifetime cost of the system if the centralized inverter has to be replaced after the
warranty has expired
Some companies are beginning to offer dual microinverters which are microinverters that service two
panels instead of one This means that a system would need half the amount of microinverters than a
system with a microinverter for each panel This would result in costs that are comparable to systems
with centralized inverters but 5-20 more energy produced (Osborn 2011)
No matter the type of inverter every precaution should be taken to ensure the panels receive direct
sunlight without shading for the majority of the day Many PV installers will provide a site evaluation
and shading assessment prior to installing a system to ensure the location is ideal for PV generation
(Enviroharvest)
19
Solar Easements
One issue that may concern residents before installing a solar energy system is the possibility of
neighbors constructing or planting something that may obstruct the amount of sunlight incident on their
PV array A solar easement prohibits neighboring property owners from this ensuring the solar system
will not be blocked by the actions of neighboring residents A typical solar easement will contain a
description of the dimensions of the easement including horizontal and vertical angles measured from
the solar installation as well as conditions for revision and termination of the easement (Garrard 2011)
New York Statersquos solar easement provision is outlined in LS Real Property Statute 335-b which
describes the aforementioned terms and a request for provisions for compensation in the instance that
a solar installation is blocked (CLS 335-b) Like many other states solar easements are voluntary
contracts that can ensure uninterrupted solar access for solar energy systems They are required to
contain at a minimum information describing ldquothe easement location and orientation to real property
subject to the easement provisions for termination and provisions for compensation in the event that
interference occursrdquo (DSIRE Solar Easements)
The full text of CLS 335-b can be found here
httpwwwdsireusaorgdocumentsIncentivesNY01Rhtm
In addition to the general solar easement provision New York General City Town and Village codes
allow local zoning districts to enact regulations regarding solar access within a municipality The intent
of the legislation recognizes ldquoaccess to solar energy as a valid public purpose within the zoning authority
of local governmentsrdquo (DSIRE Solar Easements)
This full legislation regarding municipal zoning can be found below
General City httpwwwdsireusaorgdocumentsIncentivesNY01Rbhtm
Towns httpwwwdsireusaorgdocumentsIncentivesNY01Rchtm
Villages httpwwwdsireusaorgdocumentsIncentivesNY01Rdhtm
Solar Thermal Systems
Solar thermal systems differ from PV systems in the fact that they collect and store heat from the sun
instead of producing electricity One of the most typical and practical applications of a solar thermal
system is hot water heating The heat from the sun is collected with a solar thermal collector and the
heat is then transferred to water in the house reducing the heating load of the house
The most common type of solar thermal collector is a flat-plate collector which is similar in size to a PV
module but operates much differently It consists of a metal box with a tempered glass coating called
glazing to protect it from the elements Inside the collector is an absorber which is frequently a copper
plate with copper tubing fastened to it The top of the absorber is coated with a dark paint with a
special absorber to ensure it absorbs the most amount of solar heat possible As the plate heats up
20
energy is transferred from the plate to a fluid circulating through the copper piping which is then either
pumped directly to the house to be used or to a heat exchanger that gives off its thermal energy to
water that is used in the house (Steeby 2012) Figure 15 shows the typical setup of a flat-plate solar
thermal collector
Figure 15 Typical arrangement of a flat plate collector The sunrsquos energy is absorbed by the absorber which is
then transferred to a fluid that is used to heat water in the home
A typical residential solar hot water system will need 100 to 120 ft2 of collector panels for hot water
needs If electricity or propane are currently used to heat water in a household electricity rates above 7
₵kWh or propane prices above $125 per gallon could make solar water heating an attractive
investment At these rates an average household could save between 50 and 80 of the total cost of
heating their water (Steeby 2012) A typical solar thermal hot water system is shown below in Figure
16
21
Figure 16 An example of a typical solar thermal hot water system The heated water is stored on the bottom
floor which is then circulated throughout the house for hot water uses such as bathing and washing clothes In
addition the hot water can be circulated through pipes in the floor or through radiators in the winter to heat the
home
An alternative use of solar water heating is pool andor spa heating The use of solar thermal heating
systems for swimming pools has grown to be the number one application of solar energy in the United
States today When a solar thermal pool heating system is appropriately sized and installed it can pay
for itself in 2 to 3 years (Steeby 2012)
Tompkins County PV Performance
In My Backyard Tool
In order to specifically assess the solar energy resource potential in Tompkins County NRELrsquos ldquoIn My
Backyardrdquo (IMY) tool was utilized
IMBY can be found here httpwwwnrelgoveisimby
This tool is a variation of NRELrsquos PVWatts tool that uses a model developed by Richard Perez from SUNY
Albany in conjunction with NREL for the US Department of Energy This model uses hourly radiance
22
images from geostationary weather satellites daily snow cover data and monthly averages of
atmospheric water vapor trace gases and the amount of aerosols in the atmosphere to calculate the
hourly insolation falling on a horizontal surface From there calculations are performed to determine
insolation for a specified tilt angle (NREL)
Since there are a variety of different sized PV systems in the County three representative sized systems
were used with IMBY 2 kW 4 kW and 6kW These roughly represent a ldquosmall medium and largerdquo
spectrum for residential PV systems Since PV systems generally require about 100 ft2 of roof space for
each kW of installed capacity the 2 4 and 6 kW systems would require approximately 200 400 and
600 ft2 of roof space A 2 kW system might be ideal for a more densely populated area with many
obstructions and limited roof space
The average size of the 8 systems currently installed in downtown Ithaca is 3 kW so the 2 and 4 kW
systems should provide a reasonable estimate of the range of system sizes in a more urban
environment A 6 kW system would be suitable for a rural setting or an isolated home with a large roof
or an appropriate amount of land NYSERDA only incentivizes residential systems 7 kW and smaller so
larger systems will be ignored
To run the IMBY tool the pre-programmed settings (a list and description of which can be found in
Appendix B) were used to determine the energy output for each system size in Tompkins County Over
the course of the year IMBY calculated that for each kW of installed capacity approximately 1100 kWh
of electricity are generated Table 6 shows the electricity generation potential for each system over the
course of a year
System Size 2 kW 4 kW 6 kW
kWh Generated 2200 4400 6600
Table 6 Yearly anticipated electricity generation for 3 different sized systems in Tompkins County
Average Residential Electricity Demand
According to the Tompkins County Community Greenhouse Gas Emissions Report 1998-2008 the county
used 293 million kWh of electricity for residential purposes in 2008 (TCPD) According to this same
report there were 37443 households at this time corresponding to an average residential electricity
usage of 7837 kWh per year
This is merely an approximation and every household is different but this number can be used to get a
reasonable estimate of the benefit of installing residential PV systems Table 7 shows the amount of
electricity that each size system would provide for the average household in the county Even the
smallest system would provide over one quarter of the total electricity needs for the average residence
in the County The size of each system would have to be determined by each individual homeowner
based on cost available area and desired amount of energy produced
23
Jul Jul Jul Jul Jul Jul Jul Jul
Jan 14 Jan 15 Jan 16 Jan 17 Jan 18 Jan 19 Jan 20 Jan 21
Avg Household Demand 7837 kWh
System Size 2 kW 4 kW 6 kW
kWh Generated 2200 4400 6600
of Avg Household Demand 28 56 84 Table 7 Yearly anticipated electricity generation for 3 different sized system in Tompkins County and the
percentage of electricity those systems would provide for the average household in the County
PV System Output
If the electricity output from the system were plotted over the course of a week it would look
something like Figure 17 This graph shows the hourly electricity production predicted by IMBY for a 4
kW system during a week in January and a week in July This graph shows the variability of generation
very well with the energy peaking during the day then returning to zero each night The January curve
shows how much more variable solar electricity will tend to be in the winter with cloudy days and not
much consistent sunshine The three days of July 24th-26th show what the energy profile would look like
during clear sunny days The other days however show how clouds and other weather patterns can
affect a PV system output
PV Generation Profile of a 4 kW System in Tompkins County
Po
we
r G
en
era
ted
(kW
)
35
3
25
2
15
1
05
0
January
July
Jan 14 Jan 15 Jan 16 Jan 17 Jan 18 Jan 19 Jan 20
Jul 23 Jul 24 Jul 25 Jul 26 Jul 27 Jul 28 Jul 29
Figure 17 Hourly electricity generation of a 4 kW system in Tompkins County during 1 week in July July 24th-26th
show the energy profile of nice sunny days while the other days show how variable the energy production can be
when clouds or other weather patterns affect the amount of sunlight hitting the array
The total amount of energy generated by this system during this particular time frame would be
represented by the ldquoarea under the curverdquo of the generation profile Since the area under the curve
during July is greater than in January it is easy to see that the system will generate more electricity in
July For a monthly breakdown of the predicted amount of energy generated for a 4 kW system see
Figure 18 below As expected the energy produced peaks during the summer months and declines
24
during the winter Overall this system generates approximately 4400 kWh of energy during the course
of the year
Figure 18 Total energy produced per month Energy production peaks during the summer and tails off during the
winter
Tompkins County PV Potential
The overall PV potential for the county was broken down by sector into commercial industrial
educational and residential buildings Commercial and industrial potentials are discussed first as they
are relatively simple to calculate followed by schools and residential buildings for which PV potentials
are difficult to assess To calculate the PV potential of each sector the ldquoinstalled capacity potentialrdquo was
determined which refers to the amount of area that would be suitable for PV arrays and the resulting
kW value of panels that could be installed The installed capacity potential was then converted to an
anticipated potential electricity generation by multiplying the installed capacity potential by the 1100
kWh per installed kW value generated by IMBY From there the anticipated electricity generation
potential was related to each sectorrsquos electricity demand in order to determine the total impact
photovoltaics can make on electricity supply within the county
Commercial Potential
The main limiting factor in determining the potential size of a commercial system is roof area (although
the added weight of the panels could cause some structural issues this analysis will assume that the
buildings are structurally capable of supporting PV panels) In order to assess the commercial potential
roof area data was obtained from the Tompkins County Planning Department by way of the County
Assessment Department According to the data there are 2118 commercial buildings in the county
which range in size from hundreds of thousands of square feet for large stores and malls to hundreds of
25
square feet for smaller business buildings Some of these buildings would not be suitable for solar
panels because of their small size oddly shaped roofs andor potential shading obstructions However
a significant amount of energy can be generated from commercial PV with just a few of the largest
buildings
Table 8 below shows the roof area of the 10 largest commercial buildings within the county as well as
the cumulative county commercial building roof area The installed capacity potential is presented in
the ldquoInstalled Potentialrdquo column assuming the entire roof is covered with 120 ft2kW arrays which is
the roof area required for the planned Solar Liberty PV systems on Tompkins County Municipal Buildings
(see Solar Liberty Lease Program on page 49 for more information) The ldquonnual Energy Potentialrdquo
column represents the expected energy that could be generated from the installed capacity which was
calculated by IMBY to be approximately 1100 kWh per installed kW
The following two examples illustrate how the ldquoInstalled Potentialrdquo and ldquonnual Energy Potentialrdquo
columns were calculated for the Ithaca Mall
Installed Potential
Annual Energy Potential
It should be noted that these annual energy potential values represent the anticipated energy production for the
first year only Due to degradation of the panels over time (see Panel Degradation on page 14) the PV system
output may slowly decrease
26
Building Area (ft2) Installed Potential
(kW)
Annual Energy Potential
(million kWh)
1 Ithaca Mall 575559 4796 528
2 Cayuga Mall 211315 1761 194
3 Home Depot 198220 1652 182
4 Lowes 188861 1574 173
5 Triphammer Mall 173081 1442 159
6 Walmart 156883 1307 144
7 Tops Plaza 124966 1041 115
8 Wegmans 122195 1018 112
9 East Hill Plaza 117451 979 108
10 Big K-Mart 112934 941 104
Total (Top-10) 1981463 16512 182
Total (Entire County) 10273216 85610 942
Percent of 200 Commercial El8 ectricity Demand 27 Table 8 Footprint of the 10 largest commercial buildings in the County and the PV generation potential based on
120 ft2 per kW installed and 1100 kWh of electricity per kW installed ldquoPercent of 2008 Sector Electricity Demandrdquo
represents the Entire County Annual Energy Potential as a share of electricity demand in the commercialschools
sector An asterisk indicates that the building is currently vacant
It is unlikely that every square inch of a buildingrsquos roof can be covered with solar panels as obstructions
such as AC units and other rooftop devices will limit the available roof surface area In addition roofs
need to provide adequate space for maintenance staff so they can maintain the panels andor other
components of the building However the assumption that the roof is completely covered should
provide a reasonable estimate within an order of magnitude of the installed capacity potential of these
buildings Appendix C provides satellite images of the 10 largest commercial buildings in the county
Fortunately most of the buildings have flat relatively unobstructed roofs which would be ideal for solar
PV systems
To illustrate the potential of the largest commercial buildings within the county Figure 19 shows the
cumulative PV electricity potential for all 2118 commercial buildings in the county The size of the
buildings is decreasing to the right meaning the largest buildings in the county are at the leftmost
portion of the chart The top 10 largest buildings in the county have the ability to cover nearly 20 of
the electricity potential at 182 million kWh The chart also shows that half of the commercial electricity
potential for the county (473 million kWh) can be provided with less than 10 of the buildings (180
buildings) Finally the largest 50 of buildings in the county represent roughly 87 of the potential
installed capacity (825 million kWh)
According to the Tompkins County Community Greenhouse Gas Emissions Report 1998-2008 total
electricity demand in the commercialschools sector in 2008 was 348 million kWh If the full potential of
commercial buildings were to be reached the buildings could produce around 27 of the sectorrsquos
electricity with photovoltaics
27
P
V E
lect
rici
ty P
ote
nti
al (
mill
ion
kW
h)
Commercial PV Electricity Potential 95 million kWh
100 90
90 80
80 70
70 60
60 50
50 4040
3030
2020
10 10
0 0
0 500 1000 1500 2000
0 20 40 60 80 100 Largest Smallest Number of Commercial Buildings
Figure 19 Cumulative potential installed capacity of commercial PV as a function of the number of buildings The
size of the buildings is decreasing to the right meaning the largest buildings in the county are on the far left of the
graph
Industrial Potential
The industrial potential was determined using the same method as the commercial potential In the
county there are 232 industrial buildings with a total PV electricity potential of around 245 million
kWh Table 9 shows the 10 largest industrial buildings in the county as well as the overall industrial PV
potential
28
Building Area (ft2) Installed
Potential (kW)
Annual Energy Potential
(million kWh)
1 Borg Warner 552395 4603 528
2 Morse ChainEmerson Power Transmission Site 278409 2320 194
3 Borg Warner 227005 1892 182
4 Vanguard Printing 176082 1467 173
5 South Hill Business Campus 136574 1138 159
6 Morse ChainEmerson Power Transmission Site 106979 891 144
7 Cargill De-Icing Technology 87079 726 115
8 TransAct Technologies 75239 627 112
9 Therm Incorporated 73091 609 108
10 Cargill De-Icing Technology 63659 530 104
Total (Top-10) 1776511 14804 163
Total (Entire County) 2671386 22262 245
Percent of 2008 Industrial Electricity Demand 17 Table 9 Footprint of the 10 largest industrial buildings in the County and the PV generation potential based on 120
ft2 per kW installed and 1100 kWh of electricity per kW installed ldquoPercent of 2008 Sector Electricity Demandrdquo
represents the Entire County Annual Energy Potential as a share of electricity demand in the industrial sector An
asterisk indicates that the building is currently vacant
Similar to the commercial potential the majority of the industrial PV potential can be met with just the
largest buildings Figure 20 shows the cumulative PV electricity potential of all 232 industrial buildings
in the county Once again the size of the buildings is decreasing to the right meaning the largest
buildings in the county are at the very left of the chart The top 10 buildings in the county account for
roughly 67 of the potential PV energy or 163 million kWh The chart also shows that half of the
installed capacity potential for the county (121 million kWh) can be reached with only the 5 largest
buildings Furthermore the largest 50 of buildings in the county represent roughly essentially all of
the potential installed capacity
According to the Tompkins County Community Greenhouse Gas Emissions Report 1998-2008 total
electricity demand in the industrial sector in 2008 was 138 million kWh If the full potential of industrial
buildings were to be reached they could produce around 17 of their own electricity with
photovoltaics
29
P
V E
lect
rici
ty P
ote
nti
al (
mill
ion
kW
h)
Industrial PV Electricity Potential 24 million kWh
100
90
2080
70
1560
50
40 10
30
20 5
10
0 0
0 50 100 150 200
0 20 40 60 80 100
Largest Number of Industrial Buildings Smallest
Figure 20 Cumulative potential installed capacity of industrial PV as a function of the number of buildings The
size of the buildings is decreasing to the right meaning the largest buildings in the county are on the far left of the
graph
School Building Potential
Since Tompkins County is home to a number of large educational buildings a similar approach was
applied to the largest school buildings in the County Table 10 shows the 10 largest school buildings in
Tompkins County and their roof areas These buildings have many more obstructions and odd contours
than the commercial buildings and are therefore less ideal for solar installations Nonetheless they still
offer a large amount of space for installing solar panels The values in the ldquopercent availablerdquo column
indicate roughly what percentage of the roofs would be usable for solar panels using aerial images
Appendix D shows the aerial images that were used to make these estimates
30
Building Area (ft2) Percent
Available Installed Potential
Available (kW)
Annual Energy Potential
(million kWh)
Ithaca High School 1 222484 70 1298 143
Dryden High School 2 179743 50 749 0824
TC3
Cornell Vet School
3
4
157088
138050
70
50
916
575
100
0633
Charles O Dickerson High School 5 116211 80 775 0852
Groton Elementary School 6 96574 90 724 0797
Duffield Hall (Cornell)
Barton Hall (Cornell)
7
8
94771
91762
20
50
158
382
0174
0421
Bartels Field House (Cornell) 9 90568 90 679 0747
Boynton Middle School 10 89901 60 450 0494
Total (Top-10) 1212337 6706 738
Total (Entire County) 9422465 ~50 39260 432
Percent of 2008 CommercialSchools Electricity Demand 13 Table 10 Footprint of the 10 largest commercial buildings in the County and the PV generation potential based on
120 ft2 per kW installed and 1100 kWh of electricity per kW installed ldquoPercent availablerdquo was estimated from
satellite images of the 10 largest buildings and assumed to be 50 for the entire county estimate ldquoPercent of
2008 Sector Electricity Demandrdquo represents the Entire County Annual Energy Potential as a share of electricity
demand in the commercialschools sector
Since school buildings have less ideal roofs for solar systems than either commercial or industrial
systems it is difficult to estimate the overall potential for the county like in the commercial and
industrial cases Assuming that 50 of the total school roof area in the county is usable for PV systems
the total installed capacity should be almost 40 MW (Figure 21) resulting in 43 million kWh of PV
electricity
31
P
V E
lect
rici
ty P
ote
nti
al (
mill
ion
kW
h)
School Building PV Electricity Potential 43 million kWh
100
4090
3580
70 30
60 25
50 20
40 15
30 10
20
510
0 0
0 200 400 600 800
0 20 40 60 80 100
Largest Number of School Buildings Smallest
Figure 21 Cumulative potential installed capacity of school building PV as a function of the number of buildings
The size of the buildings is decreasing to the right meaning the largest buildings in the county are on the far left of
the graph
Residential Potential
Since there are so many variables involved with installing solar energy systems on homes it is difficult to
estimate the overall residential potential for the county Not every house has an ideal roof for solar
panels due to a wide range of factors including limited roof area roof obstructions or shading issues
Nevertheless it is possible to estimate the energy potential of residential PV systems within the county
when operating under a few calculated assumptions
Number of Homes
Tompkins County Housing Units in Structures of 1-9 Units in Size
Urban 8797 housing units
Rural 16249 housing units
Total 25046 housing units
Katherine Borgella Principal Planner with the Tompkins County Planning Department issued the
following statement regarding the number of homes in the county
32
ldquoThese data were calculated by the Tompkins County Planning Department using US Census 2006-2010
American Community Survey 5-Year Estimates Figures were determined by allocating housing units per
structure to determine an estimated number of housing structures in Tompkins County as follows
1 unit (attached or detached) = 1 structure
2 unitsstructure = total units reported divided by 2
3-4 unitsstructure = total units reported divided by 35
5-9 unitsstructure = total units reported divided by 7
ldquoThis essentially is dividing the number of housing units located in 1-9 unit size range structures by the
average of the unit range as presented in the American Community Survey For example in the City of
Ithaca there are 1881 housing units in structures of 5-9 units in size In order to estimate the number of
structures that contain those housing units 1881 was divided by 7 Multi-unit structures that include 3-
9 housing units were considered with this analysis because it was assumed that these structures were
likely to be built in a similar fashion and have similar potential roof area for solar PV as 1-2 unit
structures
ldquoThis methodology omits 4695 multi-unit (those that include 10+ units) housing that will need to be
evaluated in the future likely by identifying solar-appropriate roof area potential in a manner similar to
this reports work on commercial sites Furthermore 3993 mobile home units were not included in the
analysis They may be evaluated for community or joint-ownership opportunities for solar potential in
the futurerdquo
Number of Homes with PV Potential
Art Weaver CEO of Ithaca based Renovus Energy estimates that of these 25046 homes about 80
(20037) have the potential for solar energy systems (Weaver 2012) The other 20 are impractical for
solar system use due to shading issues of nearby trees or buildings or inadequate roof or land area It
will be assumed that homes in rural areas have enough open space to install either a roof mounted or
ground mounted system and that all of the unsuitable homes are located in urban areas Given this
assumption there are 3788 urban households and 16249 rural households that are suitable for
installing a solar PV system Table 11 below shows the number of households in urban and rural areas
in the county overall versus the number of households that would benefit from solar energy systems
based on rt Weaverrsquos 80 estimation
TC Housing units 80 Scenario
Urban 8797 Urban 3788
Rural 16249 Rural 16249
Total 25046 Total 20037
Table 11 Number of households in Tompkins ounty in urban and rural areas ldquo80 Scenariordquo refers to the
estimate that 80 of the households in the county have the potential for PV systems It is assumed that all rural
33
households have enough area to install PV systems so the only homes in the county that are excluded are in urban
areas due to closely spaced houses limited roof area and numerous trees that could cause shading
PV Potential Calculations
As previously mentioned the county used 293 million kWh of electricity for residential purposes in 2008
(TCPD) Since IMBY calculated around 1100 kWh of electricity should be produced for every kW of
installed capacity the hypothetical installation capacity required to meet this entire demand would be
Since this value of 266000 kW (266 MW) is such a large number the county should make a point to
encourage energy efficiency in conjunction with renewable energy investment in order to lessen the
overall energy burden of the county Because energy efficiency is outside the scope of this report the
current energy usage patterns will be analyzed which could hopefully improve in the future with more
energy efficient buildings and appliances
To hypothetically meet the entire residential electricity demand from 2008 with photovoltaics every
house in the county would need to install a 133 kW system
This is an extremely large system that would generate about twice as much electricity as the average
Tompkins County household would require Since it is unlikely that 100 of the countyrsquos residential
electricity demand will be met with photovoltaics a few more assumptions will be applied to the
analysis as described below
Urban Systems
The current average size of a PV system in the downtown Ithaca area with closely spaced houses and
numerous trees is 3 kW (PowerClerk) Using the previous assumption that there are 3788 urban
households with the potential for PV systems and the average 3 kW installed system for each home the
urban residential installed capacity would be around 11000 kW (11 MW)
Rural Systems
In contrast to urban households rural homes tend to have much more roof andor land area upon
which to install a PV system Rural areas are typically unencumbered by shading obstructions and
should have enough roof or land area to install a system large enough to meet the majority of their
electricity demands Given that a 7 kW system will provide nearly 100 of the average Tompkins
ounty householdrsquos electricity it will be assumed that every rural household in the county has the
potential to install a 7 kW system As such this would result in a rural installed capacity of 113000 kW
(113 MW) and a total residential capacity of 136000 kW (136 MW) as shown below in Table 12 This
34
would result in an annual photovoltaic electricity generation of approximately 136 million kWh or
roughly 46 of total residential demand
Urban Rural
Homes 3788 16249
Avg system size (kW) 3 7
Total Installed Capacity (MW) 11 113
Energy potential (kWh) 12 million 124 million
Total Potential Energy (kWh) 136 million
of Total Demand 46
Table 12 Installed capacity and total energy generation potential of Tompkins County residential solar PV given
an average size of 3 kW for urban systems and 7 kW for rural systems Energy Potential was calculated based on
1100 kWh of electricity for every kW of installed PV capacity These are very rough estimates of the potential and
are likely best case scenarios that can only be achieved with large scale community participation and involvement
Once again this is only a potential estimate and is not a prediction of the amount of residential PV that
will be installed within the county The actual number and scale of residential PV systems installed
within the county will likely be less than the estimates but this can be seen as an upper-bound
potential Nevertheless this should be seen as an encouraging sign that Tompkins County could
potentially supply almost half of its residential electricity with solar energy If homeowners within the
county invest in supplemental energy efficiency measures it does not seem outlandish to think that half
of the countyrsquos residential electricity can be produced using photovoltaics
Total Photovoltaic Potential
Compiling all of the potentials from each sector Table 13 shows the installed capacity potential and
expected energy potential for the entire county As can be seen from the table below nearly 40 of the
countyrsquos electricity demand could be met with photovoltaics assuming large scale community
involvement and participation If these efforts are met with improved energy efficiency measures the
share of electricity produced from photovoltaics could potentially be even higher
Photovoltaic Potentials by Sector Capacity Potential
(MW) Energy Potential (million kWh)
Percent of Electricity Demand
Commercial 86 95 27
Industrial 22 24 17
Schools 39 43 13
Residential 124 136 46
Total 271 298 38 Table 13 Upper limit photovoltaic potentials by sector Nearly 40 of the countyrsquos electricity needs can be met
with photovoltaics Combined with improved energy efficiency this value could even be higher
35
Solar System Costs
Module Prices
The biggest reason for the recent precipitous drop in solar PV costs is the falling price of silicon and
silicon based modules As can be seen in Figure 22 the price of PV modules has fallen over 50 since
2009 This has put tremendous stress on PV manufacturers but has been a boon for PV installers as well
as home and business owners who wish to install PV systems A few module price statistics are shown
below in Table 14 which is the result of a survey 1000 PV companies in March 2012 Currently there
are 329 available solar modules that are less than $2 per watt a price that is getting close to fossil fuel
grid parity (which is discussed further in the Grid Parity of Solar PV section on page 46) (Solarbuzz 2011)
Furthermore Ernst amp Young analysts predict that the price decline will continue through 2012 with the
potential for modules to drop to the $070 per watt range (Ernst amp Young 2012)
Figure 22 Historical price of solar modules Module price has dropped by more than 50 in the last 10 years
Current Module Prices (per Wp)
Average Price $229
of prices below $2Wp 329
Lowest mono-cSi price $110
Lowest poly-cSi price $106
Lowest Thin Film price $084
Table 14 PV module price data from a survey of 975 companies in March 2012 It should be noted that these are
prices for just the modules and is only a portion of the total installed system cost Source Solarbuzzcom
36
Installed System Prices
While the solar panels themselves actually turn the sunlight into electricity there are a number of other
costs that go into installing a photovoltaic system In addition to the cost of the modules are the cost of
the inverter balance of system (BOS) costs ie all of the mounting and other equipment that goes along
with installing the modules installation costs and ldquootherrdquo costs such as site evaluations tax or
regulatory work and any other expenses that go along with installing a PV system
Figure 23 shows the cost breakdown of a solar PV system by component in 2005 and 2012 The 2005
chart shows that the cost of the modules accounts for over 50 of the cost of a PV system In
comparison the relative cost of modules in 2012 dropped to 41 of the total cost of the system This is
due to the previously mentioned rapidly falling price of modules All other system costs are relatively
stable and have only decreased a small percentage as compared to module price In terms of overall
cost the 2011 system is 25 less expensive than the 2005 system
55
10
9
9
17
Cost of PV System 2005
Modules
Inverter
BOS
Installation
Other
Price per Watt $773
41
13 11
11
24
Cost of PV System 2012
Modules
Inverter
BOS
Installation
Other
Price per Watt $554
Figure 23 Cost breakdown of a PV system by components 2005 chart comes from lecture slides of Tobias
Hanrath PhD Cornell University 2012 chart was developed using the change in module pricing shown in Figure
22 to determine the approximate cost of modules today All other variables were held constant
Ernst and Young tabulated the average PV system price by sector from 2010-2011 which is shown
below in Figure 24 Each bar represents a quarter of the year and each grouping of bars represents a
different end use segment The first two groupings residential and commercial are of interest to this
report as utility scale PV solar farms are more suited to high-grade solar climates such as Arizona and
Nevada Looking at the residential segment the average installed price per watt has decreased by
nearly $1 in just the past two years At the end of 2011 the average residential system installed price
was $618W with a range of about $450W to $800W The commercial segment shows economies
of scale as the average price of this segments is $492W ranging from about $325W to nearly
$800W
37
Figure 24 Average of installed system PV prices for 2010-2011 Average prices are broken down by end use sector
and by quarter The residential and commercial segments are of particular interest as utility scale PV investment is
unlikely due to the lower-grade solar resource The dashed line represents the range of prices during the fourth
quarter of 2011
Tompkins County System Prices
Of the 192 PV systems in Tompkins County 170 are residential with an average size of 49 kW and an
average price of $811W (PowerClerk) This is a relatively high price compared to current installations
but systems installed in 2011 had an average price of $663W slightly higher than the average shown
above The 3 systems approved for installation already during 2012 have an average price of $599W
which is slightly below the average Q4 2011 price (PowerClerk)
In addition to the 170 residential systems there are 22 commercialindustrial systems with an average
size of 18 kW and an average price of $606W Once again economies of scale allow for a lower price
of larger commercial installations as compared to residential systems During 2011 there were 10
commercialindustrial systems installed with an average price of $555W (PowerClerk) This is slightly
above the average value of $492 but well within the reported price range
PV System Net Cost Breakdown
Ithaca based Renovus Energy provides a chart on their website displaying rough estimates of the costs
and incentives for a few different sized systems and mounting styles (roof or ground) This table has
been updated to take into account the recent drop in PV prices and can be seen in Table 15 These
values are only rough approximations as every case is different These numbers can be used as a rule of
thumb however and should provide a reasonable ldquoballparkrdquo estimate of the initial up front cost facing a
38
homeowner wishing to install a PV system The estimated installed cost per watt of each size for a roof
mounted system is $7 $6 and $5 per watt for the 2 kW 4 kW and 6 kW systems respectively The
ground mounted systems are slightly higher at $750 $650 and $550 per watt Since PV systems are
not a ldquouniform commodityrdquo is difficult to determine with certainty an installed price per kW as
individual circumstances always have some sort of influence on the price (Vanek 2012)
System Size
Mount Style
Gross Cost
NYSERDA Incentive
NYS Tax Credit
Fed Tax Credit
Total Incentives
Net Cost
2 kW Roof $14000 -$3000 -$2750 -$3300 -$9050 $4950
Ground $15000 -$3000 -$3000 -$3600 -$9600 $5400
4 kW Roof $24000 -$6000 -$4500 -$5400 -$15900 $8100
Ground $26000 -$6000 -$5000 -$6000 -$17000 $9000
6 kW Roof $30000 -$9000 -$5000 -$6300 -$20300 $9700
Ground $33000 -$9000 -$5000 -$7200 -$21200 $11800
Table 15 Costs and incentives of various sized systems and mounting styles from the Renovus Energy website
updated for decreased cost of photovoltaics These numbers are only rough estimates and should only be used as a
rule of thumb as every situation will be different Detailed descriptions of the incentives are given in the PV
Financial Programs and Incentives section
As can be seen from the above table there are a number of financial incentives that can alleviate the
cost burden to homeowners who wish to install PV systems The details of the incentives are discussed
in depth below in the PV Financial Programs and Incentives on page 40
Table 16 below shows the expected energy savings of each system given a PV electricity production of
1100 kWh per installed kW and a residential electricity price of 14₵kWh ldquoSimple Payback Timerdquo refers
to how long it will take for the energy savings to pay for the system at which point the system will
actually begin making money for a homeowner This calculation uses the costs for roof mounted
systems in Table 15 and no interest rate An example calculation of a 2 kW system is shown below
System Size
of Average Household Electricity Demand
Annual Electricity Savings
Simple Payback Time (years)
2 kW 28 $308 16
4 kW 55 $616 13
6 kW 83 $924 11
Table 16 Annual energy savings for each system size based on an average of 1100 kWh per installed kW of
capacity and an electricity rate of 14₵kWh Simple payback time is an approximation of the time for the electricity
savings to pay for the system assuming roof mounted systems from Table 15 and no interest rate
Net Metering
Since 1997 New York State has offered net metering for residential photovoltaic systems (DSIRE New
York ndash Net Metering) This means that homeowners will only be charged for the net amount of
electricity consumed ie total electricity consumed minus solar electricity produced In the above
39
example for a 4 kW system the net amount of energy that the homeowner pays for during the year
would be 3496 kWh (7837 kWh consumed ndash 4341 kWh solar electricity produced) Any situation
where PV electricity exceeds demand will be carried over month to month
If there is still excess at the end of the year however the excess will be bought back at the wholesale
rate which is typically much lower than the retail rate that the customer pays As such it makes the
most economic sense to have a system that provides less electricity than the home or business uses
over the course of a year as any excess will be sold back at a much lower price
PV Financial Programs and Incentives
Traditional Financing Arrangements
Historically homeowners who wished to install PV systems on new homes have used home equity loans
mortgage loans or cash to pay for the leftover sum after federal state and utility incentives were
applied One benefit of using a home equity loan or a refinanced mortgage loan is that interest paid on
these loans may be tax deductible Much like other home improvements home owners can draw on
standard home equity lines of credit take out a home equity loan or take cash out of a home mortgage
refinance to help pay for the cost of their PV system The primary determinants of the amount of
money that can be borrowed are the equity value of the home combined with the credit score of the
homeowner (Coughlin and Cory 2009)
Alternative Financing Arrangements
In addition to the traditional financing arrangements mentioned there exist a few newer financial
models that can help lower the financial burden of a residential PV system Not all of these options are
available in New York State (I donrsquot think I will inquire with the contact I made at NYSERD) but they
are options that the state and county could look into in the future
Third Party Ownership Models
These are financing arrangements such as solar leases and residential power purchase agreements (PPA)
can take advantage of commercial tax benefits and reduce the up-front costs to the homeowner while
also relieving the homeowner of maintenance responsibilities In a solar lease program the homeowner
does not purchase the system instead they enter into a contract with the PV installer to make monthly
lease payments over a specified period of time At the end of the lease there may be a purchase
option whereby the homeowner can purchase the system Alternatively the homeowner may be able
to extend the lease or have the system removed at the end of the lease Leases may involve the PV
installer guaranteeing maintenance over the course of the lease relieving the homeowner of any
maintenance responsibilities (Coughlin and Cory 2009) This model could help homeowners who desire
a PV system but are intimidated by the large up-front costs
A PPA is an attractive model for large PV systems in the commercial and public sector and has begun to
work its way to residential customers as well Similar to a solar lease program a PPA takes advantage of
40
the federal PV tax incentives available to non-residential owners since the PV installer will own the
system The PV installer agrees to purchase install own operate and maintain the PV system while
the homeowner simply agrees to host the system The homeowner and PV installer will then agree on a
price the homeowner will pay the installer for the electricity that is produced from the system Once
again this relieves the homeowner of the large up-front cost of a PV system as well as the operation and
maintenance responsibilities At the end of the PPA the homeowner may elect to renew the contract
purchase the system or have the system removed As the PPA model is new however there may be
other end-of-term options that develop moving forward as the market matures (Coughlin and Cory
2009)
Property Tax Assessment Model
This model is being piloted in Berkeley California Palm Desert California and Boulder Colorado and
addresses two of the major barriers associated with residential PV systems high up-front cost and the
difficulty of recouping a 20-year investment when the homeowner may have moved in that time frame
The model involves loans made by a city to homeowners to purchase and install PV systems
The city raises the money for the program by issuing long-term bonds (Berkeley and Boulder) or tapping
into the cityrsquos general fund (Palm Desert) The city then makes loans to homeowners to finance the
installation of PV systems which are paid back over a long period of time (20 years in the case of
Berkeley) via a special property tax assessment that is collected annually or semi-annually The only upshy
front cost is a small administrative cost of entering into the agreement In addition if the homeowner
decides to sell the home before the term of the agreement is up the PV system and associated special
property tax remains with the house In this instance the homeowner only pays the associated tax
while living in the house and when the home is sold the new homeowner assumes the cost of the
system until the tax assessment is paid off or they move (Coughlin and Cory 2009)
Solar Renewable Energy Certificates
Solar Renewable Energy Certificates (SRECs) represent the environmental benefits of electricity being
produced from a PV system New Jersey is one state that has been utilizing this model through its
Renewable Portfolio Standard (RPS) One of its utilities PSEampG has declared that it will comply with the
statersquos RPS through obtaining SRECs through a new solar loan program The loan size for a PV system is
based on the expected total generation of SREs over the course of the systemrsquos life so that the revenue
from SREC sales closely matches the loan payments The homeowner agrees to sell all SRECs generated
by their system which would be supplemented by cash payments if the PV system does not generate
the expected SRECs
NYSERDA Renewable Portfolio Standard
In 2004 the New York State Public Service Commission issued an order adopting a Renewable Portfolio
Standard (RPS) with the goal of increasing the percentage of renewable energy used in the state to 25
by 2013 As part of the plan the Commission appointed NYSERDA the administrator for the RPS
41
program In 2009 the Commission undertook mid-course review of the RPS program and expanded the
RPS goal to 30 renewables by 2015 (NYSERDA)
The RPS energy targets fall into three different groups Main Tier Generators large scale generators
that sell power to the wholesale grid Customer Sited Tier small scale distributed generators and Other
Market Activites individuals and businesses that choose to pay a premium on their electricity bills to
support renewable energy development This report will focus on the Customer Sited Tier (CST) which
was updated in April 2010 to include more ambitious goals for energy generation The CST portion of
the RPS actively supports enrollment in programs for photovoltaic systems supported by the NYSERDA
Solar PV Incentive Program (NYSERDA)
NYSERDA Incentive
The main incentive Program Opportunity Notice 2112 (PON 2112) provides cash incentives of $150 per
watt to help reduce the costs of installation of grid-connected PV systems 7 kW and smaller As a
reference NYSERDA determined that a 2 kW system provides about 20-30 of an average homersquos
energy needs which is consistent with previously calculated average Tompkins County household
percentage of 28 As of April 2012 PON 2112 has $132 million available and will be accepting
applications on a first-come first-served basis until December 31 2015 or until the funds are fully
committed whichever comes sooner ustomers must purchase their PV systems from an ldquoEligible
Installerrdquo that has demonstrated technical competence in the field of photovoltaic systems Incentives
are paid directly to the Eligible Installer but must be passed on to the consumer Incentives are capped
based on a PV system size that does not exceed 110 of the previous 12 monthrsquos energy usage In
general incentives cover 25-35 of the overall costs of installation but not more than 40 after all tax
credits are applied (NYSERDA)
The full description of the program can be found here httpwwwnyserdanygovFundingshy
OpportunitiesCurrent-Funding-OpportunitiesPON-2112-Solar-PV-Program-Financialshy
Incentivesaspxsc_database=web
New York State Tax Credits
In addition to direct incentives there are also tax credits and incentives that can be applied to
residential solar systems Since tax issues can become very complicated only a basic overview of the tax
opportunities available will be presented New York State offers a tax credit of 25 of the system
expenditures (after incentives have been applied) capped at $5000 The system must be grid-tied and
net metered and any excess credits can be carried forward five years (DSIRE Residental Solar Tax
Credit)
The full statute can be found here httpwwwdsireusaorgdocumentsIncentivesNY03Fhtm
New York State also recognizes that a PV system may increase the value of a property If the municipal
assessorrsquos office determines that it does this would increase the homeownerrsquos property tax burden As
such the state provides 15 year property tax exemptions for systems purchased and installed before
42
January 1 2015 The total amount of the exemption is equal to the increase in assessed value
attributable to the solar system (DSIRE Local Option)
The full statute can be found here httpwwwdsireusaorgdocumentsIncentivesNY07Fhtm
A property tax exemption handbook can be found here
httpwwwdsireusaorgdocumentsIncentivesNY07Fbpdf
Federal Tax Credits
Finally the federal government also offers a tax credit of 30 for residential PV systems Due to
recently passed legislation there is now no cap on the amount that may be claimed The tax credit is
calculated from the net cost of the system after any direct incentives such as the NYSERDA incentive
which are not federally taxable (Boler 2012)
The full statute can be found here httpwwwdsireusaorgdocumentsIncentivesUS37F1pdf
The application for the tax credit (Federal tax form 5695) can be found here httpwwwirsgovpubirsshy
pdff5695pdf
There is a degree to subtlety to the federal tax credit though because it is only a credit against federal
taxes owed It is not a line item deduction to lower a homeownerrsquos tax liability nor an automatic refund
from the government The homeowner must owe federal taxes and the tax credit is simply carved out
of that If the tax credit is larger than the homeownerrsquos federal tax burden for the year the remaining
balance may be rolled over one more year but no more (Gordon 2010) So if for example a
homeowner owes $5000 in federal taxes in the two years following the installation of a PV system and
the federal tax credit comes to $6000 then the homeowner will have lost that extra $1000 credit This
is why it is imperative for homeowners to speak with tax professionals before committing to a PV
system to ensure they are receiving the full benefit
As mentioned before there is also a ldquoFederal Tax Increaserdquo that goes along with installing a PV system
This essentially negates part of the state tax credit because the state credit will likely increase the
homeownerrsquos federal tax liability due to a higher reported income This could cause the homeowner to
fall into a different tax bracket and pay more because of it (Boler 2012) Since this is such a complicated
issue and unique to each individual it is omitted from the previous calculations of net cost in Table 15
Furthermore every home or business owner should talk to his or her accountant before installing a
photovoltaic system to ensure the incentives are calculated properly
NYSERDA Clean Power Estimator
Since every situation is different and there are an endless amount of different variables that can
influence the cost performance and selection of a PV system NYSERDA has developed an online
calculator called the Clean Power Estimator to help home and business owners decide if a PV system is
right for them
43
The estimator can be found here httpnyserdacleanpowerestimatorcomnyserdahtm
With the Clean Power Estimator a home or business owner can input a variety of different variables
ranging from PV system specs to financial assumptions and tax considerations Figure 25 shows the
calculator with the default inputs for Ithaca and a system summary It shows a 4 kW system with an
overall cost before incentives of $24000 which is the same as a roof mounted system in the above
table Also the calculated annual electricity generation of 4304 kWh is close to the average estimate
used in this report of 4400 kWh The net cost is slightly different because of the ldquoTotal Federal Tax
Increaserdquo portion in the bottom right This is discussed above in the Federal Tax Credits section but
essentially this is dependent on the individual homeownerrsquos tax liability which will be different for each
situation
The Estimator allows individuals to tailor the PV system to their needs based on each home or
businessrsquos electricity usage and desired energy savings The tool allows for the adjustment of system
size tilt angle cost per watt and operation and maintenance costs among other things It also allows
the user to input a number of financial assumptions including the price of a typical electric bill how
much the user anticipates this price to increase and seven different methods of payment These
methods are pay cash new home loan refinance tax-deductible loan non-tax deductible loan lease
and power purchase agreement Each method has further settings that can be adjusted to better suit
each individual system
Once the Estimator has the required inputs it will calculate a system summary which includes a net cost
after benefits PV electricity production percentage of household electricity supplied by the PV system
and CO2 emission reduction In addition it shows internal rate of return net present value and years to
payback estimates This is a quick snapshot of the benefits of the system and can provide a quick
glimpse of what kind of investment a PV system would be given the selected parameters
The Estimator also includes more in depth tables in graphs which the user can click on and view It
allows users to see net cost for year 1 a monthly breakdown of the userrsquos electric bill and PV
generation a daily breakdown by month of both PV electricity production and net electricity usage four
different in-depth cash flow charts and a description of the PV systemrsquos environmental benefits and
pollution prevention Overall the Clean Power Estimator is a thorough easy to use tool that can offer a
great deal of insight to any home or business owner who is thinking about installing a PV system This
tool could be used as an educational instrument to show individuals the benefits of a PV system
installed at their home or place of business
44
Figure 25 NYSERDrsquos lean Power Estimator with default inputs for Ithaca and system summary
45
Grid Parity of Solar PV
Grid parity is a commonly used term within renewable energy circles and it refers to the time when the
lifetime cost of generating PV electricity is comparable to the cost of electricity from conventional
sources on the grid term called ldquolevelized cost of electricityrdquo (LOE) is used to relate costs on an
apples-to-apples basis between different energy sources The lower the LCOE the better so a main goal
of the solar industry is to lower the LCOE of solar energy equal to or below the LCOE of generating
electricity for the grid
If the total lifetime cost of generating electricity from a PV system is equal to the cost of receiving that
energy from the grid the system is said to have reached grid parity Solar systems in states with high
residential electricity prices (Hawaii 3621 ₵kWh Connecticut 1817 ₵kWh Alaska 1776 ₵kWh) will
reach grid parity much sooner than in states with low residential electricity prices (Idaho 745 ₵kWh
Louisiana 830 ₵kWh North Dakota ₵kWh) (EIA Electric Power Monthly) In this case the
homeowner is not only decreasing his or her carbon footprint but also saving money at the same time
It is easy to see why reaching grid parity has become a focus of many firms in the solar industry
A recent study has reviewed the LCOE of solar photovoltaics and has found that many of the
assumptions in previous LCOE calculations are outdated or incorrect They have found that PV has
reached a ldquotipping pointrdquo and that solar has gone past grid parity in some cases The study reviewed
over 40 PV LCOE calculations that have been done and analyzed the assumptions that were made as
well as their validity The LOE estimates ranged from a low of 62 ₵kWh to a high of 86 ₵kWh which
shows the large impact that different assumptions can have on these estimates (Branker Pathak and
Pearce 2011) The researchers were able to identify a few key parameters that affected every study
most notable being financing options module performance and module lifetime (Trabish 2011)
The study found that the largest and most important costs facing a homeowner are the upfront costs
and costs of financing They argue that policy and initiatives must be focused on these two areas in
order to make residential PV installations more affordable (Branker Pathak and Pearce 2011) Because
they found financing so crucial they posited that zero interest financing could be a more effective
incentive than a feed in tariff or tax credit Furthermore previous LCOE calculations are irrelevant to
todayrsquos systems because of the precipitous drop in module prices as well as decreasing BOS costs and
improvements along the supply chain and installation practices (Trabish 2011)
One widely held assumption about PV systems is related to the panelrsquos degradation over time It is
commonly assumed that a panel will lose about 1 of its efficiency per year (Note this does not mean
that a panel with 15 efficiency will be 0 efficient in 15 years It means that it will produce 85 of the
energy in year 15 as compared to year 1 ie reducing its overall efficiency to 1275) Branker Pathak
and Pearce found this assumption to be unreasonably conservative and suggested a degradation rate of
02 to 05 per year Even older panels produced in the 1980s have been shown to degrade slower
than the customary 1 mark and as technologies advance this rate should only decrease (Trabish
2011)
46
Finally the authors found that the common assumption of a 20 year panel lifetime was also too
conservative They assert that at least a 30 year lifetime should be used in predicting the economic
performance of a system If lending institutions correcting the aforementioned misguided assumptions
in PV financing arrangements they should be more willing to finance PV systems at more beneficial
terms (Trabish 2011)
County Municipal Solar Installations
Tompkins County Public Library
In January 2002 the Tompkins County Public Library (TCPL) began receiving electricity from a 147 kW
photovoltaic system on the roof of the library The system consists of 1430 modules and covers a
surface area of 17222 ft2 The system provides roughly 13 of the overall energy use of the library and
to date has produced 989000 kWh of energy enough to power 83 homes for a year (Sunpower) In
addition the system has reduced carbon dioxide emissions by 750 tons which is roughly equivalent to
driving 15 million miles in an average car (Sunpower)
The system was a result of a request by Tompkins County Legislator Dooley Kiefer who approached the
Tompkins County Engineering Division (which has now been incorporated into the Facilities Division) to
explore the possibilities of installing a PV system on the roof of library during renovation The
Engineering Division went out in search of firms to install a PV system who then selected a proposal
from Powerlight (now Sunpower) out of California to install the system The county wanted to maximize
the amount of energy available on top of the roof and Powerlight did all of the design and installation
(LeMaro 2012)
One of the challenges in designing the system was the structural limitations of the roof which couldnrsquot
support the added weight a tilted panel system Structural reinforcement would be needed to
accommodate a tilted array system but the PV design was performed late in the process of renovating
the library so reinforcing the libraryrsquos structure would have been time consuming and costly (LeMaro)
As such the panels lay flat on top of the roof which results in an overall reduction in output when
compared to a tilted system
A concern with the design of the system is the presence of the Holiday Inn hotel across the street
Figure 26 shows a picture taken from the roof of the hotel with the hotel shading a large portion of the
PV array Arel LeMaro the Tompkins County Facilities Director emphasized that the hotel has little to
no effect on the overall energy generation of the system A cursory analysis of the hourly electricity
generation data throughout the course of a year reveals that there is no significant drop in electricity
production in the afternoon when the system would be shaded by the hotel Although a rigorous
statistical analysis would be necessary to completely support this argument this brief analysis seems to
reinforce Mr LeMarorsquos claim that the hotel does not significantly harm the PV systemrsquos energy
generation
47
Figure 26 Photo of the Tompkins County Public Library taken from the roof of the Holiday Inn across the street
Notice the shadow of the hotel blocking a significant portion of the solar panels from sunlight This is a problem
that should have been foreseen and avoided
Another concern regarding the PV array was the construction of the Cayuga Street Parking Structure
Figure 27 shows an aerial view of the location of the PV array the Holiday Inn and the parking structure
When the PV system was installed the lot where the parking structure stands was only used as surface
parking A few years after the panels had been installed the city decided to turn the surface parking
into a garage There was concern that the parking facility would shade the panels but it has since been
determined that the structure had minimal impact on the amount of energy generated by the PV array
For the small impact that it does have on the array the County has worked out an arrangement with the
city whereby the city will pay the county some amount to compensate for shading which the county
then uses for additional energy improvement measures on the library (LeMaro 2012)
48
Figure 27 Aerial view of the TCPL PV array with the Holiday Inn and Cayuga Street Parking Garage and their
approximate distances from the array Both structures only contribute a minimum amount of shading to the array
and do not affect its output significantly
In terms of operation and maintenance the system has been quite reliable There were some issues
with the inverter soon after completion of the installation but these repairs were covered by
Powerlightrsquos warranty and were done free of charge The inverters were guaranteed for 10 years and
the panels themselves were guaranteed for 25 years The most significant although still minor
maintenance issue has been vandalism that has arisen since the construction of the Cayuga Street
Parking Garage People have thrown bottles and rocks off the garage and onto the library roof which
has necessitated the replacement about a dozen of the panels Another unexpected issue has been
vegetation growing up between the panels causing minor shading This has been especially challenging
because the vegetation needs to be removed by hand due to the libraryrsquos policy on herbicide use Since
the panels are too fragile to walk on maintenance workers need to crawl out on pads to remove the
weeds while protecting the integrity of the panels So far only 2 of the 1430 panels have been replaced
due to failure of the panels from normal operation
Solar Liberty Lease Program
Late in 2011 Tompkins County entered into a 15 year lease with Buffalo based Solar Liberty for the
installation and maintenance of seven solar PV systems on top of county owned buildings The county
49
took advantage of a lease program offered through Solar Liberty where federal tax credits and
NYSERD grants cover most of the $1 million price tag In this program the county doesnrsquot actually buy
the panels from Solar Liberty instead they lease them for 15 years at the end of which the county has
the option of removing the panels or buying them at current market value (DiPietro 2011)
The seven systems consist of 6-25 kW arrays and one 20 kW array The 25 kW arrays are limited by
NYSERDrsquos cap on government systems of 25 kW to be eligible for financial incentives while the 20 kW
system is limited by the roof area of the intended building In contrast to the TCPL system these
systems will be installed with a 10 tilt which will help capture more solar energy throughout the year
In addition the tilted panels would help reduce any snow accumulation as well as mitigate the problem
of vegetation experienced with the TCPL system
The leasing program is a novel solution to the problem of up-front costs of solar installations While the
Tompkins County Facilities Division was researching PV installers Solar Liberty was the only one they
found that offered this leasing program in New York State Solar Liberty performs all of the engineering
design from determining if the roofs are structurally capable to hold the arrays to siting the arrays to
ultimately installing and maintaining the arrays If the county opts to remove the arrays at the end of
the 15 year term Solar Liberty will also remove the panels and any other associated equipment (LeMaro
2012) If Solar Liberty determines that there needs to be structural reinforcement however the county
will have to pay for that itself (DiPietro 2011)
The most attractive aspect of the leasing program was the cost A single 25 kW system would most
likely cost the county $150-200 thousand to install while the county will be paying Solar Liberty a little
over $10 thousand per year for all seven systems Over the 15 year life of the lease the county will pay
roughly the same amount to lease 7 systems as it would pay to purchase one system Even Mr LeMaro
admits this sounded too good to be true but Solar Liberty is banking on the aforementioned tax credits
NYSERDA grants and the hope that the State of New York will implement a Renewable Energy Credit
system whereby they will be able to trade credits with other companies (LeMaro 2012)
Table 17 shows the specifications of each of the installations (a more detailed description of the Solar
Liberty specifications can be found in Appendix E) The annual payment column represents the lease
payment that the county will pay to Solar Liberty each year and the Annual Savings column represents
the monetary energy savings minus the annual lease payment ie the county will save $19474 in total
energy bills while lease payments will be $10260 for a total savings of $9214 Finally the offset
represents the amount of energy that will be saved for each building given its historical energy
consumption It should be noted that the offset is high for the Human Service Annex because it has
been vacant and has had low energy usage Once it is occupied it will likely similar to Annex Building C
(LeMaro 2012)
50
Table 17 System specifications and estimated costs of the seven PV arrays of the Solar Liberty lease program
Note human service annex has been vacant and therefore has had a low historical electricity load which is the
reason for the large offset value Table provided by Arel LeMaro from interview on 232012
If a worst case scenario were to happen and Solar Liberty were to become bankrupt county attorney
Jonathan Wood said that ldquoit would be a breach of the lease and Tompkins County has various options to
protect the countyrdquo (DiPietro 2011)
Conclusions
The research presented in this report shows that the solar energy potential in the county is significant
With large scale community involvement and investment the county could generate a sizable portion of
its electricity with photovoltaics especially if combined with improvements in energy efficiency Table
18 below shows the calculated PV potential by sector for the county and each sectorrsquos share of total
electricity demand
Photovoltaic Potentials by Sector Capacity Potential
(MW) Energy Potential (million kWh)
Percent of Electricity Demand
Commercial 86 95 27
Industrial 22 24 17
Schools 39 43 13
Residential 124 136 46
Total 271 298 38 Table 18 PV potential by sector ldquoPercent of Electricity Demandrdquo refers to the energy potential in relation to each
sectorrsquos 2008 electricity usage as stated in the Tompkins County Community Greenhouse Gas Emissions Report
1998-2008 It should be noted that the demand for commercial and school buildings are grouped together in the
Greenhouse Gas report In other words the 95 million kWh energy potential of commercial buildings alone could
account for 27 of both commercial and school building electricity usage
51
In order to reach the large scale levels of photovoltaic investment listed in the table above PV
technologies need to reach grid parity without financial subsidies or incentives For the time being
however a number of financial incentives exist to encourage solar energy investment NYSERDA offers
a direct financial incentive along with tax incentives from the state of New York and the Federal
government Alternative financing arrangements such as solar leases and power purchase agreements
are becoming more popular and some cities in the US have actually loaned money to residents to
purchase and install solar systems using a special property tax assessment to repay the loan
Every home and business owner should seriously consider installing a PV system and the In My
Backyard tool (page 22) and Clean Power Estimator (page 43) should provide sound technical and
financial information on what individuals can expect out of a PV system Individuals should consult a
qualified solar installer for a site evaluation and cost estimate before deciding to purchase a PV system
and contact an accountant to clarify any tax issues
Tompkins County itself has already taken steps toward meeting its aggressive climate goals with two
major solar energy projects The first was the installation of 147 kW of solar photovoltaic panels on the
roof of the public library and more recently the county has entered into an agreement with Solar
Liberty of Buffalo to install solar photovoltaic systems on top of 7 county buildings Community leaders
hope that these systems will help to reduce overall greenhouse gas emissions within the county and
provide an example of how solar energy can help individuals reduce their utility bills and minimize their
impact on the climate
52
References
Borgella Katie 2012 Personal communication via email on 272012
ranker K Pathak MJM and Pearce JM 2011 ldquo Review of Solar Photovoltaic Levelized ost of
Electricityrdquo Renewable and Sustainable Energy Reviews December 2011 15 (9)
CLS 335-b New York State Consolidated Law Service Real Property Law Statute 335-b Found online at
URL httpwwwdsireusaorgdocumentsIncentivesNY01Rhtm
artlidge Edwin 2007 ldquoright Outlook for Solar ellsrdquo Environmental Research Web URL
httpenvironmentalresearchweborgcwsarticlenews30489
leantech Investing 2009 ldquoSolarridge and PV Microinverter Reliabilityrdquo URL
httpwwwgreentechmediacomgreen-lightpostsolarbridge-and-pv-micro-inverter-reliability
olville Finlay 2012 ldquoNPD Solarbuzz- Top-10 PV cell producers in 2011rdquo PVTech URL httpwwwpvshy
techorgguest_blognpd_solarbuzz_top_10_pv_cell_producers_in_2011
oughlin Jason and ory Karlynn 2009 ldquoSolar Photovoltaic Financing Residential Sector Deploymentrdquo
NREL Technical Report NRELTP-6A2-44853 March 2009
DOE US Department of Energy 2005 ldquoasic Research Needs for Solar Energy Utilizationrdquo
DSIRE Database of State Incentives for Renewables amp Efficiency
---- ldquoLocal Option ndash Solar Wind amp iomass Energy Systems Exemptionrdquo URL
httpwwwdsireusaorgincentivesincentivecfmIncentive_Code=NY07Fampre=1ampee=1
---- ldquoNew York-Net Meteringrdquo URL
httpwwwdsireusaorgincentivesincentivecfmIncentive_Code=NY05RampRE=1ampEE=1
---- ldquoResidential Solar Tax reditrdquo URL
httpwwwdsireusaorgincentivesincentivecfmIncentive_Code=NY03Fampre=1ampee=1
---- ldquoSolar Easements amp Local Option Solar Rights Lawsrdquo URL
httpwwwdsireusaorgincentivesincentivecfmIncentive_Code=NY01Rampre=1ampee=1
Dankoff Windy and Schwartz Joe 2007 ldquosk the Experts PV Longevity amp Degradationrdquo Homepower
Magazine AprilMay 2007 118 p 12 URL
httphomepowercomarticlefile=HP118_pg12_AskTheExperts_1
DiPietro Louis 2011 ldquoTompkins ounty Preparing to dd Solar Panels to Seven uildingsrdquo Ithacacom
URL httpwwwithacacomnewsarticle_3cf741c2-25dd-11e1-9f1c-001871e3ce6chtmlusershy
comment-area
53
Dolan Kerry 2010 ldquoEnphasersquos Rooftop Solar Revolutionrdquo Forbes November 8 2010 URL
httpwwwforbescomforbes20101108technology-enphase-energy-solar-power-rooftopshy
revolutionhtml
EI US Energy Information dministration ldquoElectric Power Monthly Data for December 2011rdquo URL
http20525413524electricitymonthlyepm_table_graphercfmt=epmt_5_6_a
Enviroharvest ldquoPV Shadingrdquo URL httpwwwenviroharvestcapv_shadinghtm
Ernst amp Young 2012 ldquoUnited States Renewable Energy ttractiveness Indicesrdquo February 2012 URL
httpwwweycomPublicationvwLUAssetsUS_Attractiveness_Indices_Issue$FILEUS_Attractiveness
_Indices_Issuepdf
GTM Research 2012 ldquoUS Solar Market Insight Report 2011 Year-In-Reviewrdquo Greentech Media and
Solare Energy Industries Association
ldquoGermany Your Unlikely World Leader in Solar Powerrdquo alfinder Nationwide Home Solar Power
Contractors and Information URL httpsolarcalfindercomblogsolar-informationgermany-yourshy
unlikely-world-leader-in-solar-power
German BMU Federal Ministry for the Envirionment Nature Conservation and Nuclear Safety 2010
Renewable Energy Sources 2010
Gerrard Michael B 2011 The Law of Clean Energy Efficiency and Renewables American Bar
Association
Gilmore Jeff 2012 Personal communication via email on 2292012
Gordon Scott 2010 ldquoSolar Energy and Federal Tax redits for Residential Solar Systemsrdquo Energy
Solutions October 27 2010 URL httpblogheliopowercomcategoryfederal-tax-credits
HRS Hotel Reviews Holiday Inn Hotel Downtown Ithaca URL
httpwwwhrscomukbookingenusaithaca-new-yorkholiday-inn-ithaca-downtown-137885html
Ithaca NY City Data URL httpwwwcity-datacomcityIthaca-New-Yorkhtml
Kissell Thomas E 2012 Introduction to Solar Principles Upper Saddle River NJ Prentice Hall
LeMaro Arel 2012 Personal interview conducted on 232012
NYSERDA New York State Energy Research and Development Authority New York Renewable Portfolio
Standard URL httpnyserdanygovPage-SectionsEnergy-and-Environmental-MarketsRenewableshy
Portfolio-Standardaspx
NREL National Renewable Energy Laboratory URL httpwwwnrelgov
54
Osborne Mark 2011 ldquoEnecsys offers 360W dual micro-inverter that maintains individual MPPTrdquo PV-
Tech March 7 2011 URL httpwwwpvshy
techorgproduct_reviewsenecsys_offers_360w_dual_micro_inverter_that_maintains_individual_mppt
PowerClerk 2012 NYSERDA PV Report URL
httpnyserdapowerclerkreportscomDefaultaspxReportId=1
QPK Design ldquoTompkins ounty Library 2020rdquo URL
httpmidhudsonorgadminfacilities_resourcesgreenQPK_Designpdf
Renovus Energy website Solar Electric section URL httprenovusenergycomsolar_electrichtml
SRETrade ldquoSolar Renewable Energy ertificates (SREs)rdquo URL
httpwwwsrectradecombackgroundphp
Shahan Zachary 2012 ldquo2011 US Solar Market Report ndash Top 7 Findings and hartsrdquo
CleanTechnicacom March 15 2012 URL httpcleantechnicacom20120315us-solar-facts-charts
Solarbuzz Solar Market Research and nalysis 2011 ldquoRetail Price Summary ndash December 2011 Updaterdquo
URL httpsolarbuzzcomfacts-and-figuresretail-price-environmentmodule-prices
Solar Facts and dvice ldquoSolar Panel Temperature ffects Output ndash Herersquos what you need to knowrdquo URL
httpwwwsolar-facts-and-advicecomsolar-panel-temperaturehtml
Steeby Donald 2012 Alternative Energy Sources and Systems Clifton Park NY Delmar Cengage
Learning
Sunpower Data Sheet E20435 Solar Panel Manufacturerrsquos Data Sheet URL
httpglobalsunpowercorpcomproductssolar-panels
Sunpower Performance Monitoring ldquoTompkins ounty PowerGuard Photovoltaic Systemrdquo URL
httpwwwsunpowermonitorcomCommercialKioskaspx
TPD Tompkins ounty Planning Department 2010 ldquoTompkins ounty ommunity Greenhouse Gas
Emissions Report 1998-2008rdquo URL httpwwwtompkinsshy
coorgplanningenergyclimatedocumentsDraftCommunity10-yearGHGEmissionsReportpdf
Tester JT Drake EM Driscoll MJ Golay MW Peters WA 2005 Sustainable Energy Choosing
Among Options Cambridge MA The MIT Press
Trabish Herman K 2011 ldquoNew Study Solar Grid Parity is Here Todayrdquo Greentechsolar URL
httpwwwgreentechmediacomarticlesreadNew-Study-Solar-Grid-Parity-Is-Here-Today
Vanek Francis M 2012 Personal communication via email on 312012
Weaver Art 2012 Personal interview conducted on 442012
55
56
Appendix A Image sources
Figure 1 httpwwwgreentechmediacomresearchussmi
Figure 3 httpwwwitechnewsnetwp-contentuploads200905sanyo-hit-solar-cell-has-highestshy
energy-conversion-efficiencyjpg
Figure 4 Kissell 2012
Figure 5 Kissell 2012
Figure 6 Figure used with permission from lecture slides of KE ldquoMaxrdquo Zhang PhD ornell University
Figure 7 httpenvironmentalresearchweborgcwsarticlenews304891Generationgap
Figure 8 httpwwwpv-techorgguest_blognpd_solarbuzz_top_10_pv_cell_producers_in_2011
Figure 15 Steeby 2012
Figure 16 Kissell 2012
Figure 2 Figure used with permission from lecture slides of KE ldquoMaxrdquo Zhang PhD ornell University
Figure 9 httpnetzerorenewableresourcescomwp-contentuploads201010Roof-Mount-1jpg
Figure 10 httpwwwpowertripenergycomimages2009Pole-mount-for-webjpg
Figure 11 Steeby 2012
Figure 12 Image used with permission from lecture slides of Tobias Hanrath PhD Cornell University
Figure 13 httpwwwwattsuncommiscphotovoltaic_tilthtml
Figure 14 httpwwwenviroharvestcapv_shadinghtm
Figure 23 2005 chart developed with permission from data from lecture slides of Tobias Hanrath PhD
Cornell University
Figure 22 httpsolarbuzzcomfacts-and-figuresretail-price-environmentmodule-prices
Figure 24 GTM Research 2012
Figure 25 httpnyserdacleanpowerestimatorcomnyserdahtm
Figure 26 httpmidhudsonorgadminfacilities_resourcesgreenQPK_Designpdf
Figure 27 httpmapsgoogleco
B-1
Appendix B Description of Variables Used by PVWatts
DC Rating
The size of a photovoltaic (PV) system is its nameplate DC power rating This is determined by adding the PV module power listed on the nameplates of the PV modules in watts and then dividing the sum by 1000 to convert it to kilowatts (kW) PV module power ratings are for standard test conditions (STC) of 1000 Wm2 solar irradiance and 25degC PV module temperature The default PV system size is 4 kW This corresponds to a PV array area of approximately 35 m2 (377 ft2)
Caution For correct results the DC rating input must be the nameplate DC power rating described above It cannot be based on other rating conditions such as PVUSA test conditions (PTC) PTC are defined as 1000 Wm2 plane-of-array irradiance 20degC ambient temperature and 1 ms wind speed If a user incorrectly uses a DC rating based on PTC power ratings the energy production calculated by the PVWatts calculator will be reduced by about 12
DC-to-AC Derate Factor
The PVWatts calculator multiplies the nameplate DC power rating by an overall DC-to-AC derate factor to determine the AC power rating at STC The overall DC-to-AC derate factor accounts for losses from the DC nameplate power rating and is the mathematical product of the derate factors for the components of the PV system The default component derate factors used by the PVWatts calculator and their ranges are listed in the table below
Derate Factors for AC Power Rating at STC
Component Derate Factors PVWatts Default Range
PV module nameplate DC rating 095 080ndash105
Inverter and transformer 092 088ndash098
Mismatch 098 097ndash0995
Diodes and connections 0995 099ndash0997
DC wiring 098 097ndash099
AC wiring 099 098ndash0993
Soiling 095 030ndash0995
System availability 098 000ndash0995
Shading 100 000ndash100
Sun-tracking 100 095ndash100
Age 100 070ndash100
B-1
Overall DC-to-AC derate factor 077 009999ndash096001
The overall DC-to-AC derate factor is calculated by multiplying the component derate factors
For the PVWATTS default values
Overall DC to AC derate factor
= 095 x 092 x 098 x 0995 x 098 x 099 x 095 x 098 x 100 x 100 x 100
= 077
The value of 077 means that the AC power rating at STC is 77 of the nameplate DC power rating In most cases 077 will provide a reasonable estimate However users can change the DC-to-AC derate factor The first option is to enter a new overall DC-to-AC derate factor in the provided text box The second option is to click the Derate Factor Help button This provides the opportunity to change any of the component derate factors The derate factor calculator then calculates a new overall DC-to-AC derate factor
The component derate factors are described below
PV module nameplate DC rating This accounts for the accuracy of the manufacturers nameplate rating Field measurements of PV modules may show that they are different from their nameplate rating or that they experience light-induced degradation upon exposure A derate factor of 095 indicates that testing yielded power measurements at STC that were 5 less than the manufacturers nameplate rating Inverter and transformer This reflects the inverters and transformers combined efficiency in converting DC power to AC power A list of inverter efficiencies by manufacturer is available from the Consumer Energy Center The inverter efficiencies include transformer-related losses when a transformer is used or required by the manufacturer Mismatch The derate factor for PV module mismatch accounts for manufacturing tolerances that yield PV modules with slightly different current-voltage characteristics Consequently when connected together electrically they do not operate at their peak efficiencies The default value of 098 represents a loss of 2 because of mismatch Diodes and connections This derate factor accounts for losses from voltage drops across diodes used to block the reverse flow of current and from resistive losses in electrical connections DC wiring The derate factor for DC wiring accounts for resistive losses in the wiring between modules and the wiring connecting the PV array to the inverter AC wiring The derate factor for AC wiring accounts for resistive losses in the wiring between the inverter and the connection to the local utility service
B-2
Soiling The derate factor for soiling accounts for dirt snow and other foreign matter on the surface of the PV module that prevent solar radiation from reaching the solar cells Dirt accumulation is location- and weather-dependent There are greater soiling losses (up to 25 for some California locations) in high-trafffic high-pollution areas with infrequent rain For northern locations snow reduces the energy produced and the severity is a function of the amount of snow and how long it remains on the PV modules Snow remains longest when sub-freezing temperatures prevail small PV array tilt angles prevent snow from sliding off the PV array is closely integrated into the roof and the roof or another structure in the vicinity facilitates snow drift onto the modules For a roof-mounted PV system in Minnesota with a tilt angle of 23deg snow reduced the energy production during winter by 70 a nearby roof-mounted PV system with a tilt angle of 40deg experienced a 40 reduction System availability The derate factor for system availability accounts for times when the system is off because of maintenance or inverter or utility outages The default value of 098 represents the system being off 2 of the year Shading The derate factor for shading accounts for situations in which PV modules are shaded by nearby buildings objects or other PV modules and arrays For the default value of 100 the PVWatts calculator assumes the PV modules are not shaded Tools such as Solar Pathfinder can determine a derate factor for shading by buildings and objects For PV arrays that consist of multiple rows of PV modules and array structures the shading derate factor should account for losses that occur when one row shades an adjacent row
The figure below shows the shading derate factor as a function of the type of PV array (fixed or tracking) the ground cover ratio (GCR) defined as the ratio of the PV array area to the total ground area and the tilt angle for fixed PV arrays As shown in the figure spacing the rows further apart (smaller GCR) corresponds to a larger derate factor (smaller shading loss) For fixed PV arrays if the tilt angle is decreased the rows may be spaced closer together (larger GCR) to achieve the same shading derate factor For the same value of shading derate factor land area requirements are greatest for two-axis tracking as indicated by its relatively low GCR values compared with those for fixed or one-axis tracking If you know the GCR value for your PV array the figure may be used to estimate the appropriate shading derate factor Industry practice is to optimize the use of space by configuring the PV system for a GCR that corresponds to a shading derate factor of 0975 (or 25 loss)
B-3
Shading derate factor for multiple-row PV arrays as a function of PV array type and ground cover ratio
Sun-tracking The derate factor for sun-tracking accounts for losses for one- and two-axis tracking systems when the tracking mechanisms do not keep the PV arrays at the optimum orientation For the default value of 100 the PVWatts calculator assumes that the PV arrays of tracking systems are always positioned at their optimum orientation and performance is not adversely affected Age The derate factor for age accounts for performance losses over time because of weathering of the PV modules The loss in performance is typically 1 per year For the default value of 100 the PVWatts calculator assumes that the PV system is in its first year of operation For the eleventh year of operation a derate factor of 090 is appropriate
Note Because the PVWatts overall DC-to-AC derate factor is determined for STC a component derate factor for temperature is not part of its determination Power corrections for PV module operating temperature are performed for each hour of the year as the PVWatts calculator reads the meteorological data for the location and computes performance A power correction of -05 per degree Celsius for crystalline silicon PV modules is used
B-4
Appendix C Aerial Views of the 10 Largest Commercial Buildings in
the County
(contained in separate file)
C-1
Appendix D Aerial Views of the 10 Largest Industrial Buildings in
the County
(contained in separate file)
D-1
Appendix E Aerial Views of the 10 Largest School Buildings in the
County
(contained in separate file)
E-1
Appendix F Solar Liberty System Specifications
(contained in separate file)
F-1
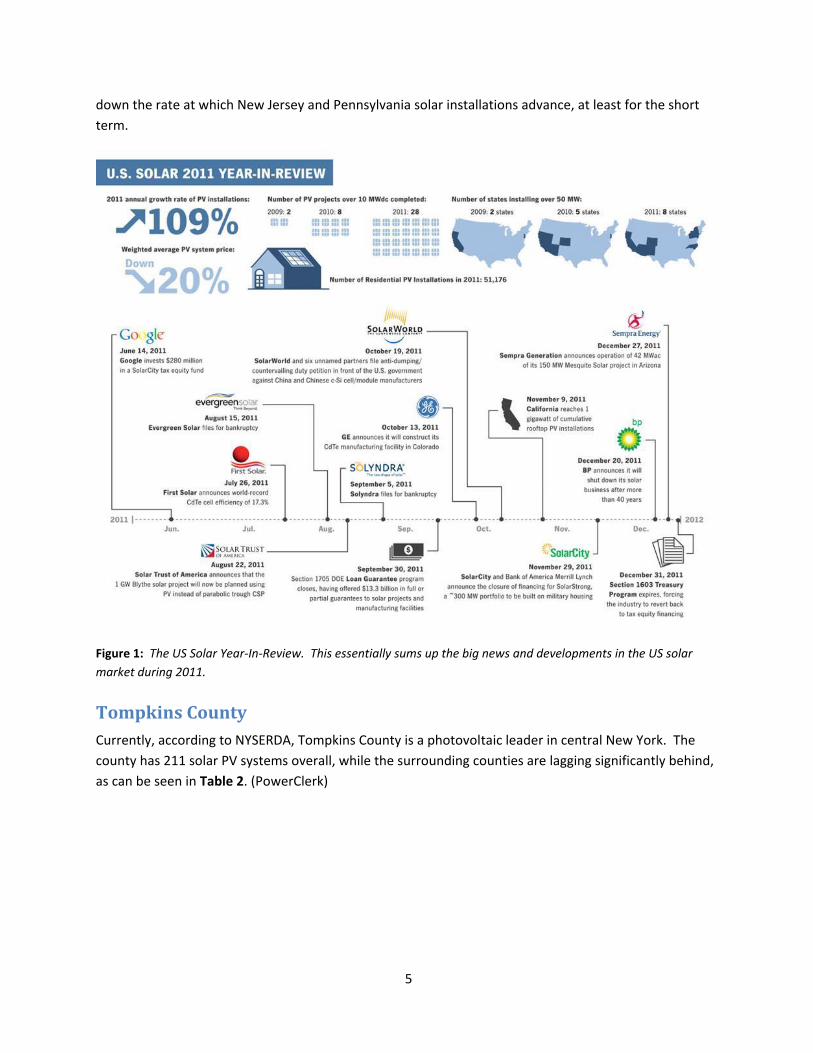
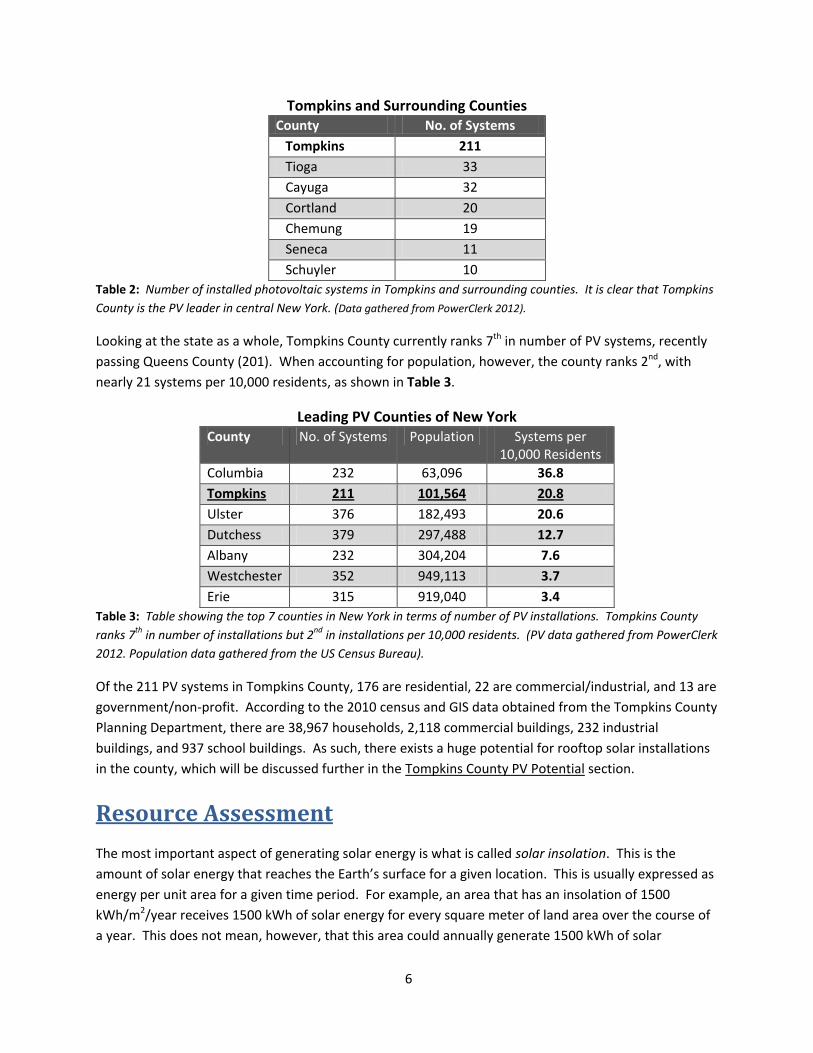
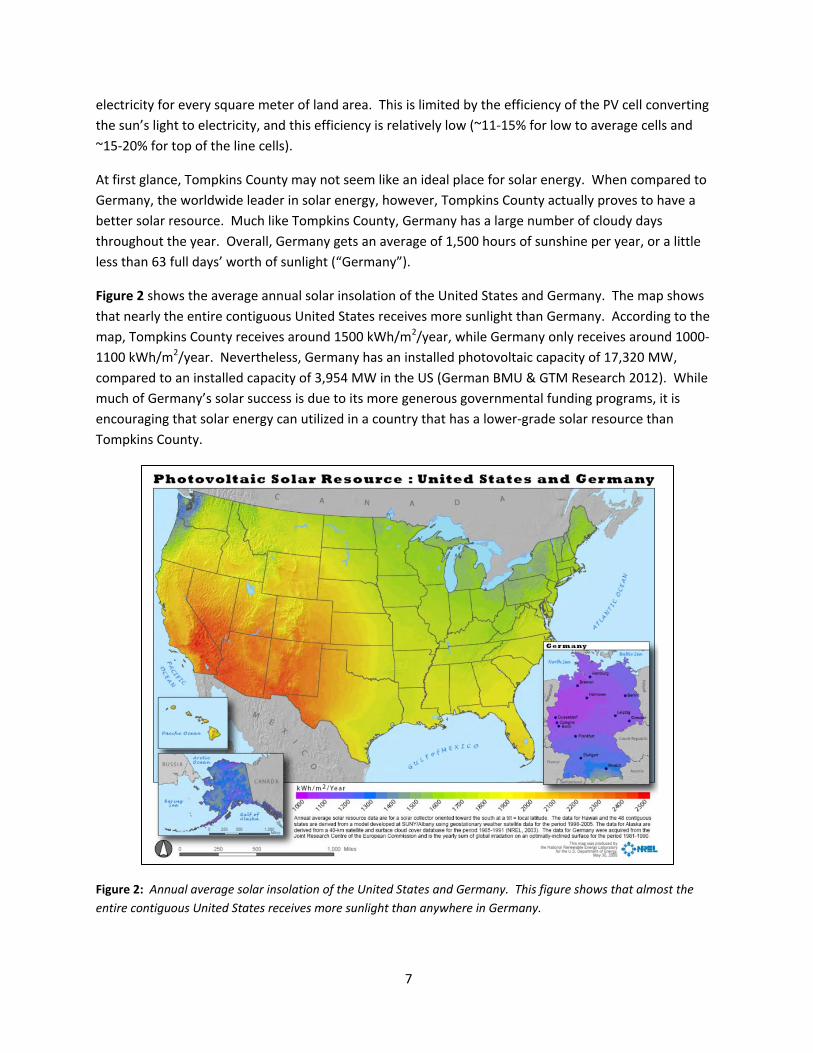
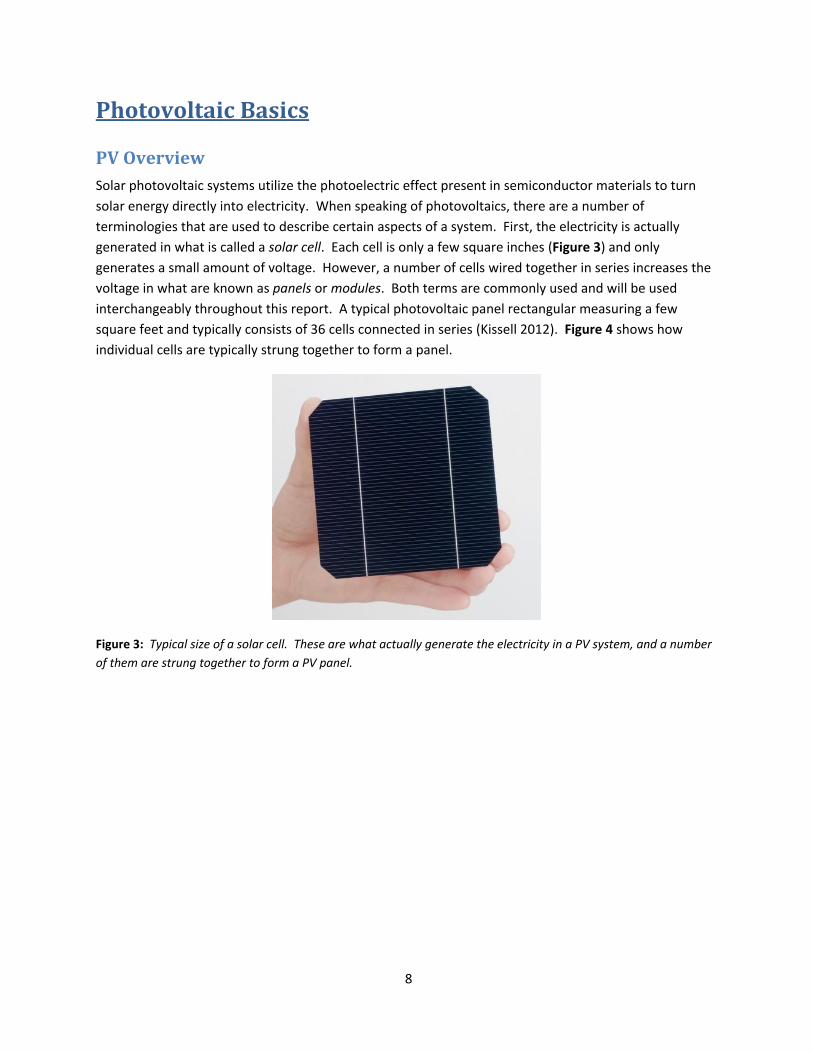
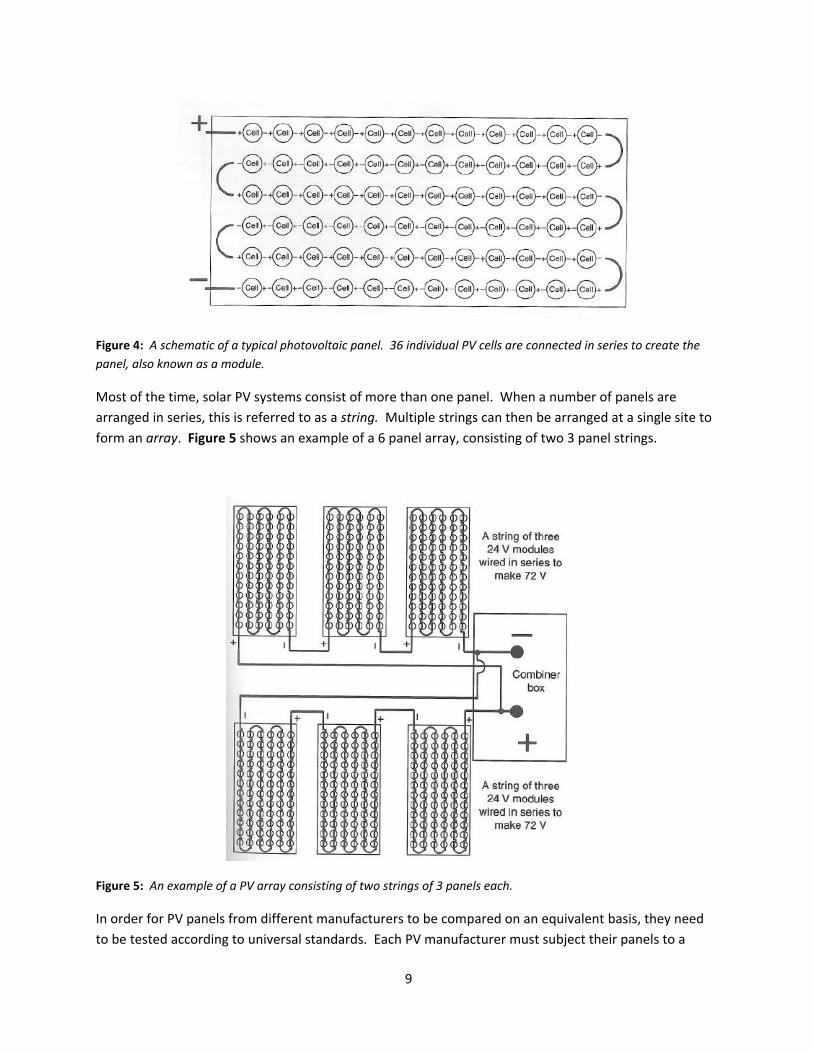
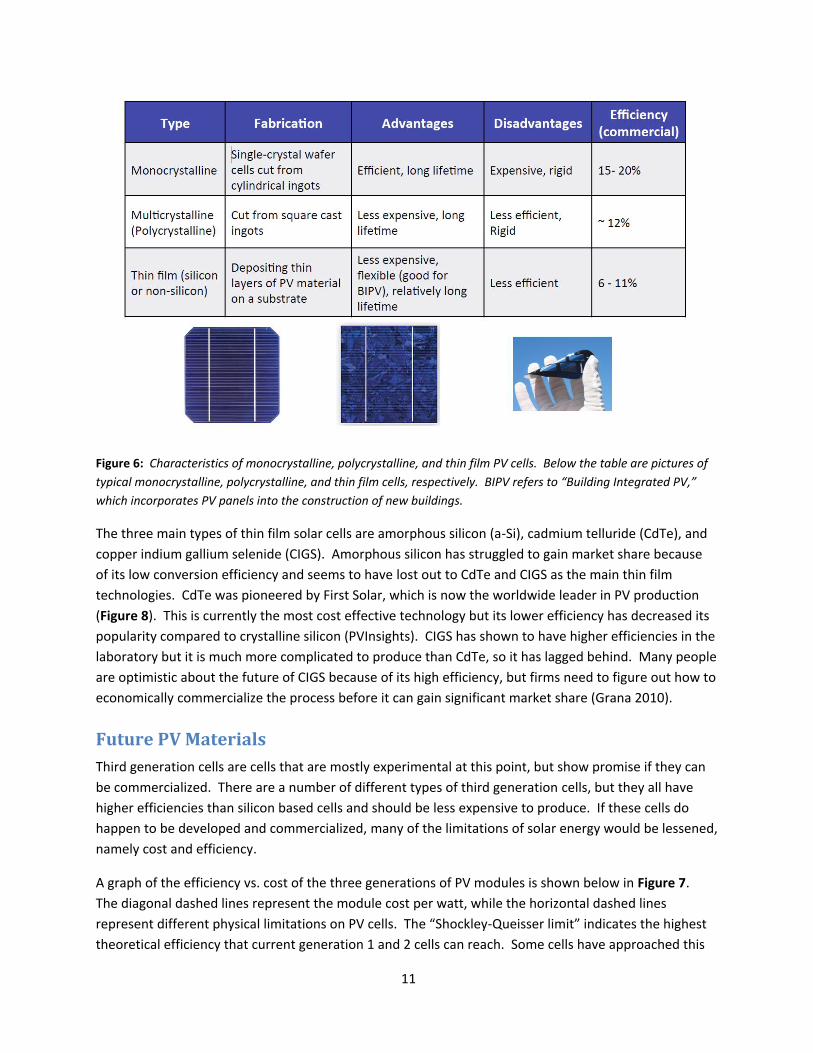
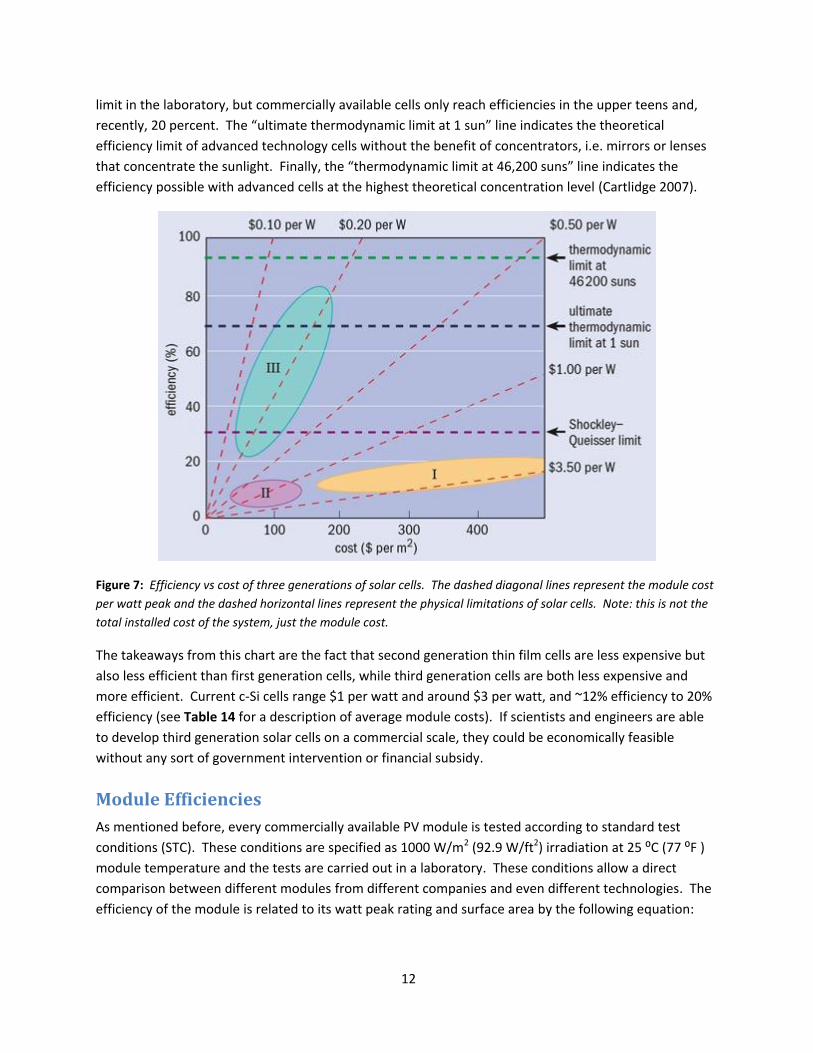