solar energy resources used in building in chongqing, china
TRANSCRIPT
2
Solar Energy Resources Used in Building in Chongqing, China
Ding Yong1, Li Bai-Zhan1, Yao Run-Ming2, Lian Da-Qi1 and Dai Hui-Zi1
1The Faculty of Urban Construction and Environmental Engineering, Chongqing University, Chongqing
2Department of Construction Management and Engineering, University of Reading, Reading
1China 2UK
1. Introduction
Our country is very rich in solar resource with annual total solar radiation about 3340-
8360MJ/m2, equivalent to 110-250kg standard coal/m2 (Wei, 2006). Since energy crisis
occurrence, an upsurge in application of new energy has been emerged in various countries
of the world. In our country, “Solar Energy Roof Plan” and “Golden Sun” demonstration
projects were also implemented in 2009 to accelerate the application of solar technology in
our country. Now in areas of Tibet, Ningxia, and Gansu where solar resource is rich, solar
resource has been widely used in the fields of power generation, lighting, refrigeration,
heating, boiling and heating water, and cooking. In addition a large batch of solar building
demonstration projects has been constructed, obtaining high social, economical, and
environmental benefits (You, et al. 2002).
In Chongqing area, utilization of solar resource is still in groping stage due to its special
geographic location and resource distribution characteristics. For a long time, traditional
view considers that application of solar energy in Chongqing area is congenitally deficient,
making its utilization very small in scale and most of the application modes are of general
application type, which is not suitable to the local climate features (Wei, et al. 2002). In
addition, building-shaped integrated application and research has not been conducted and
efficient utilization of resources has not been realized in solar technologies. This article
describes the research on proper utilization of solar technology and measures, search on the
application potentials of solar resource in Chongqing area based on the geographic location
and climate features in the area so as to strive to realize efficient utilization of solar resource
at low cost and take the opportunity that Chongqing has been approved as “nation-wide
demonstration city in the application of renewable energy resources in buildings” to
effectively solve the expansion of the application of renewable energy and proper
application of resources in Chongqing area to realize wider scope of building energy
conservation.
www.intechopen.com

Solar Power
24
2. Analysis of solar resource in Chongqing area
2.1 Briefing of solar resource in Chongqing area
Chongqing area is located in northern altitude 28°10’ - 32°13’, east longitude 105°11’-110°11’,
with sea level elevation of 259.1m, and administrative area of 82,400km2. Climate in the area
belongs to typical climate extremely hot in summer and extremely cold in winter. In the hot
summer, daily maximum temperature in July is above 35°C in average and the maximum
air temperature can be as high as 43°C. In the cold and wet winter, annual mean
temperature is about 18°C. Weather is cloudy and foggy (Annual mean foggy day is 104
days) (Ding, et al. 2007).
According to solar resource zoning in China, solar resource in Chongqing area belongs to
Category 4 area – poor solar resource area. Annual total solar radiation in the area is
equivalent to the cities of Tokyo, London, Paris, Hamburger, and Moscow (Wei, 2007).
However, the utilization extent of solar resource is not as wide as these cities. Therefore,
utilization quality of resource is not totally determined by its size. As long as proper
technological measures are taken, limited size of resources can find abundant applications.
Table 1 lists solar technologies used in areas having similar solar resource as Chongqing area.
Comparatively speaking, application of solar resource in Chongqing area can only be found in
solar water heater in some places. Application in other areas is rarely seen. How big the
utilization potential of solar resource is and how the benefit brought up by its utilization is in
Chongqing area will determine the promotion direction and technical guide of the application
of solar resource in Chongqing area. This research work has analyzed the utilization potential
of solar energy based on the distribution status of solar resource and made a comparative
study and measurement analysis for multi-types of solar energy applications.
Area Annual total solar radiation /MJ/m2
Examples of solar energy application
Solar technology used
Tokyo 4220 Hotel Monterey Ginza External sunshade technology
of building
London 3640
London Tower Natural lighting technology
“Beddington Zero Energy Development” Eco-Village
Solar photoelectric technology , solar ventilation stack
Paris 4013 Signal Tower Solar power and wind power
generation
Hamburger 3430 Heating project in
Hamburger area, GermanySolar water heating system
Moscow 3520 Crystal Island Solar photoelectric technology, solar ventilation, and cooling
technology.
Table 1. Solar Technology Applications
By compilation of relevant meteorological data of “A Collection of Special Meteorological Data for Thermal Environmental Analysis on Chinese Buildings” and the websites of China Meteorological Administration, the authors analyzed the solar radiation distribution,
www.intechopen.com
Solar Energy Resources Used in Building in Chongqing, China
25
Sunshine duration, cloud cover, and solar altitude parameters in Chongqing area and made recommendations for the application of solar resource.
2.2 Distribution of solar radiation
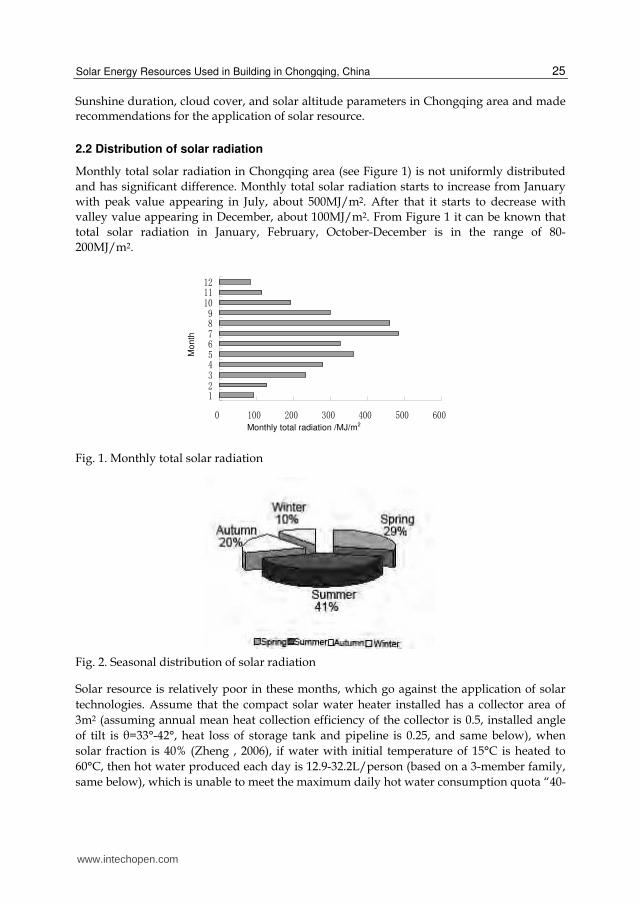
Monthly total solar radiation in Chongqing area (see Figure 1) is not uniformly distributed
and has significant difference. Monthly total solar radiation starts to increase from January
with peak value appearing in July, about 500MJ/m2. After that it starts to decrease with
valley value appearing in December, about 100MJ/m2. From Figure 1 it can be known that
total solar radiation in January, February, October-December is in the range of 80-
200MJ/m2.
0 100 200 300 400 500 600
1
2
3
4
5
6
7
8
9
10
11
12
月份
月总辐射/MJ/m
2
Fig. 1. Monthly total solar radiation
Fig. 2. Seasonal distribution of solar radiation
Solar resource is relatively poor in these months, which go against the application of solar
technologies. Assume that the compact solar water heater installed has a collector area of
3m2 (assuming annual mean heat collection efficiency of the collector is 0.5, installed angle
of tilt is θ=33°-42°, heat loss of storage tank and pipeline is 0.25, and same below), when
solar fraction is 40% (Zheng , 2006), if water with initial temperature of 15°C is heated to
60°C, then hot water produced each day is 12.9-32.2L/person (based on a 3-member family,
same below), which is unable to meet the maximum daily hot water consumption quota “40-
Monthly total radiation /MJ/m2
Month
www.intechopen.com

Solar Power
26
80L/person” (Zheng , 2006; Wang, 2007; Shi 2008) as specified in the standard. However, in
the period of May to September, solar radiation is over 300MJ/m2, for water heater with
collector area of 3m2, 60°C hot water produced can be maintained at over 48L/person every
day. Therefore, there will be at least 5 months in Chongqing area in which solar resource can
be utilized to meet the requirement of domestic hot water. However, due to the significant
periodicity of solar resource distribution, the application should be based on the time period
and the object.
From figure 2 it can be seen that the fraction of solar radiation in summer is the highest in
the four seasons of Chongqing area, about 1270MJ/m2, about 41% of the total solar radiation
of the year. This is the best period for solar thermal, solar photoelectric and solar ventilation
and cooling applications. For a 3m2 compact water heater, 60°C domestic hot water
produced every day can be over 68.8L/person, well meeting the requirement of “40-
80L/person” as specified in the standard. However, on the other hand, the high solar
radiation will increase the heat receiving capacity of solar radiation for the buildings
causing increase of air conditioning load. At this moment, if proper sun-shade technology
and auxiliary solar assisted ventilation technology is used, not only the solar radiation heat
receiving capacity of building envelope can be reduced, also energy consumption of
building can decreased. In the transition season, average outdoor air temperature is in the
range of 14~24°C. The climate is comfortable for people. If solar assisted ventilation is
utilized in this period, not only the time for air conditioning operation can be reduced
effectively, also fresh air can be supplied in the room improving indoor comfort.
2.3 Sunshine duration and monthly mean total cloud cover
From figure 3 it can be seen Sunshine duration in Chongqing area is longest on Summer
Solstice (June 22), about 14h and is shortest on Winter Solstice (December 22), about 10h,
with difference between the two of 4h, or theoretically speaking the daily Sunshine
duration in Chongqing area is more than 10h. Especially in the late spring and early
autumn and in the whole summer, there is sunshine for over half of the time of a day.
Even in winter, Sunshine duration is also about 10h. However, the actual application of
solar energy is affected by cloud cover. In cloudy days, solar radiation scattering only
about 1/5 of the total solar radiation can reach to the ground. This part of scattered
radiation can only be utilized by photoelectric transducer made of semiconductor
material. Therefore, the quantity of cloud cover has direct influence on the selection and
efficiency of solar energy utilization technologies. Figure 4 shows the monthly mean total
cloud cover of several cities. It can be known from the figure that the annual mean total
cloud over in Chongqing area is 78%, far more than the 54 % in Lanzhou, the 45% in
Beijing, and the 48% in Urumqi, which is very disadvantageous to the yea-round
utilization of solar resource. However, viewing from the seasons, cloud cover is the
highest in winter, averaged at 85%, and is lowest in summer, averaged at 69%. Especially
in July and August in summer, the cloud cover is significantly reduced, almost equivalent
to that of Lanzhou City. Although cloud cover in Chongqing is high in Chongqing area,
the long Sunshine duration of the whole year provides possibility for day lighting design
of buildings. For solar thermal conversion and solar photoelectric conversion, the best
season is summer, while spring and autumn take the second place.
www.intechopen.com
Solar Energy Resources Used in Building in Chongqing, China
27
Fig. 3. Sunshine duration
Fig. 4. Monthly mean total cloud cover of several cities
2.4 Solar elevation angle
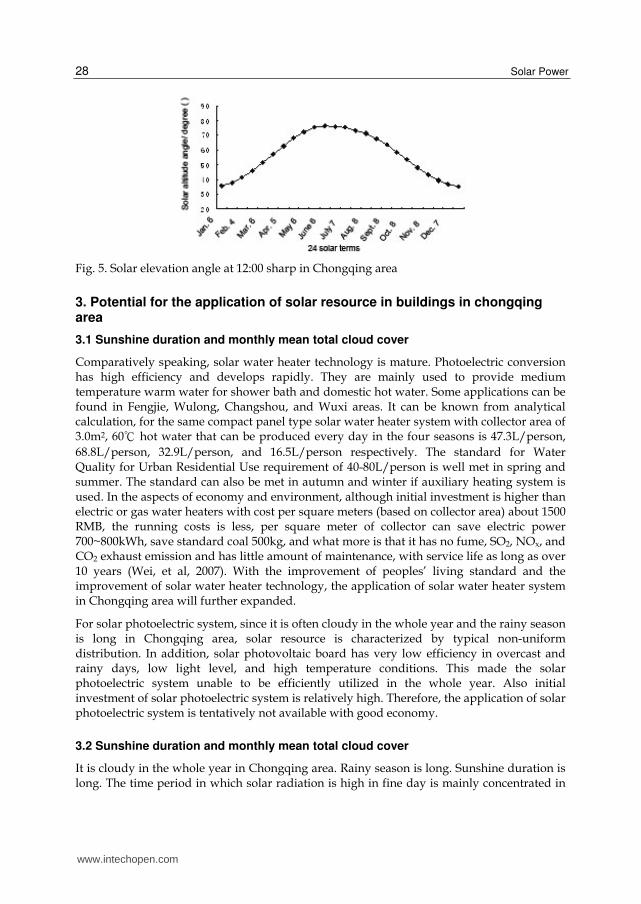
Solar elevation angle reflects quantity of solar energy absorbed on the ground in unit time. The higher the elevation angle, more solar energy will be absorbed on the earth surface. Figure 5 shows the distribution law of Solar elevation angle in Chongqing area at noon for the 24 solar terms. It can be known from the figure, the maximum value of solar altitude appears in summer at about 65°~77°. At this moment solar energy absorbed by earth surface is the highest. Considering the analysis on the utilization period of time described previously, the angle of inclination of solar water heater or solar photovoltaic board ought to be set in the range of 13°~25° so that maximum conversion and utilization of solar energy can be realized. This is more advantageous to improve solar energy absorption and the efficiency of conversion device as compared with the normal practice of setting the angle of inclination as the local attitude of (28°~32°). For passive control and regulation, if the angle of exterior shading of building is properly designed, solar radiation entering the rooms in summer can be effectively reduced to reduce energy consumption of air conditioners. In winter in which Solar elevation angle is the lowest, at about 35°~50°, it is not advantageous for the efficient utilization of solar water heaters and solar photovoltaic board due to the high cloud cover in Chongqing area. Then passive application can be improved as possible, for example, day lighting, etc. For combined utilization in summer and winter, the “utilization” and “control” of solar energy should be improved. The exterior windows of buildings in Chongqing area is suitable for installation of movable and controllable exterior sunshade for the convenience of adjustment of out-extended length, angle of exterior sunshade to meet different sunshade and day lighting requirement.
www.intechopen.com
Solar Power
28
Fig. 5. Solar elevation angle at 12:00 sharp in Chongqing area
3. Potential for the application of solar resource in buildings in chongqing area
3.1 Sunshine duration and monthly mean total cloud cover
Comparatively speaking, solar water heater technology is mature. Photoelectric conversion has high efficiency and develops rapidly. They are mainly used to provide medium temperature warm water for shower bath and domestic hot water. Some applications can be found in Fengjie, Wulong, Changshou, and Wuxi areas. It can be known from analytical calculation, for the same compact panel type solar water heater system with collector area of 3.0m2, 60℃ hot water that can be produced every day in the four seasons is 47.3L/person,
68.8L/person, 32.9L/person, and 16.5L/person respectively. The standard for Water Quality for Urban Residential Use requirement of 40-80L/person is well met in spring and summer. The standard can also be met in autumn and winter if auxiliary heating system is used. In the aspects of economy and environment, although initial investment is higher than electric or gas water heaters with cost per square meters (based on collector area) about 1500 RMB, the running costs is less, per square meter of collector can save electric power 700~800kWh, save standard coal 500kg, and what more is that it has no fume, SO2, NOx, and CO2 exhaust emission and has little amount of maintenance, with service life as long as over 10 years (Wei, et al, 2007). With the improvement of peoples’ living standard and the improvement of solar water heater technology, the application of solar water heater system in Chongqing area will further expanded.
For solar photoelectric system, since it is often cloudy in the whole year and the rainy season is long in Chongqing area, solar resource is characterized by typical non-uniform distribution. In addition, solar photovoltaic board has very low efficiency in overcast and rainy days, low light level, and high temperature conditions. This made the solar photoelectric system unable to be efficiently utilized in the whole year. Also initial investment of solar photoelectric system is relatively high. Therefore, the application of solar photoelectric system is tentatively not available with good economy.
3.2 Sunshine duration and monthly mean total cloud cover
It is cloudy in the whole year in Chongqing area. Rainy season is long. Sunshine duration is long. The time period in which solar radiation is high in fine day is mainly concentrated in
www.intechopen.com

Solar Energy Resources Used in Building in Chongqing, China
29
summer. Therefore, utilization of solar energy in summer must take protection and control into account. Typical practice is to arrange proper sunshade facility in the design of buildings. Especially in the low latitude Chongqing area and buildings having large area of glass panel wall, sun-shading technology can play the role of shading and heat insulation and reducing the load of air conditioners in summer. In the overcast ad rainy days or foggy days in other seasons, indoor day lighting will be utilized as much as possible to reduce artificial lighting, improve indoor light environment, and provide natural, gentle, and mild light comfortable sensation. The author demonstrated with experimental test that provision of interior sunshade can reduce about 17% of energy consumption for air conditioning. Other domestic and abroad study also indicated that window sunshade can save about 10%-24% energy while construction investment used in sunshade is less than 2% (Shi, 2008; Cao, et al,2006; Athienitis & zempelikos, 2002). Therefore, suitable sunshade and day lighting has good energy saving and economy for the operation of buildings. Currently, most of the buildings in Chongqing use fixed sunshades like awning, sunshade board, or out-extended balcony. The exterior sunshades in different orientations are basically the same in type and size, which are not provided based on the sunlight condition, causing poor climate adaptability. For this, the authors carried out research work on the effect of movable exterior sunshades of buildings.
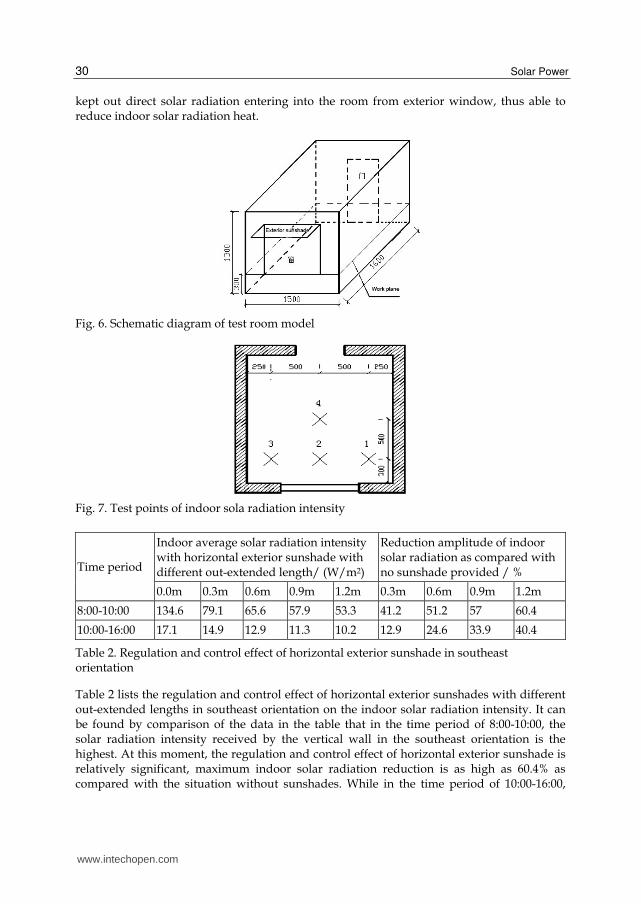
3.2.1 Model experiment and test
The authors mimicked a physical model using wood boards according to similarity principle (Song, et al, 2003). The model is sized as 1.6 (L) x 1.5 (W) x 1.0m (H). Figure 6 is a schematic diagram of the test room model. In the experiment, rooms with three types of orientation of southeast, south, and southwest were provided. Test research has been made on the effectiveness of exterior sunshades with out-extending length of 0, 0.3, 0.6, and 1.2m for rooms having different orientation. The experimental tests were made in typical summer condition in Chongqing area. In the test period, weather was sunny with less cloud cover, damp, and hot. Maximum outdoor air temperature was 39.7°C with severe solar radiation. The test points for parameters were determined as shown in Figure 7 according to standard GBT 5699-2008 – Method of Day Lighting Measurement.
3.2.2 Analysis of test results
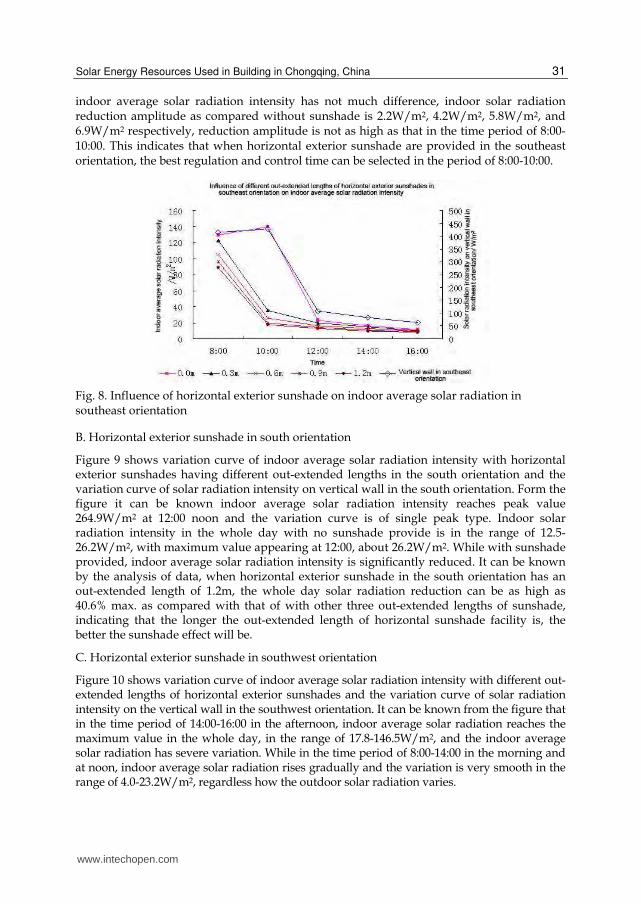
A. Horizontal exterior sunshade in southeast orientation
Figure 8 shows the variation curve of indoor average solar radiation intensity under horizontal exterior sunshades of different out-extended lengths in the southeast orientation and the variation curve of solar radiation intensity on vertical wall in the southeast orientation. It can be seen from analysis of the figure that indoor average solar radiation is the highest and has severe variation in the period of 8:00-10:00 in the morning. In the period of 10:00-16:00, indoor average solar radiation reduces gradually with the variation of outdoor solar radiation. However, the variation is very smooth, in the range of 8.1-23.2W/m2. At 10:00, the indoor average solar radiation intensity is relatively high without sunshade provided, at about 139.5W/m2 while at the moment, the indoor average solar radiation intensity having sunshade provided is significantly lower. When out-extending length of sunshade is at the level of 0.3m, indoor average solar radiation intensity is about 35.2W/m2, reduced by about 104.3W/m2 as compared with that having no sunshade provided. This indicates that the provision of horizontal exterior sunshade has effectively
www.intechopen.com
Solar Power
30
kept out direct solar radiation entering into the room from exterior window, thus able to reduce indoor solar radiation heat.
Fig. 6. Schematic diagram of test room model
Fig. 7. Test points of indoor sola radiation intensity
Time period
Indoor average solar radiation intensity with horizontal exterior sunshade with different out-extended length/ (W/m2)
Reduction amplitude of indoor solar radiation as compared with no sunshade provided / %
0.0m 0.3m 0.6m 0.9m 1.2m 0.3m 0.6m 0.9m 1.2m
8:00-10:00 134.6 79.1 65.6 57.9 53.3 41.2 51.2 57 60.4
10:00-16:00 17.1 14.9 12.9 11.3 10.2 12.9 24.6 33.9 40.4
Table 2. Regulation and control effect of horizontal exterior sunshade in southeast orientation
Table 2 lists the regulation and control effect of horizontal exterior sunshades with different out-extended lengths in southeast orientation on the indoor solar radiation intensity. It can be found by comparison of the data in the table that in the time period of 8:00-10:00, the solar radiation intensity received by the vertical wall in the southeast orientation is the highest. At this moment, the regulation and control effect of horizontal exterior sunshade is relatively significant, maximum indoor solar radiation reduction is as high as 60.4% as compared with the situation without sunshades. While in the time period of 10:00-16:00,
www.intechopen.com
Solar Energy Resources Used in Building in Chongqing, China
31
indoor average solar radiation intensity has not much difference, indoor solar radiation reduction amplitude as compared without sunshade is 2.2W/m2, 4.2W/m2, 5.8W/m2, and 6.9W/m2 respectively, reduction amplitude is not as high as that in the time period of 8:00-10:00. This indicates that when horizontal exterior sunshade are provided in the southeast orientation, the best regulation and control time can be selected in the period of 8:00-10:00.
Fig. 8. Influence of horizontal exterior sunshade on indoor average solar radiation in southeast orientation
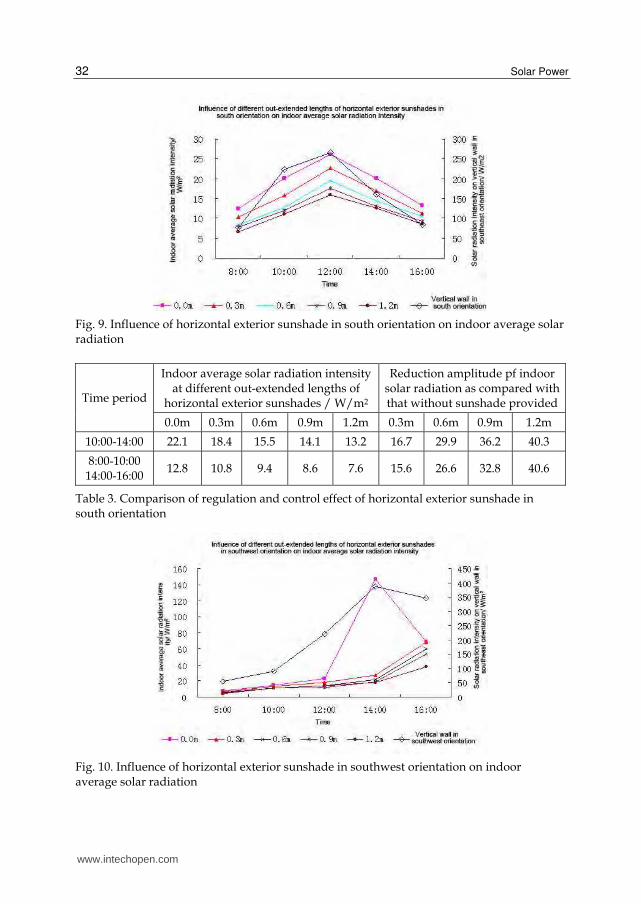
B. Horizontal exterior sunshade in south orientation
Figure 9 shows variation curve of indoor average solar radiation intensity with horizontal exterior sunshades having different out-extended lengths in the south orientation and the variation curve of solar radiation intensity on vertical wall in the south orientation. Form the figure it can be known indoor average solar radiation intensity reaches peak value 264.9W/m2 at 12:00 noon and the variation curve is of single peak type. Indoor solar radiation intensity in the whole day with no sunshade provide is in the range of 12.5-26.2W/m2, with maximum value appearing at 12:00, about 26.2W/m2. While with sunshade provided, indoor average solar radiation intensity is significantly reduced. It can be known by the analysis of data, when horizontal exterior sunshade in the south orientation has an out-extended length of 1.2m, the whole day solar radiation reduction can be as high as 40.6% max. as compared with that of with other three out-extended lengths of sunshade, indicating that the longer the out-extended length of horizontal sunshade facility is, the better the sunshade effect will be.
C. Horizontal exterior sunshade in southwest orientation
Figure 10 shows variation curve of indoor average solar radiation intensity with different out-extended lengths of horizontal exterior sunshades and the variation curve of solar radiation intensity on the vertical wall in the southwest orientation. It can be known from the figure that in the time period of 14:00-16:00 in the afternoon, indoor average solar radiation reaches the maximum value in the whole day, in the range of 17.8-146.5W/m2, and the indoor average solar radiation has severe variation. While in the time period of 8:00-14:00 in the morning and at noon, indoor average solar radiation rises gradually and the variation is very smooth in the range of 4.0-23.2W/m2, regardless how the outdoor solar radiation varies.
www.intechopen.com
Solar Power
32
Fig. 9. Influence of horizontal exterior sunshade in south orientation on indoor average solar radiation
Time period
Indoor average solar radiation intensity at different out-extended lengths of
horizontal exterior sunshades / W/m2
Reduction amplitude pf indoor solar radiation as compared with that without sunshade provided
0.0m 0.3m 0.6m 0.9m 1.2m 0.3m 0.6m 0.9m 1.2m
10:00-14:00 22.1 18.4 15.5 14.1 13.2 16.7 29.9 36.2 40.3
8:00-10:00 14:00-16:00
12.8 10.8 9.4 8.6 7.6 15.6 26.6 32.8 40.6
Table 3. Comparison of regulation and control effect of horizontal exterior sunshade in south orientation
Fig. 10. Influence of horizontal exterior sunshade in southwest orientation on indoor average solar radiation
www.intechopen.com

Solar Energy Resources Used in Building in Chongqing, China
33
At 14:00, the measured indoor average solar radiation reaches the maximum value 146.5W/m2 without sunshade provided. While at this moment, the indoor average solar radiation intensity is significantly reduced with sunshade provided. When out-extended length of horizontal exterior sunshade is at 0.3m, indoor average solar radiation is significantly reduced to 27.0W/m2, reduced by about 119.5W/m2 as compared without sunshade provided. In the time period of 14:00-16:00, solar radiation in the southwest is very high. Regulation and control effect of horizontal exterior sunshade on indoor solar radiation intensity is high. While in the time period of 8:00-14:00, solar radiation intensity in the southwest orientation is relatively low, the regulation and control effect of horizontal exterior sunshade on indoor solar radiation is relatively weak. Table 4 lists the regulation and control effect of horizontal exterior sunshades with different out-extended lengths in southwest orientation. It can be found from the comparison of data in the table that in the time period of 14:00-16:00, solar radiation intensity received by vertical wall in the southwest orientation is the highest. At this moment the regulation and control effect of horizontal exterior sunshade is very significant. Indoor solar radiation reduction amplitude is 55.8%, 62.2%, 66.5%, and 74.4% respectively as compared with that without sunshade provided. While in the time period of 8:00-14:00, indoor average solar radiation intensity has not much difference, indoor solar radiation reduction amplitude as compared without sunshade is 1.3 W/ m2, 2.6 W/ m2, 3.2 W/ m2 and 3.5 W/ m2 respectively, Reduction amplitude of indoor solar radiation is very small as compared with in the time period of 14:00-16:00, reduced by 11.8%, 23.6%, 27.3%, and 30.0% respectively.
Time period
Indoor average solar radiation intensity at different out-extended lengths of horizontal exterior sunshades / W/m2
Reduction amplitude of solar radiation as compared with no sunshade provided / %
0.0m 0.3m 0.6m 0.9m 1.2m 0.3m 0.6m 0.9m 1.2m
14:00-16:00 107.8 47.7 40.7 36.1 27.6 55.8 62.2 66.5 74.4
8:00-14:00 11.0 9.7 8.4 8.0 7.7 11.8 23.6 27.3 30.0
Table 4. Comparison of regulation and control effect of horizontal exterior sunshade in southwest orientation
This indicates that provision of horizontal exterior sunshade can effectively prevent direct solar radiation from entering the room from exterior window to reduce indoor solar radiation heat. When horizontal exterior sunshade is provided in the southwest orientation, the best time period for regulation and control is in the range of 14:00-16:00, at which time indoor solar radiation intensity can be effectively reduced, hence the indoor solar radiation heat. Therefore, sunshade effect is very significant when horizontal exterior sunshade is provided in southwest orientation and the best regulation and control time is in the range of 14:00-16:00.
3.3 Solar assisted ventilation technology
Chongqing area prevails over north-northern wind (NNW) in the whole year. It is in slight and gentle breeze area throughout the year and belongs to wind resource deficient zone. However, there is abundant of Summer Wind. Summer is extremely hot and full of sunny days. Solar radiation intensity is high and Sunshine duration is long. The scope of application
www.intechopen.com

Solar Power
34
of solar assisted ventilation technology can be extended by utilizing this distribution feature of summer wind power resource and indoor ventilation can be organized and improved.
3.3.1 Examples of application and test
The research group designed and constructed a solar assisted ventilation system in a certain
energy-saving demonstration building as shown in Figure 11. The main members of solar
assisted ventilation system were tested and measured in a typical summer day in
Chongqing area in July, 2009. The main member of the solar assisted ventilation system is
the “sunlight well” on the exterior façade in the southwest orientation of the building. The
“sunlight well” is sized as LxWxH=850x700x9000mm, consisting of two pieces of glass. Each
corresponding floor in the “sunlight well” is provided with exterior windows opened to the
“sunlight well”.
Fig. 11. Solar assisted ventilation system in an energy-saving demonstration building
In order to reflect the effect of thermal pressure ventilation, floor 2 and floor 3 were selected
as the test floors. In the living rooms directly connected to the “sunlight well”, test and
measuring points were arranged according to the test point arrangement requirement of
standard GBT 18204.13-2000 “Methods for Determination of Air Temperature in Public
Places“ and GBT 18204.15-2000 “Methods for Determination of Wind Speed in Public
Places“. The tri-section points on the diagonal lines in the living room were taken as the
humidity and wind speed measuring points. These points are all 1.5m above the floor.
During the test, the exterior windows of the ground floor facing the “sunlight well” were
closed.
3.3.2 Analysis of test results
A. Temperature analysis
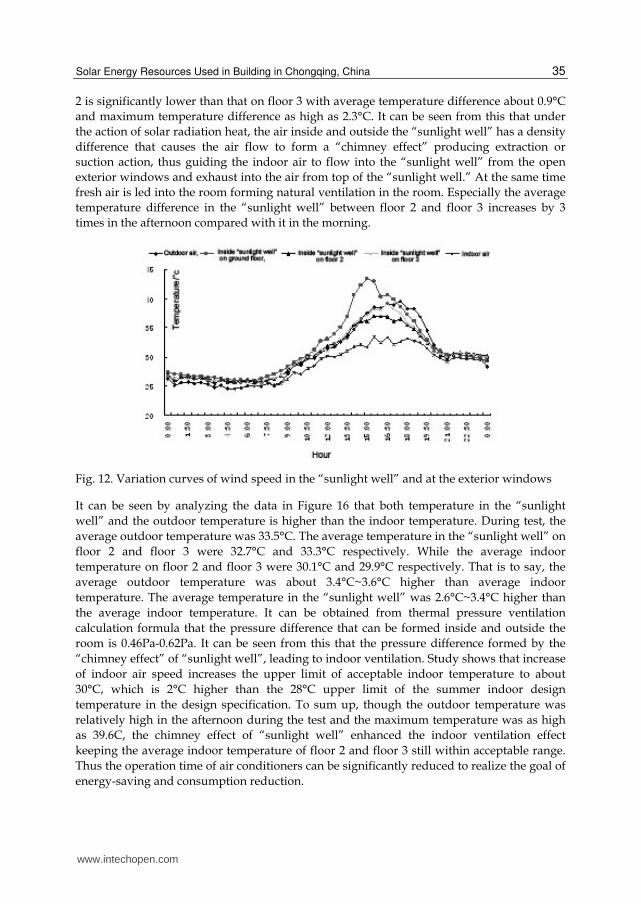
Since the “sunlight well” faces to southwest, it was subjected to most severe solar radiation
in the afternoon. It can be seen from figure 15 that in the time period of 8:00-12:00, the
temperature in the “sunlight well” on floor 2 is slightly lower than that on floor 3 with
average temperature difference about 0.3°C and maximum temperature difference as high
as 0.5°C. While in the time period of 12:00-18:00, temperature in the “sunlight well” on floor
www.intechopen.com
Solar Energy Resources Used in Building in Chongqing, China
35
2 is significantly lower than that on floor 3 with average temperature difference about 0.9°C
and maximum temperature difference as high as 2.3°C. It can be seen from this that under
the action of solar radiation heat, the air inside and outside the “sunlight well” has a density
difference that causes the air flow to form a “chimney effect” producing extraction or
suction action, thus guiding the indoor air to flow into the “sunlight well” from the open
exterior windows and exhaust into the air from top of the “sunlight well.” At the same time
fresh air is led into the room forming natural ventilation in the room. Especially the average
temperature difference in the “sunlight well” between floor 2 and floor 3 increases by 3
times in the afternoon compared with it in the morning.
Fig. 12. Variation curves of wind speed in the “sunlight well” and at the exterior windows
It can be seen by analyzing the data in Figure 16 that both temperature in the “sunlight
well” and the outdoor temperature is higher than the indoor temperature. During test, the
average outdoor temperature was 33.5°C. The average temperature in the “sunlight well” on
floor 2 and floor 3 were 32.7°C and 33.3°C respectively. While the average indoor
temperature on floor 2 and floor 3 were 30.1°C and 29.9°C respectively. That is to say, the
average outdoor temperature was about 3.4°C~3.6°C higher than average indoor
temperature. The average temperature in the “sunlight well” was 2.6°C~3.4°C higher than
the average indoor temperature. It can be obtained from thermal pressure ventilation
calculation formula that the pressure difference that can be formed inside and outside the
room is 0.46Pa-0.62Pa. It can be seen from this that the pressure difference formed by the
“chimney effect” of “sunlight well”, leading to indoor ventilation. Study shows that increase
of indoor air speed increases the upper limit of acceptable indoor temperature to about
30°C, which is 2°C higher than the 28°C upper limit of the summer indoor design
temperature in the design specification. To sum up, though the outdoor temperature was
relatively high in the afternoon during the test and the maximum temperature was as high
as 39.6C, the chimney effect of “sunlight well” enhanced the indoor ventilation effect
keeping the average indoor temperature of floor 2 and floor 3 still within acceptable range.
Thus the operation time of air conditioners can be significantly reduced to realize the goal of
energy-saving and consumption reduction.
www.intechopen.com

Solar Power
36
Fig. 13. Variation of temperature in the “sunlight well” and outdoor temperature
B. Air velocity analysis
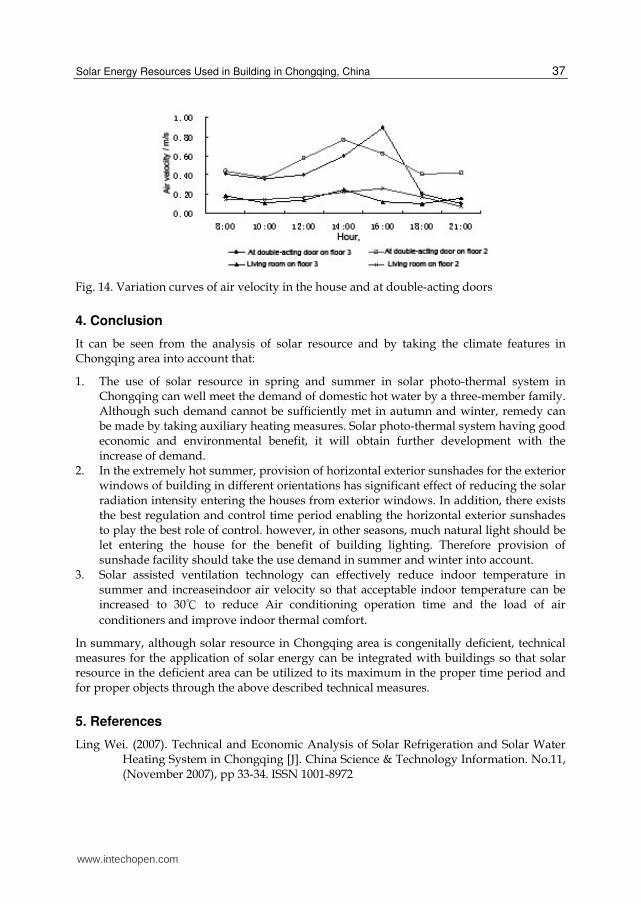
Figure 16 and Figure 17 show the variation curves of air velocity in the center and at exterior
windows of “sunlight well”, in the living room and at double-acting doors. It can be seen
from the figures that in the time period of 9:00-12:00, air velocity of the measuring points is
very smooth and has little fluctuation. At 12:00 noon when solar radiation reaches it
maximum, or about 790W/m2, air velocity of the measuring points starts to rise up. In the
afternoon when solar radiation received is the highest and the “chimney effect” formed is
most powerful, air velocity of the measuring points reaches its maximum value especially at
the double-acting doors, except the indoor air velocity on floor 3 and the air velocity at the
inlet of “sunlight well” on floor 3. After sunset in the evening, air velocity of the measuring
points decreases gradually and fluctuates smoothly. It can be seen from this that the
“sunlight well” has made full use of solar radiation in the day playing the role of good
indoor ventilation.
Under the condition that the interior cross section of “sunlight well” on floor 2 and floor 3
and the air intake area of the exterior windows opened are the same respectively, the
average indoor air velocity on floor 2 is 0.15m/s in the morning and 0.22m/s in the
afternoon with increase amplitude of 40%. The average air velocity at the double-acting
doors on floor 2 is 0.46m/s in the morning and 0.60m/s in the afternoon, with increase
amplitude of 30%. The average indoor air velocity on floor 3 is 0.14m/s in the morning and
0.16m/s in the afternoon with increase amplitude of 14%, the average air velocity at the
double-acting doors on floor 3 is 0.39m/s in the morning and 0.56m/s in the afternoon, with
increase amplitude about 44%. It can be seen from this that with solar assisted ventilation
measures, air velocity of indoor ventilation is significantly increased with increase
amplitude as high as 14%-40%, thus indoor thermal condition and air quality are improved
significantly. Investment of this technology is low. Auxiliary equipment will no affect the
appearance design of buildings. In addition, the prevailing wind direction in summer in
Chongqing area can be considered to form good wind environment for the buildings for the
benefit of applications of solar assisted ventilation and cooling technology to obtain
enhanced indoor natural ventilation effect.
www.intechopen.com
Solar Energy Resources Used in Building in Chongqing, China
37
Fig. 14. Variation curves of air velocity in the house and at double-acting doors
4. Conclusion
It can be seen from the analysis of solar resource and by taking the climate features in Chongqing area into account that:
1. The use of solar resource in spring and summer in solar photo-thermal system in Chongqing can well meet the demand of domestic hot water by a three-member family. Although such demand cannot be sufficiently met in autumn and winter, remedy can be made by taking auxiliary heating measures. Solar photo-thermal system having good economic and environmental benefit, it will obtain further development with the increase of demand.
2. In the extremely hot summer, provision of horizontal exterior sunshades for the exterior windows of building in different orientations has significant effect of reducing the solar radiation intensity entering the houses from exterior windows. In addition, there exists the best regulation and control time period enabling the horizontal exterior sunshades to play the best role of control. however, in other seasons, much natural light should be let entering the house for the benefit of building lighting. Therefore provision of sunshade facility should take the use demand in summer and winter into account.
3. Solar assisted ventilation technology can effectively reduce indoor temperature in summer and increaseindoor air velocity so that acceptable indoor temperature can be increased to 30℃ to reduce Air conditioning operation time and the load of air
conditioners and improve indoor thermal comfort.
In summary, although solar resource in Chongqing area is congenitally deficient, technical measures for the application of solar energy can be integrated with buildings so that solar resource in the deficient area can be utilized to its maximum in the proper time period and for proper objects through the above described technical measures.
5. References
Ling Wei. (2007). Technical and Economic Analysis of Solar Refrigeration and Solar Water Heating System in Chongqing [J]. China Science & Technology Information. No.11, (November 2007), pp 33-34. ISSN 1001-8972
www.intechopen.com

Solar Power
38
http://paper.people.com.cn/zgnyb/html/2009-11/30/content_393907.htm, 2009-11-30. http://bbs.tiexue.net/post_1683290_1.html, 2006-12-20. Shijun You, Hejiang Sun, Degang Ma, Hongxing Yang. (2002). Solar Energy Resource and
Application Potential in China [J]. Urban Environment & Urban Ecology, Vol.15, No.2, (April 2002), pp. 57-59, ISSN 1002-1264
Bingzhong Wang. ( 1983). Solar Energy Resource Division in China [J], Acta Energiae Solaris Sinica, Vol.4, No.3, (March 1983), pp. 221-228. ISSN 0254-0096
Xiuli Wei, Lihong Gao, Yanghua Gao, Ping Li, Jin Xu. (2008). Assessment on Solar Photo-Thermal Utilization in the Country Area of Chongqing [J], South China Agriculture. Vol.2, No.7, (April 2008), pp. 14-16. ISSN 1673-890X
Yong Ding, Baizhan Li, Qing Luo, Hong Liu. (2007). The Role of Natural Resources in the Improvement of Indoor Hot and Humid Conditions in Chongqing [J], Journal of Chongqing University(Natural Science Edition). Vol.30, No.9, (September 2007), pp. 127-133. ISSN 1000-582X
http://cdc.cma.gov.cn/shishi/climate.jsp?stprovid= Chongqing, China Meteorological Administration
Ministry of Construction of People’s Republic of China, (2002), GB/T 50331-2002. The Standard for Water Quality for Urban Residential Use, China Architecture & Building Press, ISBN 1511211985, Beijing
Chongjie Wang, Yibing Xue. (2007). Design of Solar Buildings, China Architecture & Building Press, ISBN 9787112091249, Beijing.
Ruicheng Zheng. (2006). Technical Manual of Solar Water Heating System Engineering for Civil Buildings( First edition), Chemical Industry Press, ISBN 7-5025-7719-X, Beijing
Dan Shi, Study on Designing Optimized about Window External Shade Device of Resident Building [D], Chongqing, Master thesis of Chongqing University, 2008.
Guoqing Cao, Guangbei Tu, Bin Yang. (2006). Study of Optimum Horizontal Shading Device Dimensions for Energy Saving in Residential Buildings. Acta Energiae Solaris Sinica. Vol.27, No.1, (Jan 2006), pp.96-100, ISSN 0254-0096
A.K.Athienitis, and A.Tzempelikos. (2002). A methodology for simulation of daylight room illuminance distribution and light dimming for a room with a controlled shading device. solar energy. Vol.72, No.4, (April 2002), pp.271-281, ISSN 1003-0417
Huo Song, Guiwen Zhang, Xinghai Dang, et al. (2003). Specialties analysis of similar model and reduced-scale model. Journal of Architectural Education in Institutions of Higher Learning.Vol.12, No.4, (September 2003), pp.57-58, ISSN 1005-2909
www.intechopen.com
Solar PowerEdited by Prof. Radu Rugescu
ISBN 978-953-51-0014-0Hard cover, 378 pagesPublisher InTechPublished online 15, February, 2012Published in print edition February, 2012
InTech EuropeUniversity Campus STeP Ri Slavka Krautzeka 83/A 51000 Rijeka, Croatia Phone: +385 (51) 770 447 Fax: +385 (51) 686 166www.intechopen.com
InTech ChinaUnit 405, Office Block, Hotel Equatorial Shanghai No.65, Yan An Road (West), Shanghai, 200040, China
Phone: +86-21-62489820 Fax: +86-21-62489821
A wide variety of detail regarding genuine and proprietary research from distinguished authors is presented,ranging from new means of evaluation of the local solar irradiance to the manufacturing technology ofphotovoltaic cells. Also included is the topic of biotechnology based on solar energy and electricity generationonboard space vehicles in an optimised manner with possible transfer to the Earth. The graphical materialsupports the presentation, transforming the reading into a pleasant and instructive labor for any interestedspecialist or student.
How to referenceIn order to correctly reference this scholarly work, feel free to copy and paste the following:
Ding Yong, Li Bai-Zhan, Yao Run-Ming, Lian Da-Qi and Dai Hui-Zi (2012). Solar Energy Resources Used inBuilding in Chongqing, China, Solar Power, Prof. Radu Rugescu (Ed.), ISBN: 978-953-51-0014-0, InTech,Available from: http://www.intechopen.com/books/solar-power/solar-energy-resources-used-in-building-in-chongqing-china

© 2012 The Author(s). Licensee IntechOpen. This is an open access articledistributed under the terms of the Creative Commons Attribution 3.0License, which permits unrestricted use, distribution, and reproduction inany medium, provided the original work is properly cited.