solar + storage jobs...solar + storage jobs discussion paper, the solar foundation 5 while...
TRANSCRIPT

2016
SOLAR +
STORAGE JOBS
A DISCUSSION PAPER

ABOUT THE SOLAR FOUNDATION® The Solar Foundation® is an independent 501(c)(3) nonprofit organization whose mission is to increase understanding of solar energy through strategic research and education that transforms markets. It has set itself apart as the premier research organization on the solar workforce, employment trends, and the economic impacts of the solar industry. The common thread throughout The Solar Foundation’s work is a deep interest in increasing access to solar for everyone and the bedrock of that work is its National Solar Jobs Census, which has proven time and again that demand-side solar policies are working - the solar industry is creating good paying jobs faster than other sectors of the economy.
In addition to its highly acclaimed Solar Jobs Census work, The Solar Foundation is the prime awardee on four, multiyear U.S. Department of Energy grants – totaling $15 million. Through this work, The Solar Foundation:
• Leads a team of experts via SolSmart to build capacity among cities nationwide in order to make solar more accessible and affordable for all Americans;
• Leads a team of experts via CivicPACE to provide PACE financing for nonprofits and other tax-exempt entities including homeless shelters and multifamily affordable housing;
• Serves as the National Administrator for the Solar Ready Vets program – which trains transitioning military personnel for solar careers, and;
• Serves as the National Administrator for the Solar Training Network – which connects solar trainers, employers and jobseekers in order to better meet growing workforce demands.
More at www.TheSolarFoundation.org
For media inquiries about this discussion paper, contact:Avery Palmer, Senior Communications [email protected] 202-846-7509
For questions about the analysis, contact:Ed Gilliland, Senior Director of [email protected]
Special thanks to Intersolar for sponsoring this work.
COVER IMAGE COURTESY OF NREL

1Solar + Storage Jobs Discussion Paper, The Solar Foundation
IntroductionAs energy storage systems are added to the electricity grid at an accelerating pace, it is imperative that decision makers have a general understanding of the economic impacts. To this end, The Solar Foundation (TSF) produced this discussion paper on the current labor efficiencies experienced by the U.S. solar industry and how such measures may provide insight about solar related employment in the energy storage industry. While we consider the storage results to be preliminary, this discussion paper was developed using data collected through The Solar Foundation’s National Solar Jobs Census 2015, as well as information collected through interviews of solar and energy storage experts from across the country.
Solar Installation Productivity
Table 1: Installation Sector (Residental & Non-Residential) Jobs/MW Calculation
Year Jobs* MW Installed** Jobs/MW
2010 43,934 585 75.10
2011 52,503 1,140 46.06
2012 57,177 1,569 36.44
2013 69,658 1,906 36.55
2014 97,031 2,325 41.73
2015 119,931 3,228 37.15
2016 (projected) 139,813 4,044 34.57
*The Census survey defines solar employees as any worker who spends at least 50% of their time on solar-related work. For the installation sector it would not only include installation work crews but supporting staff such as those needed to obtain permits, order parts, and manage human resources. **SEIA/GTM Solar Market Insight Report Series, 2010 – Q1 2016
According to the National Solar Jobs Census 2015, there were nearly 209,000 people em-ployed in the U.S. solar industry in 2015, rep-resenting the third consecutive year of roughly 20% job growth. This growth mirrored that of installed solar capacity; 7,451 MWs were in-stalled in 2015, a 19% increase over that es-timated for 2014.1 The installation sector em-ploys 119,931 people, or about 57% of the total solar workforce. As counted in Census 2015, this figure primarily consists of residential and non-residential installers and installation sup-port staff.
Labor efficiency in the solar industry, as mea-sured by the number of jobs/MW installed has increased over the past five years, with the number of jobs needed per MW installed drop-ping rapidly from 75 in 2010, to 46 in 2011, and declining unevenly to 37 in 20152. This decline is expected to continue as improvements in equipment, technology, and experience among installers lead to more streamlined installation techniques. Nonetheless, the rate of this decline is decreasing as many of the simplest to achieve efficiencies, such as integrated racking systems, have already been realized.

2Solar + Storage Jobs Discussion Paper, The Solar Foundation
Most of the Census 2015 utility-scale installa-tion jobs were counted in the project develop-ment sector. In 2015, this sector consisted of 22,452 jobs, growing nearly 50% since 2014. Project development firms hired about 50 em-ployees per firm in 2015, more than eight times the rate of such hiring in 2014. Utility-scale ca-pacity deployment experienced improved effi-ciency until 2015, with the number of jobs/MW declining from 4.43 in 2012 to 3.85 in 2014, be-
fore rising again to 5.32 in 2015. This increase is attributable to the buildup in employment given that 2016 was presumed to be the final year of the 30% federal investment tax credit.3 Utility-scale projects require more lead time to develop and complete than residential rooftop. Thus, the ramp up in employment to support projects that would come online in 2016 like-ly began in 2015 and was factored into Census 2015 employer responses.
Table 2: Project Development Sector (Utility-Scale) Jobs/MW Calculation
Year JobsMW
Installed* Jobs/MW
2012 7,988 1,803 4.43
2013 12,169 2,855 4.26
2014 15,112 3,922 3.85
2015 22,452 4,223 5.32
2016 (projected) 26,074 10,498 2.48
Given the subjectivity of the above analysis, The Solar Foundation also examined the jobs/MW question from a slightly different perspective. The breakdowns above assume that firms that self-identified as installation firms only install for residential and non-residential projects and
that those that identified as project developer firms only worked on utility-scale projects. As part of Census 2015, firms in the two sectors collectively reported the following breakdown of their workforces by project sector:
*SEIA/GTM Solar Market Insight report series, 2010 – Q1 2016
Table 3: Revised Jobs/MW Calculation
Percent of Jobs Jobs MWs Installed Jobs/MW
Residential 63.3% 90,128 2,159 41.75
Non-Residential 15.2% 21,642 1,069 20.25
Utility-Scale 21.5% 30,612 4,223 7.25
Total 100.0% 142,382 7,451

3Solar + Storage Jobs Discussion Paper, The Solar Foundation
This breakdown provides a cleaner approach to matching jobs to MWs by market segment, but this data is only available for 2015. Based on these figures, the average jobs/MW for each market segment in 2015 were 41.75 for residen-tial, 20.25 for non-residential, and 7.25 for utili-ty-scale. If we assume that the utility-scale proj-ects hired in anticipation of the coming year’s projected capacity additions, then average labor efficiency is best calculated using 2015 jobs and projected 2016 installed capacity. With such an adjustment, there were 2.92 utility-scale jobs/MW. Utility-scale work is more labor efficient be-cause these projects benefit from economies of scale. While the permitting and approval pro-cess is longer than for a residential project, it is relatively short given the project size or on a time per MW basis. The utility-scale workforce is also more specialized, and since the arrays are typically ground mounted, in one location, and fairly uniform, the installation process itself is generally easier than a portfolio of residential rooftop projects of comparable capacity. While
not as efficient, rooftop residential projects cre-ate significantly more jobs (but lower paying ones), and thus, from a tax-base and purchasing power standpoint, can provide a stronger stim-ulus to the local economy.
The dichotomy between utility-scale, commer-cial and residential MW labor productivity has numerous economic and policy implications. While job creation is desired, it is also desirable for firms to develop efficiently at the lowest cost. And while utility-scale solar development is more efficient than residential rooftop so-lar, there are merits for distributive generation as well. Such issues take on added complexity when storage is considered.
The previous discussion on solar productivity forms the basis for a comparison with energy storage productivity and subsequently, solar + storage jobs. In the next section we introduce the solar + storage market followed by an analy-sis of solar + storage jobs.
Photo courtesy of Solar City

4Solar + Storage Jobs Discussion Paper, The Solar Foundation
While energy storage is experiencing significant growth, most of it has not been in support of solar installation. Storage growth is needed to meet demand for everything from mobile devic-es to electric vehicles to the electricity market. In the electricity market, storage is primarily used by utilities and independent system oper-ators (ISOs) to improve the speed and accuracy of the wholesale market. As such, storage serves to improve grid efficiency for all energy sources, whether renewables or fossil fuels.4 As it relates to solar power, storage benefits vary depending on markets and policies. Solar sup-ported by storage can help the grid and whole-sale markets as noted above. Specifically, stor-age can help regulate changes in grid frequency and voltage caused by load variation. Similarly, storage can support the grid through black start capability, providing a quick injection of energy in case of system failure, such as that caused by inclement weather. In contrast, many large fos-sil fuel plants are unable to start quickly after a
system-wide shut down. Storage can also sup-port utilities and ISOs in transmission conges-tion relief. Finally, storage can provide peak load power that can help to defer capital investment for increased generation, transmission, or dis-tribution capacity.
To provide some or all of the energy services above, the storage owner contracts with a util-ity, ISO, or third party, providing them access to the owner’s storage system. Front of the meter, utility-scale storage has typically deployed solar to meet the above needs. Storage has other benefits, some of which spe-cifically apply to solar. Storage can smooth the impact of cloud caused variation in solar irradi-ation, allowing a solar farm to provide a great-er, more consistent supply of energy. Storage batteries can also be charged by solar energy during the daytime for use at night. Similarly, storage systems can store solar or grid-provid-ed energy when electricity rates are low and use it or sell it back to the grid when rates are high.
Solar + Storage Benefits
Photo courtesy of NREL

5Solar + Storage Jobs Discussion Paper, The Solar Foundation
While utility-scale storage has been the larg-est electricity-related market, there is growing interest in deploying storage to support be-hind the meter renewables such as solar. Like utility-scale, behind the meter residential and non-residential storage can provide backup power and a source of evening power. Notably, the latter benefit materializes where net me-tering is unavailable or uneconomical, or when demand charges or time-of-use rates encour-age energy price arbitrage. Therefore, non-res-idential customers are finding greater use for storage than residential customers, as they are more frequently subjected to these variable rate structures. Residential demand for storage will grow as customers encounter more of these variable rates. Thus, the benefits of storage are highly contingent on policies and regulations.
Behind the meter storage can also support the grid. There is rapidly growing interest in aggre-gating smaller commercial and residential cus-tomers to provide energy services to the whole-sale market. Firms can aggregate multiple solar + storage systems through software to provide energy services to the wholesale market in sim-ilar fashion to that of ISOs and utilities.
For example, New York’s Consolidated Edison (Con Edison) is starting a pilot project to aggre-gate 300 solar-plus-storage customers to serve the wholesale market in return for lower electric bills. To set up this “Virtual Power Plant,” Con Edison has contracted with SunPower (panels) and Sunverge (batteries) to install the systems. The customers will lease the systems, but Con Edison will maintain operation of the systems to support the grid by providing over 1.8 MWs of storage capacity.5 The customers, in turn, will also benefit by having a source of backup elec-tricity if the power goes out.
Storage systems need not be limited to pro-viding just one of the above benefits; they can serve multiple uses at different times, increas-ing return on investment. For example, a solar + storage system can reduce demand charges and shift billing to lower time-of-use rates for the customer. When storage is not supporting these customer needs, it can, in conjunction with other customer storage units, provide fre-quency regulation and ancillary services to the grid. The further down the electric grid supply chain, the more valuable these services can be.6 So behind the meter residential and commercial customers have the greatest opportunity to cap-ture and monetize this multitude of uses.
Solar + Storage Residential/
Non-Residential Benefits
Photo courtesy of NREL

6Solar + Storage Jobs Discussion Paper, The Solar Foundation
Solar + Storage Market OpportunityIn 2015, the energy storage market deployed 221 MWs of storage, 243% more than the 65 MWs deployed in 2014. Of the 221 MWs, 187 MWs were estimated to be in front of the me-ter (utility-scale), with the remaining 35 MWs behind the meter.7 The U.S. market is expected to deploy 2,081 MWs by 2021, nine times larg-
er than the 2015 market. The greatest growth is expected to occur in the behind the meter (residential & non-residential) segment, grow-ing from 15% to 49% of deployed MWs in 2021 with residential demand experiencing the fast-est growth.8
Table 4: Storage Deployment Trends 2015 - 2021 (MWs)*
2015 2021
Front of the Meter 187 1,061
Behind the Meter 35 1,020
Total 221 2,081
Key drivers of market growth include many of the same factors that have driven PV growth: declining costs, comparably high electricity rates, policies, and incentives. Battery prices have declined 80% over the last six years9 and total costs are project-ed to decline more than 40% over the next five years.10 As storage costs decline, the value of the solar + storage package increases. The pack-age cost is higher than just solar but of greater value – so storage will likely increase PV instal-lation and related employment. Furthermore, storage makes larger systems more economical. Many residential customers installed smaller, 2-3 KW systems so as to not exceed the total annual load for their net metering credit. With storage, it becomes economical to enlarge their system, which, at scale, would result in more jobs.
The fastest growing storage market segment – residential – will likely be driven by solar deployment if states restrict net metering, in-crease residential time-of-use rates (or demand charges), or encourage virtual power plants as
is being done in New York. While net meter-ing is being challenged in many states, the proposed legislation is not passing in most instances.11 Converse-ly, it is likely that more states will be subject to
time-of-use rates; California has already enact-ed them for residential customers. The virtual power plants have both policy and economic ap-peal and, thus, will likely experience significant growth. Distributed generation can be aggregat-ed to optimize both customer and utility needs, providing a return on investment for all parties. With solar coupled with storage, utilities are starting to view distributed generation (DG) as a business opportunity.
As storage costs decline, the value of
the solar + storage package increas-
es. The package cost is higher than
just solar but of greater value – so
storage will likely increase PV instal-
lation and related employment.
*GTM Research/ESA, U.S. Energy Storage Monitor, Q2 Review
7Solar + Storage Jobs Discussion Paper, The Solar Foundation
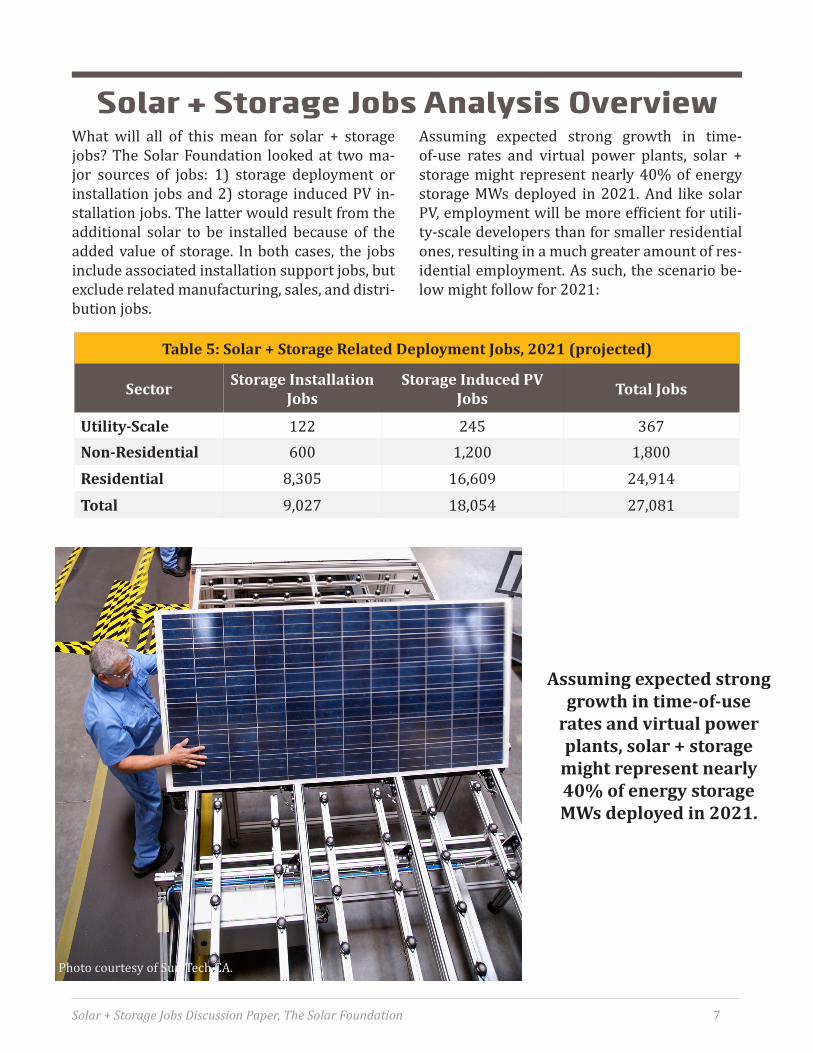
Solar + Storage Jobs Analysis OverviewWhat will all of this mean for solar + storage jobs? The Solar Foundation looked at two ma-jor sources of jobs: 1) storage deployment or installation jobs and 2) storage induced PV in-stallation jobs. The latter would result from the additional solar to be installed because of the added value of storage. In both cases, the jobs include associated installation support jobs, but exclude related manufacturing, sales, and distri-bution jobs.
Assuming expected strong growth in time-of-use rates and virtual power plants, solar + storage might represent nearly 40% of energy storage MWs deployed in 2021. And like solar PV, employment will be more efficient for utili-ty-scale developers than for smaller residential ones, resulting in a much greater amount of res-idential employment. As such, the scenario be-low might follow for 2021:
Table 5: Solar + Storage Related Deployment Jobs, 2021 (projected)
SectorStorage Installation
Jobs
Storage Induced PV
JobsTotal Jobs
Utility-Scale 122 245 367
Non-Residential 600 1,200 1,800
Residential 8,305 16,609 24,914
Total 9,027 18,054 27,081
Assuming expected strong
growth in time-of-use
rates and virtual power
plants, solar + storage
might represent nearly
40% of energy storage
MWs deployed in 2021.
Photo courtesy of Sun Tech CA.

8Solar + Storage Jobs Discussion Paper, The Solar Foundation
Analysis, Assumptions & MethodologyAbout a third, or 9,000, of the projected 27,000 jobs are from storage installation/deployment. The calculation of storage jobs assumes that just under 40% of projected installed storage MWs are tied to solar with utility-scale represent-ing the fewest (10%) and residential the most (90%) as shown in Table 6.The projected storage jobs/MW are based on The Solar Foundation’s solar jobs/MW calcula-tion as shown in Table 7. We assumed that stor-age deployment can be completed on average in 25% of the time that it takes to install solar given the same size work crew. Since labor effi-ciency will vary greatly based on many factors, the 25% figure is a composite figure. For exam-ple, storage labor is more efficient if the system is deployed when the solar panels are originally installed.12
We used a factor to convert solar jobs/MW into storage jobs/MW as shown in Table 8. The need-ed storage capacity in MWs does not necessarily
match the capacity of the associated PV system or systems. Therefore, storage MWs must be converted into solar MWs to get a comparable ratio of jobs/MW. Storage jobs are primarily based on the number of customers rather than MWs. So while 1 MW of PV might equate to 167 installations at an average of 6 kW per installa-tion, a MW of storage might equate to over 300 installations averaging 3.3 kW per customer. For residential storage, we assumed such a scenar-io: that smaller sized kilowatt storage units are paired with larger sized kilowatt PV systems. This adjustment results in a greater number of jobs/MW for storage as shown in Table 8. However, these calculations are very subjective requiring further research. Dozens of factors, including the selected set of benefits discussed previously, help to determine the optimum size storage system. Several examples, used in our calculations for the three solar sectors, are shown in the Table 8.
Photo courtesy of O2 EMC

9Solar + Storage Jobs Discussion Paper, The Solar Foundation
Table 7: Storage Installation Jobs/MW, 2021 (projected)
SectorSolar Jobs/
MW
Additional Labor to
Install Storage
Factor to Con-
vert Storage
Jobs/MW
Storage Jobs/
MW*
Percent Jobs/MW
Utility-Scale 2.5 25% 0.63 1.85 1.15
Non-Residential 15 25% 3.75 0.91 3.41
Residential 35 25% 8.75 1.82 15.91*Per MW of storage. Additional solar jobs/MW times conversion factor
Table 8: Factor to Convert Solar Jobs/MW to Storage Jobs/MW
SectorTypical or Sample
Solar Installation
Typical or Sample
Storage Installation
Factor to Convert Stor-
age to Jobs/MW
Utility-Scale* 24 MW 13 MW 1.85
Non-Residential** 50 MW 55 MW 0.91
Residential*** 6 MW 3.3 MW 1.82
* Kaua'i, Hawaii 24 MW solar farm being supported by a 13 MW (52 MWH) storage system. **Hypothetical 27,625 sq. ft. Los Angeles store, Economic Analysis Case Studies of Battery EnergyStorage with SAM, NREL, Nov., 2015 ***Based on a 3.3 KW Tesla Powerwall matched with an average 6 KW rooftop solar installation
Table 6: Storage Installation Jobs, 2021 (projected)
SectorStorage MWs
Deployed*
Solar + Storage
Deployed**
Storage Jobs/
MWStorage Jobs
Percent MWs
Utility-Scale 1,061 10% 106 1.15 122
Non-Residential 440 40% 176 3.41 600
Residential 580 90% 522 15.91 8,305
Total 2,081 39% 804 9,027
*Total and utility-scale projections: U.S. Energy Storage Monitor: Q2 Review, GTM Research/ESA **The percent and MWs of total deployed storage that is collocated with and tied to a solar array.

10Solar + Storage Jobs Discussion Paper, The Solar Foundation
The storage employment includes installa-tion and associated support jobs. Storage de-ployment typically includes a battery, inverter, software controls, wiring, and onsite program-ming. Skills and wages for storage deployment are expected to mirror the median wage for PV installation ($21 per hour in 2015). Efficiency could improve quickly as firms gain practice with modular, plug-and-play equipment. None-theless, with the growing complexity of storage uses, demand for higher skilled programming work will likely increase. Non-residential and utility-scale storage deployment skills, like those for PV installation, will be greater and
more specialized than residential. Onsite pro-gramming could be considerable, driving up re-quired skills and wages.
For the second projection, we assumed that 50% of the storage installations will stimulate solar installation that, if not for the availability of storage, wouldn’t occur. Given the natural fit between solar and storage, we consider 50% a conservative estimate, as shown in Table 9. This estimate generates another 18,000 jobs for a to-tal of 27,000 jobs after adding in the 9,000 stor-age jobs.
Table 9: Storage Induced PV Jobs, 2021 (projected)
Sector
Storage
MWs De-
ployed*
Equivalent
Amount of So-
lar Installation
Storage In-
duced PV
Solar
Jobs/MW
Additional
Solar Jobs
Factor MWsMarket
Share MWs
Utility-Scale 106 1.85 196 50% 98 2.5 245
Non-
Residential176 0.91 160 50% 80 15 1,200
Residential 522 1.82 949 50% 475 35 16,609
Total 804 18,054
Photo courtesy of NREL
*Storage that is collocated with and tied to a solar array.

11Solar + Storage Jobs Discussion Paper, The Solar Foundation
Like the experience of solar PV, storage deploy-ment labor efficiency has been improving, help-ing to drive down costs and stimulate demand for the technology. Fortunately, it is expected that storage will continue to experience greater declines in both soft and hard costs. Yet solar + storage, from a business model and policy per-spective, is where solar PV was approximately ten years ago. There are a number of ways for storage to add value, yet business practices and policies are not well enough established to cap-italize on these opportunities. However, as the practices and policies improve, storage and re-lated jobs are anticipated to experience signifi-cant growth.
While this discussion paper attempts to project labor market impacts and efficiencies of storage with PV systems, many assumptions were nec-essary. Thus, additional research focused on the following questions will be required in order for any future analysis to be more rigorous.
1. What is the labor required to install storage? What size crew is needed to install storage for what length of time under various scenarios? How is this changing?
2. What is the likely solar + storage share of the overall electric grid storage market and how will it change? How will it vary for the utility-scale, non-residential, and residential segments?
3. What is the right mix of storage and solar ca-pacity? How does it vary for the three sectors under various scenarios?
4. How can we make the solar + storage mar-ket more attractive? What policies and business practices need to change to grow this promising market?
5. Similarly, what proportion of solar + storage customers install solar because of the benefits of storage? That is, they would not install solar if not for the chance to acquire the entire solar + storage package and related benefits. 6. What can the U.S. learn from other countries?
Conclusion
Photo courtesy of Direct Energy Solar

12Solar + Storage Jobs Discussion Paper, The Solar Foundation
Endnotes1SEIA/GTM Solar Market Insight Report, 2015
2 Jobs per MW is a broad productivity measure depicted by the ratio between total installation related jobs in the Fall of a given year and total installed capacity (output) over that same year. Solar jobs are defined as those where some-one spends at least 50% of their time in solar-related work. This measure also includes support jobs such as staff to obtain permits, order parts, and manage human resources. Given these assumptions, the calculation is not intended to tie output to the labor hours.
3The investment tax credit was extended in December 2015 at the full 30% through 2019, declining to 26% in 2020 and 22% in 2021, and for commercial, 10% thereafter. 4An October 2015 report, The Economics of Battery Energy Storage, by the Rocky Mountain Institute identified 13 uses for storage for the electric grid for three stakeholder groups: ISOs & regional transmission organizations (RTOs), utilities, and customers.
5Con Edison virtual power plant shows how New York's REV is reforming utility practices, Utility Dive, June 21, 2016, http://www.utilitydive.com/news/coned-virtual-power-plant-shows-how-new-yorks-rev-is-reforming-utility-pra/421053/
6The Economics of Battery Storage, Rocky Mountain Institute, October, 2015
7 U.S. Energy Storage Monitor: 2015 Year in Review, GTM Research/ESA U.S. Energy Storage Monitor
8U.S. Energy Storage Monitor: Q2 Review, GTM Research/ESA U.S. Energy Storage Monitor
9Evaluating Behind-the-Meter Energy Storage Systems with NREL’s System Advisor Model, NREL, Jan., 2016, http://www.nrel.gov/docs/gen/fy16/65729.pdf
10Grid-Scale Energy Storage Balance of Systems 2015-2020: Architectures, Costs and Players, Jan. 2016, GTM Research, figure is for utility-scale storage systems.11GTM Solar Summit, Future of Solar, solar is winning 95% of net metering battles.12Similar to the way that the National Solar Jobs Census counts solar workers, for storage installation we not only include installation work crews but supporting staff such as those needed to obtain permits, order parts, and manag
human resources.

Washington, DC | (202) 469-3750
www.TheSolarFoundation.org