solids, liquids, gases
DESCRIPTION
Solids, Liquids, Gases. Ch 16 09-10. Phase Change Graphs. Shows the temperatures at which substances change from solids to liquids, liquids to gases Can show time or energy needed to make the changes. Phase changes - Adding energy. Phase changes – Giving Off energy. - PowerPoint PPT PresentationTRANSCRIPT
Solids, Liquids, GasesCh 16
09-10

Phase Change GraphsShows the temperatures at which
substances change from solids to liquids, liquids to gases
Can show time or energy needed to make the changes

Phase changes - Adding energy
Phases Change Example
Solid liquid Melting Ice water
Liquid Gas Boiling Water steam
Solid Gas SublimingDry ice CO2
Gas
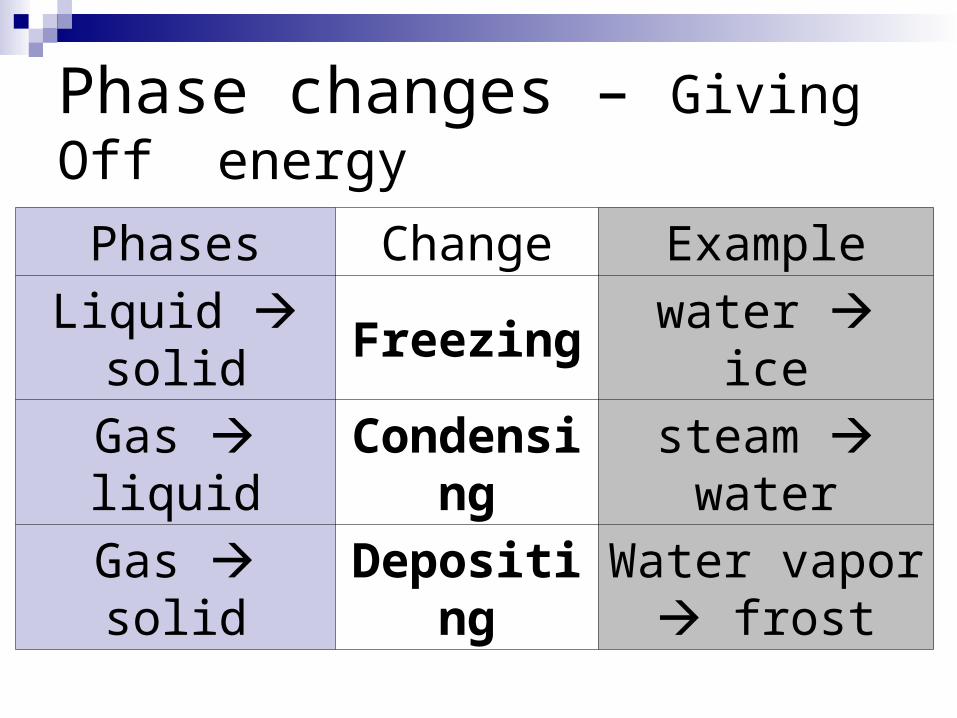
Phase changes – Giving Off energy
Phases Change Example
Liquid solid Freezing water ice
Gas liquid Condensing steam water
Gas solid DepositingWater vapor
frost
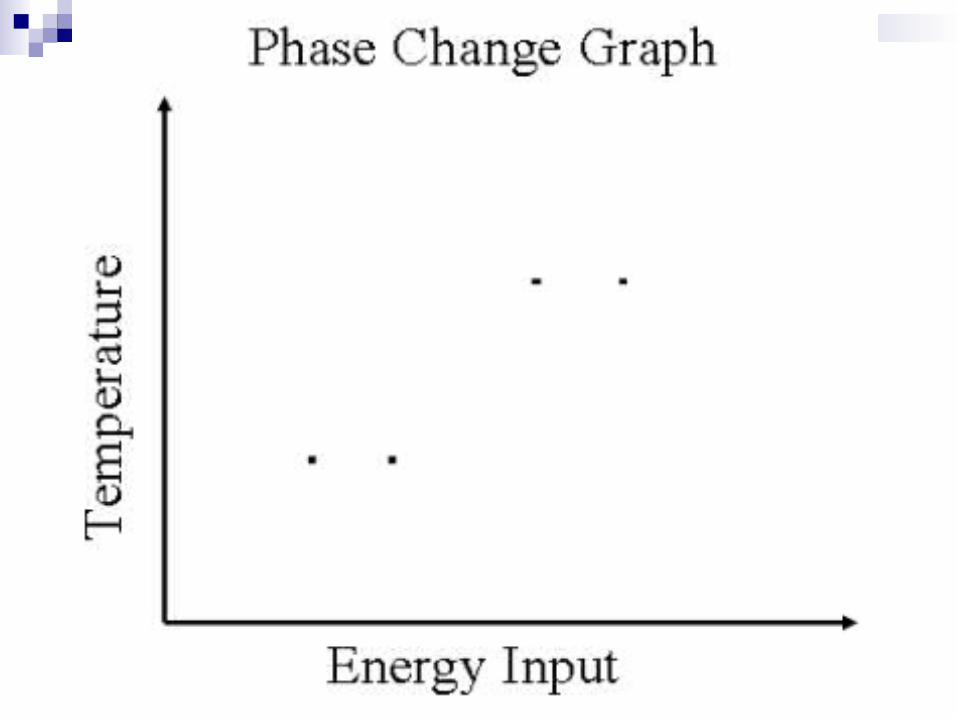

Water Phase Change Graph

During a phase change, such as melting or boiling, the Temperature remains the same.
During a phase change, such as melting or boiling, the energy is changing.
On the phase change graph, the energy/time is the independent variable.
On the phase change graph, the temperature is the dependent variable.

DensityDEF: amount of mass in a
certain volume.Density is a physical
property.

Circle Formula

Variable Units
m = mass g
V = volumeLiquids - mL
Solids - cm3
D = densityLiquids – g/mL
Solids – g/cm3

What is the density of a 140g block of wood whose volume is 200mL?

What is the density of a piece of iron that has a mass of 16.4 g and a volume of 2.08 mL?

What is the density of a granite block that has a volume of 47 cm3 and a mass of 220 g?

If a block of tungsten has a mass of 97 g and a volume of 5 cm3, what is the density of the tungsten block?

Ice has a density less than water. If you have a 34 g block of ice with a volume of 38 mL, what is the density of the ice block?
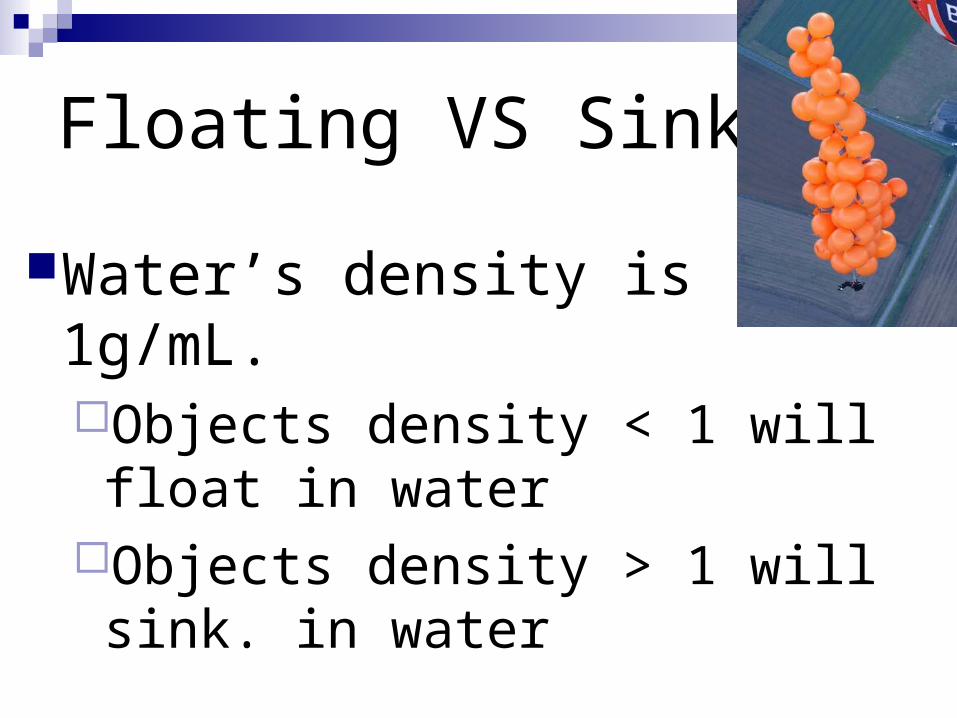
Floating VS Sinking
Water’s density is 1g/mL.Objects density < 1 will float in waterObjects density > 1 will sink. in water
Gas Laws
Sections 2 - 3
Objectives 16-2 Explain and apply Gas Laws. 16-3 Determine the viscosity of a liquid.

Viscosity – DEF: Resistance to flow
High viscosity pours slowly
EX:
Low viscosity pours fast/easily
EX:

PressureDEF: Amount of force exerted
per unit area

Caused byIn gases
Particles hitting each otherIn liquids & solids
Pushing down

Pressure on your hand activity
See worksheet packet for directions

RelationshipsHigher altitude = lower air pressure
Lower altitude = higher air pressure

RelationshipsDeeper under water =
higher water pressure
Shallow water = lower water pressure
Thermal ExpansionDEF: A substance increase in
size as temperature increasesIt will decrease in size as the
temperature decreases

Thermometers As temp rises, fluid takes up
more spaceHot Air Balloons
As temp rises, air less dense, Hot Air Balloon moves upward
Bridge JointsAs road expands, would
push up if no place to go

Thermal expansion in gases is involved with 2 gas laws.Boyle’s LawCharles’ Law
Off to the SMART Notebook