solutions for homework 2 networked life, fall 2014 … for homework 2 networked life, ... solution....
TRANSCRIPT

Solutions for Homework 2Networked Life, Fall 2014Prof Michael KearnsDue as hardcopy at the start of class, Tuesday December 9
Problem 1 (15 points: Graded by Shahin) Recall the network structure of ourin-class trading experiment shown in Figure 1
Figure 1: Network Trading - In Class Example
a. (3 points) Carefully apply the theory relating network structure to equilibrium to thisnetwork. You must describe exactly how the theory yields the resulting equilibriumwealths/prices, and what parties will trade with each other. No credit will be givenfor simply describing the equilibrium; you must show how it is derived.
Solution. The equilibrium is as shown in Slides 26 of the lecture on Trading inNetworks.
b. (3 points) What is the smallest number of Wheat players that can be added to GroupF that will cause the Milk players in Group S to trade only with Group F Wheatplayers? Justify your answer.
Solution. Let x denote the number of Wheat players added to group F . Then, wewant the ratio of (5 + x)/6 be the highest ratio of nodes to neighbors in the network.So in particular, it should also be bigger than the second highest ratio which is(15 + x)/8 (adding Wheat players of group F and A together).
5 + x
6>
15 + x
8→ x > 15. (1)
1

So at least 16 wheat players should be added to group F . Note that it is not simplysufficient to beat the 25/12 ratio because this ratio will also get bigger when addingmore players to group F . The same logic applies to parts c and e.
c. (3 points) What is the smallest number of Milk players that can be added to GroupB that will cause the Wheat players in Group S to trade only with Group B Milkplayers? Justify your answer.
Solution. Similar to part b we want
10 + x
8>
15 + x
9→ x > 30. (2)
So at least 31 Milk players should be added to group B.
d. (3 points) What is the smallest number of edges that can be added to the network sothat all equilibrium wealths are equal? Describe in detail which edges should beadded.
Solution. The smallest number of edges that needs to be added is 13. To see this, letgroup E’s Wheat and Milk players trade together. Let 5 of the Wheat players ingroup A trade with the 5 Milk players in S and 3 with group A’s Milk players.Connect the other 2 to 2 of the Milk players in group B. Similarly for group B, let 5of the Milk players in group B trade with the 5 Wheat players in S and 3 with groupB’s Wheat players. The remaining 2 are now trading with the 2 Wheat players ofgroup A. For group C let 3 of the Wheat players to internally trade with group C’sMilk players. Do the opposite in group D. Now connect the 7 remaining Wheatplayers from group C to 7 remaining Milk players in group D. For group E let 1 ofthe Wheat players to internally trade with the sole group F ’s Milk players. Do theopposite in group F . Now connect the 4 remaining Wheat players from group E tothe 4 remaining Milk players in group F . In this way we added 2 + 7 + 4 = 13 edgesand arrived at a perfect matching.
Note that the naive solution of adding an edge between the 7 Wheat players fromgroup A (and also C) to 7 Milk players in group B (and also D), then adding 4 edgesbetween the 4 Wheat players from group F to the 4 Milk players in group G willresult in 7 + 7 + 4 = 18 edges with is obviously not the smallest number of edgesneeded for the perfect matching.
Finally note that adding an edge between two groups will count as more than oneedge! For example the edge between group A and S represents 65 edges: 5× 10 edgesbetween the Milk players of group S and the Wheat players of group A and 5× 3edges between the Wheat players of group S and the Milk players of group A.
e. (3 points) Suppose we add another Group H to the network. Let us denote thenumber of Milk and Wheat players in group H as mH and wH , respectively. AssumewH > mH . Precisely determine the relationship between mH and wH such that theGroup S Milk players trade only with Group H Wheat players.
2

Solution.wH
mH + 5>wH + 5
mH + 6→ wH > 5mH + 25. (3)
Note that the answer to some part of this question is different than what I discussed in thereview session. (Thanks to Lulu for pointing this out!) So I graded this question veryleniently especially on parts c and e.
Problem 2 (9 points: Graded by Ryan) Consider the competitive contagionexperiments in which you participated. Suppose that for some graph G, the distribution ofseed pairs chosen by the participants is P . We say that P is an equilibrium if every seedpair (i, j) appearing in P receives the same average payoff (call it x) against P , and thereis no seed pair (i, j) not appearing in P that receives a payoff greater than x against P .
a. (3 points) Suppose the graph G is generated by Preferential Attachment. Describewhat you think the equilibrium distribution P would look like. Justify your answer.
Solution. The 2 highest degree nodes would be the only seed pairs to choose. So allplayers would play the same seed pairs and hope the randomization worked in theirfavor where they won the seed pair. The heavy tail degree distribution characteristicof PA graphs means that there are few nodes with degree many times more than theaverage degree. Thus, the expected number of times a player could win a high degreenode, even if everyone is playing it, would still lead to a better payoff than choosing asmall degree node.
b. (3 points) Describe, as precisely as possible, a network G for which the equilibriumdistribution P will not have all players choose the same seed pair. Justify youranswer.
Solution. The network with 3 disjoint connected components with equal number ofnodes in each component.
c. (3 points) Describe, as precisely as possible, a network G for with the equilibriumdistribution P requires that every player play a different seed pair. Justify youranswer.
Solution. The network with 2n disjoint connected components with equal number ofnodes in each component, where n is the number of players.
Common issues with this problem: you needed to make sure that the network youmade did not have an equilibrium where everyone played the same seed pair. This wouldhappen in the cycle graph. You must consider the expected payoff under the distributionP .
3

Problem 3 (10 points: Graded by Shahin) Consider a 2-player game where both therow and column players have two actions.
a. (5 points) Suppose the utility of each pair of actions is summarized as in Table 1.Complete the empty cells of the utility matrix such that the game has no purestrategy equilibrium.
Row Player/Column Player a bc +1, -1d
Table 1: Utility Matrix
Solution. Here are two of the many possible ways to fill the entries.
Row Player/Column Player a bc +1, -1 2, 0d 0, 2 3, 1
Row Player/Column Player a bc +1, -1 -1, +1d -1, +1 +1, -1
Table 2: Games with no pure strategy Nash-equilibrium.
b. (5 points) Suppose the utility of each pair of actions is summarized as in Table 3.Complete the empty cells of the utility matrix such that the game has exactly twopure strategy equilibria. Does your game have a mixed strategy Nash-equilibrium?
Row Player/Column Player a bc -1, 2d 2, -1
Table 3: Utility Matrix
Solution. There are many possibilities for this part as well. The equilibria can be theinitial filled cells (Table 4), or the initial empty cells (Table 5) or a combination ofone initially empty cell and one initially filled cell (Table 6). The game always have amixed strategy Nash-equilibrium (and by that we mean a mixed strategy that isdifferent than the pure strategies!).
4

Row Player/Column Player a bc +1, -1 -1, 2d 2, -1 -4, -3
Table 4: The equilibria are the initial filled cells. The game has a mixed strategy.
Row Player/Column Player a bc 5, 5 -1, 2d 2, -1 5, 5
Table 5: The equilibria are the initial empty cells. The game has a mixed strategy equilib-rium.
Row Player/Column Player a bc 2, 4 -1, 2d 2, -1 -1, -3
Table 6: The equilibria are one initially filled cell and one initially empty cell. The gamehas a mixed strategy.
5

Problem 4 (12 points: Graded by Shahin) Remember the attendance dynamic wherethe horizontal axis denotes the percentage of students who attended the class today andthe vertical axis denotes the percentage of students who are going to attend the next class.If possible, plot an attendance dynamic with the properties mentioned in each part. If not,briefly describe why plotting such attendance dynamic is impossible.
a. (3 points) An attendance dynamic with 5 equilibria such that 3 equilibria are stableand 2 are unstable.
b. (3 points) An attendance dynamic with 5 equilibria such that 2 equilibria are stableand 3 are unstable.
c. (3 points) An attendance dynamic with 5 equilibria such that only 1 equilibrium isstable and 4 are unstable.
d. (3 points) An attendance dynamic with 5 equilibria such that all equilibria areunstable.
Solution. It is possible to have an attendance dynamic in all parts except the last part.1
For grading on part (d), unless you draw something with a clearly stable equilibrium oryour graph does not have support for some parts of 0-100 range, you received full credit.The dynamics are drawn in Figure 2.
Figure 2: Problem 4
1It is actually possible to get an attendance dynamic for the last part. But the solution is out of scope ofthis course.
6

Problem 5 (5 points: Graded by Shahin) Pick one of the experiments from theassigned papers on behavioral experiments that we have not discussed in class (e.g.,Independent Set or Network Bargaining). Briefly but precisely describe the equilibria inthe experiment. Then compare these equilibria in terms of the pay-offs that players receiveand describe why some equilibria might be more preferable to players than others.
Solution. Open ended. There are more than one equilibria in all of these experiments forexample in independent set, any independent set is an equilibrium. However, players willreceive more pay off in total (in terms of social welfare) if they find the largest independentset (instead of only an independent set). So players might prefer to find the largestindependent set instead of any independent set if they want to maximize the social welfare.Similar observations can be made for other experiments like network bargaining.
Problem 6 (10 points: Graded by Ryan) Recall the Online Coloring Experiment on30 graphs and the results that were covered in class. There were three types of graphfamilies (Random, Preferential Attachment, and Small Worlds) that were used in theonline experiments and each had the same number of nodes and edges.
a. Many students claimed that one strategy they used was to color the maximum degreenode first and then color its neighbors in as few colors as possible. Why might thisheuristic lead students to faster finish times in Preferential Attachment graphs? Whymight this same heuristic cause students to have worse finish times in Small Worldgraphs?
Solution. PA has few nodes of very high degree and few links between its neighbors.That means that we could color the highly connected node, say Red, and then colorall of its neighbors Blue because the chance that two Blues would now be connectedwas low. This was because the clustering coefficient for PA graphs is small.
In SW, we do not have very high degree nodes, but we have lots of nodes that areclose in distance to one another. Hence, there would be lots of nodes that haveneighbors who are also neighbors of each other, i.e. triangles due to the highclustering coefficient. This makes it hard to color the neighbors of a highly connectednode with few different colors. Also the nodes with highest degree are not muchhigher than most of the nodes.
b. Another strategy that students claimed to use was to find triangles and then color allthe nodes in the triangle differently. What family of graphs (Preferential Attachmentor Small World) would you think this would be a better heuristic for? Explain yourreason.
Solution. I would argue that SW would be, because there is a large clusteringcoefficient for SW (i.e. friends of friends happen to also be friends of eachother).Hence, we would image lots of cliques, e.g. triangles, in the network. Dealing withthe triangles first would nearly color the whole graph.
7
Problem 7 (9 points: Graded by Ryan) Recall Network Trading where there arepeople with one unit of Milk (Red) and people with one unit of Wheat (Blue) that want totrade their good for the other good.
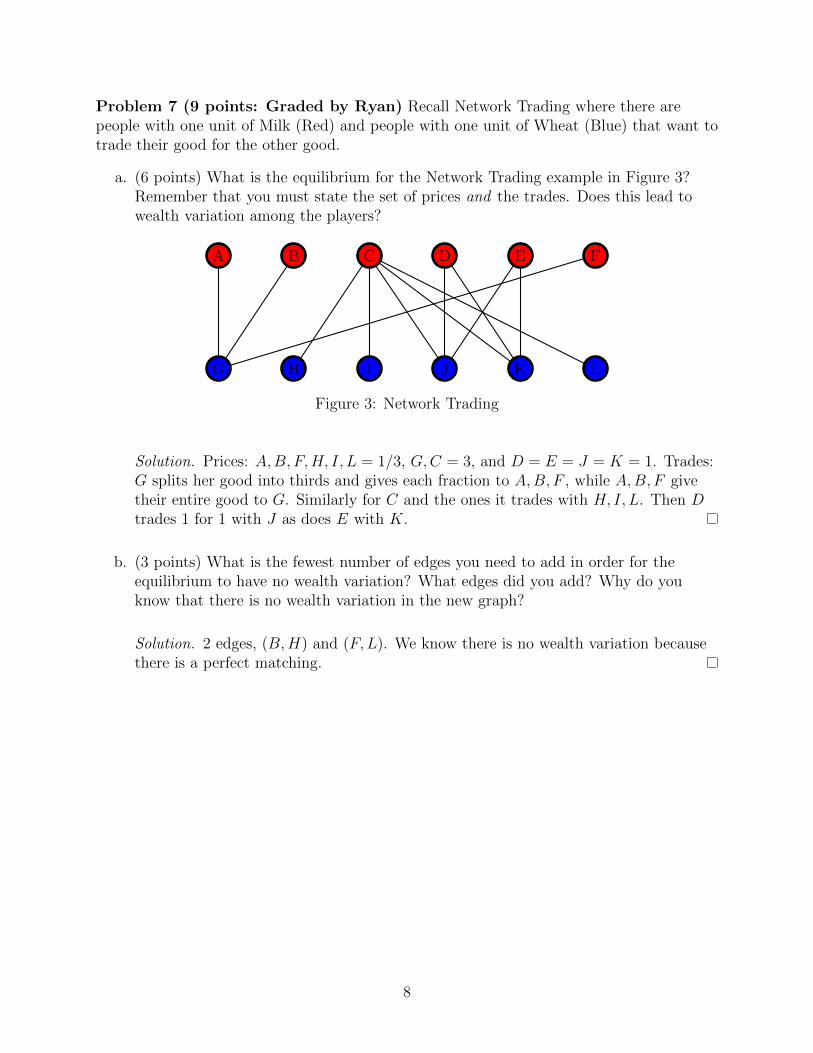
a. (6 points) What is the equilibrium for the Network Trading example in Figure 3?Remember that you must state the set of prices and the trades. Does this lead towealth variation among the players?
A B C D E F
G H I J K L
Figure 3: Network Trading
Solution. Prices: A,B, F,H, I, L = 1/3, G,C = 3, and D = E = J = K = 1. Trades:G splits her good into thirds and gives each fraction to A,B, F , while A,B, F givetheir entire good to G. Similarly for C and the ones it trades with H, I, L. Then Dtrades 1 for 1 with J as does E with K.
b. (3 points) What is the fewest number of edges you need to add in order for theequilibrium to have no wealth variation? What edges did you add? Why do youknow that there is no wealth variation in the new graph?
Solution. 2 edges, (B,H) and (F,L). We know there is no wealth variation becausethere is a perfect matching.
8

Problem 8 (9 points: Graded by Ryan) Price of Anarchy - We refer to the socialwelfare SW of a pair of strategies for the players as the total payoff to both players underthat strategy. As an example, SW (Confess,Defect) = 0 + 10 = 10 in the Prisoner’sDilemma given in Table 7.
a. (6 points) Consider the following Prisoner’s Dilemma given in Table 7 where for eachpair of action the entries of the table show the satisfaction of each prisoner afterhearing their verdict (so prisoners prefer higher numbers). What is the social welfareSW for the Nash equilibrium for this game? We will call this value SW (NE). Findthe strategy OPT that maximizes SW , and calculate its social welfare, i.e.SW (OPT ). Calculate the price of anarchy POA of the Prisoner’s Dilemma by
computing POA = SW (OPT )SW (NE)
. Explain in non-technical terms what it means to have aPOA much larger than 1.
Row Player/Column Player Cooperate DefectCooperate 9, 9 0, 10Defect 10,0 1,1
Table 7: Prisoner’s Dilemma
Solution.SW (NE) = 2 SW (OPT ) = 18 POA = 9.
This means that selfish individuals end up doing a lot worse than if they followed theadvice of some overseer.
b. (3 points) Recall that the Nash equilibrium for the game Rock-Paper-Scissors (givenin Table 8 is mixed where each player should choose to play Rock, Paper, or Scissorswith equal probability. Calculate the POA for Rock-Paper-Scissors. Be sure to writeall of your work. Write in non-technical terms what your value of POA means.
Row Player/Column Player Rock Paper ScissorsRock 1, 1 0,2 2,0Paper 2,0 1,1 0,2Scissors 0,2 2,0 1,1
Table 8: Rock-Paper-Scissors
Solution.
SW (NE) = 9× 1
3× 1
3× (2) = 2
SW (OPT ) = 2 =⇒ POA = 1.
Selfish players can do just as well as the optimal strategy.
9

Problem 9 (12 points: Graded by Ryan) Selfish Routing - Suppose one unit of flowthat is fully divisible wants to route from node S to node T in the network given in Figure4. The latency functions are given on each edge in terms of the fraction of people usingthat edge. Recall that an equilibrium is a way to route the unit flow such that if anyfraction of people deviate, they only get a longer total commute time from S to T .
S
a
b
c
T
e
x2
1
x
1
x2
x
Figure 4: Selfish Routing - Part (a)
a. (4 points) Which of the following is an equilibrium in Figure 4? Give a reason foreach one. Also give the total payoff for each strategy. What is the optimal strategy?
• All unit of flow is sent from S to T along the top route (S → a→ c→ T ).
Solution. Not, because half of the players can take the bottom route and dobetter. Its payoff (or total cost) is 3.
• Splitting the unit of flow evenly across the top route and the bottom route.
Solution. Is an equilibrium. If any fraction diverts, they will make the routethey were on lower and the new route have higher total cost. The total cost is7/4, which is also optimal.
b. (4 points) Which of the following is an equilibrium in Figure 5? Give a reason foreach one. Also give the total payoff for each strategy. What is the optimal strategy?
• All unit of flow is sent from S to T along the zig-zag route (S → b→ c→ T ).
Solution. Is not an equilibrium. Payoff is 2.
• Splitting the unit of flow evenly across the top route and the bottom route.
Solution. Yes, this is still an equilibrium with a cost of 7/4. Finding the optimalis a bit tricky here. We could evenly distribute the players among the 3 routes(i.e. 1/3 take top, 1/3 take bottom, and 1/3 take the zig-zag). This gives a totalcost of 1.6296 < 1.75. We will accept students saying that strategy 2 is theoptimal though.
10

S
a
b
c
T
e
x2
1
x
1
x2
x
0
Figure 5: Selfish Routing - Part (b)
S
a
b
c
T
e
x2
1
x
1
x2
x
0
Figure 6: Selfish Routing - Part (c)
c. (4 points) Which of the following is an equilibrium in Figure 6? Give a reason foreach one. Also give the total payoff for each strategy. What is the optimal strategy?
• All unit of flow is sent from S to T along the zig-zag route (S → a→ e→ T ).
Solution. This is an equilibrium with cost 2.
• Splitting the unit of flow evenly across the top route and the bottom route.
Solution. This is not an equilibrium. An ε fraction of people can do better. Thecost is 7/4. The optimal solution for this problem is actually quite complicatedto find (because we have an x2 cost on an edge which is not linear). However,you could find strategies that were close to optimal (or better than thestrategies given). Consider putting 1/4 of the people on the top route, 1/4 onthe bottom, and 1/2 on the zig-zag. This gives a total cost of
1/4[(3/4)2+1/4+1]+1/2[(3/4)2+(3/4)2]+1/4[(3/4)2+1/4+1] = 1.46875 < 1.5.
Note that you can do a little better by sending flows (.3, .4, .3) along (top route,zig-zag, bottom route). The optimal value is actually 1.46329.
11

Problem 10 (8 points: Graded by Shahin) The command traceroute determines theroute taken by a packet to reach a destination e.g. Figure 7 shows the route a packet takesto reach Stanford’s Computer Science Department.
Figure 7: Output of command traceroute
a. (4 points) Briefly describe the technological, geographical and economical inferencesyou can have from Figure 7.
Solution. Technological: The packet takes 12 hops to reach from Penn to Stanford.The first few hops are in Penn and then the packet leaves from the border router atPenn. Note that the delays are different for each router along the path.Geographical: The packet is moving from Philadelphia to Washington, Atlanta,Houston, Los Angeles and finally to Stanford. You can infer that from the url names.Economical: It seems like the packet is going from Penn to a network controlled byInternet2, then the Cenic network till it reaches Stanford. So there can be a financialrelationship between each two consecutive entries in the sequence mentioned above.Also it turns out that Internet2 and Cenic are both non-profit organization. So itseems like the communication is happening through a path that only facilitatesrelationships between academic entities in the network.
b. (4 points) Consider the network in Figure 8 where user A, who has Comcast as itsprovider, tries to send a packet to user B, who has Sprint as its provider. Comcastand Sprint operate separately and each uses the shortest path to route the packetthrough its network. Does this routing scheme result in the packet from user A touser B to travel through the shortest path in the network? If so, briefly describe why.If not, plot a simple internal network for Comcast and Sprint to illustrate a counterexample.
Solution. Since the providers only know their networks, the routing scheme may notresult in the shortest path in the entire network. For example in Figure 9, the
12

Figure 8: Online Packet Routing
shortest path in Comcast’s network to send A to Sprint’s network is through the topconnection. However, the shortest path in the entire network is through the bottomconnection between Comcast and Sprint.
Figure 9
13